An Electro-Geometric Model for Lightning Shielding of Multiple Wind Turbines


1
School of Electrical Engineering, Shandong University, Jinan 250061, China
2
School of Electrical & Electronic Engineering, North China Electric Power University, Beijing 102206, China
*
Author to whom correspondence should be addressed.
Energies 2017, 10(9), 1272; https://doi.org/10.3390/en10091272
Submission received: 20 July 2017
/
Revised: 18 August 2017
/
Accepted: 24 August 2017
/
Published: 26 August 2017
(This article belongs to the Special Issue Wind Generators Modelling and Control)
Abstract
:Wind turbine blades being struck by lightning is one of the most urgent problems facing wind farms. In order to reduce the probability of lightning accidents on wind farms, this paper presents a new electro-geometric model for multiple turbines. In this new model, based on the physical model of lightning leader development, the striking distance range of the blade tip receptor is calculated, taking into account the influence of the charged particles around the blade. Lightning shielding amongst multiple turbines is provided in combination with the traditional electro-geometric model, and a criterion formula is obtained for mutual shielding for multiple turbines. The influence of environmental factors, such as temperature, atmospheric pressure, air humidity, and altitude, on lightning shielding on large-scale wind farms is also analyzed by studying the lightning shielding distance between wind turbines. The calculation shows that the larger the relative air density and the absolute humidity, and the lower the altitude, and the larger the lightning shielding distance between wind turbines. The method proposed in this paper provides a theoretical basis for the lightning protection on wind farms under different environmental conditions.
1. Introduction
Wind power is an important contributor to energy system reform as a form of clean energy production. However, wind farms are highly susceptible to lightning strikes as a result of their special structure and the area surrounding wind turbines. Most damage caused by lightning is irreparable, which seriously affects the economic performance of wind farms due to the high cost of repairing or replacing the damaged blades [1,2]. Therefore, it is imperative to analyze the lightning protection of multiple turbines and the influence of environmental factors on lightning protection is important in order to promote the economic and stable operation of the wind farms.
The turbines on existing wind farms are mostly arranged in rows where the spacing is based on semi-empirical models, confirmed by wind farm operations, to maximize the power generation efficiency [3]. The optimal spacing between columns was suggested to be 3R–6R [4] according to actual operational experience. In order to determine a method for optimizing turbine spacing on wind farms with different wind conditions and regional boundaries, genetic algorithms have been employed, using the ratio of total investment to the power generation efficiency as the target parameter [5,6].
The above research indicates that the existing layout of wind farms has not been analyzed from a lightning protection perspective, and the influence of environmental factors on lightning protection efficiency has not been considered. For the protection of wind turbines from lightning, some progress has been made through experimental studies on electric field distribution around the blade and the lightning protection effect of the blade tip receptor [7,8,9]. However, those experimental studies have poor portability since repeated tests have to be done for different models of wind turbines under different environmental conditions, requiring extensive manpower and resources. As the wind turbine capacity increases, it becomes more difficult to perform the experiments. The experiments are also not applicable to the protection of multiple turbines. Therefore, the development of an analytical model suitable for shielding multiple turbines from lightning is the basis for improving the allocation of wind turbines on farms for lightning protection. Based on the two-dimensional (2D) stochastic model of the lightning leader (a discharge mode in early formation of lightning), the Chinese Academy of Meteorological Sciences [10] simulated the characteristics of lightning strikes on wind turbines and analyzed the impact of lateral distance of the lightning downward leader from the wind turbine, and the effect of the angle of the blade on the probability of lightning strikes. Mengni et al. [11] employed the Self-consistent Leader Inception and Propagation Model (SLIM) proposed by Becerra and Cooray [12,13] to calculate the striking distance of each blade tip receptor and explain how the points on the blade farthest from the receptor are damaged by lightning. However, the above analysis is insufficient as it does not take into account the accumulation of charges at the tip discharge area and is confined to a single turbine, while the lightning shielding between multiple turbines was not considered.
In this paper, the electro-geometric model (EGM) of lightning shielding between multiple wind turbines is introduced by combining the lightning leader progression physical model and a conventional EGM. In this new EGM, the influence of charged particles around the blade is taken into account. The model is then used to analyze the impact of environmental factors such as temperature, atmospheric pressure, air humidity, and altitude on mutual shielding between wind turbines on a large-scale wind farm. The results provide a theoretical basis for the allocation of turbines on wind farms under different environmental conditions, and gives significant insight for their safe and economic operation. A breakdown experiment of scaled wind turbines was designed to verify the impact of air humidity on the shielding distance between two turbines.
2. EGM of Lightning Shielding Between Multiple Wind Turbines
2.1. The Principle of Lightning Shielding Between Multiple Wind Turbines
The EGM relates the lightning’s parameters to the geometrical structure of the studied object by the striking distance, which describes the capacity of ground structures to attract lightning. The common assumption is the lightning will discharge to the object as long as it reaches the range of striking distance [14,15]. With the large-scale application of wind power, cluster development often occurs with wind turbines. This section focuses on the mutual shielding between two turbines and analyzes the mutual shielding distance. As shown in Figure 1, the colored circle represents the striking distance range under a certain lightning current at a certain rotation angle of the blade. The center of the striking distance circle is located on the blade tip rotation circle and the radius Rp is the striking distance of the tip receptor. D is the spacing between two wind turbines, and Lf is the horizontal shielding distance of one turbine at a certain angle, which can be calculated as:
The two turbines are assumed to be axially symmetrical during operation. Figure 1 shows the intersection of striking distance circles of two turbines’ blade tip receptors, where Ls is the overlap distance. Provided that the lightning downward leader (DL) develops vertically, the number of lightning strikes on two turbines can be calculated as:
where n is the equivalent lightning bolt frequency where the turbines are located. If the striking distance circles of two turbines do not intersect, the number of lightning strikes on two turbines is:
From Equations (2) and (3), N < N0, which means the intersection of the striking distance circles of two turbines enables them to shield each other, reducing the overall likelihood of lightning strikes. This improves the lightning protection of the whole wind farm. Mutual shielding occurs when the distance between two turbines D meets the requirement that:
where Dmax is the maximum distance at which mutual shielding exists. If D > Dmax, the two turbines have no mutual shielding on each other, so that Equation (4) is the criteria formula for mutual shielding between multiple turbines.
2.2. Calculation of Space Potential Around the Wind Turbine Blade
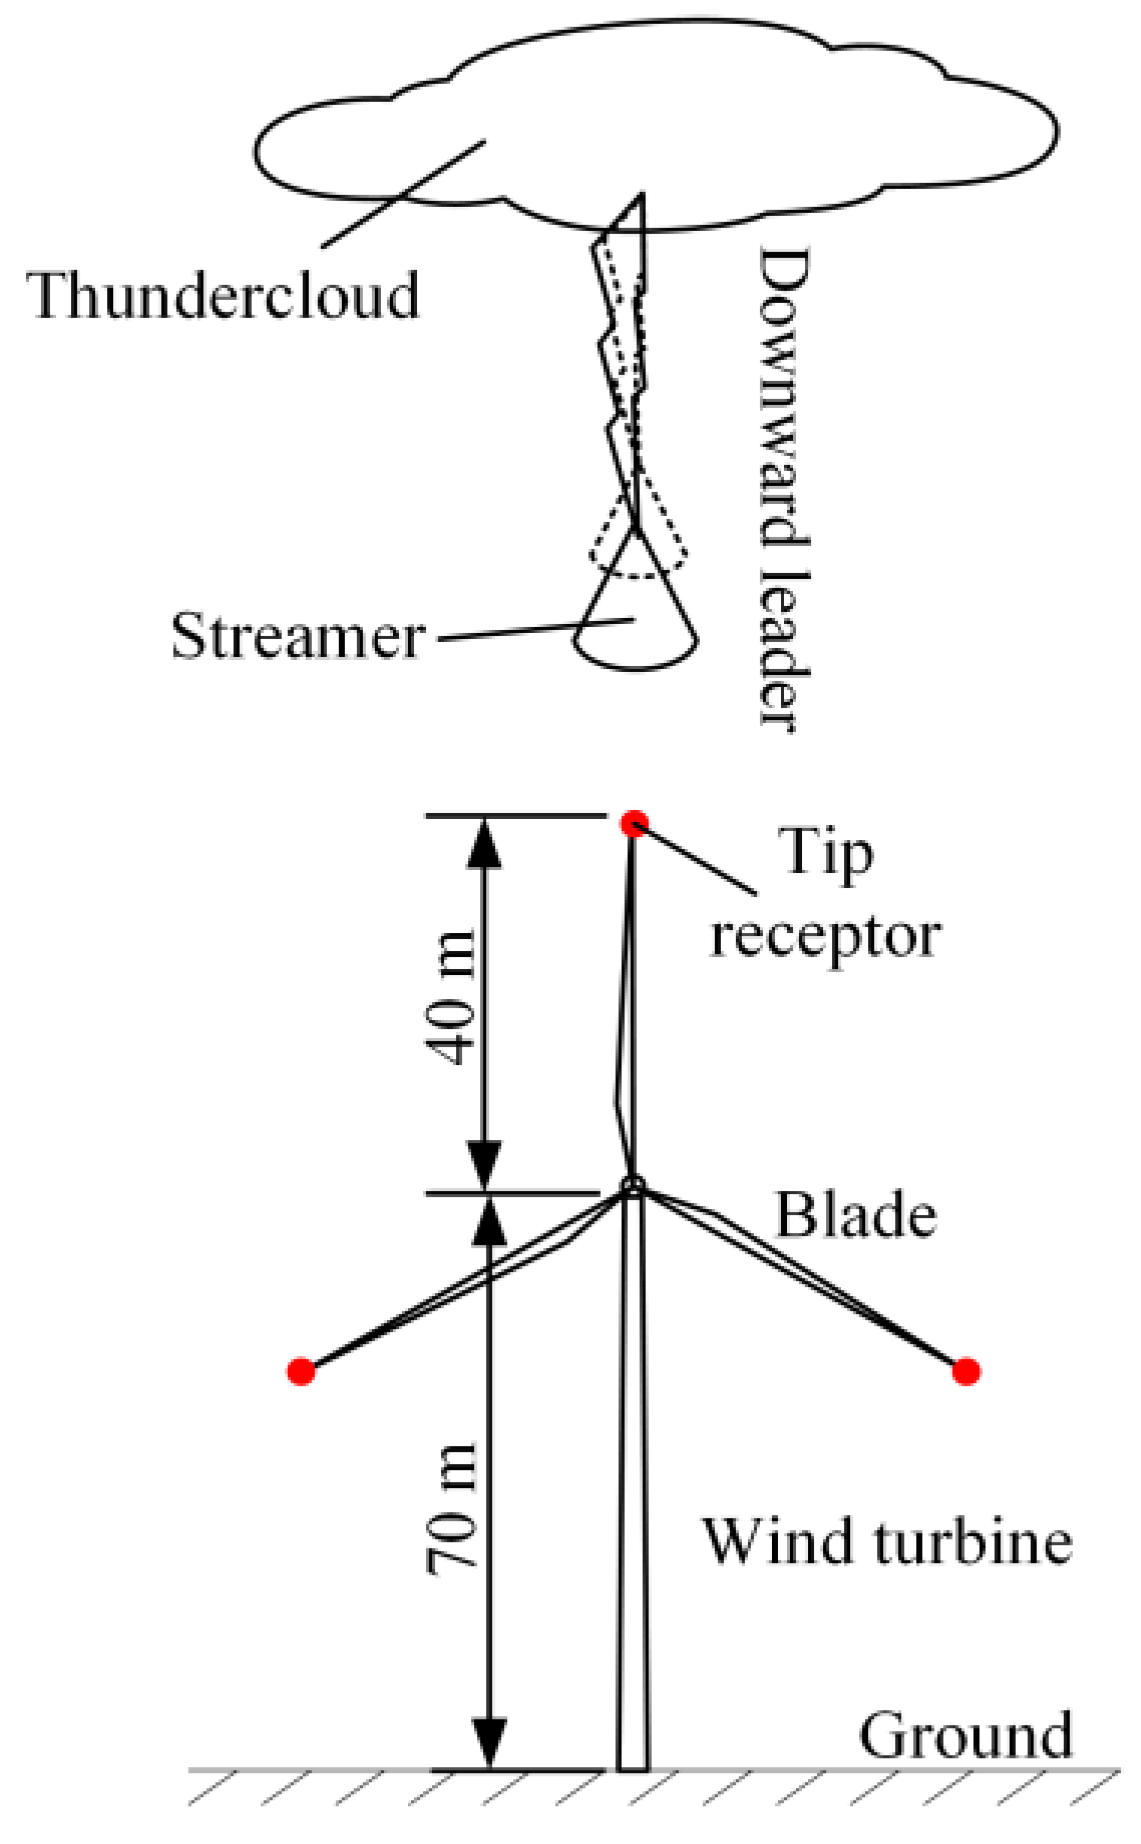
Thunderclouds are generally distributed in the space 2–10 km above the ground, and 90% of them have negative polarity [16]. We assume the height of the thundercloud to be 2.5 km and the potential generated by thundercloud is calculated by a simplified charged disk model [17]. The charge distribution of the lightning DL channel is simulated by a line charge with a point charge at the head. According to the charge model proposed by Cooray et al. [18], the internal charge density of lightning leader channel is obtained by:
where G(z0) = 1 − z0/H, H(z0) = 0.3 α + 0.7 β, α = e−(z0 − 10)/75, G(z0) = 1 − z0/H, p(τ) is the internal charge density of the lightning leader channel, C/m; z0 is the height of lightning leader head, m; H is the height of thundercloud, m; τ is the distance from a certain point of DL channel to leader head, m; Ip is the first return stroke current amplitude, kA. The values of the coefficients are: a0 = 1.476 × 10⁻⁵, a = 4.875 × 10⁻⁵, b = 3.9097 × 10⁻⁶, c = 0.522, and d = 3.73 × 10⁻³.
In order to calculate the motion of charged particles in the corona area for lightning weather, a simulation model has been built on the basis of a research by Axel Winter [19]. The space charge is axially symmetric around the blade tip receptor ignoring the influence of wind. For the sake of convenience, charged particles are divided into three categories according to their sizes: large charged particles such as aerosols, small charged particles such as charged ions, and neutral particles. The charge of each type of particle is considered to be approximately the same. The Convection/Diffusion module and the AC/DC module of COMSOL Multiphysics (COMSOL Multiphysics 5.0, COMSOL, Stockholm, Sweden) were used to simulate the distribution of charges in the vicinity of the wind turbine blade taking into account the motion, diffusion, and neutralization of charged particles [20].
The kinematic equations of n+, N+, and Na, respectively, are as follows:
The electric field intensity and electric potential Φ are in accord with the Poisson equation:
where μn+ is the ion mobility of small particles with a value of 1.5 × 10⁻⁴ m2/(s·V), μN+ is the ion mobility of large aerosol particles with a value of 1.5 × 10⁻⁶ m2/(s·V), knN is the binding coefficient between small particles and large aerosol particles with a value of 2.9 × 10⁻⁶ m3/s, d is the particle diffusion rate with a value of 1 m2/s, e is the charge of elementary charge, and ε0 is the dielectric constant of air with a value of 8.854187 × 10⁻¹² F/m.
A 1.5 MW wind turbine was used as an example, with a tower height of 70 m, a blade length of 40 m, a radius of the lightning down conductor of 0.01 m, a tower radius of 2.5 m, and the blade has only a single tip receptor. As shown in Figure 2, one blade is perpendicular to the horizontal plane and the lightning DL develops vertically downward from directly over the blade.
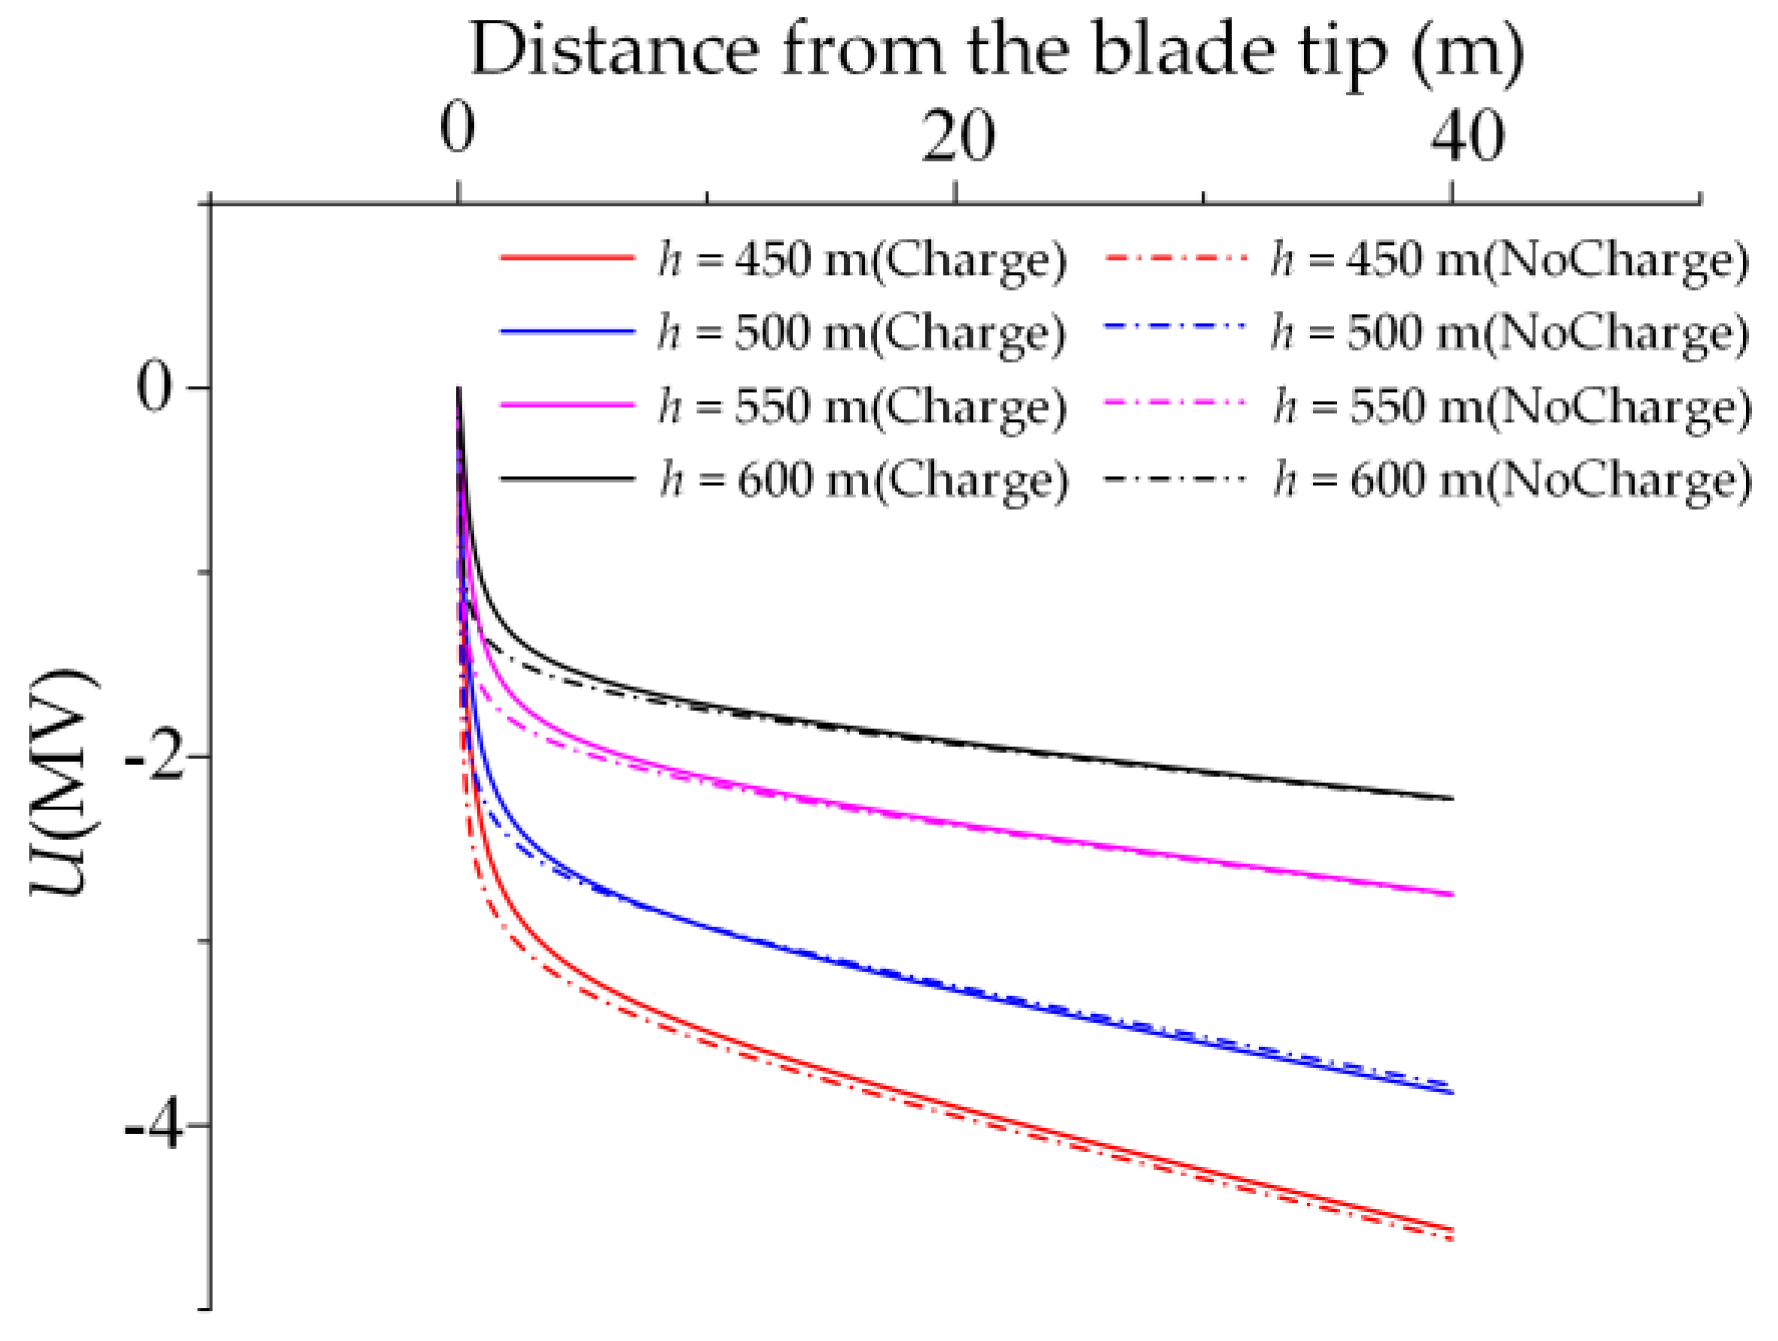
The space potential distribution near the upright blade is shown in Figure 3, where h is the height of the DL head, m; and U is the background potential in the direction of discharge axis of the blade tip receptor, MV. Under the combined action of the lightning DL and the blade, the electric field is significantly distorted in the space especially within 5 m from the blade tip. The potential of the area within 10 m from the blade is significantly reduced if the movement of charge around the blade is taken into account. This is due to the accumulated positive charge near the blade tip that neutralizes the negative background electric field. There is no significant difference in the potential beyond 10 m since there is little charge in the area far from the blade.
2.3. Numerical Calculation of the Striking Distance of the Blade Tip Receptor
Most of the negative lightning strikes can be divided into three stages: the downward development of DL, the initiation of upward leader (UL), and the connection process between DL and UL. The downward development of DL increases the surface electric field of the ground object. A positive space charge area is generated due to the collision ionization and adhesion effect, which will produce an initial corona when the positive space charge is larger than a certain value [21]. After an initial corona is generated, a streamer is formed in the discharge gap [22,23] and an UL is generated while the streamer charge Q > 1 C [24].
After a UL is generated, DL is assumed to vertically approach the ground incrementally. The corresponding simplified process of UL development is shown in Figure 4 where l is the length of the UL, ls is the length from streamer head to the starting point of the UL, U1 is the background potential and U2 is the distorted potential considering the corona area charge. When the DL develops in the ith step, the potential of the UL head is Utip, which can be calculated as [25]:
where E∞ is the steady-state value of the quasi-static leader field intensity with a value of 3 × 10⁴ V/m; Estr is the electric field intensity of the streamer area, which is related to the relative density of air, humidity, and altitude with a value of 400 kV/m here; and x0 is the length coefficient with a value of 0.75 m.
The quantity of the newly generated charge in the corona area in front of the UL head can be approximated by:
where KQ is an environmental factor with a value of 3.5 × 10⁻¹¹ C/(V·m).
The quantity of charge qL required to convert the streamer to UL per unit length corresponds to a value with a suggestion of 65 μC/m. Combining this into Equation (11), the length of the UL in the i + 1th step is:
Based on the above-mentioned leader development mechanism, we assumed the lightning strike occurs when DL and UL develop to the nth step and their streamers encounter one another. At this time, ls(n) is the longest distance the UL and its streamer reach, which represents the lighting attraction range of tip receptor. This distance is determined to be Rp, the striking distance of the tip receptor, which can be calculated by:
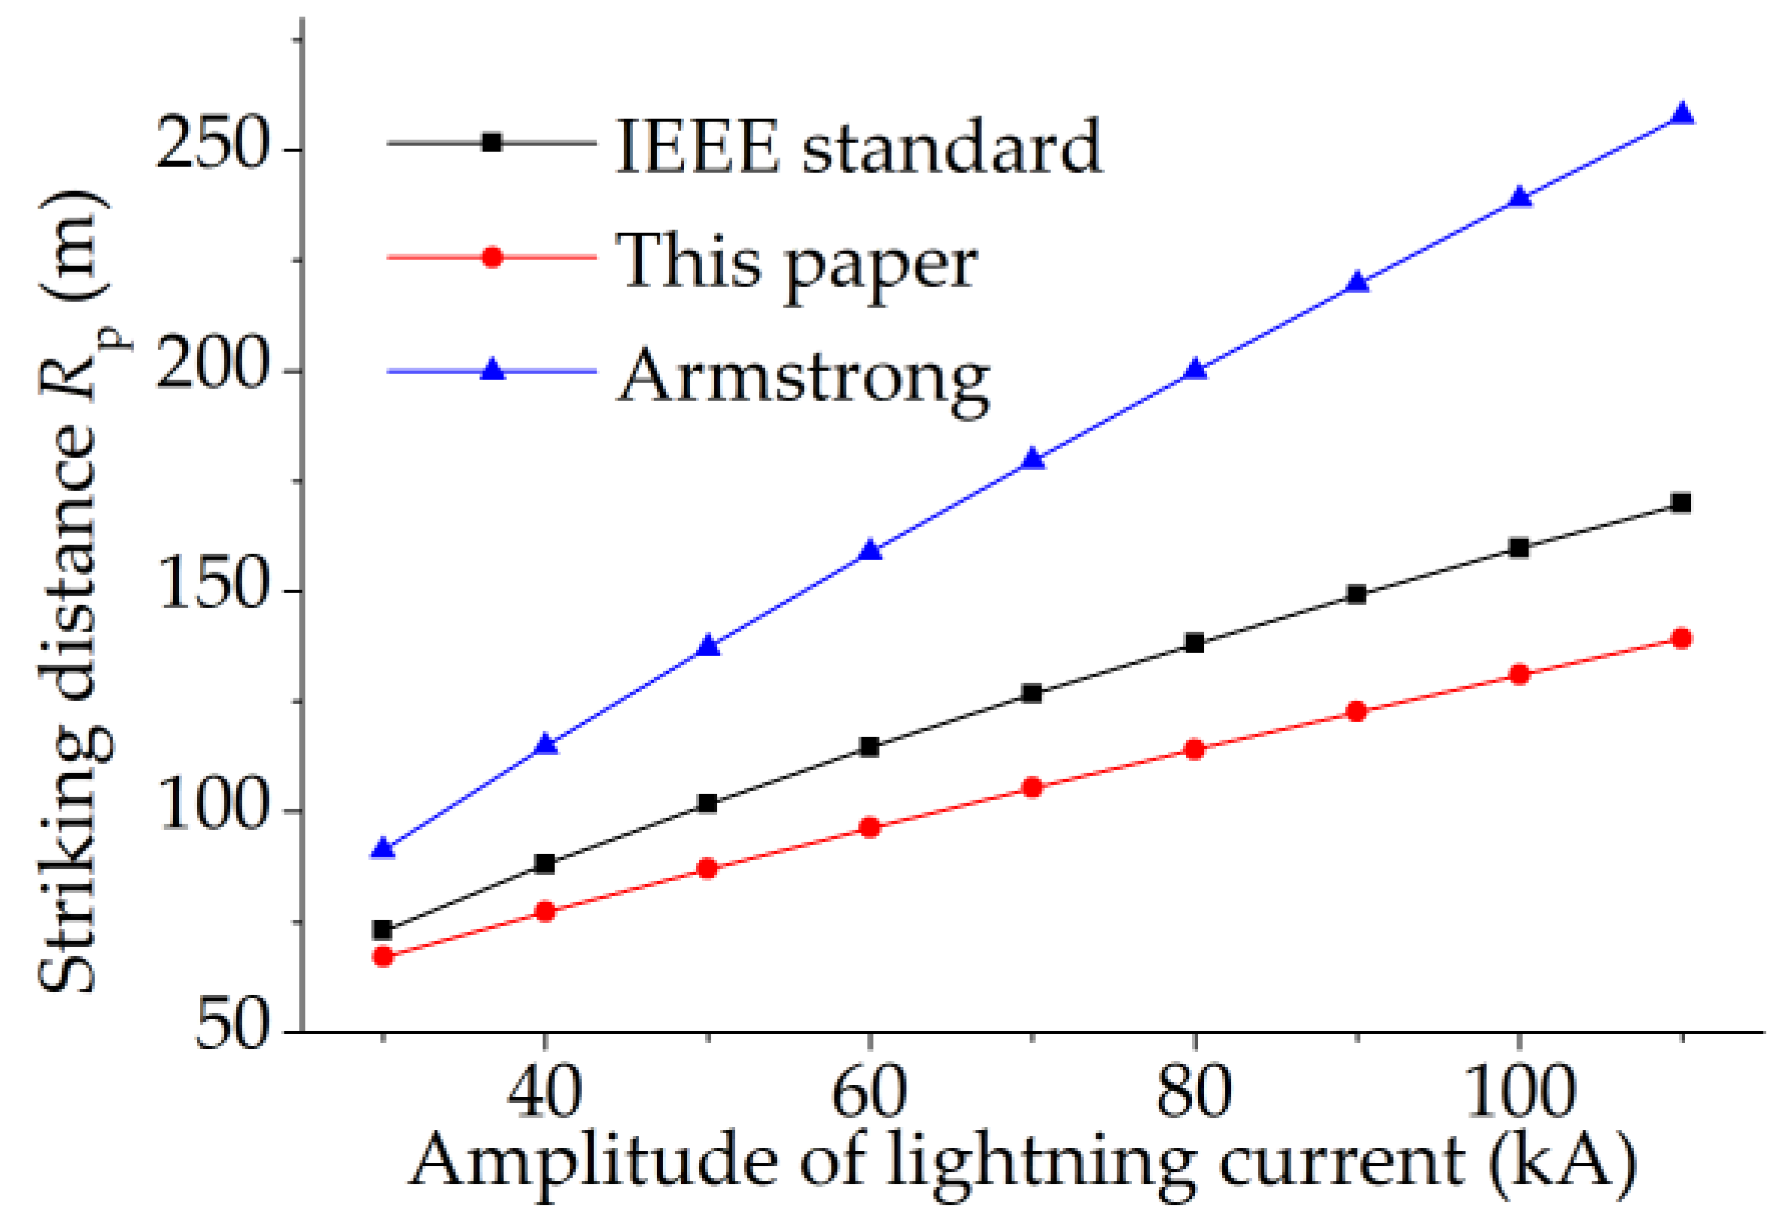
where Ud is the potential of the DL head. The process for calculating Rp is described by the algorithm sketched in Figure 5. The traditional formula of striking distance has been widely used for the lightning protection of buildings with lightning rods. The upright blade is similar to a lightning rod. In this paper, the striking distance of the upright blade was calculated and compared with the result obtained with the traditional formulas (Figure 6). The values obtained with this study are smaller than those of Armstrong and Whitehead [14] as well as the results given by IEEE [26], and are closer to the results of the formula recommended by IEEE. The calculation method used in this paper takes into account the effect of space charge that attenuates the electric field intensity around the blade tip receptor and making the generation of an UL more difficult, which leads to the decrease of Rp. In addition, this method is more consistent with the physical development of lightning and considers the special structure of the wind turbine, unlike the traditional formula which makes it unsuitable for wind turbine lightning protection.
3. Impact of Environmental Factors on the Maximum Shielding Distance of Two Turbines
As is shown in Figure 1, the value of Lf is associated with the rotation angle of the blade. In order to analyze the impact of environmental factors on the maximum shielding distance, Dmax, we took the median rotation angle (θ = 45°), instead of the boundary values of 0° and 90°, to reduce the overall relative error. The lightning current is Ip = 60 kA and the wind turbines have a rated capacity of 1.5 MW; the parameters are described in Section 2.2.
3.1. Relationship Between Dmax and Pressure, Temperature and Humidity
The electric field intensity of the streamer area Estr is influenced by environmental factors such as atmospheric pressure, temperature and humidity [27]. The relationship can be expressed as:
where γ is the absolute humidity, g/m3; δ is the relative air density; P is the atmospheric pressure, atm; T is the temperature, K; P0 is the atmospheric pressure at sea level under standard atmospheric condition with a value of 1 atm; and T0 is the temperature at sea level under standard atmospheric condition with a value of 293 K.
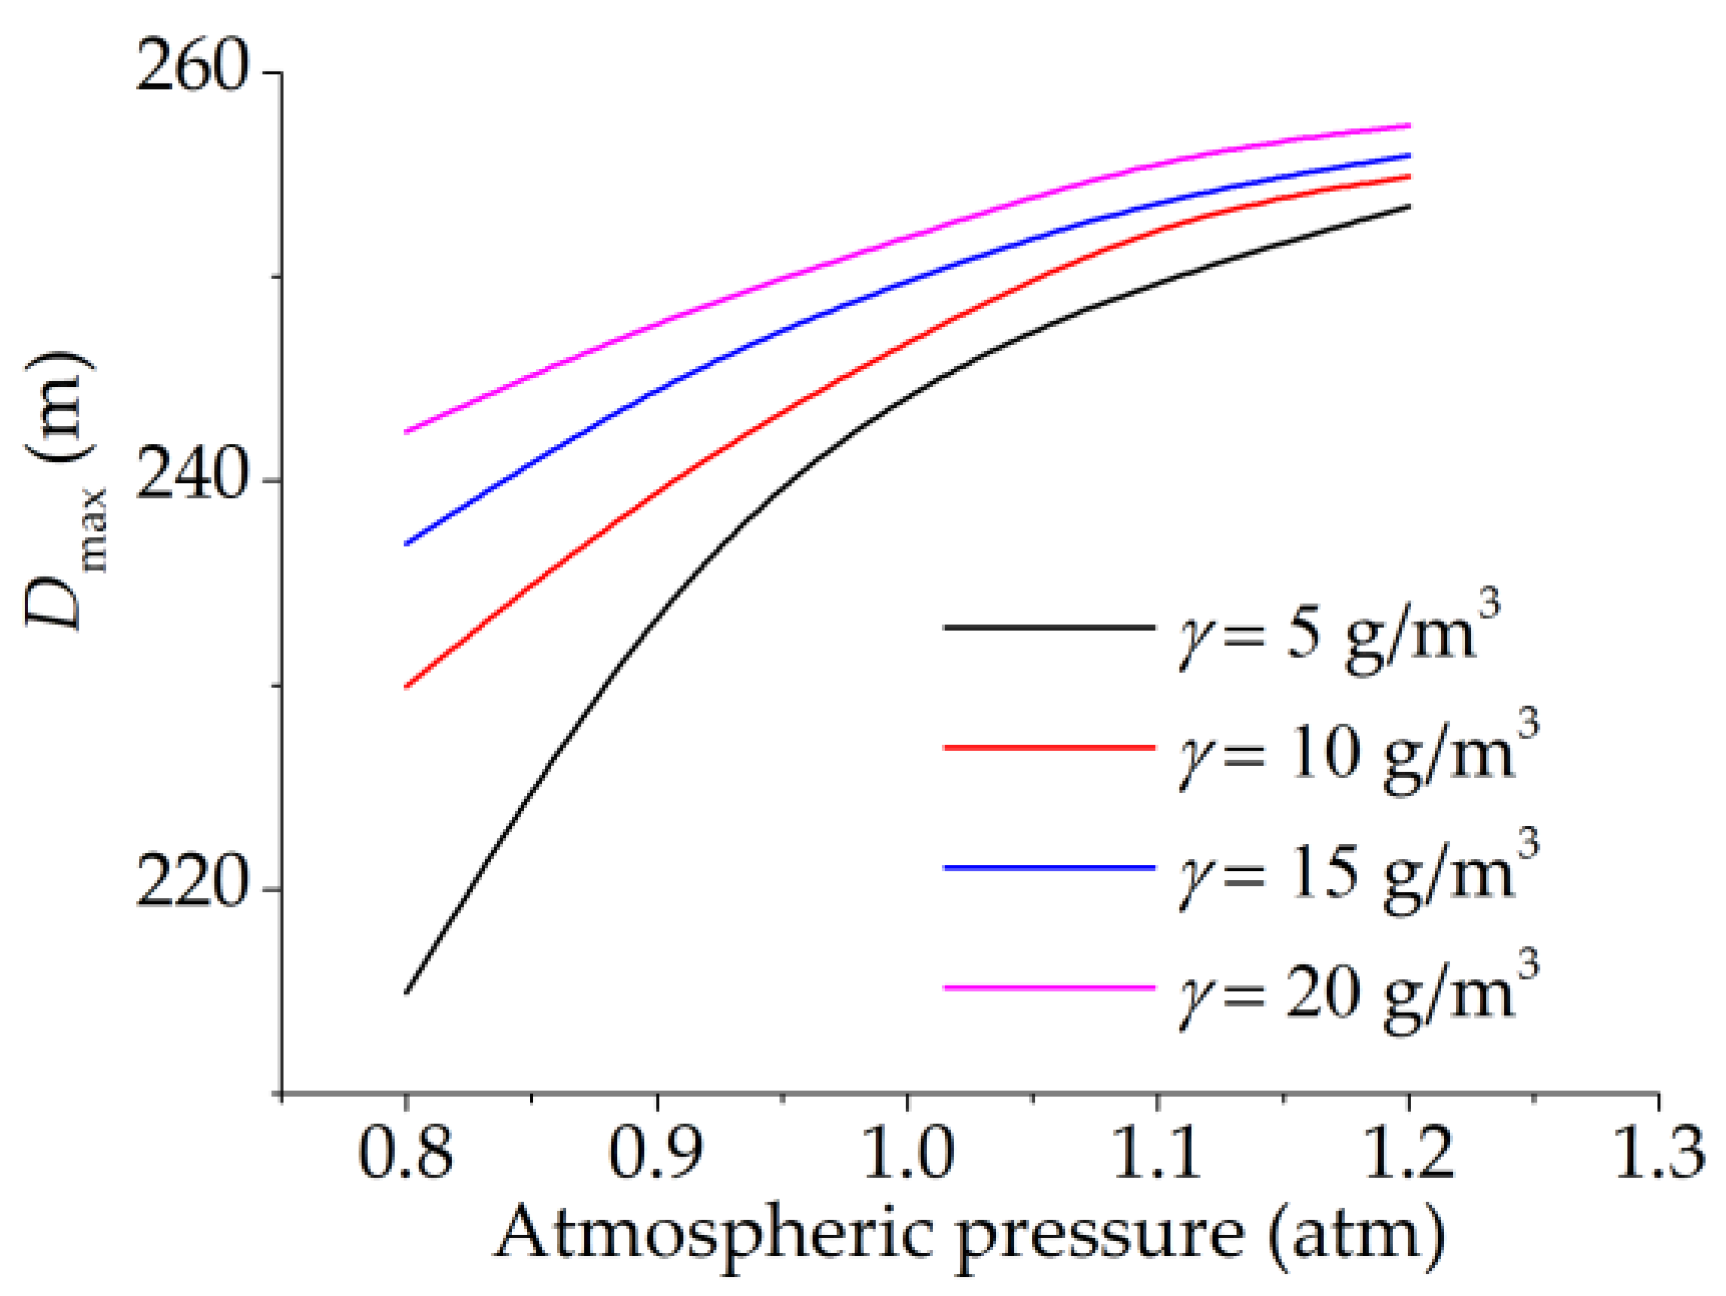
According to the principle of lightning leader development reviewed in Section 2.3, we know that the value of Estr will affect the potential of leader head and the quantity of electric charge ΔQ newly generated by each step in the streamer area, and ultimately the development length of the UL. According to the simulation process shown in Figure 5 and Equation (4), the variation of Dmax versus the change of atmospheric pressure, temperature, and humidity with a lightning current of 60 kA is obtained (Figure 7 and Figure 8). Dmax increases with the increase of atmospheric pressure and absolute humidity, and decreases with the increase of temperature.
As temperature and atmospheric pressure are related to relative air density, the above-mentioned relationship can be expressed simply as Dmax increase with the increase of relative air density δ and absolute humidity γ. For a wind farm with low air density and absolute humidity, the spacing between two turbines should be reduced as much as possible to guarantee mutual shielding.
3.2. Relationship Between Dmax and Altitude
Since precise data for δ and γ have to be measured with special instruments, using Equation (14) in engineering is impractical. Dmax between two turbines can be approximately calculated according to the local altitude [28] because P, T and γ are related to the altitude HL as follows:
where HL is the altitude, km; γ0 is the standard absolute humidity at sea level under standard atmospheric condition with a value of 11 g/m3. Equations (15)–(17) are incorporated with Equation (14) to obtain the relationship between the electric field intensity of streamer area Estr and the altitude, represented as:
The variation of the maximum shielding distance Dmax between two turbines under Ip = 60 kA with changing altitude is illustrated in Figure 9. Dmax decreases with the increase of altitude, so wind farms at high altitude must reduce the distance between two turbines as much as possible to guarantee mutual shielding.
Notably, P, T, and γ in two different areas at the same altitude may be slightly different due to the terrain, latitude, and season. Therefore, in order to obtain an accurate result, δ and γ of the area have to be locally measured with instruments and be incorporated into Equation (14).
4. Long Gap Breakdown Experiment for a Scaled Wind Turbine
To verify the influence of environmental factors on the shielding distance Dmax, a long gap discharge experiment with a scaled wind turbine model was carried out at the Shahe Experimental Station of North China Electric Power Research Institute. The voltage of the rod-shaped electrode was used to simulate the height of the lightning DL. The variation of striking distance of a single wind turbine Rp with different air humidity was studied. Combining Rp and Dmax shown in Equation (4), the variation of Dmax with the change of air humidity is obtained.
The experimental schematic diagram and the wind turbine model are illustrated in Figure 10, where the height of the scaled wind turbine model is 4 m and the length of blade is 1.8 m. A tip receptor was installed on each blade and grounded by a down conductor. A rod-shaped electrode was used to simulate the lightning DL. The height between the electrode and the wind turbine nacelle was adjusted to ensure that an UL is formed when breakdown occurs (Figure 11). Considering the maximum voltage generated by the impulse voltage generator, the vertical distance between the lower end of electrode and the nacelle was determined to be 3 m.
The angle of the blade was set to 30° and 90° in the experiment. Because the atmospheric pressure intensity is difficult to control, the experiment mainly analyzes the influence of air humidity to UL creation. The breakdown experiment of the scaled wind turbine model was carried out on both sunny (γ = 18 g/m3) and cloudy days (γ = 25 g/m3) while the temperature is between 30 and 32 degrees Celsius.
The analysis in Section 3 indicates that the greater the air humidity, the greater the value of Dmax and the longer the length of the UL. Under higher air humidity, the UL can be generated when the DL value is higher. This relationship can be approximately represented by the potential of the rod electrode: the higher the electrode potential, the nearer the DL to the ground.
The breakdown experiment was performed 20 times each with blade angles at 30°and 90° under different humidity conditions. The camera used long exposure mode to record the breakdown path to ensure an UL was generated when breakdown occurred. The breakdown voltage is illustrated in Figure 12. The breakdown voltage at γ = 25 g/m3 is lower than the breakdown voltage at γ = 18 g/m3 by about 80 kV. This means the higher the air humidity, the earlier the UL is generated and the larger the Rp. According to the relationship between Rp and Dmax in Equation (4), Dmax is also larger. The experimental results are consistent with the conclusion drawn in Section 3 that Dmax increases with an increase in air pressure and absolute humidity.
5. Conclusions
In this paper, an electro-geometric model of lightning shielding between multiple turbines was established. The model uses the physical development model for the lightning upward leader to calculate the striking distance of the blade tip receptor, taking into account the influence of charged particles around the blade on the background potential distortion. The criterion formula for the mutual shielding of multiple turbines is obtained, showing that mutual shielding exists when the distance between two turbines D < Dmax.
The effect of environmental factors, including temperature, atmospheric pressure, air humidity and altitude, on Dmax were further investigated. We found that the distance between two turbines should be reduced as much as possible in areas with low air density, high humidity or high altitude in order to meet the requirements for mutual shielding.
The EGM of lightning shielding between multiple wind turbines proposed in this paper is of referential value for lightning protection and ensuring the stable operation of wind farms.
Acknowledgments
This work was supported by the National Science Foundation of China under Grant Nos. 51677110 and 51420105011, and State Key Laboratory of Alternate Electrical Power System with Renewable Energy Sources(LAPS16018).
Author Contributions
Li Zhang, Guozheng Wang designed the new EGM for turbines, performed the data analysis, and prepared the manuscript. Wenfang Zhang, Yufei Ma and Zixin Guo assisted the breakdown experiment. Qingmin Li led the project and research. All authors discussed the results and approved the publication.
Conflicts of Interest
The authors declare no conflict of interest.
Nomenclature
| θ | Angle between the blade and horizontal direction |
| p | Charge density of the lightning leader channel |
| γ | Absolute humidity |
| γ0 | Standard absolute humidity |
| δ | Relative air density |
| τ | Distance from a point of downward leader channel to the leader head |
| Φ | Electric potential |
| μn+ | Ion mobility of small particles |
| μN+ | Ion mobility of large aerosol particles |
| ε0 | Dielectric constant of air |
| d | Particle diffusion rate |
| D | Spacing between two wind turbines |
| e | Charge of elementary charge |
| Electric field intensity | |
| E∞ | Steady-state value of quasi-static leader field intensity |
| Estr | Electric field intensity of the streamer area |
| HL | Altitude |
| Ip | Lightning current amplitude |
| knN | Binding coefficient of small particles and large aerosol particles |
| KQ | Environmental factor |
| l | Length of the upward leader |
| ls | Total length of upward leader and streamer |
| Lf | Horizontal shielding distance of turbines at a certain angle |
| Ls | Overlap distance |
| n | Equivalent thunderbolt frequency |
| n+ | Concentration of small charged particle |
| N+ | Concentration of large charged aerosol particle |
| Na | Concentration of neutral aerosol particle |
| P | Atmospheric pressure |
| P0 | Standard atmospheric pressure |
| R | Length of turbine blade |
| Rp | Striking distance of blade tip receptor |
| T | Temperature |
| T0 | Standard temperature |
| U1 | Background potential |
| U2 | Distorted potential considering corona area charge |
| Ud | Potential of downward leader head |
| Utip | Potential of blade tip receptor |
| x0 | Length coefficient |
| z0 | Height of lightning leader head |
References
- Wind turbines—Part 24: Lightning protection; IEC 61400–24:2010; International Electrotechnocal Commission: Geneva, Switzerland, 2010.
- Guo, Z.X.; Li, Q.M.; Yan, J.Y.; Ma, Y.F.; Siew, W.H. Summary of Research on Physical Evolution Mechanism of Lightning Discharge of Offshore Wind Farms. J. Electr. Eng. 2015, 10, 10–19. [Google Scholar]
- Frandsen, S.; Barthelmie, R.; Pryor, S.; Rathmann, O.; Larsen, S.; Højstrup, J.; Thøgersen, M. Analytical modelling of wind speed deficit in large offshore wind farms. Wind Energy 2006, 9, 39–53. [Google Scholar] [CrossRef]
- Patel, M.R. Wind and Solar Power Systems: Design, Analysis, and Operation; CRC Press: Boca Raton, FL, USA, 2005. [Google Scholar]
- Mosetti, G.; Poloni, C.; Diviacco, B. Optimization of wind turbine positioning in large windfarms by means of a genetic algorithm. J. Wind Eng. Ind. Aerodyn. 1994, 51, 105–116. [Google Scholar] [CrossRef]
- Grady, S.A.; Hussaini, M.Y.; Abdullah, M.M. Placement of wind turbines using genetic algorithms. Renew. Energy 2005, 30, 259–270. [Google Scholar] [CrossRef]
- Muto, A.; Suzuki, J.; Ueda, T. Performance comparison of wind turbine blade receptor for lightning protection. In Proceedings of the International Conference on Lightning Protection (ICLP), Cagliari, Italy, 13–17 September 2010. [Google Scholar]
- Montanyá, J.; March, V.; Hermoso, B.; Hermoso, J.R. Highspeed videos of laboratory leaders emerging from wind turbine blade tips. In Proceedings of the International Conference on Lightning Protection (ICLP), Cagliari, Italy, 13–17 September 2010. [Google Scholar]
- Garolera, A.C.; Holboell, J.; Madsen, S.F. Lightning attachment to wind turbine surfaces affected by internal blade conditions. In Proceedings of the International Conference on Lightning Protection (ICLP), Vienna, Austria, 2–7 September 2012. [Google Scholar]
- Li, D. 3D Simulation of the Lightning Leader and its Application; Chinese Academy of Meteorological Sciences: Beijing, China, 2013.
- Mengni, L.; Marley, B.; Rajeev, T. On the Lightning Incidence to Wind Farms. In Proceedings of the International Conference on Lightning Protection (ICLP), Estaril, Portugal, 25–30 September 2016. [Google Scholar]
- Becerra, M.; Cooray, V. A self-consistent upward leader propagation model. J. Phys. D Appl. Phys. 2006, 39, 3708. [Google Scholar] [CrossRef]
- Becerra, M.; Cooray, V. A simplified physical model to determine the lightning upward connecting leader inception. IEEE Trans. Power Deliv. 2006, 21, 897–908. [Google Scholar] [CrossRef]
- Armstrong, H.R.; Whitehead, E.R. Field and Analytical Studies of Transmission Line Shielding. IEEE Trans. Power Appar. Syst. 1968, 87, 270–281. [Google Scholar] [CrossRef]
- Brown, G.W.; Whitehead, E.R. Field and Analytical Studies of Transmission Line Shielding: Part II. IEEE Trans. Power Appar. Syst. 1969, 88, 617–626. [Google Scholar] [CrossRef]
- Rakov, V.A.; Uman, M.A. Lightning: Physics and Effects; Cambridge University Press: Cambridge, UK, 2003. [Google Scholar]
- Amoruso, V.; Lattarulo, F. Thundercloud pre-stroke electrostatic modeling. J. Electrost. 2002, 56, 255–276. [Google Scholar] [CrossRef]
- Cooray, V.; Rakov, V.; Theethayi, N. The lightning strike distance-revisited. J. Electrost. 2007, 65, 296–306. [Google Scholar] [CrossRef]
- Winter, A.; Kindersberger, J. Transient field distribution in gas-solid insulation systems under DC voltages. IEEE Trans. Dielectr. Electr. Insul. 2014, 21, 116–128. [Google Scholar] [CrossRef]
- Hu, J.L.; Hong, C.; Du, L.; Mi, Y.; Sun, C.X. Simulation study on electric field of a long rod-plane air gap during leader discharge based on weak form of finite element method. Proc. CSEE 2008, 28, 148–154. [Google Scholar]
- Abdel-Salam, M.; Turky, A.A.; Hashem, A.A. The onset voltage of coronas on bare and coated conductors. J. Phys. D Appl. Phys. 1998, 31, 2550. [Google Scholar] [CrossRef]
- Gallimberti, I. The mechanism of the long spark formation. J. Phys. Colloq. 1979, 40, C7-193–C7-250. [Google Scholar] [CrossRef]
- Ren, H.W.; Guo, Z.X.; Ma, Y.F. Quantitative characterization of the striking saltus distance of wind turbine blade. Trans. China Electrotech. Soc. 2017, 32, 216–224. [Google Scholar]
- Gallimberti, I.; Bacchiega, G.; Bondiou-Clergerie, A. Fundamental processes in long air gap discharges. C. R. Phys. 2002, 3, 1335–1359. [Google Scholar] [CrossRef]
- Rizk, F. A model for switching impulse leader inception and breakdown of long air-gaps. IEEE Trans. Power Deliv. 1989, 4, 596–606. [Google Scholar] [CrossRef]
- Whitehead, J.T.; Chisholm, W.A.; Anderson, J.G. IEEE working group report. Estimating lightning performance of transmission lines. II: Updates to analytical models. IEEE Trans. Power Deliv. 1993, 8, 1254–1267. [Google Scholar]
- Eriksson, A.J.; Roux, B.C.; Geldenhuys, H.J.; Meal, D.V. Study of air gap breakdown characteristics under ambient conditions of reduced air density. IEE Proc. 1986, A133, 485–492. [Google Scholar]
- Petrov, N.I.; Waters, R.T. Determination of the striking distance of lightning to earthed structures. Proc. R. Soc. Lond. A 1995, 450, 589–601. [Google Scholar] [CrossRef]
Figure 1.
Mutual shielding of two adjacent turbines.
Figure 2.
The schematic diagram of the position of the downward leader and the wind turbine.

Figure 3.
Space potential distribution near the blade.

Figure 4.
The progress of upward leader inception.
Figure 5.
Flowchart of the calculation for the striking distance of the tip receptor, Rp.
Figure 6.
Striking distances obtained by different methods.

Figure 7.
The variation of Dmax with the changing of absolute humidity and atmospheric pressure.

Figure 8.
The variation of Dmax with changing of temperature and atmospheric pressure.
Figure 9.
The variation of Dmax with changing altitude.
Figure 10.
(a) Schematic diagram of experimental setup; (b) the actual wind turbine scaled model.

Figure 11.
Breakdown phenomenon of a scaled wind turbine.

Figure 12.
Average breakdown voltage with blade angles of 30° and 90°.
© 2017 by the authors. Licensee MDPI, Basel, Switzerland. This article is an open access article distributed under the terms and conditions of the Creative Commons Attribution (CC BY) license (http://creativecommons.org/licenses/by/4.0/).
Share and Cite
MDPI and ACS Style
Zhang, L.; Wang, G.; Zhang, W.; Ma, Y.; Guo, Z.; Li, Q. An Electro-Geometric Model for Lightning Shielding of Multiple Wind Turbines. Energies 2017, 10, 1272. https://doi.org/10.3390/en10091272
AMA Style
Zhang L, Wang G, Zhang W, Ma Y, Guo Z, Li Q. An Electro-Geometric Model for Lightning Shielding of Multiple Wind Turbines. Energies. 2017; 10(9):1272. https://doi.org/10.3390/en10091272
Chicago/Turabian StyleZhang, Li, Guozheng Wang, Wenfang Zhang, Yufei Ma, Zixin Guo, and Qingmin Li. 2017. "An Electro-Geometric Model for Lightning Shielding of Multiple Wind Turbines" Energies 10, no. 9: 1272. https://doi.org/10.3390/en10091272
Note that from the first issue of 2016, this journal uses article numbers instead of page numbers. See further details here.