A Simulation-Based Optimization Method for Hybrid Frequency Regulation System Configuration


1
Department of Industrial Engineering, College of Engineering, Peking University, Beijing 100871, China
2
Department of Electrical Engineering, Tsinghua University, Beijing 100084, China
3
Department of Electrical and Computer Engineering, University of Illinois at Urbana-Champaign, Urbana, IL 61801, USA
*
Author to whom correspondence should be addressed.
Energies 2017, 10(9), 1302; https://doi.org/10.3390/en10091302
Submission received: 21 July 2017
/
Revised: 9 August 2017
/
Accepted: 29 August 2017
/
Published: 30 August 2017
(This article belongs to the Section D: Energy Storage and Application)
Abstract
:Frequency regulation is essential for the stability of a power grid with high load fluctuation and integration of new energies. Constrained by the large ramping, a generator alone is not capable of conducting load frequency controls effectively and economically. In this paper, an energy storage system (ESS) is introduced to coordinate with generators in automatic generation control (AGC), where ESS and the generator respectively deal with high-frequency load fluctuation and low-portion. We develop a system configuration framework for such a hybrid system, including the operation strategy and capacity optimization. Due to the complexity of the hybrid system, the operation process is captured by a simulation model which considers practical constraints as well as remaining energy management of ESS. Taking advantage of the gradient-based approximation algorithm, we are then able to optimize the capacity of a hybrid system. According to the numerical experiments with real historical AGC data, the hybrid system is shown to perform well in cost reduction and to achieve the regulation tasks.
1. Introduction
The integration of intermittent new energy resources and stochastic load into power grids has introduced significant randomness and fluctuations to both the generation and the demand side, which unfortunately will result in frequency deviation and decrease the stability of power systems. As such, frequency regulation, which is an effective means to maintain system frequency within a reasonable range, is becoming increasingly important.
Conventionally, a generator is utilized as the major tool in frequency regulation operations in AGC (Automatic Generation Control) (see [1]). However, the regulation capacity of generators is quite limited because of ramping rate. In the case of rapid fluctuations, generators cannot follow all the AGC signals as this would incur huge ramping costs. With the development of energy storage techniques, an energy storage system (ESS) has been applied to a wide spectrum of application with different requirements on power and energy density as well as response time [2,3], such as load shaving [4], primary control reserve [5] and wind energy compensation [6]. Among those applications, the literature [7] identifies primary control reserve to be the one with highest benefit for ESS owners. In addition, sophisticated systems combining different types of batteries, such as superconducting magnetic energy storage (SMES) [8,9] and redox flow batteries [10], have shown good performance in reducing overshoots of frequency deviations caused by sudden demand variations [11], tie-power deviations, and steady-state time errors [12]. Previous literature have widely researched on the sizing of ESS in the application of frequency regulation, for example, in micro grid with wind turbines [13] and in distributed generation joint with photovoltiac power [14], and also the control strategy of ESS in frequency regulation based on SOC (state of charge) [15,16], and coordination control of distributed energy storage [17]. Although these works considered various power generations, they neglected the potential benefits of power generations’ participation in frequency regulation, so as to prevent a large ESS investment.
Despite their many functional advantages, moderately-sized ESS is incapable of providing consistent frequency regulation [18] because of the non-zero mean AGC signals and energy loss during charge-discharge cycles, while a large-sized ESS would take a huge investment cost. Therefore, a hybrid system combining ESS and a traditional thermal generator is introduced in [18] about frequency relation by decomposing AGC signals into low-frequency and high-frequency portions by a low-pass filter. The technical details are given in [18], and as a further research on that topic our work studies the operation strategy and sizing of ESS for such a hybrid system. The operation strategy guide real-time output of generator and ESS, and then the capacity of ESS is optimized to guarantee the frequency regulation tasks with minimum costs. Literature [19] also jointly considers these two research objectives in frequency regulation application but only regarding a battery energy storage system (BESS), and without any generator involved.
A brief introduction of the hybrid system is first presented, and then we show how the hybrid system output is controlled in operation level. Based on this the system capacity is optimized. Due to the complexity of hybrid system control, the operation process is captured in a Monte Carlo simulation model, which considers practical constraints such as output adjustment range, amplitude limiting and redistribution. Furthermore, we also introduced the remaining energy management (REM) in operation strategy so as to maintain the sustainability of ESS regulation capacity. With respect to the optimization on ESS capacity, based on the dependence of ESS capacity on the filtering coefficient, we propose an optimization framework on the basis of Simultaneous Perturbation Stochastic Approximation (SPSA) algorithm to find the optimal filtering coefficient. By carrying out the hybrid system in historical AGC data, we validate the hybrid system performance in both achieving frequency regulation tasks and cost reduction.
2. Hybrid Frequency Regulation System
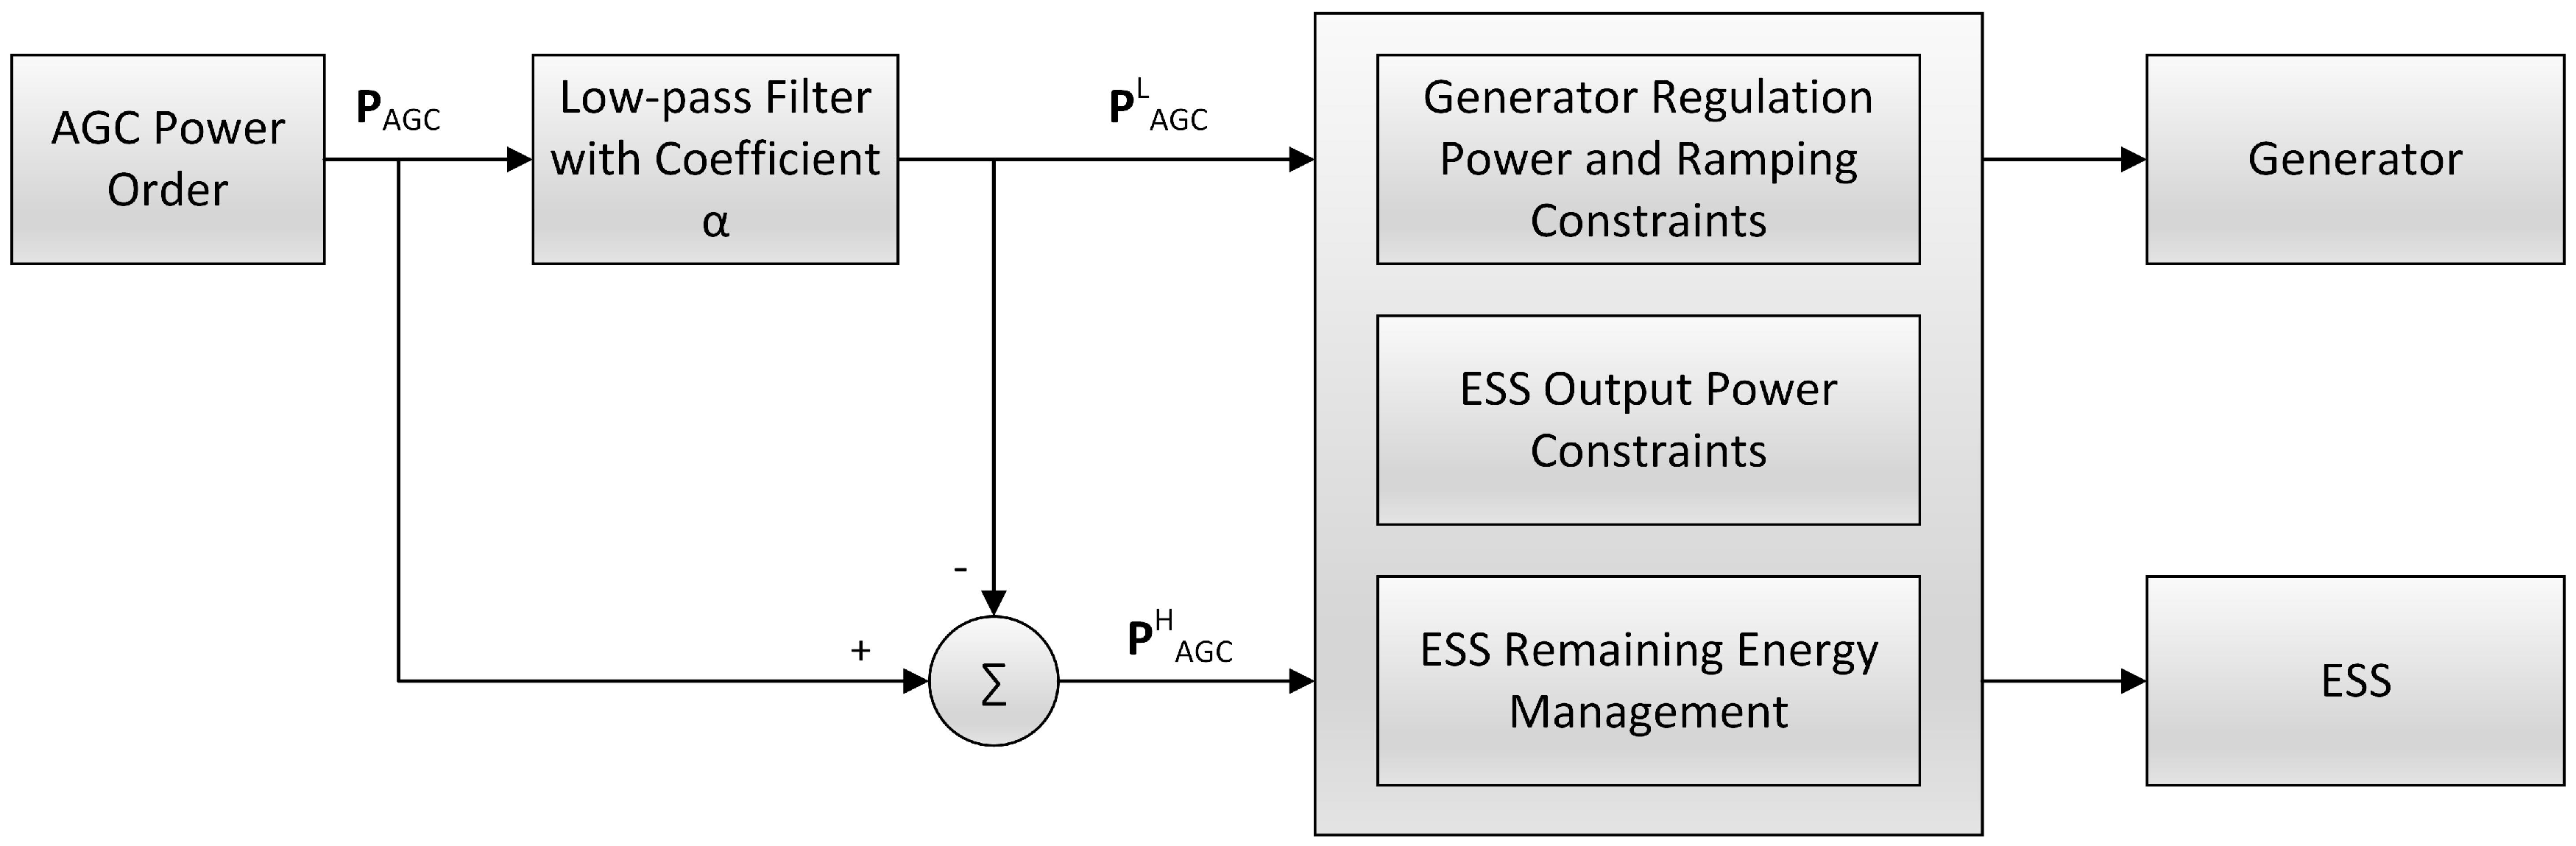
To participate in AGC, generators are relatively powerless to follow rapid frequency fluctuation and are only appropriate when the required power output changes slightly. In contrast, ESSs are able to follow power orders that change rapidly because of its quick response ability. However, moderate-size ESS is incapable of providing consistent frequency regulation since most of the AGC signals present non-zero mean property, and even when the signals are zero-mean, a large energy capacity is required because of the energy loss during charge-discharge cycles. Thus, a large ESS is usually inevitable when ESS alone is involved in AGC, incurring large investment costs. Instead, establishing a hybrid frequency regulation system with both generator and ESS could improve the regulation performance and contribute to cost reduction in a power system. To that end, filtering techniques should be used to process the original power control orders, and then generators are dispatched with low-frequency AGC signal portion while ESS is assigned to execute the high-frequency portion. The filtering and subsequent control process is shown in Figure 1.
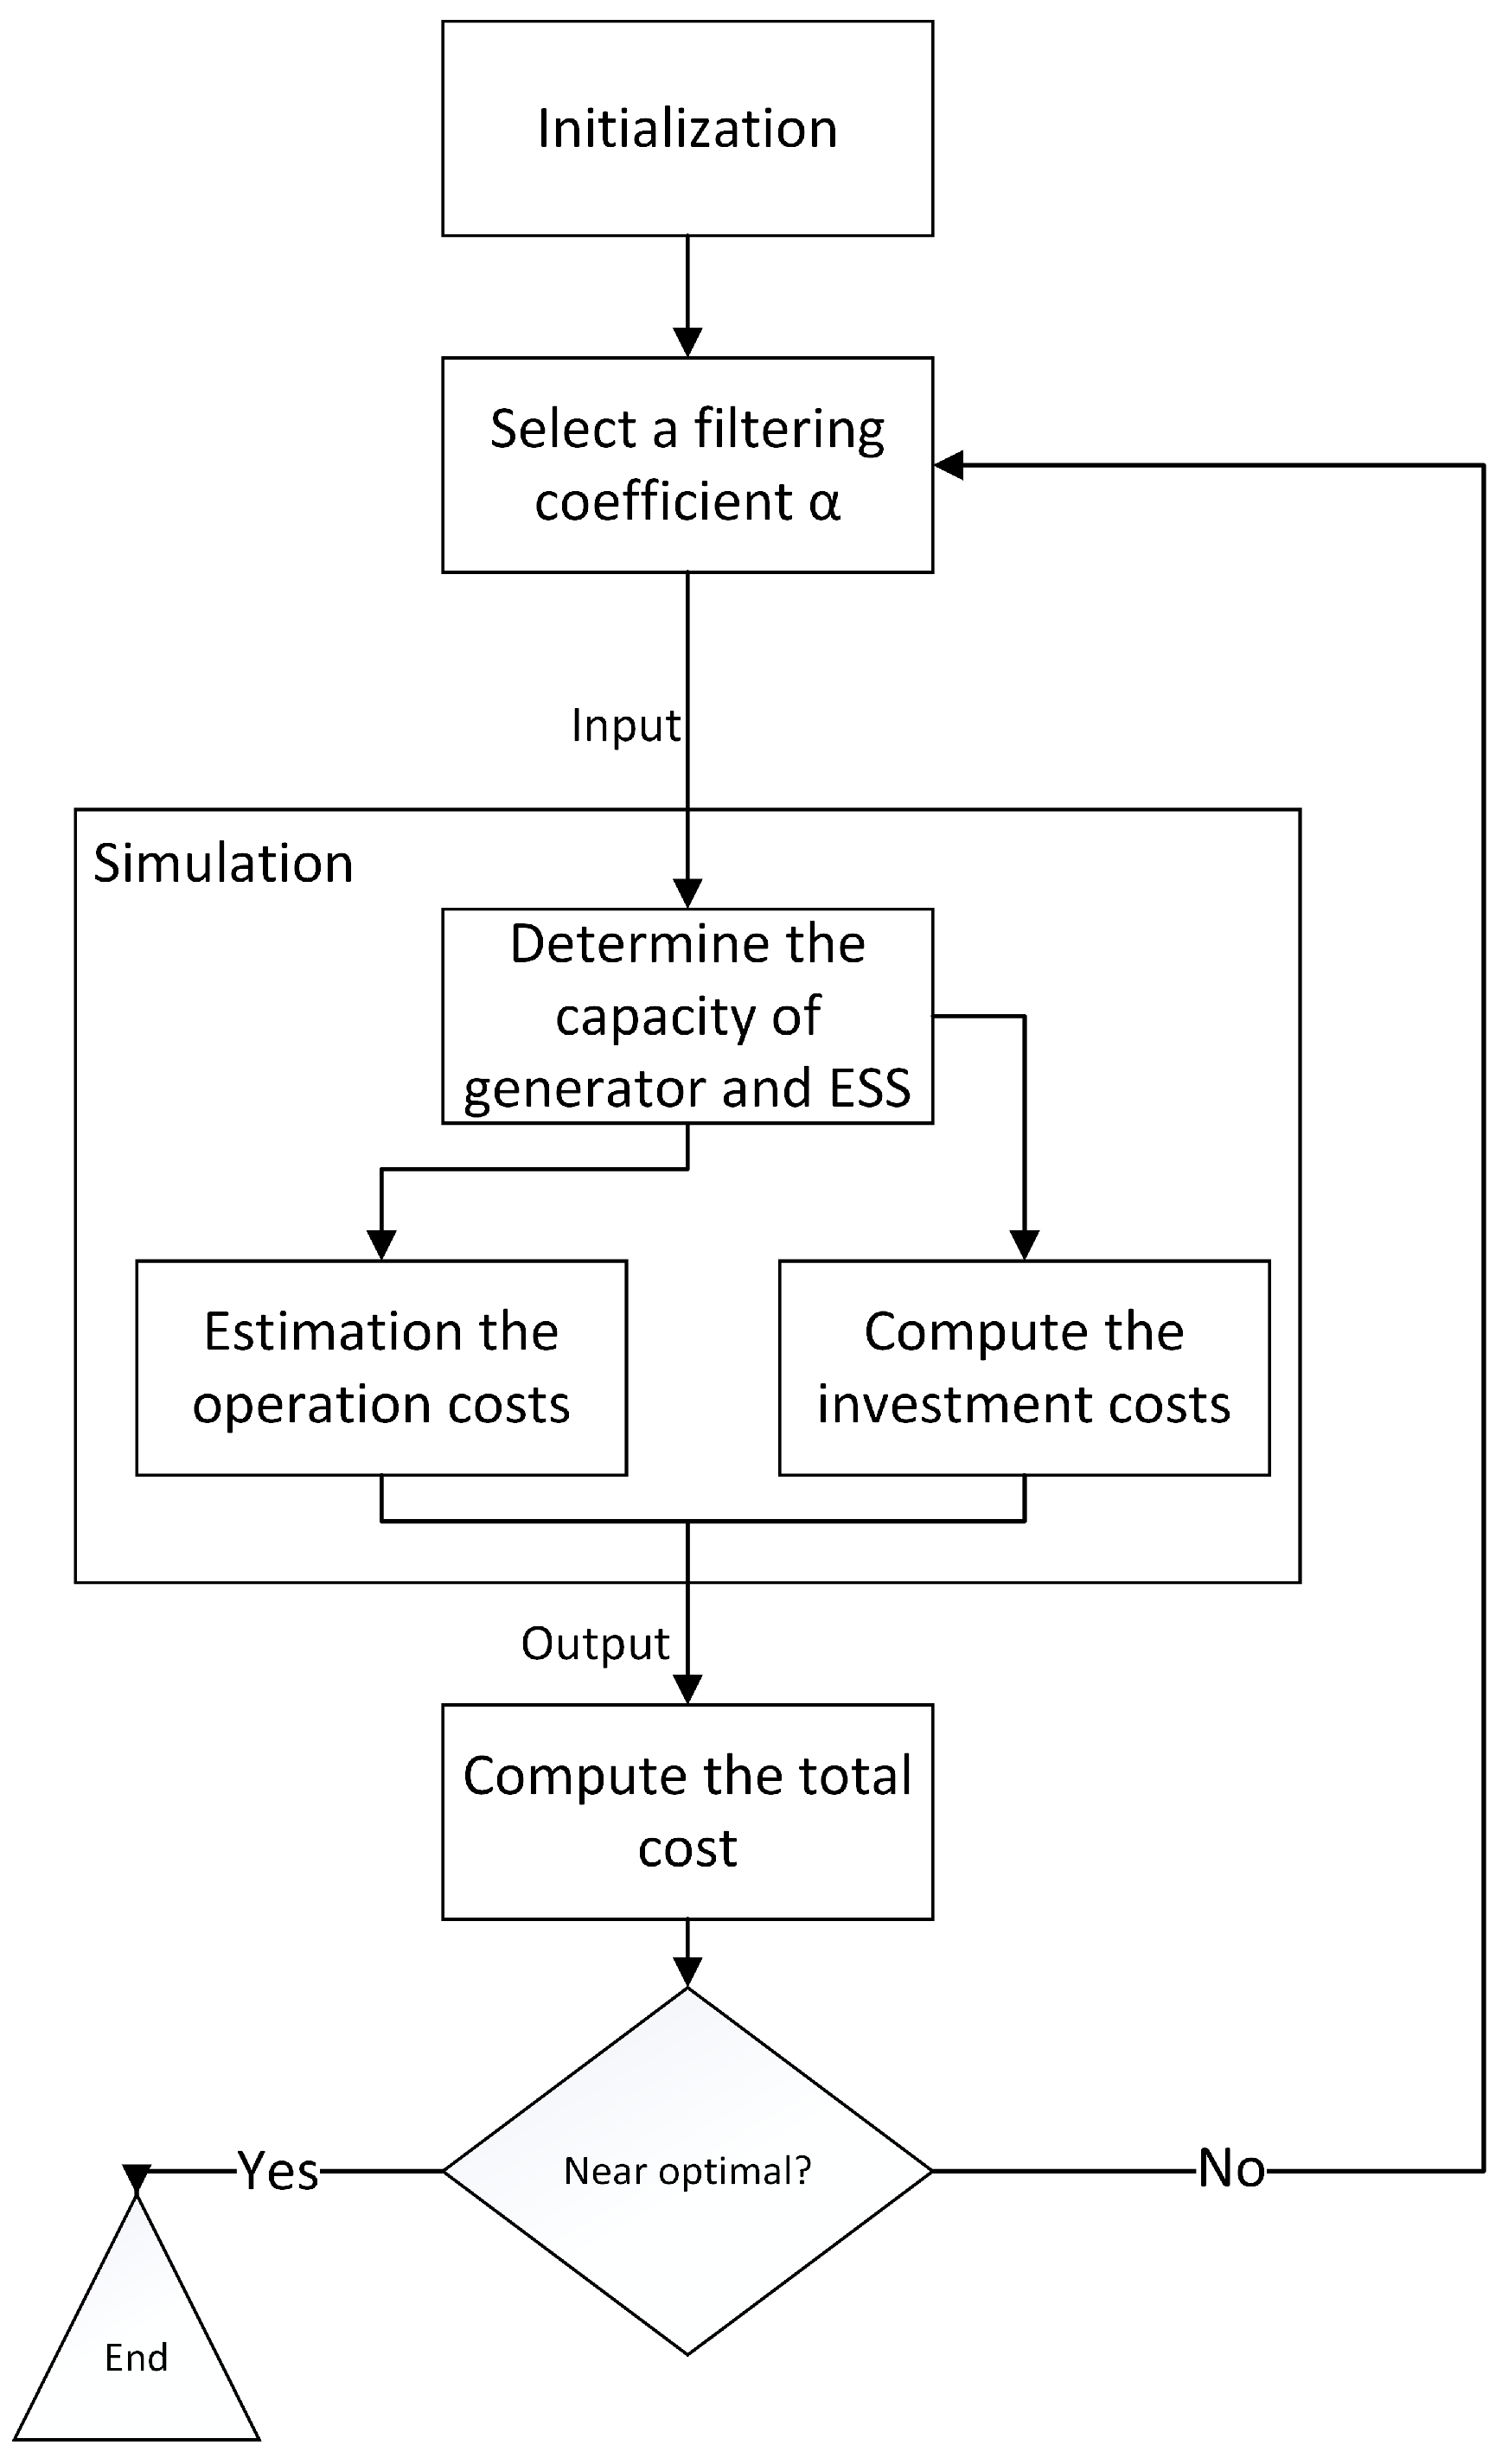
To establish such a hybrid system, the generator regulation capacity as well as the ESS capacities which should be invested for the AGC system should be determined. All these capacities are directly related to the AGC signals dispatched to them, where the filtering coefficient plays an important part. Given the system capacity and a control strategy, the operation costs can be estimated as well as the initial investment costs. These two costs are the major concern in frequency regulation system practice, so they are the major optimization objective in our proposed hybrid system. Considering the dependence of regulation capacity, the filtering coefficient is the decision variable we need to optimize during the frequency regulation process. Figure 2 presents a detailed research framework for our presented hybrid system.
Due to the complexity of the entire operation process, which is analytically intractable, we proposed a simulation model to study the hybrid system. The complex operation process includes the real-time output control of the generator and ESS, and it is impossible to track every single control operation and cost. By simulating the operation process, we estimate the operation costs in a monthly time scale. In the simulation model, we include the capacity determination activity and the control process which directly influence the operation costs. Upon observing the total costs, we conduct a gradient-based algorithm to judge whether the performance of the hybrid system has reached optimality, otherwise the algorithm iteratively selects a better filtering coefficient for total cost evaluation. We will provide a more detailed description of the optimization algorithm in Section 4.
3. Simulation Model for Operation Process
The simulation model takes the filtering coefficient and AGC signals as input. The filtering coefficient is continuous variable , while the AGC signals are the main sources of randomness. Based on historical AGC signal data, we establish a sampling method to generate random signals in simulations. To estimate the operation costs, the control strategy is also necessary. This paper considers practical constraints such as the adjustment range of generator and ESS, amplitude limiting and also remaining energy management (REM). We will reveal that the strategy shows good performance in maintaining ESS energy and reducing the ramping power of the generator.
3.1. AGC Signal Sampling
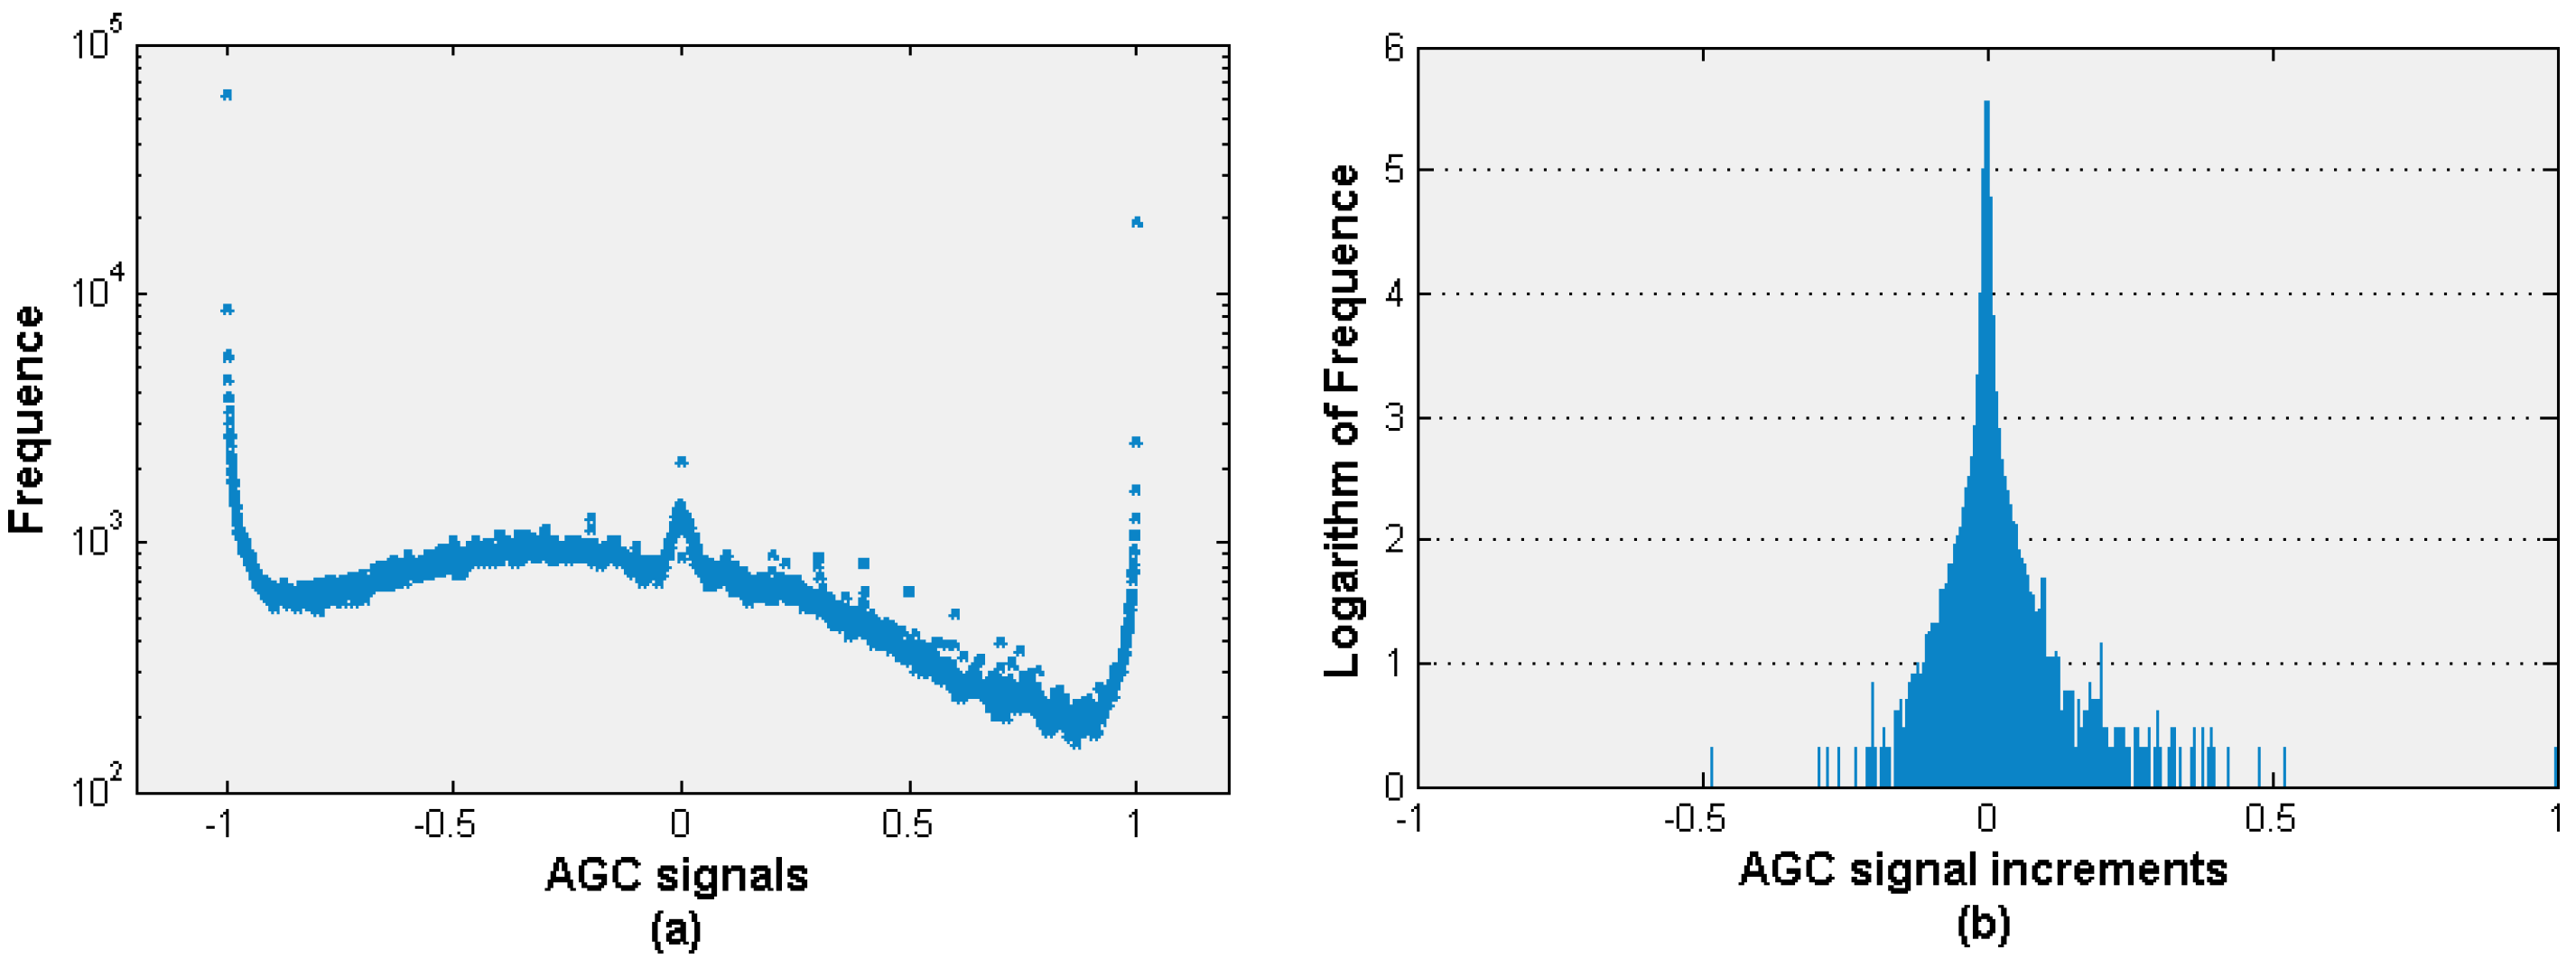
We demonstrate a sampling method in this section that is based on the historical data, and take the sampled signals as simulation input. To that end we have to describe the probability model of the control process, which is the initial step of Monte Carlo Simulation. Therefore, we analysed the historical AGC signals data of PJM from 18 December 2012 to 18 January 2013. The signals are collected every 2 s, thus there are 43,200 samples for one day. The left of Figure 3 shows the distribution of these signals, while the right figure indicates the distribution of incremental signals. Note that the ordinate of right figure is the logarithm of frequency, and we can see that it is more reasonable to draw samples from a normal distribution as in Figure 3b. Therefore, the incremental signal is fitted as a normal distribution, from which the AGC signals are sampled. The fitting results have passed the KS test.
3.2. Determine the Regulation Capacity
Throughout this paper, we use boldface letters for vector parameters and plain letters for scalar parameters. Let be the original AGC power orders which is sampled from the fitted distribution above in a simulation model, and and are the low- and high-frequency portions. The following equation is satisfied:
With first-order low-pass filter, the frequency domain relationships among , , and are described as in Equation (2) and time domain relationships are described as in Equation (3), where T is the time constant of the filter and is the frequency sample interval.
Let and , Equation (3) can be written as
To cover all the AGC signals, the regulation capacity of generator and the power capacity of ESS should be larger than and respectively. Thus, we have and . In the simulation model, we sample AGC signals for one month and pick out the maximum value of high-frequency portion and low-frequency portion signals respectively.
3.3. Control Strategy
We propose a control strategy in simulation model, which takes practical constraints into consideration, such as the adjustment range and amplitude limiting, and also captures the remaining energy management so as to maintain the sustainability of ESS regulation capacity. First of all, according to the regulation capacity of the generator and ESS, as well as the ramping rate of the generator and the remaining energy of ESS, the adjustment range for both the generator and ESS are computed. Then the AGC signals are compared with the range so that it is examined whether it is necessary to limit the amplitude or not, and if the amplitude is limited, the signal re-distribution is also conducted. Finally, the remaining energy of ESS is managed by making an adjustment to the output of the generator and ESS.
3.3.1. Power Adjustment Range Computation
According to the regulation capacity and ramping constraints of the generators, the output power adjustment ranges of the generators at time k is as follows:
and are the maximum and minimum regulation power of generator in time k, with and being the maximum upstream and downstream ramping power within .
The adjustment range of ESS is not only related to the power capacity , but also related to the remaining energy, which is as follows:
and are the maximum and minimum output power for ESS, assuming the discharge power is positive and the charging power is negative. In the equation, indicates the remaining energy of ESS at time k, and and are the minimum and maximum energy of ESS that should be maintained to prevent over-charge and over-discharge. In this paper we set to be 5% of ESS energy capacity while is set to be 95%. and are the discharge and charge efficiency respectively.
3.3.2. Amplitude Limit and Redistribution
By comparing the adjustment range and AGC signals, the amplitude limiting operations are conducted when the AGC signals exceed the adjustment ranges. Let and , and be as follows:
Negative or indicates that the high-frequency AGC signals are beyond the adjustment range of ESS; thus, the AGC order are amplitude-limited and over-dimension signals are redistributed to the generator. The same operation rules also apply to the generator, and the amplitude limiting and redistribution operations instruction are shown in Table 1.
3.3.3. Remaining Energy Management
Amplitude limiting and redistribution guarantee that AGC orders are within the capacity of the generators and ESS, noting that after these activities, negative will be trimmed to be positive. However, while these steps do not prevent over-charging and over-discharging, the remaining energy cannot be guaranteed to lie within a reasonable interval. Once the remaining energy reaches extreme values, i.e., the given maximum and minimum values of the remaining energy, the ESS may lose its capacity to regulate the frequency.
The remaining energy management operations are based on the current state of charge (SOC) and adjustment ranges, and the main instructions for conducting recharging or discharging policy are as follows:
- If the remaining energy is very low, e.g., 0–30% of , recharge ESS with full capacity, i.e., , and if the remaining energy is relatively low, e.g., 30–50%, recharge ESS with partial capacity, i.e., .
- If the remaining energy is very high, e.g., 70–100%, release the energy with full capacity, i.e., , and if the remaining energy is relatively high, e.g., 50–70%, release the energy with partial capacity, i.e., .
It is noted that, after amplitude limiting and redistribution operations, the parameters and are trimmed to be non-negative values; thus, in a word, the strategy prevents ESS from being over-discharged when SOC is low and over-charged when SOC is high.
4. Optimize the Hybrid System
Monte Carlo simulation has been widely adopted in power system research, for example, electric vehicles [20] and thermal unit control [21], because of its flexibility to deal with complex operating conditions and system considerations such as load uncertainty [22]. Simulation is able to capture every known logical detail and every perspective of stochasticity of complex stochastic system, and it is much cheaper and faster to predict and evaluate system performance [23]. Considering the complexity of the control strategy and stochasticity of the AGC signal, we modelled the whole process by a simulation model described above. Simulation optimization studies how to find the optimal solution to a system modelled by simulation, which usually has to deal with noisy, expensive computation and black-box [23]. We refer readers to [23] for current simulation optimization algorithms and applications.
The simulation model takes the filtering coefficient and AGC signals as input and the output is the total cost of the system in a fixed time period. Thus, given the filtering coefficient we can evaluate the related performance, and by comparing a wide range of feasible we can find the optimal one. However, since is continuous parameter, and it can need a large computation effort to simulate sufficient potential values in order to reach optima. Therefore, a gradient-based simulation optimization algorithm is used in this paper. The algorithm Simultaneous Perturbation Stochastic Approximation (SPSA) is a modified SA algorithm which is based on the gradient approximation methods. The algorithm will generate a random perturbation so that each iteration selects a random direction to search for the global optima. The proof for strong convergence and asymptotic normality are provided in [24]. The algorithm version for the constrained problem is provided in [25]. The problem in this paper is a constrained problem because of . The method to deal with the constraint is to incorporate a heavy penalty if exceeds the range [0,1] as
where M is a very large number and when is beyond a large penalty will be incurred. The algorithm used in this paper is shown in Table 2.
Also the algorithm can be seen intuitively in Figure 4.
5. Numerical Experiments
5.1. Simulation Input
We conduct numerical experiments with data originating from PJM from 18 December 2012 to 18 January 2013. The AGC orders are collected every 2 s. We fitted the signal increment distribution based on the historical data, which includes over 1 million signals. The fitted results are a normal distribution . Besides, we also found that a positive (negative) signal increment is more likely followed by a positive (negative) increment, and the probability is about 0.92. Thus, we sample signal increment , and make sure that a positive (negative) increment is followed by a positive (negative) increment with probability 0.92. After a random sample from U(−1, 1) for the initial signal , we can get the sampled AGC signal
Here are some illustrations of the real daily signals and sample signals in Figure 5, which intuitively show the effectiveness of the sampling methods by comparison. (a) and (b) are AGC signals from two different days from the historical data, while (c) and (d) are two samples from our sample methods.
ESS parameters in simulation originate from [26]. ESS discharging efficiency is , whereas charging efficiency is also . The lifetime of energy-converting devices is years, and the maximum charging and discharging cycles of storage battery is . ESS power cost is , and energy cost is .
The rated power of generators is MW in simulation, and upper and lower ramping rates are 10% of rated power. We take advantage of the method in [18] to estimate extra costs of generators participating in AGC, i.e., costs involved in AGC lead to decreased generator operation efficiency, whereas decreased operation efficiency leads to increased costs to generate the same amount of energy. Frequent operations and variation in operation points both lead to decreased generator efficiency, with the cost per MWh by frequent operations set to . Considering that the maximum value of AGC power orders is 10% of generator rated power, the operation point of generators is around 90%. The decreased generator efficiency is relatively not that large; thus, the extra cost related to change in operation points is set to the constant . For a general case, can be estimated using a generator efficiency curve.
5.2. Costs and Optimization Results
We carry out the SPSA algorithm with the instance introduced above, and the parameter of the algorithm is determined according to the [27] as well as trial and error. The operation cost considered in this instance includes costs caused by frequent operations (ramping up and down) and variation in operation points. The ramping cost is evaluated by
and the cost related to the departure of generator output power from optimal operation point is
where is the operation point and , and is the rated power of generator. Besides the two operation costs above, it is noted that the simulation model could capture operation costs of other forms.
The initial costs are needed to invest the ESS with respect to power capacity and energy capacity. The power costs come from power conversion devices (PCS) and energy costs come from energy storage units, herein
Our evaluated total cost will then be
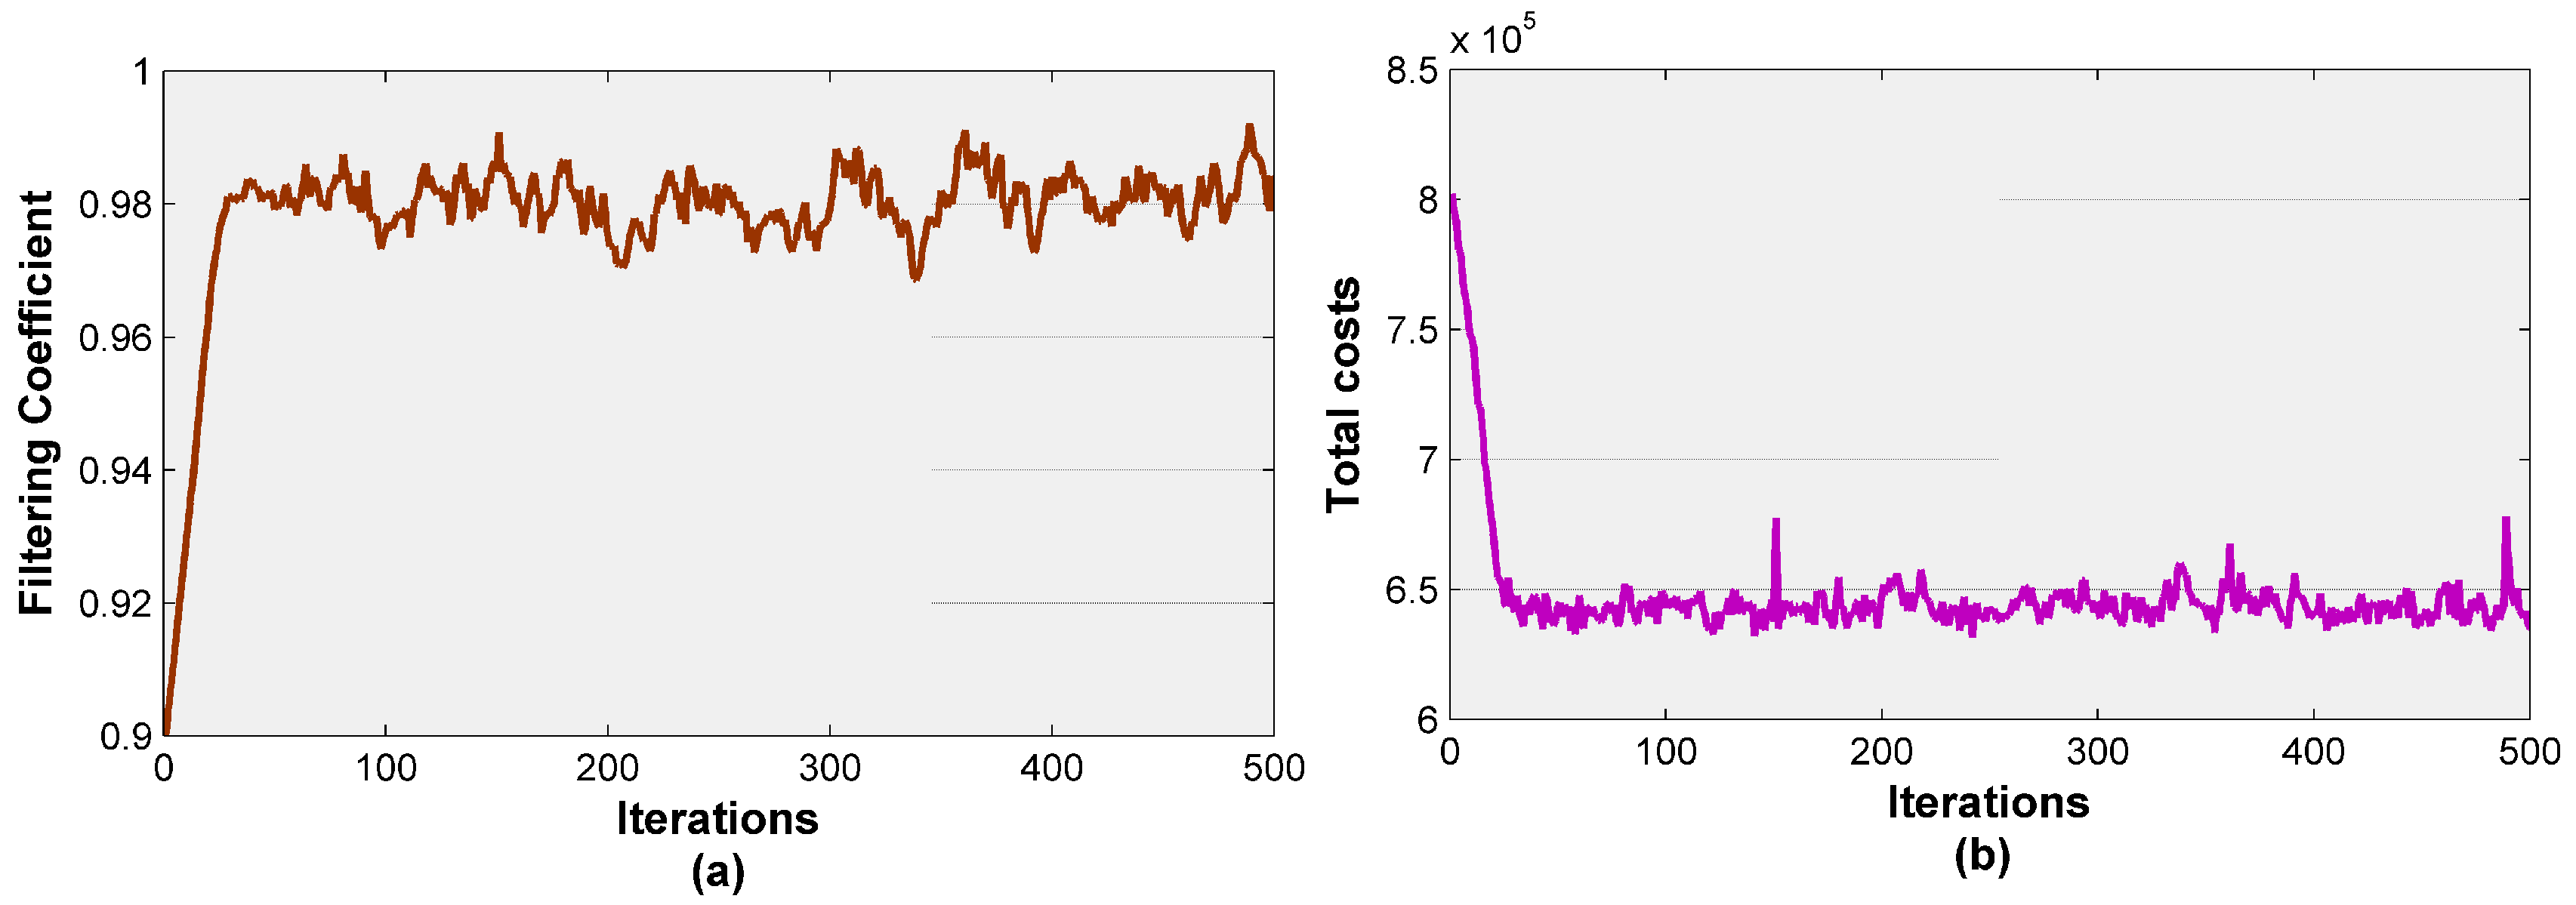
The iterations and optimization results are shown in Figure 6, and we select as the initial filtering coefficient. As we can see, the algorithm converges to the optimal value with less than 100 iterations and then fluctuates up and down around the average value to the end. The fluctuations are due to the noise in the simulation caused by the random AGC signals. By taking the average of the results after the 100th iteration, we obtain the optimal filtering coefficient . In the next sections, we will evaluate the hybrid system’s performance on achieving the regulation tasks and reducing the costs with respect to the real AGC signal data.
5.3. Frequency Regulation Performance
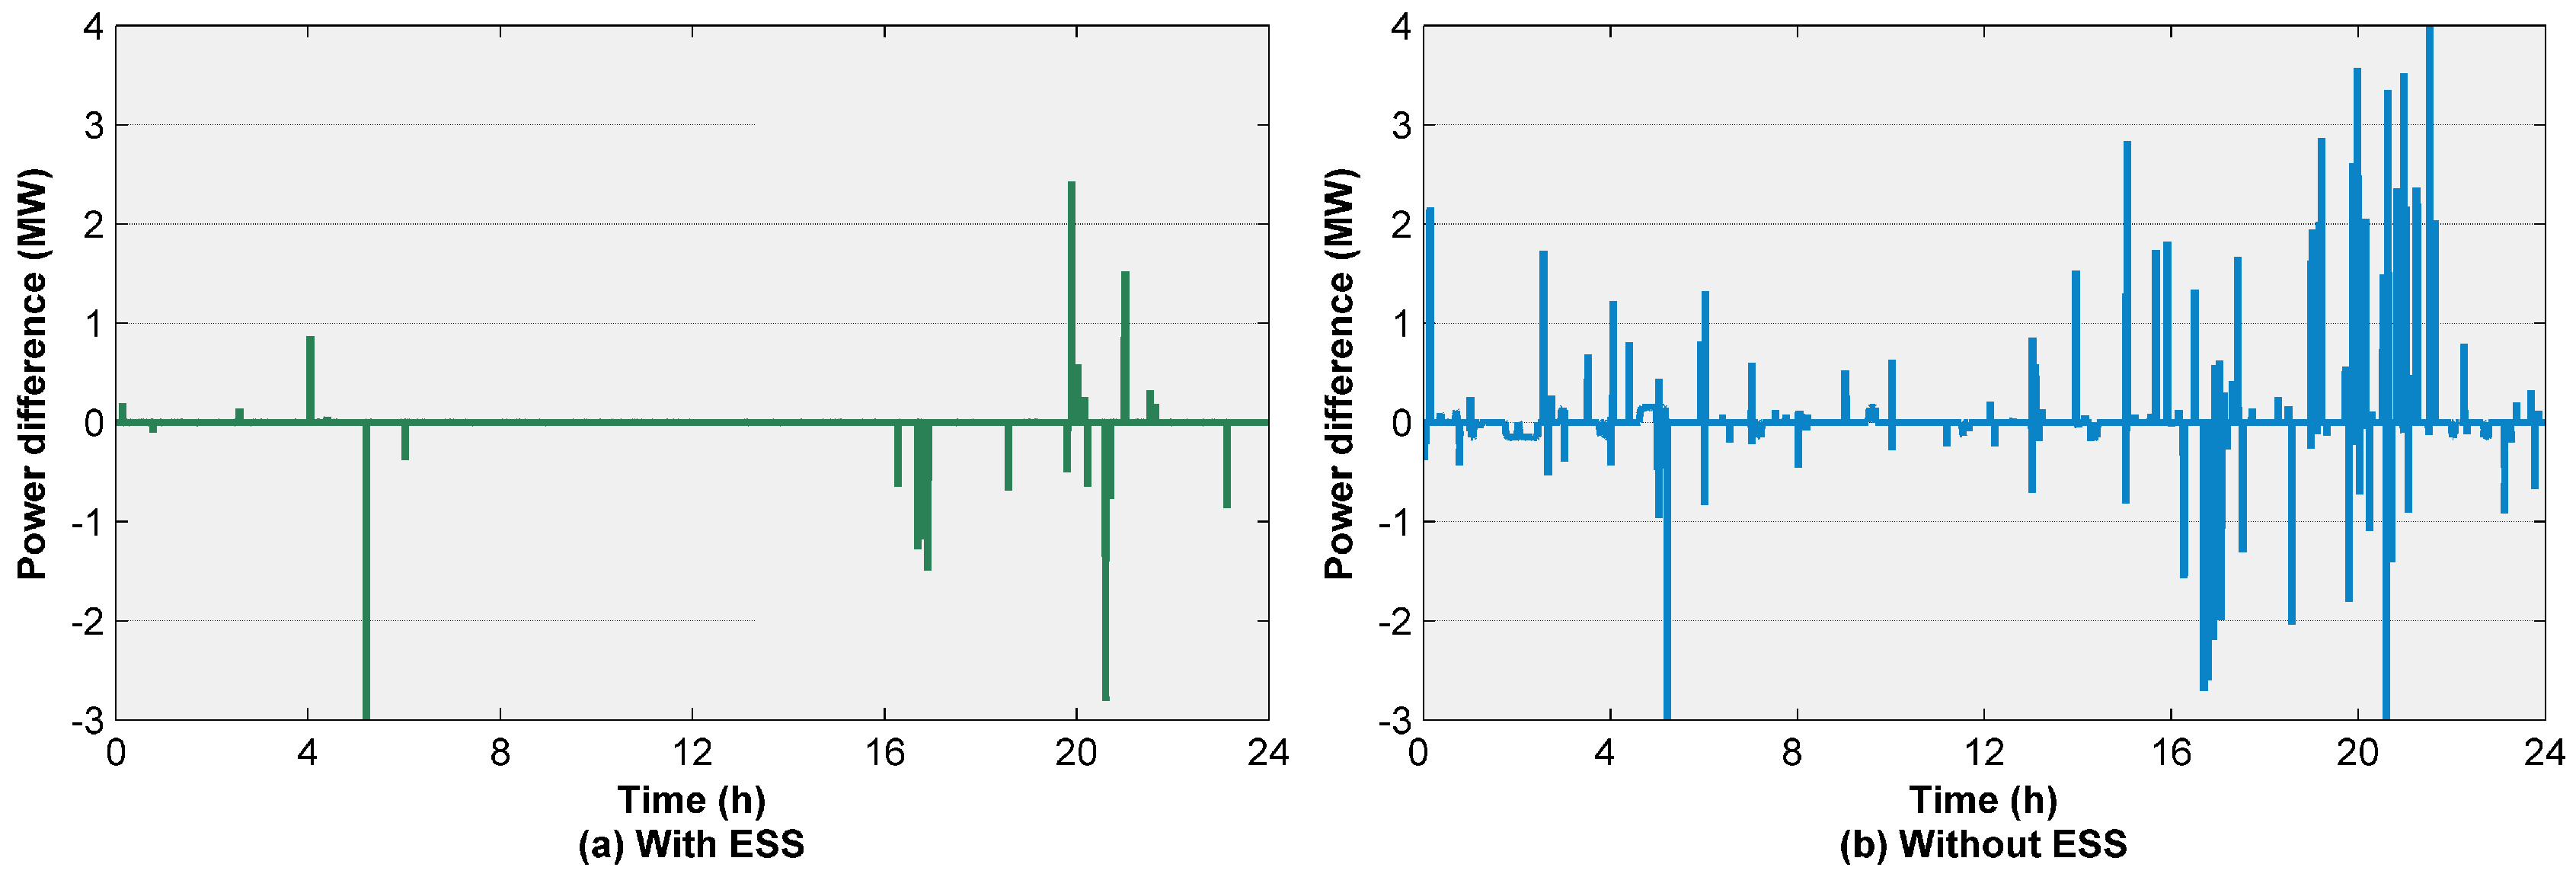
We input the optimal filtering coefficient in simulations with historical AGC signal data of PJM from 18 December 2012 to 18 January 2013, and consequently we get the regulation power capacity for generator is 0.985 MW and 0.405 MW for ESS considering the AGC signal is between MW to 1 MW, and the energy capacity of ESS is set accordingly 0.405 MWh. Figure 7 illustrates the hybrid system regulation output on 1 January 2013. The power difference indicates the uncovered AGC signals; hence, we see that the involvement of ESS in AGC has enhanced the ability of frequency regulation. After fully simulating the operations of a hybrid system with the one-month real data, we realize that, on average, the power differences are reduced by 91%.
5.4. Generator Ramping Reduction
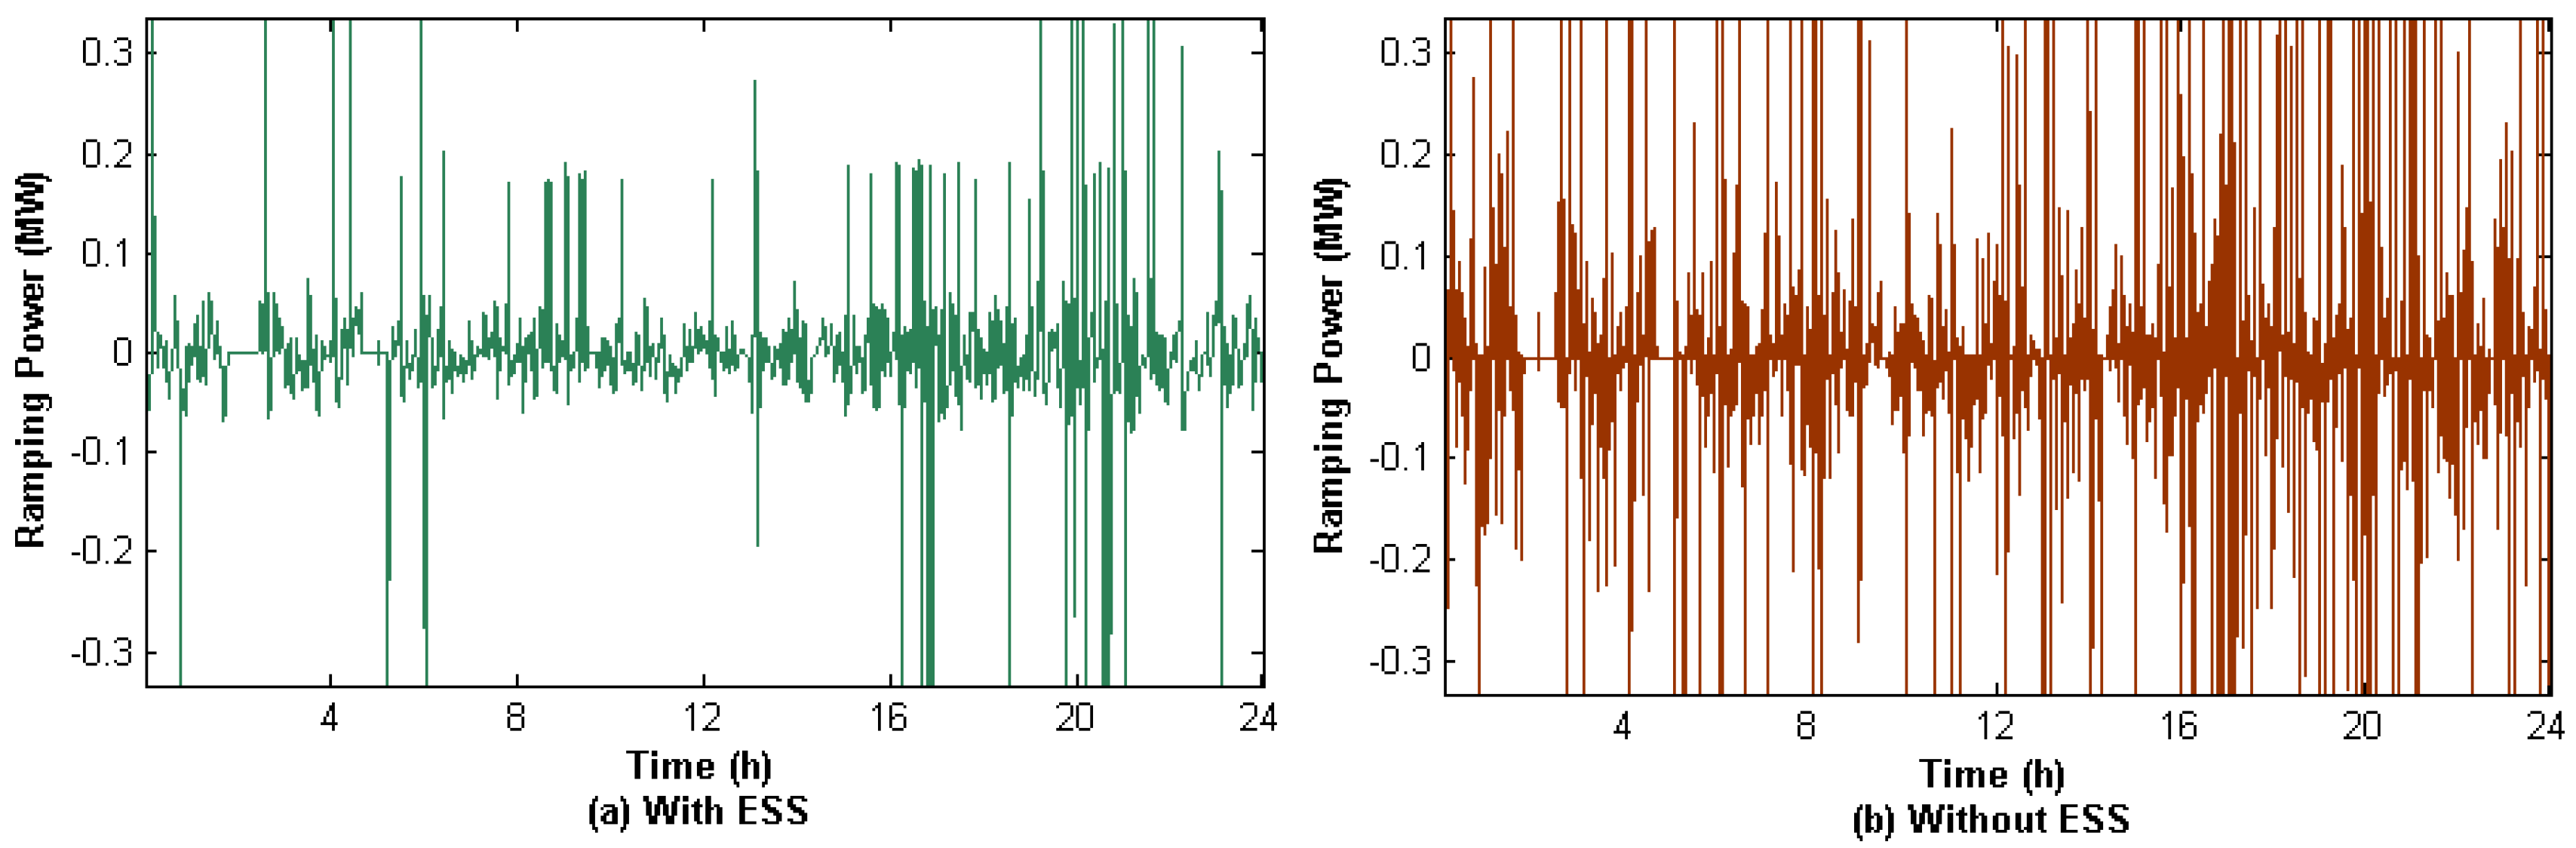
We then examined the generator ramping reduction of the hybrid system. Figure 8 is the generator ramping power with and without ESS in the frequency regulation system given the optimal filtering coefficient 0.9805. The reduction is obvious according to the figure, and, in addition, the average ramping reduction of the hybrid system with the one-month real data is over 25%.
5.5. Remaining Energy Management
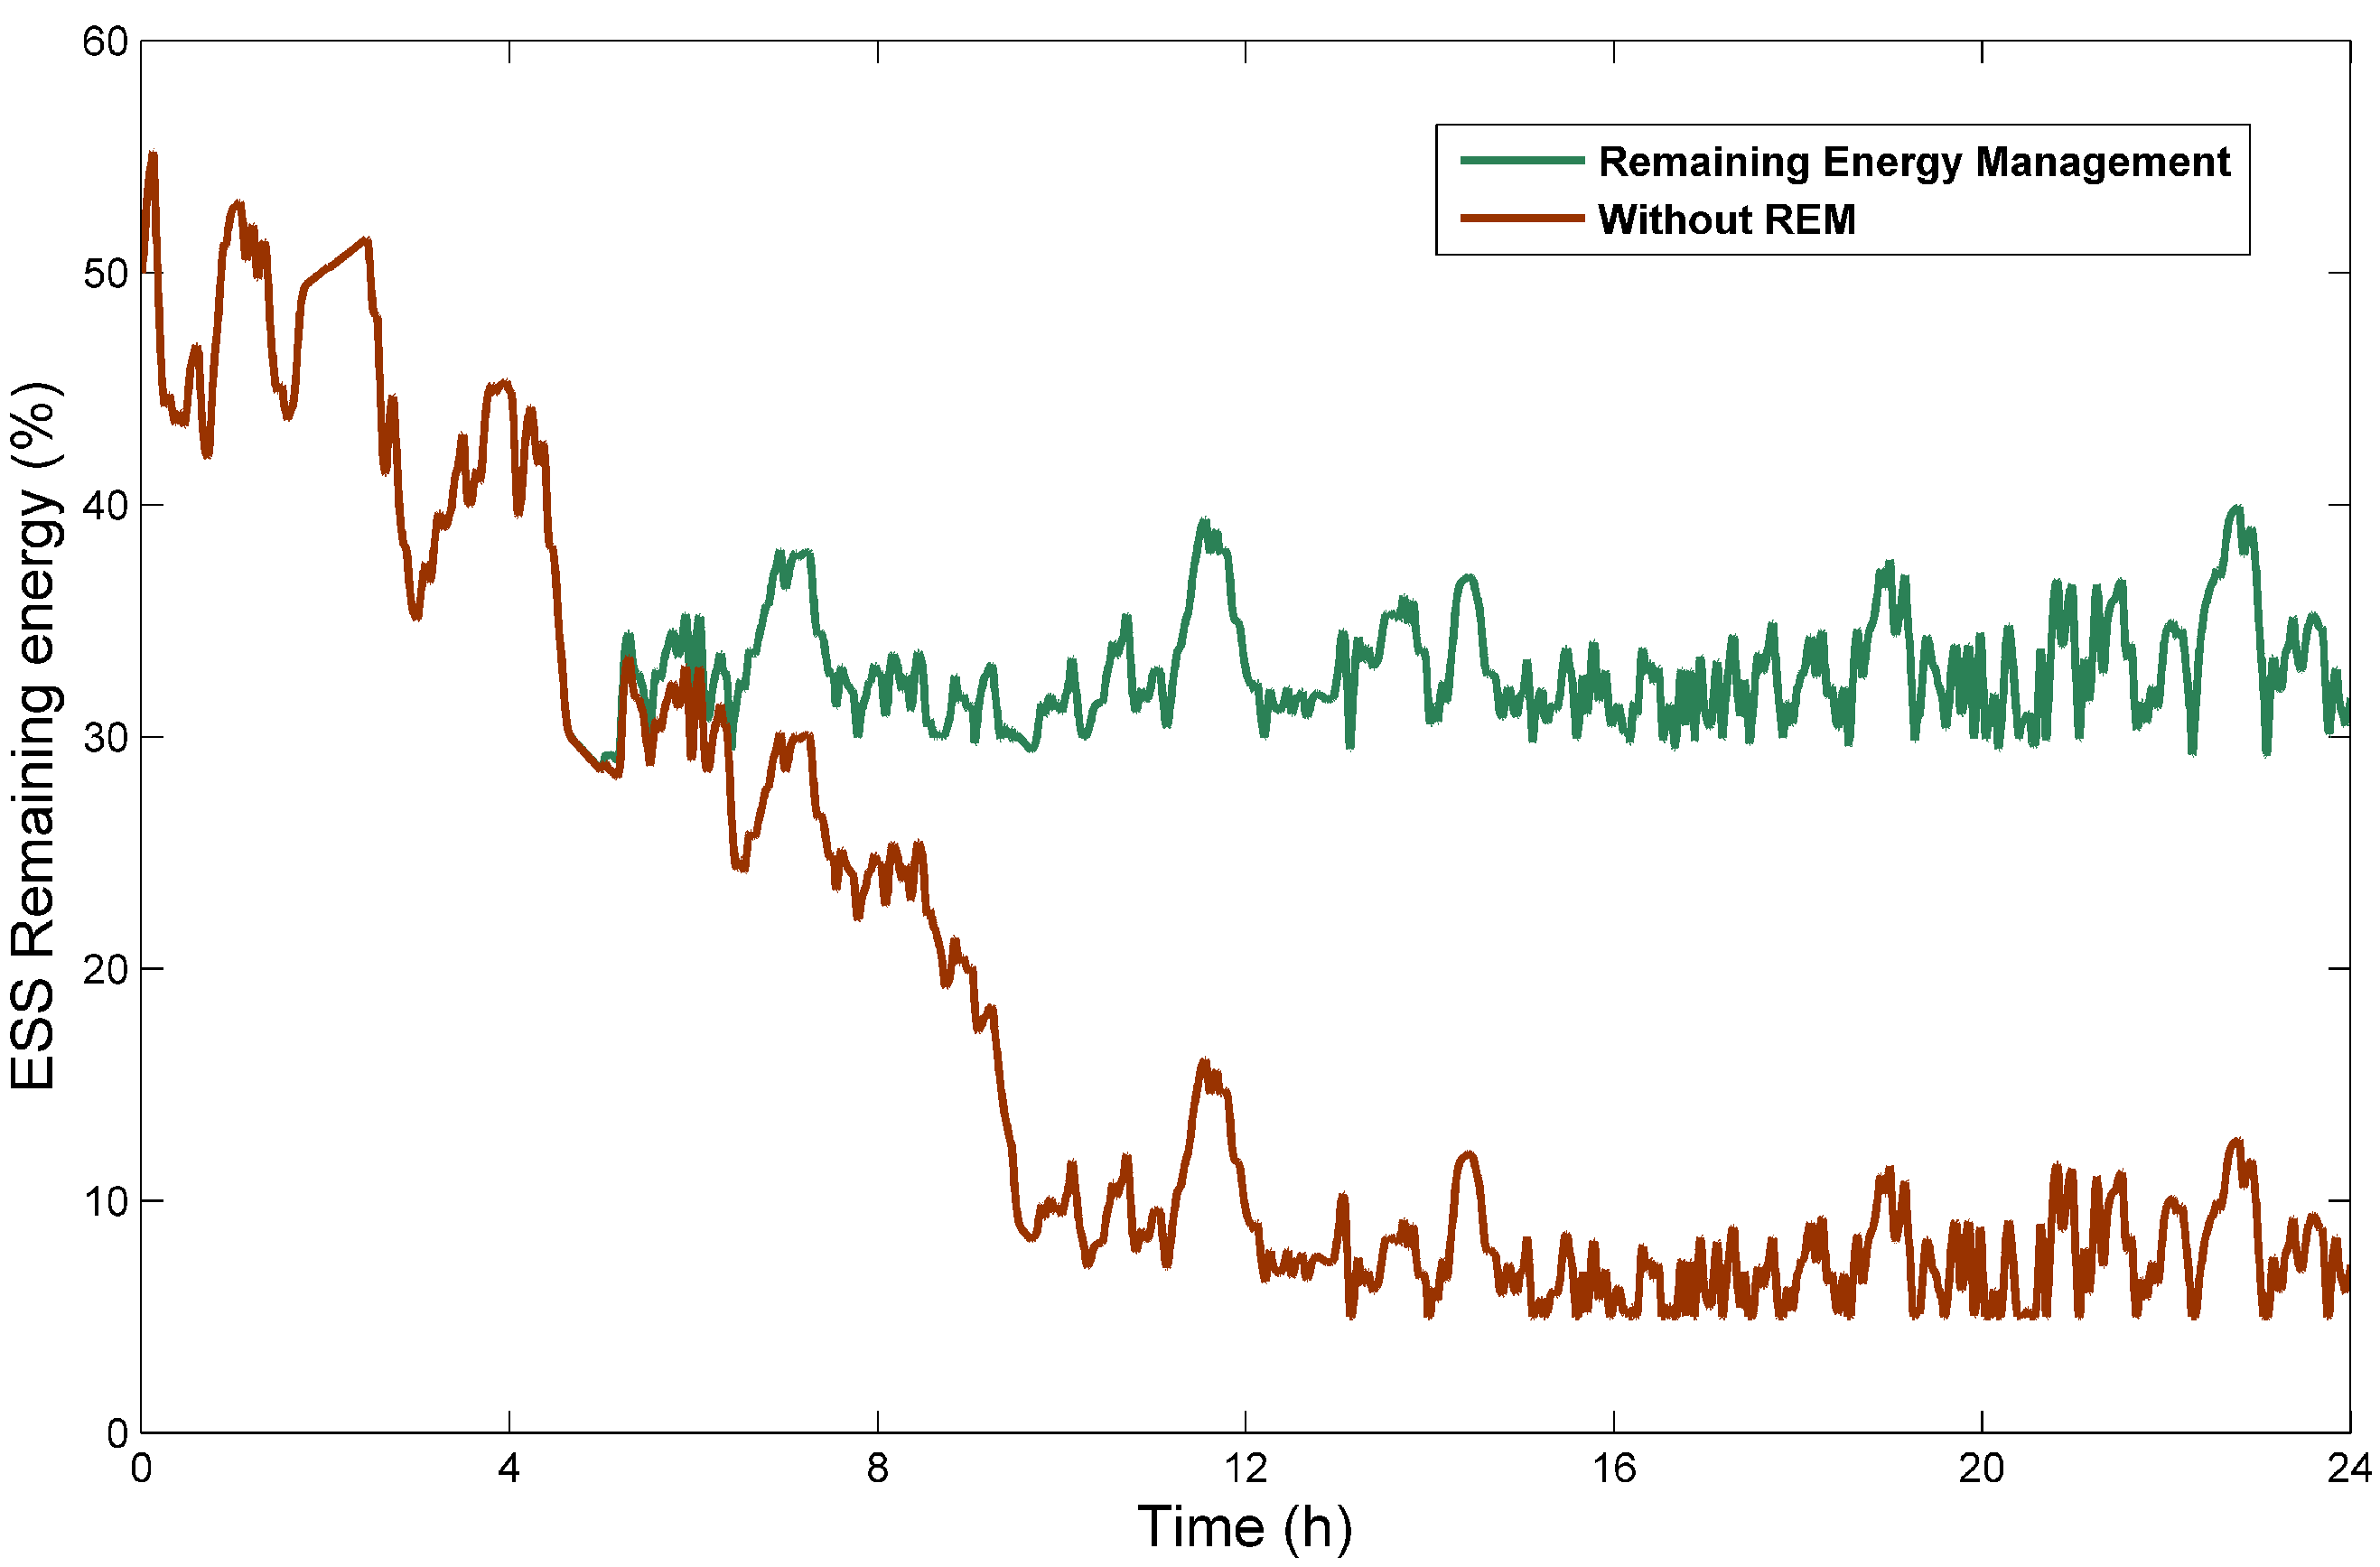
The regulation ability of ESS is directly influenced by the remaining energy; therefore, maintaining the remaining energy within a reasonable range becomes essential for ESS to provide sustainable regulation power. As we can see from Figure 9, with remaining energy management (REM), the energy is maintained above 30% while remaining energy fluctuates below 10% most of the time when there are no such management activities.
6. Conclusions
In this paper, we studied the coordination of ESS with a generator in AGC in frequency regulation. Although the fast response ability of ESS makes it suitable for frequency regulation, it is expensive to invest in large-size ESS. A hybrid regulation system with both a generator and ESS can take advantage of the benefits of both devices so that the regulation tasks can be achieved with less costs. We adopted a Monte Carlo simulation model to study the capacity optimization of generator and ESS, and took the operation process and control strategy as an input. Various practical constraints are considered in the operation process, such as the amplitude limiting and remaining energy management of ESS. Based on the simulation model, the total costs of the hybrid system to invest and operate are estimated on a given filtering coefficient . Further, a gradient-based algorithm is introduced to search for the optimal system configuration, specifically the , based on which the capacities of generator and ESS are optimized. We show in numerical experiments that the algorithm can converge to the optimal solution efficiently. The performances of the hybrid system in terms of achieving the regulation tasks and costs reduction are also shown in the experiments with respect to the generator ramping and the power differences between AGC signals and hybrid system output. As the key to ESS operation, the remaining energy management is proved to be crucial in maintaining the ESS energy.
We model the operation process based on the Monte Carlo simulation method, in order to incorporate many influence factors in the model. We captured the influence of regulation demand and some practical constraints on capacity optimization of the hybrid system, while other factors, such as the growth of demand in the short-term and long-term future, are not incorporated yet because of a lack of related data. Due to the complexity, we optimize the capacity of the hybrid system with a determined operation strategy and parameters in this paper. However, there is a great potential to make progress in jointly optimizing the capacity and operation strategy.
Acknowledgments
This work was supported in part by National Key Research and Development Program of China (2017YFB0902801).
Author Contributions
The paper was a collaborative effort between the authors. Jie Song designed the simulation optimization framework. Xin Pan established the simulation model and conducted the numerical analysis. Chao Lu dealt with the energy storage technique constraints and process. Hanchen Xu designed the hybrid system operation strategy.
Conflicts of Interest
The authors declare no conflicts of interest.
Abbreviations
The following abbreviations and nomenclature are used in this manuscript:
| AGC | Automatic Generation Control |
| ESS | Energy Storage System |
| REM | Remaining Energy Management |
| Filtering coefficient | |
| Original AGC signals | |
| The low-frequency portion of AGC signals after filtering with kth element being | |
| The high-frequency portion of AGC signals after filtering with kth element being | |
| The regulation capacity of generator | |
| The power capacity of ESS | |
| The energy capacity of ESS | |
| The upstream or downstream adjustment bound for generator at time k | |
| The upstream or downstream adjustment bound for ESS at time k | |
| ESS remaining energy at time k | |
| The upper limit for remaining energy maintained | |
| The lower limit for remaining energy maintained | |
| or | The discharge and charge efficiency |
| or | The upper and lower adjustment range for ESS |
| or | The upper and lower adjustment range for generator |
| M | A very large number for constraint penalty |
| Energy storage costs | |
| The unit cost for 1 MW ramping in generator | |
| The operation point of generator | |
| The unit cost for 1 MW storage capacity | |
| The unit cost for 1 MWh energy capacity |
References
- Zhang, J.; Lu, C.; Song, J. Dynamic performance-based automatic generation control unit allocation with frequency sensitivity identification. Int. J. Prod. Res. 2016, 54, 1–16. [Google Scholar] [CrossRef]
- Luo, X.; Wang, J.; Dooner, M.; Clarke, J. Overview of current development in electrical energy storage technologies and the application potential in power system operation. Appl. Energy 2015, 137, 511–536. [Google Scholar] [CrossRef]
- Cong, T.N. Progress in electrical energy storage system: A critical review. Prog. Nat. Sci. Mater. Int. 2009, 19, 291–312. [Google Scholar]
- Lu, C.; Xu, H.; Pan, X.; Song, J. Optimal sizing and control of battery energy storage system for peak load shaving. Energies 2014, 7, 8396–8410. [Google Scholar] [CrossRef]
- Hollinger, R.; Diazgranados, L.M.; Braam, F.; Erge, T.; Bopp, G.; Engel, B. Distributed solar battery systems providing primary control reserve. IET Renew. Power Gener. 2016, 10, 63–70. [Google Scholar] [CrossRef]
- Korpaas, M.; Holen, A.T.; Hildrum, R. Operation and sizing of energy storage for wind power plants in a market system. Int. J. Electr. Power Energy Syst. 2003, 25, 599–606. [Google Scholar] [CrossRef]
- Oudalov, A.; Chartouni, D.; Ohler, C.; Linhofer, G. Value analysis of battery energy storage applications in power systems. In Proceedings of the 2006 IEEE PES Power Systems Conference and Exposition, Atlanta, GA, USA, 29 October–1 November 2006; pp. 2206–2211. [Google Scholar]
- Ngamroo, I.; Mitani, Y.; Tsuji, K. Application of SMES coordinated with solid-state phase shifter to load frequency control. IEEE Trans. Appl. Supercond. 1999, 9, 322–325. [Google Scholar] [CrossRef]
- Sheikh, M.R.I.; Muyeen, S.M.; Takahashi, R.; Murata, T.; Tamura, J. Improvement of load frequency control with fuzzy gain scheduled superconducting magnetic energy storage unit. In Proceedings of the International Conference on Electrical Machines, Vilamoura, Portuga, 6–9 September 2008; pp. 1–6. [Google Scholar]
- Sasaki, T.; Kadoya, T.; Enomoto, K. Study on load frequency control using redox flow batteries. IEEE Trans. Syst. 2004, 19, 660–667. [Google Scholar] [CrossRef]
- Kottick, D.; Blau, M.; Edelstein, D. Battery energy storage for frequency regulation in an island power system. IEEE Trans. Energy Convers. 1993, 8, 455–459. [Google Scholar] [CrossRef]
- Aditya, S.; Das, D. Battery energy storage for load frequency control of an interconnected power system. Electr. Power syst. Res. 2001, 58, 179–185. [Google Scholar] [CrossRef]
- Aghamohammadi, M.R.; Abdolahinia, H. A new approach for optimal sizing of battery energy storage system for primary frequency control of islanded Microgrid. Int. J. Electr. Power Energy Syst. 2014, 54, 325–333. [Google Scholar] [CrossRef]
- Singh, S.; Singh, S.K.; Chanana, S.; Singh, Y.P. Frequency regulation of an isolated hybrid power system with Battery energy storage system. In Proceedings of the Power and Energy Systems Conference: Towards Sustainable Energy, Bangalore, India, 13–15 March 2014; pp. 1–6. [Google Scholar]
- Yun, J.Y.; Yu, G.; Kook, K.S.; Rho, D.H.; Chang, B.H. SOC-based Control Strategy of Battery Energy Storage System for Power System Frequency Regulation. Trans. Korean Inst. Electr. Eng. 2014, 63, 7424–7425. [Google Scholar] [CrossRef]
- Li, X.; Huang, Y.; Huang, J.; Tan, S. Modeling and control strategy of battery energy storage system for primary frequency regulation. In Proceedings of the International Conference on Power System Technology, Chengdu, China, 20–22 October 2014; pp. 543–549. [Google Scholar]
- Lee, S.J.; Kim, J.H.; Kim, C.H.; Kim, S.K. Coordinated Control Algorithm for Distributed Battery Energy Storage Systems for Mitigating Voltage and Frequency Deviations. IEEE Trans. Smart Grid 2016, 7, 1713–1722. [Google Scholar] [CrossRef]
- Leitermann, O. Energy Storage for Frequency Regulation on the Electric Grid. Ph.D. Thesis, Massachusetts Institute of Technology, Cambridge, MA, USA, 2012. [Google Scholar]
- Oudalov, A.; Chartouni, D.; Ohler, C. Optimizing a Battery Energy Storage System for Primary Frequency Control. IEEE Trans. Power Syst. 2007, 22, 1259–1266. [Google Scholar] [CrossRef]
- Su, S.; Li, H.; Gao, D.W. Optimal Planning of Charging for Plug-In Electric Vehicles Focusing on Users’ Benefits. Energies 2017, 10, 952. [Google Scholar] [CrossRef]
- Turhan, C.; Simani, S.; Zajic, I.; Gokcen Akkurt, G. Performance Analysis of Data-Driven and Model-Based Control Strategies Applied to a Thermal Unit Model. Energies 2017, 10, 67. [Google Scholar] [CrossRef]
- Sankarakrishnan, A.; Billinton, R. Sequential Monte Carlo simulation for composite power system reliability analysis with time varying loads. IEEE Trans. Power Syst. 1995, 10, 1540–1545. [Google Scholar] [CrossRef]
- Xu, J.; Huang, E.; Chen, C.H.; Lee, L.H. Simulation Optimization: A Review and Exploration in the New Era of Cloud Computing and Big Data. Asia-Pac. J. Oper. Res. 2015, 32, 1550019. [Google Scholar] [CrossRef]
- Spall, J.C. Multivariate stochastic approximation using a simultaneous perturbation gradient approximation. IEEE Trans. Autom. Control 1992, 37, 332–341. [Google Scholar] [CrossRef]
- Wang, I.J.; Spall, J.C. Stochastic optimization with inequality constraints using simultaneous perturbations and penalty functions. In Proceedings of the 2003 42nd IEEE Conference on Decision and Control, Maui, HI, USA, 9–12 December 2003; Volume 4, pp. 3808–3813. [Google Scholar]
- Schoenung, S. Energy Storage Systems Cost Update; SAND2011-2730; Sandia National Laboratories: Livermore, CA, USA, 2011.
- Spall, J.C. Implementation of the simultaneous perturbation algorithm for stochastic optimization. IEEE Trans. Aerosp. Electron. Syst. 1998, 34, 817–823. [Google Scholar] [CrossRef]
Figure 1.
Control structure of the hybrid frequency regulation system.

Figure 2.
The research framework for the hybrid system.

Figure 3.
This figure shows (a) the frequency of AsGC signals which is between and 1; (b) the logarithm of frequency of automatic generation control (AGC) signal increments with minimum value around and maximum value around 1.5.
Figure 3.
This figure shows (a) the frequency of AsGC signals which is between and 1; (b) the logarithm of frequency of automatic generation control (AGC) signal increments with minimum value around and maximum value around 1.5.

Figure 4.
The optimization process of the Simultaneous Perturbation Stochastic Approximation (SPSA) algorithm.
Figure 4.
The optimization process of the Simultaneous Perturbation Stochastic Approximation (SPSA) algorithm.
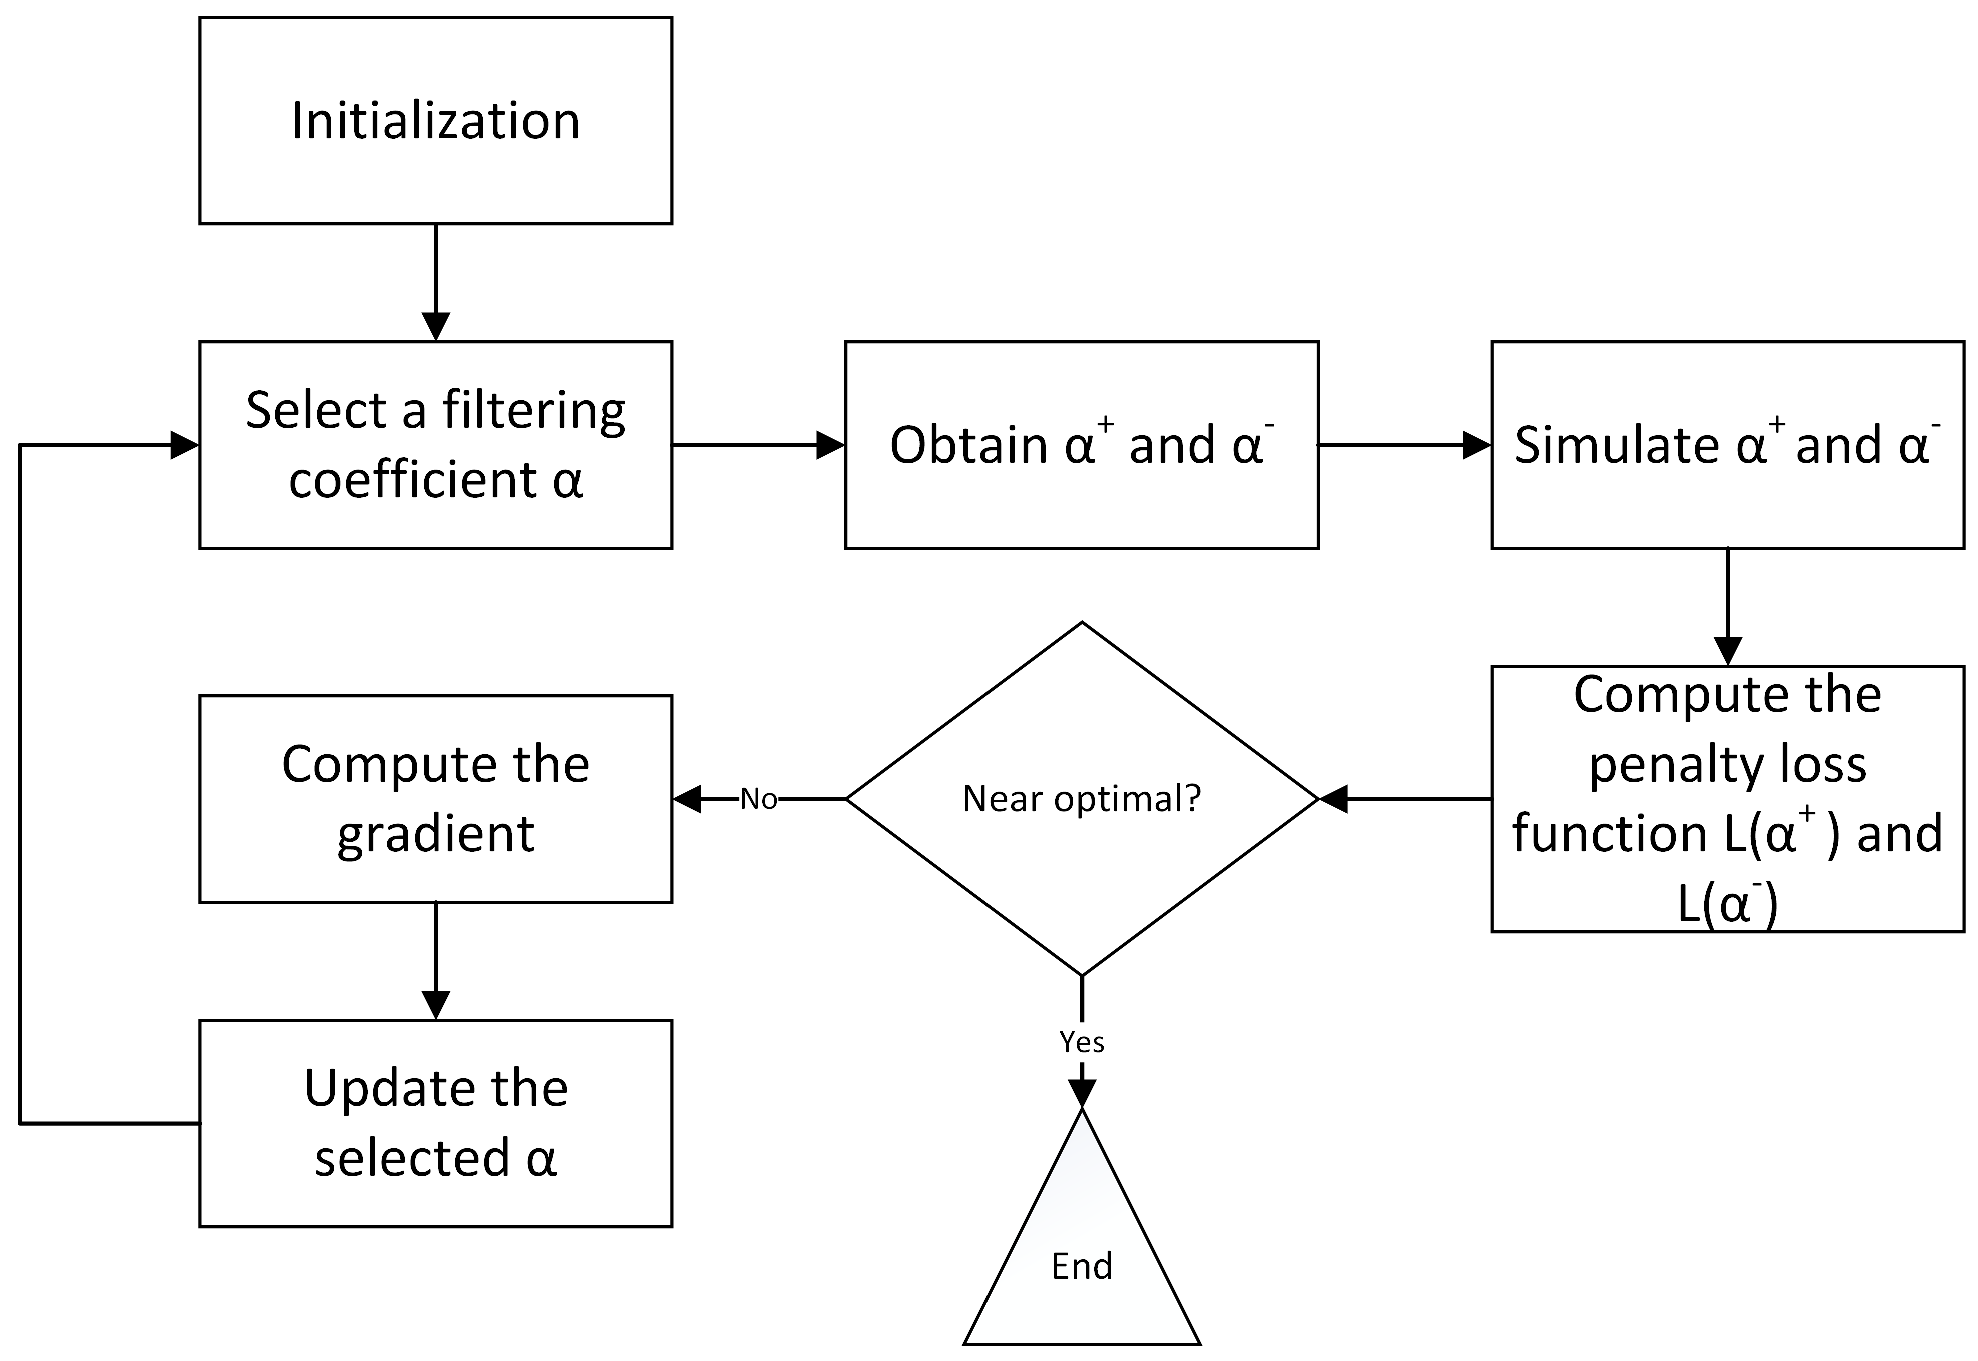
Figure 5.
Illustration of real AGC signals curve (a,b), and sampled AGC signals curve (c,d).
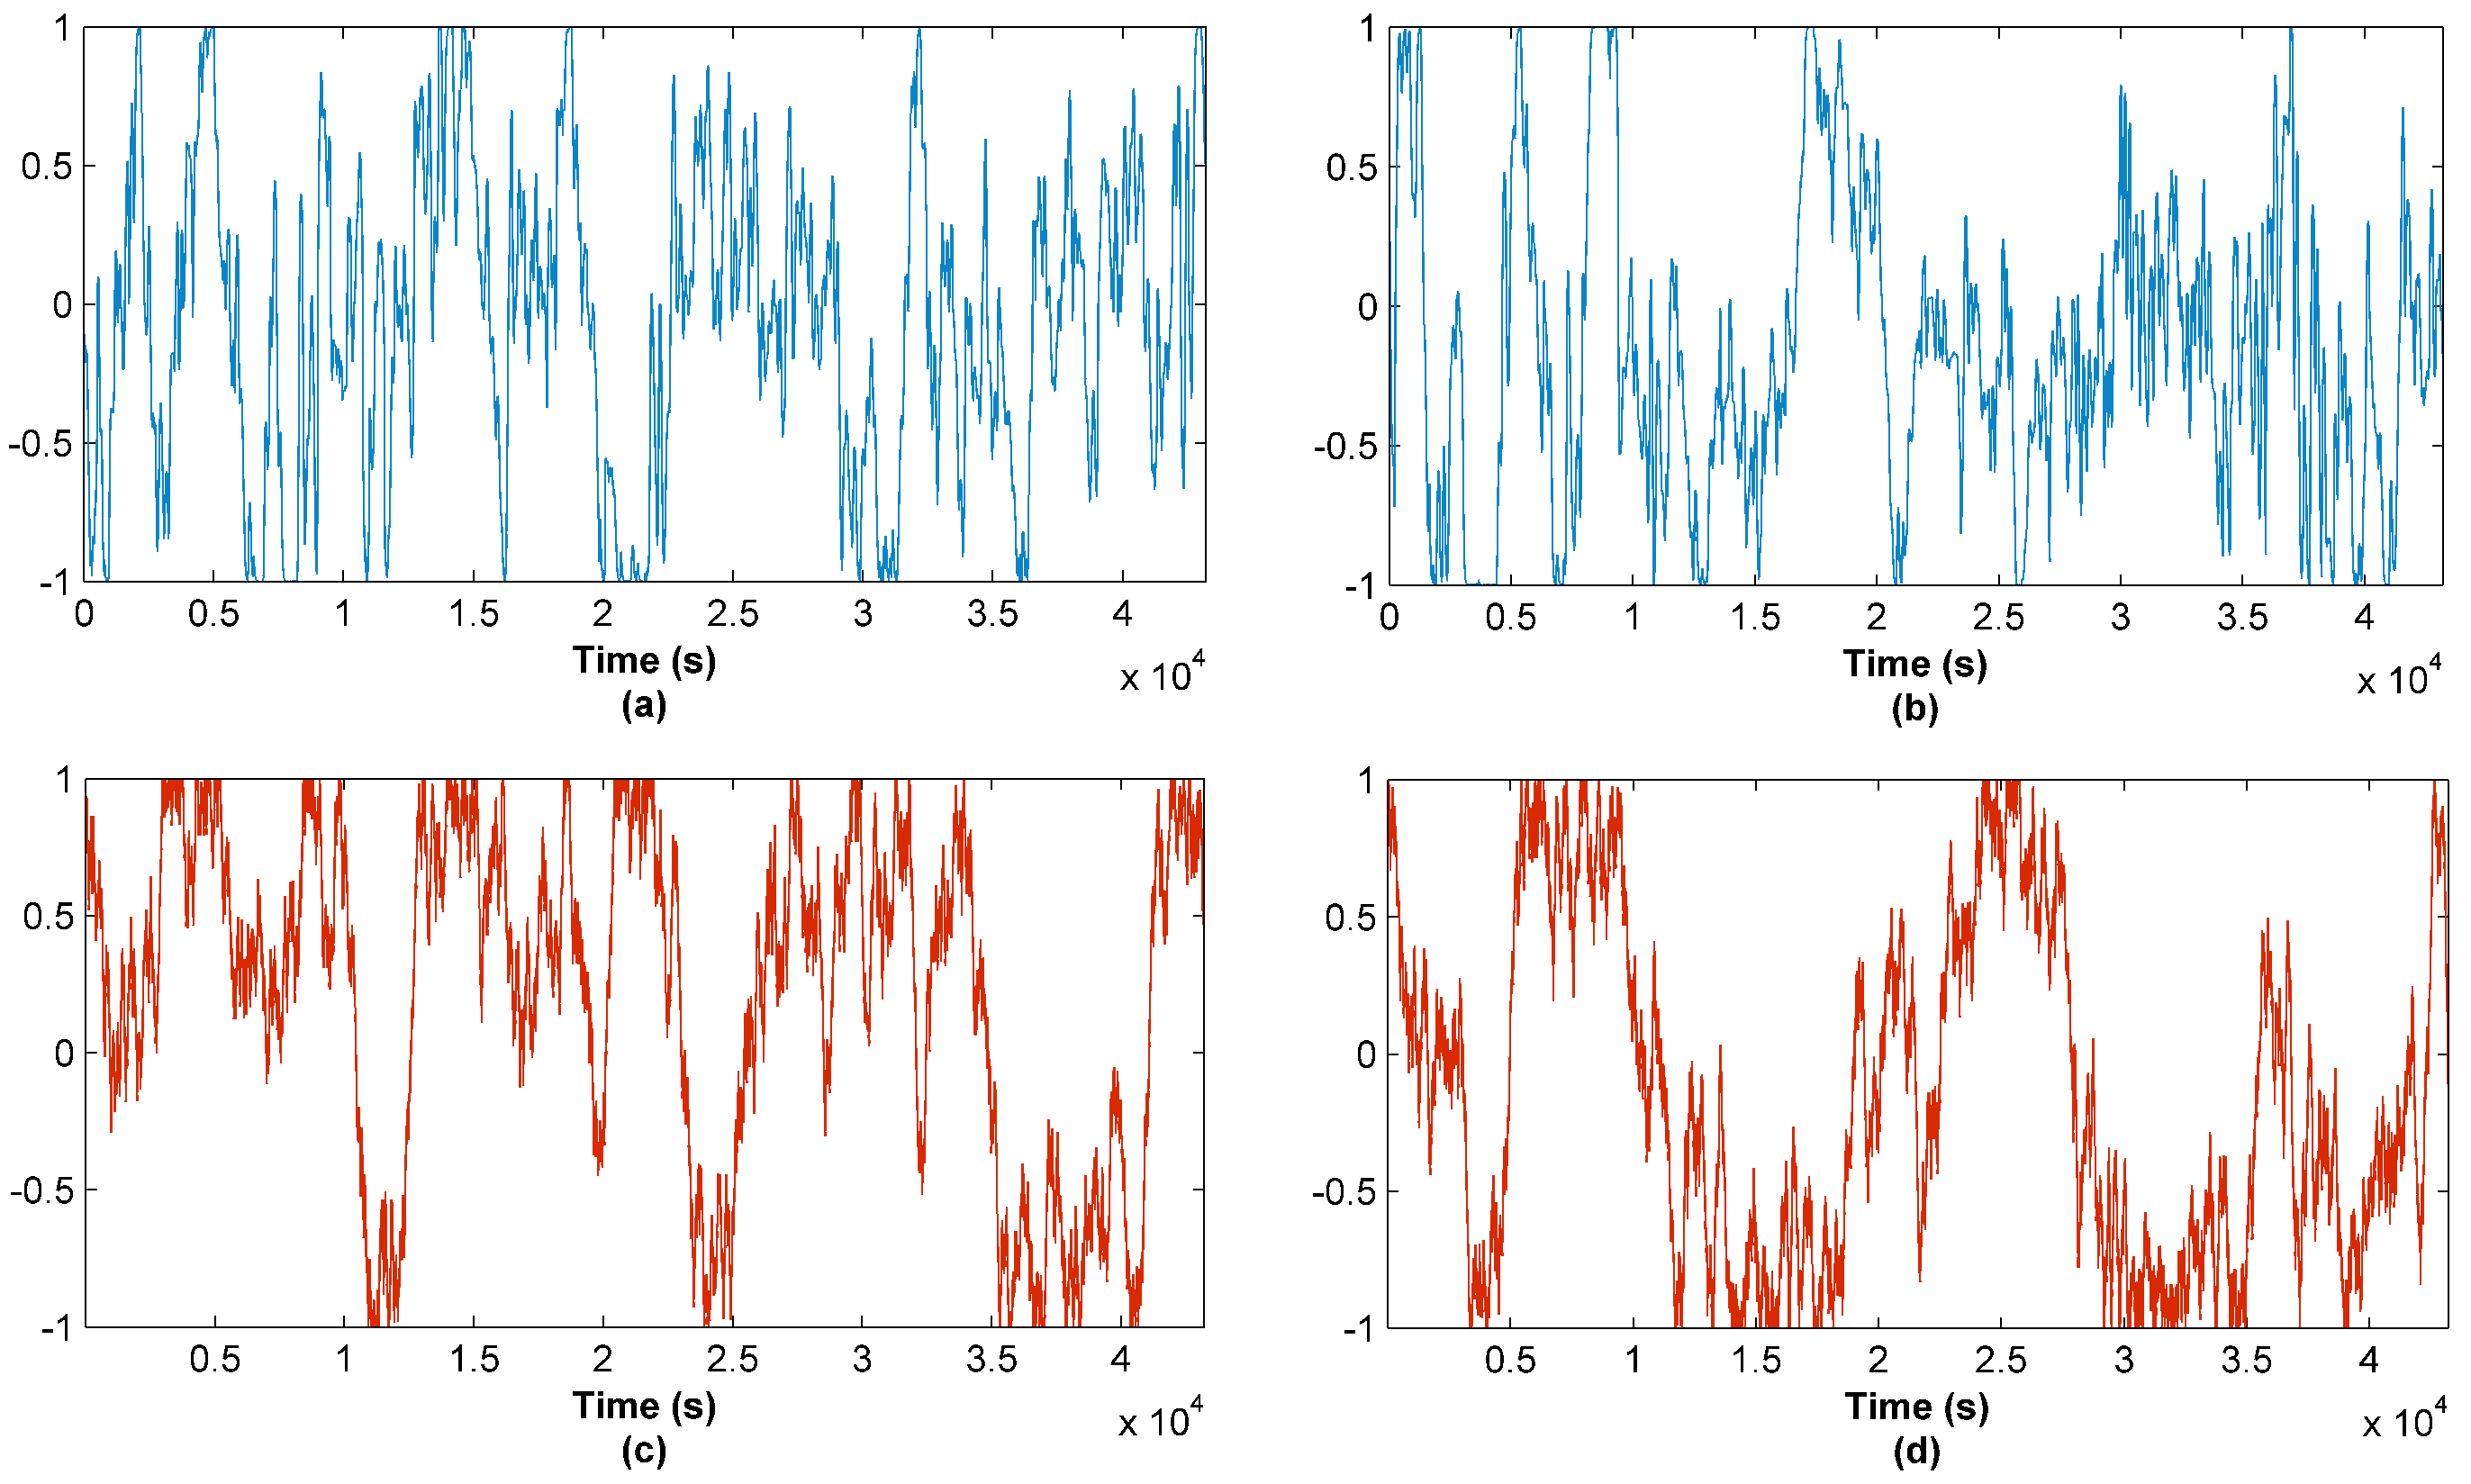
Figure 6.
Iteration of algorithm with respect to optimal solution: (a) filtering coefficient and optimal value; (b) total costs.
Figure 6.
Iteration of algorithm with respect to optimal solution: (a) filtering coefficient and optimal value; (b) total costs.

Figure 7.
The power difference under the hybrid system (a) and the AGC system without energy storage system (ESS) (b).
Figure 7.
The power difference under the hybrid system (a) and the AGC system without energy storage system (ESS) (b).

Figure 8.
The generator ramping under hybrid system (a) and AGC system without ESS (b).

Figure 9.
The remaining energy curve with and without remaining energy management (REM).


Table 1.
The operation guidance for the amplitude limiting and redistribution.
| | | | |
| | Limit both G and S. | Limit S; Redistribute S→G. | Limit both G and S. |
| | Limit G; Redistribute G→S. | No adjustment. | Limit G; Redistribute G→S. |
| | Limit both G and S. | Limit S; Redistribute S→G. | Limit both G and S. |
G: generator; S: energy storage system; G→S: redistribute from generator to ESS; S→G: redistribute from ESS to generator.
Table 2.
The framework of Simultaneous Perturbation Gradient Approximation (SPSA) algorithm to the hybrid system configuration and optimization.
Table 2.
The framework of Simultaneous Perturbation Gradient Approximation (SPSA) algorithm to the hybrid system configuration and optimization.
| Initial. | |
| Set parameter a, c and select an initial filtering coefficient . Step , and the maximum number of step . | |
| Iteration. | |
| Repeat | 1. Generate a random perturbation according to Bernoulli distribution B(−1,1); |
| 2. Find and in the adjacent area of , with
| |
| 3. Estimate the total cost of and in the simulation model, e.g., and . Then the loss function with constraint penalty is obtained as
| |
| 4. Compute the gradient ; | |
| 5. Update the filtering coefficient ; | |
| 6. . | |
| End | End if or for some small ; else return to 1. |
| Stop. |
© 2017 by the authors. Licensee MDPI, Basel, Switzerland. This article is an open access article distributed under the terms and conditions of the Creative Commons Attribution (CC BY) license (http://creativecommons.org/licenses/by/4.0/).
Share and Cite
MDPI and ACS Style
Song, J.; Pan, X.; Lu, C.; Xu, H. A Simulation-Based Optimization Method for Hybrid Frequency Regulation System Configuration. Energies 2017, 10, 1302. https://doi.org/10.3390/en10091302
AMA Style
Song J, Pan X, Lu C, Xu H. A Simulation-Based Optimization Method for Hybrid Frequency Regulation System Configuration. Energies. 2017; 10(9):1302. https://doi.org/10.3390/en10091302
Chicago/Turabian StyleSong, Jie, Xin Pan, Chao Lu, and Hanchen Xu. 2017. "A Simulation-Based Optimization Method for Hybrid Frequency Regulation System Configuration" Energies 10, no. 9: 1302. https://doi.org/10.3390/en10091302
Note that from the first issue of 2016, this journal uses article numbers instead of page numbers. See further details here.