Article

A Hybrid Approach for Power System Security Enhancement via Optimal Installation of Flexible AC Transmission System (FACTS) Devices

1
College of Electrical and Information Engineering, Hunan University, Changsha 410082, China
2
Department of Electrical Engineering, Industrial University of Ho Chi Minh City, Ho Chi Minh City 700000, Vietnam
3
College of Computer and Information Engineering, Hunan University of Commerce, Changsha 410205, China
*
Author to whom correspondence should be addressed.
Energies 2017, 10(9), 1305; https://doi.org/10.3390/en10091305
Submission received: 18 July 2017 / Revised: 16 August 2017 / Accepted: 27 August 2017 / Published: 1 September 2017
(This article belongs to the Special Issue Energy Production Systems)

Abstract

:
Increasing demand for electricity has placed heavy stress on power system security. Therefore, this paper focuses on the problem of how to maximize power system static security in terms of branch loading and voltage level under normal operation and even the most critical single line contingency conditions. This paper proposes a hybrid approach to find out the optimal locations and settings of two classical types of flexible AC transmission system (FACTS) devices, namely thyristor-controlled series compensators (TCSCs) and static var compensators (SVCs) for solving this problem. Our proposed approach requires a two-step strategy. Firstly, the min cut algorithm (MCA) and tangent vector technique (TVT) are applied to determine the proper candidate locations of TCSC and SVC respectively so as to reduce the search scope for a solution to the problem, and then the cuckoo search algorithm (CSA) is employed to solve this problem by simultaneously optimizing the locations and settings for TCSC and SVC installation. The proposed hybrid approach has been verified on the IEEE 6-bus and modified IEEE 14-bus test systems. The results indicate that CSA outperforms particle swarm optimization (PSO), proving its effectiveness and potential, and they also show that our proposed hybrid approach can find the best locations and settings for TCSC and SVC devices as an effective way for enhancing power system static security by removing or alleviating the overloads and voltage violations under normal operation and even the most critical single line contingency conditions. Using this hybrid approach, the search space for solution to the problem becomes limited hence the computational burden will be decreased.

Graphical Abstract

1. Introduction

Deregulation of the electric industry throughout the world, grid interconnections and ever continuous increasing demand for electricity have resulted in heavy stress on power systems. System operators are facing many challenges related to power system security. Various factors such as expansion of the generation and transmission systems cannot be match the growth in load. Meanwhile, the creation of electricity markets has led to the trading of significant amounts of electrical energy over long transmission distances, and also the number of unplanned power exchanges has increased due to the competition among utilities and contracts concluded directly between producers and consumers, which have weakened the level of security of power systems. As the power system becomes more complex and more heavily loaded and unexpected outages occur, the systems can be operated in unstable or insecure situations like transmission congestion and voltage violations. Therefore, the power system security has become an important and critical issue and obtained much attention in the deregulated power industry [1,2,3,4]. In order to eliminate or alleviate congestion and voltage violations and to improve system security, rather than constructing new lines, the existing power lines need to be utilized more efficiently. The reason is that building new transmission lines is rather time consuming and sometimes impossible, due to political and environmental problems in many countries. Hence, the first alternative provides an economically and technically attractive solution to power system security problem by use of some efficient controls [5], such as generation rescheduling, load shedding and controllable FACTS, etc. Although generation rescheduling [6] and load shedding [7] to eliminate/alleviate emergency transmission line overloads and bus voltage violations is an important problem in power system operation, these two ways may not be acceptable by both power providers and customers due to their significant effect on the existing power transaction contracts, so the use of controllable FACTS to enhance power system static security by eliminating/alleviating congestion and voltage violations is one of the main interests among current issues.
FACTS devices, which were first defined by Hingorani in 1988 [8], have a significant potential ability to make power systems operate in a more flexible, secure and economical way. They can benefit the emerging power system in terms of improving the system stability, reducing the flow in heavily loaded lines, maintaining bus voltages at their desired level and thus enhance power system security under contingency conditions. However, the benefits of these devices are mainly dependent on their location in the system [9]. The proper location of FACTS devices is a key to maximize power system security. Therefore, the system operators are facing the problem of where and which types of FACTS devices should be installed for achieving the required goals. This is a difficult problem due to the large size of the search space for a practical system.
In practice, due to transfer capacity of the transmission lines, some lines located on particular paths may become overloaded if the unplanned power exchanges were not controlled. This is the main bottleneck of the power system. The existence of bottlenecks in power networks directly affects market transactions and impedes system security [10]. The security of the power system can be enhanced if appropriate types of FACTS devices are chosen and suitably installed on transmission lines and buses to redistribute real power flows and regulate bus voltages by modifying line reactance and injecting reactive power.
From the view point of optimization, the optimal installation of FACTS devices is a highly multimodal, constrained and complex optimization problem [11]. Generally, the approaches for optimal allocation of FACTS devices can be classified into three categories: classical optimization approaches, sensitivity-based approaches and heuristic optimization approaches.
In classical optimization approaches, a Newton Raphson (NR) algorithm has been developed to find out the best operating point of a SVC for the enhancement of system security by minimizing the security index iteratively [12]. A mixed integer nonlinear programming (MINLP) based on line flow- based equations (LFB) is utilized to find the optimal location and setting of the TCSC under single line contingency conditions [13]. In [14], by applying a mixed integer optimization technique, the demand response (DR) and the TCSC and SVC controllers are optimally coordinated with the conventional generators to manage the network congestion in a restructured market environment. In [15], mixed integer linear programming (MILP) is used to the optimal allocation of thyristor controlled phase shifter transformers (TCPSTs) for maximizing power system loadability. Mixed integer linear and nonlinear programming-based optimal power flow (OPF) methods have been utilized for finding the optimal installation of FACTS to enhance system loadability [16,17]. Although classical optimization approaches have excellent convergence characteristics, they are not flexible and especially, handling constraints in them is hard work.
In sensitivity-based approaches, for enhancing the security of the system, a sensitivity-based approach has been proposed to decide the optimal location of TCSCs and unified power flow controllers (UPFCs) [18]. In [19], a real power flow performance index (PI) sensitivity-based approach and the concept of a line outage distribution factor have been proposed to decide the optimal location of TCSCs and static synchronous series compensators (SSSCs) to enhance the security of the power systems. Line loading security Performance Index (PI) sensitivity factors have been suggested for optimal placement of UPFCs for enhancing the security of the power system [20]. The approach based on the sensitivity of the reduction of total system VAR power loss and real power performance index has been suggested for determining the optimal TCSC location for congestion management [21]. In order to evaluate the suitability of a given line for installing a TCSC, two new indices called Thermal Capacity Index (TCI) and Contingency Capacity Index (CCI) [22] have been used to obtain secured optimal power flow under normal and network contingencies. In [23], an approach based on an index called the single contingency sensitivity index is proposed to find the optimal installations of TCSCs to enhance static security by eliminating line overloads under a single contingency. In [24], a transmission network is analyzed based on line parameters variation to improve Total Transmission Capacity (TTC) of the interconnected system. Real power flow PI sensitivity factors are introduced to select lines for placing FACTS devices. Although sensitivity-based approaches have advantages in computing efficiency, their computation accuracy is partly lost because of the nonlinearity of the power flow model is neglected. Moreover, they cannot simultaneously optimize the location and initial settings of FACTS devices.
The heuristic optimization approaches have been widely used in FACTS allocation problems. In [25], three heuristic methods, for instance, the genetic algorithm (GA), the tabu search method (TS) and the simulated annealing (SA) are applied to optimal installation of FACTS to enhance the system security. A GA is applied for seeking the optimal placement of multi-type FACTS to maximize the loadability in a power system [26]. In [27,28], the GA has been used to find the optimal location of FACTS for improving the security of a power system. A multi-objective GA is employed for optimal allocation of multi-type FACTS devices to maximize power systems security [29]. In [30], the effects of different types of FACTS devices on the performance of Hydro-Québec network have been analyzed. The optimal locations and rating of these FACTS controllers will be determined with a view to improving network security using an optimization algorithm based on a genetic algorithm. In [31], PSO technique is used for optimal installations of TCSCs, SVCs and UPFCs to minimize the cost of FACTS installation and improving the system loadability. In [32], PSO is employed for solving the security enhancement problem by optimal location of TCSCs. In [33], two evolutionary optimization techniques namely, GA and PSO, are applied for seeking the best location with the optimal setting of TCSC under single line contingency to improve the system security by eliminating or minimizing line overloads and bus voltage violations. In [34], a differential evolution (DE) algorithm is applied for finding the best location with parameter setting of UPFCs for enhancing power system security under single line contingencies. In [35], a relatively new evolutionary optimization technique, namely the DE technique, is applied to find the optimal locations and parameter settings of TCSCs under determined contingency scenarios for enhancing power system security. An adaptive DE algorithm is proposed for allocating the TCSC incorporated with the reactive power management problem [36]. In [37], the self-adaptive firefly algorithm (SAFA) is presented to optimize the placement of TCSCs, SVCs and UPFCs for improving the power system performance through minimizing real power loss, improving voltage profiles and enhancing the voltage stability. In [38], the imperialistic competitive algorithm (ICA) is employed for solving TCPST and TCSC allocation problem in a way that low values of overloads and voltage deviations result both during line outage contingencies and demand growth. In [39], Biogeography-Based Optimization (BBO), Weight Improved PSO (WIPSO) and PSO are applied to solve the optimization problem of finding the optimal placements and capacities of TCSCs, SVCs and UPFCs for enhancing system security under increased system loading conditions. In [40], a PSO-based adaptive gravitational search algorithm hybrid algorithm is proposed for finding out the best locations with the settings of UPFCs and interline power flow controllers (IPFCs) for improving the voltage stability of the power transmission systems. Although the heuristic optimization approaches are very flexible and easy to deal with discrete and constraint optimization problems, they have high computational burden due to the huge search space of the solution to FACTS allocation problems.
Recently, a novel meta-heuristic called cuckoo search algorithm (CSA) inspired by some cuckoo species’ obligate brood parasitic behavior, was developed by Yang and Deb [41]. A cuckoo bird lays and dumps its egg in a randomly selected nest of other species and the egg is either hatched and carried over to the next generations or abandoned by the host bird [42]. CSA has a few parameters needed to be tuned, and the inexperienced user can easily interact with it. It has two crucial search capabilities, which are local search and global search controlled by a fraction probability or discovery rate, Pa internal parameter and therefore converges to the global optimum for a multimodal optimization [43]. It uses Lévy flights motion with infinite mean and variance rather than standard random walks motion for global search. Such behavior has been emulated to perform optimization and global optimal search with promising results [44,45]. It is an efficient meta-heuristic algorithm that balances between the local search strategy (exploitation) and the whole space (exploration) [
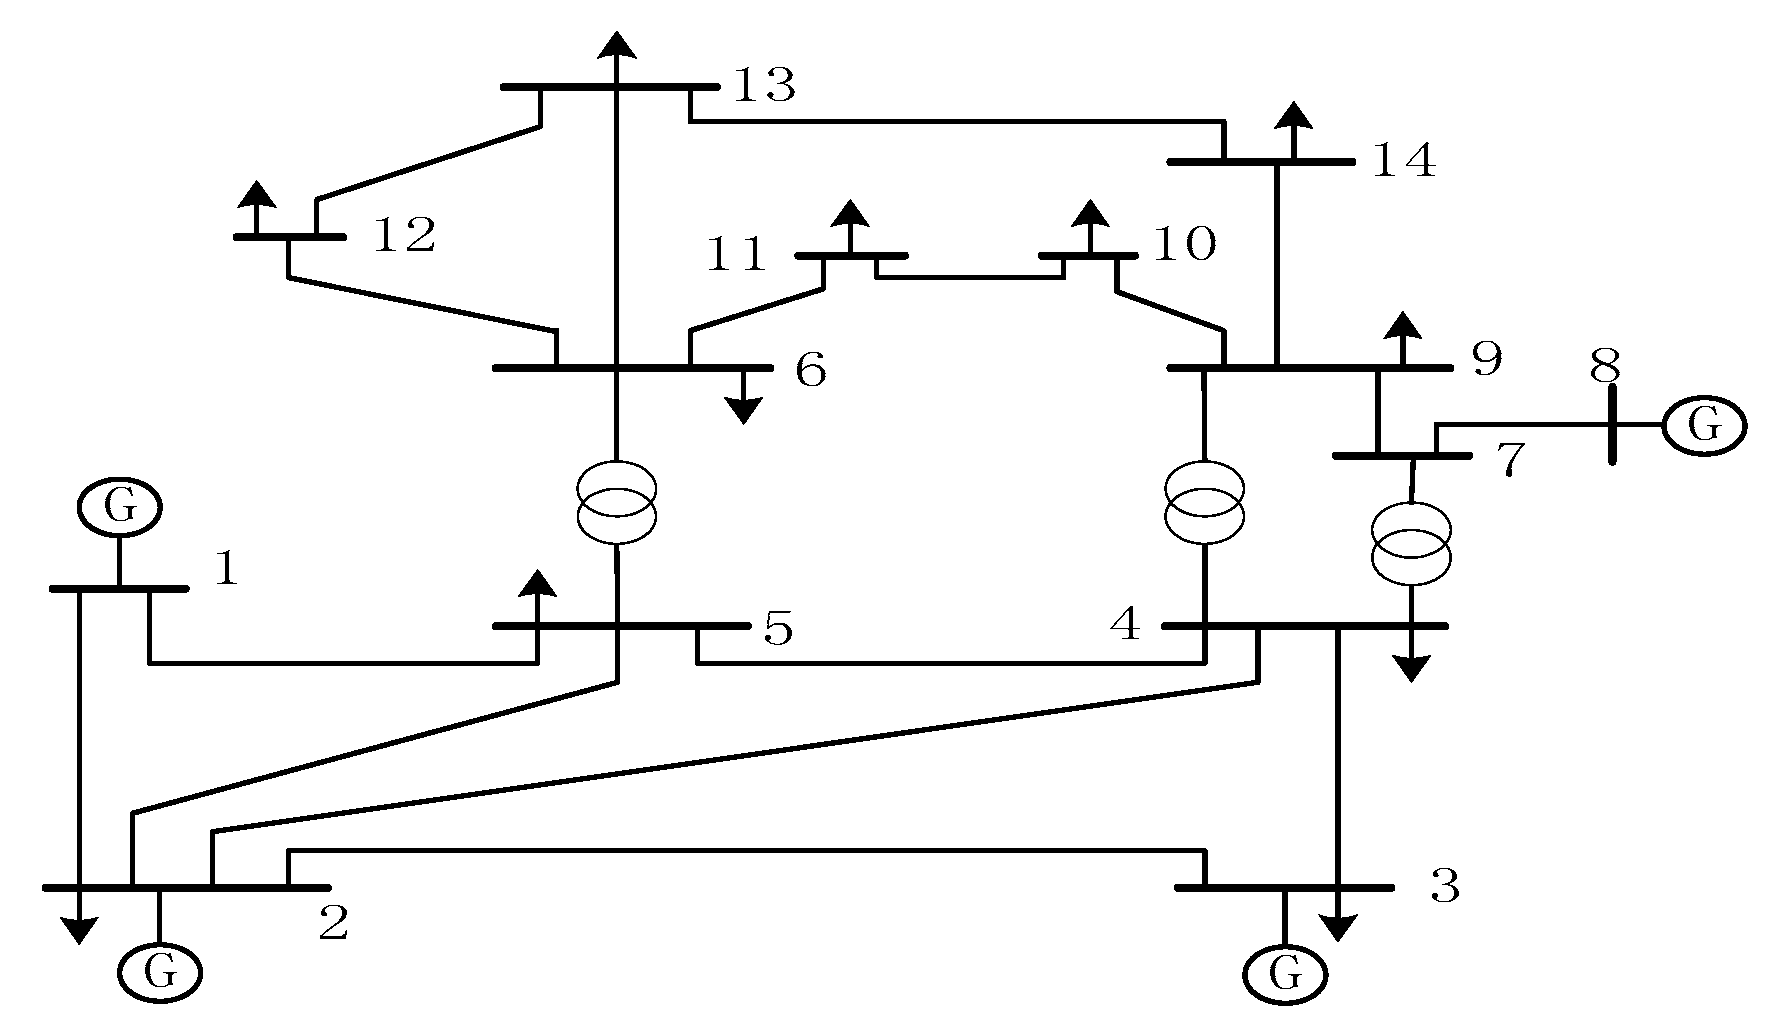
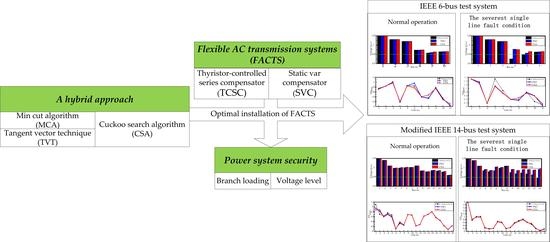
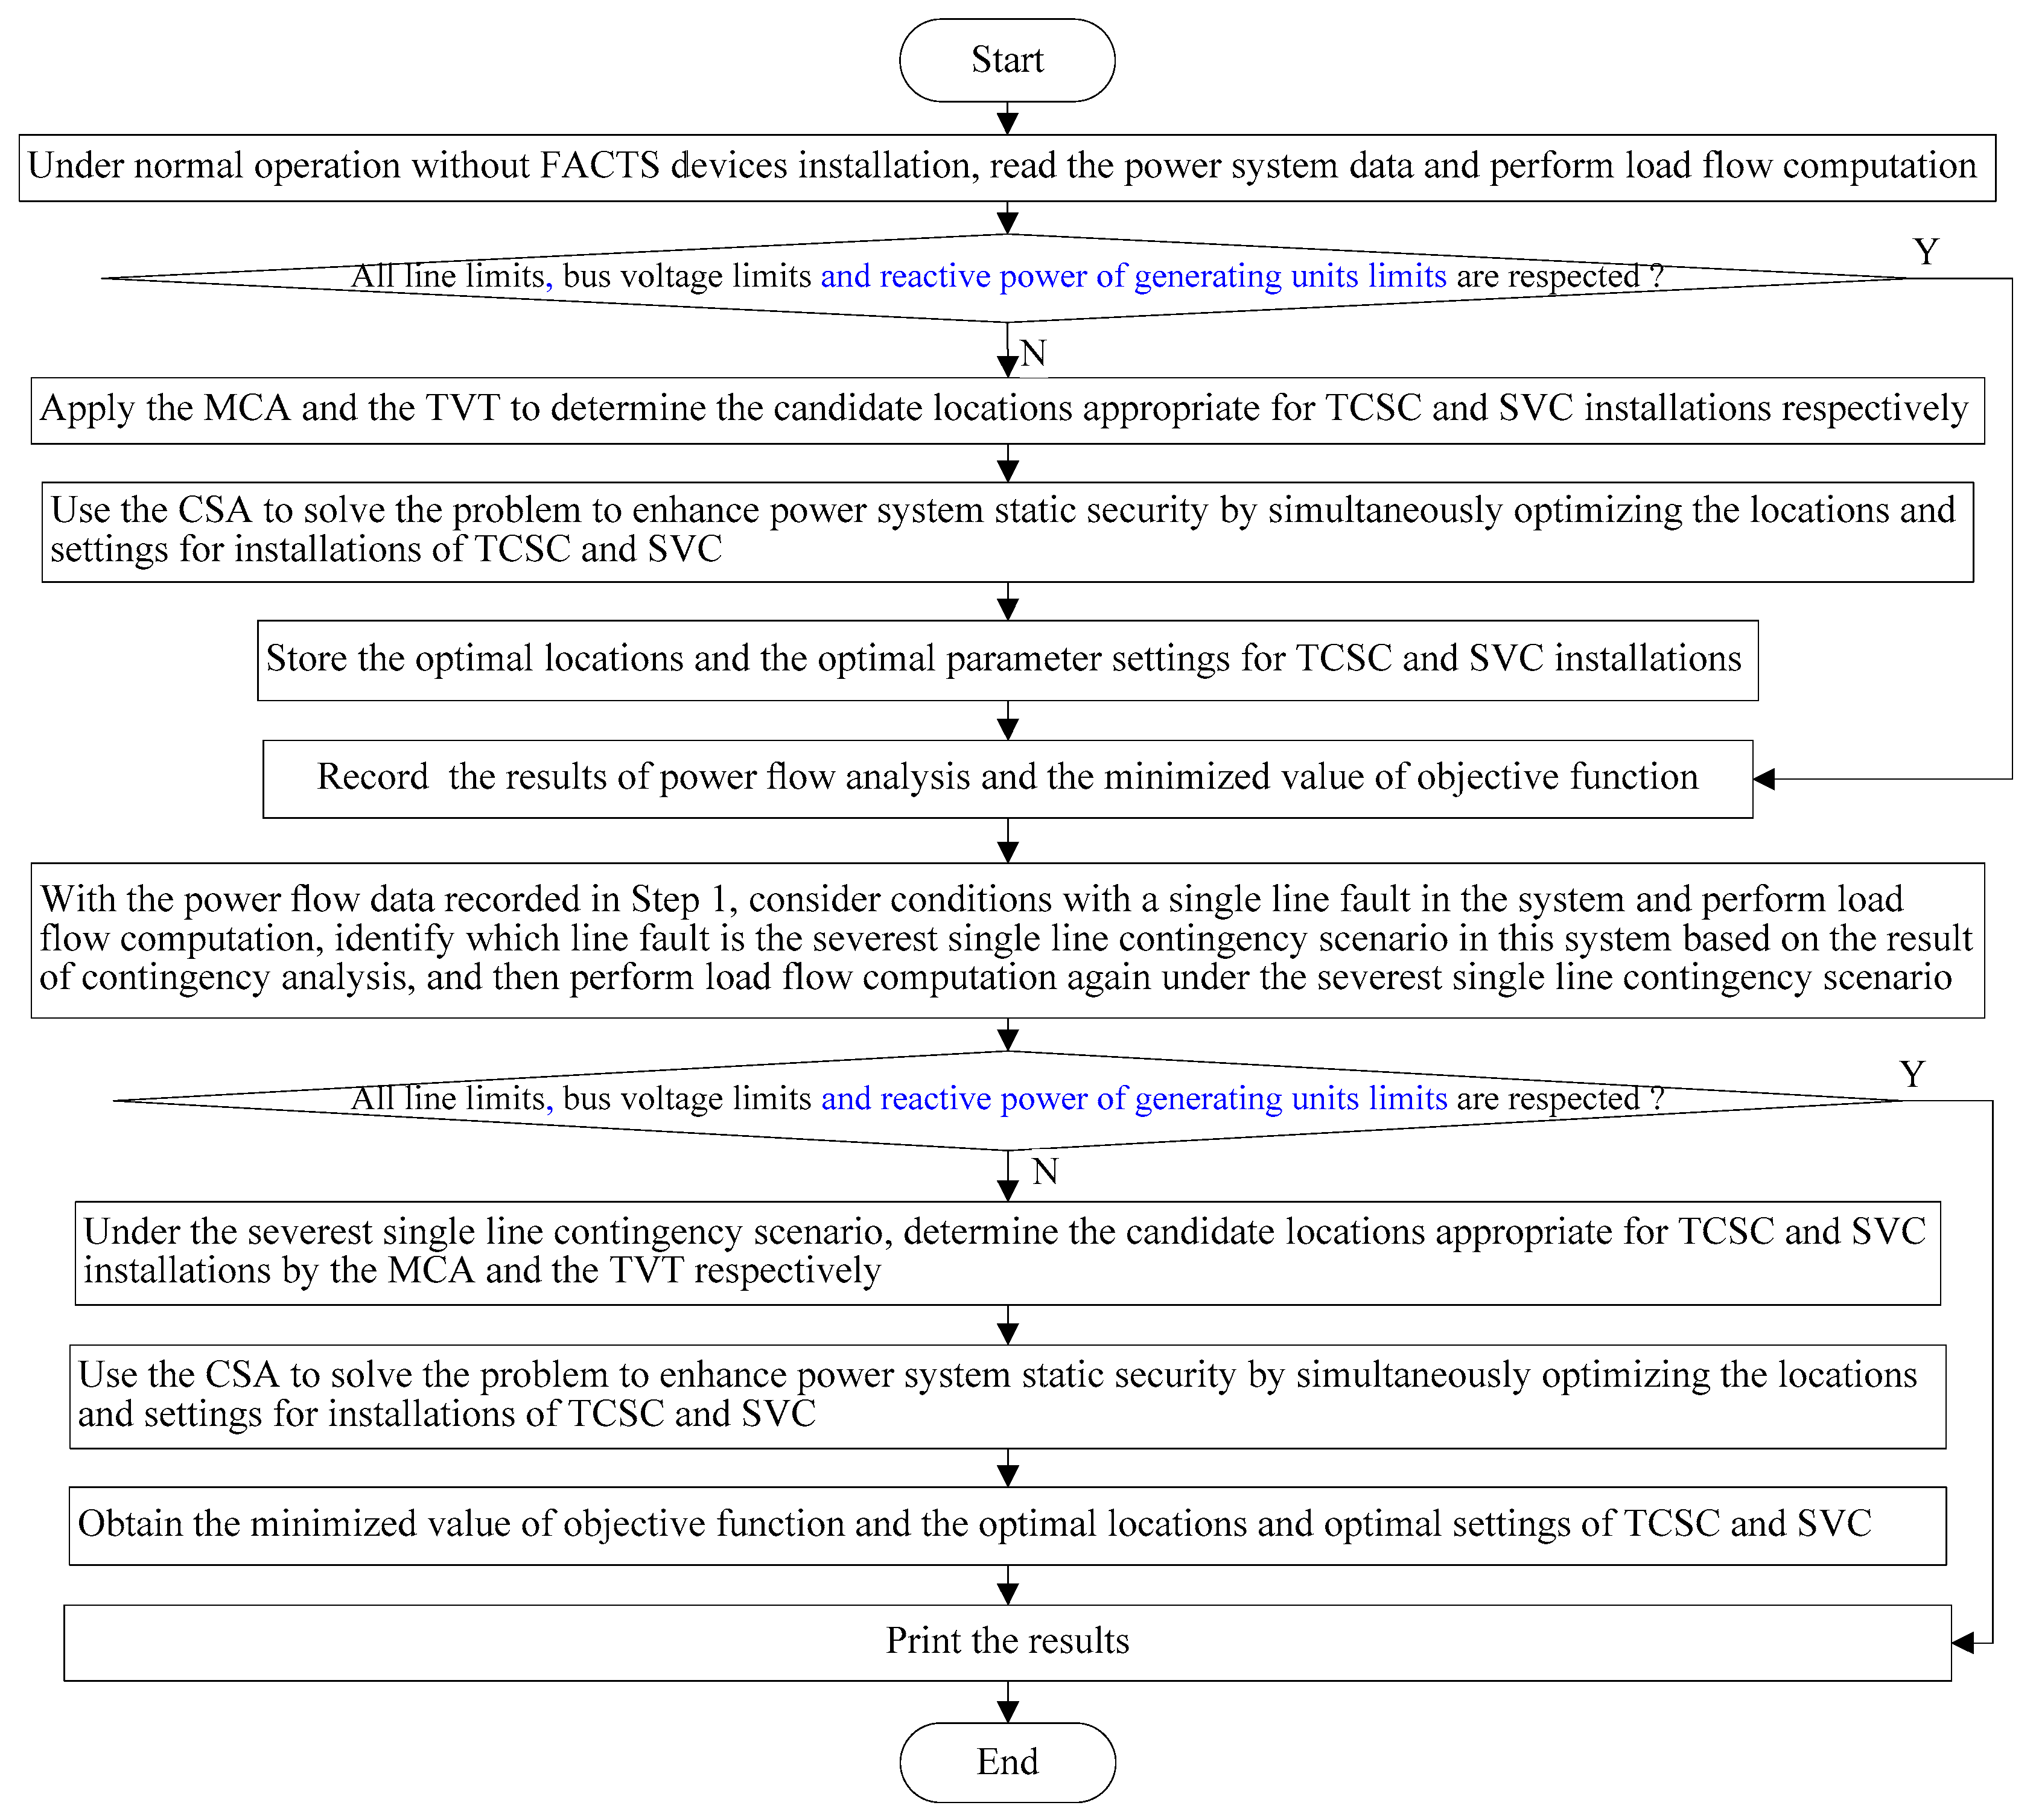
46]. To the best knowledge of the authors, the application of CSA to optimal installation of FACTS devices for enhancing power system static security by removing or alleviating the overloads and voltage violations under normal operation and even the most critical single line contingency condition is quite rare. This paper focuses on the problem of how to maximize power system static security in terms of branch loading and voltage level under normal operation and even the most critical single line contingency conditions. Additionally, two classical types of FACTS devices, namely TCSCs and SVCs are chosen for the study. This paper proposes a hybrid approach to find out the optimal locations and settings of TCSCs and SVCs for solving this problem. Our proposed approach requires a two-step strategy. Firstly, the MCA and TVT are applied to determine the proper candidate locations of TCSCs and SVCs, respectively, and then the CSA is employed for solving this problem by simultaneously optimizing the locations and settings for installations of TCSCs and SVCs. Our proposed hybrid approach has been demonstrated on the IEEE 6-bus and modified IEEE 14-bus test systems. The major contributions of this study are as follows:
  • A hybrid approach to solve the problem of maximizing power system static security in terms of branch loading and voltage level via optimal installations of TCSCs and SVCs under normal operation and even the most critical single line contingency condition is proposed.
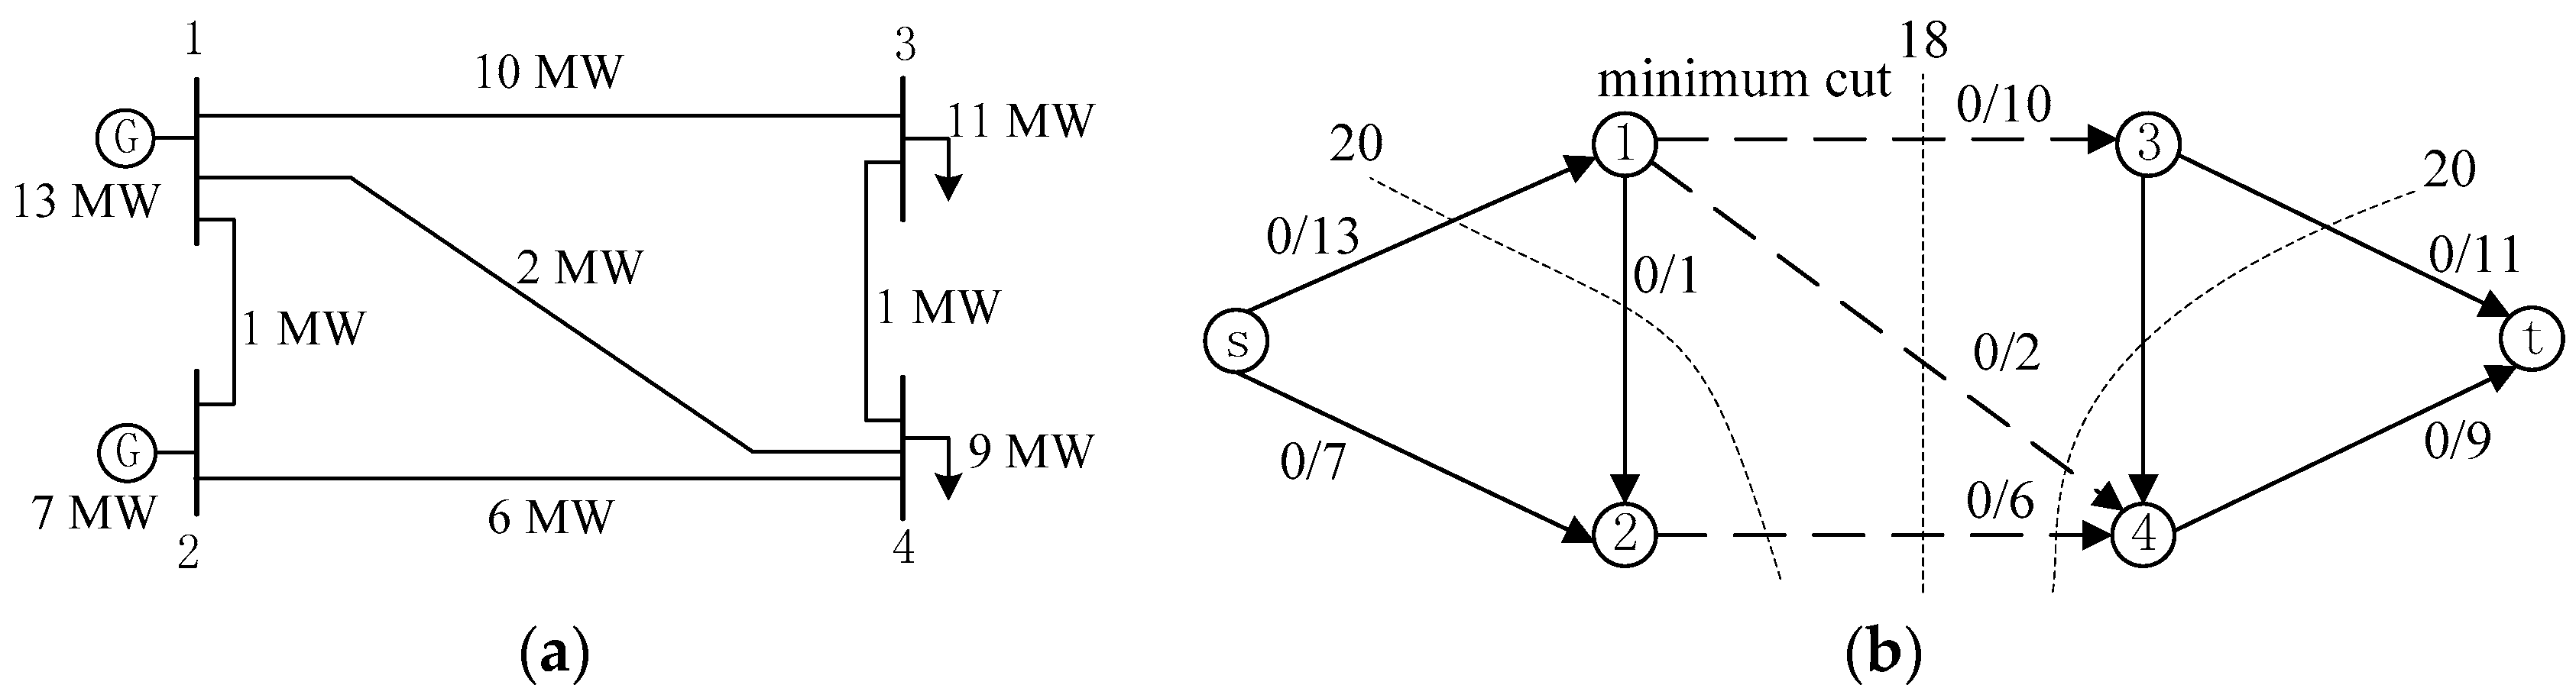
  • In order to reduce the search space for the solution to the problem, the MCA and the TVT are applied to determine the proper candidate locations of TCSCs and SVCs, respectively. The number of lines and buses which need to be investigated to determine the best locations of TCSC and SVC is significantly decreased, hence, the computational burden of CSA to solve the problem is lessened.
  • A novel CSA-based procedure to solve the problem to enhance power system static security by simultaneously optimizing the locations and settings for installations of TCSCs and SVCs is proposed.
  • The proposed hybrid approach is capable of finding out the best locations and settings of TCSCs and SVCs in an effective way for enhancing power system static security by removing or alleviating the overloads and voltage violations under normal operation and even the most critical single line contingency conditions.
This paper is arranged as follows: Section 2 introduces the models of TCSCs and SVCs. Our proposed mathematical problem formulation for enhancing the power system static security via optimal installations of TCSCs and SVCs is also presented. Section 3 explains the MCA and the TVT for determining the proper candidate locations for TCSC and SVC installation, respectively. Section 4 describes the CSA and its application for optimal locations and settings of TCSCs and SVCs. Section 5 gives the overall procedure of implementation of the proposed hybrid approach. Section 6 demonstrates the simulation results and discussion. Finally, Section 7 summarizes the conclusions and the data of transmission line for modified IEEE 14-bus test system is detailed in Table A1.

2. Problem Formulation

In this section, the modeling of two FACTS devices, namely, TCSCs and SVCs, are described briefly. Then we will give the objective function in detail.

2.1. Modeling of FACTS Devices

According to the type of compensation, we can distinguish three categories of FACTS devices [47]:
  • Series controllers such as TCSCs and TCPSTs;
  • Shunt controllers such as SVCs and static synchronous compensators (STATCOMs);
  • Combined shunt-series controllers such as UPFCs.
Inside a category, several FACTS devices exist and each of them has its own proprieties, and we can use them in specific contexts for a specific goal. For example, a TCSC can be installed on a transmission line to control the line flow by regulating the reactance of the line, while a SVC can be installed at a bus to provide reactive power and control local bus voltage. As we already mentioned, this paper focuses on enhancing the power system static security in terms of branch loading and voltage level, i.e., eliminating or alleviating the overloads on transmission lines and the bus voltage violations under normal operation and even the most critical single line contingency conditions. Hence, two classical types of FACTS devices, namely TCSCs and SVCs are chosen in this paper. The steady state model of these FACTS devices used in this paper is presented in detail below.

2.1.1. Modeling of TCSC

The TCSC can be installed in series connection with a transmission line to modify the impedance of a line and thereby controls the line flow to eliminate or alleviate the overloads on the transmission lines. Hence, the system static security is enhanced. In the steady state power flow study, the TCSC can be considered as an additional reactance (XT) on a transmission line. In most cases, the shunt susceptances of a line are usually neglected. Therefore, the TCSC’s static capacitor will be directly in series with the line impedance [48]. The model of a transmission line with series impedance Zij = Rij + jXij and a TCSC installed between bus i (with voltage Vi) and bus j (with voltage Vj) is shown in Figure 1a.
A new line reactance (Xnew) of the transmission line where a TCSC is located is given as follows:
Xnew = Xij + XT
XT = kcXij
where Xij is the reactance of line ij; kc is the coefficient which represents the compensation degree of the TCSC. In general, the allowed compensation degree of the TCSC is in the range of 20% inductive and 80% capacitive to avoid overcompensation. That is, −0.8XijXT ≤ 0.2Xij. Optimal setting of reactance value can be achieved by optimizing the reactance values between these ranges.
The active and reactive power flows from bus i to bus j and from bus j to bus i of the line with a new line reactance (Xnew) affected by the location of TCSC can be derived as follows [10,49]:
P i j   =   V i 2 G i j V i V j ( G i j cos δ i j + B i j sin δ i j )
Q i j   =   V i 2 B i j V i V j ( G i j sin δ i j B i j cos δ i j )
P j i   =   V j 2 G i j V i V j ( G i j cos δ i j B i j sin δ i j )
Q j i   =   V j 2 B i j + V i V j ( G i j sin δ i j + B i j cos δ i j )
where δij is the phase angle difference between buses i and j; the transmission line’s conductance and susceptance can be calculated respectively as:
G i j = R i j R i j 2 + X new 2
B i j = X new R i j 2 + X i j 2

2.1.2. Modeling of SVC

While the TCSC is a series-connected controller as mentioned above, the SVC is a shunt connected device. It can be installed at a bus to absorb or generate reactive power at the point of connection to control the bus voltages to the desired level. Hence, the system static security can be improved. In the power flow formulation, the SVC is considered as a generator (or absorber) of reactive power [50], and the model of SVC is presented in Figure 1b. The reactive power provided by SVC is limited as presented below:
QS,minQSQS,max

2.2. Objective Function

As mentioned, the aim in this paper is to enhance the power system static security in terms of branch loading and voltage level via optimal installation of FACTS devices. Two classical types of FACTS devices, namely TCSCs and SVCs are located in order to remove or alleviate the overloads and the bus voltage violations under normal condition and even the most critical single line contingency condition. The optimal installation of FACTS devices consisting of TCSCs and SVCs for the power system static security enhancement is generally formulated as a nonlinear constrained optimization problem (NCOP) below:
Minimize J subject to:
g ( x , u ) = 0
h ( x , u ) 0
where J is the objective function and will be discussed in detail below. The equality constraint (10) is the power flow equations, while the inequality constraint (11) is due to various limitations. The limitations include lower and upper limits on the sizes of TCSCs and SVCs, generator real and reactive power outputs, bus voltage magnitudes and phase angles; and the transmission line thermal limits. x is the state vector of the system consisting of the bus voltage magnitudes and phase angles, u is the vector of control variables to be optimized (i.e., locations and ratings of TCSCs and SVCs).
In order to improve the power system static security, the TCSCs and SVCs should be installed properly so as to eliminate or relieve the overloaded lines and maintain the bus voltages at a desired level under normal state and even the severest single line contingency conditions, so the following objective function J in terms of branch loading and voltage level [25,33] can be considered to minimize:
J = i = 1 l w i ( S i S i , max ) k + j = 1 m w j ( V j , ref V j V j , ref ) k
where Si is the apparent power flow on the transmission line i, Si,max is the maximum apparent power flow limit of the transmission line i; Vj is the voltage magnitude at bus j and Vj,ref is the nominal voltage at bus j (usually considered as 1.0 p.u.); l is the total number of lines and m is the total number of buses in the system; wi and wj are two weighting factors which are determined in order to have the same index value for 100% branch loading and for 5% voltage difference; k is the exponent, equal to 4 in order to give more importance to high levels of overloads and voltage violations.
The objective function J described above consists of two parts. The first part is related to line flow, and it will be a small value if the number of overloaded lines decreases or all lines operate under/near their thermal limits in a system. The second part is corresponding to bus voltage, and it will be a small value if all bus voltages have a value close to the desired level. Therefore, minimization of the objective function J means the maximization of the power system static security.
After achieving the objective function J as described above, here we will give the details of the equality constraints and the inequality constraints represented previously in (10) and (11).
Equality constraints are given in the following discussion. The real and reactive power balance equations considering installation of FACTS devices are expressed as follows:
j P i j + P D i P G i = 0
j Q i j + Q D i Q S i Q G i = 0
where Pij, Qij are the active and reactive power flows between buses i and j, and the effects of a TCSC installation in the network can be considered; PGi, QGi are the active and reactive power generation at bus i; PDi, QDi are the active and reactive power demand at bus i; QSi is the continuously regulable reactive power provided by the SVC installation at bus i.
Inequality constraints are given as follows:
  • Power generation limits:
    P G i , min P G i P G i , max i = 1 , , N g
    Q G i , min Q G i Q G i , max i = 1 , , N g
    where PGi,min, QGi,min are the minimum limits of active and reactive power generation; PGi,max, QGi,max are the maximum limits of active and reactive power generation; Ng is the total number of generation buses.
  • Voltage and angle limits:
    V i , min V i V i , max i = 1 , , N b
    δ i , min δ i δ i , max i = 1 , , N b
    where Vi,min and δi,min are the minimum limits of voltage magnitude and angle, respectively; Vi,max and δi,max are the maximum limits of voltage magnitude and angle, respectively; Nb is the total number of buses.
  • Apparent power flow limit:
    S i S i , max i = 1 , , N l
    where Si,max is the maximum apparent power flow limit of a transmission line; Nl is the total number of lines.
  • The TCSC and SVC parameters operating limits:
    X T , min X T X T , max
    Q S , min Q S Q S , max
    where XT,max, XT,min are the maximum and minimum limits of the reactance of TCSC; QS,max, QS,min are the maximum and minimum limits of the reactive power provided by the SVC, respectively.

3. Determination of the Proper Candidate Locations for FACTS Installation

The optimal location and rating for installation of FACTS devices is the key to enhancing the power system static security. Once the suitable candidate locations of FACTS devices are determined, the computational burden of the NCOP described in Section 2.2 will be significantly lessened. In order to lessen the search scope for the solution, two methodologies, namely MCA and TVT, are applied to determine the proper candidate locations for TCSC and SVC installations, respectively.

3.1. Min Cut Algorithm (MCA)

The MCA [10,49,51] is introduced here for installing TCSCs at suitable location to remove or alleviate the overloads/congestion by controlling the power flow to improve the system static security. However, the distribution of power flow is independent from the capacity loading of transmission line but it is reliant on the line impedance. This leads to the result that the bottleneck can be overloaded though the capacity loading of bottleneck is higher than the power demand. Hence, the installation of TCSCs on the branch bottlenecks to regulate the line impedance is a good way to rapidly rebalance the power by redirecting the power flow across these branches to eliminate or alleviate overloads/congestion. For this determining the system branch bottleneck becomes very critical. The problem can be solved if the minimum cut of power network is determined. That is the cut which contains the bottleneck branch with the sum of capacity through it is the smallest. Therefore, if the minimum cut is identified, the branch that can be able to contribute to adjust the line impedance will be recognized and only that branch has the ability to install TCSCs to help the overloaded/congested branches and improve the system static security. That is to say, the TCSCs need to be installed on branches where the minimum cut passes through and also lay in a loop which contains the congested line. Thus, the search space will be reduced from n branch to m branch (m is the branches that the minimum cut passes through).
There are several methods to find the minimum cut for any network having a single origin node and single destination node. One of the usual approaches to solve this problem is to use its close relationship to the maximum flow problem. The famous Max-Flow/Min-Cut Theorem proposed by Ford and Fulkerson in 1956 [52] showed the duality of the maximum flow and the so-called minimum st cut. Here s and t represent two vertices which are the source and the sink in the flow problem and have to be separated by the cut, that is, they have to lie in different parts of the partition as shown in Figure 2. Maximum amount can flow between nodes i and j is called capacity of arc cij.
The maximum flow is the flow of maximum value from the source to the sink and equals the capacity of a minimum cut for all cuts in the network. A cut is any set of directed links containing at least one link in every path from source node to sink node. This means if the links in the cut are removed the flow from the source to sink is completely cut off.
The cut value is the sum of the flow capacities in the source to sink direction over all the links crossing a cut. A minimum cut is a cut of minimum capacity, in other words, the sum of capacities of arcs crossing the cut is minimum. The minimum cut problem is to find the minimum cut in a given network.

3.2. Modeling Power Network Using MCA

The power network is modeled as a directed network G(N, A) where flow in the network represents the power flow. The set of nodes N, corresponds to the buses of the power network. The branch between bus i N and bus j N is represented by an arc aij A. Each arc has a capacity cij, denoting the maximum allowable power flow through that line. The min cut algorithm is added two special nodes, the virtual source (s) and the virtual sink (t) which are representing the combination of the generators and loads respectively. Each line out of the virtual source (s) has a maximum flow that matches the generation of the connected node, and each line into the virtual sink (s) represents the load demanded by the connected node. The modeling of an example power system is shown in Figure 3b, a power system using MCA is shown in Figure 3a.
The algorithm works by successively assigning flow f(aij) to arcs along a directed path from s to t until no more flow can be added. The main steps for the MCA may be constructed below:
  • Find any path through the origin point to the terminal point. If there is no more such path, exit.
  • Determine f (the maximum flow along this path) which will be equal to the smallest flow capacity on any arc in the path (the bottleneck arc)
  • Subtract f from the remaining flow capacity according to the direction from the origin point to the terminal point for each arc in the path.
  • Go to Step 1.
The details for determining the minimum cut of power network are presented in [10,49,51].

3.3. Tangent Vector Technique (TVT)

The TVT [53] is introduced here for installing SVC at suitable location to maintain the bus voltages in the desired level to improve the system static security. Then, referring to [54,55], with the Jacobian matrix, the changes of the state variables can be evaluated by the tangent vector as follows:
[ Δ θ G Δ θ D Δ V D ] = [ J 0 ] 1 [ Δ P G Δ P D Δ Q D ]
where vector ΔPG includes the increments of all real power generations; vectors ∆PD and ΔQD include all the loading levels for system load to increase; and vectors ΔθG, ΔθD and ΔVD are the corresponding changes of the bus angles and voltage magnitudes due to the increased system load. Generally speaking, the changes of the voltage magnitudes are negative.
The factor ΔVi/Vi is used to evaluate how necessary the SVC installation at bus i is for the system under normal and even the most critical single line contingency condition able to operate within the voltage security limits. In principle, the more ΔVi/Vi is negative, the more bus i will be necessary for an SVC installation. In the proposed hybrid approach, since the buses with most negative ΔV/V are specified as the suitable candidate locations for SVC installation, the number of buses which need to be investigated to determine the best location of SVCs has reduced and for that reason the search space for the solution to the problem becomes limited.

4. Cuckoo Search Algorithm (CSA) and Its Application

This section, firstly presents the CSA. And then, we describe the proposed process of applying the CSA to simultaneously optimize the locations and settings of TCSCs and SVCs for solving the problem to enhance power system static security.

4.1. Cuckoo Search Algorithm (CSA)

CSA is a novel nature-inspired meta-heuristic method to solve optimization problems developed by Yang and Deb [41]. The basic ideas of this algorithm are on account of some cuckoo species' obligate brood parasitism by removing eggs in the birds’ nests laid by other host species, laying her own and flying off with host eggs in her bill in combination with a search pattern called Lévy flight which is encountered in some birds and insects. In order to give a clearly description of cuckoo search algorithm, we will outline the interesting breed behaviour of certain cuckoo species and the Lévy flight behaviour.

4.1.1. Cuckoo Breeding Behaviour

The cuckoo is the best known brood parasite, an expert in the art of cruel deception. Its aggressive reproduction strategy involves stealth, surprise and speed. Some species such as the Ani and Guira cuckoos lay eggs in common nests, in order to raise their own eggs’ hatching probability, though they may push others’ eggs out. Quite a few species involve in obligate brood parasitism in a way of laying their eggs in other host species' nests and flying off with the host egg in her bill. The whole process takes merely ten seconds. A few host birds can involve in direct battle with the invading cuckoos. Once a host bird detects the eggs are laid by others, it will either remove these strange eggs or straightforwardly desert this nest and build a new nest at other places. Therefore cuckoos parasitize the nests of a large variety of bird species and carefully mimic the color and pattern of their own eggs to match that of their hosts. Some cuckoo species, for instance, the New World brood-parasitic Tapera can reduce the probability of their eggs being abandoned so as to improve their reproductivity in such an evolved way that female parasitic cuckoos are good at the mimicry in colour and pattern of some chosen host species' eggs. From the description of cuckoo breeding behaviour above, cuckoo search is based on the following three principle rules [41,42]:
  • Each time, each cuckoo can only lay one egg (a solution for an optimization problem), and which will be dumped in a randomly chosen nest among the fixed number of obtainable host nests.
  • The best nests in which high-quality eggs (an optimization problem’s better solutions) are laid will be retained in the next generations.
  • During the whole search process, the number of obtainable nests of hosts is fixed, and the host bird can discover the strange egg laid by a cuckoo with a probability Pa [0, 1]. Under these circumstances, it can either remove the strange egg or straightforwardly desert this nest and build a new nest at a new place. And very simplistically, the last hypothesis can be estimated by the fraction probability Pa of the n nests is substituted by new nests (with new locations’ new random solutions).

4.1.2. Lévy Flights Behaviour

Lévy flights are a particular class of generalized random walk, and the step lengths during the walk are described by a ‘heavy-tailed’ probability distribution. They can describe all stochastic processes that are scale invariant. Lévy flights have accordingly turned out to be applicable to a diverse range of fields, describing animal foraging patterns, the distribution of human travel and even some aspects of earthquake behaviour. Lévy flights have been shown as a good searching strategy that may be used by some species. A recent study indicates that fruit flies (like Drosophila melanogaster) search their landscape via employing a series of straight line flight paths interrupted by a abrupt 90-degree turn, causing a Lévy-flight-style intermittent scale-free search pattern. Even light waves perform a Lévy flight. Thus, such behavior has been emulated to perform optimization and global optimal search with promising results [45].

4.1.3. CSA

Combining cuckoo search based on three principle rules which have been described in cuckoo breeding behaviour with Lévy flights, we can form a general mathematical model for the CSA. For simplicity, each nest has only a single egg. In this case, there is no distinction between an egg (a solution), a nest or a cuckoo, as each nest corresponds to one egg which also represents one cuckoo. There are two key branches or types of generating new solutions in the CSA, namely, the local random walk and the global random walk. This algorithm uses a balanced combination of a local random walk and the global explorative random walk, controlled by a switching parameter Pa [0, 1]. The switching parameter Pa can be used for balancing between exploration and exploitation. The local random walk can be written as:
X i t + 1 = X i t + α s H ( P a ε ) ( X j t X k t )
where Xi, Xj and Xk are three different solutions; α > 0 represents the step size scaling factor involving the scales of the problem; s is the step size; represents entry-wise multiplications; H ( ) is a Heaviside function and ε is a uniform distributed random number. On the other hand, the global random walk is carried out by using Lévy flights as follows.
X i t + 1 = X i t + α L ( s , λ )
where:
L ( s , λ ) = λ Γ ( λ ) sin ( π λ / 2 ) π 1 s 1 + λ , ( s > > s 0 > 0 )
where Γ ( ) is a Gamma function and calculated by:
Γ ( z ) = 0 t z 1 e t d t
particularly, when z = n is an integer, and then we will obtain Γ ( n ) = ( n 1 ) ! .
In most cases, we can use α = O(l/10), where l is the characteristic scale of the problem, while in some instances, α = O(l/100) can be more effective and avoid the need to fly too far. Essentially, Equation (24) is the stochastic equation describing a random walk. Generally speaking, a random walk can be treated as a Markov chain, and the Markov chain means that its next status/position only relies on the current status/position (that is, the first part in Equation (24)) and the transition probability (that is, the second part). The Lévy flight substantially offers a random walk with a Lévy distributed random step length as:
L e v y 1 s λ + 1 , ( 0 < λ 2 )
which possesses both an infinite variance and an infinite mean. Now, the steps substantially form a heavy tailed and power-law step-length distributed random walk process. Some new solutions should be given by Lévy walk close to the best solution gained so far to accelerate the local search. However, in order to avoid local minimum, the new solutions’ significant fraction probability should be given by far field randomisation and whose positions should be far away from the current best solution. From the implementation point of view, there are a few ways of achieving Lévy flights, but in this article, a method called Mantegna algorithm [56] which is one of the most efficient and yet straightforward ways for asymmetric Lévy stable distribution is used for generating random step sizes. Here ‘symmetric’ means that the step sizes can be positive and negative.
The step length s in Mantegna’s algorithm for Lévy flights can be computed by:
s = u | v | 1 β
where the parameters v and u are drawn from normal distributions. That is:
{ u N ( 0 , σ u 2 ) v N ( 0 , σ v 2 )
and the standard deviations σ u and σ v are calculated by:
{ σ u = { Γ ( 1 + β ) sin ( π β / 2 ) Γ [ ( 1 + β ) / 2 ] β 2 ( β 1 ) / 2 } 1 / β σ v = 1
where β is the distribution factor (0.3 ≤ β ≤ 1.99).
Studies show that Lévy flights can maximize the efficiency of resource searches in uncertain environments. Actually, Lévy flights have been observed among foraging patterns of albatrosses and fruit flies, and spider monkeys. Additionally, many physical phenomena such as the diffusion of fluorescent molecules, cooling behaviour and noise could show Lévy-flight characteristics. Hence, it is promising to apply such behaviour to optimization algorithms as the search optimization strategy.
Algorithm 1 Pseudocode of the CSA
Produce initial a population of n host nests randomly within the given search interval as Xi (i = 1, …, n)
for Iter =1:Itmax
  Get a cuckoo (say a) randomly via Lévy flights
  Evaluate its quality/fitness Fa
  Select a nest (say b) among n randomly
  if (Fa is better than Fb) then
    replace the solution b by the new solution
    replace the quality/fitness Fb by the new solution’s quality/fitness
  end if
  Desert a fraction probability (Pa) of worse nests and construct new ones
  Retain the best solutions (or nests with top quality solutions)
  Sort the solutions and find the current global best nest Gbest
end for
Postprocess results and visualization
In a summary, the corresponding pseudocode for the CSA combining cuckoo search with Lévy flights is given in Algorithm 1. The main steps for the CSA may be constructed as below:
  • Generate initially a population of n host nests randomly within the given search interval as below:
    X i = ( X i 1 , X i 2 , , X i j ) T i = 1 , 2 , , n j = 1 , 2 , , d
    where Xi represents the ith nest (solution); Xij represents the jth element of the ith nest (solution); d represents the dimension of the given problem. Initialize parameter Pa [0, 1], and Pa is a probability that the host bird can discover the strange egg. Set Itmax (that is, the maximum number of iterations).
  • Evaluate the fitness function of the initial n host nests, choose the best value of each nest Xbesti (i = 1, 2,…, n) and the global best nest Gbest among all nests which is corresponding to the best fitness function, store the fitness values and the best fitness value.
  • Get cuckoos (new solutions) randomly based on the previous best nest via Lévy flights. As mentioned above, the new solution for each nest is calculated as follows:
    X i n e w = X b e s t i + α × r a n d 1 × Δ X i n e w
    where α > 0 is the updated step size; rand1 is a normally distributed stochastic number, and the increased value Δ X i n e w is determined by:
    Δ X i n e w = r a n d u | r a n d v | 1 / β × σ u σ v × ( X b e s t i G b e s t )
    where randu and randv are two normally distributed stochastic variables with standard deviation σ u and σ v given in (30) above.
  • Evaluate the new solutions’ fitness function, determine the newly best value of each nest Xbesti and the global best nest Gbest by comparing the stored fitness values in Step 2 with the newly calculated ones, update the best value of each nest Xbesti and the global best nest Gbest, and store the fitness values and the best fitness value.
  • Discover strange egg in a nest of a host bird with the probability of Pa and also create a new solution for the problem similar to the Lévy flights. The new solution because of this action is calculated as follows:
    X i d i s c = X b e s t i + C × Δ X i d i s c
    where C is the updated coefficient, determined based on the probability of a host bird to discover a strange egg in its nest:
    C = { 1 i f r a n d 2 < P a 0 o t h e r w i s e
    and the increased value Δ X i d i s c is calculated by:
    Δ X i d i s c = r a n d 3 × [ r a n d p 1 ( X b e s t i ) r a n d p 2 ( X b e s t i ) ]
    where rand2 and rand3 are the distributed random numbers on the interval [0, 1]; randp1(Xbesti) and randp2(Xbesti) are the random perturbation for positions of nests in Xbesti.
  • Evaluate the new solutions’ fitness function, determine the newly best value of each nest Xbesti and the global best nest Gbest by comparing the calculated fitness function from this new solutions with the stored fitness values in Step 4, update the best value of each nest Xbesti and the global best nest Gbest, store the fitness values and the best fitness value.
  • If the predefined Itmax has been reached, the computation can be terminated and the results are displayed, else go to Step 3.
The flowchart of the CSA is shown in Figure 4a.

4.2. Procedure of CSA-based Optimal Locations and Settings of TCSC and SVC

As using the MCA and the TVT to determine the proper candidate locations for TCSC and SVC installations respectively, described in Section 3, here, we will give the main steps of the proposed procedure of applying the CSA to solve the problem to enhance power system static security via simultaneously optimizing the locations and settings for installations of TCSC and SVC. The detail sequential steps are described as follows:
  • Read the power system data and set associated parameters such as the host nests size n, an alien egg in a nest of a host bird is discovered with the probability Pa [0, 1], the number of optimization variables d, the maximum number of iterations Itmax.
  • Initialize n host nests N { X i ( i = 1 , 2 , , n ) } considering the variables to be optimized (the locations and ratings of TCSC and SVC). Each of these nests concatenated of two strings corresponds to a feasible solution to the problem to be optimized. The first string in the nest is involving the locations of TCSC and SVC in the network. This string contains the numbers of the lines and buses where the TCSC and SVC should be located respectively, and it can be selected within the candidate locations for TCSC and SVC installations determined by the MCA and the TVT, respectively. Here, the lines where the transformers are existed and the buses where the generators are connected are not considered as locations for TCSC and SVC installations, respectively. Repeated locations are not allowed in our optimization process and each line or bus should appear only once in the string. While the second and last part of the nest’s string corresponds to the rating values of TCSCs and SVCs in the network which are normalized between 0 and 1 with 0 relating to the minimum value of the device and 1 to the maximum. It is randomly generated according to the operating range of TCSC and SVC which can be considered as follows:
    −0.8XijXT ≤ 0.2Xij per unit (p.u.),
    −80 ≤ QS ≤ 80 MVar
    where XT is the additional reactance on a transmission line where the TCSC is located; QS is the reactive power provided by SVC.
  • Evaluate the fitness function of the initial n host nests N on account of the calculation results obtained from power flow analysis, choose the best value of each nest Xbesti (i = 1, 2, …, n) and the global best nest Gbest among all nests which is corresponding to the best fitness function, store the fitness values and the best fitness value.
  • Get cuckoos (new solutions) randomly based on the previous best nest via Lévy flights. As mentioned above, the new solution for each nest is calculated using (32) and (33).
  • Evaluate the new solutions’ fitness function on account of the calculation results obtained from power flow analysis, determine the newly best value of each nest Xbesti and the global best nest Gbest by comparing the stored fitness values in Step 3 with the newly calculated ones, update the best value of each nest Xbesti and the global best nest Gbest, store the fitness values and the best fitness value.
  • Discover strange egg in a nest of a host bird with the probability of Pa and also create a new solution for the problem similar to the Lévy flights. The new solution because of this action is calculated using (34)–(36).
  • Evaluate the new solutions’ fitness function on account of the calculation results obtained from power flow analysis, determine the newly best value of each nest Xbesti and the global best nest Gbest by comparing the calculated fitness function from this new solutions with the stored fitness values in Step 5, update the best value of each nest Xbesti and the global best nest Gbest, store the fitness values and the best fitness value.
  • If the predefined Itmax has been reached, the computation can be terminated and the results (optimal locations and optimal parameter settings of the TCSC and SVC) are displayed, else go to Step 4.
The flowchart of the proposed process of applying the CSA to solve the problem to enhance power system static security via optimal installations of TCSCs and SVCs is shown in Figure 4b.

5. Implementation of the Proposed Hybrid Approach

In this section, we will give the overall procedure of implementation of the proposed hybrid approach for the power system static security enhancement via optimal installations of TCSCs and SVCs under normal operation and even the most critical single line contingency conditions. In our proposed hybrid approach, for purpose of lessening the computing burden of the NCOP and improving the accuracy of its solution, two methodologies, namely the MCA and the TVT are first applied to investigate the lines and buses suitable for TCSC and SVC installations, respectively. With the specific lines and buses chosen as candidate locations for TCSC and SVC installations, respectively, the search space for the solution to the problem will be reduced. That is to say, the number of lines and buses which need to be investigated to determine the best locations of TCSCs and SVCs for CSA to solve the problem to enhance power system static security formulated in Section 2.2 will be significantly decreased. Here, the overall procedure of implementation of the proposed hybrid approach is presented below:
  • Read the power system data and perform load flow computation under normal operation without FACTS devices installation.
  • Check whether all transmission line limits, bus voltage limits and reactive power of generating units’ limits are respected or not. If yes, go to Step 6, else go to Step 3.
  • Determine the candidate locations appropriate for TCSC and SVC installations by the MCA and the TVT, respectively.
  • Use the CSA to solve the problem to enhance power system static security by simultaneously optimizing the locations and settings for installations of TCSCs and SVCs under normal operation.
  • Store the optimal locations and the optimal parameter settings for TCSC and SVC installations.
  • Record the results of power flow analysis and the minimized value of objective function.
  • With the power flow data recorded in Step 1, consider conditions with a single line fault in the system and perform load flow computation, identify which line fault is the severest single line contingency scenario in this system based on the result of contingency analysis, and then perform load flow computation again under the severest single line contingency scenario.
  • Check whether all transmission line limits, bus voltage limits and reactive power of generating units’ limits are respected or not. If yes, go to Step 12, else go to Step 9.
  • Under the severest single line contingency scenario, determine the candidate locations appropriate for TCSC and SVC installations by the MCA and the TVT, respectively.
  • Use the CSA to solve the problem to enhance power system static security by simultaneously optimizing the locations and settings for installations of TCSCs and SVCs under the severest single line contingency conditions.
  • Obtain the minimized value of objective function and the optimal locations and optimal settings for TCSC and SVC installations.
  • Print the results.
The flowchart of the proposed hybrid approach for the power system static security enhancement via optimal installations of TCSCs and SVCs under normal operation and even the severest single line contingency condition is shown in Figure 5.

6. Simulation Results and Discussion

This section of simulations is to validate the effectiveness of our proposed hybrid approach on IEEE 6-bus and modified IEEE 14-bus test systems under normal operating condition and even the severest single line fault conditions. In this regard, firstly, the MCA and the TVT are used for determining the proper candidate locations for TCSC and SVC installations based on the two test power networks mentioned above, respectively. Then the CSA is employed to determine the best locations with best settings of TCSC and SVC installations for the power system static security enhancement problem. Additionally, considering the high cost of installation and maintenance of FACTS devices, the number of FACTS devices is fixed at no more than one for each type in our study. The lower and upper voltage limits for both load and generator buses of the above mentioned two test systems are taken as 0.95 and 1.05 per unit, respectively.
Two studied cases are employed for the two tested networks. These cases are defined as follows:
  • Case 1: This case represents the normal operating conditions.
  • Case 2: This case represents the severest single line fault conditions.
All the programs are implemented using MATLAB on a Windows 7 PC equipped with a 2.30 GHz Intel(R) Core(TM) (Intel Corporation, 2200 Mission College Blvd. Santa Clara, California, USA) i5-2415M CPU and 4 GB RAM. However, PSO and CSA have several parameters which should be initialized. The parameters for PSO and CSA are the widely accepted values for original PSO and CSA and help algorithms achieve good performance for most of the problems. Meanwhile, in order to make a fair comparison of the CSA with PSO, we fix the same initial population size of 25. For PSO we use these settings: c1 = 2, c2 = 2, Vmax = 5. For CSA we use the setting: Pa = 0.25. In addition, the maximum number of iterations is set to 100. All the experiments are conducted for 30 independent runs.

6.1. IEEE 6-Bus Test System

The IEEE 6-bus test system consists of three generator buses at buses 1, 2 and 3. Buses 4, 5 and 6 are load buses. The system has 11 transmission lines with a capacity of 230 kV. Its single line diagram has been depicted in Figure 6. The complete data of this system is extracted from MATPOWER 4.0 [57] (Power Systems Engineering Research Center, New York, USA). The simulations have been performed for 100% of base loading on this test system. The maximum apparent power flow limits (Smax) of transmission lines are shown in Table 1 (column 3).
In case 1, Table 1 (column 4) and Figure 7 indicate that although there are no bus voltage limit violations without FACTS installation, the apparent power flow exceeds the limit (Smax) in line 1–5 and consequently transmission congestion occurs. Clearly the security of the network is violated. The existing power network can enhance its security by optimal location of TCSC to decrease the loading of line 1–5 and increase loading on the line where TCSC is located.
Table 2 shows that the minimum cut passes through lines 1–4, 1–5, 2–4, 2–5, 2–6 and 3–5. From Table 3 it can be observed that, the lines 1–4, 2–5, 2–6 and 3–5 are lines that the minimum cut passes through and are also lines in respective loops1(1–4–5–1), 2(2–5–1–2), 3(2–6–5–1–2) and 4(3–5–1–2–3) which contain the same overloaded line 1–5. Therefore, to eliminate congestion and improve the system security, the TCSC needs to be installed on line that the minimum cut passes through and also lies in loop which contains the congested line. The proper candidate locations for TCSC installation are the transmission lines 1–4, 2–5, 2–6 and 3–5 as shown in Table 3. Once the proper candidate locations are determined, the number of branches which need to be investigated to determine the best TCSC location has reduced from 11 branches to four branches in the minimum cut as shown in Table 3 which is less than as compared with [33]. Meanwhile, the search space for the solution of PSO and CSA to determine the best location and best setting of TCSC is significantly reduced.
Table 4 gives the best location with best setting of FACTS installation achieved by PSO and CSA under normal operating condition, respectively. From Table 1 (column 5–6) and Figure 8 it can be found that the congested line 1–5 has been eliminated via optimal location of TCSC obtained by using PSO and CSA. Moreover, the distributions of apparent power flow in this test system are more ordered and balanced with FACTS installation by the CSA as shown in Figure 8, when compared with those of PSO. The loading of the line 1–5 has now reduced from 101.36 to 98.79% and 96.82% obtained by using PSO and CSA to optimal installation of TCSC, respectively. Line 2–5 (that is, the best location of TCSC placement obtained by PSO as shown in Table 4) is now loaded to 96.01% which is much higher than the initial 83.94% without TCSC installation, while line 3–5 (that is, the best location of TCSC placement obtained by CSA as shown in Table 4) is now loaded to 47.10% which is much higher than the initial 34.96% without TCSC installation. The TCSC reduced the series impedance of the lines 2–5 and 3–5 and hence the apparent power flow on the lines increases. Bus voltage profiles of this test system without and with FACTS installation optimized by PSO and CSA are shown in Figure 7. It is to be noted that the voltage magnitudes of all load buses are brought nearer to 1.0 per unit after FACTS installation by CSA, when compared with those of PSO. It can also be seen in Table 4 that the initial value of objective function J of 7.6304 is reduced to 4.6973 and 4.0287 through TCSC placement by PSO and CSA, respectively. As mentioned above, the reduction of objective function J means the maximization of the power system static security. It is very clear from the results that the CSA offers better optimal location with optimal setting for TCSCs, which minimizes the objective function J to the lower possible value, when compared with those of PSO. Consequently, the severity will be reduced and the power system security will be enhanced.
In case 2, the severest single line fault condition in IEEE 6-bus test system is considered. Contingency analysis and ranking process is performed on this system, and the severest single line fault is proved line 1–4 contingency, which is determined on account of the number of overloaded lines and the number of voltage limit violation buses from the line contingency analysis. Table 5 (column 4) and Figure 9 show that both the overloaded lines and the low voltage buses occur in this test system without FACTS installation for line 1–4 outage. It can be seen that the apparent power flow exceeds the limit (Smax) in lines 1–2, 1–5 and 2–4 and consequently transmission congestion occurs. Additionally, the voltage value of bus 4 is less than 0.95 per unit as shown in Figure 9. Obviously, the security of the network is violated and can be enhanced by optimal location of TCSC and SVC to decrease the loading of lines 1–2, 1–5 and 2–4 and improve the voltage of bus 4.
According to Table 6, the minimum cut passes through lines 1–5, 2–4, 2–5, 2–6 and 3–5. From Table 7 it is observed that, the lines 2–5, 2–6 and 3–5 are lines that the minimum cut passes through and are also lines in respective loops1(2–5–1–2), 2(2–6–5–1–2) and 3(3–5–1–2–3) which contain the branch overloaded lines 1–2 and 1–5. Therefore, to eliminate congestion and improve the system security, the TCSC need to be installed on line that the minimum cut passes through and also lies in loop which contains the congested line. Obtained from the MCA and the TVT, respectively, the lines 2–5, 2–6 and 3–5 and bus 4 are the proper candidate locations for TCSC and SVC installations respectively as tabulated in Table 7. Once the proper candidate locations are determined, the number of lines and buses which need to be investigated to determine the best TCSC and SVC locations has been reduced. Hence, the search space for the solution of PSO and CSA to determine the best locations and best settings of TCSC and SVC is remarkably decreased.
Table 8 reports the best locations with best settings of TCSC and SVC installations achieved by PSO and CSA, respectively, for this test system with line 1–4 outage. From Table 5 (column 5–6), Figure 9 and Figure 10 it can be seen that the loadings of the congested lines 1–2, 1–5 and 2–4 have been considerably reduced and the voltage of bus 4 is improved to a desired level via optimal location of TCSCs and SVCs obtained by using PSO and CSA, respectively. Moreover, the distributions of apparent power flow in this test system are more ordered and balanced with FACTS installation by the CSA as shown in Figure 10, when compared with those of PSO. According to Table 8 and Figure 10, the loading of the line 1–2 has now reduced from 151.21 to 150.83% and 150.16% obtained by using PSO and CSA to optimal installation of FACTS, respectively. The loading of the line 1–5 has now reduced from 134.93 to 132.61% and 127.79% obtained by using PSO and CSA to optimally instal the FACTS, respectively. The loading of the line 2–4 has now reduced from 151.42 to 112.94% and 110.80% obtained by using PSO and CSA to optimal installation of FACTS, respectively. Note that the overloading percentages in these lines of this test system without FACTS installation for line 1–4 outage are very high, which may cause these lines to be tripped and lead to cascaded failure in the system and the neighboring systems as well. Although with the help of using FACTS in the optimized locations with the optimized settings does not eliminate all of the overloaded lines, most of overloaded lines are relieved and the apparent power flow distributions in the test system are significantly reduced to an extent that the system can stand until other corrective actions are applied. Considering the electricity demand of the load buses 4 and 5, both the power supplied by the generator bus 1 through line 1–5 for the consumer in the load bus 5 and the power supplied by the generator bus 2 through line 2–4 for the consumer in the load bus 4 exceed their line limits. Thus, without FACTS installation, the lost load is great in the load buses 4 and 5. With optimal installation of FACTS in the system by our proposed hybrid approach, the generator buses 1 and 2 can supply more power for the load buses 4 and 5 and the lost load is reduced in the load buses 4 and 5. From an economical point of view, if the electricity consumers in the load buses 4 and 5 with the lowest value of lost load (VOLL) [58], the sectors in the load buses 4 and 5 with the lowest VOLL might be potential candidates for other corrective actions such as load shedding measures from the perspective of the entire power network. If the electricity consumers in the load buses 4 and 5 with extremely high VOLL, the sectors in the load buses 4 and 5 should be equipped with emergency backup systems on account of potentially very high interruption costs. In this way, the level of supply security is improved. Meanwhile, all bus voltage limit violations are totally eliminated as visualized in Figure 9. Bus voltage profiles of this test system without and with FACTS installation optimized by PSO and CSA are shown in Figure 9. It is observed that the voltage magnitudes of all load buses are brought nearer to 1.0 per unit after FACTS installation by CSA, when compared with those of PSO. It can also be seen in Table 8 that the initial value of objective function J of 19.3493 is reduced to 11.9790 and 11.0428 through TCSC and SVC placements achieved by PSO and CSA, respectively. As previously mentioned, the reduction of objective function J means the maximization of the power system static security. Obviously, the results show that the CSA offers better optimal locations with optimal settings for TCSC and SVC, which minimize the objective function J to the lower possible value, when compared with those of PSO. These results indicate the accuracy and applicability of the proposed hybrid approach. The convergence characteristic of CSA for IEEE 6-bus test system with FACTS installation is shown in Figure 11.

6.2. Modified IEEE 14-Bus Test System

The modified IEEE 14-bus test system consists of four generator buses at buses 1, 2, 3 and 8, and 14 buses, 20 transmission lines and 11 loads. Its single line diagram has been depicted in Figure 12. It has three regulating transformers in lines 4–7, 4–9 and 5–6, respectively. The complete data of this system is extracted from MATPOWER 4.0 [57] and Table A1.
In this system, a heavy load (110%) according to load level is considered in the simulations. The maximum apparent power flow limits (Smax) of transmission lines are shown in Table 9 (column 3). In case 1, Table 9 (column 4) and Figure 13 show that although all voltages at buses are within limits without FACTS installation under heavy load, the apparent power flow exceeds the limit (Smax) in line 1–2. The transmission congestion can be eliminated by optimal location of TCSC to decrease the loading of line 1–2 and increase loading on the line where TCSC is installed.
Table 10 illustrates the minimum cut passes through lines 1–2 and 1–5. From Table 11 it can be observed that, the line 1–5 is a line that the minimum cut passes through and is also a line in loop1(1–5–2–1) which contains the overloaded line 1–2. Therefore, to eliminate congestion and improve the system security, the TCSC need to be installed on line that the minimum cut passes through and also lies in loop which contains the congested line. The proper candidate location for TCSC installation is line 1–5 as listed in Table 11. Clearly, the number of branches which need to be investigated to determine the best location of TCSC has reduced from 17 branches to one branch in the minimum cut as shown in Table 11 which is less than as compared with [33]. Thus, the search space for the solution of PSO and CSA to determine the best location and best setting of TCSC is dramatically reduced.
Table 12 gives the best location with best setting of FACTS installation achieved by PSO and CSA under normal heavy load operation, respectively. From Table 9 (column 5–6) and Figure 14 it can be found that the congested line 1–2 has been eliminated via optimal location of TCSC obtained by using PSO and CSA. Moreover, the distributions of apparent power flow in this test system are more ordered and balanced with FACTS installation by the CSA as shown in Figure 14, when compared with those of PSO. The loading of the line 1–2 has now reduced from 110.07 to 95.10% and 87.68% obtained by using PSO and CSA to optimal installation of TCSC, respectively. Line 1–5 is now loaded to 82.55% and 88.66% achieved by PSO and CSA, respectively, which is much higher than the initial 70.33% without TCSC installation. The TCSC reduced the series impedance of the line 1–5 hence apparent power flow on the line increases. Bus voltage profiles of this test system without and with FACTS installation optimized by PSO and CSA is shown in Figure 13. It is to be noted that the voltage magnitudes of all load buses are brought nearer to 1.0 per unit after FACTS installation by CSA, when compared with those of PSO. It can also be seen in Table 12 that the initial value of objective function J of 5.0799 is reduced to 4.4408 and 4.2714 through TCSC allocation by PSO and CSA, respectively. As mentioned above, the reduction of objective function J means the maximization of the power system static security. It is very clear from the results that the CSA offers better optimal location with optimal setting for TCSC, which minimize the objective function J to the lower possible value, when compared with those of PSO. Accordingly, the system security in terms of branch loading will be improved.
In case 2, the severest single line fault condition in modified IEEE 14-bus test system with heavy load is considered. Contingency analysis and ranking process is performed on this system, and the severest single line fault is proved line 1–5 contingency, which is determined on account of the number of overloaded lines and the number of voltage limit violation buses from the line contingency analysis. Table 13 (column 4) and Figure 15 show that both the overloaded lines and the low voltage buses occur in this test system without FACTS installation in heavy load with line 1–5 outage.
It can be seen that the apparent power flow exceeds the limit (Smax) in lines 1–2, 2–4 and 2–5. Additionally, the voltage value of bus 14 is less than 0.95 per unit as shown in Figure 15. Clearly the security of the network can be enhanced by optimal location of TCSC and SVC to decrease the loading of lines 1–2, 2–4 and 2–5 and improve the voltage of bus 14. According to Table 14, the minimum cut passes through lines 2–4, 2–5 and 3–4. From Table 15 it is observed that, the line 3–4 is a line that the minimum cut passes through and are also a line in loops1(2–4–3–2), 2(2–5–4–3–2) and 3(3–4–2–3) which contain the branch overloaded lines 2–4 and 2–5. Therefore, to eliminate congestion and improve the system security, the TCSC need to be installed on line that the minimum cut passes through and also lies in loop which contains the congested line. Obtained from the MCA and the TVT, respectively, the line 3–4 and bus 14 are the proper candidate locations for TCSC and SVC installations, respectively, as tabulated in Table 15. Once the proper candidate locations are determined, the number of branches and buses which need to be investigated to determine the best locations of TCSC and SVC has reduced. Hence, the search space for the solution of PSO and CSA to determine the best locations and best settings of TCSC and SVC is significantly lessened.
Table 16 presents the best locations with best settings of TCSC and SVC installations achieved by PSO and CSA respectively for this test system in heavy load with line 1–5 outage. From Table 13 (column 5–6), Figure 15 and Figure 16 it can be seen that the loadings of the congested lines 1–2, 2–4 and 2–5 have been considerably reduced and the voltage of bus 14 is improved to a desired level via optimal location of TCSC and SVC obtained by using PSO and CSA, respectively. Moreover, the distributions of apparent power flow in this test system are more ordered and balanced with FACTS installation by the CSA as shown in Figure 16, when compared with those of PSO. According to Table 13 and Figure 16, the loading of the line 1–2 has now reduced from 195.42 to 194.98% and 194.998% obtained by using PSO and CSA to optimal installation of FACTS, respectively. The loading of the line 2–4 has now reduced from 101.73 to 97.26% and 97.07% obtained by using PSO and CSA to optimal installation of FACTS, respectively. The loading of the line 2–5 has now reduced from 101.93 to 97.63% and 97.43% obtained by using PSO and CSA to optimal installation of FACTS, respectively. Note that the overloading percentages in these lines of this test system without FACTS installation in heavy load with line 1–5 outage are very high, especially the line 1–2, which may cause these lines to be tripped and lead to cascaded failure in the system and the neighboring systems as well. Although with the help of using FACTS in the optimized locations with the optimized settings does not eliminate all of three overloaded lines, two of them (i.e., lines 2–4 and 2–5) are totally eliminated and the apparent power flow on the line 1–2 is significantly reduced to an extent that the system can withstand until other corrective actions are applied. The power supplied by the generator bus 1 through line 1–2 for the consumer in the bus 2 exceeds the limit in the line 1–2. Therefore, without FACTS installation, the lost load is great in the bus 2. The generator bus 1 can supply more power for the load at bus 2 and the lost load is reduced in the bus 2 via optimal installation of FACTS in the system by our proposed hybrid approach. In order to further improve the level of supply security, considering economic indicators such as the VOLL [58], if the electricity consumers in the bus 2 with high VOLL, which indicate that electricity is a rather critical input of the sectors in the bus 2, thus the sectors in the bus 2 should be applied other corrective actions such as equipping the sectors in the bus 2 with emergency backup systems on account of potentially very high interruption costs. If the electricity consumers in the bus 2 with the lowest VOLL, the sectors in the bus 2 with the lowest VOLL might turn out to be potential candidates for other corrective actions such as load shedding measures from the perspective of the entire power network. Meanwhile, all bus voltage limit violations are totally eliminated as visualized in Figure 15. Bus voltage profiles of this test system without and with FACTS installation optimized by PSO and CSA is shown in Figure 15. It is to be observed that the voltage magnitudes of all load buses are brought nearer to 1.0 per unit after FACTS installation by CSA, when compared with those of PSO. It can also be seen in Table 16 that the initial value of objective function J of 20.6624 is reduced to 18.8808 and 18.8678 through TCSC and SVC placements achieved by PSO and CSA, respectively. As explained previously, the reduction of objective function J means the maximization of the power system static security. The results clearly show that the CSA offers better optimal locations with optimal settings for TCSC and SVC, which minimize the objective function J to the lower possible value, when compared with those of PSO. Thus, the power system static security in terms of branch loading and voltage level has been enhanced via optimal installation of FACTS devices by our proposed hybrid approach.
The simulation times of two test systems with FACTS installation by different techniques for case 2 are tabulated in Table 17.
Table 17 shows that the total computational time of our proposed hybrid approach is reduced. Using our proposed hybrid approach, the number of lines and buses selected as the suitable candidate locations for installation of TCSCs and SVCs is reduced by using MCA and TVT in the first step. Thus, in the second step, there is no need for CSA to search all the lines and all the buses in the power network to find the best locations with optimal settings for installations of TCSCs and SVCs. In this case, the search space of CSA is significantly reduced. Therefore, searching fewer lines and fewer buses will dramatically reduce the computational time of CSA in the second step. Though the MCA and TVT procedures need some time in the first step, there is no need for CSA to spend much time to search all the lines and all the buses in the system at the second step, the total computational time of our proposed hybrid approach is reduced. The convergence characteristic of CSA for modified IEEE 14-bus test system with FACTS installation is shown in Figure 17.

7. Conclusions

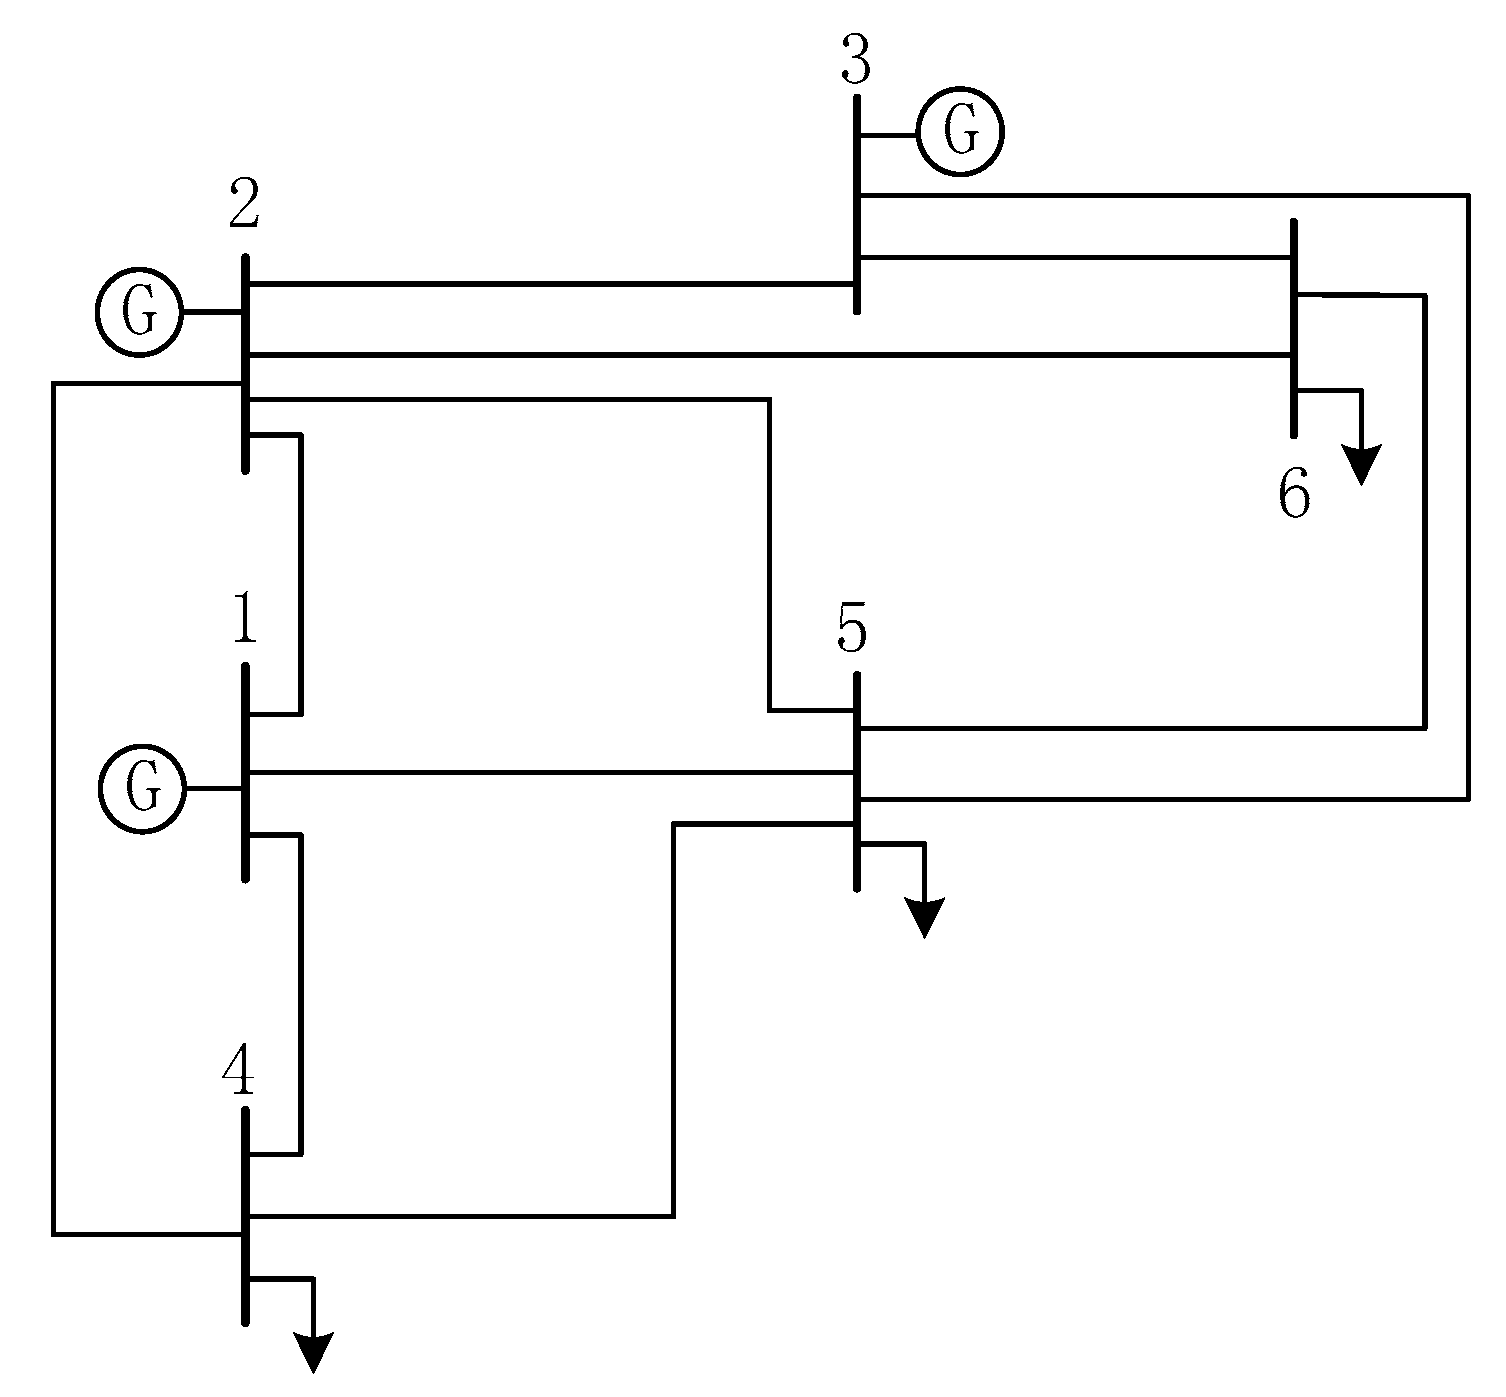
Sustained development of the economy will result in continuous growing demand for electricity regionally or integrally. Additionally, due to open access to the transmission networks, several factors such as an increasing various power transactions, unplanned power exchanges and unexpected outages will cause hugely changing power flows through lines and voltage violations on buses in the deregulated power systems. In this case, serious threats to the power system security might occur. Therefore, it is a good choice to optimally locate FACTS devices on the existing networks other than build new transmission lines for enhancing power network security. This paper proposes a hybrid approach to solve the problem of maximizing power system static security in terms of branch loading and voltage level via optimal installations of TCSCs and SVCs under normal operation and even the most critical single line contingency condition has been proposed. Our proposed approach requires a two-step strategy. In the first step, the MCA and the TVT are applied to determine the proper candidate locations of TCSCs and SVCs, respectively. In the second step, the CSA is employed to solve this problem by simultaneously optimizing the locations and settings for installations of TCSC and SVC. The proposed hybrid approach was verified on the IEEE 6-bus and modified IEEE 14-bus test systems.
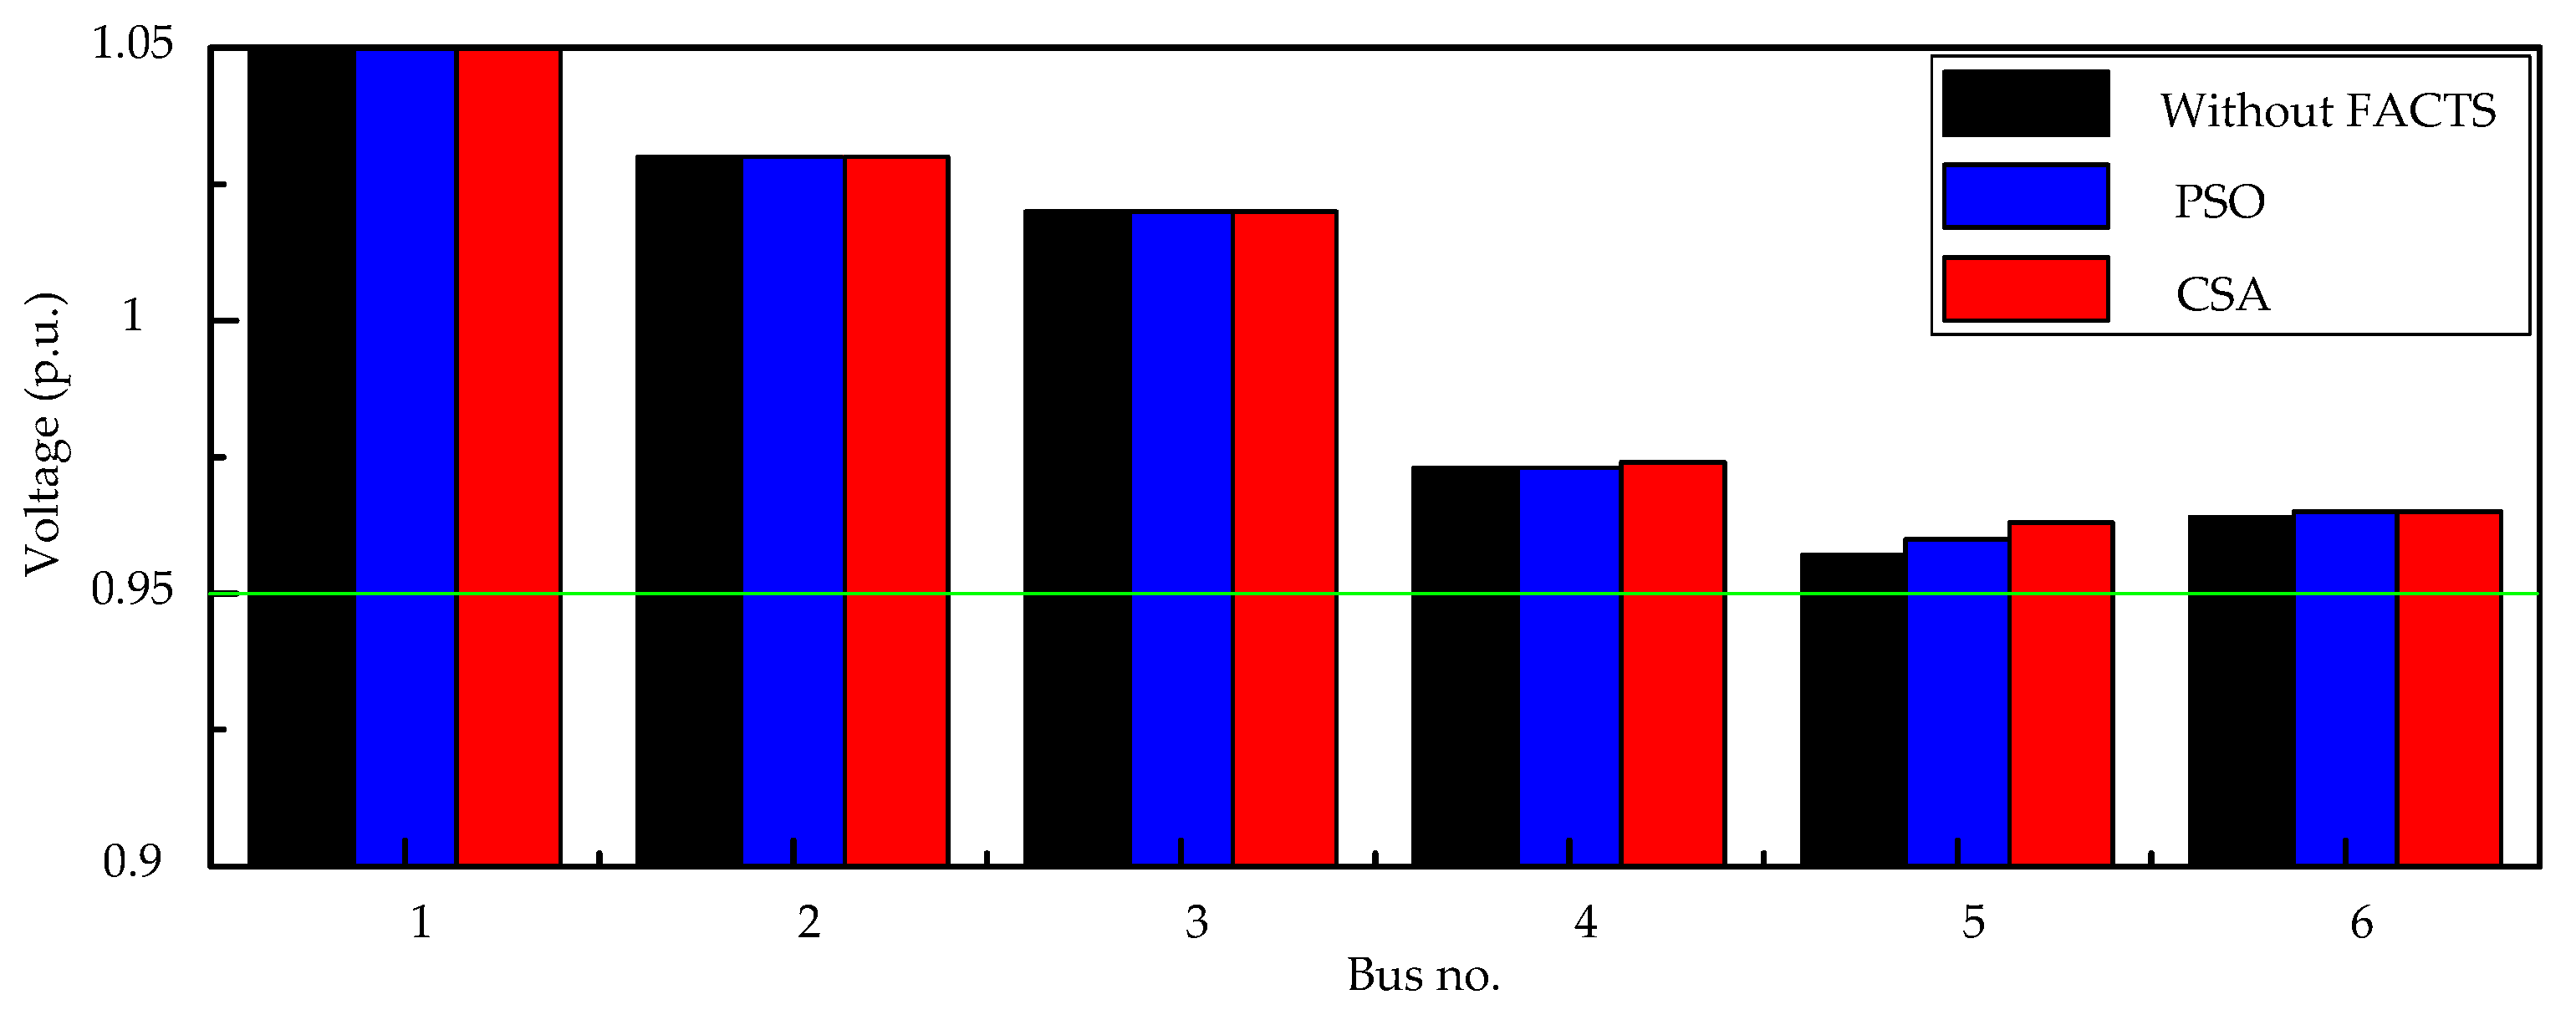
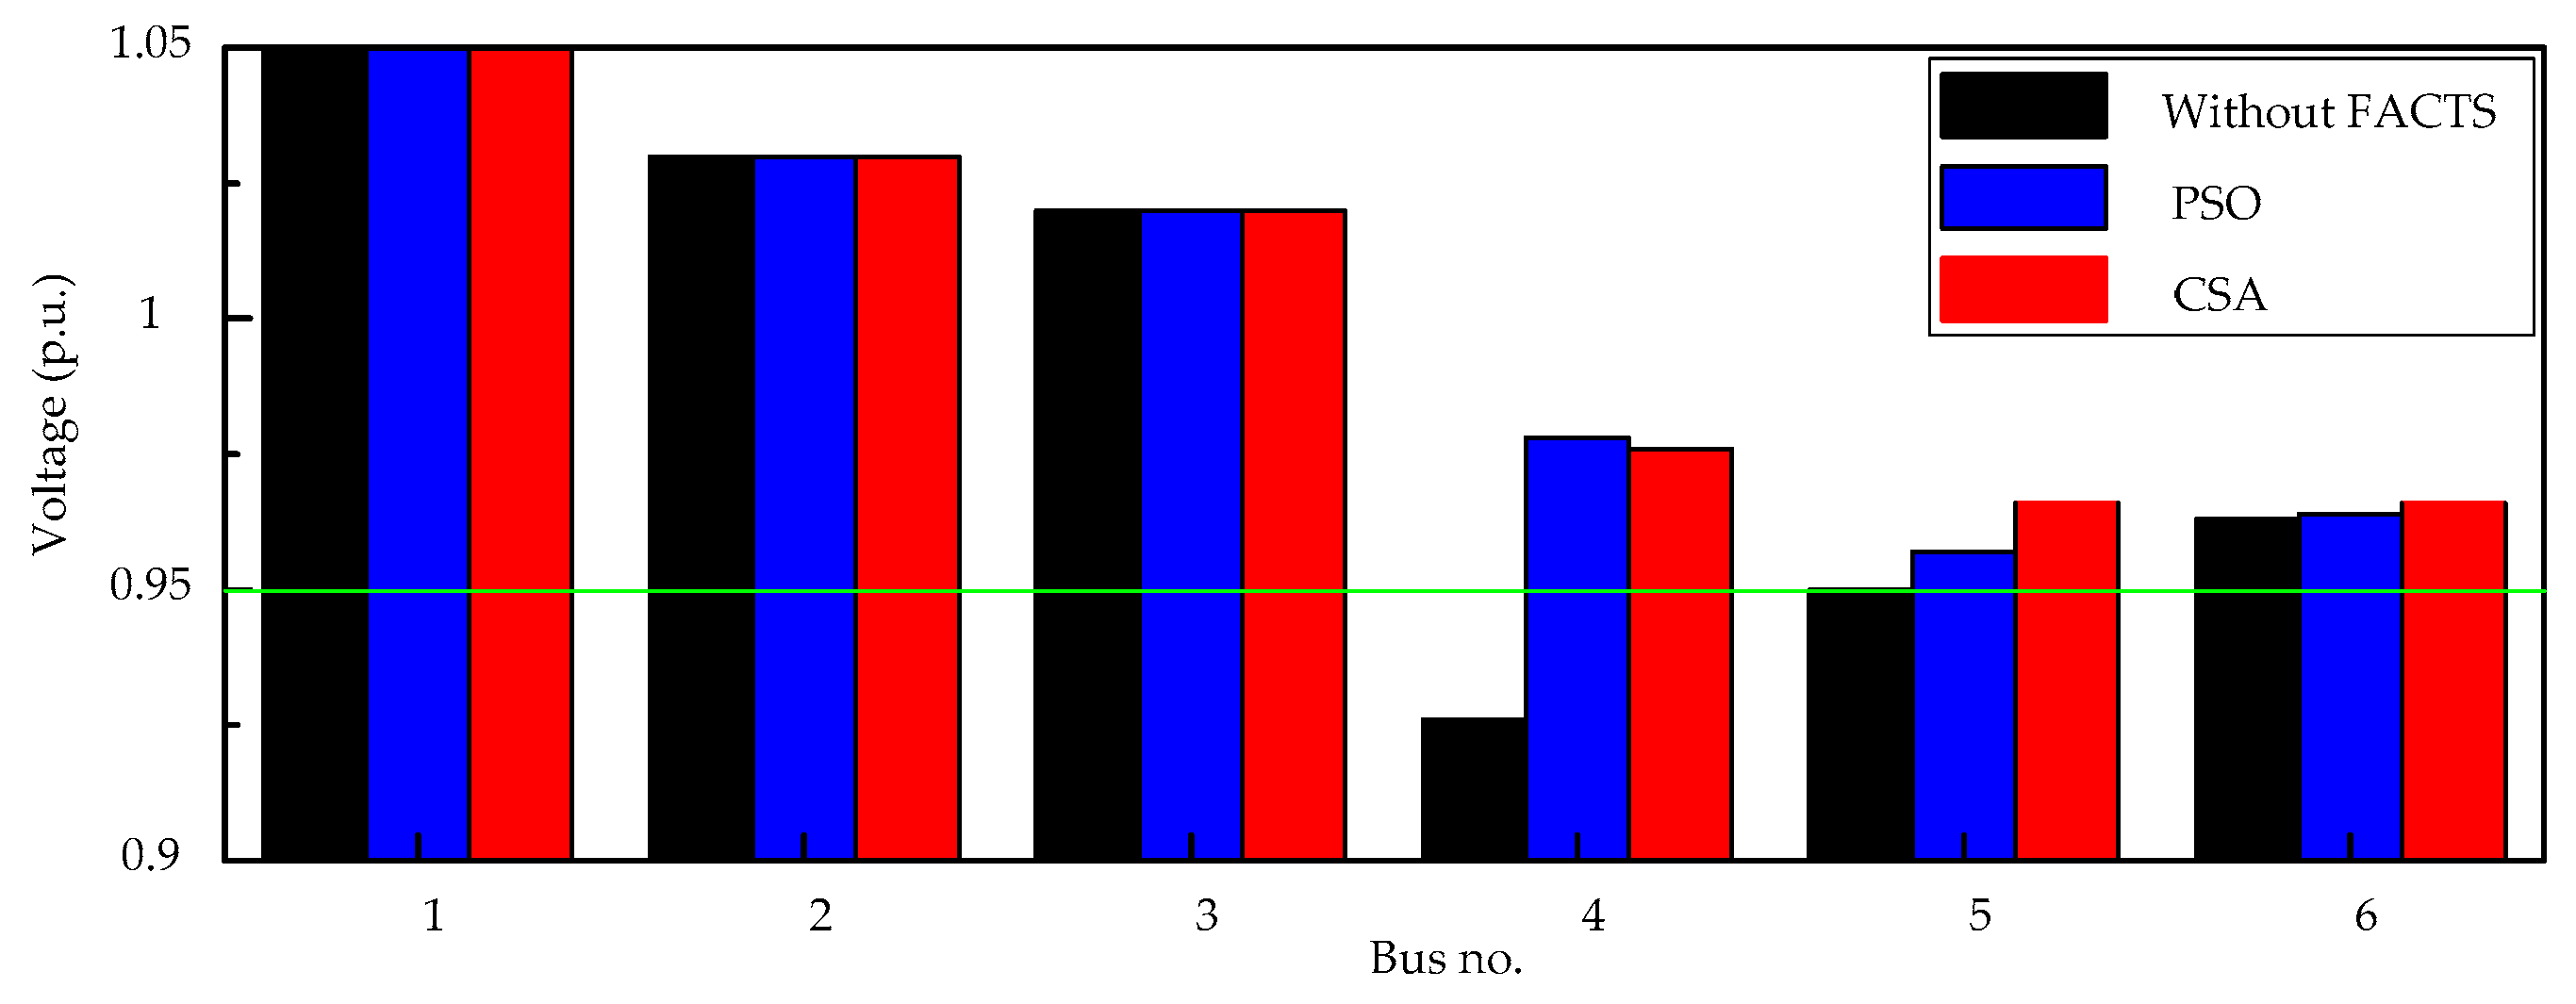
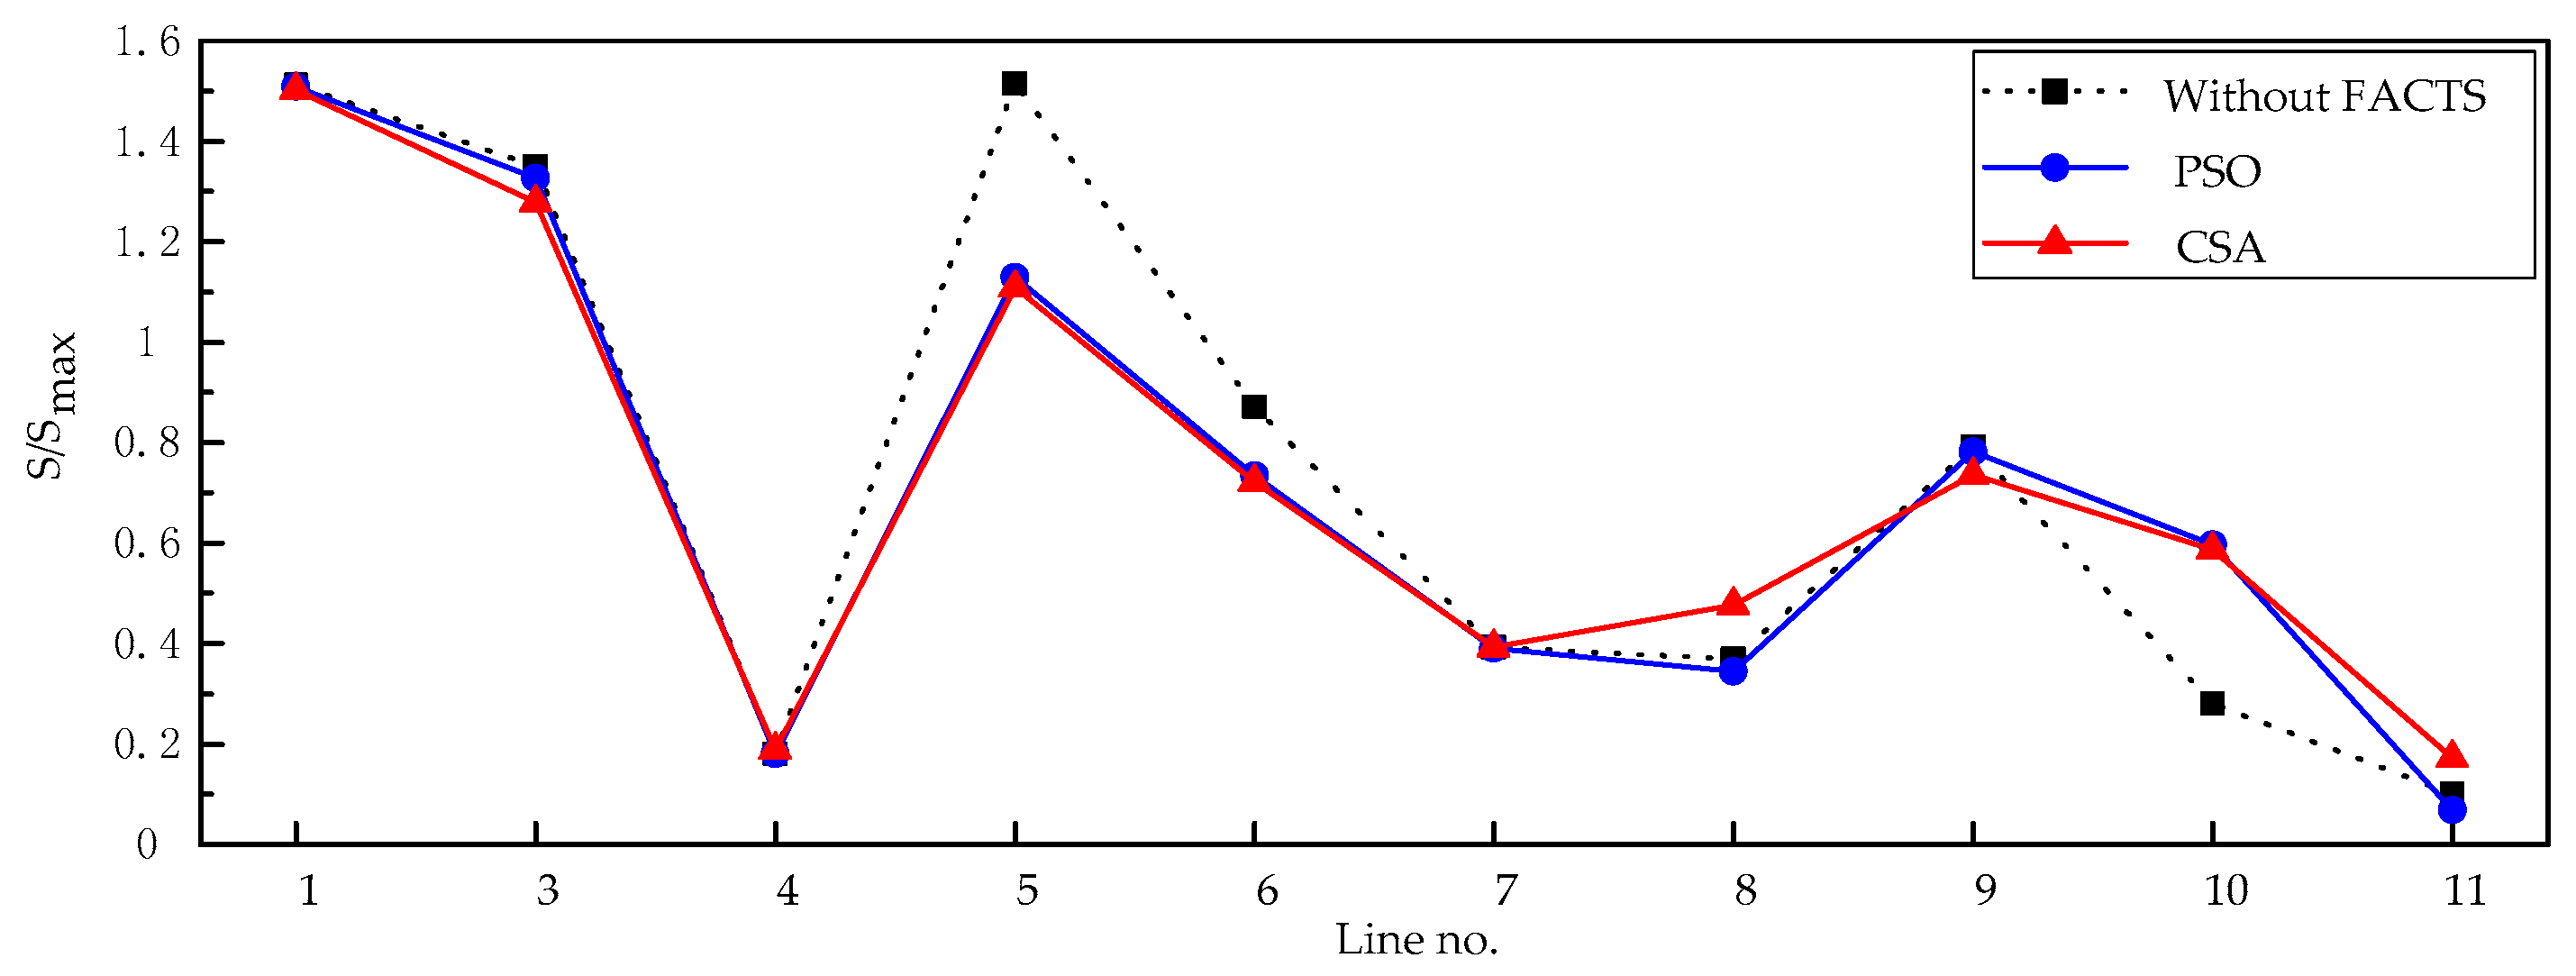
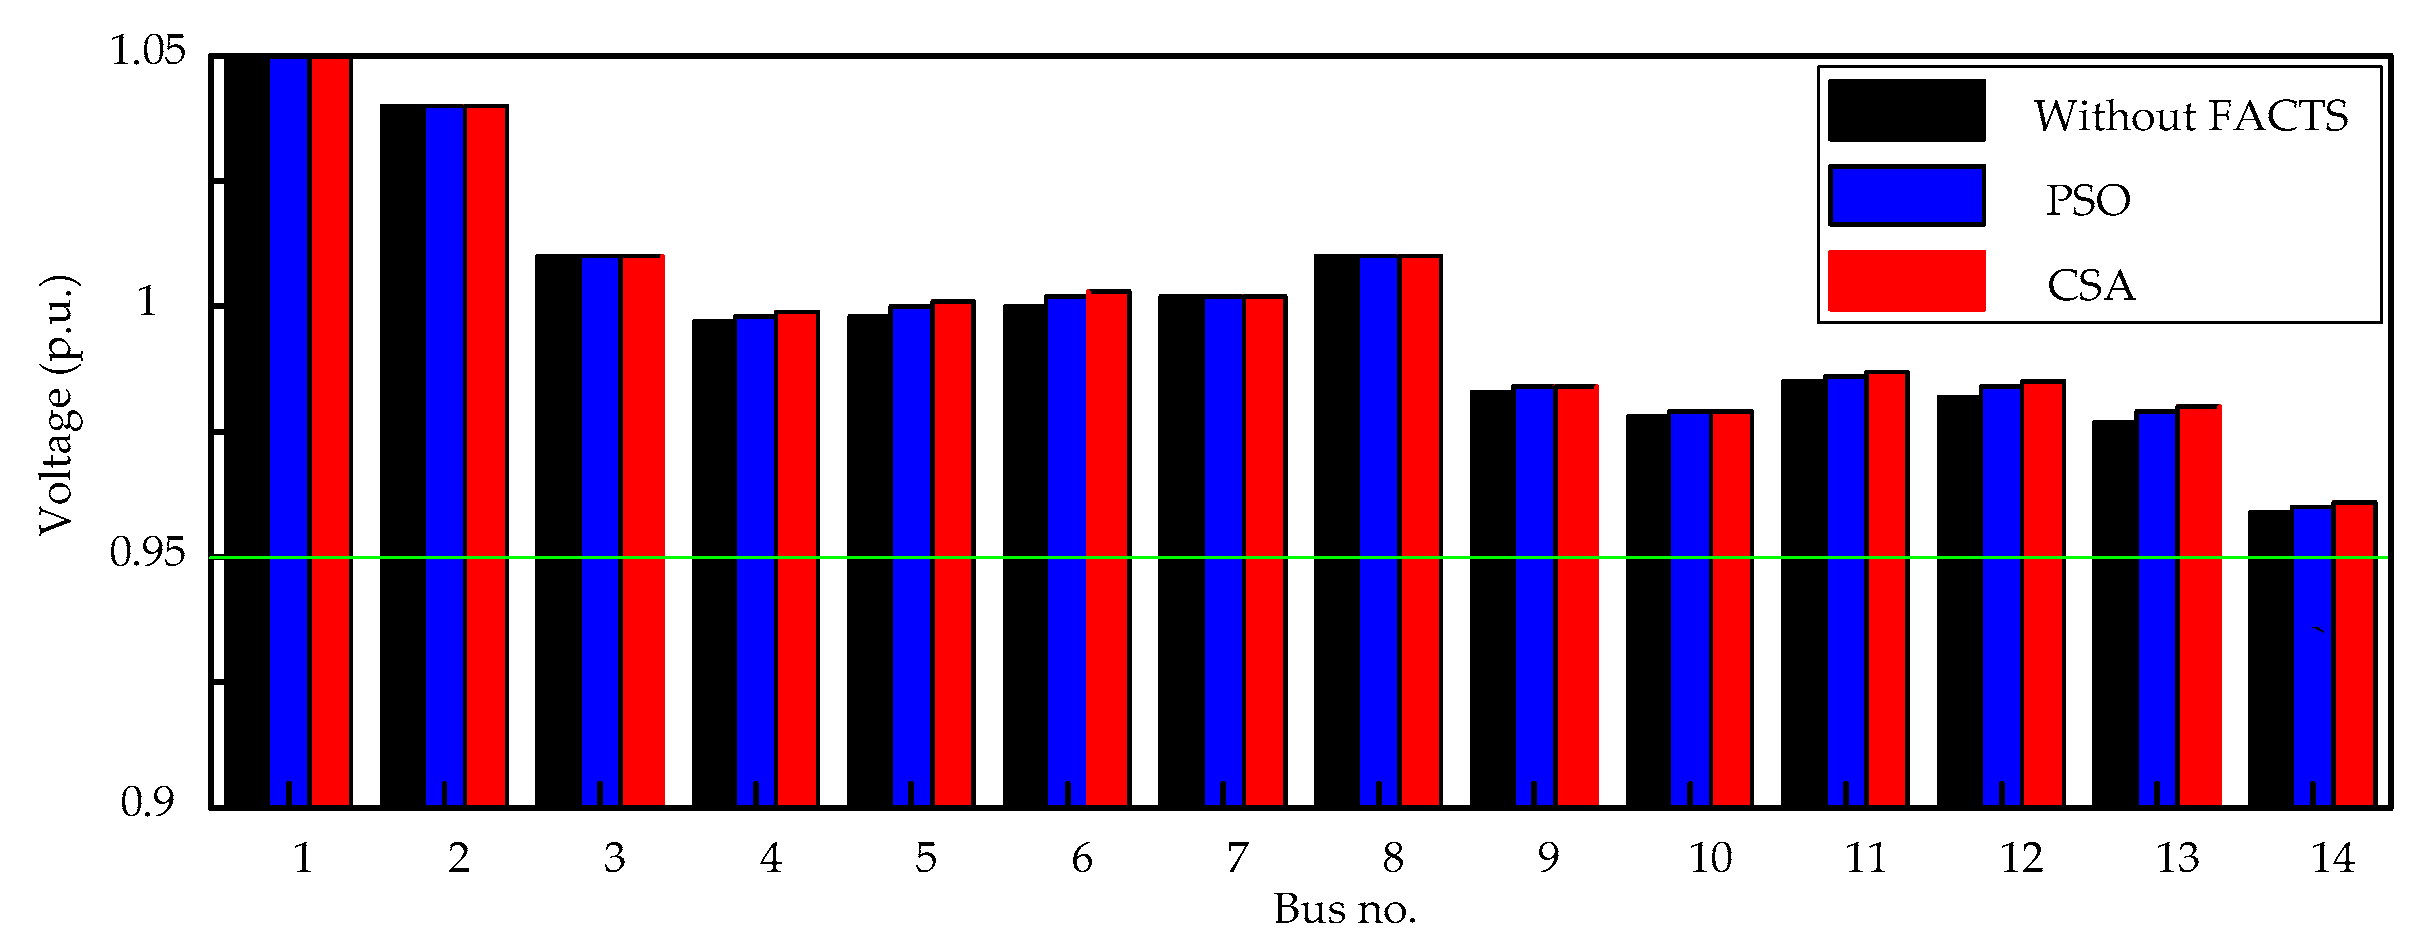
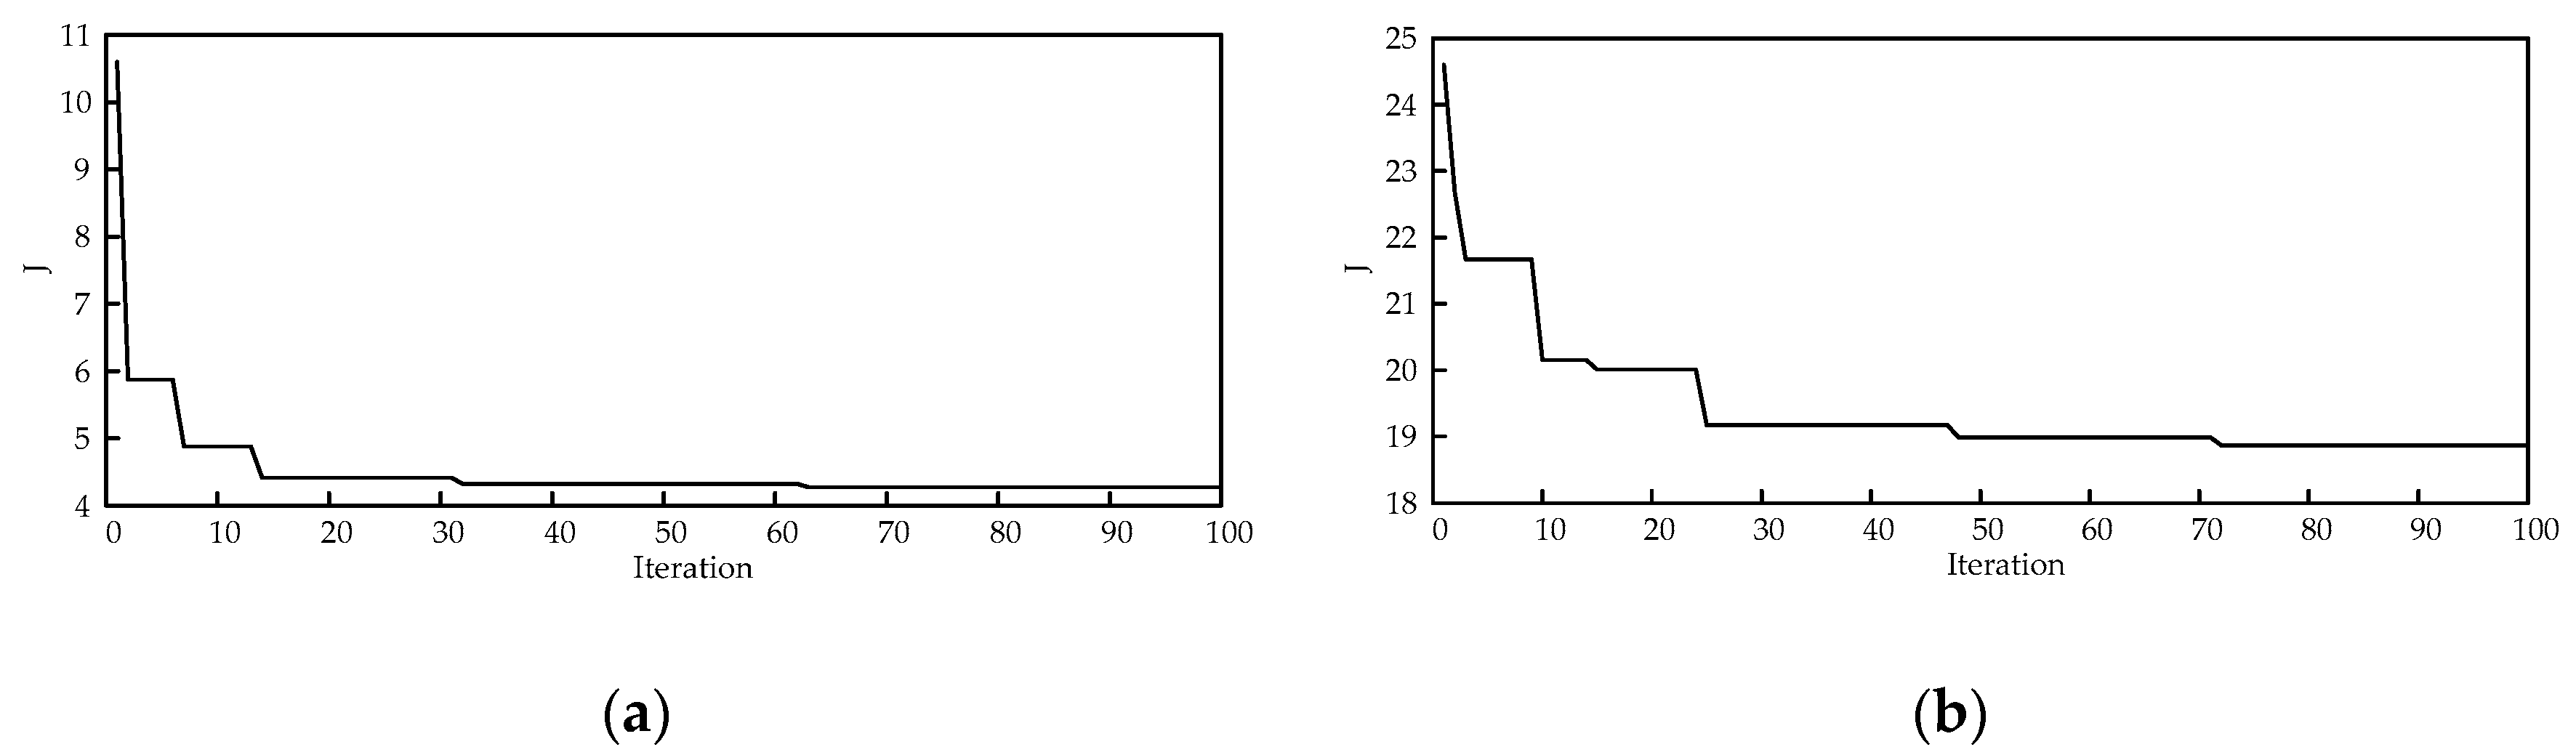
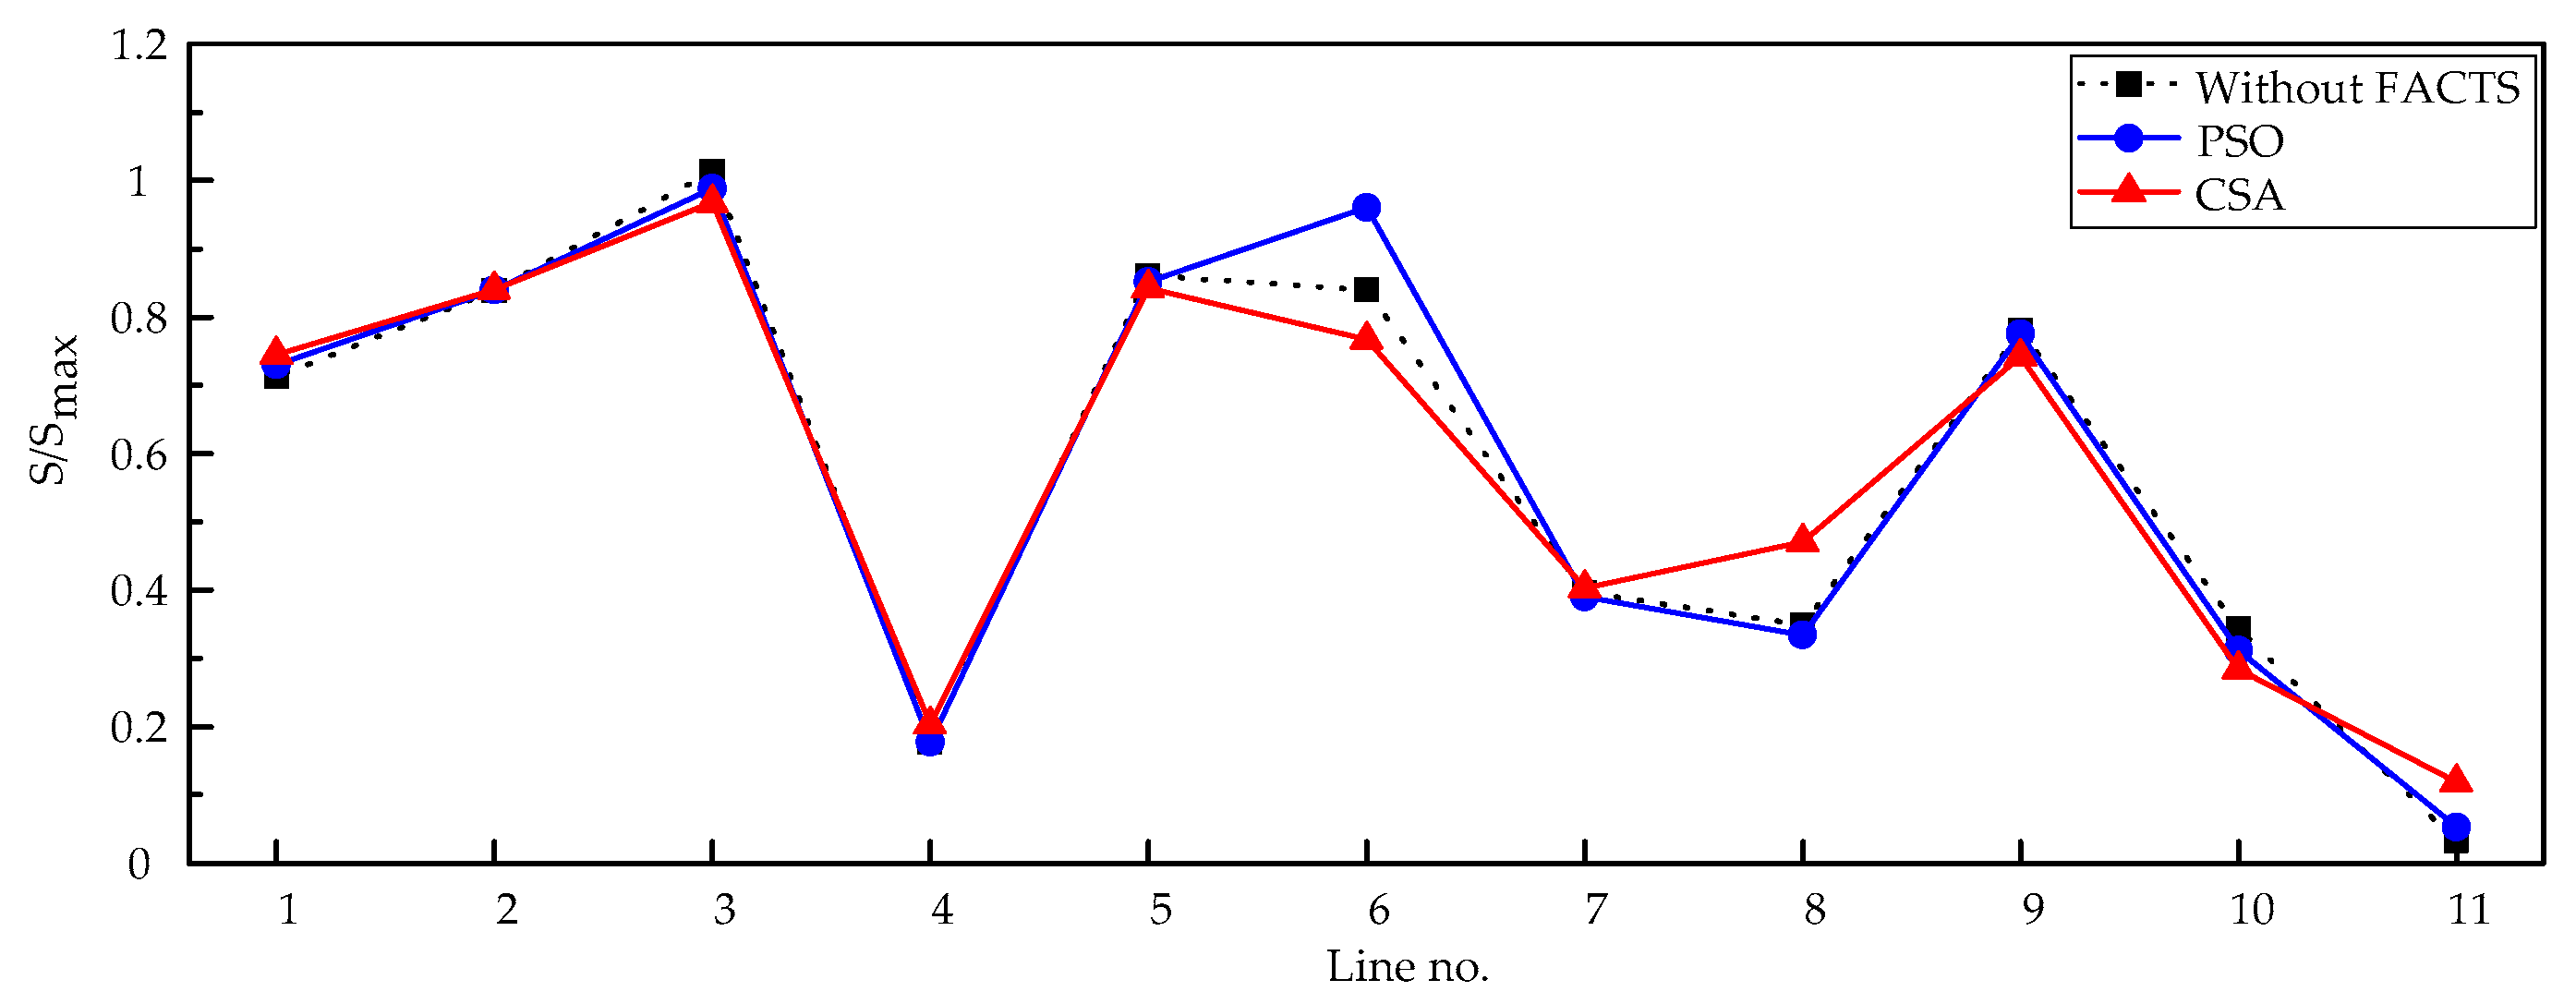
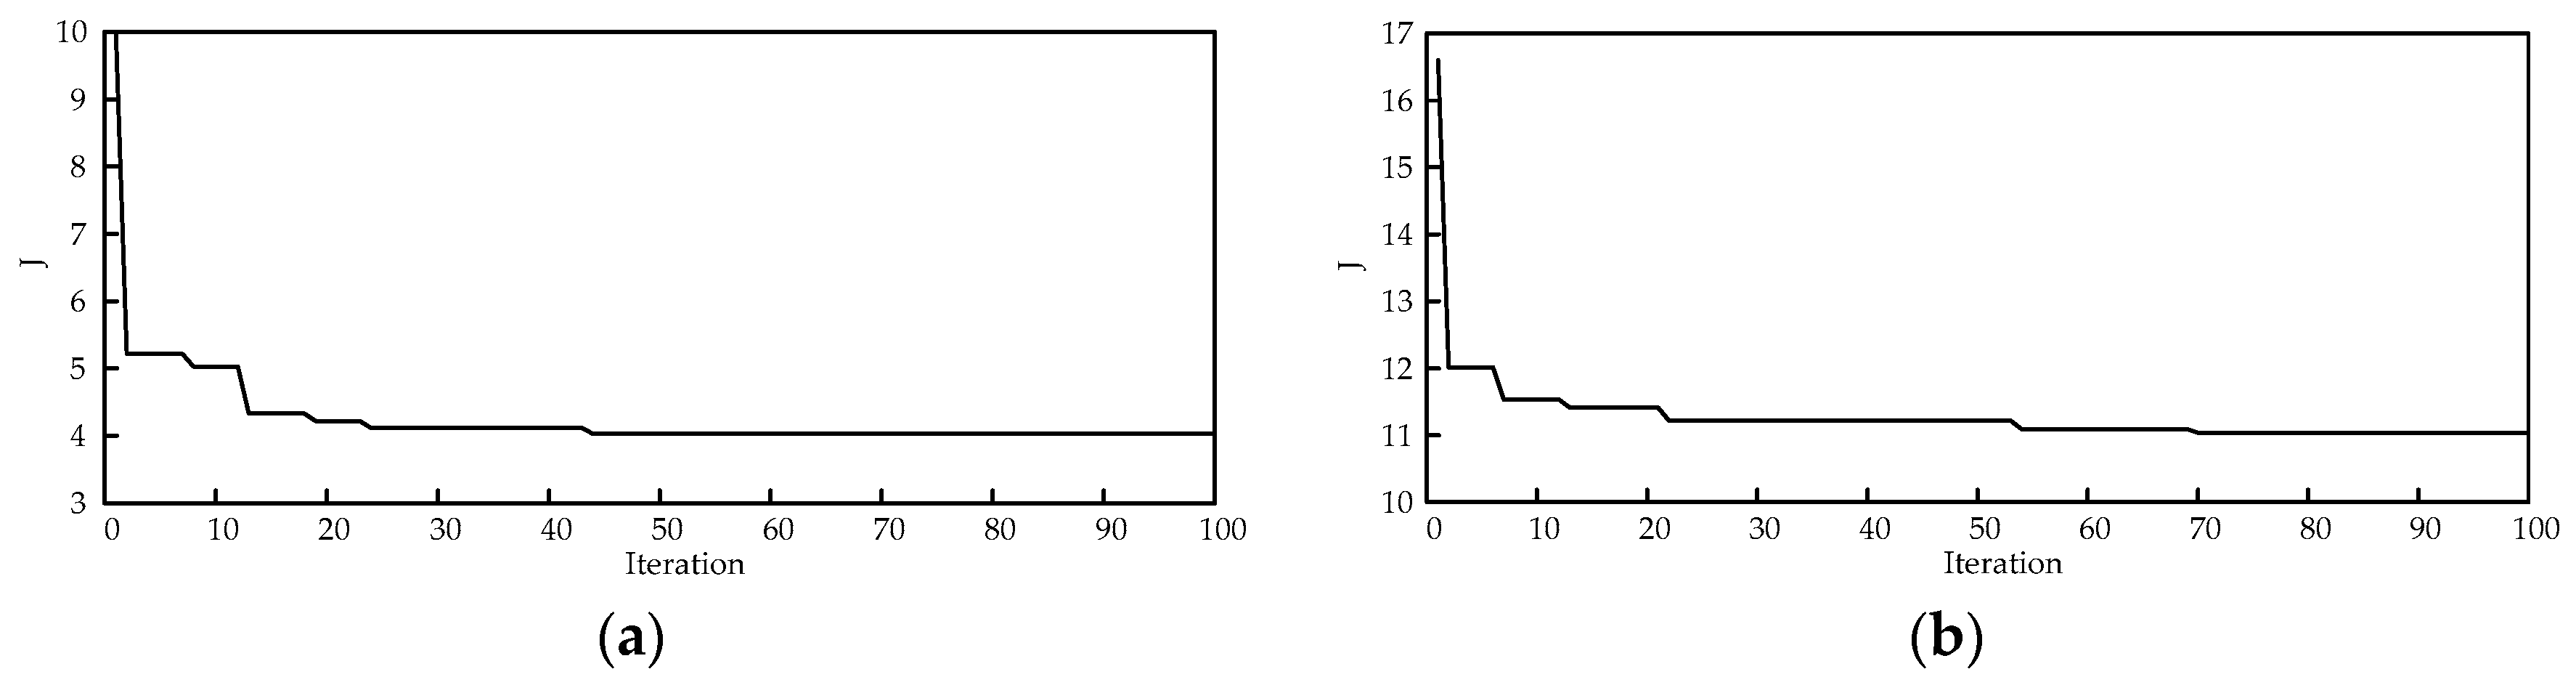
The results show that the MCA and the TVT are effective methods for determining the suitable candidate locations of TCSC and SVC, respectively, so as to reduce the search space for solution to the problem. The number of lines and buses which need to be investigated to determine the best locations of TCSCs and SVCs will be significantly decreased. Moreover, the results indicate that CSA outperforms PSO, proving its effectiveness and potential. Therefore, it can be concluded that the proposed hybrid approach is capable of finding out the best locations and settings of TCSCs and SVCs in such an effective way for enhancing power system static security by removing or alleviating the overloads and voltage violations under normal operation and even the most critical single line contingency conditions. Using this hybrid approach, the search space for solutions to the problem becomes limited, hence the computational burden has been lessened.
As future work, the methodology can be improved further if the performance of CSA is improved through its hybridization with other meta-heuristic algorithms. With the rapid increasing penetration of renewable energy sources [59] in the electricity market, particularly wind energy, the installation costs of FACTS devices and the effect of wind power generation need to be investigated in further research.

Acknowledgments

Both the National Natural Science Foundation of China (NSFC) under Grant No. 51477045 and the Outstanding Youth Project of Hunan Provincial Education Department under Grant No. 16B143 supported this work.

Author Contributions

All the authors have contributed in the article. Tong Kang performed the simulation and wrote the manuscript with guidance from Jiangang Yao and ThanhLong Duong. Tong Kang analyzed the data and results. Jiangang Yao, ThanhLong Duong, Shengjie Yang and Xiangqian Zhu reviewed the manuscript and provided valuable suggestions.

Conflicts of Interest

The authors declare no conflict of interest.

Appendix A

Table A1. The data of transmission line for modified IEEE 14-bus test system.
Line No.LineR (per unit)X (per unit)B (per unit)Limit Smax (MVA)
11–20.019380.059170.052850
21–50.054030.223040.049260
32–30.046990.197970.043850
42–40.058110.176320.03453
52–50.056950.173880.034653
63–40.067010.171030.012870
73–50.013350.04211080
84–700.20912040
94–900.55618020
105–600.25202070
116–110.094980.1989030
126–120.122910.25581030
136–130.066150.13027030
147–80.010.045060
157–900.11001060
169–100.031810.0845020
179–140.127110.27038030
1810–110.082050.19207020
1912–130.220920.19988020
2013–140.170930.34802020

References

  1. Singh, S.N. Location of FACTS devices for enhancing power systems’ security. In Proceedings of the 2001 Large Engineering Systems Conference on Power Engineering (LESCOPE ‘01), Halifax, NS, Canada, 11–13 July 2001; pp. 162–166. [Google Scholar]
  2. Kundur, P.; Paserba, J.; Ajjarapu, V.; Andersson, G.; Bose, A.; Canizares, C.; Hatziargyriou, N.; Hill, D.; Stankovic, A.; Taylor, C.; et al. Definition and classification of power system stability IEEE/GIGRE joint task force on stability terms and definitions. IEEE Trans. Power Syst. 2004, 19, 1387–1401. [Google Scholar]
  3. Song, S.H.; Lim, J.U.; Moon, S.I. Installation and operation of FACTS devices for enhancing steady-state security. Electr. Power Syst. Res. 2004, 70, 7–15. [Google Scholar] [CrossRef]
  4. Hagh, M.T.; Alipour, M.; Teimourzadeh, S. Application of HGSO to security based optimal placement and parameter setting of UPFC. Energy Convers. Manag. 2014, 86, 873–885. [Google Scholar] [CrossRef]
  5. Momoh, J.A.; Zhu, J.Z.; Boswell, G.D.; Hoffman, S. Power system security enhancement by OPF with phase shifter. IEEE Trans. Power Syst. 2001, 16, 287–293. [Google Scholar] [CrossRef]
  6. Wang, R.; Lasseter, R.H. Re-dispatching generation to increase power system security margin and support low voltage bus. IEEE Trans. Power Syst. 2000, 15, 496–501. [Google Scholar] [CrossRef]
  7. Affonso, C.M.; Silva, L.C.P.D. Potential benefits of implementing load management to improve power system security. Int. J. Electr. Power Energy Syst. 2010, 32, 704–710. [Google Scholar] [CrossRef]
  8. Hingorani, N.G. Power electronics in electric utilities: Role of power electronics in future power systems. Proc. IEEE 1988, 76, 481–482. [Google Scholar] [CrossRef]
  9. Shaheen, H.I.; Rashed, G.I.; Cheng, S.J. Application and comparison of computational intelligence techniques for optimal location and parameter setting of UPFC. Eng. Appl. Artif. Intell. 2010, 23, 203–216. [Google Scholar] [CrossRef]
  10. Duong, T.L.; Yao, J.G.; Truong, V.A. A new method for secured optimal power flow under normal and network contingencies via optimal location of TCSC. Int. J. Electr. Power Energy Syst. 2013, 52, 68–80. [Google Scholar] [CrossRef]
  11. Jordehi, A.R. Particle swarm optimization (PSO) for allocation of FACTS devices in electric transmission systems: A review. Renew. Sustain. Energy Rev. 2015, 52, 1260–1267. [Google Scholar] [CrossRef]
  12. Padmavathi, S.V.; Sahu, S.K.; Jayalaxmi, A. Modeling and simulation of static var compensator to enhance the power system security. In Proceedings of the 2013 IEEE Asia Pacific Conference on Postgraduate Research in Microelectronics and Electronics (PrimeAsia), Visakhapatnam, India, 19–21 December 2013; pp. 52–55. [Google Scholar]
  13. Etemad, R.; Navabi, R.; Shayanfar, H.A. Optimal location and setting of TCSC under single line contingency using Mixed Integer Nonlinear Programming. In Proceedings of the 2010 IEEE 9th International Conference on Environment and Electrical Engineering (EEEIC), Prague, Czech Republic, 16–19 May 2010; pp. 250–253. [Google Scholar]
  14. Yousefi, A.; Nguyen, T.T.; Zareipour, H.; Malik, O.P. Congestion management using demand response and FACTS devices. Int. J. Electr. Power Energy Syst. 2012, 37, 78–85. [Google Scholar] [CrossRef]
  15. Lima, F.G.M.; Galiana, F.D.; Kockar, I.; Munoz, J. Phase shifter placement in large-scale systems via mixed integer linear programming. IEEE Trans. Power Syst. 2004, 18, 1029–1034. [Google Scholar] [CrossRef]
  16. Sharma, A.; Chanana, S.; Parida, S. Combined optimal Location of FACTS controllers and loadability enhancement in competitive electricity markets using MILP. In Proceedings of the 2005 IEEE Power Engineering Society General Meeting, San Francisco, CA, USA, 12–16 June 2005; pp. 670–677. [Google Scholar]
  17. Sharma, A.K. Optimal number and location of TCSC and loadability enhancement in deregulated electricity markets using MINLP. Int. J. Emerg. Electr. Power Syst. 2006, 5. [Google Scholar] [CrossRef]
  18. Singh, J.G.; Singh, S.N.; Srivastava, S.C. Enhancement of power system security through optimal placement of TCSC and UPFC. In Proceedings of the 2007 IEEE Power Engineering Society General Meeting, Tampa, FL, USA, 24–28 June 2007; pp. 1–6. [Google Scholar]
  19. Vaidya, P.S.; Rajderkar, V.P. Optimal location of series FACTS devices for enhancing power system security. In Proceedings of the 2011 4th International Conference on Emerging Trends in Engineering and Technology (ICETET), Port Louis, Mauritius, 18–20 November 2011; pp. 185–190. [Google Scholar]
  20. Govind, J.; Energy, S.; Serd; Singh, S.N.; Srivastava, S.C.; Söder, L. Power system security enhancement by optimal placement of UPFC. In Proceedings of the 2010 IASTED Asian Conference on Power & Energy Systems (AsiaPES 2010), Phuket, Thailand, 24–26 November 2010; pp. 228–235. [Google Scholar]
  21. Besharat, H.; Taher, S.A. Congestion management by determining optimal location of TCSC in deregulated power systems. Int. J. Electr. Power Energy Syst. 2008, 30, 563–568. [Google Scholar] [CrossRef]
  22. Sundar, K.S.; Ravikumar, H.M. Selection of TCSC location for secured optimal power flow under normal and network contingencies. Int. J. Electr. Power Energy Syst. 2012, 34, 29–37. [Google Scholar] [CrossRef]
  23. Lu, Y.; Abur, A. Static security enhancement via optimal utilization of thyristor-controlled series capacitors. IEEE Trans. Power Syst. 2002, 17, 324–329. [Google Scholar] [CrossRef]
  24. Ullah, I.; Gawlik, W.; Palensky, P. Analysis of power network for line reactance variation to improve Total Transmission Capacity. Energies 2016, 9, 936. [Google Scholar] [CrossRef]
  25. Gerbex, S.; Cherkaoui, R.; Germond, A.J. Optimal location of FACTS devices to enhance power system security. In Proceedings of the 2003 IEEE Bologna Power Tech Conference Proceedings, Bologna, Italy, 23–26 June 2003; p. 7. [Google Scholar]
  26. Gerbex, S.; Cherkaoui, R.; Germond, A.J. Optimal location of multi-type FACTS devices in a power system by means of genetic algorithms. IEEE Trans. Power Syst. 2001, 21, 537–544. [Google Scholar] [CrossRef]
  27. Radu, D.; Besanger, Y. Blackout prevention by optimal insertion of FACTS devices in power systems. In Proceedings of the 2005 International Conference on Future Power Systems, Amsterdam, The Netherlands, 16–18 November 2005; p. 6. [Google Scholar]
  28. Ghanaati, O.; Seirafian, V.R.; Naderpour, I.; Teymouri, J. Power system security improvement with optimal placement of FACTS devices using genetic algorithms. In Proceedings of the 2011 IEEE International Conference on Computer Applications and Industrial Electronics (ICCAIE), Penang, Malaysia, 4–7 December 2011; pp. 126–131. [Google Scholar]
  29. Radu, D.; Besanger, Y. A multi-objective genetic algorithm approach to optimal allocation of multi-type FACTS devices for power systems security. In Proceedings of the 2006 IEEE Power Engineering Society General Meeting, Montreal, QC, Canada, 18–22 June 2006; p. 8. [Google Scholar]
  30. Ghahremani, E.; Kamwa, I. Analysing the effects of different types of FACTS devices on the steady-state performance of the Hydro-Québec network. IET Gener. Transm. Distrib. 2014, 8, 233–249. [Google Scholar] [CrossRef]
  31. Saravanan, M.; Slochanal, S.M.R.; Venkatesh, P.; Abraham, J.P.S. Application of particle swarm optimization technique for optimal FACTS devices considering cost of installation and system loadability. Electr. Power Syst. Res. 2007, 77, 276–283. [Google Scholar] [CrossRef]
  32. Rambabu, C.; Obulesu, Y.P.; Saibabu, C. Evolutionary algorithm-based technique for power system security enhancement. In Proceedings of the 2014 International Conference on Advances in Electrical Engineering (ICAEE), Vellore, India, 9–11 January 2014; pp. 1–5. [Google Scholar]
  33. Rashed, G.I.; Shaheen, H.I.; Duan, X.Z.; Cheng, S.J. Evolutionary optimization techniques for optimal location and parameter setting of TCSC under single line contingency. Appl. Math. Comput. 2008, 205, 133–147. [Google Scholar]
  34. Shaheen, H.I.; Rashed, G.I.; Cheng, S.J. Optimal location and parameter setting of UPFC for enhancing power system security based on differential evolution algorithm. Int. J. Electr. Power Energy Syst. 2011, 33, 94–105. [Google Scholar] [CrossRef]
  35. Rashed, G.I.; Sun, Y. Optimal placement of thyristor controlled series compensation for enhancing power system security based on computational intelligence techniques. Proc. Eng. Adv. Control Eng. Inf. Sci. 2011, 15, 908–914. [Google Scholar] [CrossRef]
  36. Sehiemy, R.A.E.; Sakr, W.; Azmy, A.M. Optimal allocation of TCSCs by adaptive DE algorithm. IET Gener. Transm. Dis. 2016, 10, 3844–3854. [Google Scholar]
  37. Ranganathan, S.; Kalavathi, M.S.; Christober, A.R.C. Self-adaptive firefly algorithm based multi-objectives for multi-type FACTS placement. IET Gener. Transm. Dis. 2016, 10, 2576–2584. [Google Scholar] [CrossRef]
  38. Jordehi, A.R. Optimal allocation of FACTS devices for static security enhancement in power systems via imperialistic competitive algorithm (ICA). Appl. Soft Comput. 2016, 48, 317–328. [Google Scholar] [CrossRef]
  39. Kavitha, K.; Neela, R. Optimal allocation of multi-type FACTS devices and its effect in enhancing system security using BBO, WIPSO & PSO. J. Electr. Syst. Inf. Technol. 2017, in press. [Google Scholar]
  40. Inkollu, S.R.; Kota, V.R. Optimal setting of FACTS devices for voltage stability improvement using PSO adaptive GSA hybrid algorithm. Eng. Sci. Technol. Int. J. 2016, 19, 1166–1176. [Google Scholar] [CrossRef]
  41. Yang, X.S.; Deb, S. Cuckoo search via Lévy flights. In Proceedings of the 2009 World Congress on Nature & Biologically Inspired Computing, 2009 (NaBIC 2009), Coimbatore, India, 9–11 December 2009; pp. 210–214. [Google Scholar]
  42. Yang, X.S.; Deb, S. Engineering optimisation by cuckoo search. Int. J. Math. Model. Numer. Optim. 2010, 1, 330–343. [Google Scholar] [CrossRef]
  43. Yang, X.S.; Deb, S. Cuckoo search: Recent advances and applications. Neural Comput. Appl. 2014, 24, 169–174. [Google Scholar] [CrossRef]
  44. Pavlyukevich, I. Lévy flights, non-local search and simulated annealing. J. Comput. Phys. 2007, 226, 1830–1844. [Google Scholar] [CrossRef]
  45. Shlesinger, M.F. Mathematical physics: Search research. Nature 2006, 443, 281–282. [Google Scholar] [CrossRef] [PubMed]
  46. Shehab, M.; Khader, A.T.; Al-Betar, M.A. A survey on applications and variants of the cuckoo search algorithm. Appl. Soft Comput. 2017, in press. [Google Scholar] [CrossRef]
  47. Song, Y.H.; Johns, A. Flexible AC Transmission Systems (FACTS); Institution of Engineering and Technology (IET): Stevenage, UK, 1999. [Google Scholar]
  48. Yan, P.; Sekar, A. Steady-state analysis of power system having multiple FACTS devices using line-flow-based equations. IET Proc. Gener. Transm. Dis. 2005, 152, 31–39. [Google Scholar] [CrossRef]
  49. Duong, T.L.; Yao, J.G.; Kang, T. Optimal location of thyristor-controlled-series-capacitor using min cut algorithm. TELKOMNIKA Indones. J. Electr. Eng. 2014, 12, 3649–3661. [Google Scholar] [CrossRef]
  50. Gotham, D.J.; Heydt, G.T. Power flow control and power flow studies for systems with FACTS devices. IEEE Trans. Power Syst. 1998, 13, 60–65. [Google Scholar] [CrossRef]
  51. Duong, T.L.; Yao, J.G.; Truong, V.A. Application of min cut algorithm for optimal location of FACTS devices considering system loadability and cost of installation. Int. J. Electr. Power Energy Syst. 2014, 63, 979–987. [Google Scholar] [CrossRef]
  52. Practical Optimization: A Gentle Introduction. Available online: http://www.sce.carleton.ca/faculty/chinneck/ (accessed on 2 March 2016).
  53. Chang, Y.C.; Chang, R.F. Maximization of transmission system loadability with optimal FACTS installation strategy. J. Electr. Eng. Technol. 2013, 8, 991–1001. [Google Scholar] [CrossRef]
  54. Esmin, A.A.A.; Lambert-Torres, G.; Souza, A.C.Z.D. A hybrid particle swarm optimization applied to loss power minimization. IEEE Trans. Power Syst. 2005, 20, 859–866. [Google Scholar] [CrossRef]
  55. De Souza, A.C.Z.; Cañizares, C.A.; Quintana, V.H. New techniques to speed up voltage collapse computations using tangent vectors. IEEE Trans. Power Syst. 1997, 12, 1380–1387. [Google Scholar] [CrossRef]
  56. Mantegna, R.N. Fast, accurate algorithm for numerical simulation of lévy stable stochastic processes. Phys. Rev. E 1994, 49, 4677–4683. [Google Scholar] [CrossRef]
  57. MATPOWER A MATLAB Power System Simulation Package, Version 4.0. Available online: http://www.pserc.cornell.edu//matpower/ (accessed on 7 June 2016).
  58. Praktiknjo, A. The value of lost load for sectoral load shedding measures: The German case with 51 sectors. Energies 2016, 9, 116. [Google Scholar] [CrossRef] [Green Version]
  59. Elsholkami, M.; Elkamel, A.; Vargas, F. Optimized integration of renewable energy technologies into Alberta’s oil sands industry. Comput. Chem. Eng. 2016, 90, 1–22. [Google Scholar] [CrossRef]
Figure 1. Modeling of TCSC and SVC: (a) The static model of TCSC installed between bus i and bus j; (b) Steady state model of SVC.
Energies 10 01305 g001
Figure 2. Modeling of a network with some cuts.
Energies 10 01305 g002
Figure 3. The modeling of an example power system using MCA: (a) An example power system with generators 13 MW at 1 and 7 MW at 2 and loads of 11 MW and 9 MW; (b) A modeling of an example power system.
Energies 10 01305 g003
Figure 4. The flowchart of the CSA and its application: (a) The flowchart of the CSA; (b) The flowchart of the proposed process of applying the CSA to solve the problem to enhance power system static security via optimal installations of TCSC and SVC.
Energies 10 01305 g004
Figure 5. The proposed hybrid approach for the power system static security enhancement via optimal installations of TCSC and SVC under normal operation and even the most critical single line contingency condition.
Energies 10 01305 g005
Figure 6. IEEE 6-bus test system.
Energies 10 01305 g006
Figure 7. Comparison of bus voltage profiles of IEEE 6-bus test system without and with FACTS installation by PSO and CSA for case 1.
Energies 10 01305 g007
Figure 8. Apparent power flow distributions of IEEE 6-bus test system without and with FACTS installation by PSO and CSA for case 1.
Energies 10 01305 g008
Figure 9. Comparison of bus voltage profiles of IEEE 6-bus test system without and with FACTS installation by PSO and CSA for case 2.
Energies 10 01305 g009
Figure 10. Apparent power flow distributions of IEEE 6-bus test system without and with FACTS installation by PSO and CSA for case 2.
Energies 10 01305 g010
Figure 11. The convergence characteristic of CSA for IEEE 6-bus test system: (a) The convergence characteristic of CSA for IEEE 6-bus test system with FACTS installation for case 1; (b) The convergence characteristic of CSA for IEEE 6-bus test system with FACTS installation for case 2.
Energies 10 01305 g011
Figure 12. Modified IEEE 14-bus test system.
Energies 10 01305 g012
Figure 13. Comparison of bus voltage profiles of modified IEEE 14-bus test system without and with FACTS installation by PSO and CSA for case 1.
Energies 10 01305 g013
Figure 14. Apparent power flow distributions of modified IEEE 14-bus test system without and with FACTS installation by PSO and CSA for case 1.
Energies 10 01305 g014
Figure 15. Comparison of bus voltage profiles of modified IEEE 14-bus test system without and with FACTS installation by PSO and CSA for case 2.
Energies 10 01305 g015
Figure 16. Apparent power flow distributions of modified IEEE 14-bus test system without and with FACTS installation by PSO and CSA for case 2.
Energies 10 01305 g016
Figure 17. The convergence characteristic of CSA for modified IEEE 14-bus test system: (a) The convergence characteristic of CSA for modified IEEE 14-bus test system with FACTS installation for case 1; (b) The convergence characteristic of CSA for modified IEEE 14-bus test system with FACTS installation for case 2.
Energies 10 01305 g017
Table 1. Apparent power flow through the transmission line of IEEE 6-bus test system without and with FACTS installation by PSO and CSA for case 1.
Line No.LineLimit Smax (MVA)Case 1
Without FACTSWith FACTS
PSOCSA
11–24028.5129.1929.81
21–46050.3450.3650.41
31–54040.55 139.5138.73
42–3407.067.108.13
52–46051.6851.1050.57
62–53025.1828.8023.00
72–69035.6935.0936.27
83–57024.4723.3932.97
93–68062.4462.0859.41
104–5206.876.235.68
115–6401.292.134.76
1 The bold values represent the apparent power flow limits violations of the corresponding lines.
Table 2. The minimum cut of IEEE 6-bus test system for case 1.
Line No.The Minimum Cut Passes Through
21–4
31–5
52–4
62–5
72–6
83–5
Table 3. The proper candidate locations for FACTS installation of IEEE 6-bus test system for case 1.
TCSCSVC
Line No.The Minimum Cut Passes ThroughLoop iBus No.
21–41–4–5–1No BVL 1
62–52–5–1–2
72–62–6–5–1–2
83–53–5–1–2–3
1 No bus voltage limit violations.
Table 4. Optimal TCSC and SVC installation results of IEEE 6-bus test system for case 1.
ParametersCase 1
Without FACTS With FACTS
PSOCSA
TCSCLocation-Line 2–5Line 3–5
XTCSC (p.u.)-−0.06−0.13
SVCLocation---
QSVC (MVar)---
J7.63044.69734.0287
Table 5. Apparent power flow through the transmission line of IEEE 6-bus test system without and with FACTS installation by PSO and CSA for case 2.
Line No.LineLimit Smax (MVA)Case 2: Outage of Line 1–4
Without FACTSWith FACTS
PSOCSA
11–24060.48 160.3360.06
31–54053.9753.0451.12
42–3407.247.177.53
52–46090.8567.7666.48
62–53026.1322.0321.67
72–69035.3535.0635.29
83–57025.8224.1033.33
93–68063.3362.5158.89
104–5205.5911.9411.75
115–6404.022.736.87
1 The bold values represent the apparent power flow limits violations of the corresponding lines.
Table 6. The minimum cut of IEEE 6-bus test system for case 2.
Line No.The Minimum Cut Passes Through
31–5
52–4
62–5
72–6
83–5
Table 7. The proper candidate locations for FACTS installation of IEEE 6-bus test system for case 2.
TCSCSVC
Line No.The Minimum Cut Passes ThroughLoop iBus No.
62–52–5–1–24
72–62–6–5–1–2
83–53–5–1–2–3
Table 8. Optimal TCSC and SVC installation results of IEEE 6-bus test system for case 2.
ParametersCase 2: Outage of Line 1–4
Without FACTSWith FACTS
PSOCSA
TCSCLocation-Line 2–5Line 3–5
XTCSC (p.u.)-0.042−0.1456
SVCLocation-Bus 4Bus 4
QSVC (MVar)-−58.67−54.73
J19.349311.979011.0428
Table 9. Apparent power flow through the transmission line of modified IEEE 14-bus test system without and with FACTS installation by PSO and CSA for case 1.
Line No.LineLimit Smax (MVA)Case 1
Without FACTSWith FACTS
PSOCSA
11–25055.03 147.5543.84
21–56042.2049.5353.20
32–35031.5230.4129.85
42–45340.3938.0036.82
52–55335.7532.6131.07
63–4708.307.226.75
73–58025.9329.3931.19
84–74010.1610.5010.65
94–92013.8013.7913.79
105–67046.7047.0647.23
116–11306.816.997.08
126–12308.428.458.46
136–133018.7318.8518.90
147–86041.9641.7441.66
157–96048.5648.2848.15
169–102011.4111.2311.15
179–143013.7113.6013.55
1810–11204.524.624.65
1912–13201.711.731.75
2013–14204.564.684.75
1 The bold values represent the apparent power flow limits violations of the corresponding lines.
Table 10. The minimum cut of modified IEEE 14-bus test system for case 1.
Line No.The Minimum Cut Passes Through
11–2
21–5
Table 11. The proper candidate locations for FACTS installation of modified IEEE 14-bus test system for case 1.
TCSCSVC
Line No.The Minimum Cut Passes ThroughLoop iBus No.
21–51–5–2–1No BVL 1
1 No bus voltage limit violations.
Table 12. Optimal TCSC and SVC installation results of modified IEEE 14-bus test system for case 1.
ParametersCase 1
Without FACTSWith FACTS
PSOCSA
TCSCLocation-Line 1–5Line 1–5
XTCSC (p.u.)-−0.0573882−0.0803836
SVCLocation---
QSVC (MVar)---
J5.07994.44084.2714
Table 13. Apparent power flow through the transmission line of modified IEEE 14-bus test system without and with FACTS installation by PSO and CSA for case 2.
Line No.LineLimit Smax (MVA)Case 2: Outage of Line 1–5
Without FACTSWith FACTS
PSOCSA
11–25097.71 197.4997.50
32–35037.9641.0141.12
42–45353.9251.5551.45
52–55354.0251.7451.64
63–47016.0918.7318.75
73–58015.5213.2613.05
84–7407.988.378.38
94–92013.7313.0613.00
105–67044.2142.0841.91
116–11305.306.146.20
126–12308.227.777.74
136–133018.0116.7016.64
147–86044.3841.3141.18
157–96050.5847.9247.78
169–102012.5612.2212.19
179–143014.4616.0416.46
1810–11203.774.384.43
1912–13201.490.840.82
2013–14203.563.083.40
1 The bold values represent the apparent power flow limits violations of the corresponding lines.
Table 14. The minimum cut of modified IEEE 14-bus test system for case 2.
Line No.The Minimum Cut Passes Through
42–4
52–5
63–4
Table 15. The proper candidate locations for FACTS installation of modified IEEE 14-bus test system for case 2.
TCSCSVC
Line No.The Minimum Cut Passes ThroughLoop iBus No.
63–42–4–3–214
2–5–4–3–2
3–4–2–3
Table 16. Optimal TCSC and SVC installation results of modified IEEE 14-bus test system for case 2.
ParametersCase 2: Outage of Line 1–5
Without FACTSWith FACTS
PSOCSA
TCSCLocation-Line 3–4Line 3–4
XTCSC (p.u.)-−0.0891408−0.0923562
SVCLocation-Bus 14Bus 14
QSVC (MVar)-−52.12−16.43
J20.662418.880818.8678
Table 17. Simulation time of two test systems with FACTS installation by different techniques for case 2.
Test SystemsSimulation Time (s)
PSOCSAMCA_TVT_PSOMCA_TVT_CSA
IEEE 6-bus70.827156.24263.215456.57623.215444.6155
59.791647.8309
Modified IEEE 14-bus82.375369.85319.642864.22179.642850.5762
73.864560.2180

