
Cost Projection of State of the Art Lithium-Ion Batteries for Electric Vehicles Up to 2030
by
 ,
,
Gert Berckmans
* ,
,
Maarten Messagie
,
Jelle Smekens
,
Noshin Omar
,
Lieselot Vanhaverbeke
and
Joeri Van Mierlo

MOBI Research Group, Vrije Universiteit Brussel, Pleinlaan 2, 1050 Brussels, Belgium
*
Author to whom correspondence should be addressed.
Energies 2017, 10(9), 1314; https://doi.org/10.3390/en10091314
Submission received: 20 July 2017
/
Revised: 22 August 2017
/
Accepted: 24 August 2017
/
Published: 1 September 2017
(This article belongs to the Section D: Energy Storage and Application)
Abstract
:The negative impact of the automotive industry on climate change can be tackled by changing from fossil driven vehicles towards battery electric vehicles with no tailpipe emissions. However their adoption mainly depends on the willingness to pay for the extra cost of the traction battery. The goal of this paper is to predict the cost of a battery pack in 2030 when considering two aspects: firstly a decade of research will ensure an improvement in material sciences altering a battery’s chemical composition. Secondly by considering the price erosion due to the production cost optimization, by maturing of the market and by evolving towards to a mass-manufacturing situation. The cost of a lithium Nickel Manganese Cobalt Oxide (NMC) battery (Cathode: NMC 6:2:2 ; Anode: graphite) as well as silicon based lithium-ion battery (Cathode: NMC 6:2:2 ; Anode: silicon alloy), expected to be on the market in 10 years, will be predicted to tackle the first aspect. The second aspect will be considered by combining process-based cost calculations with learning curves, which takes the increasing battery market into account. The 100 dollar/kWh sales barrier will be reached respectively between 2020–2025 for silicon based lithium-ion batteries and 2025–2030 for NMC batteries, which will give a boost to global electric vehicle adoption.
1. Introduction
Throughout the last decades, the emission of greenhouse gases have increased dramatically; however, their negative impact on the climate has been demonstrated [1,2]. To limit these adversary effects of climate change, several actions are undertaken on a worldwide scale, for example it has been agreed at COP21 in Paris to keep the temperature rise limited to maximum 2 °C [3]. Additionally, steps are undertaken by the European Commission to have a cleaner environment by setting new ambitious environmental targets. For example the EU target is to have a CO2 reduction by 20% compared to the levels of 2008 as stated in their white paper [4]. Improving urban air quality and reducing its impact on climate change of transport comes down to (1) reducing the total consumption of kilometers by improving efficiency of the service and (2) providing the remainder of needed transport without fossil fuels. A technological option to substitute fossil based km is to use battery electric vehicles, powered by renewable fuels. To ensure a minimum of driving range a large, expensive battery is required for battery electric vehicles, explaining their high cost which is limiting its mass-adoption. The cost and performance of the battery, the most expensive component in a vehicle, is directly linked with the adaption of electric vehicles. The adoption towards battery electric vehicles mainly depends on the willingness to pay for the extra cost of the traction battery. Therefore will this paper study the price evolution of an automotive battery up to 2030 and answer the following questions. What is thus a reasonable price of a 1 kWh lithium battery in 2030? Can we expect an erosion of the price due to a production cost optimization in a mass-manufacturing situation?
In an initial phase, the current market of electric and hybrid vehicles is analyzed. Additionally, its sales up to 2030 are predicted based on historical data. Cost of a battery is inversely linked with the growth of the market of electric vehicles, since larger production quantities leads to lowers cost per unit. In this study this effect will not be taken into account, resulting in an underestimation or a very conservative estimation of the amount of EVs. In a second phase the cost and sales price of a battery are calculated and predicted up to 2030 based upon an innovative methodology. This innovative methodology will combine process-based cost modeling with learning curves to cope with the evolution from an immature to a mature battery market. Another innovative aspect is that current state of the art battery chemistries will be used alongside with battery chemistries which are believed to become the state of the art in 2030. A roadmap of future battery technologies will be presented, out of which a promising battery chemistry will be chosen.
2. Market and Technology Landscape of Electric Vehicles
This section will analyze the current global automotive market as well as the technological split between internal combustion driven vehicles, hybrid and electric vehicles. The current technological split is expected to change due to firstly the increased awareness regarding climate change and secondly the decreasing cost of electric vehicles. Based on historical sales figures a prediction of global sales of vehicles up to 2030 will be made, including the evolution of the technological split.
2.1. State of the Art—BEV
An overview of the most sold BEVs in the small and medium-large segment of 2016 are shown in Table 1, adapted from [5]. This is a non-exhaustive list, for example vehicles which do not reach 100 km/h are omitted as well as vehicles sold in low quantities. It can be seen that in the segment of small cars, which are mainly city cars, rather small batteries are used with an average energy content of 18.2 kWh and a range of 150 km. The average values are quite coherent since the median gives comparable results. In this segment rather small batteries are used due to two reasons. Firstly a battery represents 75% of an EVs powertrain cost [6], which means that implementing a bigger battery would significantly increase the overall cost. Secondly, because space is often limited in a city car to place a bigger battery. In the segment of medium to large cars it is clear from Table 1 that bigger batteries are used, namely on average a battery energy content of 36.2 kWh and of course a larger average range of 231 km. However, due to the large battery of the Tesla’s the average can be misleading and the median gives a better representation of the current market, meaning an energy content of 24.2 kWh and a range of 190 km. This is consistent with the higher cost and size of these vehicles.
2.2. State of the Art—HEV
In Table 2 an overview of the 10 most European sold hybrid electric vehicles (HEV) in 2016 are given [7]. The list consists solely of high-end vehicles in which the electrical range is quite limited except the BMW i3. This is due to the current tax reductions for hybrid vehicles in several European countries, which use the electric power to reduce their average fuel consumption and emissions on which taxes are generally based. In this table the BMW i3 is also included, which has a high range and a large battery pack since it is a BEV with a range extender. Therefore it is more representable for the HEV category to use the median value to get a better insight in the battery energy contents and driving ranges used in the HEV segment. The average value does not give a good representation due to the influence of the BMW i3 and its large range and batteries since it is a BEV with a range extender. Therefore also the median is given. Small battery packs are used which can be seen from their low median battery energy content of 9 kWh and limited median driving range of 41 km.
The mass-adoption of BEVs and HEVs are somehow limited due to two reasons. Firstly the high initial cost of HEV and BEV, mainly because of the high purchasing cost of the battery pack [8]. A second problem with electric vehicles is range anxiety, meaning the fear of running out of fuel. Many research efforts are ongoing to improve both problems of which the first one will be more deeply discussed in Section 3. In literature [9,10,11,12,13,14,15] the range anxiety is identified as mainly a psychological barrier since most people drive less kilometers a day than the range of current EVs. This problem is enhanced by the long charging time of an EV as well as the lack of abundantly available charging stations for electric vehicles. Therefore, increasing the battery energy content to increase its range to about 500 km, so having a comparable battery capacity as a Tesla of about 75–90 kWh will significantly speed up the adoption of EVs. To implement such batteries their energy density has to increase significantly, since battery with such high energy content are to large to fit in small city cars.
2.3. Electric Vehicle Prediction Up to 2030
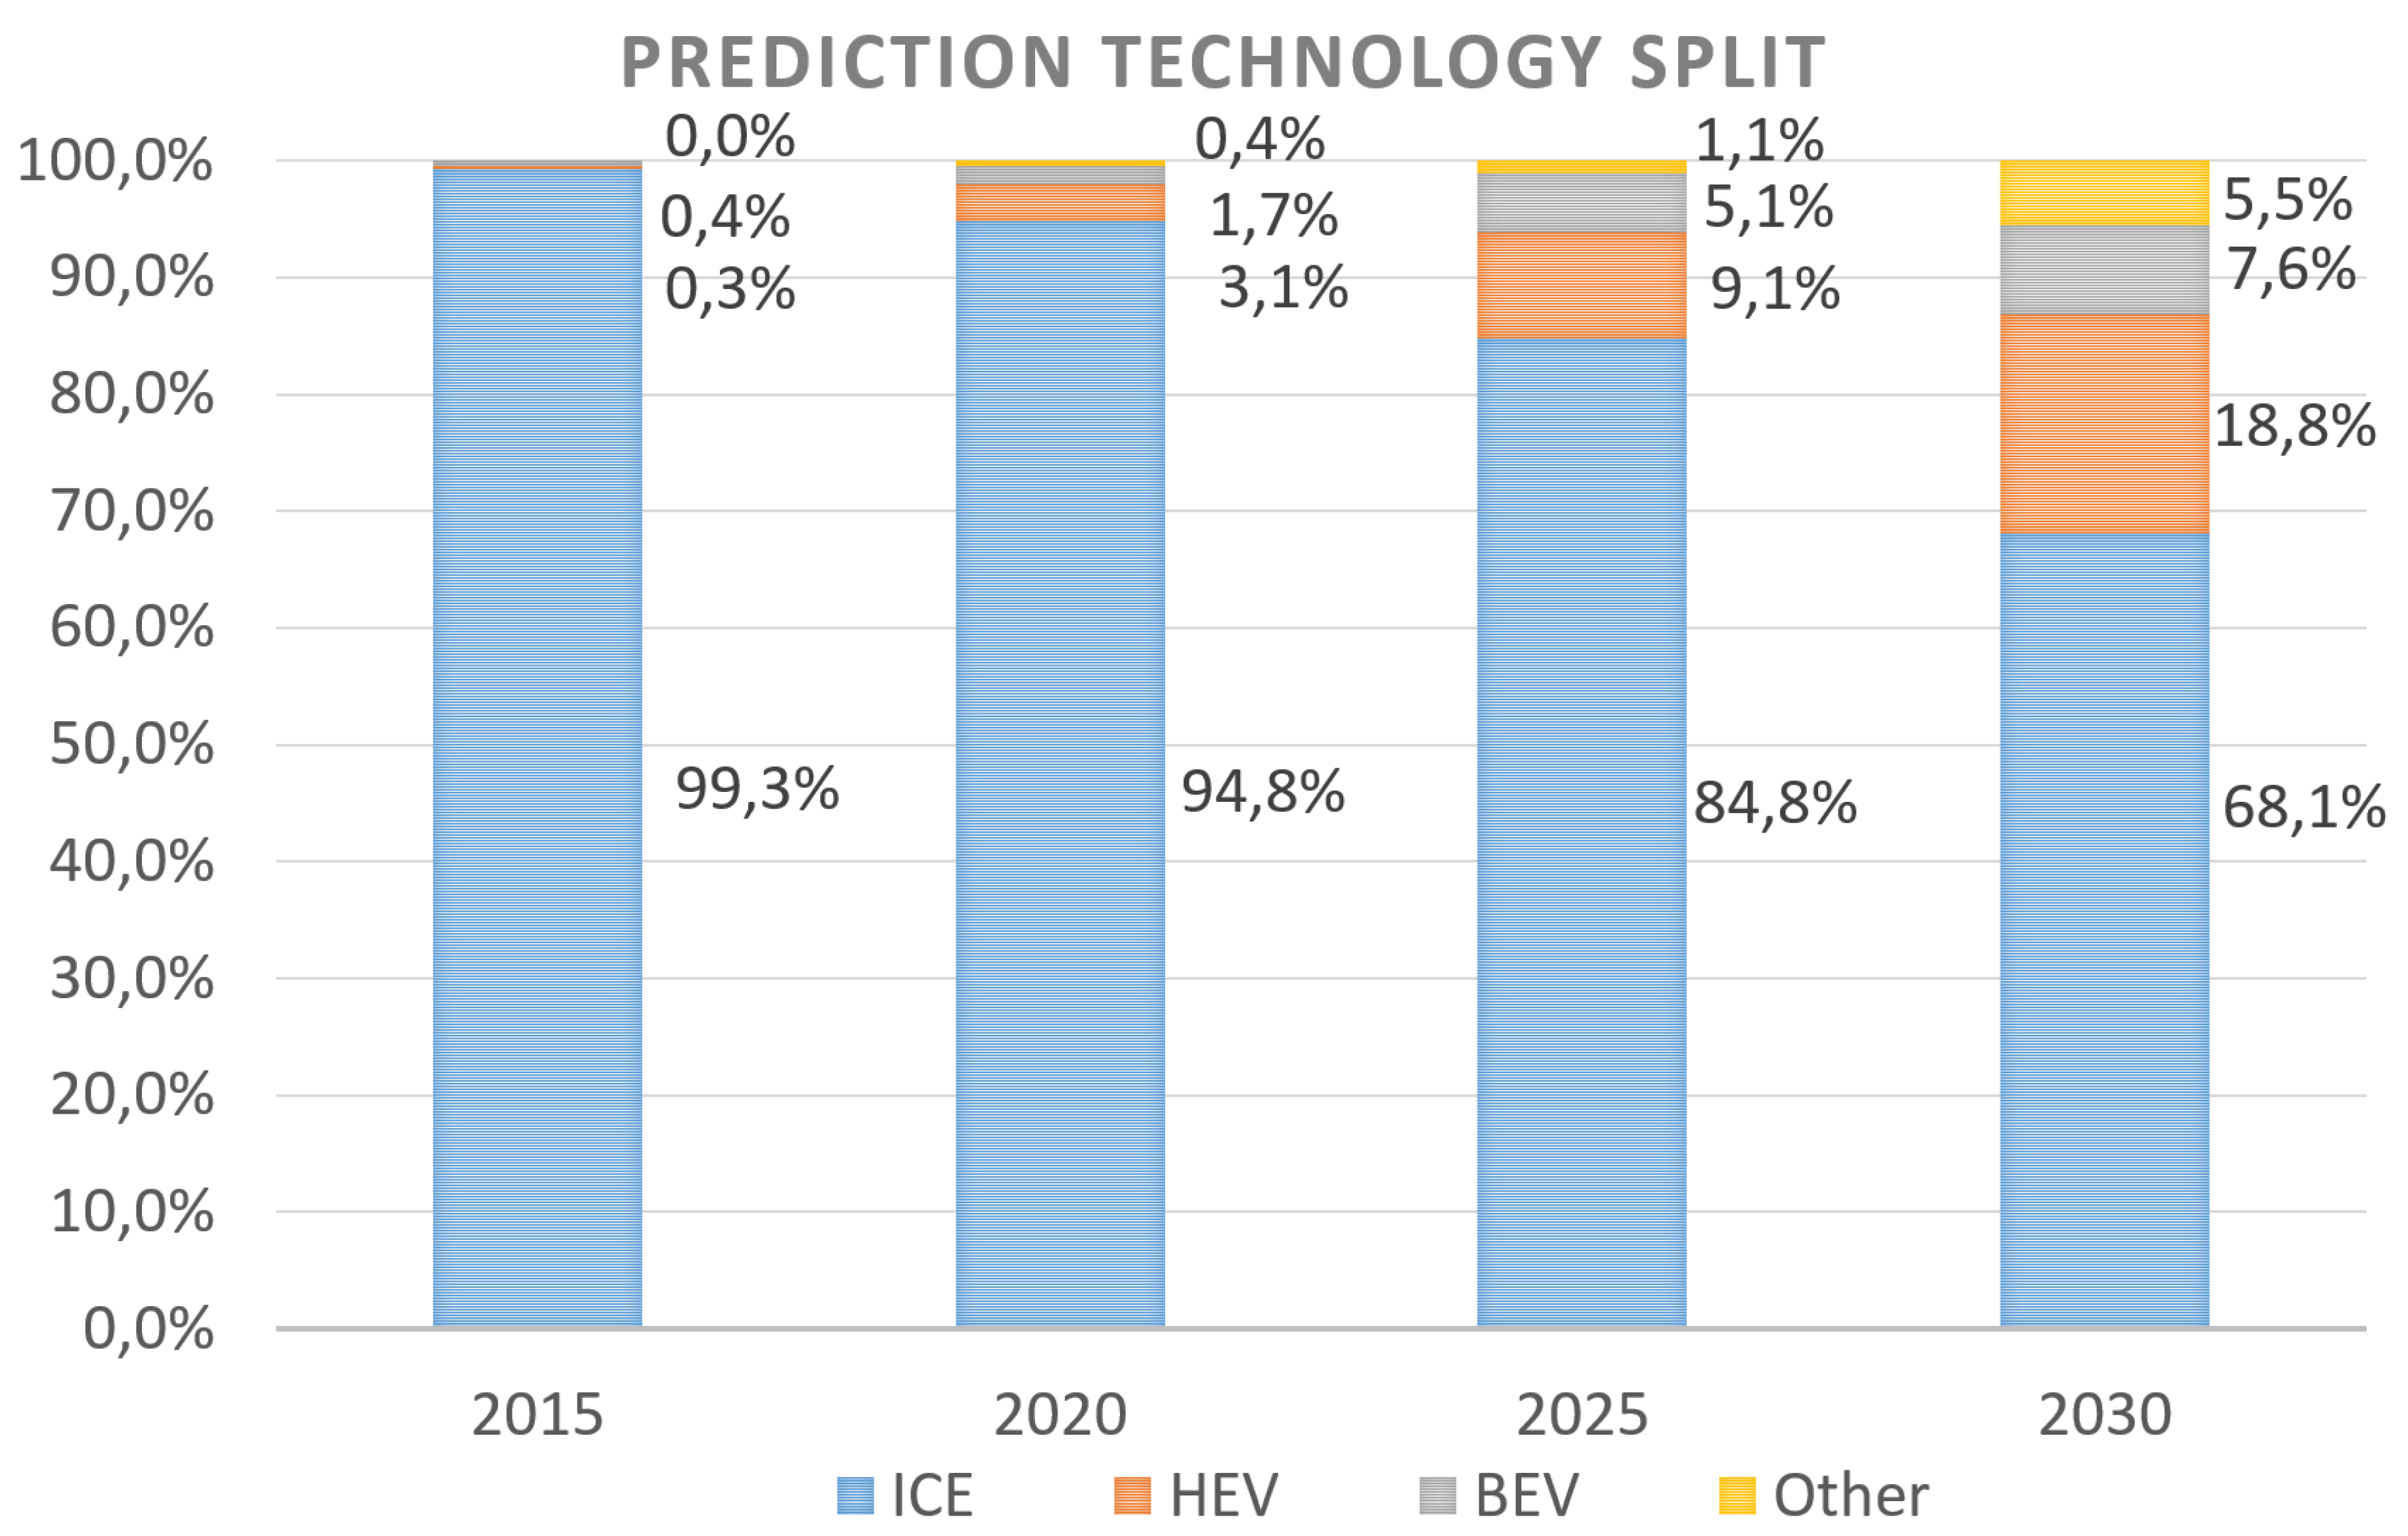
The following paragraph will make a prediction of the global sales of electric, hybrid, classical combustion engine vehicles as well as other types of vehicles such as compressed natural gas (CNG), liquefied petroleum gas (LPG), fuel cells vehicles, which will be combined in the category others. Based upon a literature review [16,17,18,19,20,21] a prediction of the technology split is shown in Figure 1. In 2015 the global sales are still dominated (99.3%) by the classical combustion engine(ICE) based vehicles, even by 2030 more ICE than electric vehicles are sold however its dominance decreases significantly. Due to the increasing effort of the automotive manufacturers more and more HEV and BEV models are available on the market, increasing the choice for consumers, which was quite limited up to in the past. In 2030 25% of all vehicles sold will be either fully electric or hybrid, requiring an enormous amount of batteries. To get a better idea of the quantities this analysis is expanded by combining the previous figure with the expected global sales of vehicles predictions worldwide, which can be seen in Figure 2. Only limited sources are available in literature [22,23,24,25,26,27,28] which predict the global sales up to 2030. Therefore it was opted to make a prediction based upon the sales in the past, more specifically the global sales between 2010 and 2015 were analyzed [28]. Since only a small period of time is analyzed a linear approximation is used, predicting in 2020, 2025, 2030 receptively 107, 122 and 138 million vehicles sold yearly. The linear approximation can be clearly seen in the increase of the total amount of vehicles sold, Figure 2. The peak of ICE vehicles will be reached in 2020 with a sales of more than 100 millions. By 2030 roughly 10 million BEVs and 20 million HEVs will be sold on a yearly. When assuming 75–90 kWh is needed for BEV, HEV will require half of the capacity roughly 23 billion kWh of battery are required yearly which is a very large potential market for battery manufactures.
3. Battery Discussion
Batteries have become an indispensable product in society; they are being used in a variety of products ranging from cellphones up to electric vehicles. The most popular battery technologies are the lithium-ion batteries due to their high energy- and power-density as well as their high lifetime compared to other types [29].
The electrochemical storage of energy in a lithium-ion battery is achieved through intercalation in the positive and negative electrode, shown by Equation (1) [30].
With:
| The insertion material | |
| Lithium inserted in material | |
| An electron | |
| A lithium-ion |
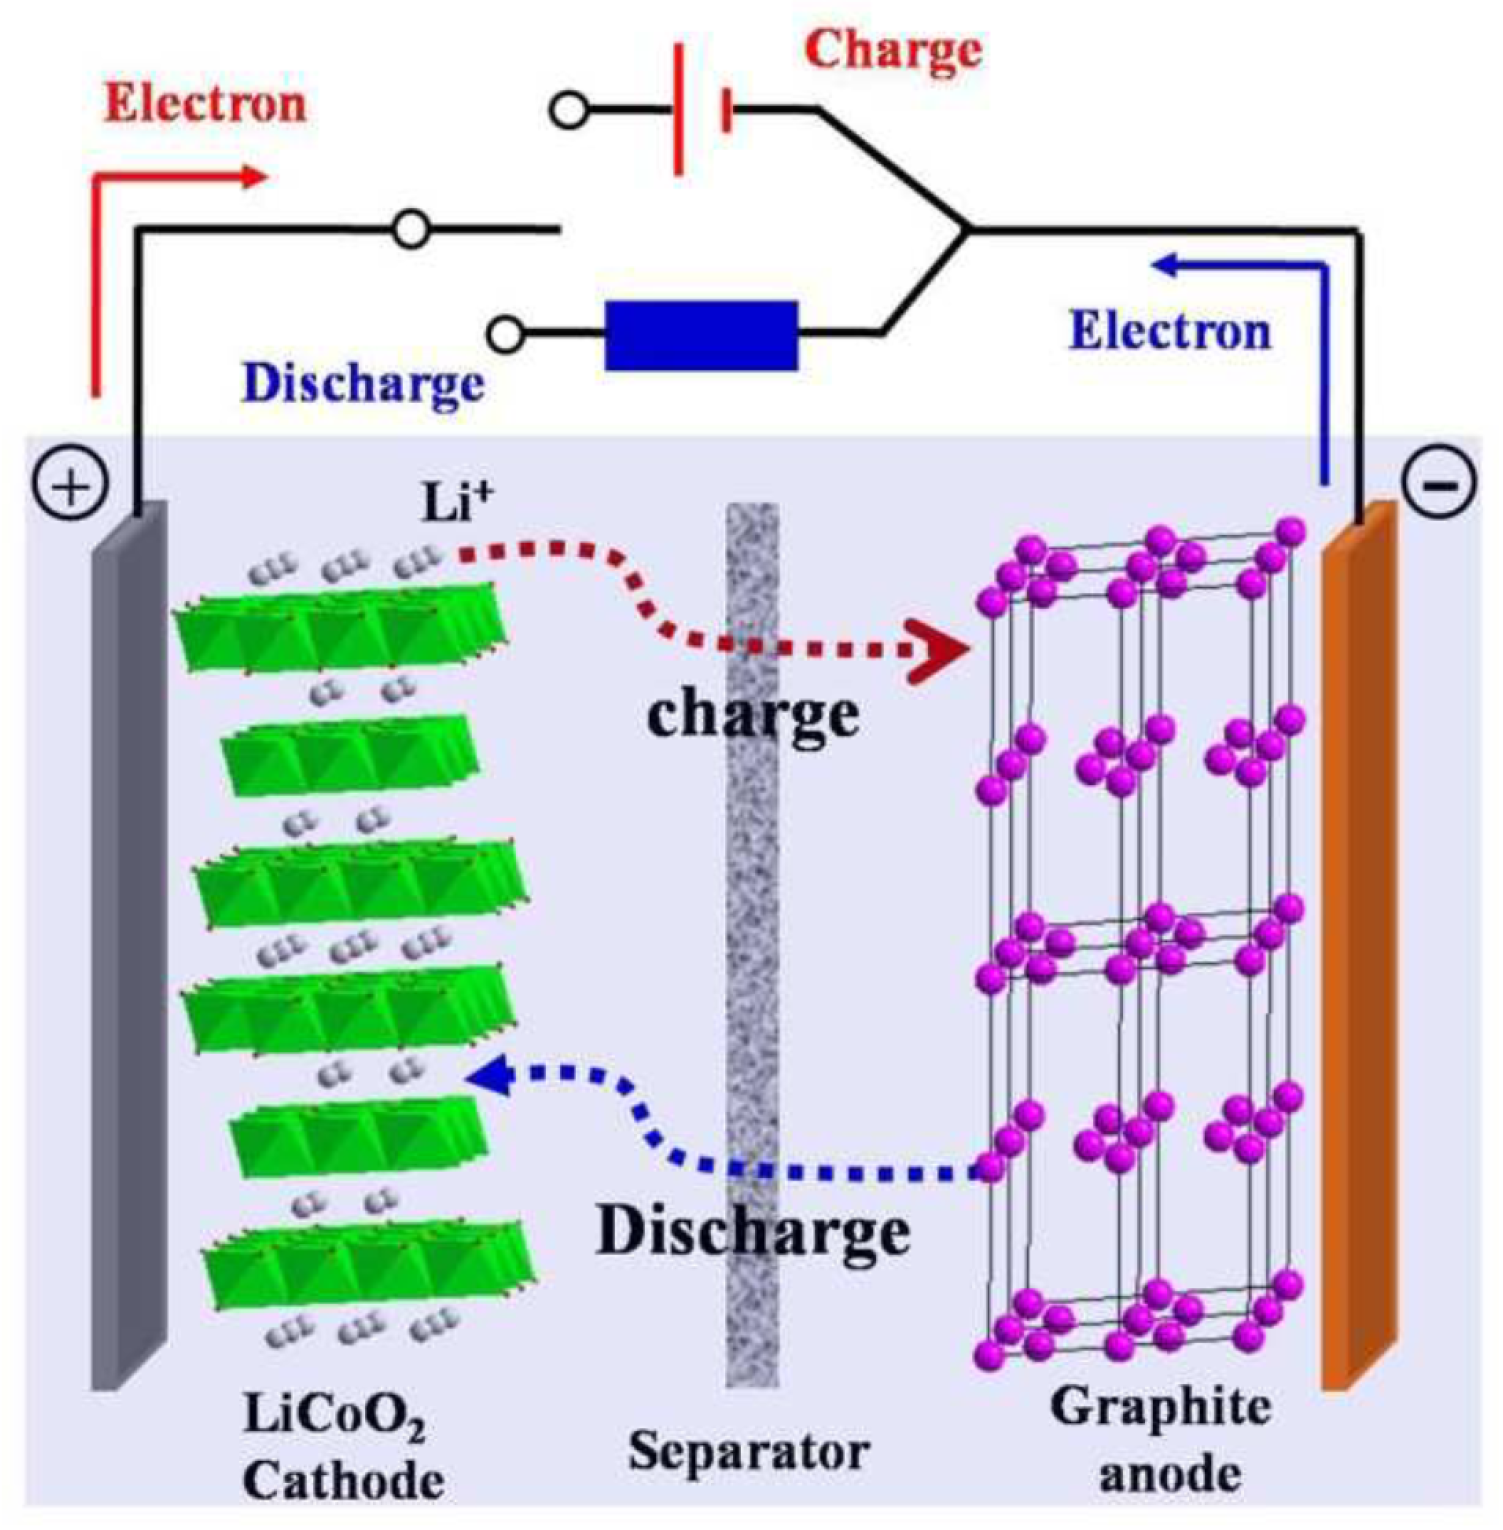
The functioning of a lithium-ion battery is summarized below; however, a more extended explanation can be found in literature, for example [32,33]. The intercalation of lithium-ions in the electrodes is the main reason for its long lifetime of this type of batteries. However, lithium undergoes numerous side-reactions, reducing the concentration of lithium available for intercalation, causing the battery to decrease in capacity over lifetime. A schematic illustration of a lithium-ion battery’s functioning is shown in Figure 3. A battery consists of four main components: a negative electrode or often called an anode, a positive electrode or often called a cathode, an electrolyte and a separator. The variety and properties of several anodes and cathodes will be discussed in the next sections except the separator and electrolyte since in most case commercially available ones are used. The main property of the electrolyte is to transport ions from the anode to the cathode or vice-versa, while ensuring as little as possible side reactions with the Li-ions. Mostly it consists of water with some dissolved salts, lithium hexafluorophosphate most used, to ensure good ion conductivity. The purpose of the separator is to stop the transport of electrons while intervening in the rest of the processes as little as possible.
3.1. State of the Art—Anode
Twenty years ago graphite (372 mAh/g [34]) was first commercialized [35] as anode material in a lithium-ion battery and up to now it is still being used in most lithium-ion batteries. Its low cost, good electrochemical performance, low volume expansion during charging and discharging as well as that it is abundantly available, explains the widely accepted use of graphite as anode material [33,35,36]. Many research efforts allowed to optimize this material resulting it is almost reaching its maximum theoretical capacity and only incremental improvements can be expected [29]. However, by adding small amounts of metals with high theoretical energy densities, such as silicon (4200 mAh/g [37]), the overall energy density can be increased [38]. Adding high concentrations of these additional components cause numerous problems such as volume expansions up to 300% as well as reduced lifetime despite the current numerous research efforts, for example using silicon as nano-particles such as in [37].
Other often used anodes materials used are lithium alloyed metals with as most popular Li4Ti5O12 LTO (175 mAh/g [35]). More noble metals are used resulting in a higher price than graphite. Other disadvantages are its lower energy capacity and reduced cell voltage compared to graphite. However its exceptional good stability over its lifetime makes it the ideal anodes in specific cases explaining its wide usage.
3.2. State of the Art—Cathode
The selection of the most suited cathode material is strongly dependent on the application itself. A selection has to be made of which key property is the most important for an application. The key properties of a battery are: energy density, power density, cost and lifetime. An overview of the most used cathode materials can be found in Table 4 [29,33,36,38,39,40,41,42,43,44,45].
The oldest commercially used electrodes are LiMn2O4 (LMO) due to the low cost, however the lifetime is limited which is considered to be the biggest disadvantage but they are still frequently used. LiCoO2 (LCO) another old electrode, characterized with a medium cost and high energy, has some safety drawbacks but is still used frequently. LiNiMnCoO2 (NMC), a combination of LCO, LMO and nickel, is gaining popularity due to its high lifetime as well as its high energy density. The exact mixture of Ni, Mn and Co will define the property of the cathode of which a variety exist such as NMC (1:1:1), NMC (5:3:2), ... The trend is to use Ni rich NMC since this gives an increased energy density. It is mainly used where cost is less important. LiFePO4 (LFP) has excellent lifetime properties and is frequently used in combination with an LTO anode to get an excellent overall lifetime of the battery. LiNiCoAlO2 (NCA), a relatively new cathode, has a very high energy density however it is potentially thermally unstable stability, meaning a reduced safety.
3.3. State of the Art—Roadmap
Demands on lifetime and energy/power density are ever increasing to extend the duration in which the battery can be used. Hence, there is a continuous need to further improve lithium-ion batteries [46]. This section will explain which future trends can be expected during the next decades, an overview is given in Figure 4, which is limited to lithium-ion batteries. Other types, such as sodium-ion, zinc air, lithium-air are still in a very early phase and thus omitted from this overview.
The world of batteries is changing very rapidly which is the reason why it is very hard to predict the most promising battery chemistry. It can be disrupted very easily if a novel type/chemistry is discovered in material sciences with superior properties. However some trends are already visible when limiting to lithium-ion based batteries.
The first clear trend is to use different electrodes which have a significant higher theoretical capacity such as sulfur (1672 mAh/g [47]), silicon (4200 mAh/g [37]) and lithium metal (3860 mA/g [48]). This will inherently increase the energy density of the cell since the electrodes itself can store more energy. A second trend is to increase the voltage limit of a single cell to around 5 V since it is a harmonized voltage value used in the field of electronics. This trend will also increase the cells energy density due to its definition which can be simply represented as integral of the actual capacity multiplied with the actual voltage. The third trend is to go towards solid state electrolytes since using liquid electrolytes can cause safety problems when leaking. In general it can be concluded that in the near future the energy density and safety are the two key topics, in which significant improvement can be expected during the next decade [32].
To make predictions further than a decade is extremely difficult but lithium-magnesium is worth mentioning. It has superior energy density and is abundantly available, but is still in a very early phase [49].
In this paper, as already mentioned, the goal is to perform a price estimation up to 2030. The best overall chemistry now in 2015 is NMC (6:2:2) as cathode combined with graphite as anode due to their high energy density and lifetime. It can be seen in literature many research efforts or ongoing on silicon based cells. Therefore in 2030 namely a silicon-alloy anode combined a nickel rich cathode (NMC (6:2:2)) to maximize its energy content will be most likely on the market. An overview of the two battery chemistries, used this research as well as their pack energy density is shown in Table 5. Throughout these two battery types will be referred to as battery I and battery II.
3.4. Battery Cell Manufacturing
Several architectures and designs of battery cells exist such as cylindrical cells, pouch cells, hard casing with a variety of positions for the tabs [51]. However in all these designs three main processes can be identified as described in Table 6 [33]. Also in this table the material inputs (+) and outputs (−) are shown since material cost is the main cost of a battery, which will be demonstrated in Section 3.5.
The first step is electrode manufacturing in which the electrodes themselves are being prepared. The active material, conductive agents, solvents and binder are mixed to a slurry which is coated onto a current collector (aluminium for the positive tab and copper for the negative one). After which the cells are dried, in order to vaporise the solvents. To ensure a good electrical connection between the slurry and current collector the electrodes are calendared, which consists of pressing the two firmly together. As a last step in this electrode manufacturing the electrodes are cut to their correct size.
The second step is to make a cells assembly or a multilayer combination of a positive electrode, separator and negative electrode. These multilayers can be created through stacking or winding to create respectively pouch and cylindrical cells. Afterwards the cells are packaged (hard casing/soft casing/...) and temporarily sealed. The cells undergo a drying procedure to ensure no solvents remain after which they are filled with electrolyte and permanently sealed.
The battery cell is now ready to use, however to ensure stable and good quality of it its has to undergo some electrical formation cycles. These formation cycles are critical for the lifetime of the cell since its stabilizes the chemical structure of the cell. The final step is to test the cell’s electrical performance to maintain a good quality control.
3.5. Process-Based Cost Modeling
This section will focus on cost and sales prices calculations and predictions by using process-based cost modeling of several battery chemistries. The methodology of process-based cost modeling is to calculate costs based on detailed process descriptions, which are well defined for batteries [52,53]. This methodology is being used in several application fields including battery cost calculations [54,55,56,57,58]. Battery production for automotive cells are still in an early phase and not yet in mass production. This means optimizations in the production process are possible by upscaling and by building more production plants. Process-based modeling can be combined with learning or dynamic curves, which are dependent on growth of the production capacity as demonstrated in other application fields [59]. This study [59] has performed a thorough analysis about the price evaluation of chemical products during a decade and linking the impact of increasing production capacities to the evolution of prices. For analysis of the price evolutions up to 2030 process-based cost modeling extended with learning curves will be used. The main drawbacks of this approach are that the exact process and composition of the battery chemistry has to be known. This can be overcome by combining recently published patents, which describe the processes in detail, as well as by performing an extended literature review.
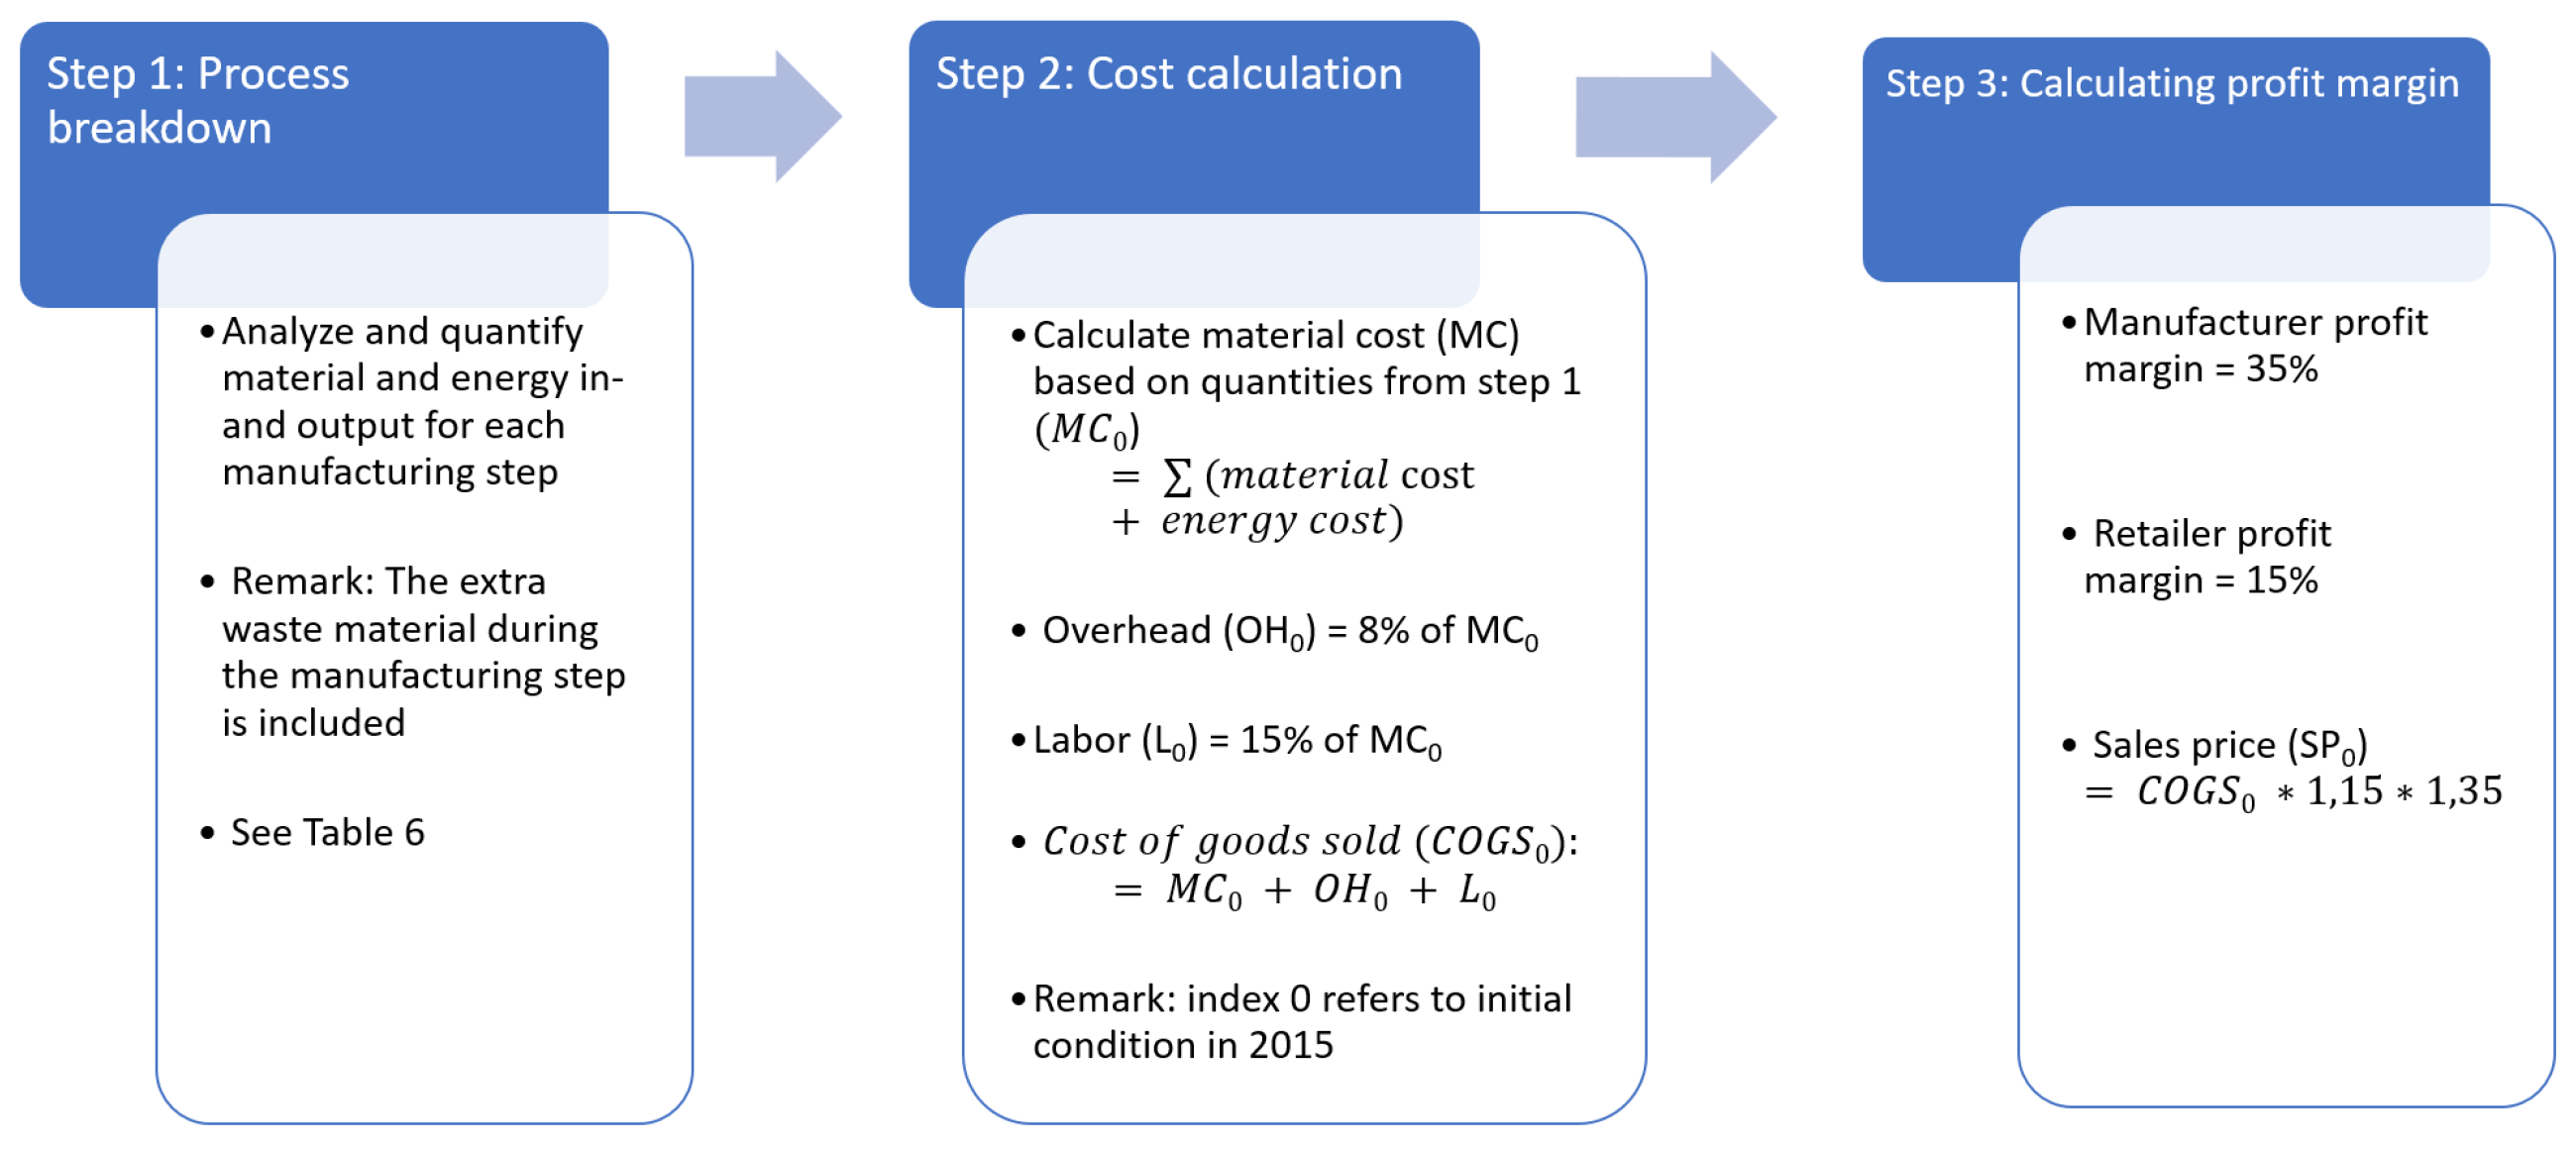
The cost of two different cell chemistries will be analyzed, namely battery I (NMC(6:2:2) + Graphite) and battery II (NMC(6:2:2) + silicon alloy). NMC based batteries can be seen as the current state of the art batteries and silicon based ones as state of the art batteries in 10–15 years as shown by the roadmap in Figure 4. Process-based cost modeling is used in order to calculate the detailed material cost in dollar/kWh for each battery type. The methodology, including the key equations, are represented in Figure 5. In the first step the manufacturing procedure is split into logical substeps of which the material and energy in and outflows are analyzed, which is done in Section 3.4. In this step also the excess material, used during the manufacturing, should be taken into account. The next step will calculate the cost of goods sold, which entails the material, energy, labor and overhead costs. Two additional assumptions are made regarding the labor and overhead cost, which can be approximated by respectively 15% and 8% as demonstrated in [60]. When comparing with other calculations done in literature [54,56,61] similar assumptions were used. The sales price including the manufacturer’s and retailer’s profit are taken into account. A profit margin of 35% for the manufacturer is used, which is high but it entails novel products requiring a high profit margin [60]. When these batteries are not directly sold by the manufacturer and additional profit margin of 15% by the retailer is added. This leads to the final sales price. The prediction of the prices will be detailed in Section 3.6.
Throughout this paper several assumptions are made. Firstly all prices will be expressed in dollar/kWh in 2015. All prices will be expressed in price in 2015 to make it easier to compare the evolutions. This will imply that the price of a battery will be higher in 2030 than predicted due to the inflation, which will occur between 2015 and 2030.
3.5.1. Battery I—Cost Calculation
The process of manufacturing of NMC lithium-ion batteries is well known; however, a variety of types are still possible. A NMC with ratio 6:2:2 will be used as a baseline for this calculations since this nickel rich type has a high energy density and is considered the current state of the art. It is also suited to increase the overall cell voltage which was described as one of the future trends. This NMC 6:2:2 cathode will be combined with standards binders, conductive agents and as anode graphite. The cost price calculations of a battery pack including a simple passive battery managements system (BMS) and casing are visually represented in Figure 6. The cost of 432 dollar/kWh is dominated by material cost representing 65% of the overall cost. Similar results can be found in literature [56,62] in which the material cost varies between 60–80%. The two most costly components are the positive and negative electrode. These require noble materials and are used in high quantities in a battery pack explaining their high cost. A detailed breakdown analysis of the negative electrode is also shown in Figure 6 in which it is clear that the active material is the main driver of the cost of the electrode (62% of the negative electrode cost). A similar trend can be seen in the positive electrode.
When including the profit margins of the producer and middle man a sales price of 670 dollar/kwh is reached. The breakdown is visualized in Figure 7. Also here the expensive electrodes represent a significant cost of 28%. Since these prices are valid for low production quantities, it is hard to compare them with the pricing of an automotive battery pack, however comparisons can be found varying from 700–1300 Dollar/kWh [63,64,65] of battery packs sold in lower quantities.
3.5.2. Battery II—Cost Calculation
This section will quantify the impact of using silicon-based batteries, with a higher energy density, compared to the classical NMC combined with graphite. The difference between the two is mainly in the negative electrode which uses silicon alloy in stead of graphite. Many varieties of silicon based lithium-ion batteries are available, however the ones in which silicon is used as an alloy are the most promising. As a baseline the following patent WO2016089666 A1 [50] will be used for making a silicon alloy with high lifetime and high energy density. The exact calculation of the composition of this active material composed from raw materials is shown in Table 7. The other components such as binder, conductive agents are kept constant. In reality different materials are required, however in a similar quantity and at a comparable cost explaining why these cost are kept con.
To calculate the total cost per kWh of battery II the increased energy density of the pack should be taken into account. For battery I and battery II receptively the following energy densities are used 155 Wh/kg and 205 Wh/kg. This is an increase of 33% which can be expected from material calculations. Silicon has a 10 times higher theoretical capacity than graphite, but a mixture is used as shown by its composition. The cost breakdown is visualized in Figure 8 in which the negative electrode cost is decreased from 24% for battery I to 19% for battery II. The main impact however comes from the higher energy density explaining a significantly lower cost of silicon based batteries compared top NMC. This makes a total sales price of 456 Dollar/kWh compared to 431 dollar/kWh from NMC, visualized in Figure 9. This is large price reduction of 30%. However it should be stated that this battery is not yet a commercial product and some extra research should be done to increase its lifetime.
3.6. Evolution of Cost in Time
The prediction of cost up to 2030 for automotive batteries based upon battery I and battery II will be detailed in this section. The cost and prices calculated in previous sections are only valid for small production quantities. Therefore the current cost of goods sold for automotive NMC battery packs will be used as a baseline, which is around 300 dollar/kWh according to literature [54,66,67]. Adding the assumed profit margin as stipulated in Figure 5 results in a sales price of 466 dollar/kWh. Also the relative amounts, calculated in the previous sections will be kept constant meaning labor 15%, overhead 8% and material cost 76% of the costs of goods sold (300 dollar/kWh).
As previously mentioned there is a clear link in doubling the production capacity of the industry and price reductions as shown by [59]. Three different types of cost can be analyzed with their own learning/discount rate per doubling capacity of the industry. The calculations of the costs of goods sold and the sales price calculations for predictions up to 2030 are shown in Figure 10. Combining process based modeling with these learning curves are a new approach to tackle the price predictions of batteries. Firstly the material cost is analyzed by Lieberman, [59] and a reduction of 23.5% can be found per doubling production capacity, corresponding to a discount factor of 0.765 of material cost. While for overhead and labor cost receptively the classical “six-tenths-rule” and “two-tenths-rule” [59] are used. The six-tenths-rule gives a relationship between size and cost as shown by following formula [68]:
This shows that for a size doubling the total cost increases to 151.4% instead of doubling. This can be achieved by for example building a new plant. When this total cost is redistributed over the two plants, the cost for each plant reduced to 75.7% of its original cost. This translate thus in a reduction of 24.3% per plant or a discount rate of 0.757 for overhead cost. Labor cost follows the two-tenths-rule meaning thus in the previous equation 0.6 should be replaced by 0.2. This results in a discount factor of 0.574 or a reduction by 42.6% for each size doubling for labor costs. For completeness the market growth for EV and BEV from 2015 up to 2030 are summarized in Table 8, based upon the predictions made in Section 2.3.
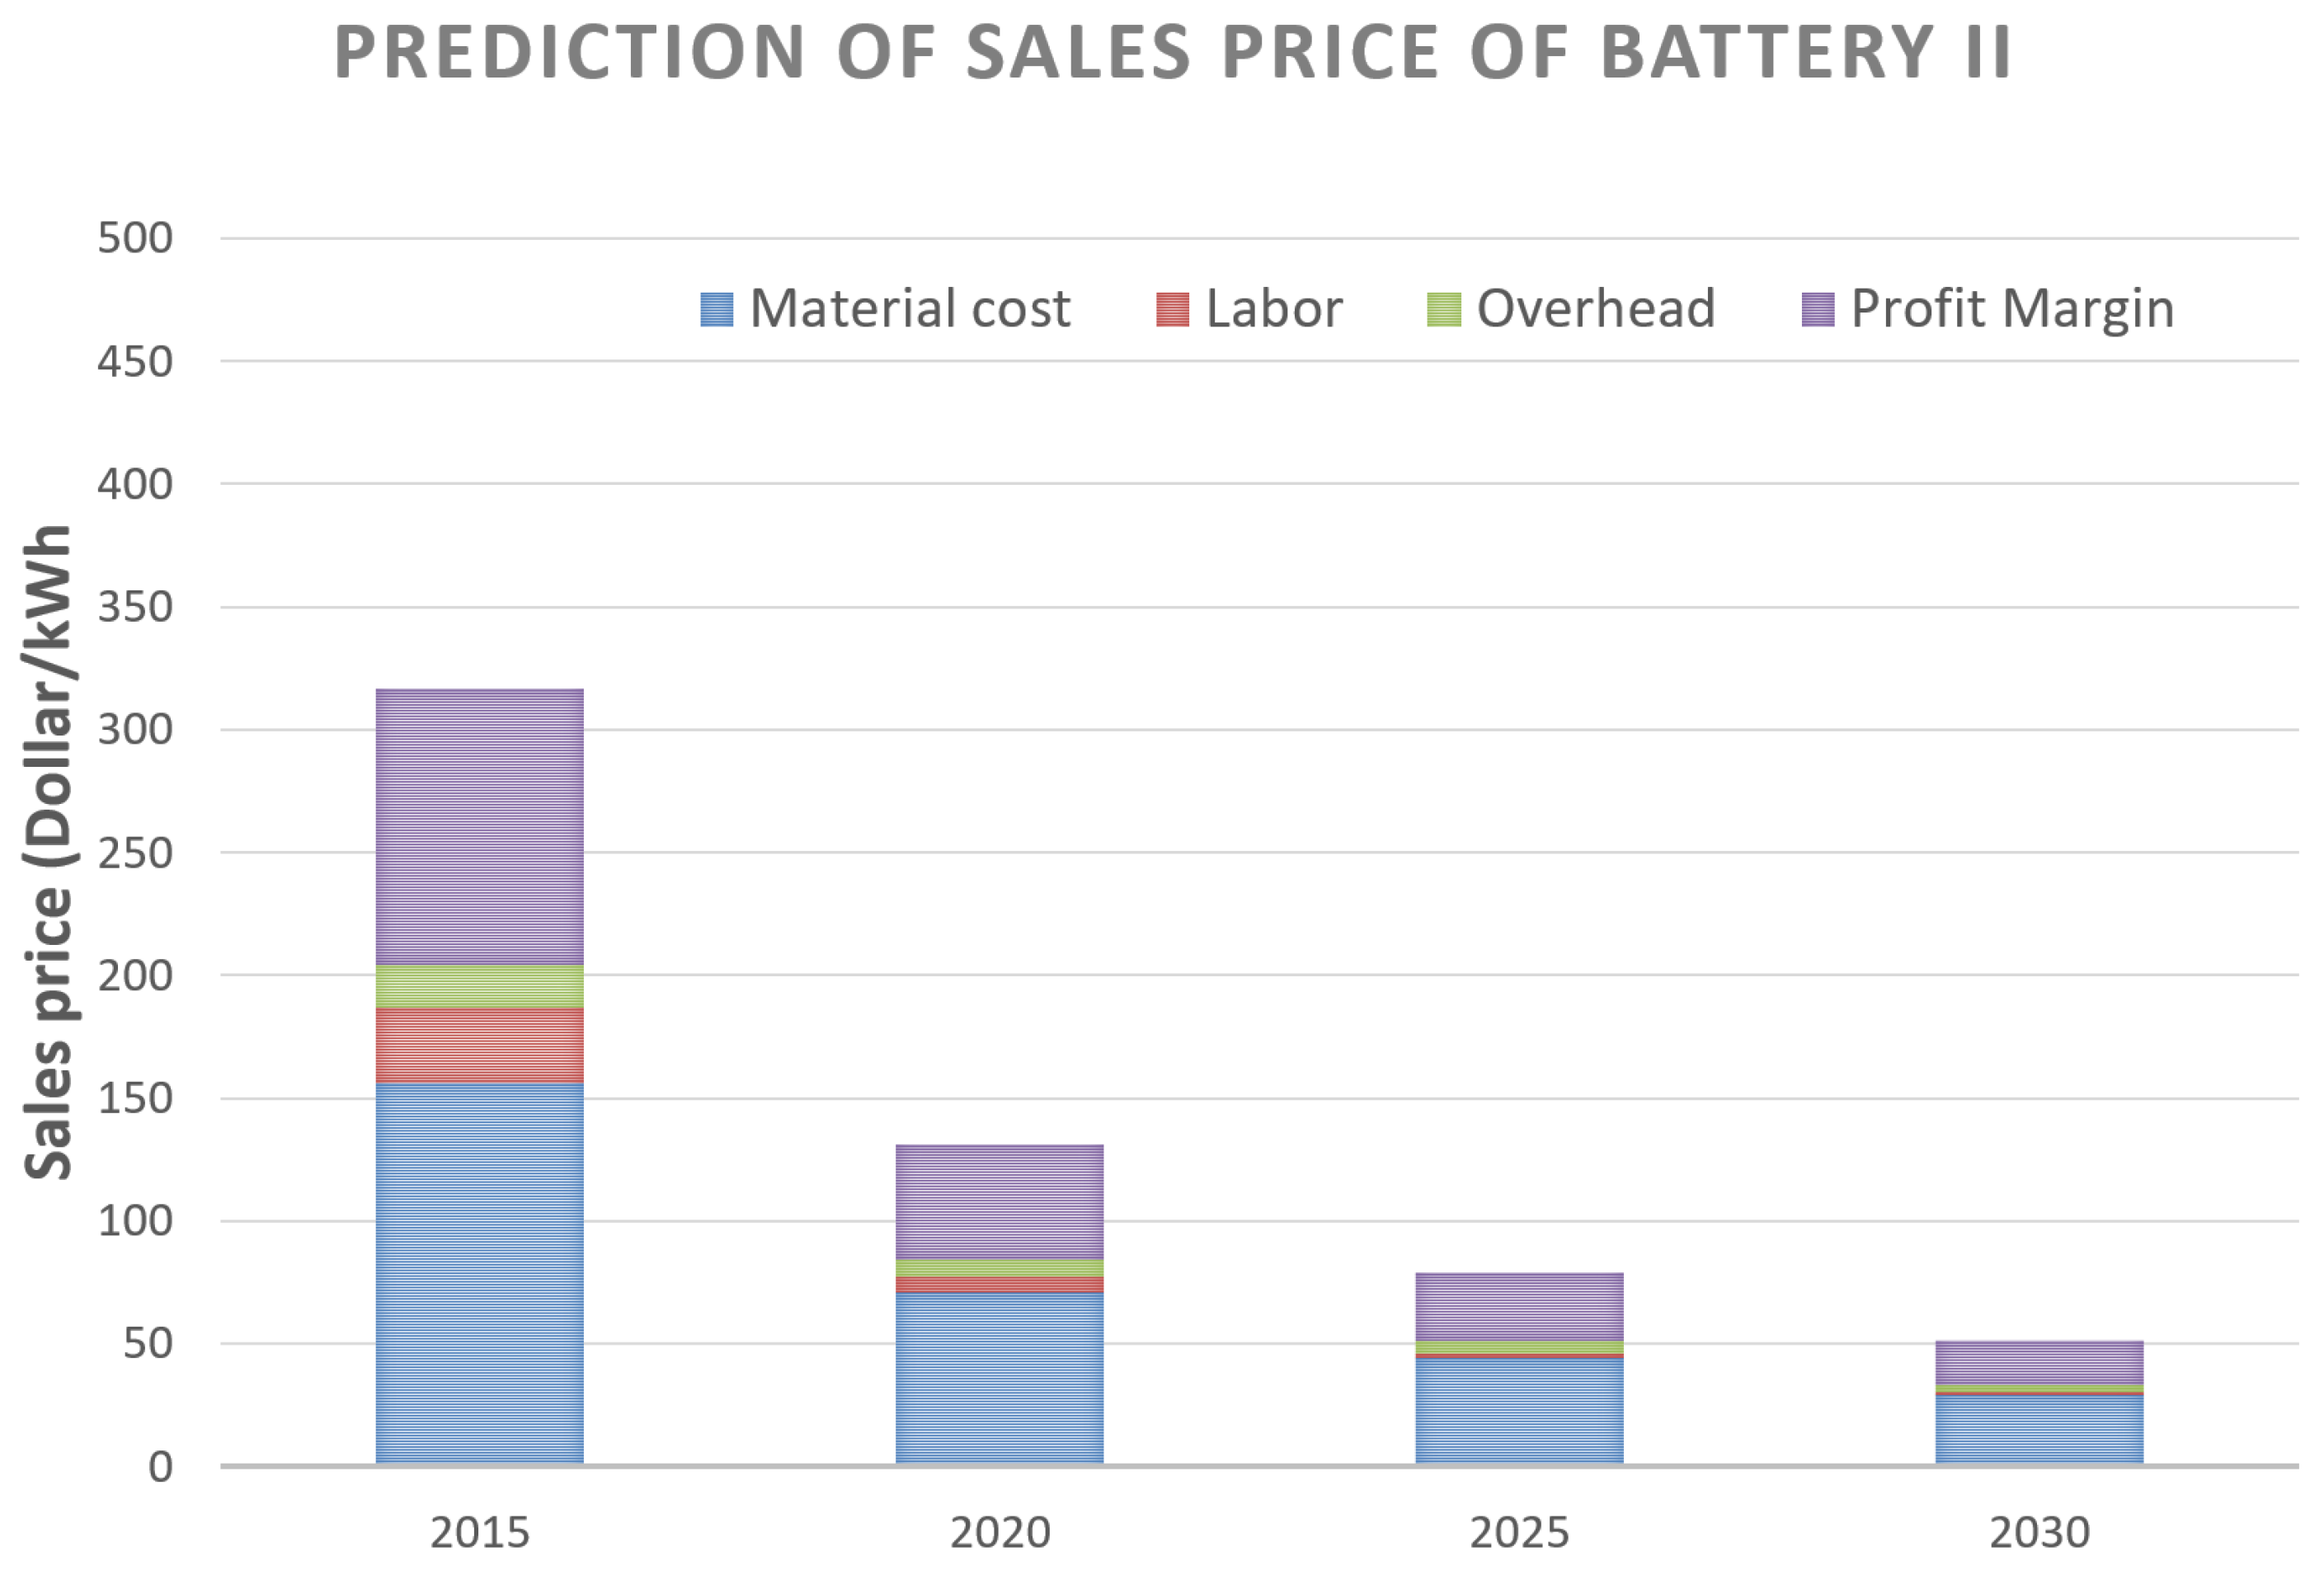
In Figure 11 the prediction of sales cost for battery II is shown. By 2020 a significant price reduction is expected (more than half of the total sales price) due to the rapid growth of the battery market, linked to the EVs one. The threshold of 100 dollar/kWh will be reached between 2025 and 2030.
The same approach is used for battery II. The price in 2015 is calculated using the same proportion of the sales price between NMC and silicon for the previous sections. After which the profit margins are added, resulting in a sales price of 317 dollar/kWh. The prediction of its price evolution is shown in Figure 12. One important remark is that silicon based lithium-ion batteries are not yet on the market but will be in 10 years. If comparing battery I this with battery II the threshold of 100 dollar/kWh will be reached much sooner in 2020–2025.
3.7. Comparison
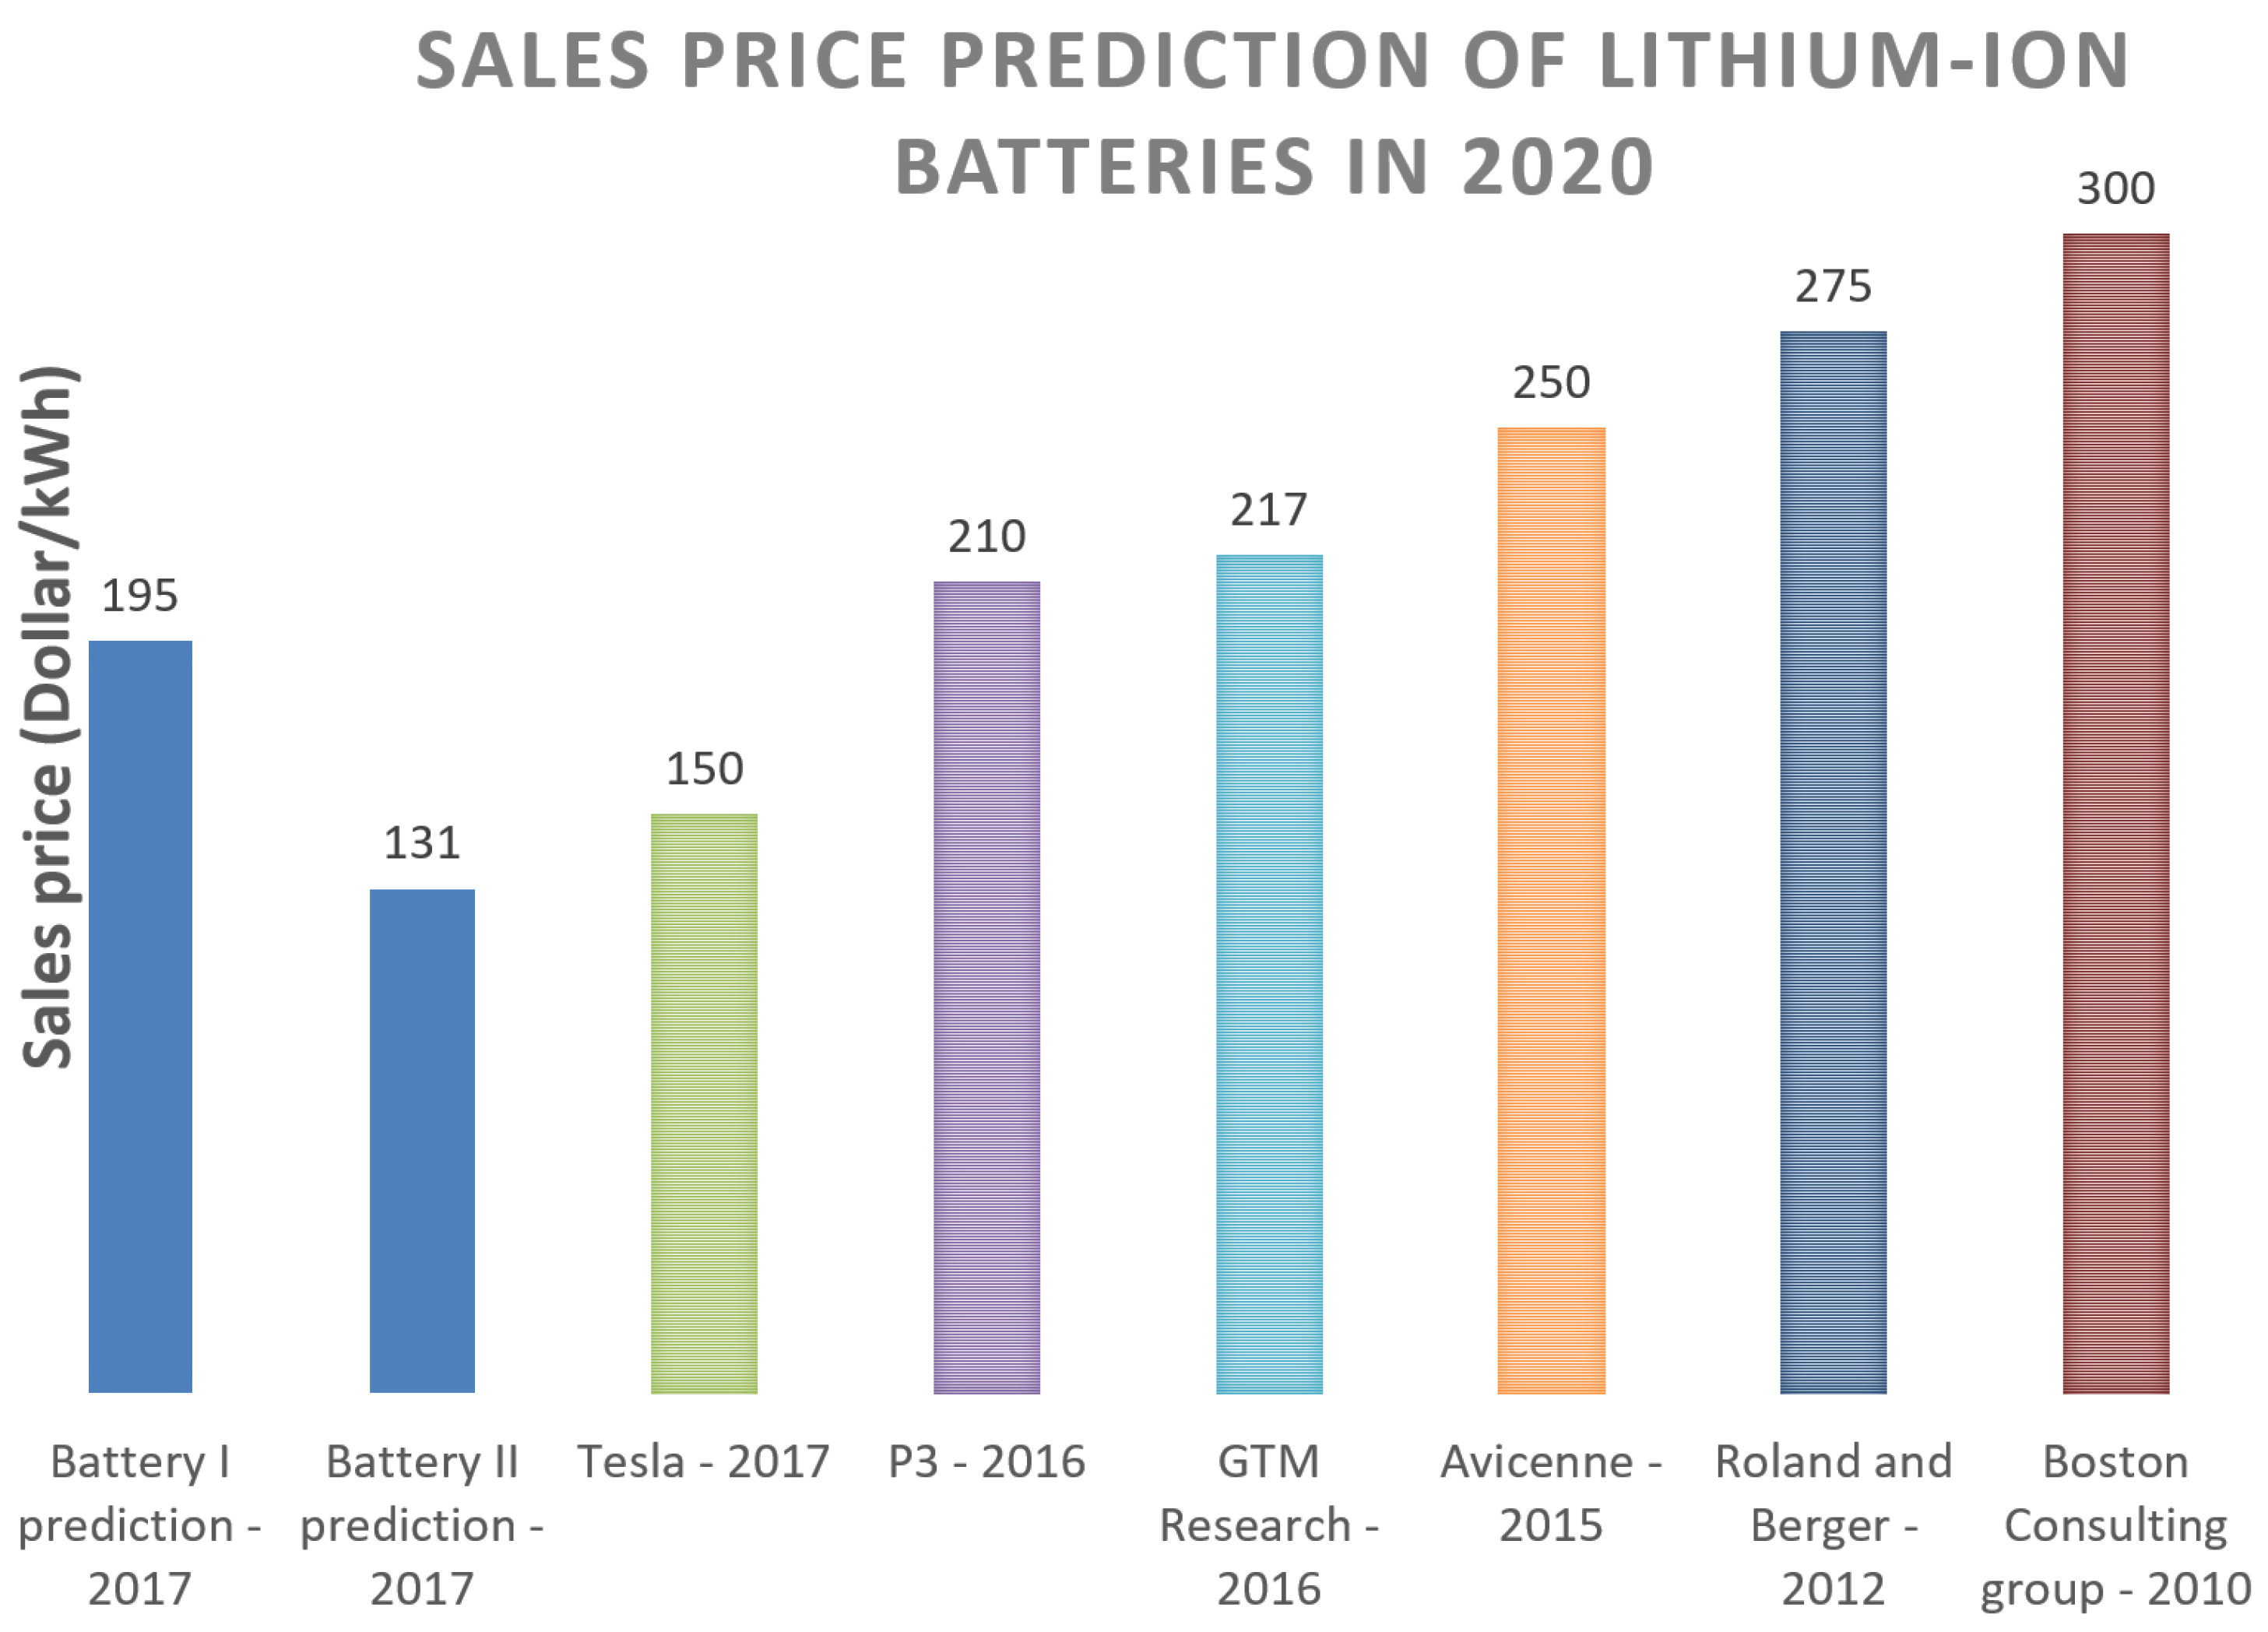
This section will compare the price predictions available in literature [69,70,71,72,73,74,75] of lithium-ion batteries in 2020, visualized in Figure 13. In this figure it can be seen that the prices are ranked from low to high, which also coincides with when the price was predicted. The Boston Consulting Group [71] predicted in 2010 an average price of 300 dollar/kWh, which is the oldest and highest price in the listed comparison. In 2012 and 2015 receptively Roland and Berger [73,74] and Avicenne [72] predicted a price of 275 and 250 dollar/kWh. The predictions in 2016 made by P3 Consulting [75] and GTM Research [69] even shows lower costs of 210 and 217 dollar/kWh. The most recent prediction made by Tesla [70] even 150 dollar/kWh can be expected in 2015. The predictions made by this research gives result of 195 and 131 dollar/kWh, which is in the same line as the recent predictions. However silicon based batteries can have a beneficial impact on the cost it is unlikely that it is already commercially available in 2020 but most likely by 2025.
4. Conclusions
From the previous analysis it is clear that the electric automotive market is still in its innovators/introduction stage [76]. However in the near future a step towards mass-adoption/ growth is expected. One of the indicators is to analyze the publications and patents about the electric automotive industry which is currently booming. BEVs still have a small driving range however a large effort was done by the manufacturers to significantly extend the choice of electric vehicles during the last years. The most popular HEVs are the higher priced vehicles in which cost plays is less important. Currently the market is still dominated by classical combustion engine vehicles however its dominance will decrease from 99% in 2015 to 68% in 2030. The market of electric vehicles (HEVs and BEVs) will have to increase by a factor of 52, which means a huge investment in battery manufacturing will be required to cope with this increase. This mass production will be one of the driving forces of the decreasing cost of battery pack.
The trends deduced from the roadmap of lithium-ion batteries show that within the next decade improvements regarding energy density and safety can be expected. To anticipate on this trend a innovative approach is used in which process-based cost calculations are used on two types of battery chemistries, one which can be considered as state of the art in 2015, namely NMC and one which will be considered as state of the art in 2030, namely silicon based lithium-ion batteries. Additionally, this methodology is combined with learning curves to which will include the maturing of the battery market. Material costs represent the majority of costs in a battery pack (66%) of which the active material, responsible for the intercalation of li-ions, is the most costly component. By using silicon based batteries a cost reduction per kWh of 30%. The limit of 100 Dollar/kWh will be reached in 2020–2025 for silicon based batteries and in 2025–2030 for NMC batteries. This low price will have a significant impact on the overall price of an electric vehicles since the battery represents the largest cost. This price reduction will aide in the mass adoption of electric vehicles.
Author Contributions
Gert Berckmans performed the research and wrote the paper. The supervisors: Lieselot Vanhaverbeke and Joeri Van Mierlo as well as Maarten Messagie, Jelle Smekens and Noshin Omar provided interesting disucssions adn interesting insights inS the research. All authors read and approved the final manuscript.
Conflicts of Interest
The authors declare not conflicts of interest.
References
- Hooftman, N.; Oliveira, L.; Messagie, M.; Coosemans, T.; Mierlo, J.V. Environmental Analysis of Petrol, Diesel and Electric Passenger Cars in a Belgian Urban Setting. Energies 2016, 9, 84. [Google Scholar] [CrossRef]
- Oliveira, L.; Messagie, M.; Rangaraju, S.; Sanfelix, J.; Rivas, M.H.; Mierlo, J.V. Key issues of lithium-ion batteries e from resource depletion to environmental performance indicators. J. Clean. Prod. 2015, 108, 354–362. [Google Scholar] [CrossRef]
- COP21. Available online: http://www.cop21paris.org/about/cop21/ (accessed on 19 April 2017).
- European Commission. White Paper: European Transport Policy for 2010: Time to Decide; Technical Report; European Commission: Luxemburg, 2001. [Google Scholar]
- Grunditz, E.A.; Thiringer, T. Performance Analysis of Current BEVs—Based on a Comprehensive Review of Specifications. IEEE Trans. Transp. Electr. 2016, 2, 270–289. [Google Scholar] [CrossRef]
- Wolfram, A.P.; Lutsey, N. Electric Vehicles: Literature Review of Technology Costs and Carbon Emissions; The International Council on Clean Transportation: Washington, DC, USA, 2016; pp. 1–23. [Google Scholar]
- European Alternative Fuels Observatory. Available online: http://www.eafo.eu/vehicle-statistics/m1 (accessed on 15 March 2017).
- Delucchi, M.E.; Lipman, T. An Analysis of the Retail and Lifecycle Cost of Barrery-Powered Electric Vehicles. Transp. Res. Part D 2001, 6, 371–404. [Google Scholar] [CrossRef]
- Neubauer, J.; Wood, E. The impact of range anxiety and home, workplace, and public charging infrastructure on simulated battery electric vehicle lifetime utility. J. Power Source 2014, 257, 12–20. [Google Scholar] [CrossRef]
- Rauh, N.; Franke, T.; Krems, J.F. Understanding the Impact of Electric Vehicle Driving Experience on Range Anxiety. J. Hum. Factors Ergon. Soc. 2015, 57, 177–187. [Google Scholar] [CrossRef] [PubMed]
- Franke, T.; Neumann, I.; Bühler, F.; Cocron, P.; Krems, J.F. Experiencing Range in an Electric Vehicle: Understanding Psychological Barriers. Appl. Psychol. 2012, 61, 368–391. [Google Scholar] [CrossRef]
- Franke, T.; Krems, J.F. What drives range preferences in electric vehicle users? Transp. Policy 2013, 30, 56–62. [Google Scholar] [CrossRef]
- Pearre, N.S.; Kempton, W.; Guensler, R.L.; Elango, V.V. Electric vehicles: How much range is required for a day’s driving? Transp. Res. Part C Emerg. Technol. 2011, 19, 1171–1184. [Google Scholar] [CrossRef]
- Dong, J.; Liu, C.; Lin, Z. Charging infrastructure planning for promoting battery electric vehicles: An activity-based approach using multiday travel data. Transp. Res. Part C Emerg. Technol. 2014, 38, 44–55. [Google Scholar] [CrossRef]
- Bakker, J. Contesting Range Anxiety: The Role of Electric Vehicle Charging Infrastructure in the Transportation Transition. Master’s Thesis, Eindhoven University of Technology, Eindhoven, The Netherlands, 2011. [Google Scholar]
- International Energy Agency (IEA). Technology Roadmap: Electric and Plug-in Hybrid Electric Vehicles; Technical Report; International Energy Agency (IEA): Paris, France, 2011. [Google Scholar]
- Klynveld Peat Marwick Goerdeler KPMG’s Global Automotive Executive Survey. Available online: https://assets.kpmg.com/content/dam/kpmg/xx/pdf/2017/01/global-automotive-executive-survey-2017.pdf (accessed on 16 May 2017).
- Lazard & Roland Berger. Global Automotive Supplier Study 2013. Available online: https://www.rolandberger.com/en/Publications/pub_global_automotive_supplier_study_by_roland_berger_and_lazard.html (accessed on 10 May 2017).
- International Energy Agency. Global EV Outlook 2016 Electric Vehicles Initiative; IEA: Lisbon, Portugal, 2016; pp. 1–51. [Google Scholar]
- Mac Donald, J. Electric Vehicles to Be 35% of Global New Car Sales by 2040. Available online: https://about.bnef.com/blog/electric-vehicles-to-be-35-of-global-new-car-sales-by-2040/ (accessed on 4 October 2017).
- Global Trends to 2025: A Transformed World; Lukoil: Moscow, Russia, 2015.
- King, N. Global Light Vehicle Sales Forecast to Exceed 100 Million Units in 2019. Available online: http://blog.euromonitor.com/2015/07/global-light-vehicle-sales-forecast-to-exceed-100-million-units-in-2019.html (accessed on 25 May 2017).
- Goldman Sachs. Cars 2025. Available online: http://www.goldmansachs.com/our-thinking/technology-driving-innovation/cars-2025/ (accessed on 5 April 2017).
- Price Waterhouse Coopers. PWC: Prediction; Electric Cars: A Market Outlook: The Future of Plug-in Hybrid Electric and All-Electric Vehicles in Hungary; Technical Report; PWC: Prediction: London, UK, 2014. [Google Scholar]
- Statista. Available online: https://www.statista.com/statistics/267128/outlook-on-worldwide-passenger-car-sales/ (accessed on 17 March 2017).
- Information Handling Services Automotive. Global Light Vehicle Forecast: Readying For The Next Stage; Technical Report; IHS Automotive: London, UK, 15 October 2015. [Google Scholar]
- International Energy Agency. Electric and Plug-In Hybrid Vehicle Roadmap; International Environmental Agency: Lisbon, Portugal, 2010; p. 4. [Google Scholar]
- Oica. Oica: Sales Figures; Technical Report; Oica: Paris, France, 2017. [Google Scholar]
- Deng, D. Li-ion batteries: Basics, progress, and challenges. Energy Sci. Eng. 2015, 3, 385–418. [Google Scholar] [CrossRef]
- Fuller, T.F.; Doyle, M.; Newman, J. Simulation and Optimization of the Dual Lithium Ion Insertion Cell. J. Electrochem. Soc. 1994, 141, 1. [Google Scholar] [CrossRef]
- Xu, G.L.; Wang, Q.; Fang, J.C.; Xu, Y.F.; Li, J.T.; Huang, L.; Sun, S.G. Tuning the structure and property of nanostructured cathode materials of lithium ion and lithium sulfur batteries Gui-Liang. J. Mater. Chem. A 2014, 2, 19941–19962. [Google Scholar] [CrossRef]
- Gopalakrishnan, R.; Goutam, S.; Oliveira, L.M.; Timmermans, J.M.; Omar, N.; Messagie, M.; Bossche, P.V.D.; Mierlo, J.V. A comprehensive study on rechargeable energy storage technologies. J. Electrochem. Energy Convers. Storage 2017, 13, 1–107. [Google Scholar] [CrossRef]
- Smekens, J.; Gopalakrishnan, R.; Van den Steen, N.; Omar, N.; Hegazy, O.; Hubin, A.; Van Mierlo, J. Influence of electrode density on the performance of Li-ion batteries: Experimental and simulation results. Energies 2016, 9, 104. [Google Scholar] [CrossRef]
- Kheirabadi, N.; Shafiekhani, A. Graphene/Li-Ion battery. J. Appl. Phys. 2012, 112, 1–19. [Google Scholar] [CrossRef] [Green Version]
- Nitta, N.; Wu, F.; Lee, J.T.; Yushin, G. Li-ion battery materials: Present and future. Mater. Today 2015, 18, 252–264. [Google Scholar] [CrossRef]
- Mekonnen, Y.; Sundararajan, A.; Sarwat, A.I. A Review of Cathode and Anode Materials for Lithium-Ion Batteries. In Proceedings of the 2016 SoutheastCon, Norfolk, VA, USA, 30 March–3 April 2016; pp. 2–7. [Google Scholar]
- Su, X.; Wu, Q.; Li, J.; Xiao, X.; Lott, A.; Lu, W.; Sheldon, B.W.; Wu, J. Silicon-Based Nanomaterials for Lithium-Ion Batteries: A Review. Adv. Energy Mater. 2013, 4, 1–23. [Google Scholar] [CrossRef]
- Blomgren, G.E. The Development and Future of Lithium Ion Batteries. J. Electrochem. Soc. 2017, 164, A5019–A5025. [Google Scholar] [CrossRef]
- Fergus, J.W. Recent developments in cathode materials for lithium ion batteries. J. Power Source 2010, 195, 939–954. [Google Scholar] [CrossRef]
- Mizushima, K.; Jones, P.C.; Wiseman, P.J.; Goodenough, J.B. LixCoO2: A new cathode material for batteries of high energy density. Solid State Ion. 1981, 3–4, 171–174. [Google Scholar] [CrossRef]
- Liu, C.; Neale, Z.G.; Cao, G. Understanding electrochemical potentials of cathode materials in rechargeable batteries. Mater. Today 2016, 19, 109–123. [Google Scholar] [CrossRef]
- Julien, C.M.; Mauger, A.; Zaghib, K.; Groult, H. Comparative Issues of Cathode Materials for Li-Ion Batteries. Inorganics 2014, 2, 132–154. [Google Scholar] [CrossRef]
- Meyers, R.A.; Doeff, M.M. Encyclopedia of Sustainability Science and Technology; Springer: New York, NY, USA, 2012; pp. 529–564. [Google Scholar]
- Heyns, M.; Vereecken, P. Materials for the Next Generation Batteries (Some) Ways of Storing Electricity; Technical Report; KU Leuven: Leuven, Belgium, 2013. [Google Scholar]
- Meeus, M.; Pace, G. Current and Future Development of Battery Technology and Its Suitability within Smart Grids; Technical Report; Ghent University: Ghent, Belgium, 2013. [Google Scholar]
- Noorden, R.V. The rechargeable revolution: A better battery. Nature 2014, 507, 26–28. [Google Scholar] [CrossRef] [PubMed]
- Preefer, M. Lithium-Sulfur Batteries and Discharge Products from Cycling Why Li-S Batteries? Technical Report; Materials Research Laboratory at UCSB: Santa Barbara, CA, USA, 2016. [Google Scholar]
- Xu, W.; Wang, J.; Ding, F.; Chen, X.; Nasybulin, E.; Zhang, Y.; Zhang, J.G. Lithium metal anodes for rechargeable batteries. Energy Environ. Sci. 2014, 7, 513–537. [Google Scholar] [CrossRef]
- Aurbach, D.; Gofer, Y.; Lu, Z.; Schechter, A.; Chusid, O.; Gizbar, H.; Cohen, Y.; Ashkenazi, V.; Moshkovich, M.; Turgeman, R.; et al. A short review on the comparison between Li battery systems and rechargeable magnesium battery technology. J. Power Source 2001, 97–98, 28–32. [Google Scholar] [CrossRef]
- Figgemeier, E. Electrode Composition Comprising Carbon Naotubes, Electrochemical Cell and Method of Making Electrochemical Cells. Patent EP 3029759 A1, 6 August 2016. [Google Scholar]
- Kurfer, J.; Westermeier, M.; Tammer, C.; Reinhart, G. Production of large-area lithium-ion cells— Preconditioning , cell stacking and quality assurance. CIRP Ann. Manuf. Technol. 2012, 61, 1–4. [Google Scholar] [CrossRef]
- Field, F.R. Fundamentals of Process-Based Cost Modeling Session Goal & Outline Review of Process-Based Cost Model; Technical Report; MIT: Cambridge, MA, USA, 2017. [Google Scholar]
- Field, F.; Kirchain, R.; Roth, R. Process cost modeling: Strategic engineering and economic evaluation of Materials technologies. JOM J. Miner. Met. Mater. Soc. 2007, 59, 21–32. [Google Scholar] [CrossRef]
- Patry, G.; Romagny, A.; Martinet, S.; Froelich, D. Cost modeling of lithium-ion battery cells for automotive applications. Energy Sci. Eng. 2015, 3, 71–82. [Google Scholar] [CrossRef]
- Isaacs, J.A.; Tanwani, A.; Healy, M.L.; Dahlben, L.J. Economic assessment of single-walled carbon nanotube processes. J. Nanoparticle Res. 2010, 12, 551–562. [Google Scholar] [CrossRef]
- Nelson, P.A.; Gallagher, K.G.; Bloom, I.; Dees, D.W. Modeling the Performance and Cost of Lithium-Ion Batteries for Electric-Drive Vehicles; Argonne National Lab: Lemont, IL, USA, 2011; pp. 1–102.
- Wood, D.L.; Li, J.; Daniel, C. Prospects for reducing the processing cost of lithium ion batteries. J. Power Source 2015, 275, 234–242. [Google Scholar] [CrossRef]
- Henriksen, G.L.; Amine, K.; Liu, J.; Nelson, P.A. ANL-03/5 Materials Cost Evaluation Report for High-Power Li-Ion HEV Batteries; Argonne National Lab: Lemont, IL, USA, 2002; Volume 1.
- Lieberman, M. The Learning Curve and Pricing in the Chemical Processing industries. RAND J. Econ. 1984, 15, 213–228. [Google Scholar] [CrossRef]
- Gaines, L.; Cuenca, R. Costs of Lithium-Ion Batteries for Vehicles; Center for Transportation Research, Energy Division, Argonne National Labratorye: Lemont, IL, USA, 2000.
- Nykvist, B.; Nilsson, M. Rapidly falling costs of battery packs for electric vehicles. Nat. Clim. Chang. 2015, 5, 329–332. [Google Scholar] [CrossRef]
- Anderson, D. An evaluation of current and future costs for lithium-ion batteries for use in electrified vehicle powertrains. arXiv, 2009; arXiv:arXiv:1011.1669v3. [Google Scholar]
- Alibaba. Available online: https://www.alibaba.com/showroom/li-ion-nmc-battery.html (accessed on 15 April 2017).
- Aliexpress. Available online: http://www.aliexpress.com/popular/nmc-battery.html (accessed on 15 April 2017).
- Batteryspace. Available online: http://www.batteryspace.com/LiNiMnCo-Cells/Packs.aspx (accessed on 15 April 2017).
- Chung, D.; Elgqvist, E.; Santhanagopalan, S. Automotive Lithium-ion Cell Manufacturing: Regional Cost Structures and Supply Chain Considerations; Clean Energy Manufacturing Analysis Center (CEMAC): Golden, CO, USA, 2016. [Google Scholar]
- Ashley, S. Battling the High Cost of EV Batteries; SAE: Washington, DC, USA, 2015. [Google Scholar]
- Sweeting, J. Project Cost Estimating: Principles and Practice; Institution of Chemical Engineers: Rugby, UK, 1997; pp. 150–170. [Google Scholar]
- Lacy, S. Stem CTO: Lithium-Ion Battery Prices Fell 70% in the Last 18 Months. Available online: https://www.greentechmedia.com/articles/read/stem-cto-weve-seen-battery-prices-fall-70-in-the-last-18-months (accessed on 4 June 2017).
- Lambert, F. Electric Vehicle Battery Cost Dropped 80% in 6 Years down to $227/kWh – Tesla Claims to Be Below $190/kWh. Available online: https://electrek.co/2017/01/30/electric-vehicle-battery-cost-dropped-80-6-years-227kwh-tesla-190kwh/ (accessed on 6 May 2017).
- The Boston Consulting Group. Batteries for Electric cars: Challanges Opportunities, and the outlook to 2020; Technical Report; The Boston Consulting Group: Boston, MA, USA, 2010. [Google Scholar]
- Pillot, C. Battery Market Development for Consumer Electronics, Automotive, and Industrial: Materials Requirements and Trends. In Proceedings of the 5th Israeli Power Sources Conference 2015, Herzelia, Israel, 20–21 May 2015; Volume 1. [Google Scholar]
- Roland and Berger. Technology & Market Drivers for Stationary and Automotive Battery Systems. In Proceedings of the Batteries 2012, Nice, France, 24–26 October 2012. [Google Scholar]
- Roland and Berger. The Lithium-Ion Battery Value Chain. In Proceedings of the Batteries 2012, Nice, France, 24–26 October 2012. [Google Scholar]
- P3 Consulting Group. Cost Developments of Battery Systems; Technical Report; P3 Consulting Group, Inc.: Coral Gables, FL, USA, 2016. [Google Scholar]
- Haupt, R.; Kloyer, M.; Lange, M. Patent indicators for the technology life cycle development. Res. Policy 2007, 36, 387–398. [Google Scholar] [CrossRef]
Figure 1.
Evolution of the technology split between electric vehicles (EV), hybrid electric vehicles (HEV), internal combustion engines (ICE) and other up to 2030.
Figure 1.
Evolution of the technology split between electric vehicles (EV), hybrid electric vehicles (HEV), internal combustion engines (ICE) and other up to 2030.

Figure 2.
Global vehicles sales predictions up to 2030 including the evolution of the technological split between EV, HEV, ICE and others.
Figure 2.
Global vehicles sales predictions up to 2030 including the evolution of the technological split between EV, HEV, ICE and others.
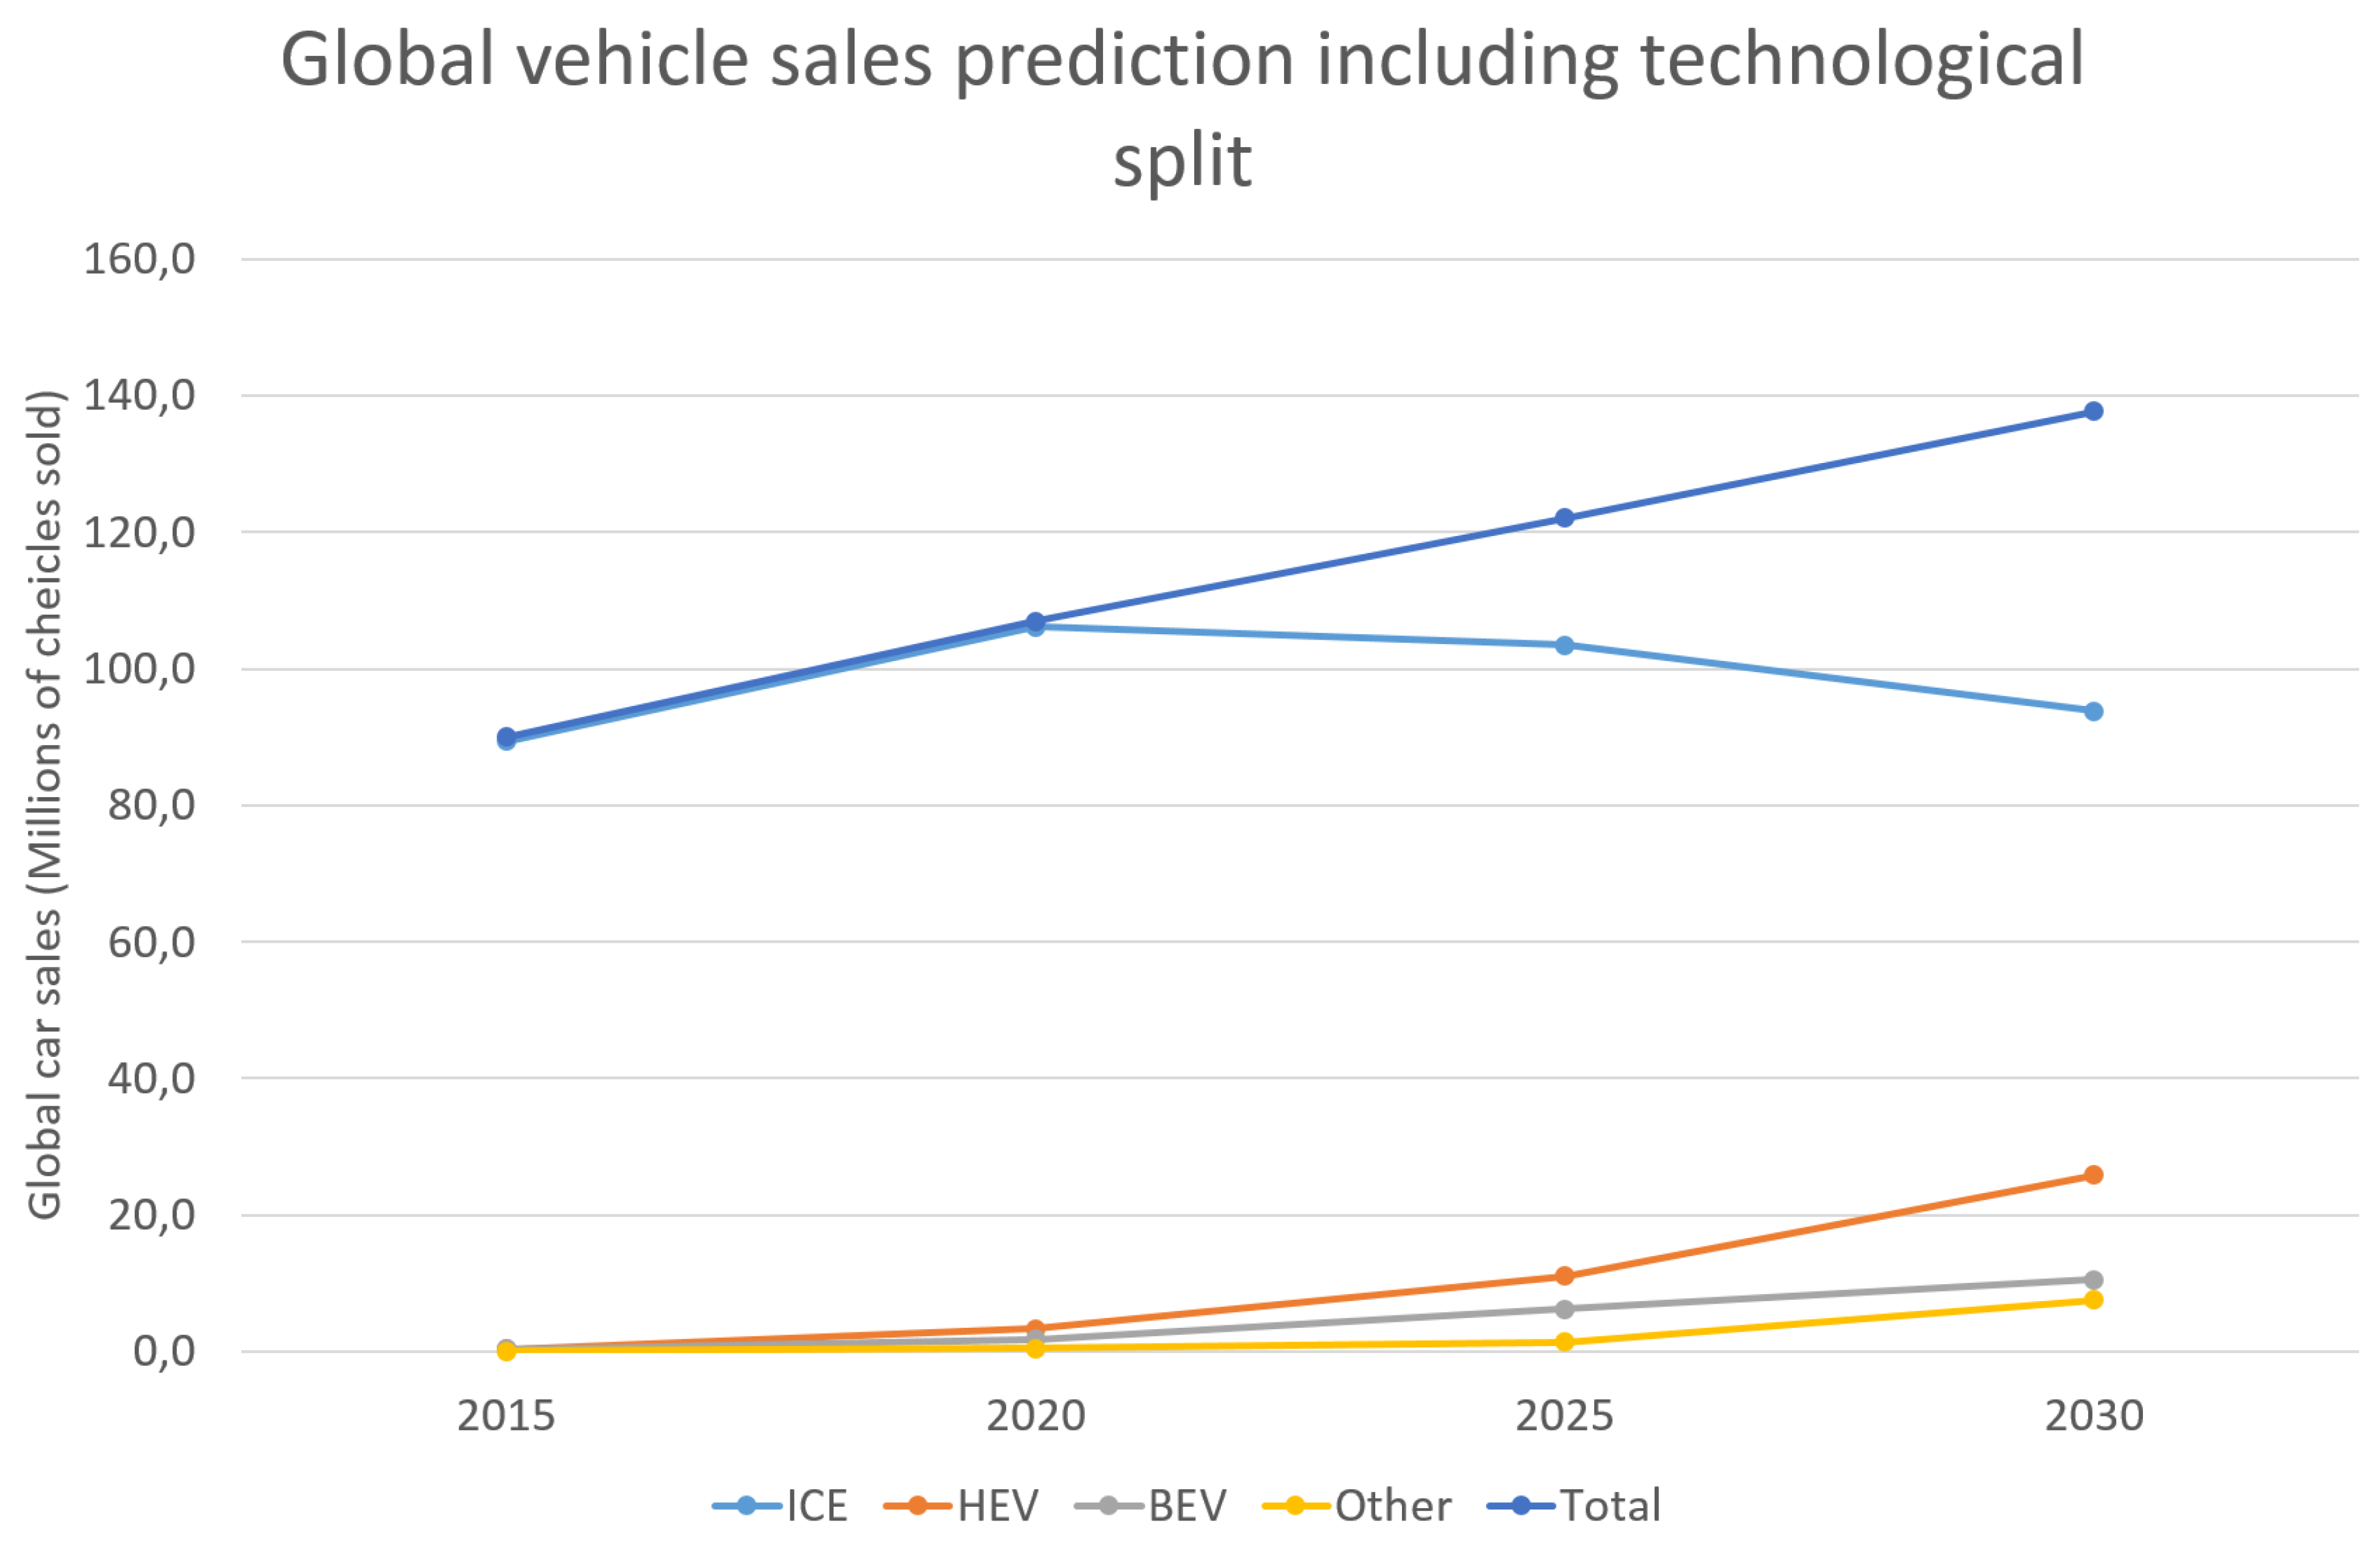
Figure 3.
Schematic illustration of the charge/discharge process in a lithium-ion battery, reproduced from [31].
Figure 3.
Schematic illustration of the charge/discharge process in a lithium-ion battery, reproduced from [31].

Figure 4.
Roadmap of Lithium-ion based batteries from present up to >10 years.
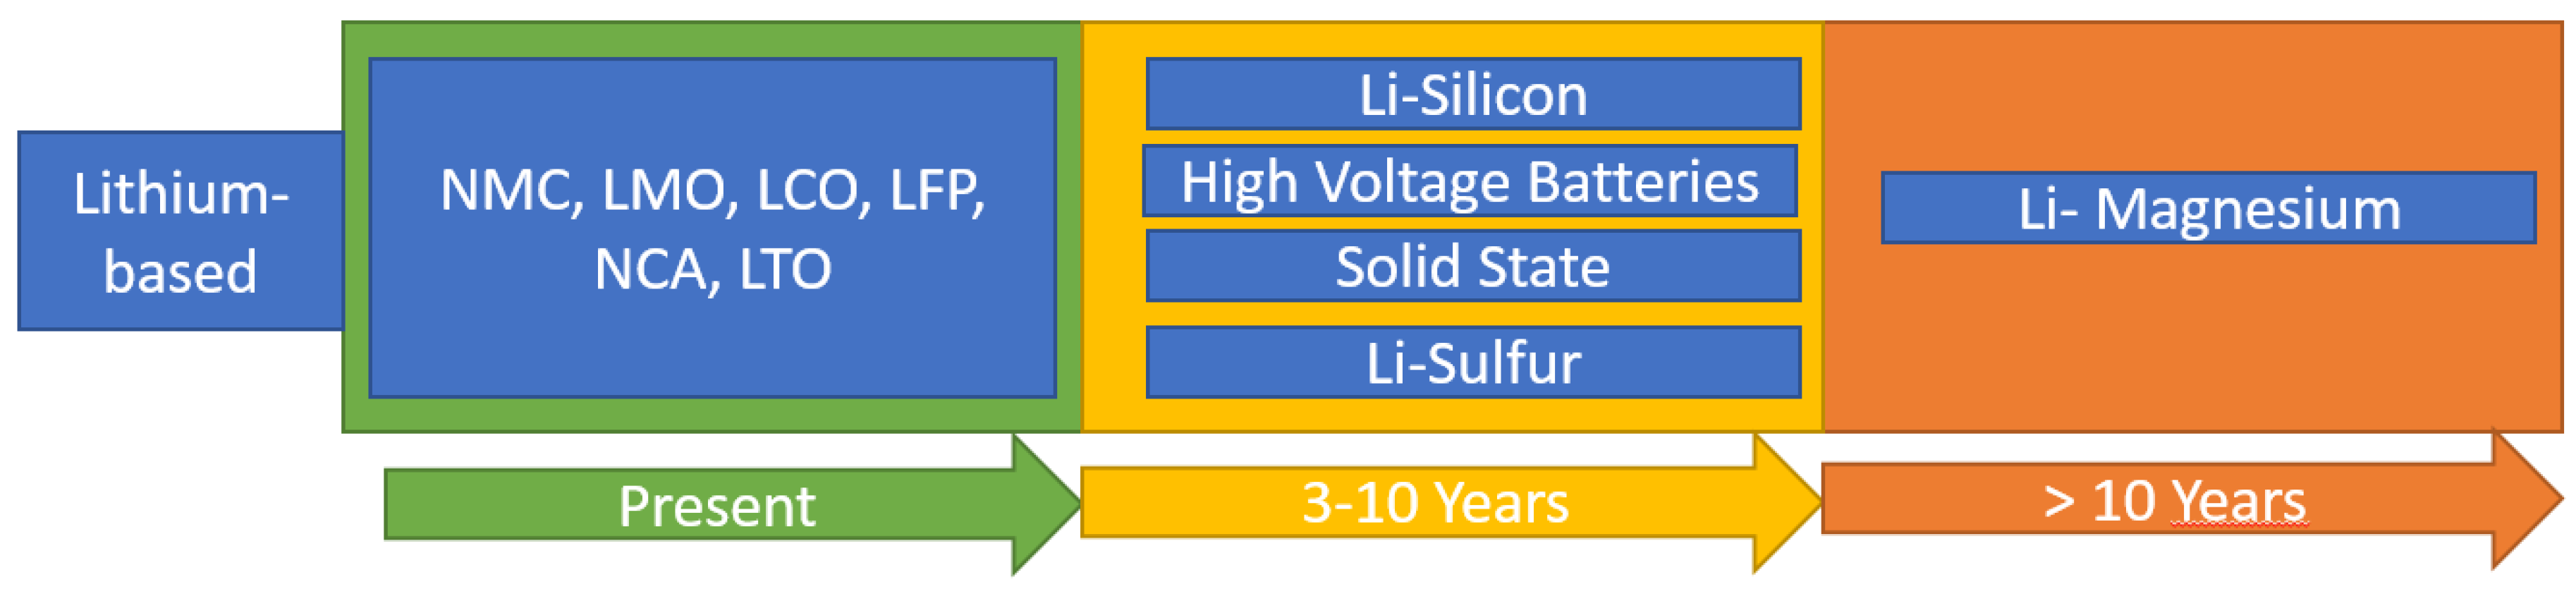
Figure 5.
Overview of the used methodology including learning curves.

Figure 6.
Cost breakdown of battery I with a special focus on the anode composition.
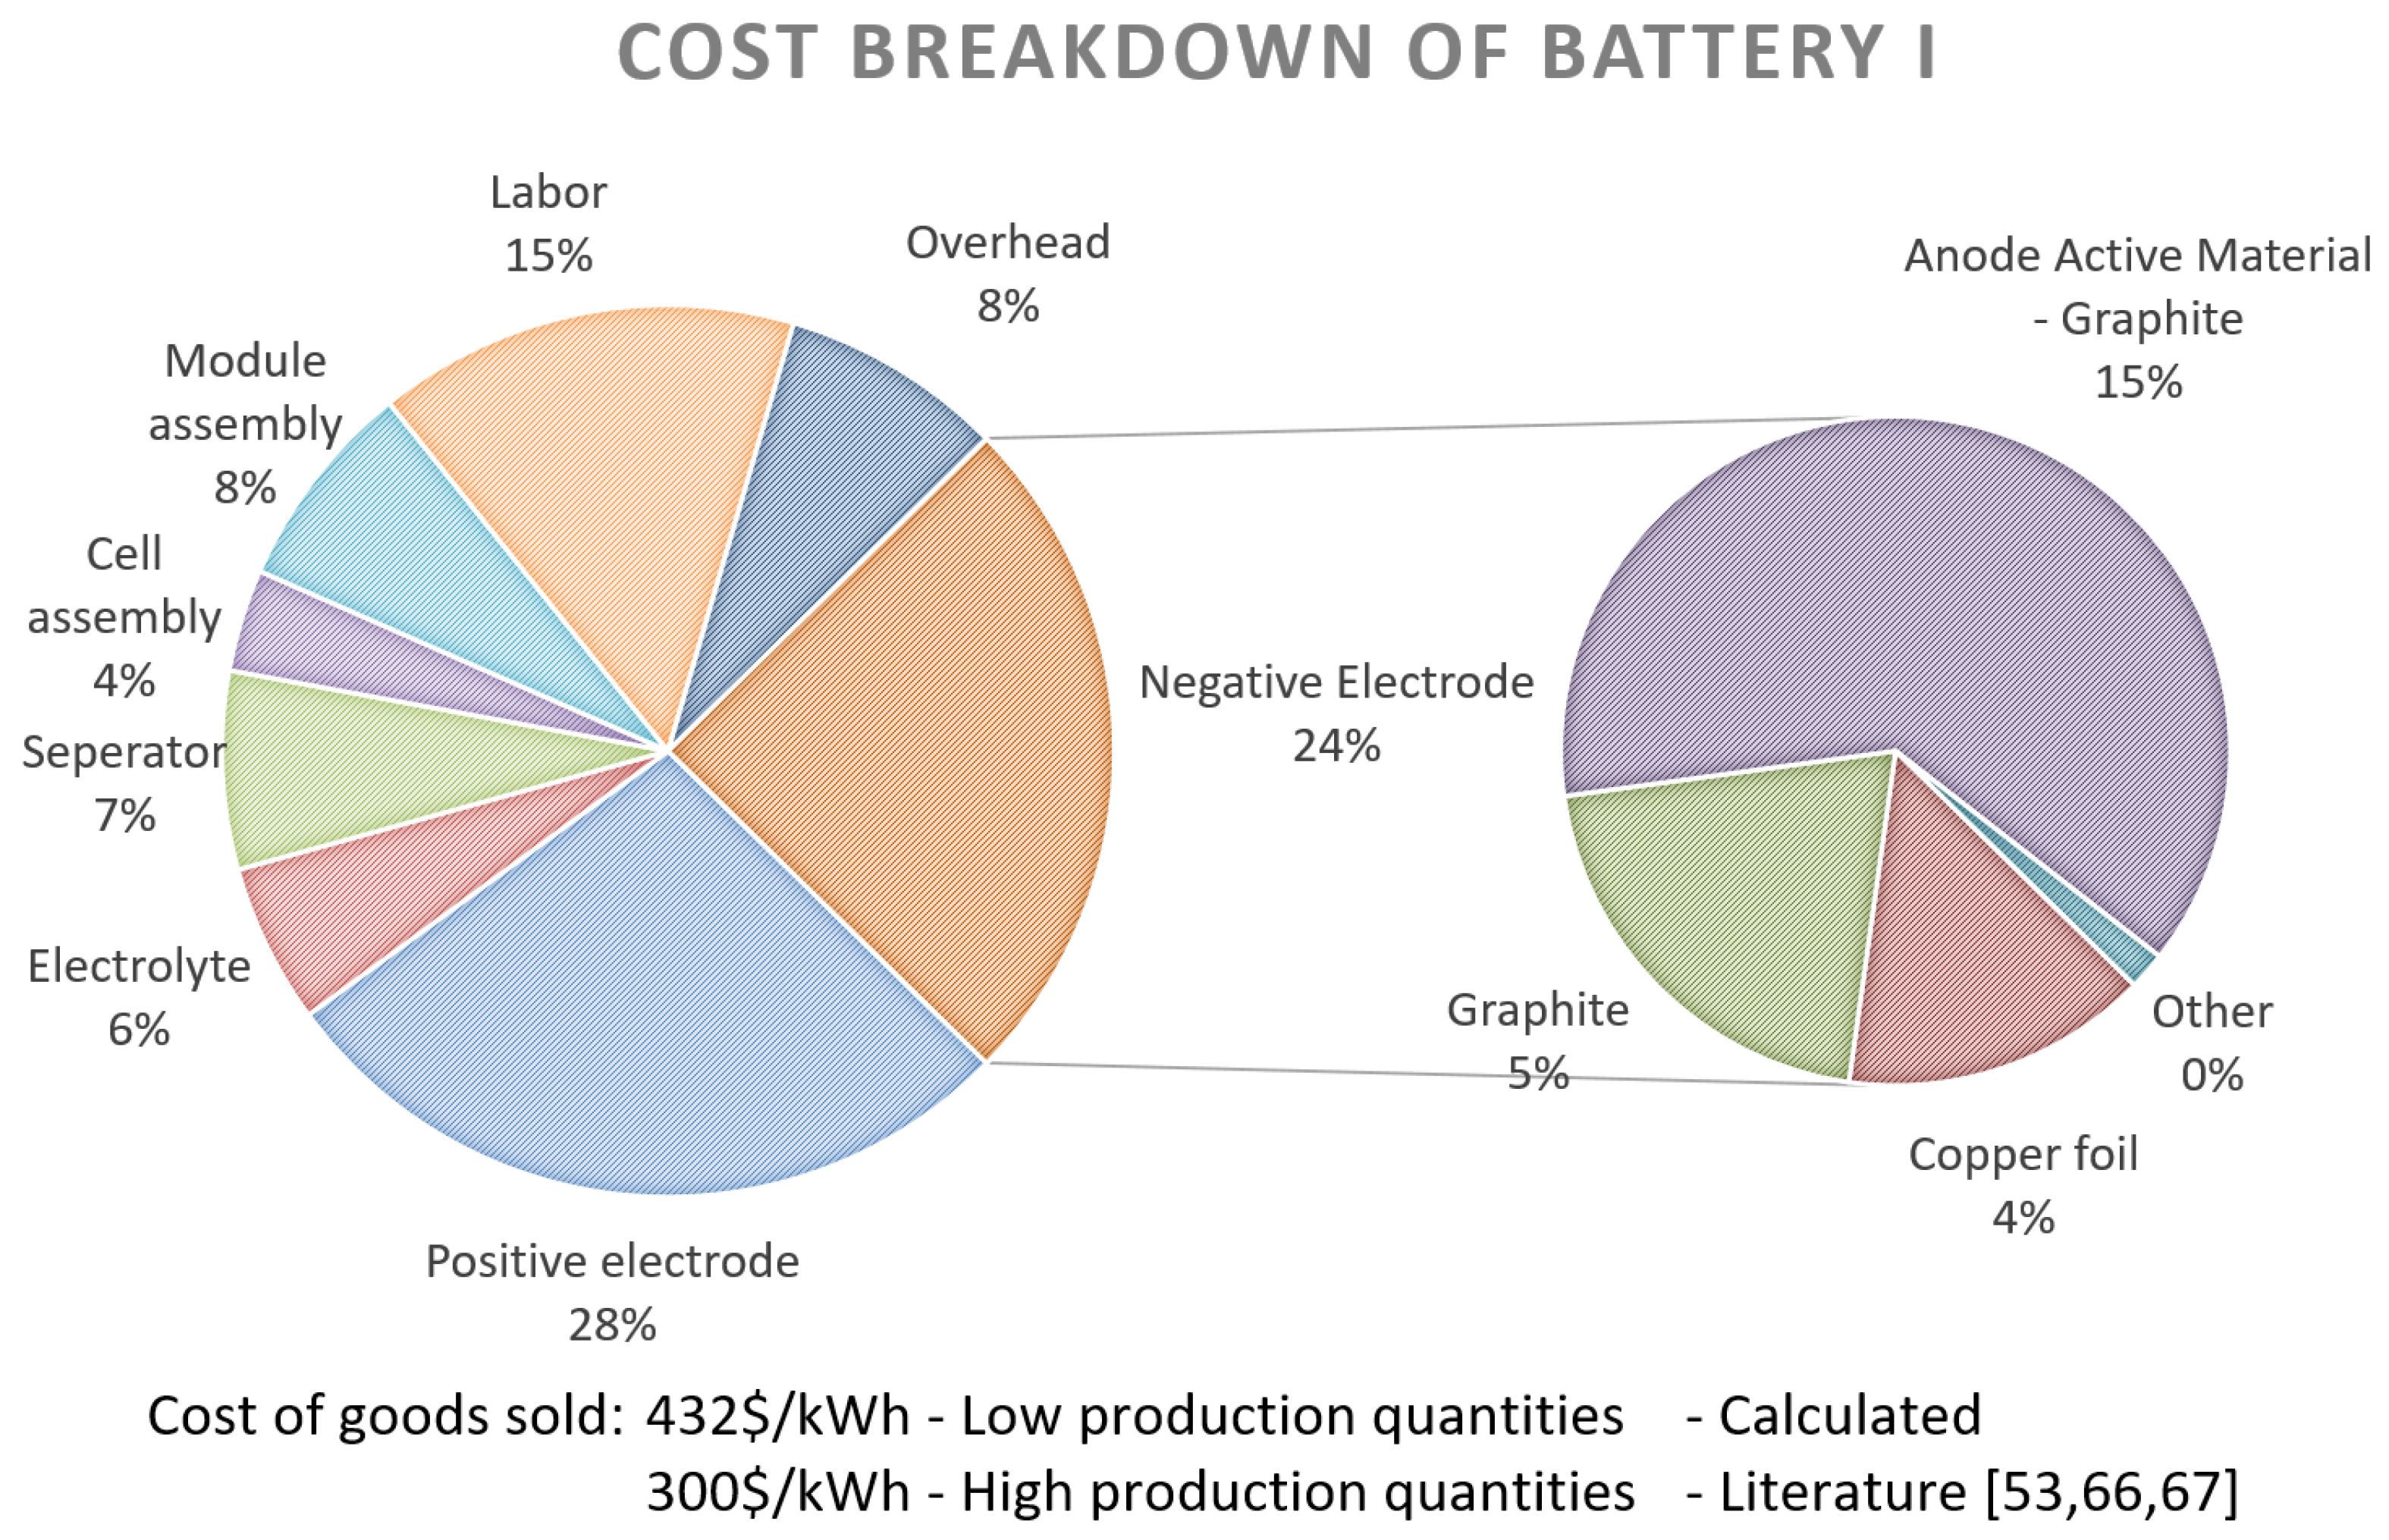
Figure 7.
Sales price of battery I.
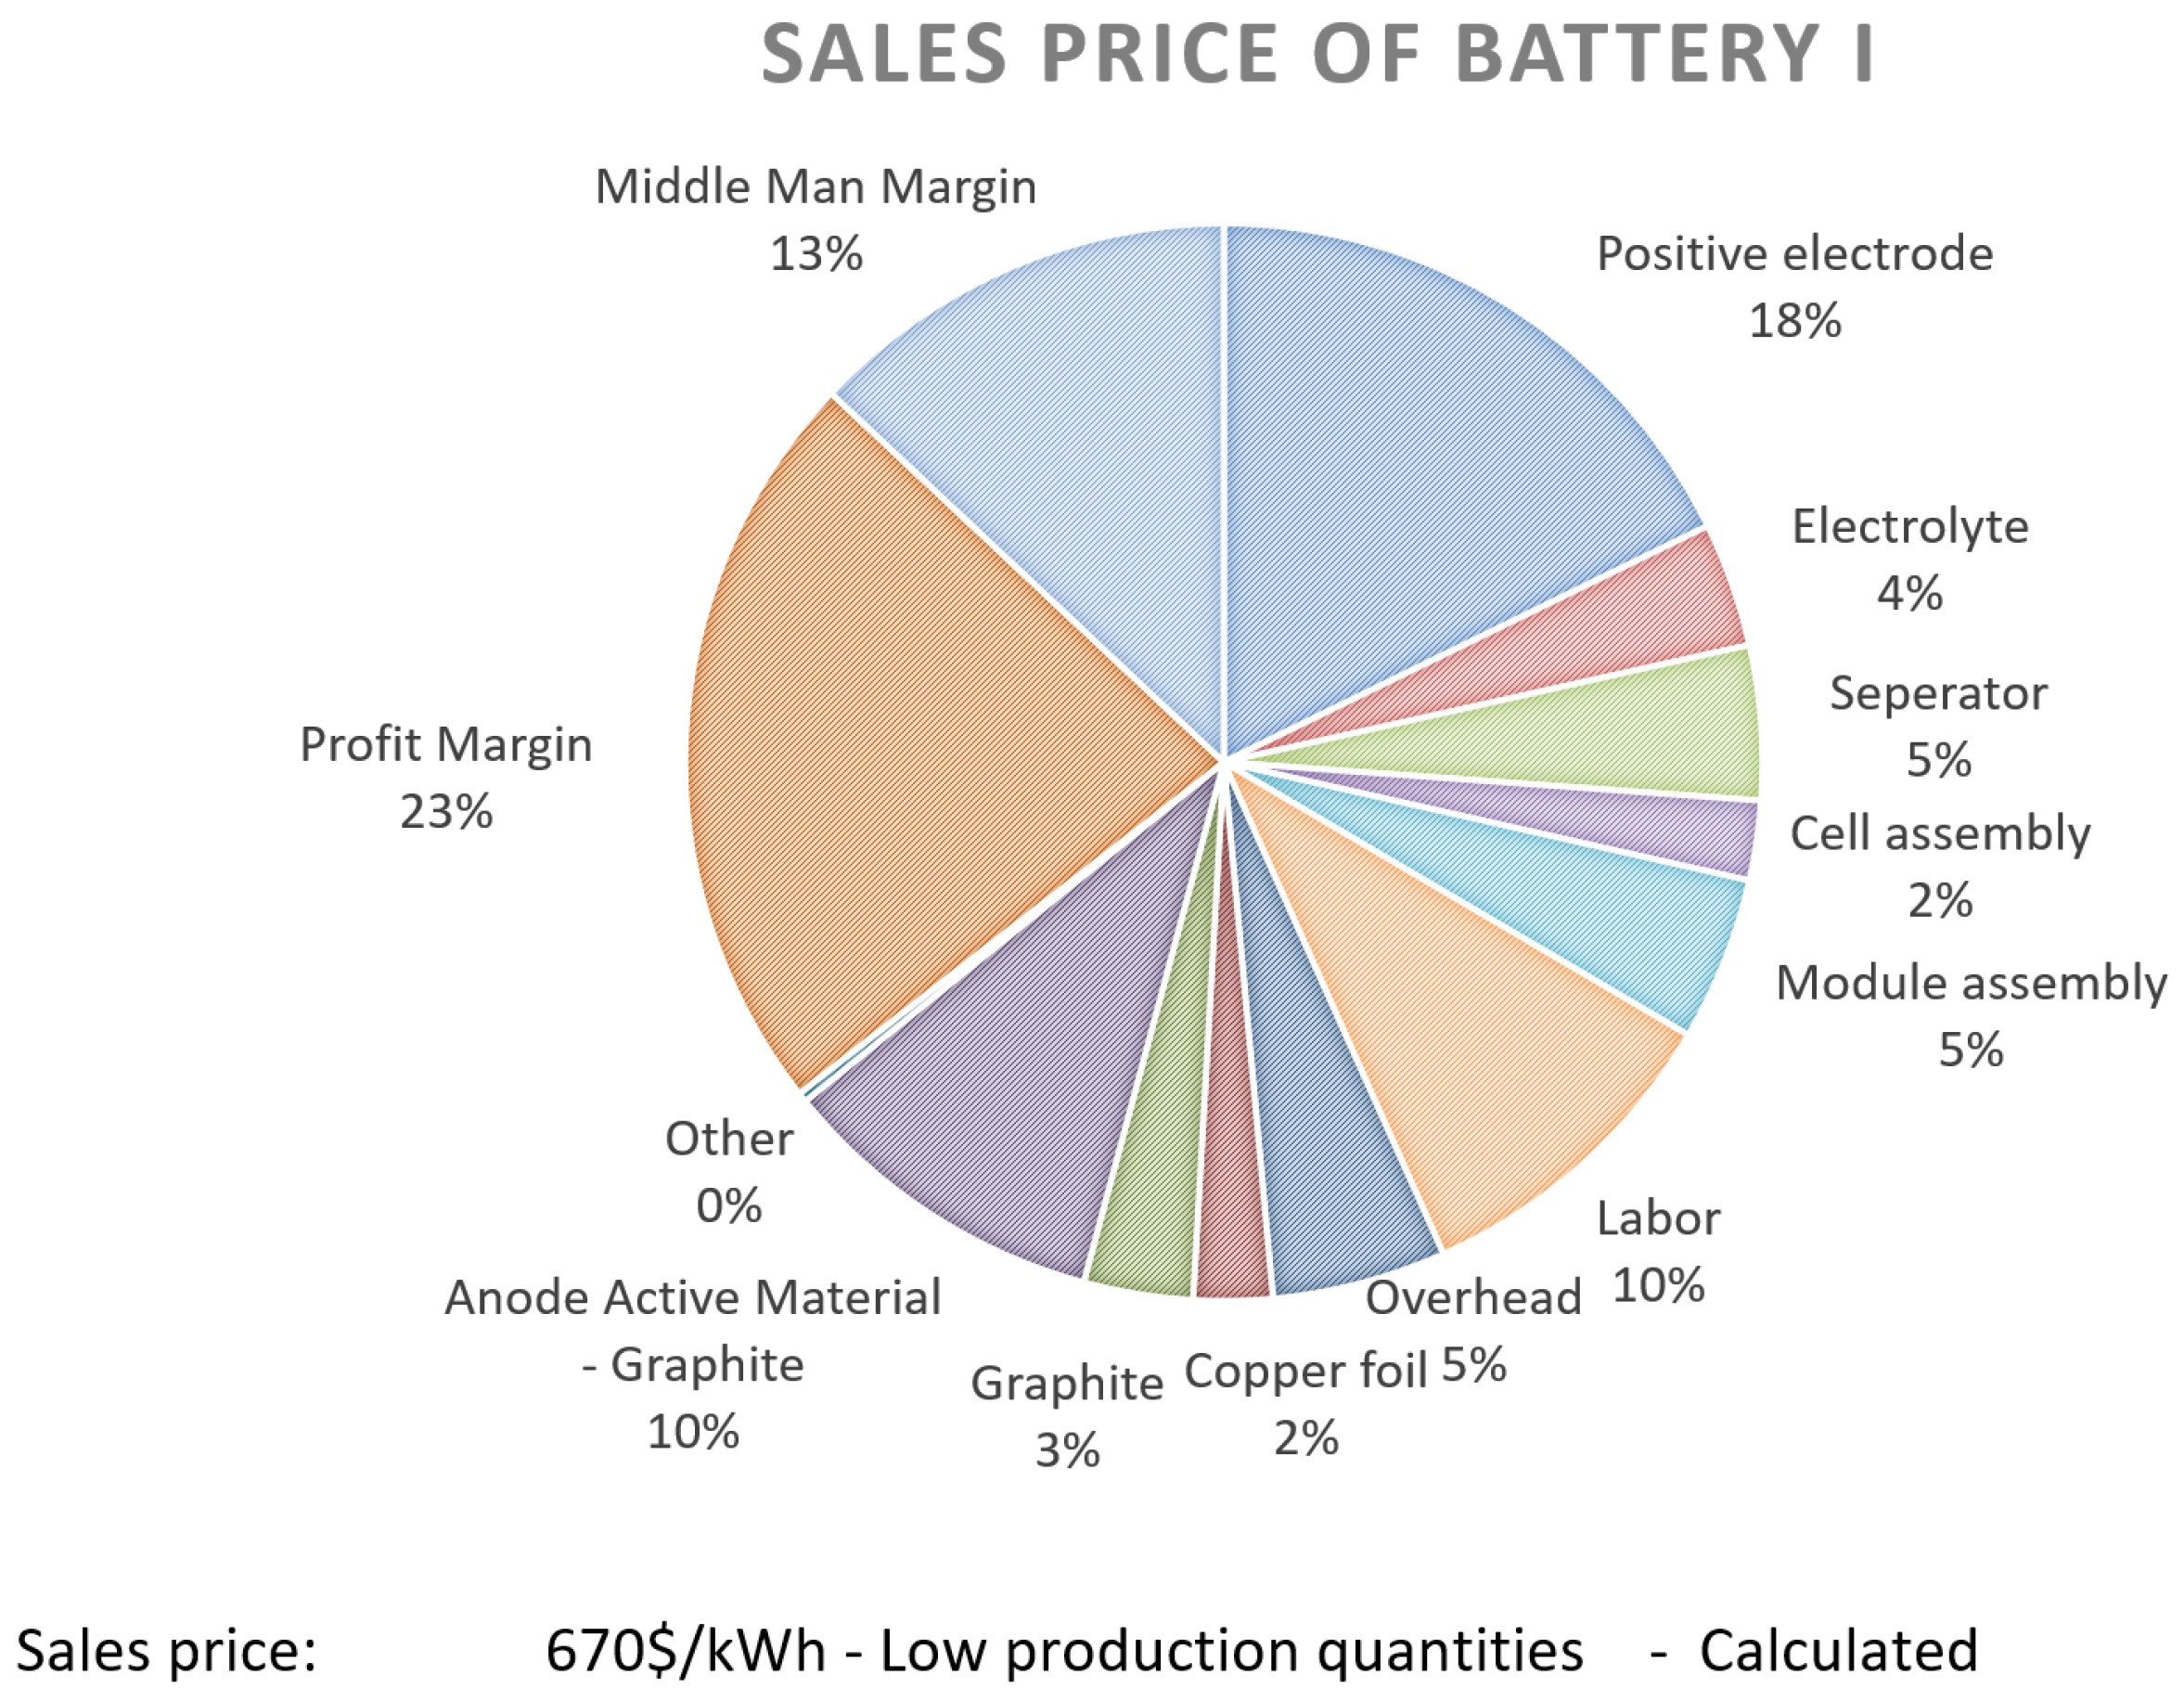
Figure 8.
Cost breakdown of battery II with a special focus on the anode composition.
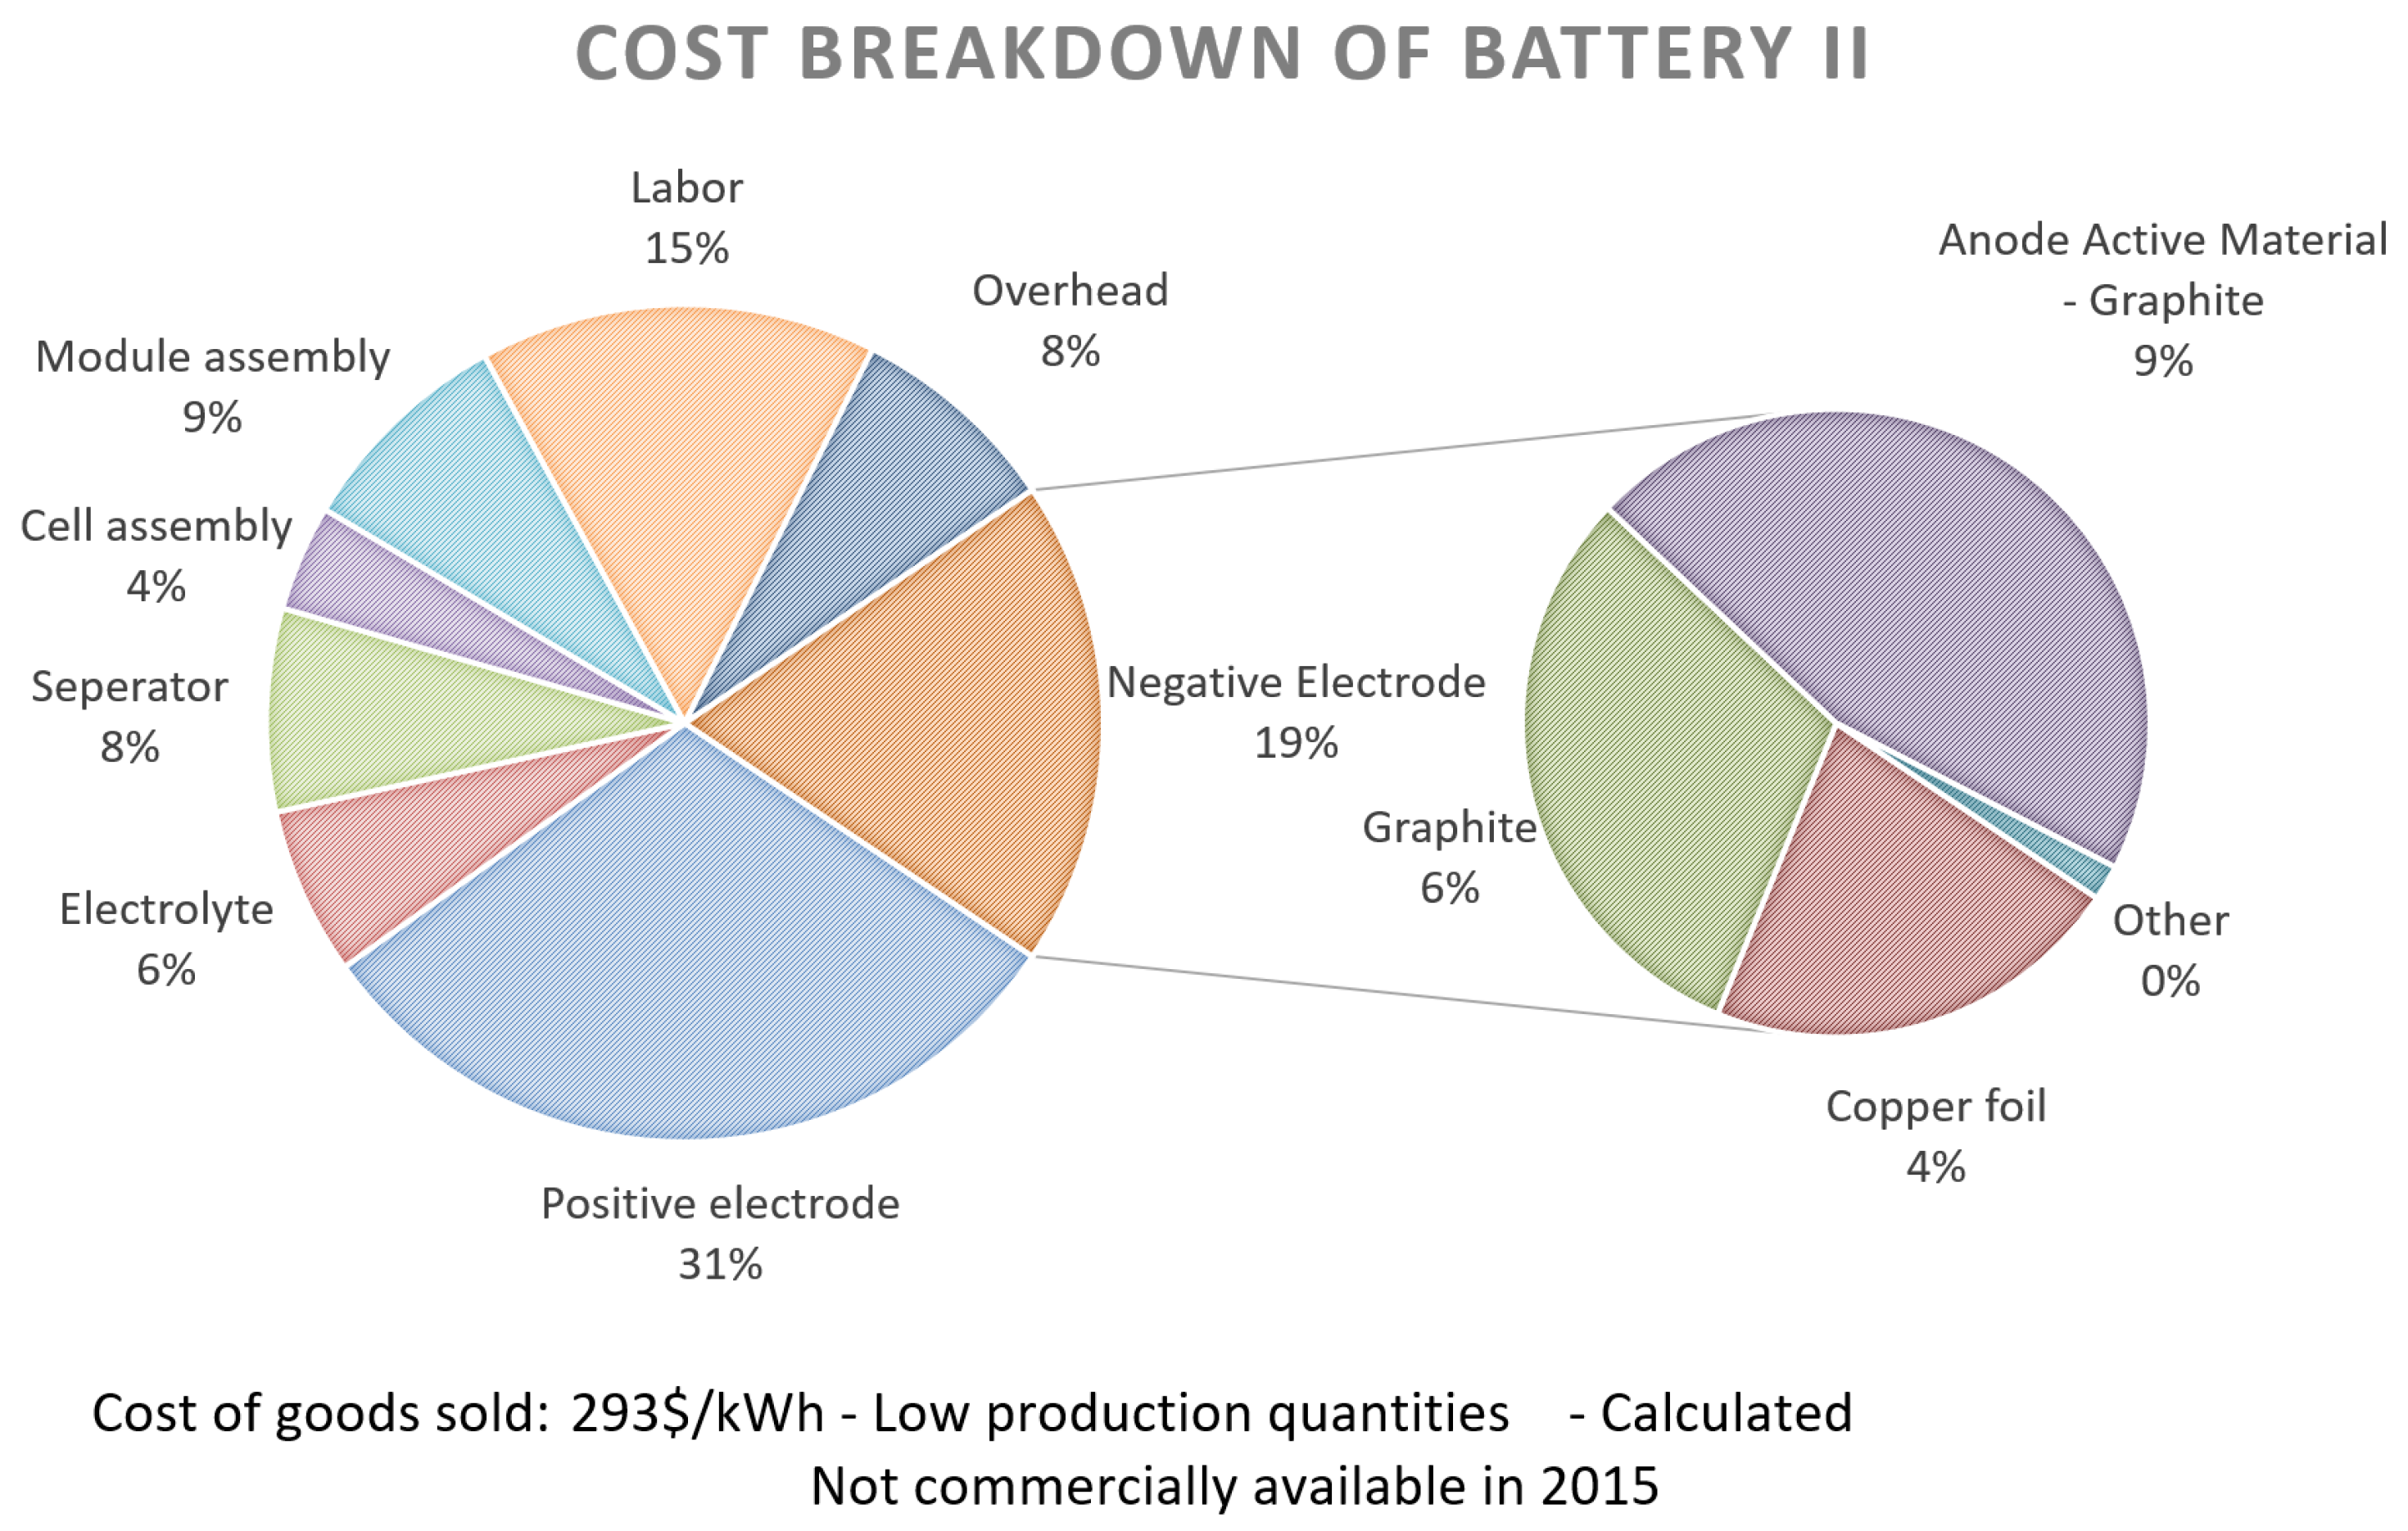
Figure 9.
Sales price of battery II.
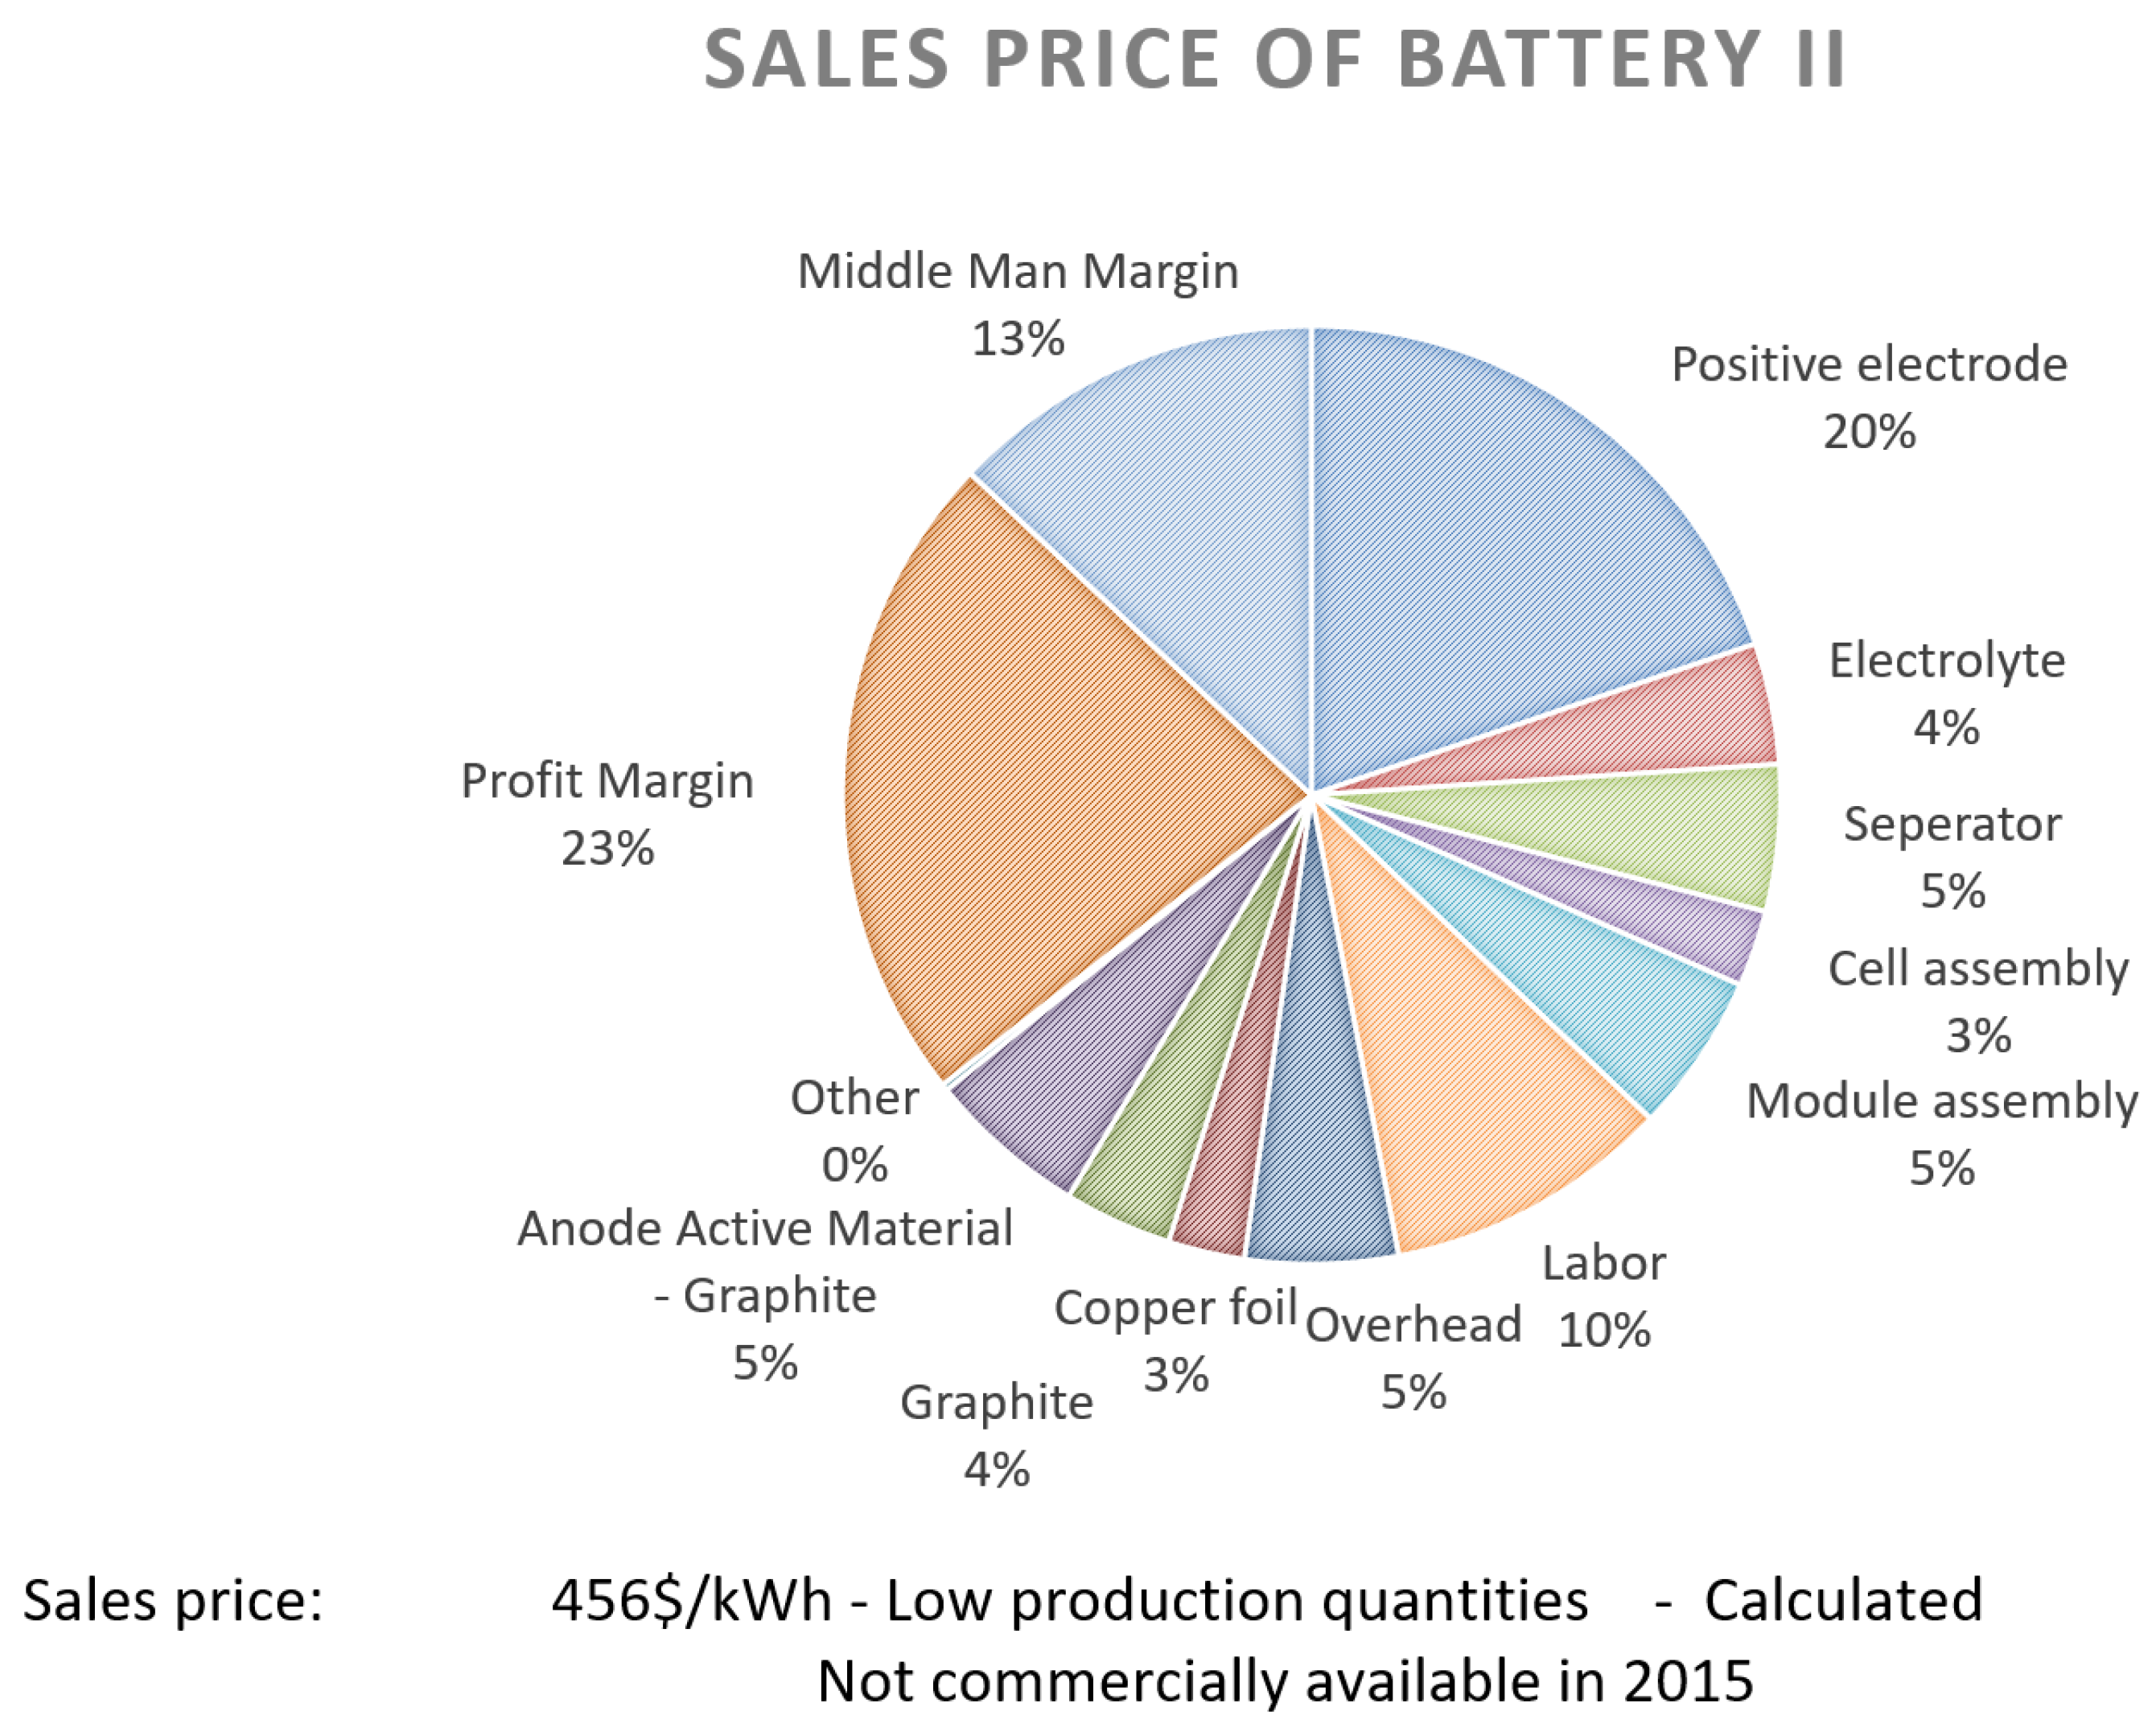
Figure 10.
Overview of the used methodology including its key equations.
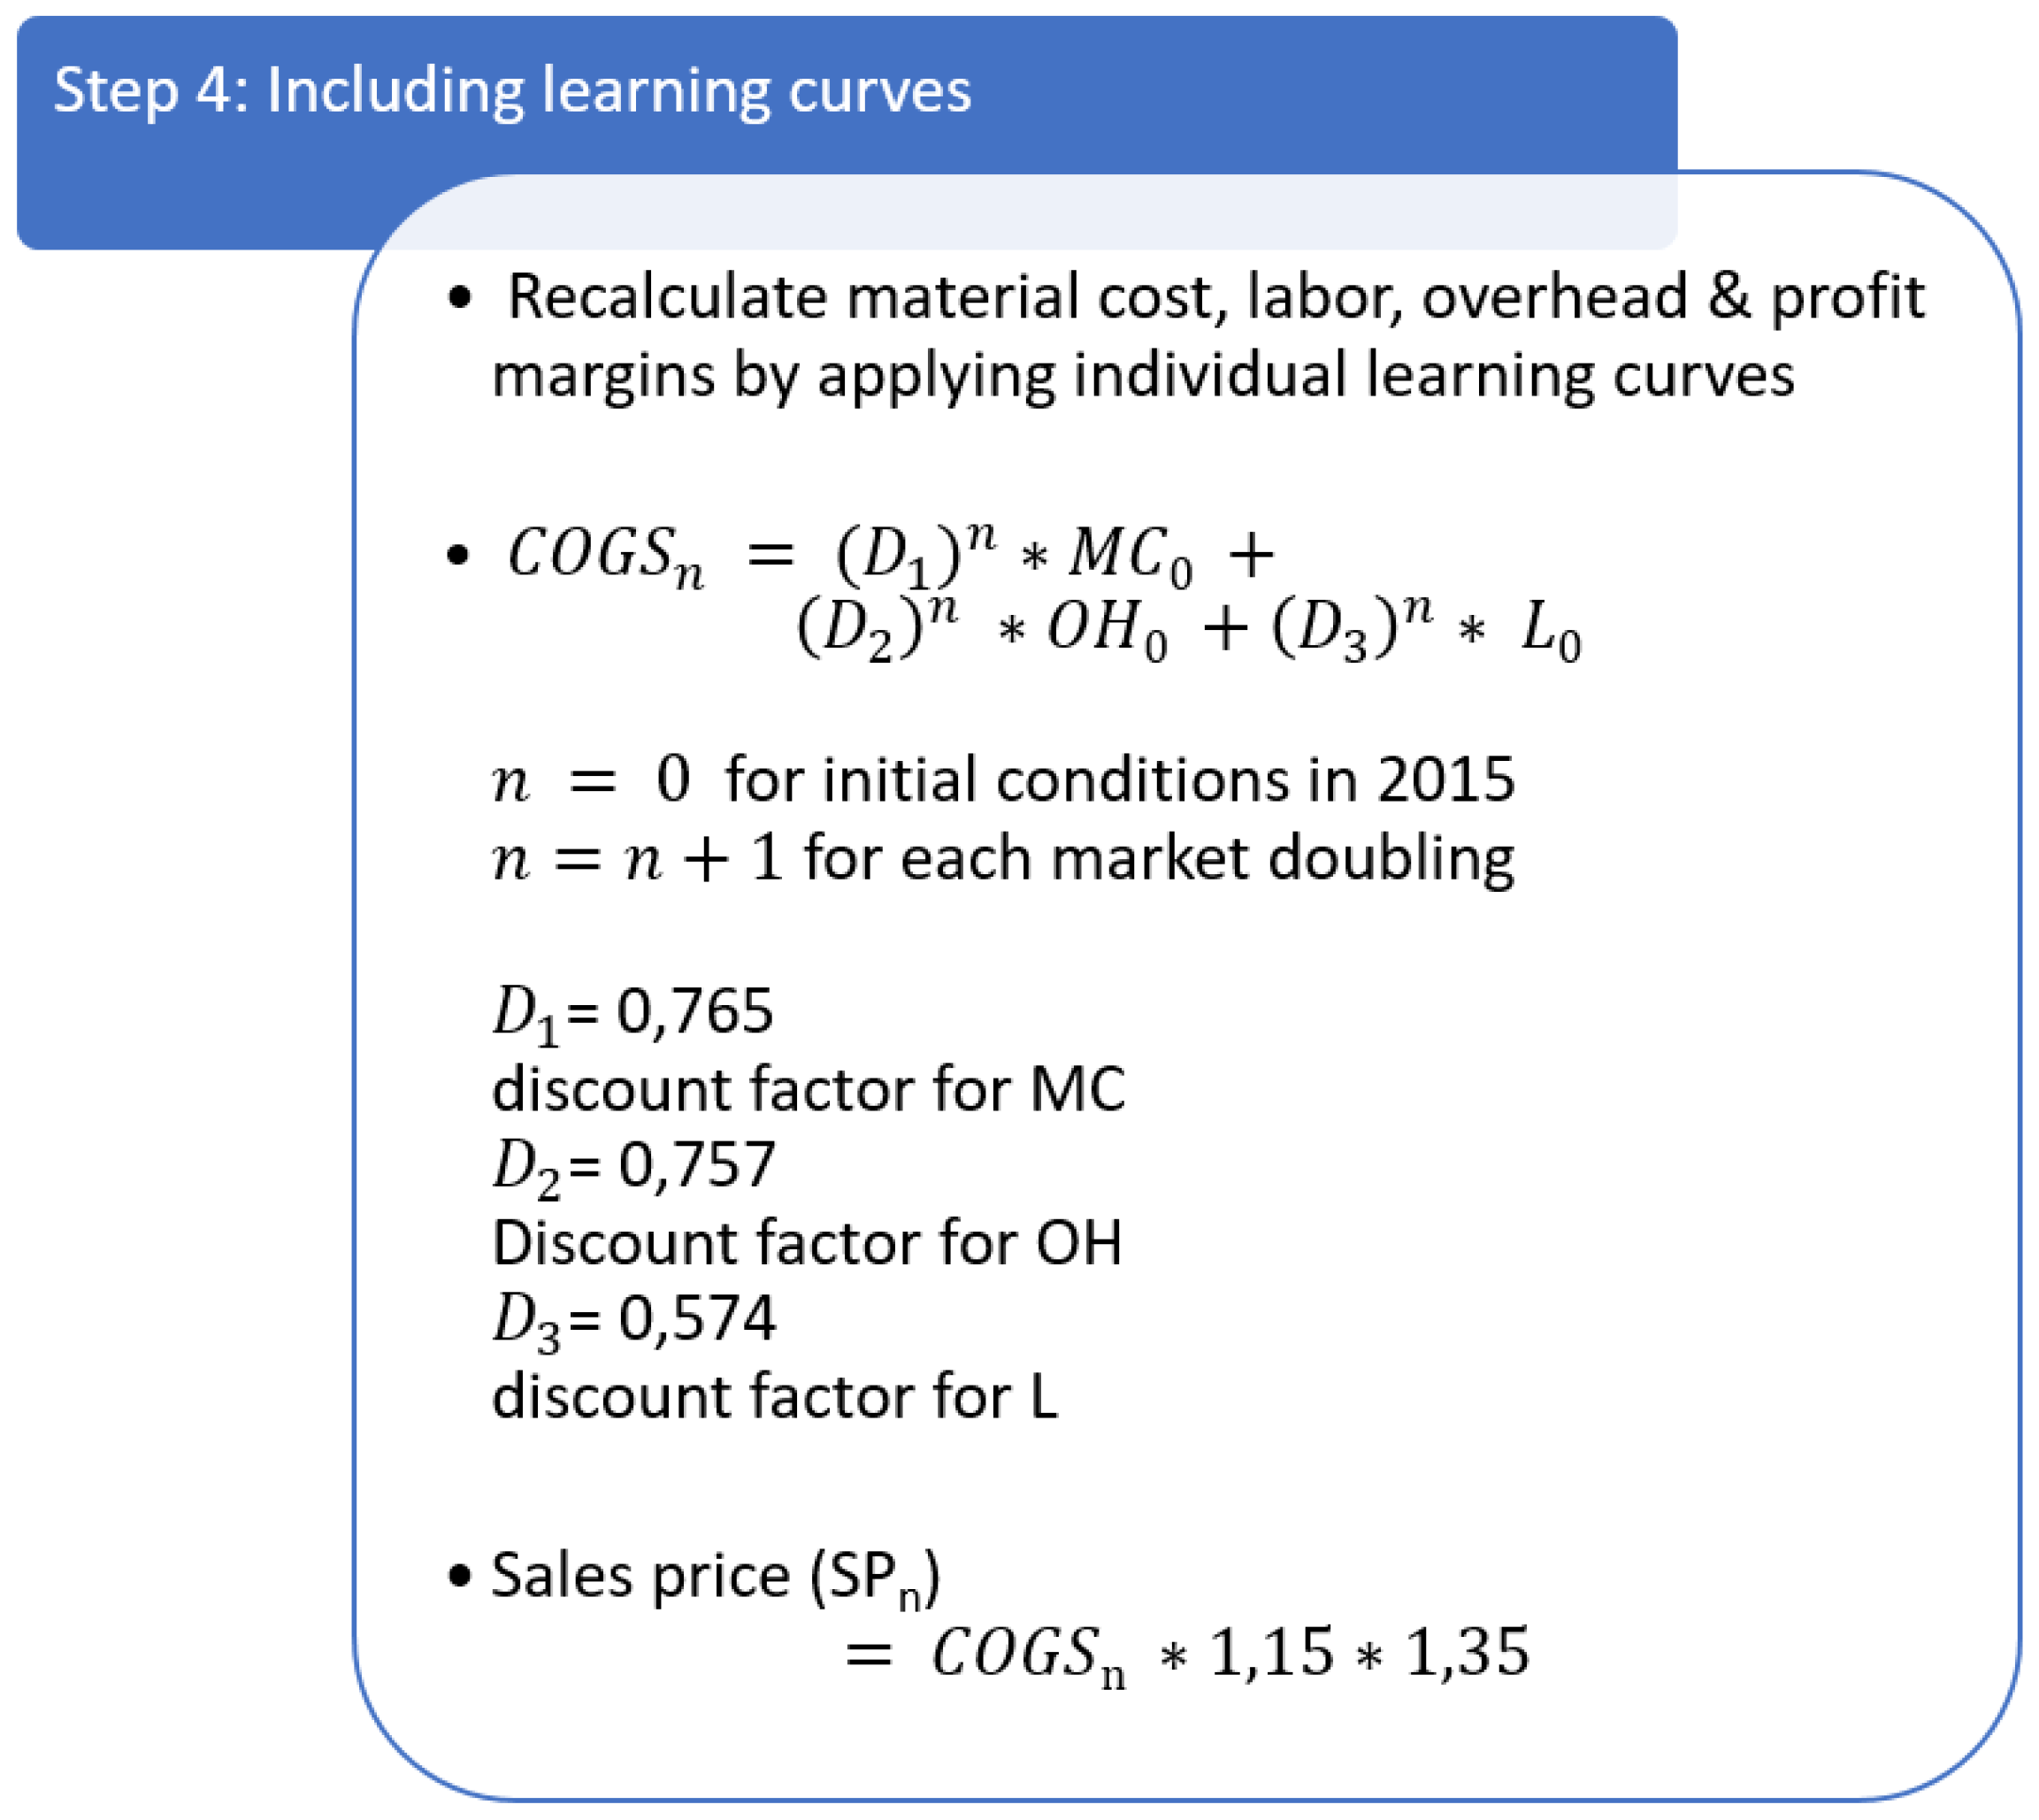
Figure 11.
Prediction of sales price of battery I up to 2030.
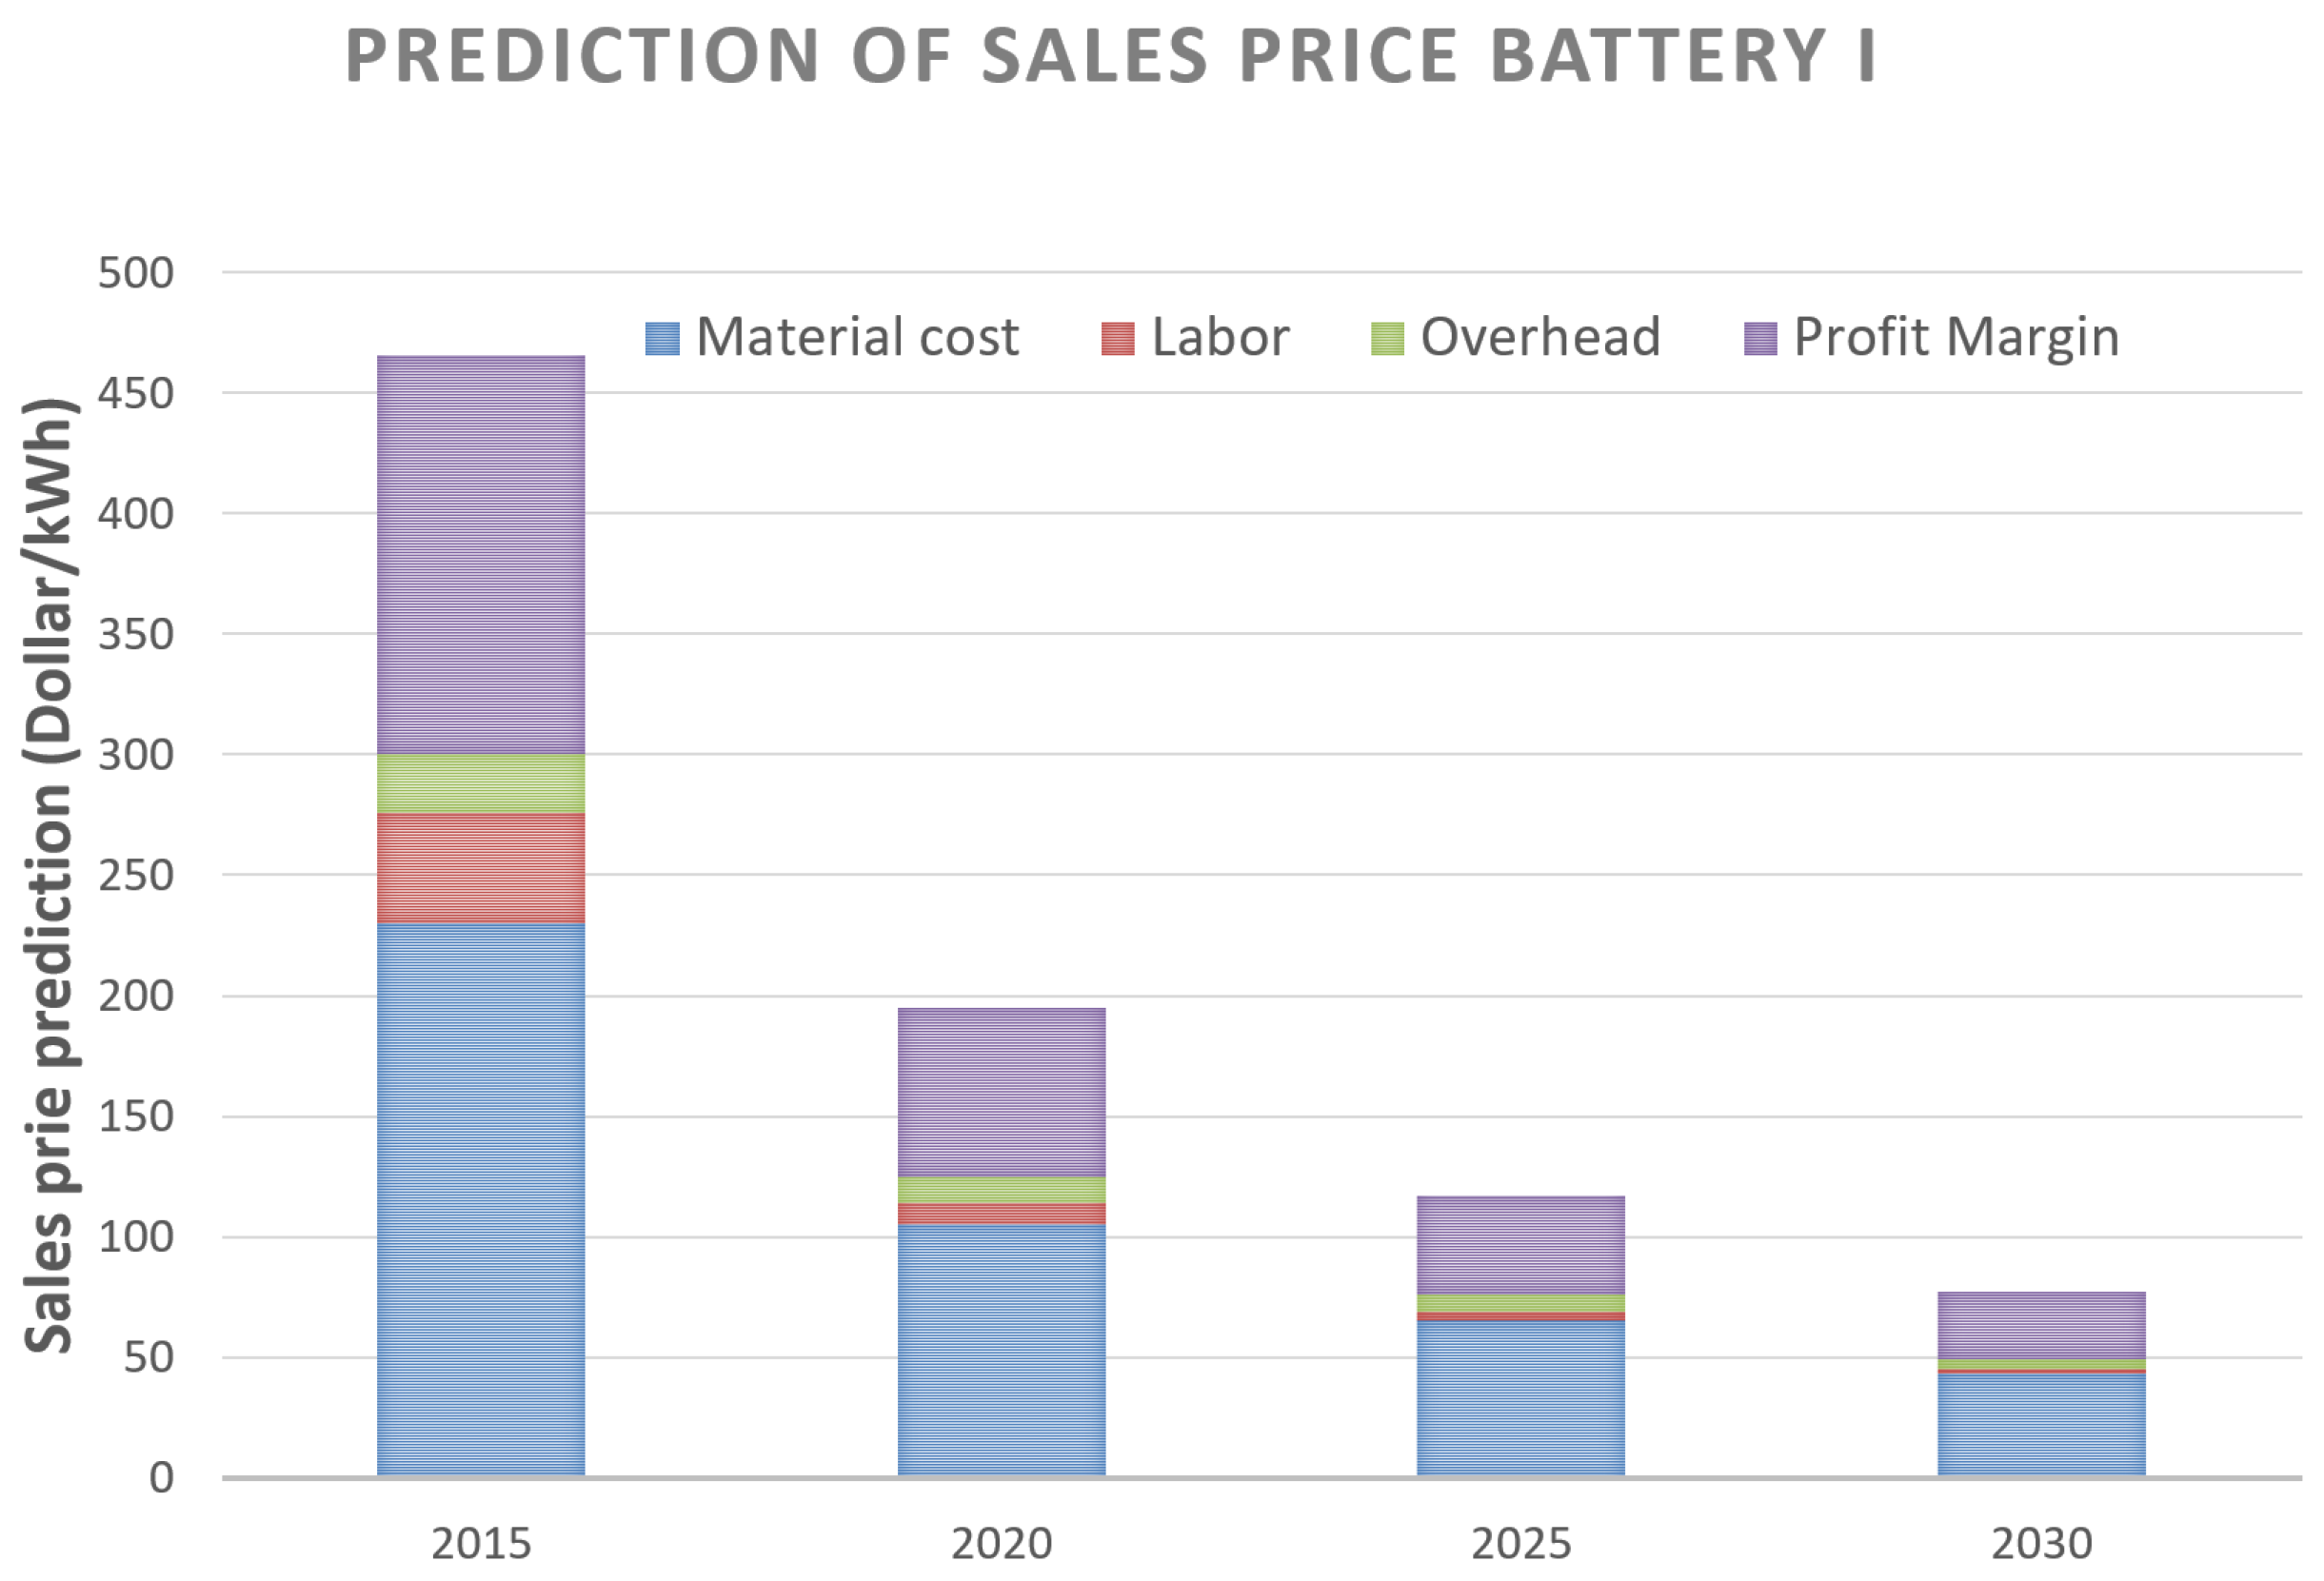
Figure 12.
Prediction of sales price of battery II up to 2030.

Figure 13.
Sales price prediction of lithium-ion batteries in 2020.


Table 1.
Overview of electric vehicles commercially available in 2016, adapted from [5].
Table 1.
Overview of electric vehicles commercially available in 2016, adapted from [5].
| Vehicle Segment | Brand | Model | Model Year | Battery Energy Content (kWh) | Range (km) |
|---|---|---|---|---|---|
| Small | Smart | Fortwo | 2014 | 17,6 | 160 |
| Toyota | iQ EV | 2012 | 12 | 85 | |
| Fiat | 500e | 2015 | 24 | 135 | |
| Citroen | C-Zero | 2014 | 14,5 | 150 | |
| Peugeot | iOn | 2014 | 14,5 | 150 | |
| Mitsubitshi | i-MiEV | 2014 | 16 | 160 | |
| VW | e-up! | 2013 | 18,7 | 160 | |
| Chevrolet | Spark Ev | 2015 | 18,4 | 130 | |
| Bollore | Bluecar | 2015 | 30 | 250 | |
| Mitsubitshi | MinicabMiEV | 2014 | 16 | 150 | |
| Average | 18.2 | 153 | |||
| Median | 16.8 | 150 | |||
| Medium-Large | BMW | i3 | 2014 | 22 | 190 |
| Renault | Zoe | 2015 | 22 | 240 | |
| Volvo | C30 Electric | 2015 | 24 | 145 | |
| VW | e-Golf | 2016 | 24,2 | 190 | |
| Nissan | Leaf (2016) | 2014 | 30 | 250 | |
| Honda | FIT EV | 2012 | 20 | 130 | |
| Renault | Fluence Z.E. | 2015 | 22 | 185 | |
| Ford | Focus EV | 2015 | 23 | 162 | |
| Kia | Soul Electric | 2015 | 27 | 212 | |
| Mercedes | B-class El.Dr. | 2015 | 36 | 230 | |
| BYD | e6 | 2015 | 61,4 | 205 | |
| Nissan | e-NV200 | 2015 | 24 | 170 | |
| Toyota | RAV 4 EV | 2014 | 41,8 | 182 | |
| Tesla | Model S | 2015 | 75 | 480 | |
| Tesla | Model X | 2015 | 90 | 489 | |
| Average | 36.2 | 231 | |||
| Median | 24.2 | 190 | |||
Table 2.
Overview of most sold hybrid electric vehicles in 2016 in Europe (10 most popular).
| Vehicle Segment | Brand | Model | Model Year | Battery Energy Content (kWh) | Range (km) |
|---|---|---|---|---|---|
| Medium-Large | VW | Passat GTE | 2015 | 9,9 | 50 |
| Mitsubishi | Outlander PHEV | 2013 | 12 | 52 | |
| Volvo | XC90 PHEV | 2015 | 9,2 | 40 | |
| Mercedes | GLC350e | 2016 | 8,7 | 34 | |
| BMW | 225xe Active Tourer | 2015 | 7,6 | 41 | |
| Mercedes | C350e | 2015 | 6,5 | 31 | |
| BMW | 330e | 2015 | 7,6 | 40 | |
| BMW | X5 40e | 2015 | 9 | 31 | |
| Audi | A3 e-Tron | 2014 | 9 | 50 | |
| BMW | i3 range extended | 2013 | 22 | 320 | |
| Average | 18.2 | 153 | |||
| Median | 9 | 41 | |||
Table 3.
Anode materials—Overview including specific energy density, cost and lifetime.
| Anode Material | Energy Density | Cost | Lifetime |
|---|---|---|---|
| (mAh/g) | |||
| Graphite | 372 | Medium | Medium |
| Li4Ti5O12 (LTO) | 175 | High | High |
Table 4.
Cathode materials—Overview including energy density cost and lifetime.
| Cathode Material | Energy Density | Cost | Lifetime |
|---|---|---|---|
| (Wh/kg) | |||
| LiCoO2 (LCO) | 546 | Medium | Medium |
| LiMn2O4 (LMO) | 410–492 | Low | Low |
| LiNiMnCoO2 (NMC) | 610–650 | High | High |
| LiFePO4 (LFP) | 518–587 | Medium | High |
| LiNiCoAlO2 (NCA) | 680–760 | High | Medium |
Table 5.
Overview of the cell chemistries used for cost calculations. The first one will be referred to as the NMC battery and the second one as the silicon based lithium-ion battery.
Table 5.
Overview of the cell chemistries used for cost calculations. The first one will be referred to as the NMC battery and the second one as the silicon based lithium-ion battery.
| Battery I | Battery II | |
|---|---|---|
| Positive electrode | NMC (6:2:2) | NMC (6:2:2) |
| Negative electrode | Graphite | Silicon Alloy [50] |
| Pack energy density | 155 Wh/kg | 205 Wh/kg |
Table 6.
Battery cell manufacturing process summary including material in- and outflow.
| Manufacturing Process | Material | |
|---|---|---|
| Electrode Manufacturing | Slurry Mixing | + Active Material |
| + Conductive agent | ||
| + Solvents | ||
| + Binder | ||
| Coating | + Al/Cu foil | |
| Drying | − Solvents | |
| Calendaring | ||
| Cutting | + Remaining al/Cu foil | |
| Cell Assembly | Stacking/Winding | + Separator |
| + Adhesive Tape | ||
| + Al/Cu tabs | ||
| Packaging (Pouch/Case) | + Pouch Foil/casing | |
| Temporary sealing | + Solvents | |
| Drying | ||
| Filling | − Remaining al/Cu foil | |
| Permanent Seal | ||
| Formation | Formation | |
| Cell Testing | ||
Table 7.
Anode active material battery II—detailed.
| Material | Amount | Price in 2015 |
|---|---|---|
| (kg) | (Dollar) | |
| Si73FeI7C10 | 0.6 | 2.76 |
| Graphite | 0.128 | 1.25 |
| Carbon nanotubes | 0.16 | 4.17 |
| Carboxy methyl cellulose | 0.032 | 2.96 |
| LiPAA | 0.08 | 11.25 |
| Total | 1 | 22.39 |
Table 8.
BEV and EV market growth.
| Year | Amount of BEV (Millions) | Amount of HEV (Millions) | Market growth |
|---|---|---|---|
| 2015 | 0.4 | 0.3 | 1 (Baseline) |
| 2020 | 1.8 | 3.4 | 7 |
| 2025 | 6.2 | 11.1 | 25 |
| 2030 | 10.5 | 25.8 | 52 |
© 2017 by the authors. Licensee MDPI, Basel, Switzerland. This article is an open access article distributed under the terms and conditions of the Creative Commons Attribution (CC BY) license (http://creativecommons.org/licenses/by/4.0/).
Share and Cite
MDPI and ACS Style
Berckmans, G.; Messagie, M.; Smekens, J.; Omar, N.; Vanhaverbeke, L.; Van Mierlo, J. Cost Projection of State of the Art Lithium-Ion Batteries for Electric Vehicles Up to 2030. Energies 2017, 10, 1314. https://doi.org/10.3390/en10091314
AMA Style
Berckmans G, Messagie M, Smekens J, Omar N, Vanhaverbeke L, Van Mierlo J. Cost Projection of State of the Art Lithium-Ion Batteries for Electric Vehicles Up to 2030. Energies. 2017; 10(9):1314. https://doi.org/10.3390/en10091314
Chicago/Turabian StyleBerckmans, Gert, Maarten Messagie, Jelle Smekens, Noshin Omar, Lieselot Vanhaverbeke, and Joeri Van Mierlo. 2017. "Cost Projection of State of the Art Lithium-Ion Batteries for Electric Vehicles Up to 2030" Energies 10, no. 9: 1314. https://doi.org/10.3390/en10091314
Note that from the first issue of 2016, this journal uses article numbers instead of page numbers. See further details here.