An Energy-Efficient Coverage Algorithm for Macrocell—Small Cell Network Systems


Department of Communications, Navigation and Control Engineering, National Taiwan Ocean University, Keelung City 20224, Taiwan
Energies 2017, 10(9), 1319; https://doi.org/10.3390/en10091319
Submission received: 22 July 2017
/
Revised: 5 August 2017
/
Accepted: 30 August 2017
/
Published: 1 September 2017
Abstract
:The energy efficiency of a macrocell base station (MBS) can be substantially improved via the deployment of small cell base stations (SBSs) within the coverage area of the MBS. Moreover, this approach is expected to remain a key feature of communication network markets in the future. However, little research has been conducted to uncover effective solutions to the issue of coverage holes (i.e., specific locations or areas in which a user is not able to get an adequate signal from the wireless network) that may occur in the context of such a network architecture. To address this dearth of relevant research, the present study proposes an energy-efficient coverage algorithm utilizing novel system configurations, for use in such macrocell—small cell network systems. The goal of the proposed algorithm is providing the maximum possible reduction of the combined power consumed by the transceivers of all the BSs (that is, the SBSs and the MBS), while simultaneously guaranteeing the provision of comprehensive wireless signal coverage to users under various scenarios. In order to accomplish this aim in an efficient manner, the algorithm smartly adjusts the power levels of all the SBSs in a given system, including the full deactivation of a previously active SBS, or the activation of a previously inactive SBS, according to the dynamics of the given network traffic, thereby modifying their power consumption as necessary. The results for simulations of various test scenarios indicated that the algorithm exhibits better performance than two conventional methods in terms of its overall effects on coverage, power usage, and average transmission rate. The simulated power savings yielded by the proposed algorithm were particularly notable, as it garnered an improvement as high as 78% under the condition of light traffic volumes.
1. Introduction
In recent years, the flow rate indices for wireless transmission in mobile networks have exhibited continuous growth. In fact, it is expected that mobile data throughput will have increased by seven-fold from 2016 to 2021, according to a forecast published by Cisco [1]. The increased utilization of mobile devices, including devices supporting data services (smartphones in particular), is primarily responsible for this ongoing growth in mobile data throughput. In this context of rapid throughput growth, one effective means of ensuring that sufficient resources are provided and that service quality is maintained on a local level is the deployment of small cell base stations (SBSs) inside the coverage area of a macrocell base station (MBS). By allowing for the efficient utilization of spectrum resources, which in turn allows for increased network capacity and is thus key to enhancing the energy efficiency of networks, the use of SBSs makes it easier for network operators to meet the requirements of network users. In other words, for operators seeking to ensure efficient transmission in the context of modern wireless network environments, it is generally understood that the utilization of a two-layer cellular network architecture (that is, small cell areas incorporated into a larger macrocell area) is key [2,3].
The Small Cell Forum [4] predicted that the SBS market will substantially grow in the next few years, providing services to more and more mobile users. Hence, the spread of SBSs and related devices, along with associated technological growth, are expected to be ongoing. With data transmission projected to grow notably by the year 2021, and in order to achieve the vision of “seamless connection”, “incessantness”, and “connection without connections”, the 3rd Generation Partnership Project (3GPP) organization suggested the widespread and high-density deployment of SBSs. High-density SBS deployment is considered to be a highly promising strategy to address the demand for high capacity in next-generation networks, and is also expected to be a subject of considerable interest in future research studies. Relatedly, it is essential that current research into the improvement of data transmission efficiency in such network environments via the more efficient allocation of resources be continued.
One problem that research thus far has failed to effectively address, however, is that of the coverage holes that may occur in a two-layer cellular network. Coverage holes consist of specific locations or areas in which a user is not able to get an adequate signal from the wireless network. For example, in a metropolis with many irregularly distributed high buildings, signals may be obstructed by buildings, negatively affecting the quality of wireless reception. For related reasons of physical obstruction, there is typically no signal available in mountain caves, basements, or elevators. At the same time, the internet has become and will continue to be an integral element of people’s lives, such that people expect ubiquitous network coverage. Indeed, whether or not a person absolutely needs to have network service at any given moment, its mere availability provides a sense of security. Thus, more in-depth investigations and discussion is required to address this ongoing problem.
The present study offers a potential means of addressing the problem of coverage holes in two-layer cellular networks, via its proposal of an energy-efficient coverage algorithm for use in such systems. The goal of the proposed algorithm is minimizing the combined power consumed by the transceivers of all the BSs (that is, the SBSs and the MBS) in a system, while simultaneously guaranteeing the provision of comprehensive wireless signal coverage to users under various scenarios. The simulation results for various test scenarios indicated that the algorithm yields substantially better system performance than two conventional methods in terms of coverage, power usage, and average transmission rate.
The remaining sections of this paper are organized as follows. An overview of the related previous research is provided in Section 2. Section 3 consists of an extended consideration of a two-layer cellular network system model, while Section 4 presents the study’s proposed energy-efficient coverage algorithm for use in such systems. The results of simulations run to test the algorithm’s performance are then presented in Section 5, while the key conclusions of the study are presented in Section 6.
2. Related Work
A substantial amount of the previous research regarding the design of cellular network resource allocation has been largely devoted to the involvement of the MBSs in those systems only, with numerous studies (such as [5,6,7,8,9,10,11]) having addressed, in a comprehensive manner, the individual contributions of a variety of approaches, in terms of improved system performance. For example, studies by Ng et al. investigated the proper allocation of resources in single-cell environments [5] and in multi-cell environments [6] when seeking to ensure energy-efficient transmission by the traditional MBS of single component carriers (CCs). The same authors later investigated the utilization of another type of MBS, namely, an MBS that itself utilized the harvesting of hybrid energy, for data transmissions [7]. More recently still, a study by Chung sought to provide a means of minimizing the energy used by the transceivers of an MBS utilizing two CCs, while simultaneously ensuring the necessary quality of service and fairness for users through its proposal of a rate-and-power control transmission scheme [8]. Subsequently, another paper by Chung considered the same system in its construction of a framework aimed at thoroughly examining how to ensure transmission efficiency via both the maximization of system capacity and the minimization of the total energy consumed [9]. This was followed by still another paper from the same author, in which a more flexible scheme for the efficient minimization of total power consumed by the transceivers of an MBS utilizing two or more CCs (while simultaneously ensuring the necessary quality of service and fairness for users) was proposed [10]. That study was followed, in turn, by one in which the author proposed an efficient packet scheduling algorithm aimed at increased transmission efficiency in the context of the simultaneous transmission of both real-time traffic and non-real-time traffic [11].
While those studies largely focused, again, on the involvement of MBSs in systems only, other recent studies have reported the expectation that SBSs will be among the mainstream technologies utilized in the next-generation networks designed to provide energy savings [2,3]. In order to furnish network service to users, both SBSs and MBSs are reliant on the wireless spectrum. At the same time, the presence and simultaneous use of multiple SBSs and MBSs in a network necessarily creates a number of complicated resource allocation-related issues, and a variety of further studies (such as [12,13,14,15,16,17,18,19,20,21,22,23,24,25]) have devoted their attention to these issues.
For example, discussions have been conducted by the aforementioned 3GPP organization regarding various possible approaches to conserving power in evolved universal terrestrial radio access networks [12]. Relatedly, Claussen et al. proposed a scheme in which user-activity detection would be used to enhance energy efficiency [13], while a study by Wang and Shen [14] explored the cell’s energy efficiency (measured in bits per joule) and area energy efficiency (measured in energy efficiency per unit area). In 2011, Auer et al. [15] conducted a study in which they quantified the differing levels of power consumed by different types of BSs, while a 2013 study by Aleksic et al. [16] suggested a hybrid model for the assessment of converged wireless/optical access network energy efficiency. Two years later, both distributed and centralized optimization methods for addressing small cell cluster coverage optimization problems were proposed by Huang et al. [17], while in 2016, Wang et al. investigated the potential imposition of quality-of-service requirements and interference mitigation as a means of improving transmission efficiency [18]. Meanwhile, Chung proposed a number of transmission algorithms that could ensure that data-rate needs were met, even under a variety of SBS deployment strategies, while simultaneously allowing the total amount of energy consumed by the transceivers of all the BSs to be minimized [19,20]. Furthermore, in a 2014 study, a method for ascertaining the minimum cost of network deployment with random deployment was suggested by Mekikis et al. [21], while in a more recent paper, Xie et al. [22] proposed a continuous-time Markov chain model that could be used to quantify the survivability of a network subjected to extensive failures resulting from, for example, security attacks, natural disasters, and common mode software and hardware failures. Meanwhile, a number of other recent studies (such as [23,24,25]) have focused on systems involving the simultaneous activity of multiple mobile network operators. Antonopoulos et al. [23], for example, suggested a framework for improved energy efficiency and throughput in such systems based on intra-operator spectrum sharing, while an auction-based offloading and switching off algorithm, that could be used to conserve energy and costs by spurring the operators of mobile networks to offload their traffic and turn off any redundant MBSs, was proposed by Bousia et al. [24]. Relatedly, a 2017 study by Oikonomakou et al. [25] investigated the cost efficiency and energy efficiency of a network resulting from the cooperative activity of numerous mobile network operators.
By providing various alternatives for enhancing specific aspects of system performance, all of these studies (that is, [12,13,14,15,16,17,18,19,20,21,22,23,24,25]) have made important contributions to furthering the development of macrocell—small cell two-layer network systems. Nonetheless, none of them managed to provide a comprehensive investigation of potential means of minimizing the total amount of power consumed by the transceivers of all the BSs while simultaneously ensuring that network users are provided with complete wireless signal coverage under various conditions; in particular, none of them adequately addressed the specific problem of coverage holes. Moreover, as network service needs continue to rapidly grow, the importance of enhancing the ability of BSs to provide comprehensive network coverage, while avoiding any waste of power during the operation of their transceivers, will also continue to grow. Further research into this subject is therefore required.
3. Problem Description
3.1. System Model with Novel Configurations
Consider a two-layer cellular network system, with the focus directed at an MBS containing densely distributed SBSs, where it is assumed that there is an SBS (that is normally switched off) at the approximate centers of each potential coverage hole. The MBS is constantly activated. To facilitate later description, the number of SBSs is denoted by , and the number of users is denoted by . Here, downlink transmission under this scenario is discussed, under the assumption that the arrival traffic pattern is always backlogged. Let and denote the basic power consumption levels of the MBS and an SBS, respectively. Let denote the transmission power consumption upper limit of the MBS. In order to simplify system operations, SBS transmission power consumption is set to a three-mode adjustable configuration that includes an off state, a low power output state, and a high power output state (i.e., cell-enlarged state), which are closely related to different coverage areas. Let and denote the low and high transmission power levels of an SBS, respectively. Thus, for an SBS, its low power consumption, denoted as , and high power consumption, denoted as , can be shown to be
and
respectively. In addition, assume that if the SBS deployed in the center of a coverage hole is activated, and its power is adjusted to , its coverage range is equal to the range of the coverage hole, and therefore, enough to fully fill the coverage hole.
Assume that the available frequency bandwidth for the MBS is denoted by , that the available frequency bandwidth for an SBS is denoted by , and that the effective frequency reuse mechanism is in use, such that signals among the MBS and SBSs will not interfere with each other. Define as the average transmission rate requirement of all users. Define as the minimum signal power that can be received by the receiving terminal. According to the well-known Shannon capacity formula [26,27], the bandwidth required by can be obtained as follows:
where is the white Gaussian noise power.
In this study, the available bandwidths of the MBS and any SBS are divided into equal parts, respectively. Each part represents a channel. Specifically, let and denote the number of channels of the MBS and any SBS, respectively. As such, and can be expressed as:
and
respectively. It is assumed that each user uses one channel at a time. For each SBS, we assume that channels have the same transmission power. With respect to low power output, the transmission power of each channel, denoted as , is set as:
With respect to high power output, the transmission power of each channel, denoted as , is set as:
However, according to the data from the aforementioned study [15] by Auer et al., the maximum transmission power of the MBS (i.e., ) (equal to 20 W) and the maximum transmission power of the SBS (i.e., ) (equal to 0.05 W) can differ by as much as 400-fold. In order to avoid unnecessary energy consumption, the transmission power of any MBS channel is consumed only when it is used; if a channel is not used, it does not consume energy. Specifically, the transmission power consumption of any used MBS channel, denoted as , is set as:
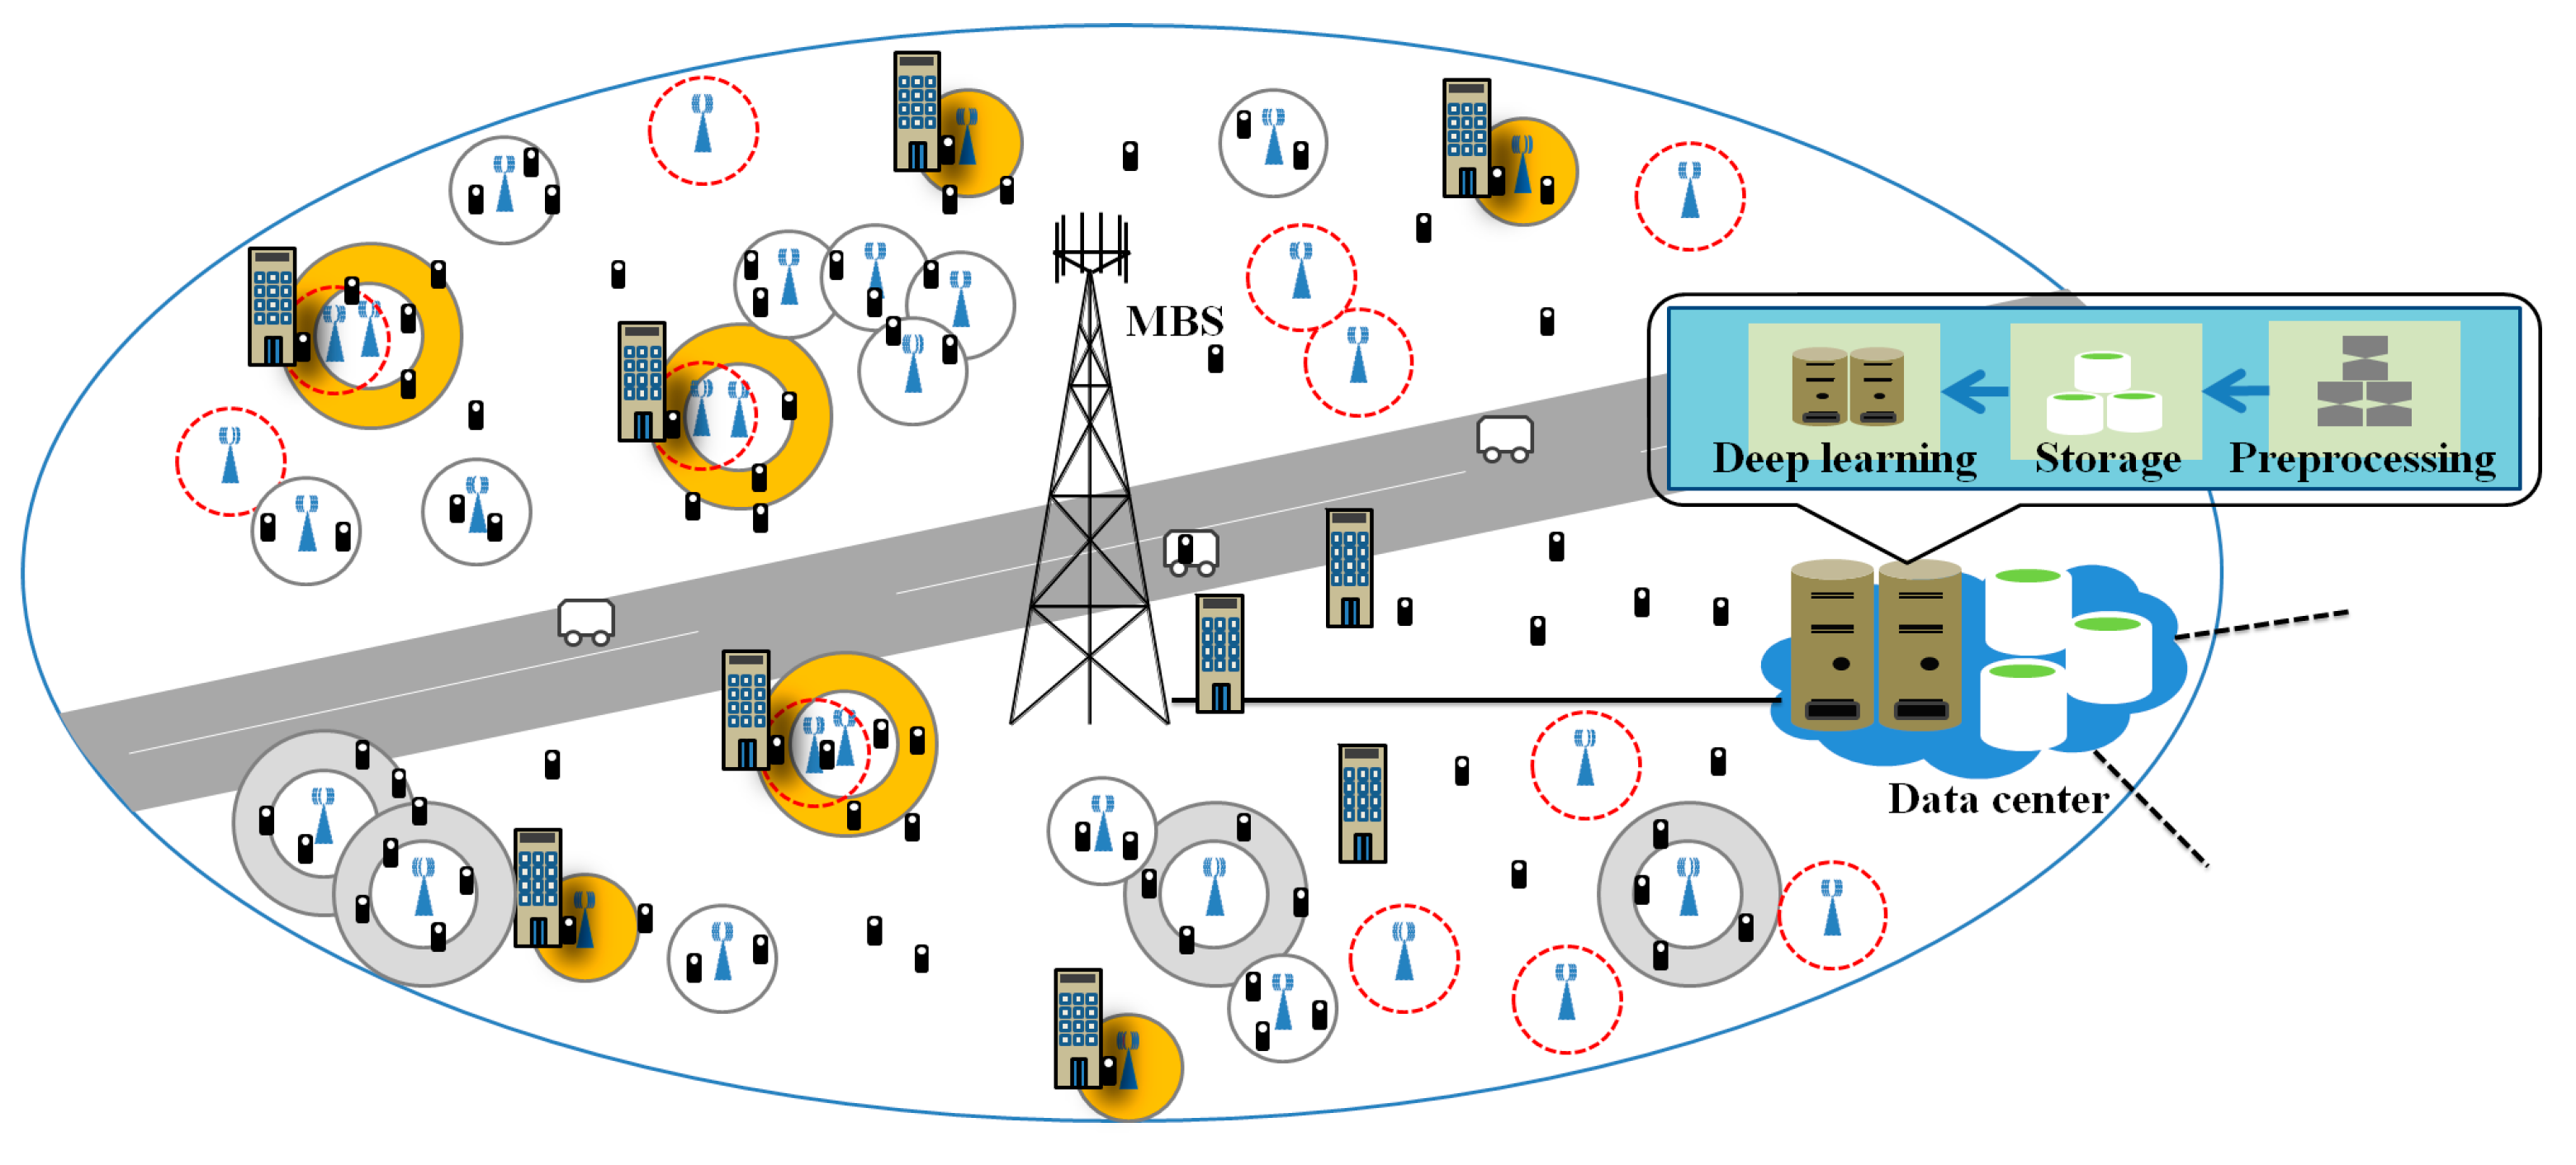
Furthermore, in order to improve the operating efficiency of network infrastructure in different environments, it is assumed that the data center has precise information and data collected via big data mining (methods for which include big data preprocessing, storage management, and deep learning data analysis), allowing adjustments to network throughput requirements and improvements to resource allocation efficiency.
To provide clarity to the illustrations in later figures, the graphical representations of the SBSs in all possible states, as well as the accompanying descriptions for these representations, are shown in Figure 1. Last, but not least, a conceptual construction of the system model from a systemic point of view is presented in Figure 2.
3.2. Problem Formulation and Goal
Given the system model under consideration, the aim of this study was to minimize the total amount of power consumed by the transceivers of all the different types of BSs while ensuring that all coverage holes were completely filled.
Define as the set of all combinations of transmission power configurations for the SBSs’ transceivers. Next, we define as the transmission power status vector of the SBSs’ transceivers, where z is the index for the employed configuration in , z = 1, 2, …, . It follows that = . Given a configuration z, if SBS k’s transceiver is in the off state, then = 0; if SBS k’s transceiver is in the low power output state, then = 1; if SBS k’s transceiver is in the high power output state, then = 2. Let denote the transmission power from SBS k in configuration z. can thus be expressed as:
In turn, define as the set of all of the transmission power configurations for the MBS transceiver. Next, we define as the transmission power status vector of the MBS transceiver, where h is the index for the employed configuration in , h = 1, 2, …, . It follows that = . Given a configuration h, if the number of used MBS channels is j, with j = 0, 1, …, , then = j. Let denote the transmission power for the MBS in configuration h. can thus be expressed as:
Moreover, we define three different binary decision indicators , , and . First, the value for indicates whether or not SBS k is active. If yes, = 1; otherwise, = 0. Next, indicates whether or not the selected position is able to be served by SBS k. If yes, = 1; otherwise, = 0. Following that, indicates whether or not the selected position is able to be served by the MBS. If yes, = 1; otherwise, = 0. For the purpose of mathematically modeling the complete coverage of all coverage holes, we introduce the set, , of dense measurement positions. For convenience, define as the set of all the channels of the SBSs and the MBS. Let the indicator denote whether user i uses channel . If yes, = 1; otherwise, = 0. Additionally, define as the total power consumption of all the BSs’ transceivers in the considered model, and define as the set of active SBSs in configuration z.
Given the above conditions, the aim with respect to optimization is to obtain the minimum by choosing the appropriate values for z and h at each scheduling instant, while still providing the required coverage to all users under the constraints of the allowed configuration sets, as well as the assumption that only one channel is used by each user at any given time. In mathematical terms, the optimization problem in question can be formulated in a rigorous manner as follows:
subject to
- ;
- ;
- , ;
- , i = 1, 2, …, M.
In light of this, the ideal solution would consist of smartly adjusting the power levels of all the SBSs, including the full deactivation of a previously active SBS or the activation of a previously inactive SBS within the system, according to the dynamics of the given network traffic, so as to actively manage the overall power consumption of the system. In other words, the goal of the study was to determine a feasible solution, given the available configurations and under various traffic scenarios, for providing users with complete signal coverage for wireless devices, while also yielding the minimum possible level of total power consumed. Given these conditions, it should be clear that the considered optimization problem would necessarily require the use of integer-nonlinear programming. That said, problems of this type have a high degree of complexity, such that an exhaustive search is typically needed if the optimal solution is to be found. To put that another way, this sort of problem can be seen as numerically tractable. It should also be noted, moreover, that an optimal solution will not be achievable at all if the level of traffic is so excessive that it surpasses what the system can handle.
With these points in mind, and with the aim of giving system operators a practical way of handling their operations in real-life contexts, this study sought to work out an effective approach for addressing the stated problem. Consequently, the following section proposes a simple-but-efficient strategy for managing power aimed at achieving the stated goal in an efficient and effective manner.
4. Proposed Algorithm
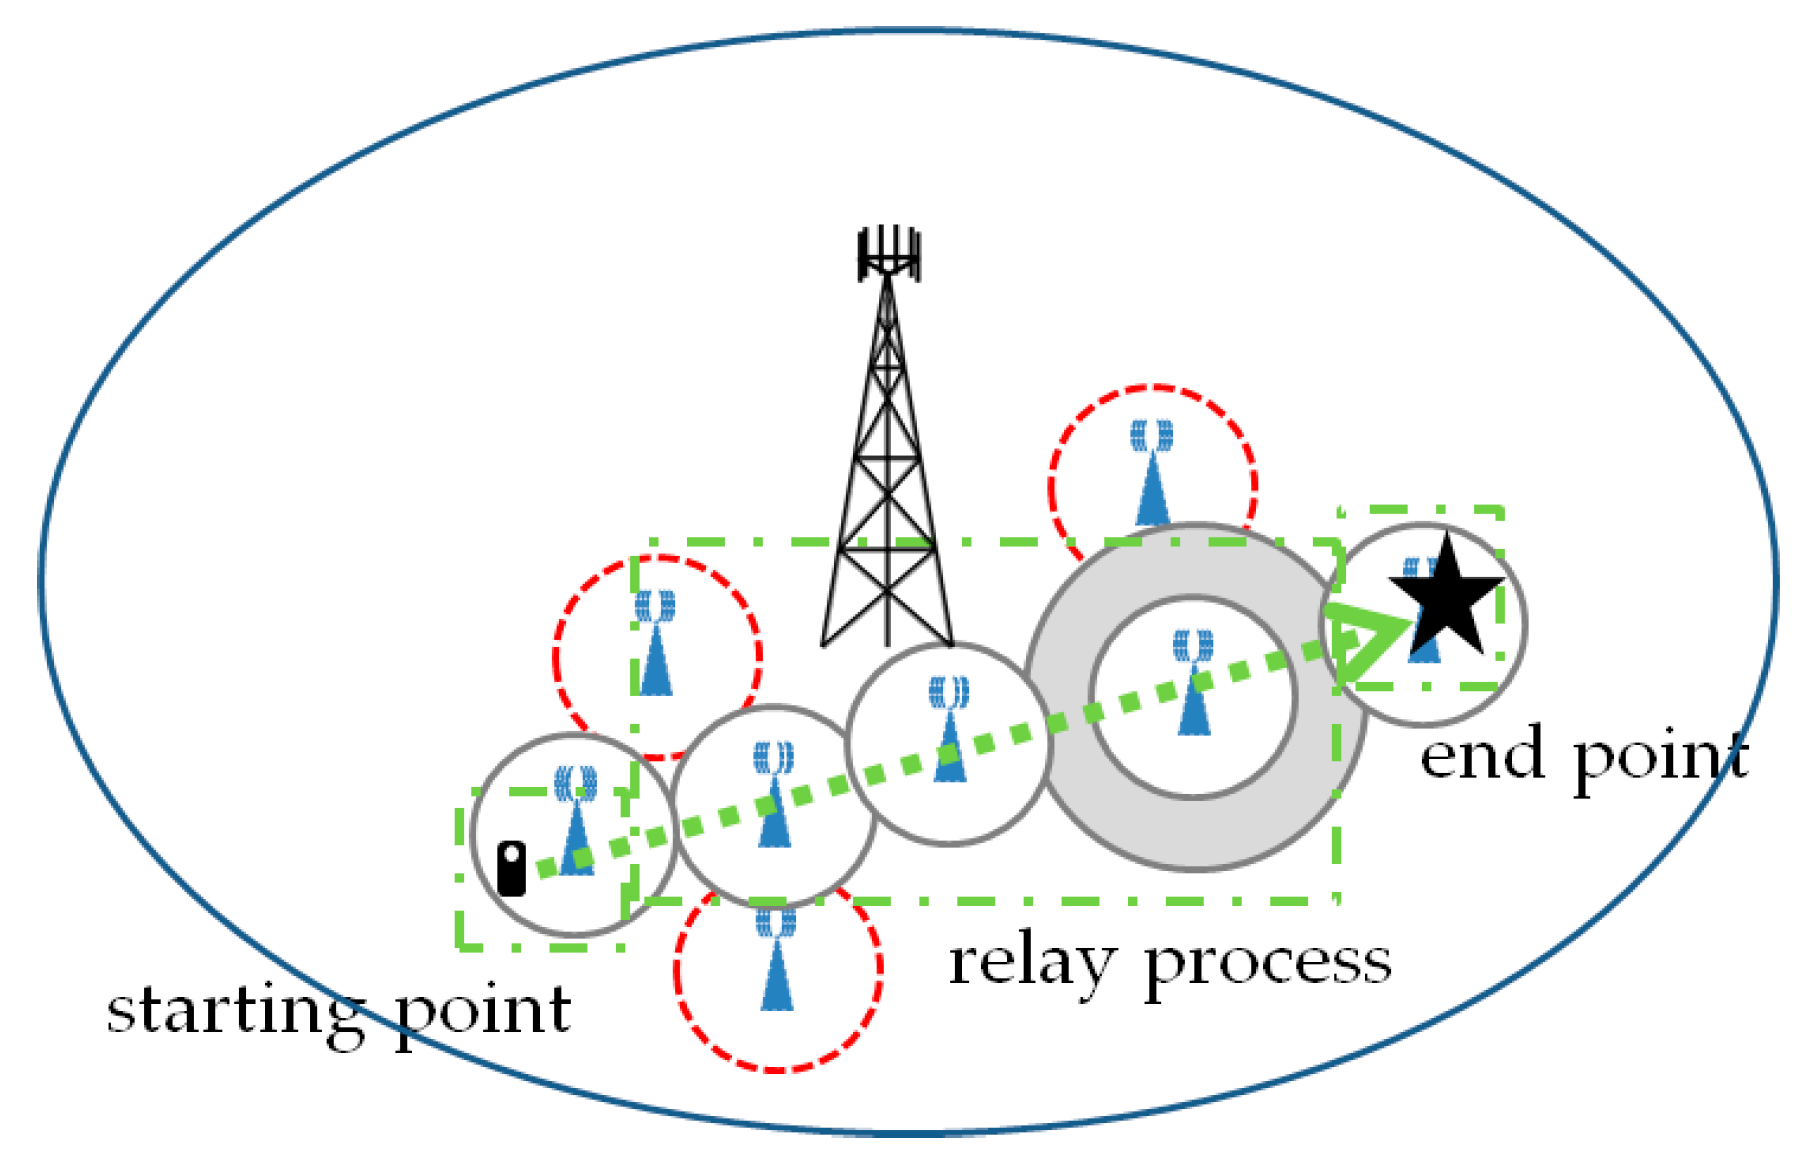
We employ the MBS’s centralized-control-based management method to manage the resource allocation of BSs along the mobile paths of users. Moreover, we use SBSs to provide connection services to users in due course, in order to reduce energy consumption. The algorithm is executed at fixed time intervals, and the period of each time interval is denoted by t. The t value is sufficiently small (hence, paths within any period can be assumed to be direct paths), an assumption which is made based on the moving speed of users. Meanwhile, as described in Section 3.1, we assume the presence of a powerful deep learning system (one that has been subjected to countless rounds of learning and testing) within the data center, and that it can predict the direction of a user’s path with virtually no errors, particularly when the period is short (since the likelihood of changes occurring to a user is lower). During any given period, the connection in users’ direct paths is divided into three areas, as shown in Figure 3 and Definition 1, and operations are conducted for each area in order to allow the BSs to better solve the issue of coverage insufficiency, ensuring unhindered network use through the BSs. However, signal coverage does not guarantee effective connection in cases in which channels are insufficient.
Definition 1.
Starting point, end point, relay process
The user’s position when the algorithm is executed is referred to as the user’s starting point. The user’s position, predicted at time t from the starting point, is referred to as the user’s end point. Excluding the starting and end points, the direct path from the starting point to the end point is referred to as the relay process.
Definition 2.
Path process
The user’s path during the period (i.e., starting point → relay process → end point) is referred to as the path process.
Definition 3.
Support overlay
If there is no coverage gap between any two adjacent SBSs in the relay or path process, then when the SBSs in the relay or path process are activated, users may be under the coverage of the signals of these SBSs; this situation is referred to as support overlay.
Definition 4.
A, B, and C
A is defined as the SBS status (i.e., the presence or absence of an SBS, and, if present, whether the SBS’s power can be amplified to facilitate coverage) in the starting point area. B is defined as the SBSs status (i.e., the presence or absence of SBSs, and, if present, whether the SBSs are providing support overlay) in the relay process area. C is defined as the SBS status in the end point area. These statuses of the user’s path process (i.e., starting point → relay process → end point) are denoted as ABC.
A flow chart illustrating the proposed coverage algorithm is shown in Figure 4. We begin by sorting all users in order of priority (they will be processed in order of priority). Next, we will determine if the end point of user i will fall within a coverage hole. If it does not fall within a hole, the processing procedure for Case 1 (which will be covered in detail later) will be used; if it does fall within a hole, we will identify the type of BS that is providing service to user i at the starting point. If user i is being serviced by an SBS at the starting point, the processing procedure for Case 2 (which will be covered in detail later) will be used. If user i is being serviced by the MBS at the starting point, the processing procedure for Case 3 (which will be covered in detail later) will be used. Regardless of whether the processing procedure for Case 1, 2, or 3 was used, we will record the relevant data after the processing process has been completed. When processing has been completed for user i, we will verify if all users have been processed. If there are users who have not been processed, we will perform the above operation on the next batch of users. If processing has been completed for all users, we will switch off the SBSs that have not been used (according to the recorded data) and complete the execution of the algorithm.
In addition, in our design, if coverage holes are present during the relay process, the SBSs in the centers of these holes will be “directly activated first”, with their power levels being set to during the execution of the algorithm, thus providing coverage for these holes. In this manner, the coverage holes that are present during the relay process will be covered, and thus no locations or areas will exist where signal coverage is lacking during the relay process. Next, if the algorithm determines that SBSs are being used to provide coverage during the relay process, these SBSs will include the SBSs in the centers of the holes. If the MBS takes over the role of providing coverage during the relay process, a user will switch to the SBSs in the centers of the holes for coverage when he or she enters the holes, and revert back to the MBS upon leaving them.
Along user i’s direct path (comprising the starting point, relay process, and end point), the determination of A, B, and C, and the notational representation of these statuses, are described below (and are categorized into the “end point will not fall within a coverage hole” and “end point will fall within a coverage hole” scenarios for discussion):
(1) Determination of A, B, and C when the end point will not fall within a coverage hole
The system first determines if user i at the starting point has an SBS that provides him or her with coverage. If it is present, A would be represented by S; if it is not present, A would be represented by N. The system then determines if an SBS that provides the user with coverage is present at the end point area. If it is present, C would be represented by S; if it is not present, C would be represented by N. Finally, the system determines if SBSs providing support overlay are present during the relay process. If they are present, B would be represented by S; if they are not present, B would be represented by N.
However, when B is represented by S, it would be revised in the following manner, unless A and C are also both represented by S. If A and/or C are represented by N, the SBSs in the relay process area that are closest to A and/or C would amplify their power levels, in an attempt to provide coverage to A and/or C. If this attempt is successful, B would then be represented by Y instead of S; if the attempt is not successful, B would then be represented by X instead of S. However, when B is represented by N, and A and C are both represented by S and able to compensate or cover the relay process via the amplification of their power levels, A and C would then be represented by Y instead of S; otherwise, A and C would be represented by X instead of S.
(2) Determination of A, B, and C when the end point will fall within a coverage hole
In this situation, the determination principles are similar to those used when the end point will not fall within a coverage hole. The following points indicate the differences: (1) if there is at least one available SBS next to a coverage hole center, a user at the end point would obtain coverage from the SBS closest to the coverage hole center (with its power level being set to ), at which point C would be represented by D; (2) if there is no available SBS next to a coverage hole center, a user at the end point would obtain coverage from the SBS deployed in the coverage hole (with its power level being set to ), at which point C would be represented by O.
In order to operate efficiently, we have categorized all the possible scenarios for user i each time the algorithm is executed into three categories (i.e., Case 1, Case 2, and Case 3), based on the algorithmic methodology described in Figure 4. Take note that all of these scenarios are mutually exclusive. It should also be noted that the aforementioned mechanism for coping with situations in which there are coverage holes during the relay process will be automatically applied to these scenarios as necessary. The scenarios are described below:
Case 1. The end point of user i will not fall within a coverage hole.
- Service is provided at the starting point of user i in the SBS service state, and SBS service is also available at the end point.
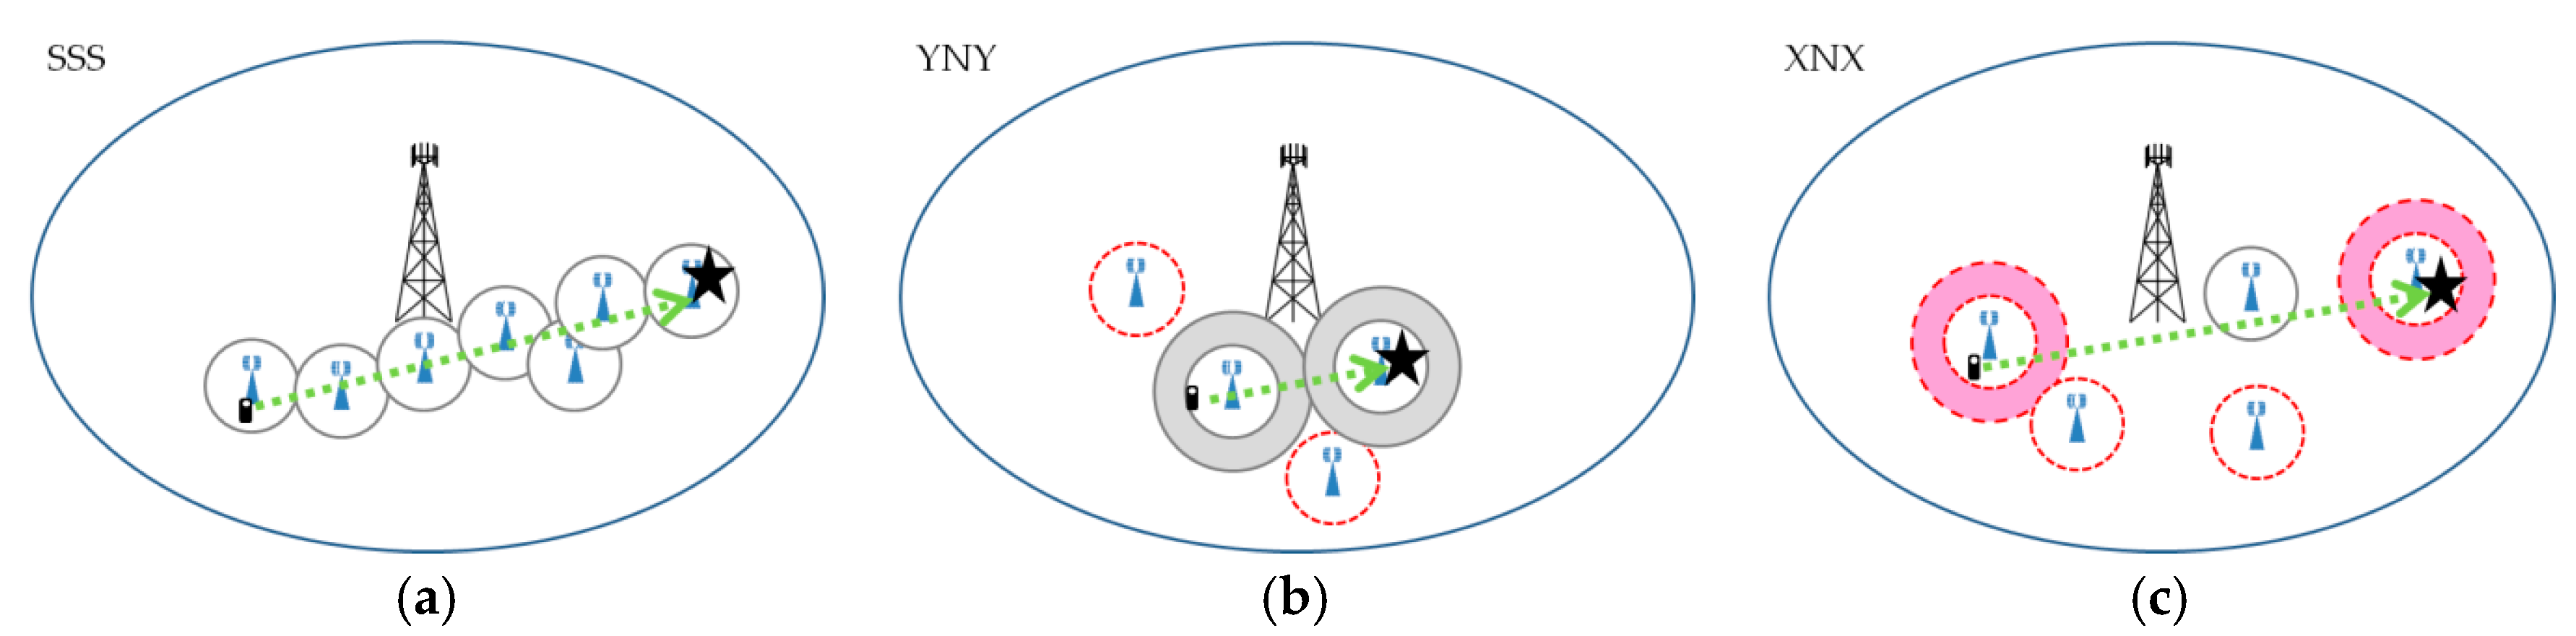
- The path process has SBSs providing support overlay. In this case (SSS), service is provided using the corresponding SBSs in the path process. An example is shown in Figure 5a.
- The relay process does not have SBSs providing support overlay. However, the two SBSs that cover the starting and end points can be jointly used to provide relay process coverage after the adjustment of their power levels to , respectively. In this case (YNY), service is provided by these two cell-enlarged SBSs in the path process. An example is shown in Figure 5b.
- The relay process does not have SBSs providing support overlay, and the relay process coverage cannot be compensated by the starting and end point SBSs after the adjustment of their power levels to , respectively. In this case (XNX), service is provided by switching to the MBS in the path process. An example is shown in Figure 5c.
- Service is provided at the starting point of user i in the SBS service state, but SBS service is not available at the end point.
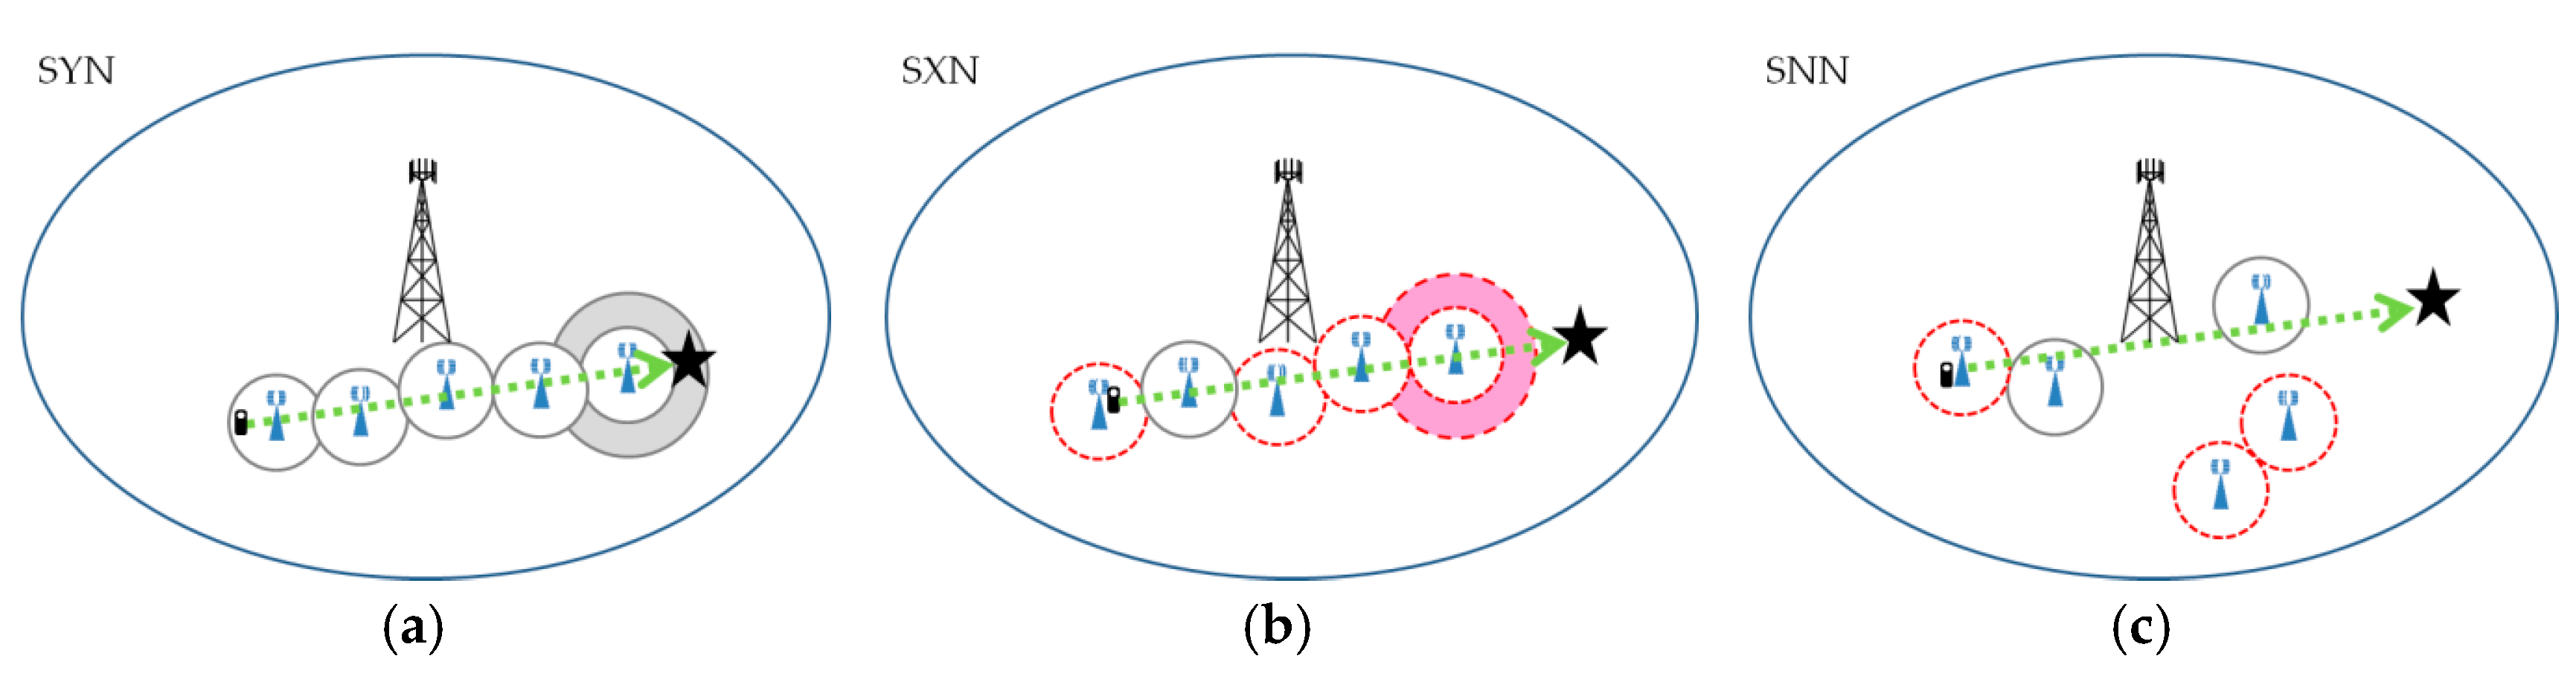
- The relay process has SBSs providing support overlay, and coverage can include the end point after adjusting the power level of the SBS closest to the end point to . In this case (SYN), the cell of this SBS is enlarged, and service is provided using the corresponding SBSs in the path process. An example is shown in Figure 6a.
- The relay process has SBSs providing support overlay, but coverage is unable to include the end point after adjusting the power level of the SBS closest to the end point to . In this case (SXN), the path process connection is switched to the MBS to provide service. An example is shown in Figure 6b.
- The relay process does not have SBSs providing support overlay. In this case (SNN), the path process connection is switched to the MBS to provide service. An example is shown in Figure 6c.
- Service is provided at the starting point of user i in the MBS service state, and SBS service is available at the end point.
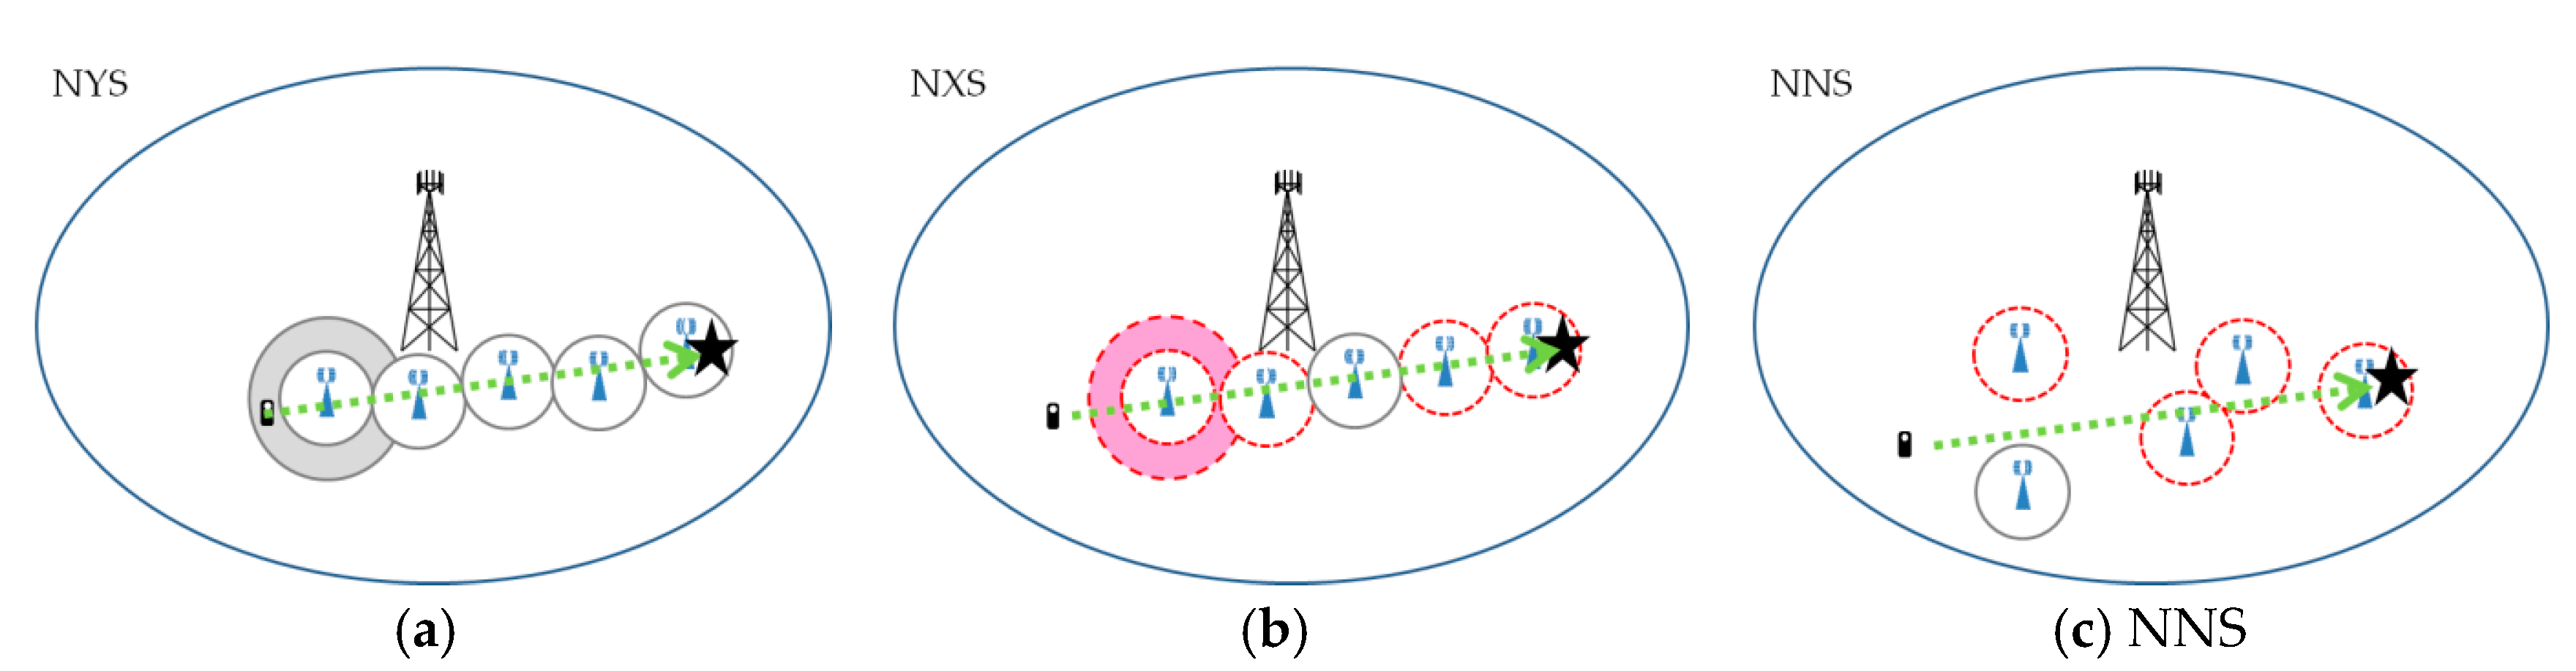
- The relay process has SBSs providing support overlay, and coverage can include the starting point after adjusting the power level of the SBS closest to the starting point to . In this case (NYS), service is provided by transferring the original user-MBS connection at the starting point to this cell-enlarged SBS, with the corresponding SBSs being used in the remaining path process. An example is shown in Figure 7a.
- The relay process has SBSs providing support overlay, but coverage is unable to include the starting point after adjusting the power level of the SBS closest to the starting point to . In this case (NXS), service is provided by using the MBS in the path process. An example is shown in Figure 7b.
- The relay process does not have SBSs providing support overlay. In this case (NNS), service is provided by using the MBS in the path process. An example is shown in Figure 7c.
- Service is provided at the starting point of user i in the MBS service state, but SBS service is not available at the end point.
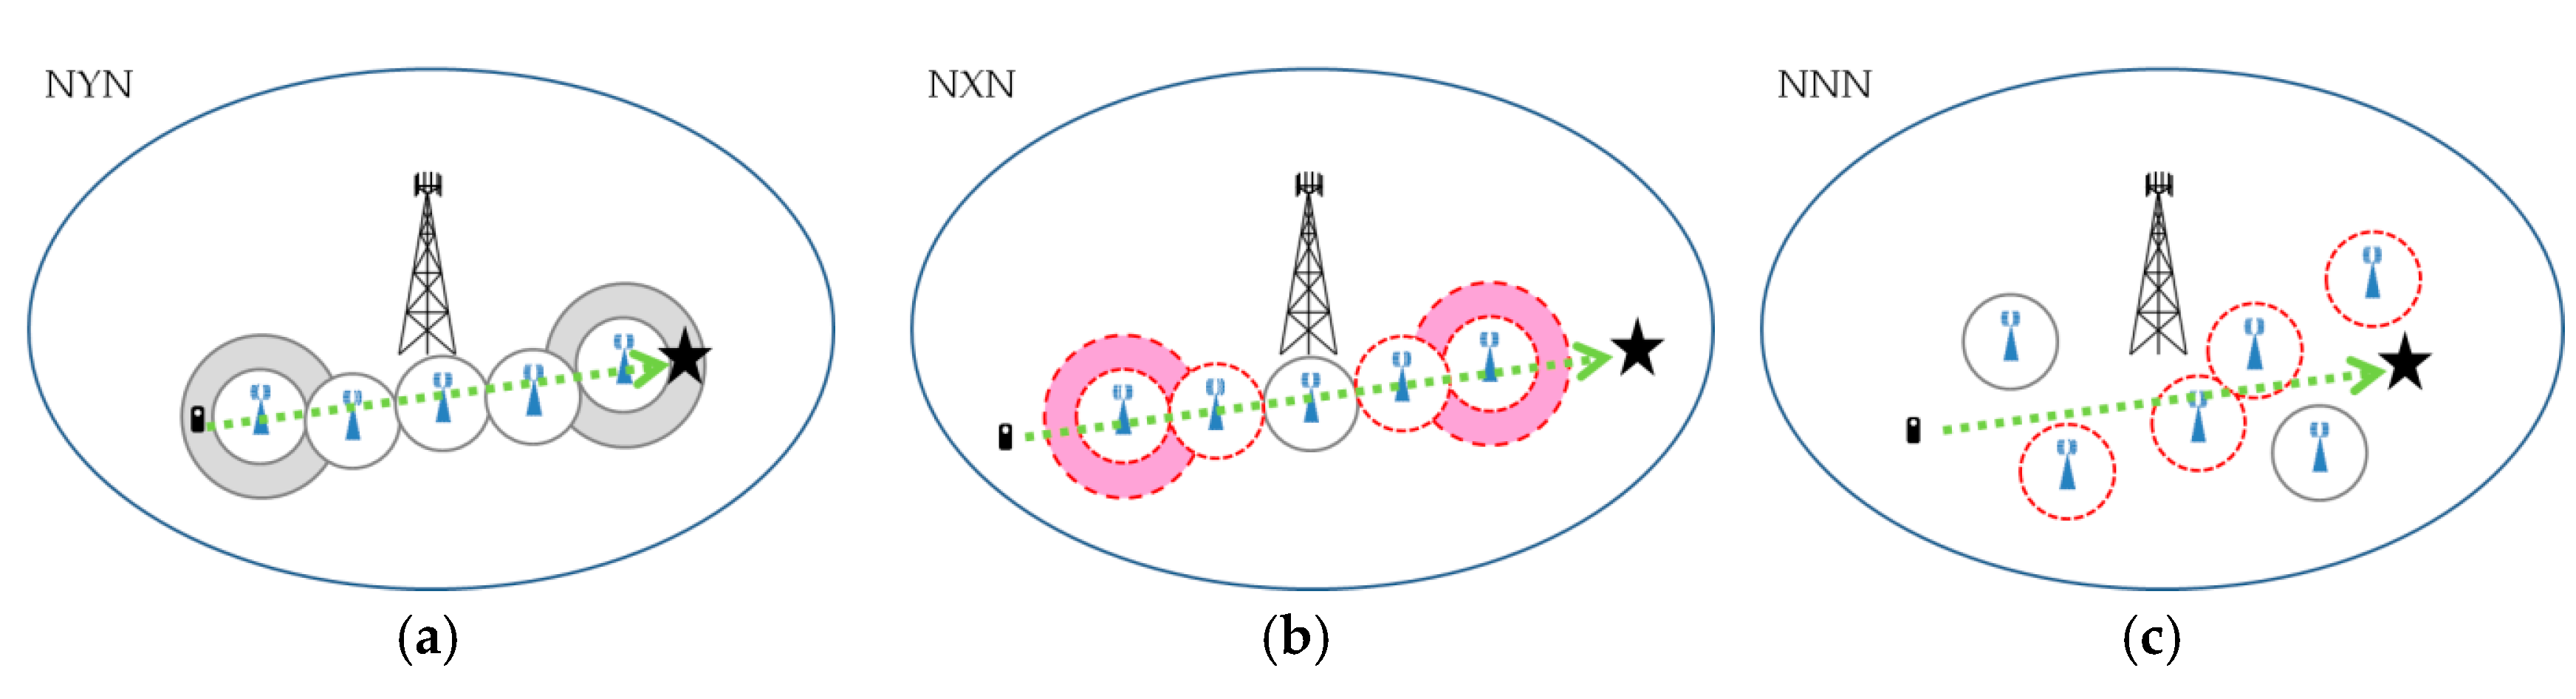
- The relay process has SBSs providing support overlay, and the starting and end points can be covered after adjusting the power levels of SBSs in the relay process closest to the two points to , respectively. In this case (NYN), the power levels of both SBSs are each adjusted to , and service is provided using the corresponding SBSs in the path process. An example is shown in Figure 8a.
- The relay process has SBSs providing support overlay, but the starting and end points cannot be covered after adjusting the power levels of SBSs closest to the two points to , respectively. In this case (NXN), service is provided by using the MBS in the path process. An example is shown in Figure 8b.
- The relay process does not have SBSs providing support overlay. In this case (NNN), service is provided by using the MBS in the path process. An example is shown in Figure 8c.
Case 2. The end point of user i will fall within a coverage hole, and the starting point is in the SBS service state.
- The relay process has SBSs providing support overlay.
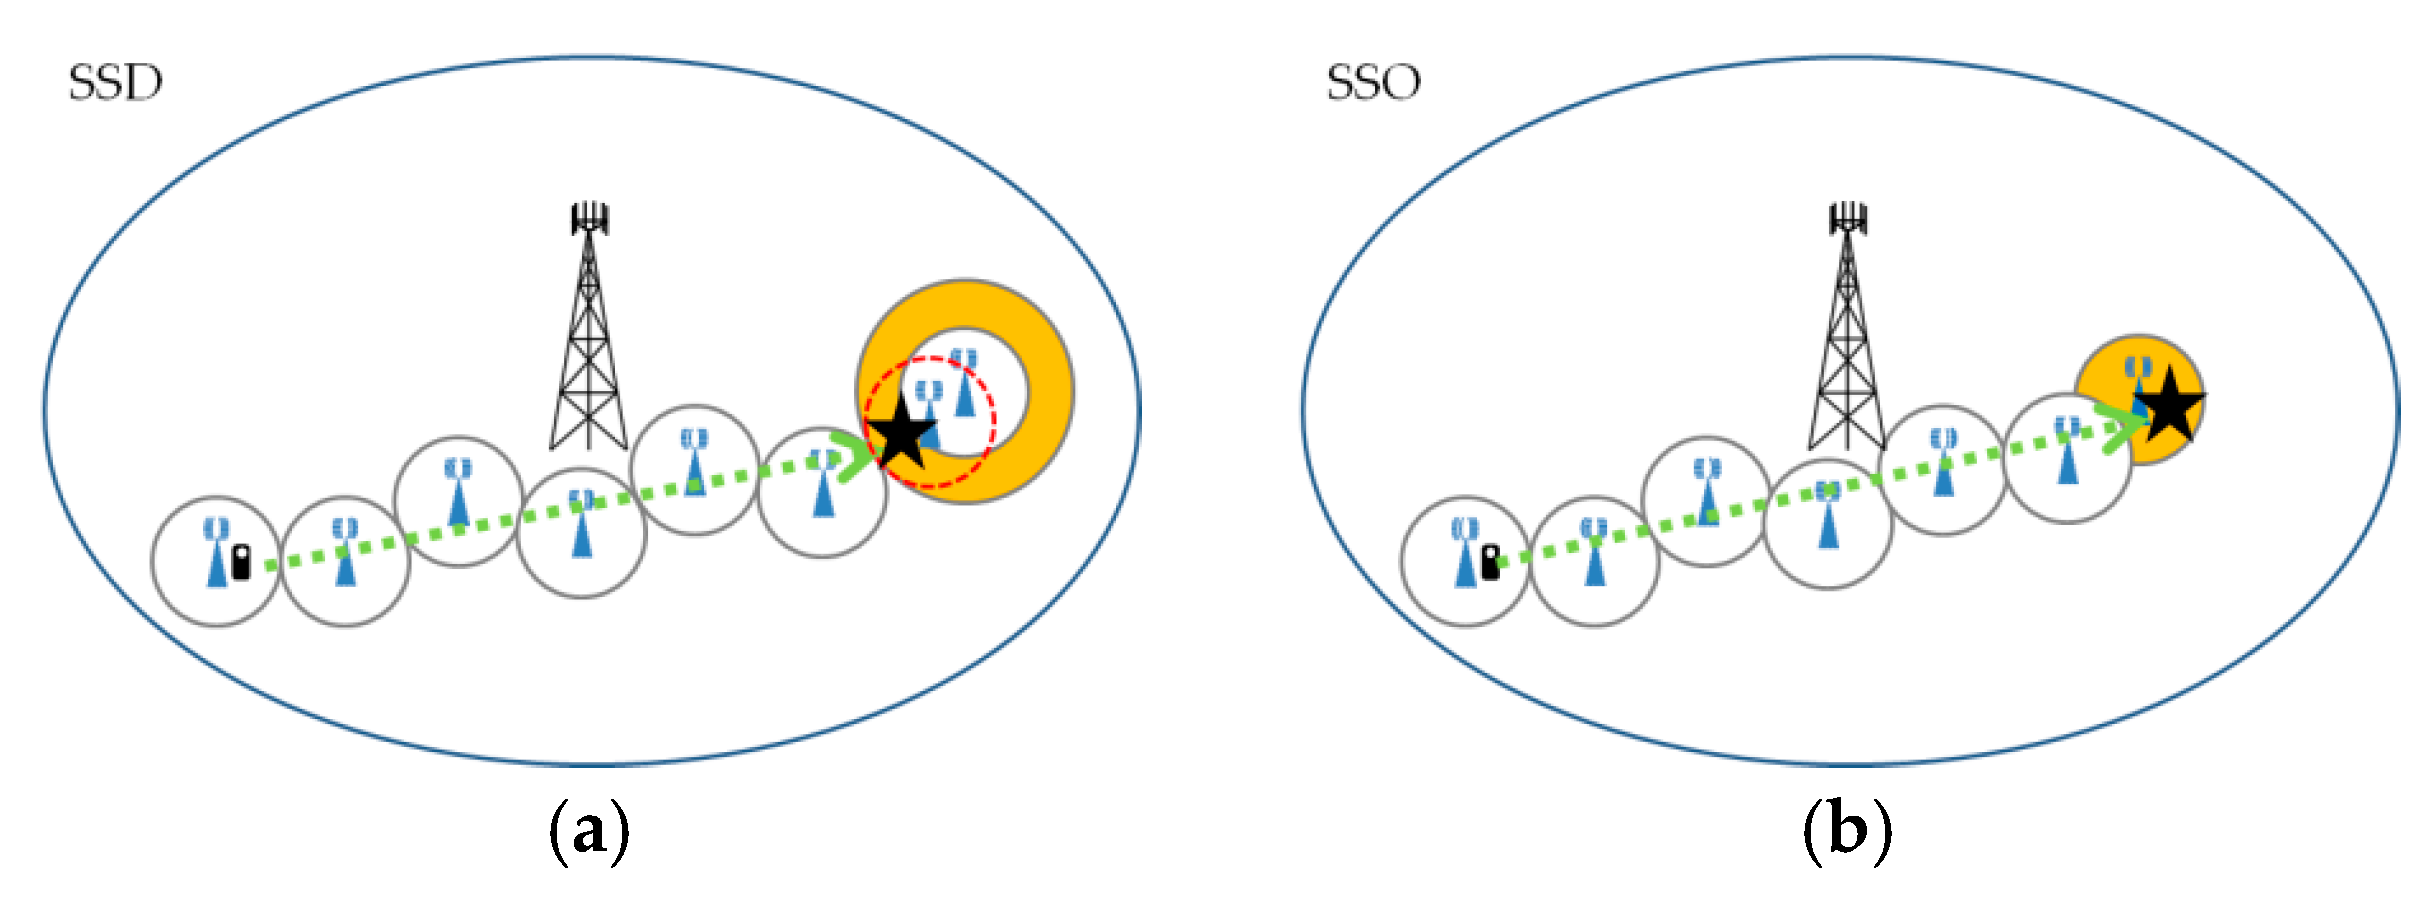
- There is at least one available SBS next to the coverage hole center (i.e., the coverage hole can be fully covered after adjusting the power level of any available SBS to ). In this case (SSD), the cell of the SBS closest to the coverage hole center is enlarged (note that such an SBS is denoted as SBStag to facilitate description later), and service is provided using the corresponding SBSs in the path process. An example is shown in Figure 9a.
- There is no available SBS next to the coverage hole center. In this case (SSO), the power level of the SBS deployed in the coverage hole center is set to (note that such an SBS is denoted as SBSh_tag to facilitate description later), and service is provided using the corresponding SBSs in the path process. An example is shown in Figure 9b.
- The relay process has no SBSs providing support overlay.
- There is at least one available SBS next to the coverage hole center. In this case, the cell of the SBS closest to the coverage hole center, which is denoted as SBStag, is enlarged.
- Together with SBStag, the coverage insufficiency in the relay process can be compensated after adjusting the starting point SBS power level to . In this case (YND), service is provided using these two cell-enlarged SBSs in the path process. An example is shown in Figure 10a.
- However, for the above power adjustment, the relay process cannot be compensated. In this case (XND), service is provided by transferring the connection to the MBS for the starting point and the relay process and by using SBStag for the end point. An example is shown in Figure 10b.
- There is no available SBS next to the coverage hole center. In this case, the power level of the SBS deployed in the coverage hole, which is denoted as SBSh_tag, is set to .
- Together with SBSh_tag, the coverage insufficiency in the relay process can be compensated after adjusting the starting point SBS power level to . In this case (YNO), service is provided using these two SBSs adjusted in the path process. An example is shown in Figure 11a.
- However, for the above power adjustment, the relay process cannot be compensated. In this case (XNO), the processing method is almost identical to that used in Case 2.B.a.ii; the only difference is that we use SBSh_tag for covering the end point. An example is shown in Figure 11b.
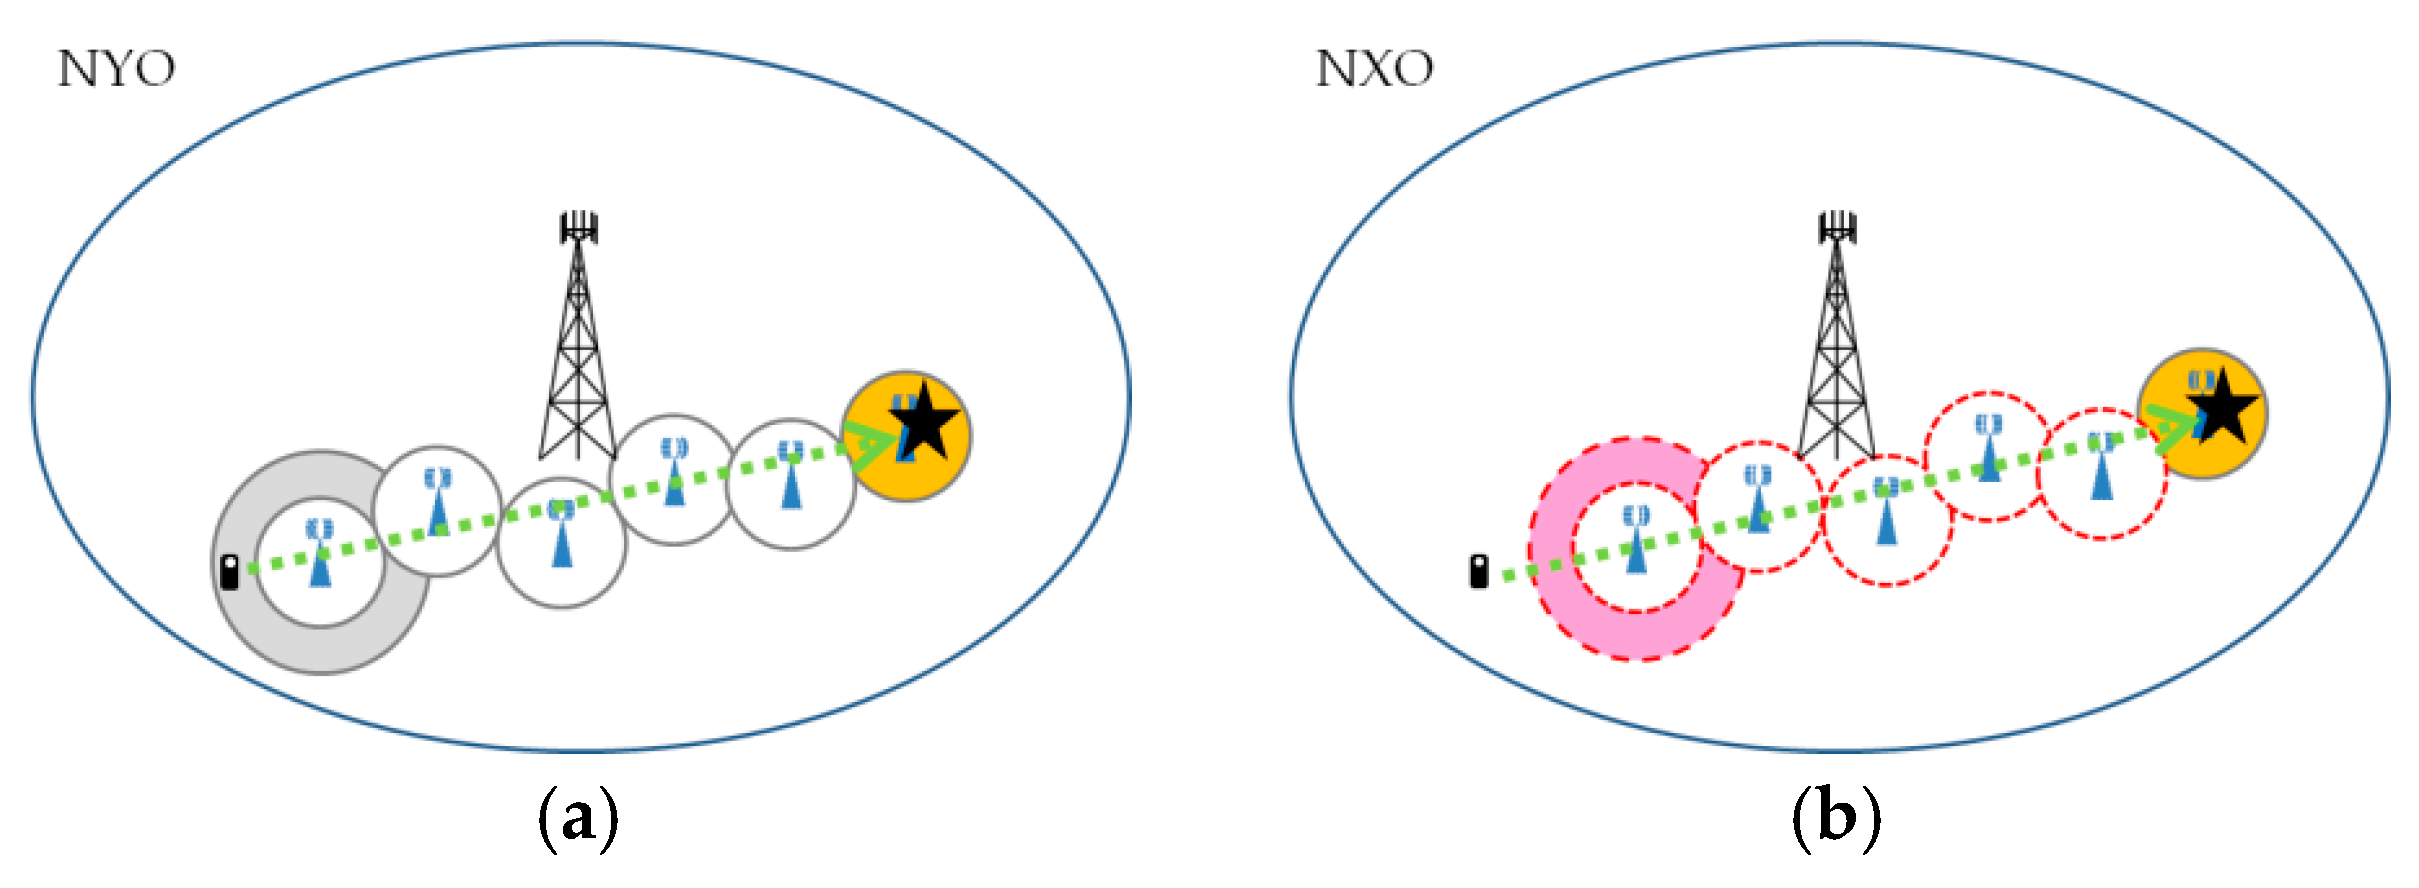
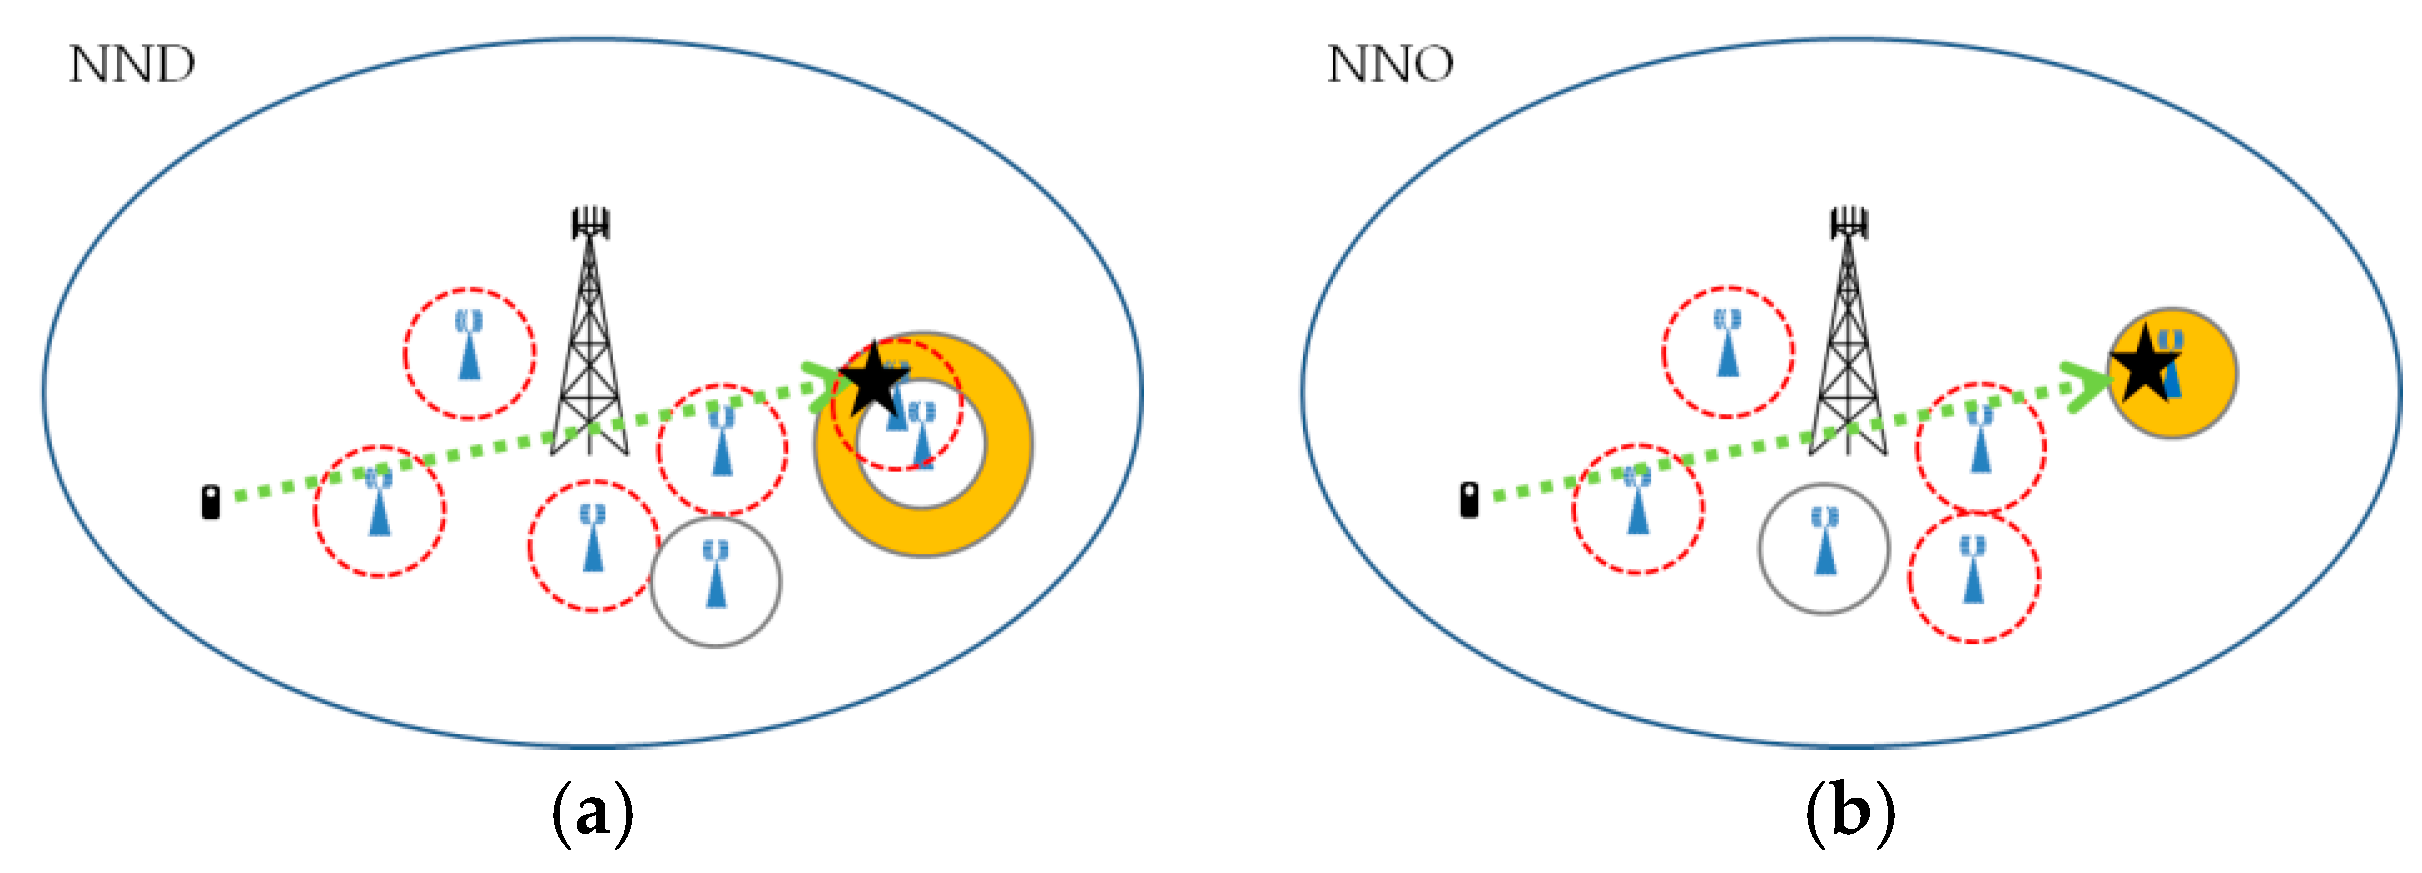
Case 3. The end point of user i will fall within the coverage hole, and the starting point is in the MBS service state.
- The relay process has SBSs providing support overlay.
- There is at least one available SBS next to the coverage hole center. In this case, the cell of the SBS closest to the coverage hole center, which is denoted as SBStag, is enlarged.
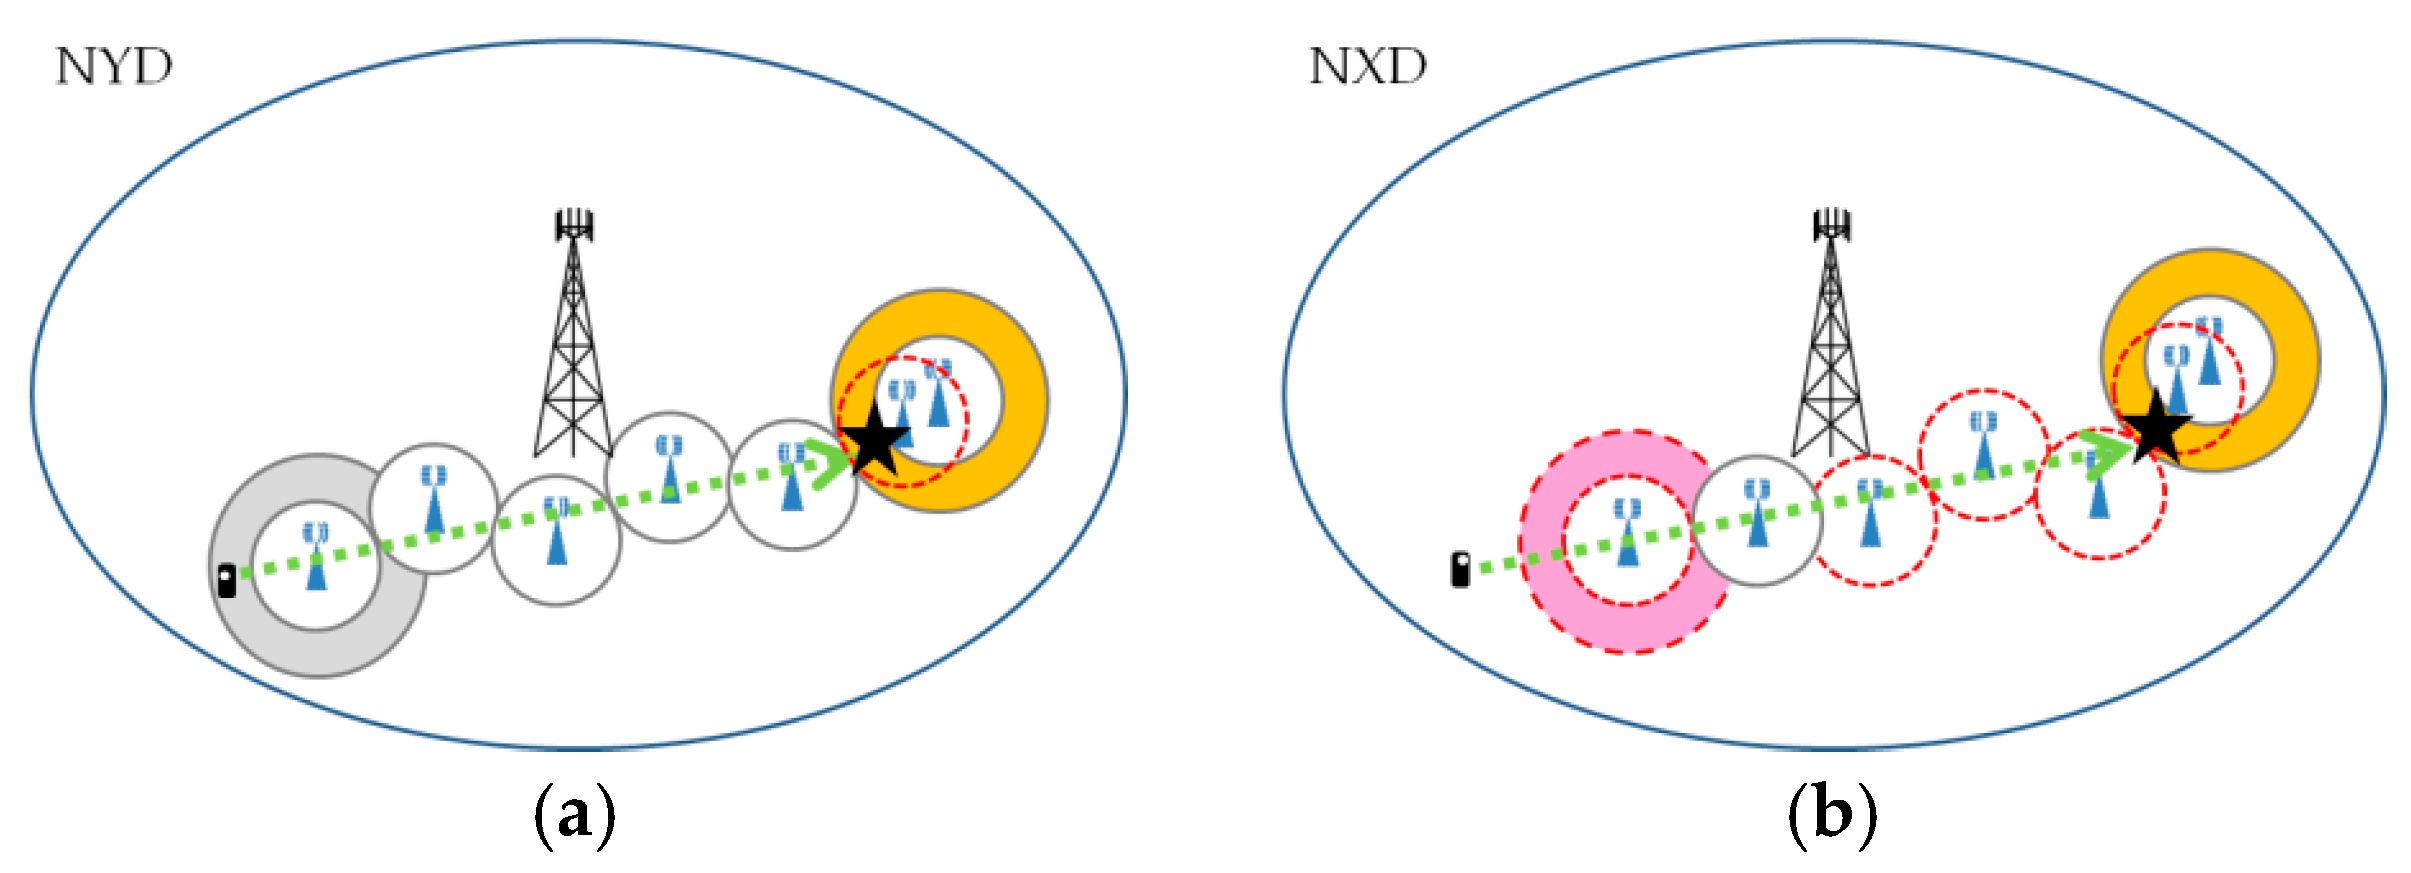
- The starting point can be covered by the SBS in the relay process closest to the starting point after adjusting its power level to . In this case (NYD), service is provided by transferring the starting point connection to this cell-enlarged SBS, with the corresponding SBSs being used in the relay process, and SBStag being used at the end point. An example is shown in Figure 12a.
- However, for the above power adjustment, the starting point cannot be covered. In this case (NXD), the processing method is the same as the corresponding processing method in Case 2.B.a.ii. An example is shown in Figure 12b.
- There is no available SBS next to the coverage hole center. In this case, the power level of the SBS deployed in the coverage hole, which is denoted as SBSh_tag, is set to .
- The starting point can be covered by the SBS in the relay process closest to the starting point after adjusting its power level to . In this case (NYO), the processing method is almost identical to that used in Case 3.A.a.i; the only difference is that we use SBSh_tag for covering the end point. An example is shown in Figure 13a.
- However, for the above power adjustment, the starting point cannot be covered. In this case (NXO), the processing method is the same as the corresponding processing method in Case 2.B.b.ii. An example is shown in Figure 13b.
- The relay process has no SBSs providing support overlay.
- There is at least one available SBS next to the coverage hole center. In this case (NND), the processing method is identical to that used in Case 3.A.a.ii. An example is shown in Figure 14a.
- There is no available SBS next to the coverage hole center. In this case (NNO), the processing method is identical to that used in Case 3.A.b.ii. An example is shown in Figure 14b.
Finally, after the execution of the algorithm, the system will close SBSs that have not been used (that is, or will be adjusted to 0).
Last, but not least, the worst-case performance of the proposed algorithm, with regard to the time complexity as a function of the number of users and the number of SBSs , is provided as follows. We first sort the users in order of priority, . Next, we process the users, which require rounds, with c comparisons in each round, where c is a constant, . Finally, we deactivate SBSs that have not been used, . Accordingly, the worst-case time complexity of the proposed algorithm can be expressed as , and it indicates that the complexity level is low.
5. Results and Discussions
Here, the effectiveness of the proposed algorithm, in terms of the outage ratio of all the users, the total power consumption of transceivers at all the BSs, and the average transmission rate of all the users, in the context of the macrocell—small cell network system, as conceptually shown in Figure 2, is evaluated and compared with that of two conventional methods. The two conventional methods are set as follows: (1) a system that is the same as the proposed system, except that all SBSs are continuously in the cell-enlarged (i.e., high power output) state, and (2) a system that is the same as the proposed system, except that the cell of each SBS is randomly determined to be closed or enlarged. For convenience, the two conventional methods are called SBS-Cell-Enlarged and SBS-Random, respectively.
In addition, it is important to note that, typically, a given SBS is classified as a microcell, picocell, or femtocell BS, and that in recent studies, the use of increasingly small BSs has become a notable trend [2]. As a result, femtocell BSs were chosen as the SBSs used in this study.
5.1. Parameter and Environment Settings
We use Matlab R2016a to conduct simulations for the proposed algorithm, SBS-Cell-Enlarged, and SBS-Random, in order to assess their respective performance results. Specifically, the size of the two-layer cellular network under consideration is set at 1000 m × 1000 m. A model of grid deployment suggested by Simsek et al. is adopted [28], with the field designed such that 50 m × 50 m squares are situated over a 20 × 20 grid consisting of 400 squares in total. The region for an SBS deployment is represented by a square, while the MBS itself is situated at the very center of the grid. The given SBSs are randomly distributed over the grid. The number of coverage holes is set at 10 (recall that each of their approximate centers has one SBS that is normally switched off). Moreover, users are assumed to move about the grid in random directions at a sustained velocity of 10 km/h. The period for the execution of the algorithm is set at 1 minute. Referring to the aforementioned study [15] by Auer et al., , , , , and are set at 130 W, 20 W, 4.8 W, 0.05 W, and 0.025 W, respectively. Additionally, , , , , and are set at −73 dBm, −150 dBm, 10 MHz, 2 MHz, and 2 Mbps, respectively. The simulation time is set at 1 h. Furthermore, the physical-layer channel model in the current study is viewed as consisting of path loss, while the underlying path-loss model, utilized in the aforementioned study [20] by Chung, was also chosen for the current study.
For the sake of completeness, the effects of the number of users and the number of SBSs on the three aspects of performance (i.e., the outage ratio, total power consumption, and average transmission rate) are examined in sequence, using the three methods. The corresponding results are included in Section 5.2 and Section 5.3, respectively, and it should be noted that, for the former, the number of users is the variable, with the number of SBSs being set at 310, while for the latter, the number of SBSs is the variable, with the number of users being set at 240.
5.2. Effects of the Number of Users on the Various Performance Aspects
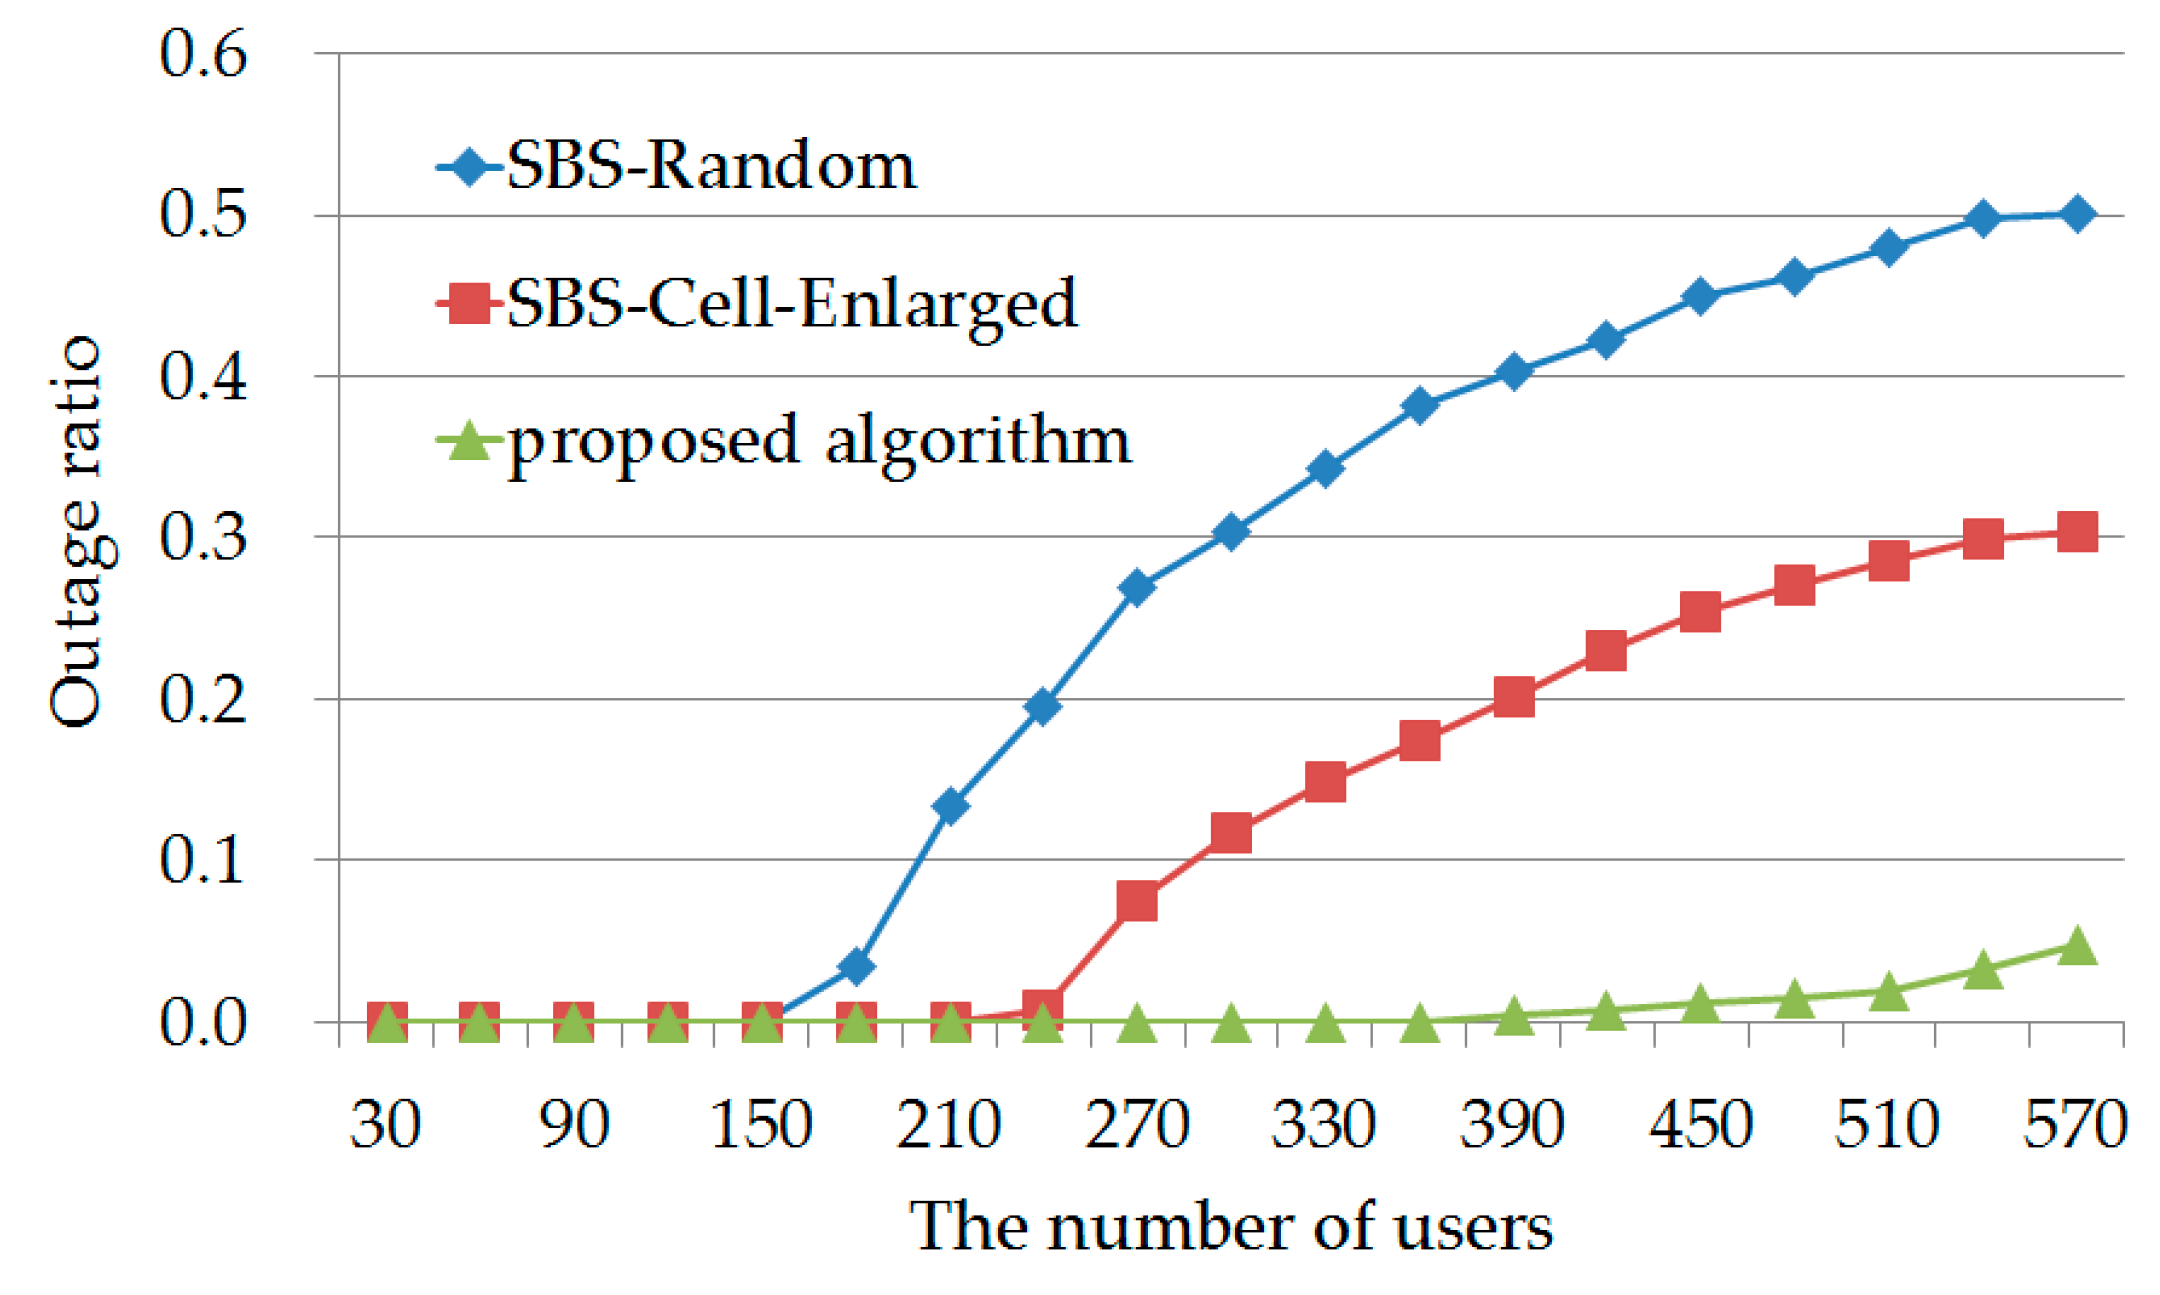
The effect of the number of users on the outage ratios for the proposed algorithm, SBS-Cell-Enlarged, and SBS-Random, is shown in Figure 15. The outage ratios of all the three methods are equal to 0 when the traffic volume is low. This is due to the fact that each of them has a sufficient number of channels for providing service to users. As the traffic volume increases, the outage ratios of the three methods increase as well. Compared to the other two methods, the proposed algorithm is better able to delay or slow down the increase of the outage ratio. This is due to the fact that it can effectively resize or shut down SBSs depending on the traffic volume.
At the traffic volume of 390, the proposed algorithm has a relatively small outage ratio (about 0.4%). However, for SBS-Cell-Enlarged, the outage ratio is approximately 20%. This increase occurs since the cells of all SBSs are enlarged, and are therefore more likely to cover more users, but considering that the number of channels in a single SBS is limited, some users within coverage areas may not be able to access channels. As for SBS-Random, its outage ratio is significantly higher at approximately 40%. Since there are fewer available SBSs in the system, some users are prevented from using SBSs for transmission. Moreover, the number of channels that the MBS has is also limited. Thus, a higher outage ratio is observed. Next, when the traffic volume increases to 570, the proposed algorithm still exhibits the best performance among all three methods, due to its more effective resource allocation design. However, the outage ratio for SBS-Random is close to 52%, which means that the network is almost paralyzed. This is due to the fact that the SBSs and the MBS do not have enough channels to provide services. In addition, as expected, SBS-Cell-Enlarged also performs better than SBS-Random, due to the higher number of SBSs that the former allows.
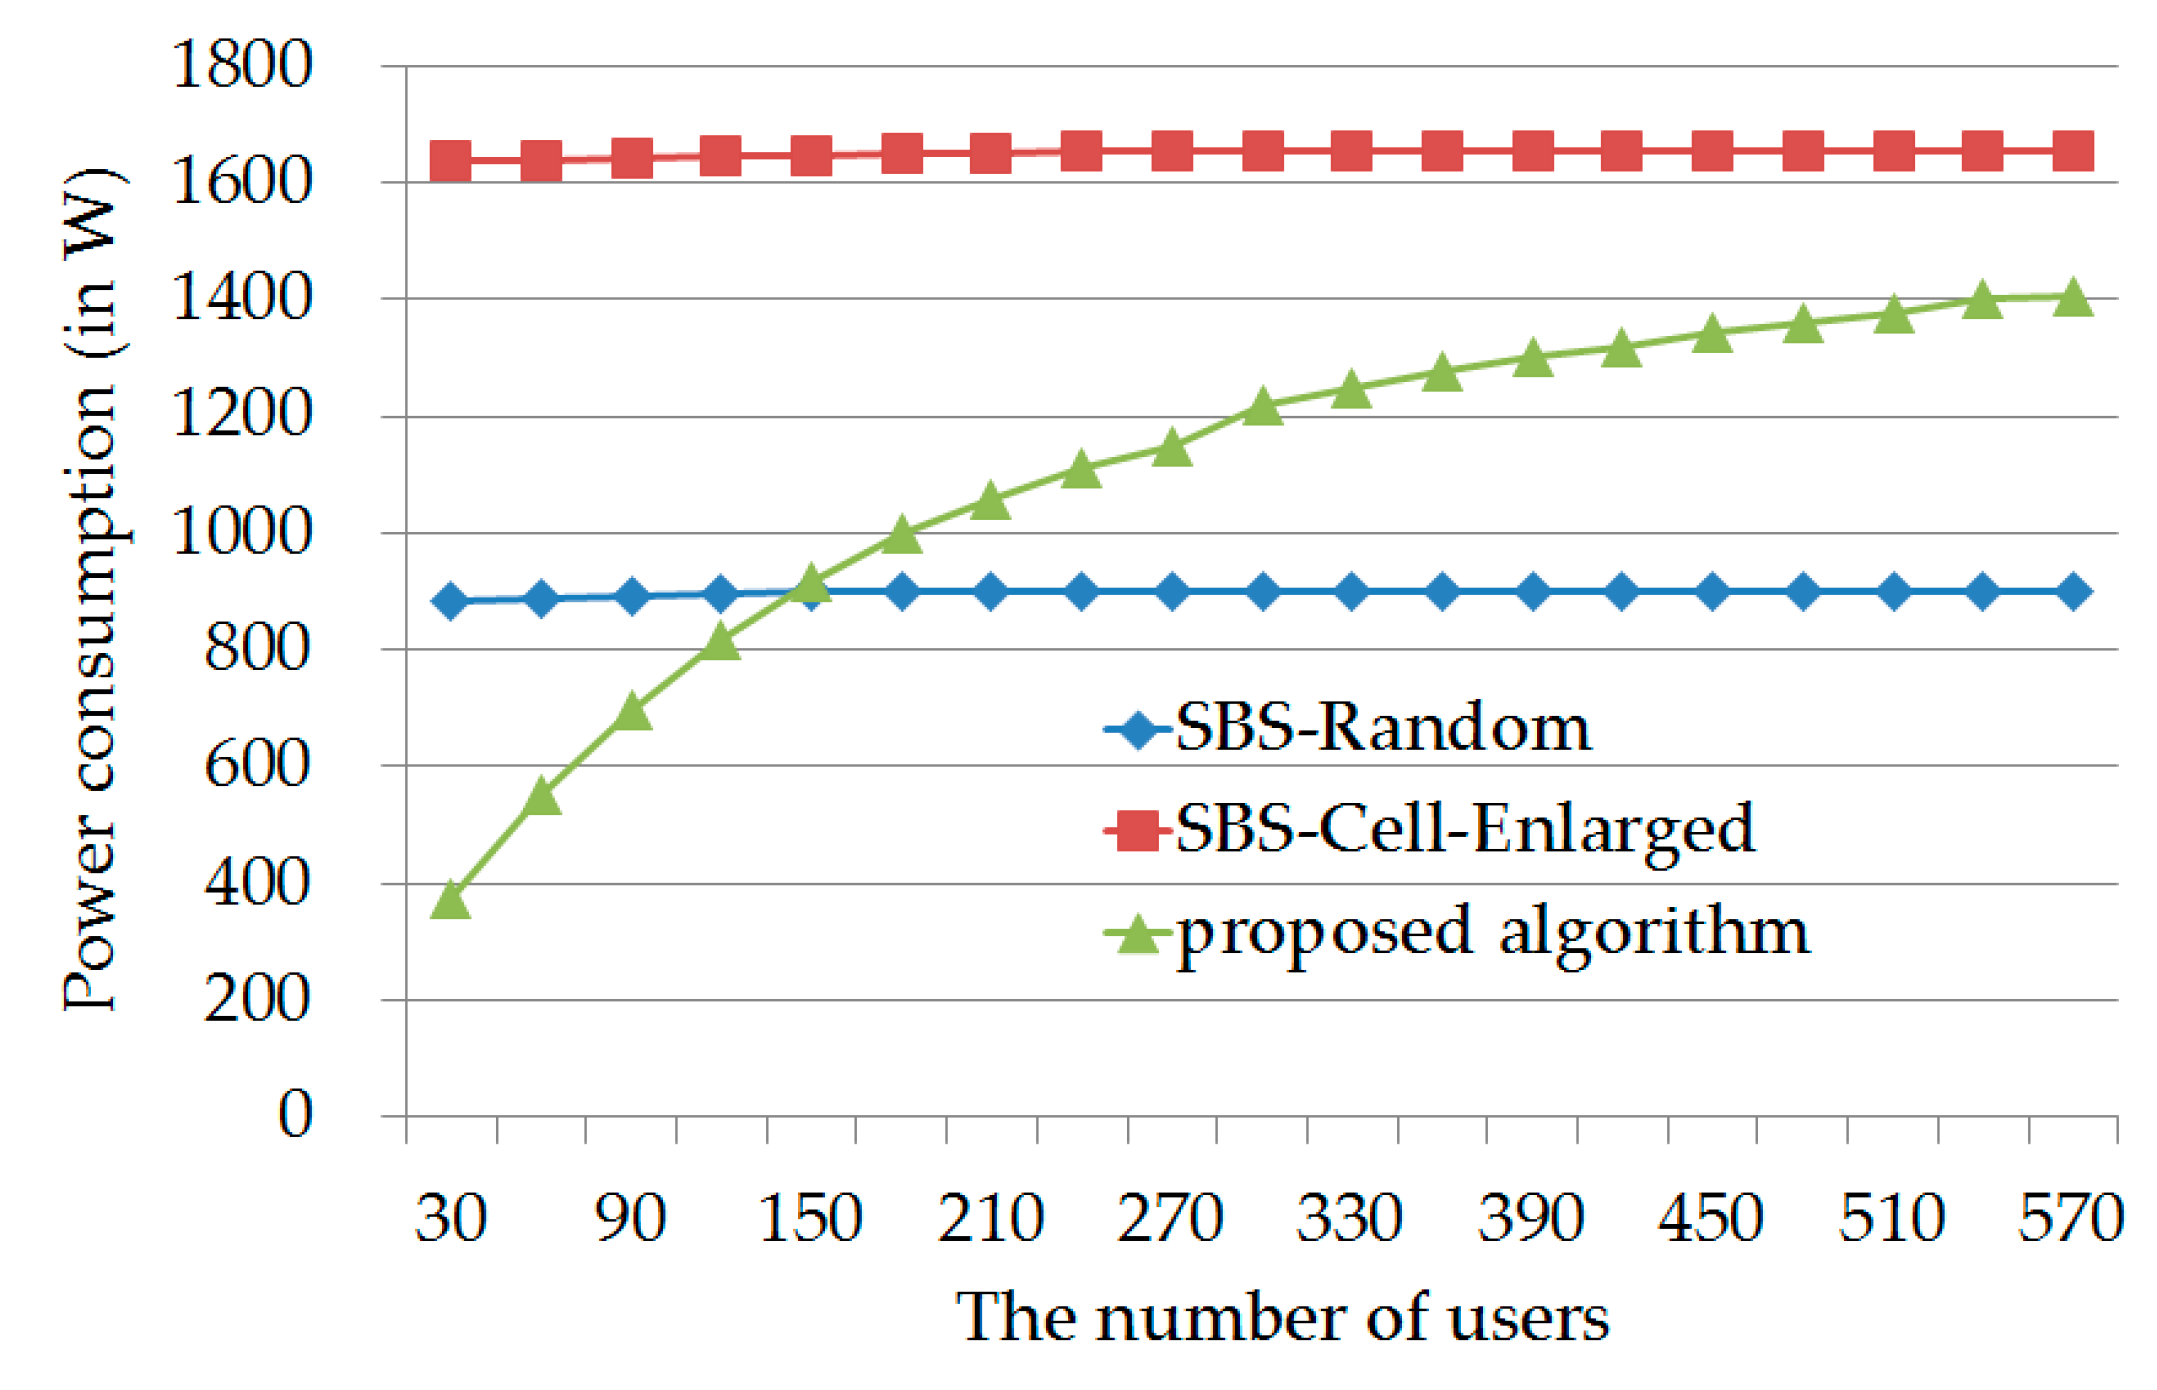
The effect of the number of users on the total power consumption levels of transceivers at all the BSs for the proposed algorithm, SBS-Cell-Enlarged, and SBS-Random, is shown in Figure 16. Because it only activates the SBSs necessary for transmission, the proposed algorithm produces a lower total power consumption level than the other two methods. In particular, when the traffic volume is low (e.g., when the number of users is equal to 30), the proposed algorithm can reduce the power consumption by up to about 78% and 58%, as compared with the consumption levels for SBS-Cell-Enlarged and SBS-Random, respectively. Moreover, the results indicate that as the traffic volume increases, the curves for SBS-Cell-Enlarged and SBS-Random remain almost flat. This is due to the fact that all SBSs are constantly in the high power output state when using these two methods, and that only the MBS’s transmission power will change, and its level is lower than the sum of the power levels in other parts; thus, a smaller degree of variation for each of the two curves is observed.
Furthermore, when the traffic volume increases to about 150, the power consumption curves of the proposed algorithm and SBS-Random intersect, indicating that at this volume, the proposed algorithm is consuming as much power as SBS-Random. On the other hand, for traffic volumes lower than 150, the power consumption of SBS-Random is higher than that of the proposed algorithm. At the same time, according to our simulations, for traffic volumes lower than 150, the outage ratios of both the proposed algorithm and SBS-Random are equal to 0. Taken together, these findings mean that SBS-Random is wasting power relative to the proposed algorithm for traffic volumes lower than 150. For similar reasons, SBS-Cell-Enlarged causes excessive energy consumption at low traffic volumes. In addition, it is found that, at high traffic volumes, power consumption for the proposed algorithm is still lower compared to SBS-Cell-Enlarged. In terms of the outage ratio under high traffic volumes, as shown in Figure 15, the proposed algorithm is largely more effective than SBS-Cell-Enlarged. These outcomes indicate that the proposed algorithm allows for adjustments to or the shutting down of SBSs in a smart manner, depending on the number of users and the location distribution of users.
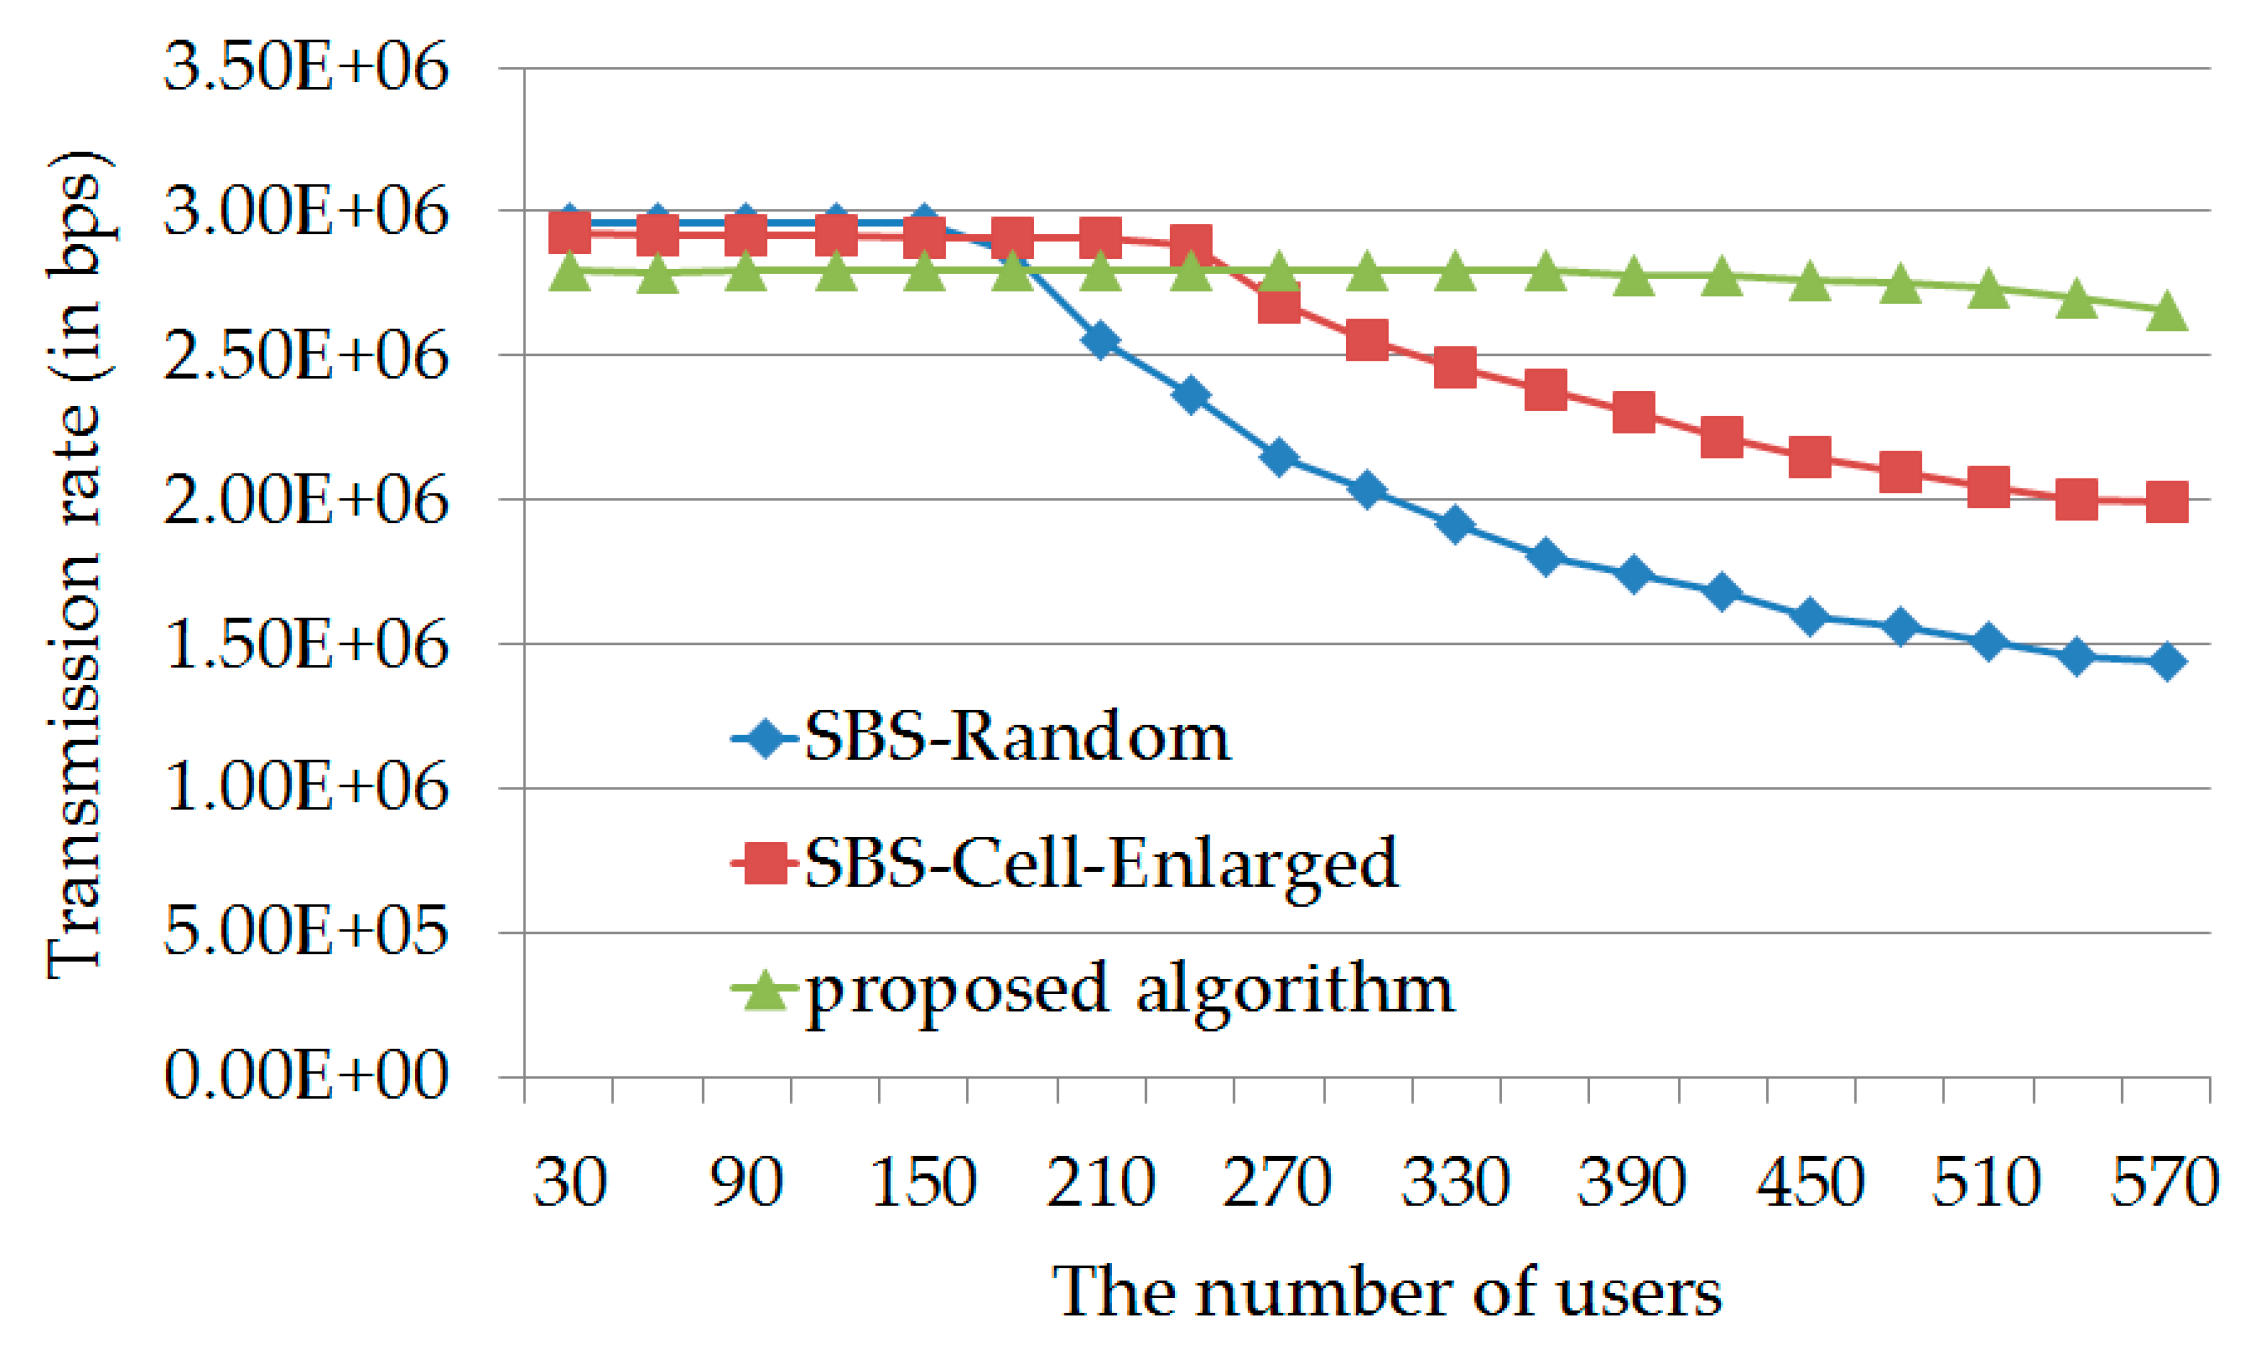
Figure 17 demonstrates the effect of the number of users on the average transmission rates of the proposed algorithm, SBS-Cell-Enlarged, and SBS-Random. At low traffic volumes, the average transmission rates of the proposed algorithm are lower than those of SBS-Cell-Enlarged and SBS-Random, but higher than the average required transmission rate due to the efficient configurations of (3)–(8). However, recall that in terms of total power consumption (see Figure 16), the proposed algorithm performs better than SBS-Cell-Enlarged and SBS-Random. Unlike SBS-Cell-Enlarged and SBS-Random, which will always expand SBSs, the proposed algorithm provides users with channels with lower transmission power; as a result, the transmission rate for users is lower. Meanwhile, the rate of SBS-Random is found to be slightly higher than that of SBS-Cell-Enlarged. This is due to the difference in transmission rates caused by the use of channels with the MBS and SBSs (that is, a higher transmission rate can be obtained by using the MBS as compared to any SBS) and the smaller number of available SBSs in SBS-Random when compared to SBS-Cell-Enlarged (implying that SBS-Random has a higher possibility of using the MBS). As the traffic volume increases, the average transmission rate decreases at a slower rate under the proposed algorithm than under SBS-Cell-Enlarged and SBS-Random, and it decreases at the fastest rate under SBS-Random. Due to the smaller quantity of available SBSs and channels in SBS-Random as compared to the other two methods, it increases the likelihood of a user outage at higher traffic volumes, and thus, reduces the average transmission rate.
More specifically, it can be seen in Figure 17 that SBS-Random’s average transmission rate begins to drop when the traffic volume increases to about 160, whereas the average transmission rates of the proposed algorithm and SBS-Cell-Enlarged do not drop. At a traffic volume of about 240, SBS-Cell-Enlarged’s average transmission rate begins to drop due to the occurrence of user outage (see Figure 15). At this volume, it is also found that the average transmission rate drops more substantially under SBS-Random. Only when the proposed algorithm is used does the rate not drop at that traffic volume. When the traffic volume reaches 570, the average transmission rate of the proposed algorithm does decrease, but it still remains higher than the average required transmission rate. This is due to the proposed algorithm’s ability to effectively close, open, and scale SBSs, which allows for the effective distribution of each SBS channel to users. Although the average transmission rate of SBS-Cell-Enlarged at this volume is higher than the required value, its power consumption is higher than that of the proposed algorithm. Moreover, one can also see that the average transmission rate of SBS-Random is much lower than the required value.
5.3. Effects of the Number of SBSs on the Various Performance Aspects
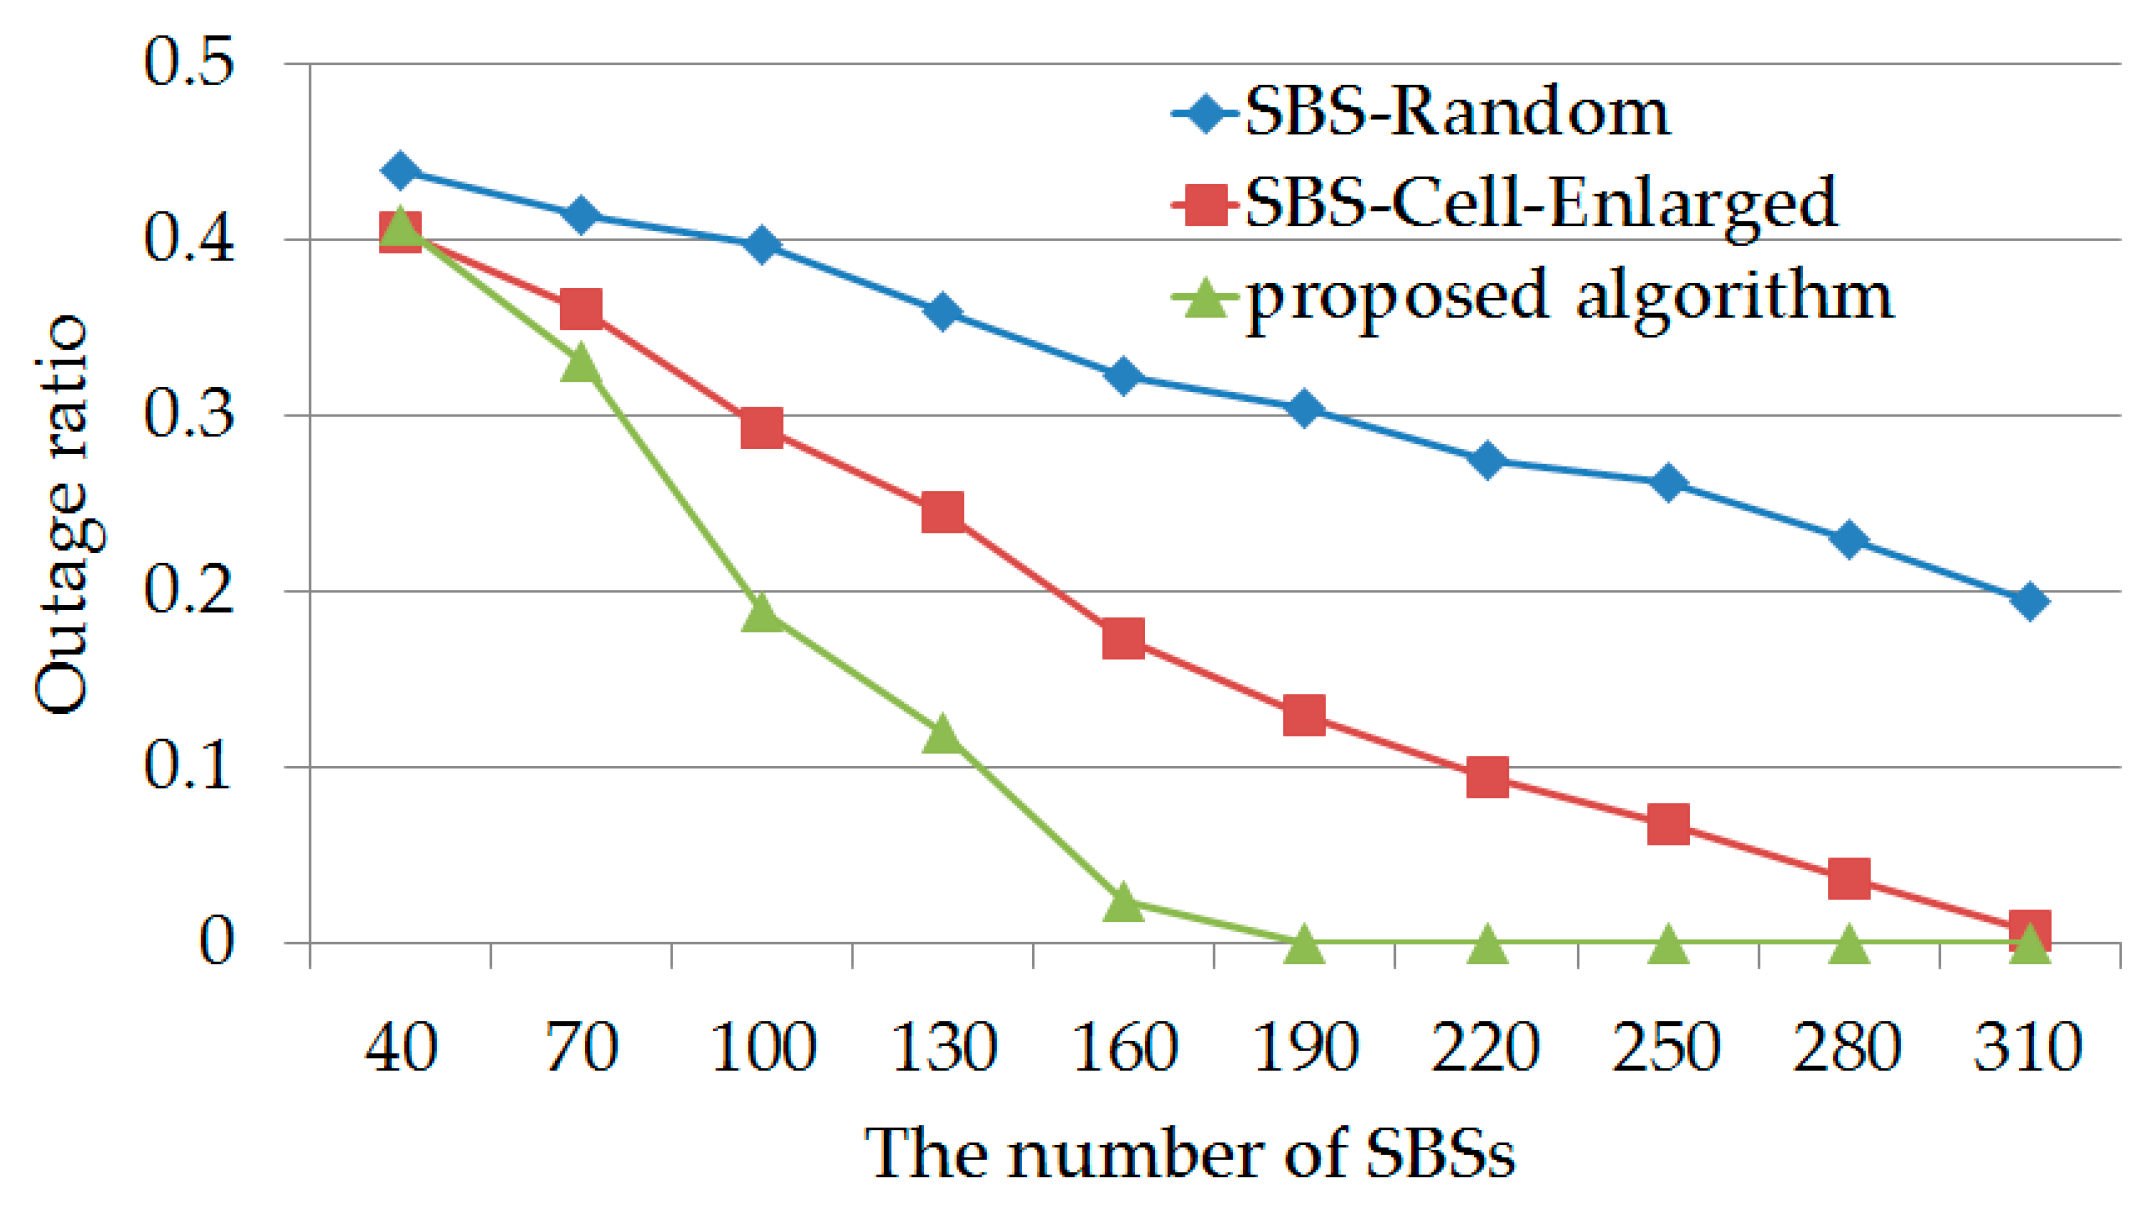
Figure 18 shows the effect of the number of SBSs on the outage ratios of the proposed algorithm, SBS-Cell-Enlarged, and SBS-Random. The outage ratios of all the three methods are higher than 0.4 when the number of SBSs is small, indicating the paralyzed state of the entire network system regardless of the method applied. This is because the distribution of SBSs is sparse when the traffic volume is fixed, forcing most users to use the MBS for transmission. But when the bandwidth is limited, the MBS cannot provide channels to many users, which results in a growing outage ratio.
Figure 18 also shows that, when the number of SBSs increases, the outage ratios of all the three methods decrease. However, the outage ratio of the proposed algorithm decreases faster when compared to the other two methods. More specifically, when the number of SBSs increases to about 160, the outage ratio of the proposed algorithm is close to 0. A continuous decrease in the outage ratio is also observed for SBS-Cell-Enlarged and SBS-Random. The cell enlargement of SBSs, which occurs when these two methods are used, can cover and provide services to users. However, due to the limited number of channels within one SBS, users may be unable to access any channels even though they are covered, and this causes outages. Due to the smaller number of SBSs as compared to SBS-Cell-Enlarged, SBS-Random does not allow some users to use SBSs for transmission. Also, the number of channels in the MBS is limited. Thus, the extent of the decrease in the outage ratio under SBS-Random is small. When the number of SBSs is equal to 190, the outage ratio of the proposed algorithm becomes 0, whereas the outage ratios of SBS-Cell-Enlarged and SBS-Random remain high. When the number of SBSs reaches 310, the outage ratio almost decreases to 0 under SBS-Cell-Enlarged, but remains high under SBS-Random.
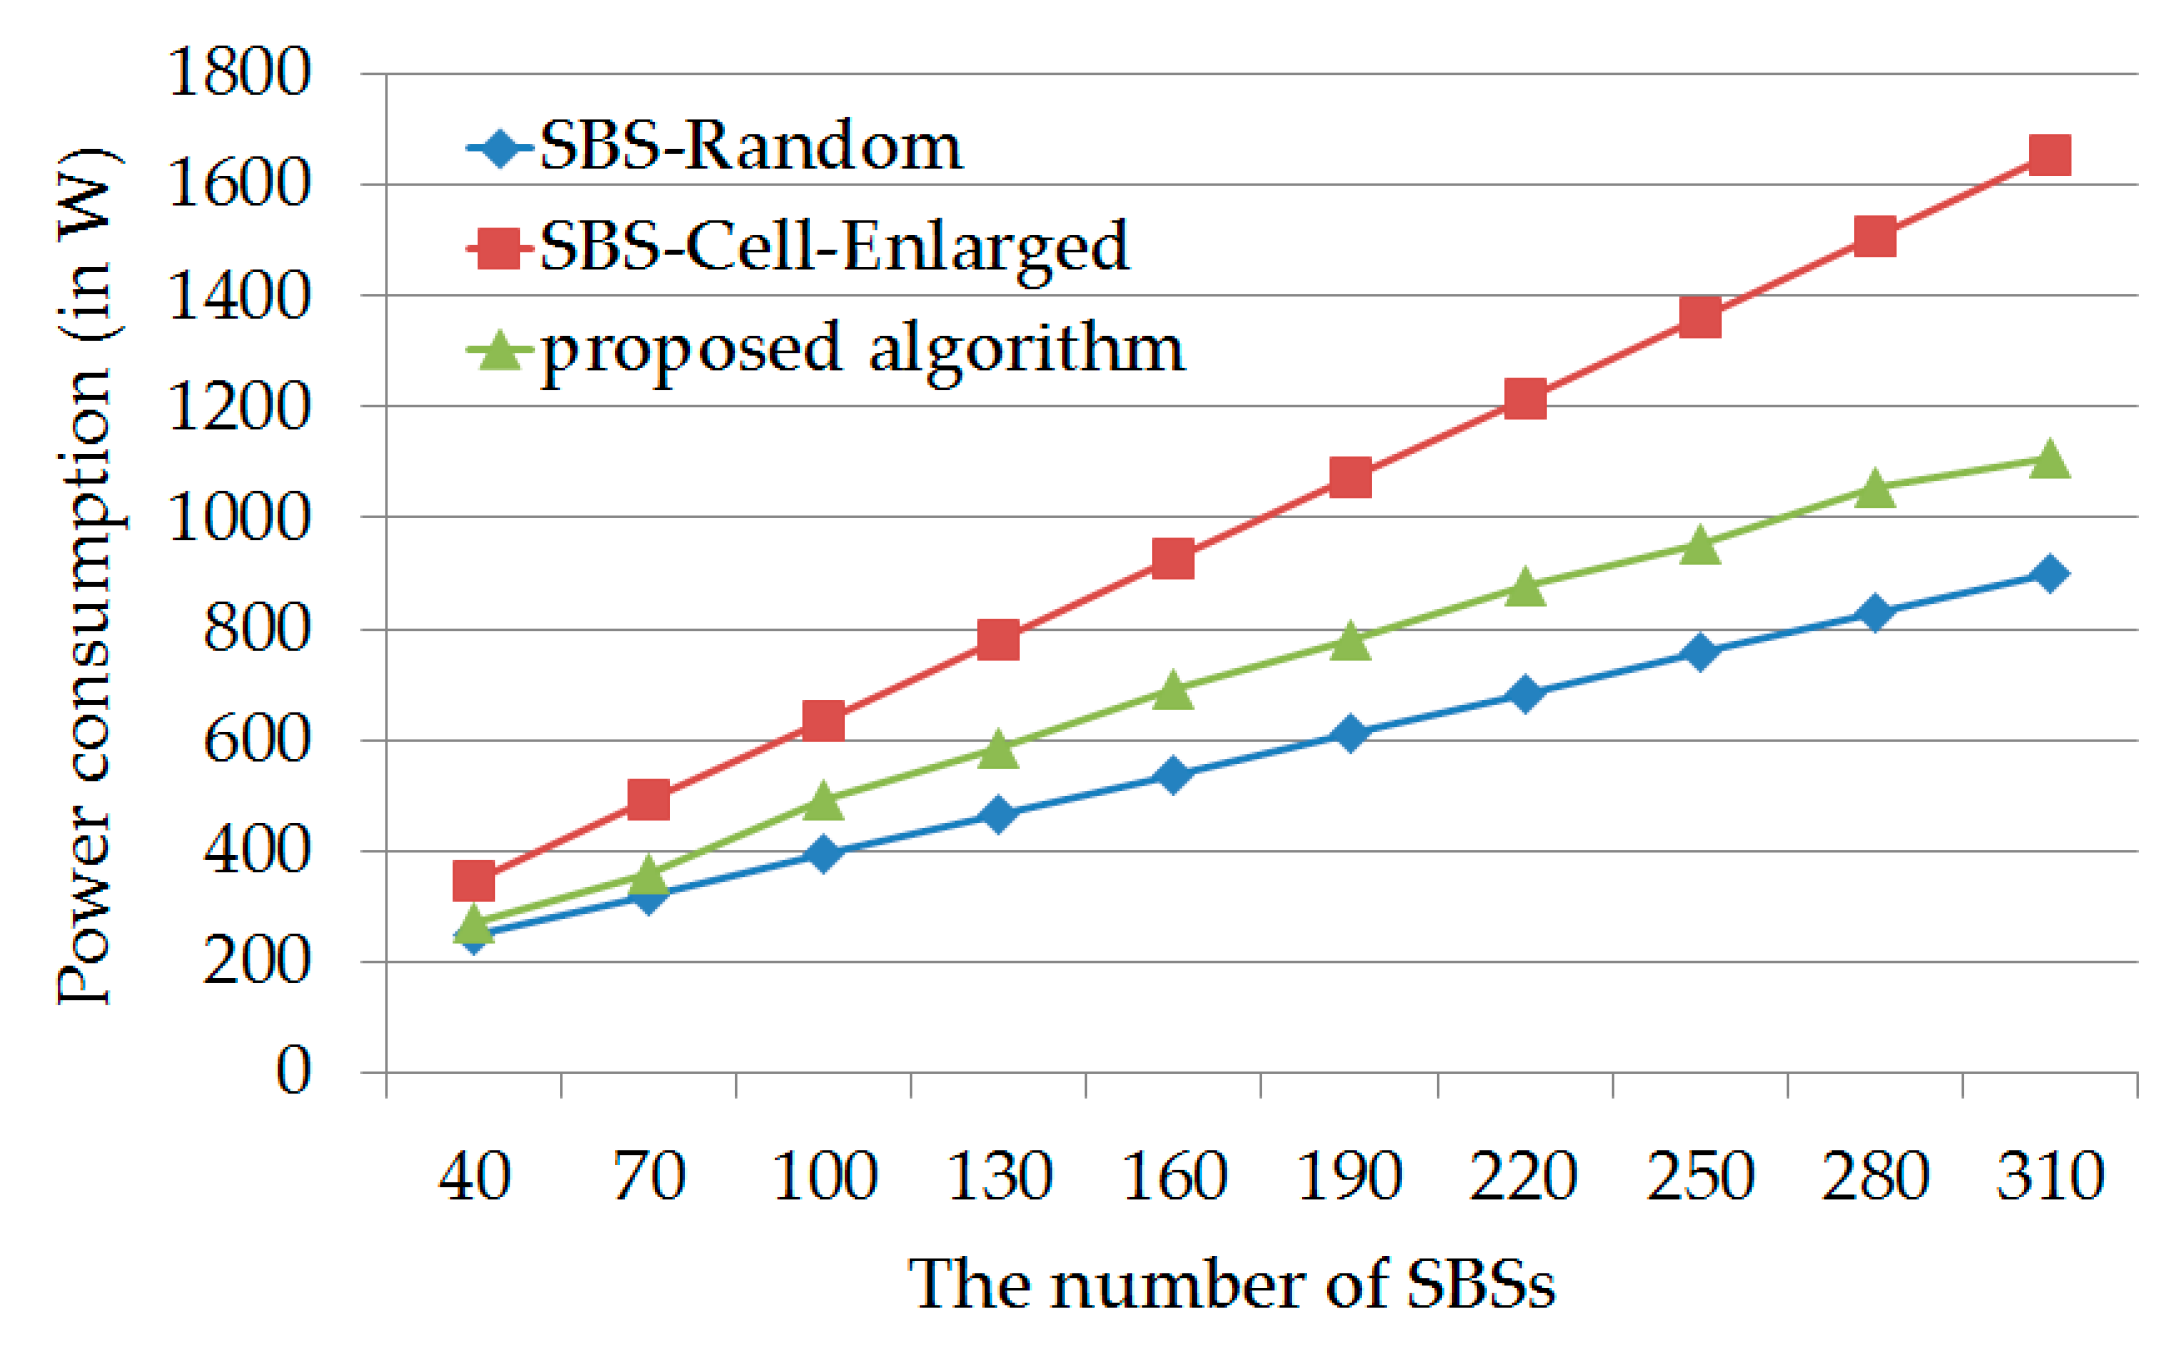
The effect of the number of SBSs on the total power consumption levels of transceivers at all the BSs for the proposed algorithm, SBS-Cell-Enlarged, and SBS-Random, is shown in Figure 19. When the number of SBSs is 40, the total power consumption levels of the three methods are similar. This is because, with 40 SBSs, distribution is considered sparse in relation to the entire network system being considered. The proposed algorithm only uses the SBSs that are needed, which makes it difficult to use these SBSs (i.e., the 40 SBSs) to provide service to users. Given that most users access services through the MBS, the total power consumption level of the MBS increases to its upper limit (i.e., 150 W). Moreover, it is known that the total power dissipated by each SBS is 5 W. Therefore, the total power consumption level of the proposed algorithm is only slightly lower than that of SBS-Cell-Enlarged. The difference in total power consumption is even smaller between SBS-Random and the proposed algorithm, indicating that SBS-Random and the proposed algorithm both use a similar number of SBSs.
In addition, Figure 19 shows that, as the number of SBSs increases, the total power consumption levels of the three methods increase as well. Due to the smaller number of available SBSs, SBS-Random shows the lowest power consumption level among the three methods. Moreover, despite the same number of available SBSs for SBS-Cell-Enlarged and the proposed algorithm, the proposed algorithm can effectively control the switching and scaling of each SBS depending on user location and manage the power of each SBS, therefore ensuring the maximum utility of the SBSs being used; SBSs that are not needed are not used, which prevents unnecessary power dissipation. Therefore, as shown by the results, as the number of available SBSs gradually increases, so does the gap between the proposed algorithm and SBS-Cell-Enlarged. That is to say, the proposed algorithm saves significantly more power than SBS-Cell-Enlarged. For instance, when the number of SBSs is 310, power dissipation decreases by about 33%.
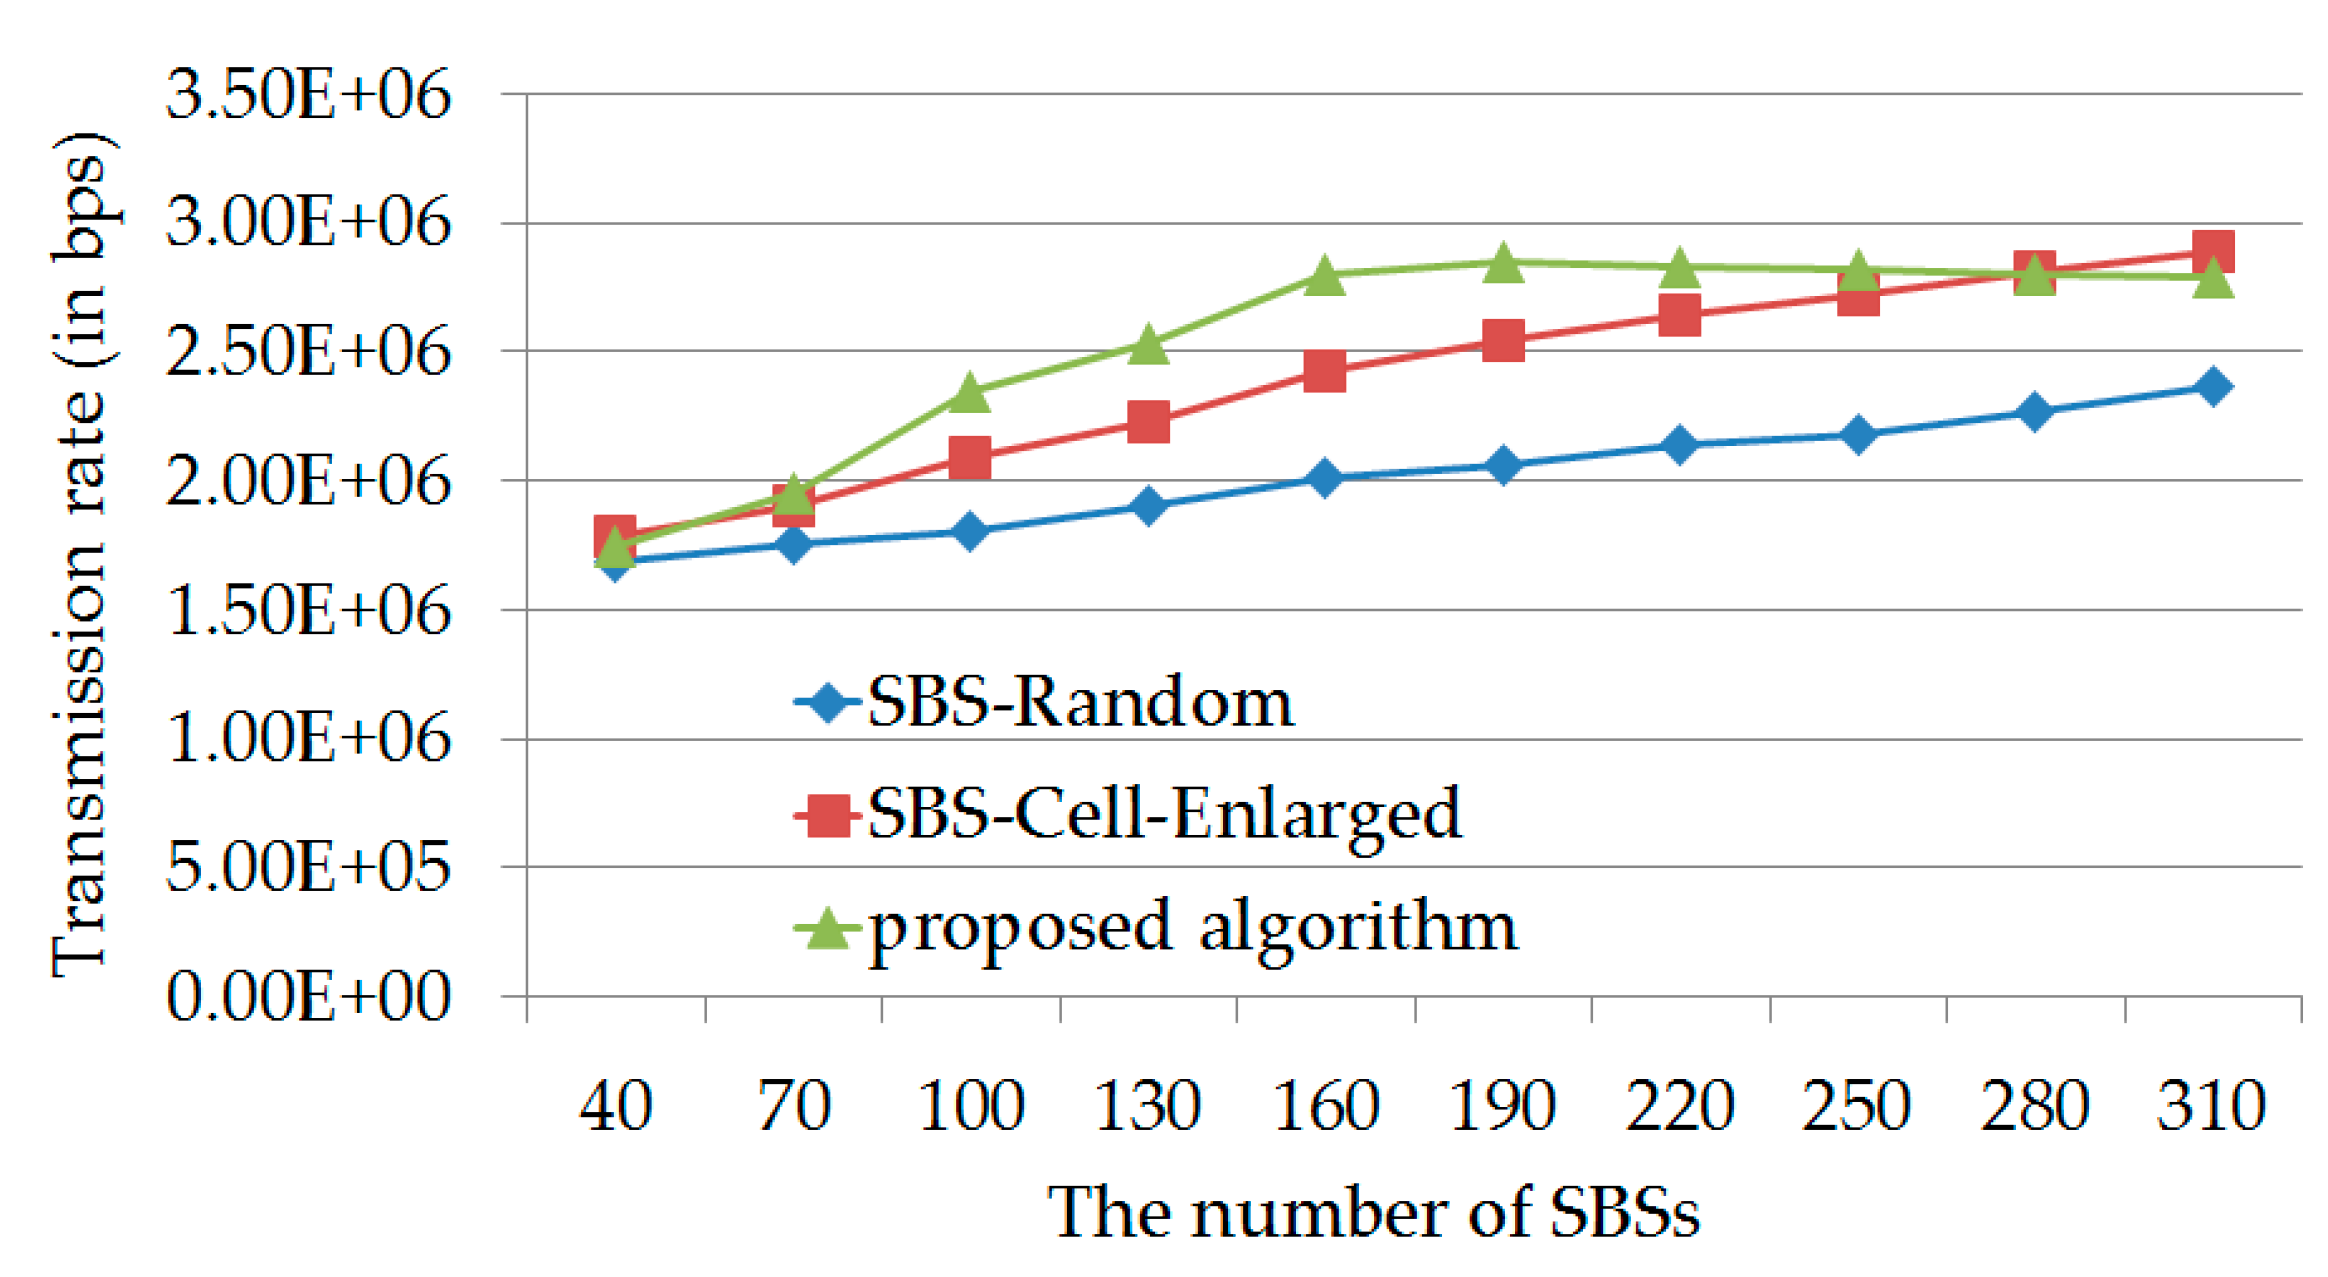
The effect of the number of SBSs on the average transmission rates for the proposed algorithm, SBS-Cell-Enlarged, and SBS-Random, is demonstrated in Figure 20. When the number of SBSs is low (e.g., 40), all the three methods fail to reach the average required transmission rate (i.e., 2 Mbps). As the number of SBSs increases, the average transmission rates of the three methods (particularly the proposed algorithm and SBS-Cell-Enlarged) increase as well.
For example, when the number of SBSs increases to 100, the average transmission rates of the proposed algorithm and SBS-Cell-Enlarged are higher than the required value, while SBS-Random’s average transmission rate is still lower than the required value. As the number of SBSs increases, the proposed algorithm gradually outperforms the other two methods. When the number of SBSs reaches 160, the curve of the proposed algorithm approaches a horizontal line. As shown in Figure 18, when the number of SBSs is 160, the outage ratio of the proposed algorithm approaches zero. This suggests that, at this quantity, the SBSs could handle the current traffic volume, meaning that each user could be provided with services through the MBS or SBSs. Moreover, the main effect of the increased number of SBSs on the proposed algorithm is the gradual transfer of MBS users to SBSs (the outage ratio is maintained at zero). As a result, changes in average transmission rate are small. When the number of SBSs reaches about 280, the average transmission rate of SBS-Cell-Enlarged catches up again with that of the proposed algorithm. Due to the fact that all SBSs are in the cell-enlarged state in SBS-Cell-Enlarged (higher power output provides higher transmission rate) and that the outage ratio of SBS-Cell-Enlarged continuously decreases (as shown in Figure 18), a transmission rate that is higher than that of the proposed algorithm is thus attained. Moreover, the average transmission rate of SBS-Cell-Enlarged is substantially higher than that of SBS-Random when the number of SBSs is high. Since the larger number of available SBSs as compared to SBS-Random allows SBS-Cell-Enlarged to provide users with more channels, this results in a lower outage ratio, and therefore, a higher average transmission rate.
6. Conclusions
The present study proposes and successfully demonstrates a novel coverage algorithm aimed at increasing the energy efficiency of macrocell—small cell two-layer network systems with novel system configurations. The proposed algorithm adjusts the power levels of all the SBSs in a given system, including the full deactivation of a previously active SBS or the activation of a previously inactive SBS, according to the dynamics of the given network traffic situation, thus reducing the power used by the SBSs, when appropriate, in order to limit any waste of energy. At the same time, by activating/deactivating the SBSs and adjusting their power levels at the most appropriate times, the proposed algorithm can simultaneously ensure that users are still provided with comprehensive wireless signal coverage. The results for simulations of various test scenarios indicated that the algorithm yields better system performance than two conventional approaches, in terms of its overall effects on the outage ratio of all the users, the total power consumption of transceivers at all the BSs, and the average transmission rate of all the users. The simulated power savings yielded by the proposed algorithm were particularly notable, as it garnered an improvement as high as 78% under the condition of light traffic volumes. Based on these findings, we believe that the proposed algorithm could yield considerable benefits if used in two-layer network systems, while also making substantial contributions to research, or the previous lack thereof, into the subject of coverage holes. Relatedly, we conclude that the proposed approach could be of substantial value/guidance to researchers and network operators engaged in the design of next-generation two-layer energy-saving networks. Moreover, by potentially providing substantial energy savings and contributing to environmental sustainability, this approach, or related approaches developed in subsequent related research, could help to mitigate the problem of global warming. Similarly, by providing for the judicious conservation and utilization of energy, this approach, or related approaches, may make the avoidance or reduction of various other types of environmental degradation possible.
Acknowledgments
The author wishes to express his appreciation for the financial support provided by the Ministry of Science and Technology (MOST) of Taiwan, R.O.C., under the Contracts MOST 105-2628-E-019-002-MY3 and MOST 106-2221-E-019-011-MY2.
Conflicts of Interest
The author declares no conflict of interest.
References
- Cisco Visual Networking Index: Global Mobile Data Traffic Forecast Update, 2016–2021 White Paper. Available online: http://www.cisco.com/c/en/us/solutions/collateral/service-provider/visual-networking-index-vni/mobile-white-paper-c11-520862.html (accessed on 15 April 2017).
- Fehske, A.J.; Viering, I.; Voigt, J.; Sartori, C.; Redana, S.; Fettweis, G.P. Small-cell self-organizing wireless networks. Proc. IEEE 2014, 102, 334–350. [Google Scholar] [CrossRef]
- Gupta, A.; Jha, R.K. A survey of 5G network: Architecture and emerging technologies. IEEE Access 2015, 3, 1206–1232. [Google Scholar] [CrossRef]
- Small Cell Forum. Available online: http://www.smallcellforum.org (accessed on 8 June 2017).
- Ng, D.W.K.; Lo, E.S.; Schober, R. Energy-efficient resource allocation in OFDMA systems with large numbers of base station antennas. IEEE Trans. Wirel. Commun. 2012, 11, 3292–3304. [Google Scholar] [CrossRef]
- Ng, D.W.K.; Lo, E.S.; Schober, R. Energy-efficient resource allocation in multi-cell OFDMA systems with limited backhaul capacity. IEEE Trans. Wirel. Commun. 2012, 11, 3618–3631. [Google Scholar] [CrossRef]
- Ng, D.W.K.; Lo, E.S.; Schober, R. Energy-efficient resource allocation in OFDMA systems with hybrid energy harvesting base station. IEEE Trans. Wirel. Commun. 2013, 12, 3412–3427. [Google Scholar] [CrossRef]
- Chung, Y.-L. Rate-and-power control based energy-saving transmissions in OFDMA-based multicarrier base station. IEEE Syst. J. 2015, 9, 578–584. [Google Scholar] [CrossRef]
- Chung, Y.-L. Energy-efficient transmissions for green base stations with a novel carrier activation algorithm: A system-level perspective. IEEE Syst. J. 2015, 9, 1252–1263. [Google Scholar] [CrossRef]
- Chung, Y.-L. A novel power-saving transmission scheme for multiple-component-carrier cellular systems. Energies 2016, 9, 265. [Google Scholar] [CrossRef]
- Chung, Y.-L. A novel algorithm for efficient downlink packet scheduling for multiple-component-carrier cellular systems. Energies 2016, 9, 950. [Google Scholar] [CrossRef]
- 3GPP TR. 36.927 V10.1.0, Potential Solutions for Energy Saving for E-UTRAN (Release 10). September 2011. Available online: http://www.qtc.jp/3GPP/Specs/36927-a10.pdf (accessed on 10 March 2017).
- Claussen, H.; Ashraf, I.; Ho, L.T.W. Dynamic idle mode procedures for femtocells. Bell Syst. Tech. J. 2010, 15, 95–116. [Google Scholar] [CrossRef]
- Wang, W.; Shen, G. Energy efficiency of heterogeneous cellular network. In Proceedings of the 2010 IEEE 72nd Vehicular Technology Conference Fall, Ottawa, ON, Canada, 6–9 September 2010. [Google Scholar]
- Auer, G.; Giannini, V.; Desset, C.; Godor, I.; Skillermark, P.; Olsson, M.; Imran, M.A.; Sabella, D.; Gonzalez, M.J.; Blume, O.; et al. How much energy is needed to run a wireless network? IEEE Wirel. Commun. 2011, 18, 40–49. [Google Scholar] [CrossRef]
- Aleksic, S.; Deruyck, M.; Vereecken, W.; Joseph, W.; Pickavet, M.; Martens, L. Energy efficiency of femtocell deployment in combined wireless/optical access networks. Comput. Netw. 2013, 57, 1217–1233. [Google Scholar] [CrossRef] [Green Version]
- Huang, L.; Zhou, Y.; Wang, Y.; Han, X.; Shi, J.; Chen, X. Advanced coverage optimization techniques for small cell clusters. China Commun. 2015, 12, 111–122. [Google Scholar] [CrossRef]
- Wang, Y.; Dai, X.; Wang, J.M.; Bensaou, B. Iterative greedy algorithms for energy efficient LTE small cell networks. In Proceedings of the 2016 IEEE Wireless Communications and Networking Conference, Doha, Qatar, 3–6 April 2016. [Google Scholar]
- Chung, Y.-L. An energy-saving small-cell zooming scheme for two-tier hybrid cellular networks. In Proceedings of the 2015 International Conference on Information Networking, Siem Reap, Cambodia, 12–14 January 2015. [Google Scholar]
- Chung, Y.-L. Energy-saving transmission for green macrocell—Small cell systems: A system-level perspective. IEEE Syst. J. 2017, 11, 706–716. [Google Scholar] [CrossRef]
- Mekikis, P.-V.; Kartsakli, E.; Antonopoulos, A.; Lalos, A.S.; Alonso, L.; Verikoukis, C. Two-tier cellular random network planning for minimum deployment cost. In Proceedings of the 2014 IEEE International Conference on Communications, Sydney, Australia, 10–14 June 2014. [Google Scholar]
- Xie, L.; Heegaard, P.E.; Jiang, Y. Survivability analysis of a two-tier infrastructure-based wireless network. Comput. Netw. 2017. [Google Scholar] [CrossRef]
- Antonopoulos, A.; Kartsakli, E.; Bousia, A.; Alonso, L.; Verikoukis, C. Energy-efficient infrastructure sharing in multi-operator mobile networks. IEEE Commun. Mag. 2015, 53, 242–249. [Google Scholar] [CrossRef] [Green Version]
- Bousia, A.; Kartsakli, E.; Antonopoulos, A.; Alonso, L.; Verikoukis, C. Multiobjective auction-based switching-off scheme in heterogeneous networks: To bid or not to bid? IEEE Trans. Veh. Technol. 2016, 65, 9168–9180. [Google Scholar] [CrossRef]
- Oikonomakou, M.; Antonopoulos, A.; Alonso, L.; Verikoukis, C. Evaluating cost allocation imposed by cooperative switching off in multi-operator shared HetNets. IEEE Trans. Veh. Technol. 2017. [Google Scholar] [CrossRef]
- Shannon, C.E. A mathematical theory of communication. Bell Syst. Tech. J. 1948, 27, 379–423. [Google Scholar] [CrossRef]
- Shannon, C.E. A mathematical theory of communication. Bell Syst. Tech. J. 1948, 27, 623–656. [Google Scholar] [CrossRef]
- Simsek, M.; Akbudak, T.; Zhao, B.; Czylwik, A. An LTE-femtocell dynamic system level simulator. In Proceedings of the 2010 IEEE International ITG Workshop on Smart Antennas, Bremen, Germany, 23–24 February 2010. [Google Scholar]
Figure 1.
Small cell base stations (SBSs) in all possible states: (a) an SBS with low power output that is placed at a point outside of coverage hole centers; (b) an SBS with high power output that is placed at a point outside of coverage hole centers, providing coverage to nearby areas, excluding coverage holes, that need it; (c) an SBS that is disabled; (d) a disabled SBS that is placed at a point outside of coverage hole centers and unable, in its high power output state, to provide coverage to nearby areas that need it; (e) an SBS with high power output that is placed at a point outside of coverage hole centers, providing coverage to the coverage hole closest to it; (f) an SBS that is placed in a coverage hole center, and that is functioning in the low power state.

Figure 2.
Conceptual depiction of a two-layer cellular network system.

Figure 3.
Three areas of connection in direct paths during the period.

Figure 4.
Flow chart of the proposed coverage algorithm.

Figure 5.
Conceptual illustrations of (a) SSS, (b) YNY, and (c) XNX.

Figure 6.
Conceptual illustrations of (a) SYN, (b) SXN, and (c) SNN.

Figure 7.
Conceptual illustrations of (a) NYS, (b) NXS, and (c) NNS.

Figure 8.
Conceptual illustrations of (a) NYN, (b) NXN, and (c) NNN.

Figure 9.
Conceptual illustrations of (a) SSD and (b) SSO.

Figure 10.
Conceptual illustrations of (a) YND and (b) XND.
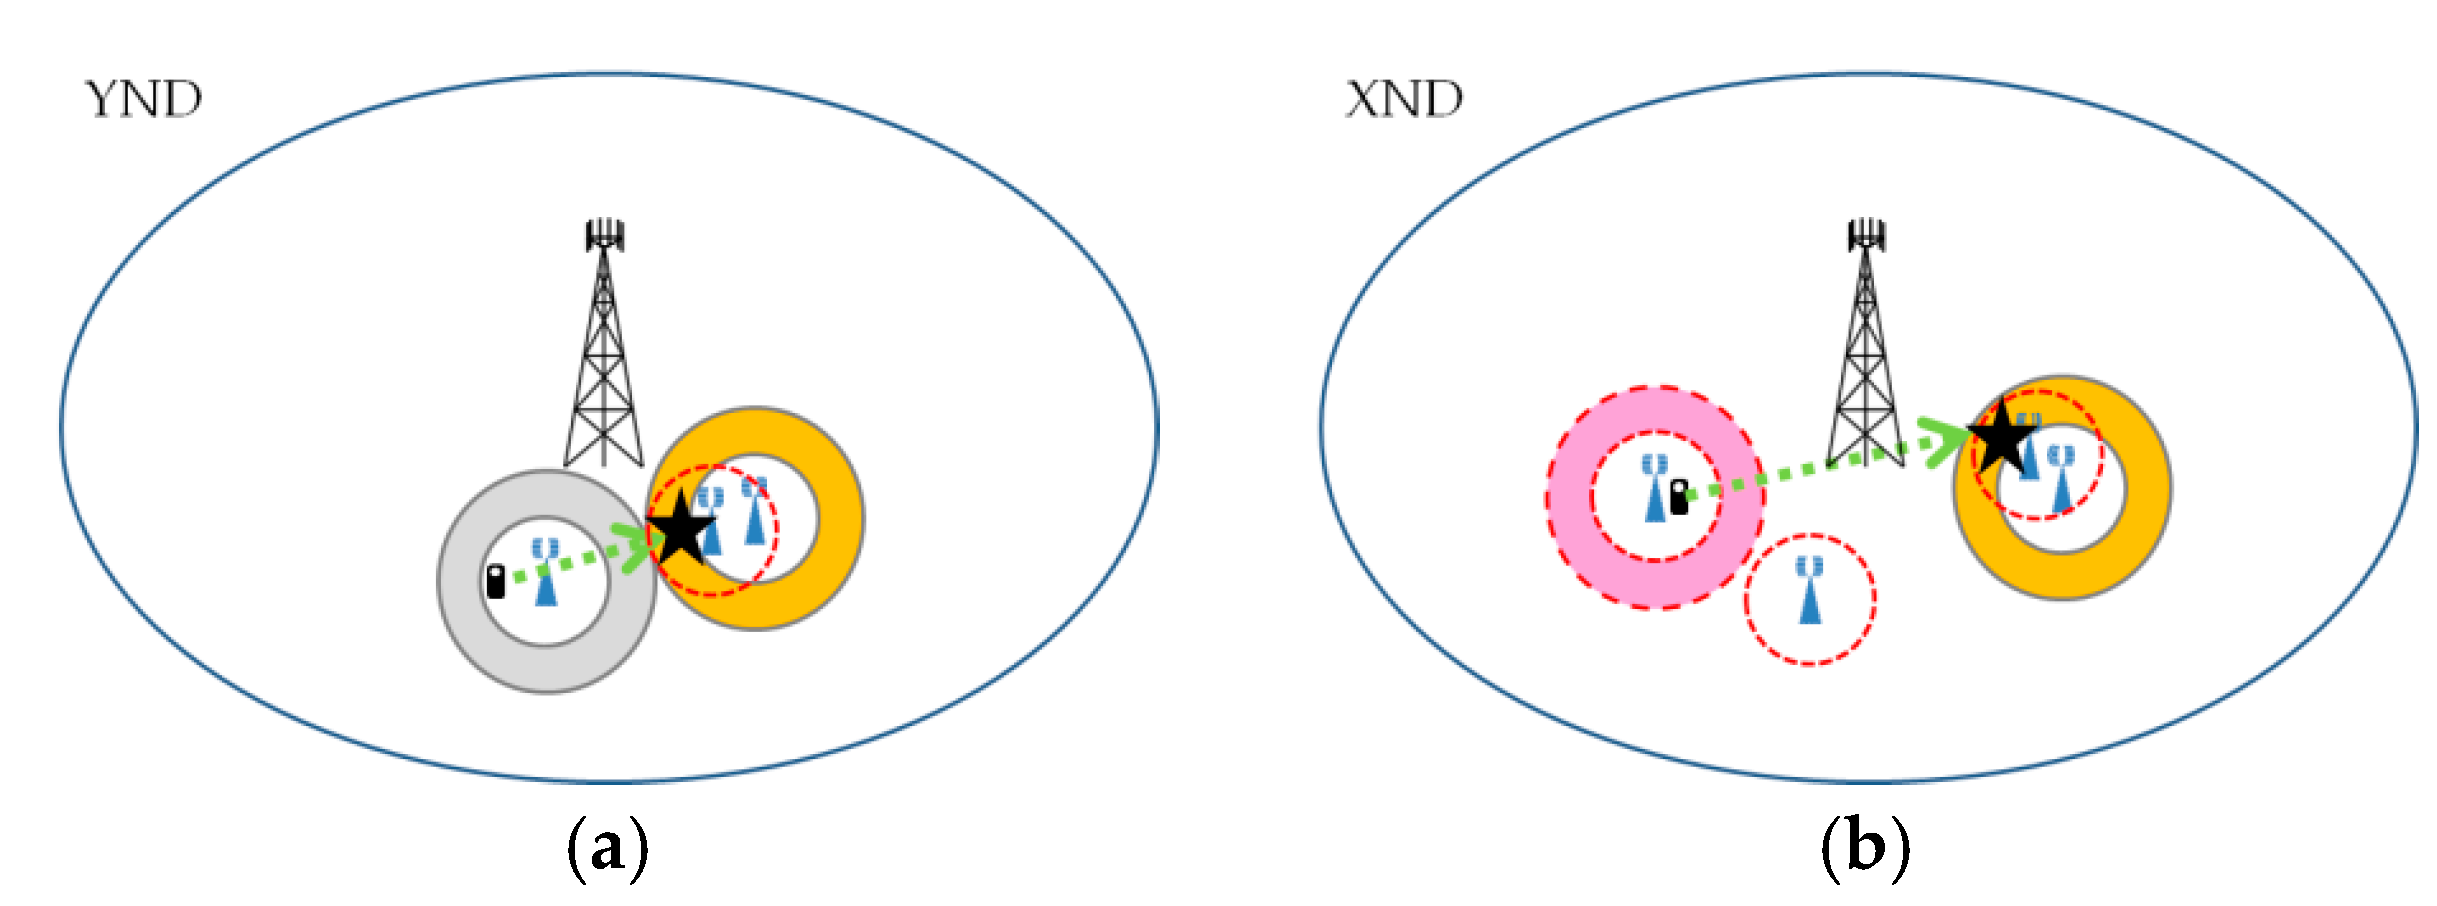
Figure 11.
Conceptual illustrations of (a) YNO and (b) XNO.

Figure 12.
Conceptual illustrations of (a) NYD and (b) NXD.

Figure 13.
Conceptual illustrations of (a) NYO and (b) NXO.

Figure 14.
Conceptual illustrations of (a) NND and (b) NNO.

Figure 15.
Effect of the number of users on the outage ratios for the proposed algorithm, SBS-Cell-Enlarged, and SBS-Random.
Figure 15.
Effect of the number of users on the outage ratios for the proposed algorithm, SBS-Cell-Enlarged, and SBS-Random.

Figure 16.
Effect of the number of users on the total power consumption levels of transceivers at all the BSs for the proposed algorithm, SBS-Cell-Enlarged, and SBS-Random.
Figure 16.
Effect of the number of users on the total power consumption levels of transceivers at all the BSs for the proposed algorithm, SBS-Cell-Enlarged, and SBS-Random.

Figure 17.
Effect of the number of users on the average transmission rates for the proposed algorithm, SBS-Cell-Enlarged, and SBS-Random.
Figure 17.
Effect of the number of users on the average transmission rates for the proposed algorithm, SBS-Cell-Enlarged, and SBS-Random.

Figure 18.
Effect of the number of SBSs on the outage ratios for the proposed algorithm, SBS-Cell-Enlarged, and SBS-Random.
Figure 18.
Effect of the number of SBSs on the outage ratios for the proposed algorithm, SBS-Cell-Enlarged, and SBS-Random.

Figure 19.
Effect of the number of SBSs on the total power consumption levels of transceivers at all the BSs for the proposed algorithm, SBS-Cell-Enlarged, and SBS-Random.
Figure 19.
Effect of the number of SBSs on the total power consumption levels of transceivers at all the BSs for the proposed algorithm, SBS-Cell-Enlarged, and SBS-Random.

Figure 20.
Effect of the number of SBSs on the average transmission rates for the proposed algorithm, SBS-Cell-Enlarged, and SBS-Random.
Figure 20.
Effect of the number of SBSs on the average transmission rates for the proposed algorithm, SBS-Cell-Enlarged, and SBS-Random.

© 2017 by the author. Licensee MDPI, Basel, Switzerland. This article is an open access article distributed under the terms and conditions of the Creative Commons Attribution (CC BY) license (http://creativecommons.org/licenses/by/4.0/).
Share and Cite
MDPI and ACS Style
Chung, Y.-L. An Energy-Efficient Coverage Algorithm for Macrocell—Small Cell Network Systems. Energies 2017, 10, 1319. https://doi.org/10.3390/en10091319
AMA Style
Chung Y-L. An Energy-Efficient Coverage Algorithm for Macrocell—Small Cell Network Systems. Energies. 2017; 10(9):1319. https://doi.org/10.3390/en10091319
Chicago/Turabian StyleChung, Yao-Liang. 2017. "An Energy-Efficient Coverage Algorithm for Macrocell—Small Cell Network Systems" Energies 10, no. 9: 1319. https://doi.org/10.3390/en10091319
Note that from the first issue of 2016, this journal uses article numbers instead of page numbers. See further details here.