Development of a Decision-Making Algorithm for the Optimum Size and Placement of Distributed Generation Units in Distribution Networks

Department of Electrical and Electronic Engineering Educators, ASPETE—School of Pedagogical and Technological Education, Ν. Ηeraklion, 141 21 Athens, Greece
Energies 2017, 10(9), 1433; https://doi.org/10.3390/en10091433
Submission received: 23 July 2017
/
Revised: 1 September 2017
/
Accepted: 14 September 2017
/
Published: 18 September 2017
(This article belongs to the Section F: Electrical Engineering)
Abstract
:The paper presents a decision-making algorithm that has been developed for the optimum size and placement of distributed generation (DG) units in distribution networks. The algorithm that is very flexible to changes and modifications can define the optimal location for a DG unit (of any type) and can estimate the optimum DG size to be installed, based on the improvement of voltage profiles and the reduction of the network’s total real and reactive power losses. The proposed algorithm has been tested on the IEEE 33-bus radial distribution system. The obtained results are compared with those of earlier studies, proving that the decision-making algorithm is working well with an acceptable accuracy. The algorithm can assist engineers, electric utilities, and distribution network operators with more efficient integration of new DG units in the current distribution networks.
1. Introduction
The worldwide continuous integration of distributed generation (DG) units in the electric power systems is a result of electricity markets’ privatization, of environment protection from emissions and of technological progression. The unadvised and uncontrolled installation of DGs in the distribution network during the past two decades brought in serious problems and challenges to the distribution networks. Such problems are the inevitable bidirectional power flow in the modern distribution networks, in contrast to unidirectional power flow from higher to lower voltages, and the very important problems of voltage drop and power losses [1,2]. Researchers from all over the world are studying the above-mentioned problems and have featured various techniques and methodologies for selecting the optimum sitting and sizing of DGs in an effort to improve the voltage profiles and minimize or even eliminate power losses of modern distribution networks with DG.
A new particle swarm optimization method has been proposed in [1], aiming to improve the power quality and the reliability of a distribution system by identifying the optimal number of DGs to be connected and their most suitable location within the system. The proposed method was tested on the IEEE 30-bus system, producing results that have shown considerable reduction in the total system’s power losses, improvement in the buses voltage profiles and reliability. Jamian et al. [3] used multiple types of optimization techniques to regulate the DG’s output in order to compute its optimal size. Comparative studies of a new proposed rank evolutionary particle swarm optimization method with evolutionary particle swarm optimization and a traditional particle swarm optimizations were conducted. The implementation of evolutionary programming and particle swarm optimization allowed the entire particles to move towards the optimal value in a more rapid way. Their applied technique demonstrates a reduction in power losses, achieved when an optimal DG size is selected. Evolutionary particle swarm optimization presented better results than the conventional particle swarm optimization due to its reduced iterations and computing time.
Devabalaji and Ravi [4] have proposed a combined methodology for the optimal size and sitting of multiple DGs and distribution static compensators. They have used the loss factor to determine the optimal location and the bacterial foraging optimization algorithm to determine the optimal size. The used objective function was formulated for minimizing power loss, operational costs, and voltage profile enhancement of the system The proposed methodology was tested on IEEE 33-bus and 119-bus radial distribution system with different load factors obtaining very useful results and demonstrating the benefits developing within radial systems by the implementation of DGs and the distribution of static compensators. In [5] combined nature inspired algorithms for the optimal location and sizing of DGs have been used. A two-step optimization technique has been proposed for DG integration. In the first step, the best size of DG is determined through particle swarm optimization metaheuristics and the results obtained are checked for reverse power flow using the negative load approach. Then, optimal location is determined by loss sensitivity factor and weak bus methods in search of possible bus locations. In the second step, the optimal sizing of DGs is determined by using three nature inspired algorithms, i.e., particle swarm optimization, gravitational search algorithm, and a combination of the previous two algorithms. The effectiveness of the proposed technique has been proved through its testing on the IEEE 30-bus system.
A study conducted by Kotb et al. [6] used genetic algorithms to define the optimal location and size of several DG units. Three main objectives have been selected, i.e., voltage, real and reactive power losses, and DG size, aiming to reduce the total power losses and to improve the voltage profiles. A 69-bus radial distribution test system for testing and verification purposes has been used in their study. The proposed methodology suggested that the installation of three DG units of the same size in three different positions of the 69-bus radial distribution test system resulted in the reduction of power losses and in voltage profiles enhancement. A similar technique that combines a genetic algorithm with the particle swarm optimisation method for the sitting and sizing of DGs within distribution networks has been proposed in [7]. The suggested technique aimed at voltage improvement, voltage stabilisation, and power losses reduction for radial systems. The genetic algorithm has been used in order to locate the optimum DG installation location while the particle swarm optimisation method has been used to compute the DG’s optimum size. A 33-bus radial system and a 69-bus radial system were used in order to test the proposed technique.
In a similar way in [8], genetic and particle swarm optimization algorithms have been exploited for the optimal placement and sizing of both a DG and a capacitor. The performance of these algorithms has been tested by applying the proposed methodology to a 12-bus radial distribution system. The produced results have presented that the proposed methodology is more effective and capable of providing better results than other analytical methods. Following, Parizad et al. [9] tried to determine the optimum location and the size of DG in terms of reducing losses and stabilizing voltage, using two different methods. The first approach aimed at real power losses reduction through the development of an exact loss formula that determined the best location for DG installation. In the second approach, a voltage stability index to position DG in the optimum location was used. Power flow was computed by applying the forward-backward sweep method. Two distribution systems of 33-bus (radial) and 30-bus (loop) have been used in the study. The proposed techniques revealed significant improvement in terms of voltage profiles and power losses reduction. In [10], fuzzy logic has been applied for locating the optimum placement of a single DG unit and a new analytical expression for DG sizing implemented in radial networks was proposed. The aim of this study was to improve the voltage profile and minimize real and reactive power losses. Three different distribution systems (a 12-bus, a 33-bus, and a 69-bus) were utilized in order to demonstrate that the proposed methodologies can be applied in radial distribution systems of different sizes and arrangements. The results have presented that the appropriate installation of a DG unit has resulted in significant reduction in real and reactive power losses as well as in a noteworthy voltage profile improvement. Contrasting the majority of other researchers that use the Newton-Rapson method, a forward-backward sweep algorithm for load flow analysis was applied.
Mahat et al. [11] introduced a methodology for defining both the optimal size and location of wind type DG in primary distribution systems aiming in the reduction of system’s real power loss. The exact loss formula was used to trace system losses and their methodology was implemented in both a 33-bus and a 69-bus radial distribution system. An analytical study for the calculation of the optimum size and allocation of DG units at optimal positions was presented in [12]. The above-mentioned technique aimed to reduce distribution systems power losses and to improve voltage profiles by applying a sensitivity index in order to identify the optimal DG connection location. The 13-bus IEEE radial distribution test system has been used for verification purposes and the main conclusion was that minimum losses and an improved voltage profile can be achieved by integrating a single DG unit of optimum size in an optimum location rather the integration of several DG units.
A very interesting study has been presented by Di Silvestre et al. [13]. The authors are concerned with reducing energy losses of an islanded medium voltage distribution network aiming at the improvement of electricity distribution efficiency. One of the proposed actions taken was the installation of distributed photovoltaic (PV) generation units. The NSGA-II multi-objective optimization algorithm has been implemented for defining the optimal location and size of the PV units. The most significant contribution of this study, as compared to others, is that economic factors have been taken into account such as: utilities’ costs and subsidies to customers. The application of the proposed methodology on an existent medium voltage distribution network of Lampedusa Island has proven that the PV generation units installation leads to significant advances in terms of investment payback, voltage drop, and greenhouse gas emissions reduction.
Safigianni et al. [14] were concerned with the impact of mixed DG technologies penetrating a medium voltage power distribution network. Power flow and short-circuit analyses were conducted aiming to determine the impact of DG penetration in terms of current, losses, voltage profiles, and short-circuit levels of the examined network. Their general conclusion was that arbitrary DG accommodation leads not only to network sterilization, but also to the violation of technical constraints. Balamurugan et al. [15] conducted load flow and short circuit studies in an effort to investigate the impact of photovoltaics on the distribution systems. They implemented their analysis on the IEEE 34-bus system, with their main focus on the system’s total power losses, phase imbalances, fault levels, and voltage profiles. They have concluded that the higher the penetration level, the higher the improvement of the DG’s impact in terms of power losses and voltage profile. They have also observed that the same positive impact was sustained even when DG was installed in several different places within the distribution system.
To this direction this paper presents a decision-making algorithm for the optimum size and placement of DG units in distribution networks. The proposed algorithm is relatively simple, very flexible to changes and modifications, and can support any type of DG unit. It is implemented in MATLAB (R2014b, MathWorks, Natick, MA, USA) and the power systems software NEPLAN 360 (NEPLAN AG, Zurich, Switzerland) is used for the load flow analysis, something that simplifies significantly the simulation process. The algorithm has been tested on the IEEE 33-bus radial distribution system and the obtained results are compared with those of earlier studies, proving that the decision-making algorithm is working well and has an acceptable accuracy. The proposed decision-making algorithm can assist engineers, electric utilities, and network operators to handle more efficient the increasing installation of DG in distribution networks.
2. The Impact of Distributed Generation in Voltage Profile and Power Losses
2.1. Voltage Profile
DG is supposed to support and improve the system’s voltage, but the question that is raised is up to what extent is this statement accurate, since it has been demonstrated that the penetration of DGs in the distribution system may cause overvoltages or undervoltages. Furthermore, specific DG technologies vary their output power level over time, as in the case of photovoltaics and wind generators. As a consequence, voltage fluctuations occur that in turn deteriorate the power quality delivered to consumers [2].
Moreover, overvoltages and undervoltages in distribution networks with DG have been reported due to the incompatibility of DGs with the existing voltage regulation methods. In general, the distribution networks are regulated with the help of voltage regulators, capacitors, and the tap changing of transformers. These methods were designed for radial (unidirectional) power flow and have been proved to be very reliable and efficient in the past. However, nowadays, the installation of DGs in distribution networks have had a substantial impact on the voltage regulation methods performance due to the meshed (bidirectional) power flow, introduced by DGs to the networks.
On the other hand, the implementation of DG has had a positive impact on the distribution networks for the reason that they contribute to the reactive compensation for voltage control, to frequency regulation, and they operate as spinning reserve in the case of main system’s fault indices.
2.2. Power Losses
It has been proved that the DG can minimize the power losses (both real and reactive) of distribution networks due to their installation near the load centers. Several studies, most of which were presented earlier, demonstrated that the location and the size of a DG unit play an important role in the power losses elimination. Consequently, the specific location of a DG in a distributed network and DG’s specific capacity resulting in minimum power losses is in general identified as the optimum location. The DG allocation process is very similar to the capacitor allocation procedure aimed at power losses reduction. The main difference between the two processes is that DG units exhibit impact upon both real and reactive power, while the capacitor banks influence only the reactive power flow. It has been proven, that in the case of networks with increased power losses, installing a relatively small DG unit strategically connected to the network, may result in substantial power losses reduction [16,17].
The losses in a network are dependent on the system operating conditions and are given by (1), known as exact loss formula [18].
where:
P and Q are net real and reactive power injection in each bus, rij is the line resistance between buses i and j, V and δ are the voltage and load angle at corresponding buses.
3. The Propose Decision-Making Algorithm
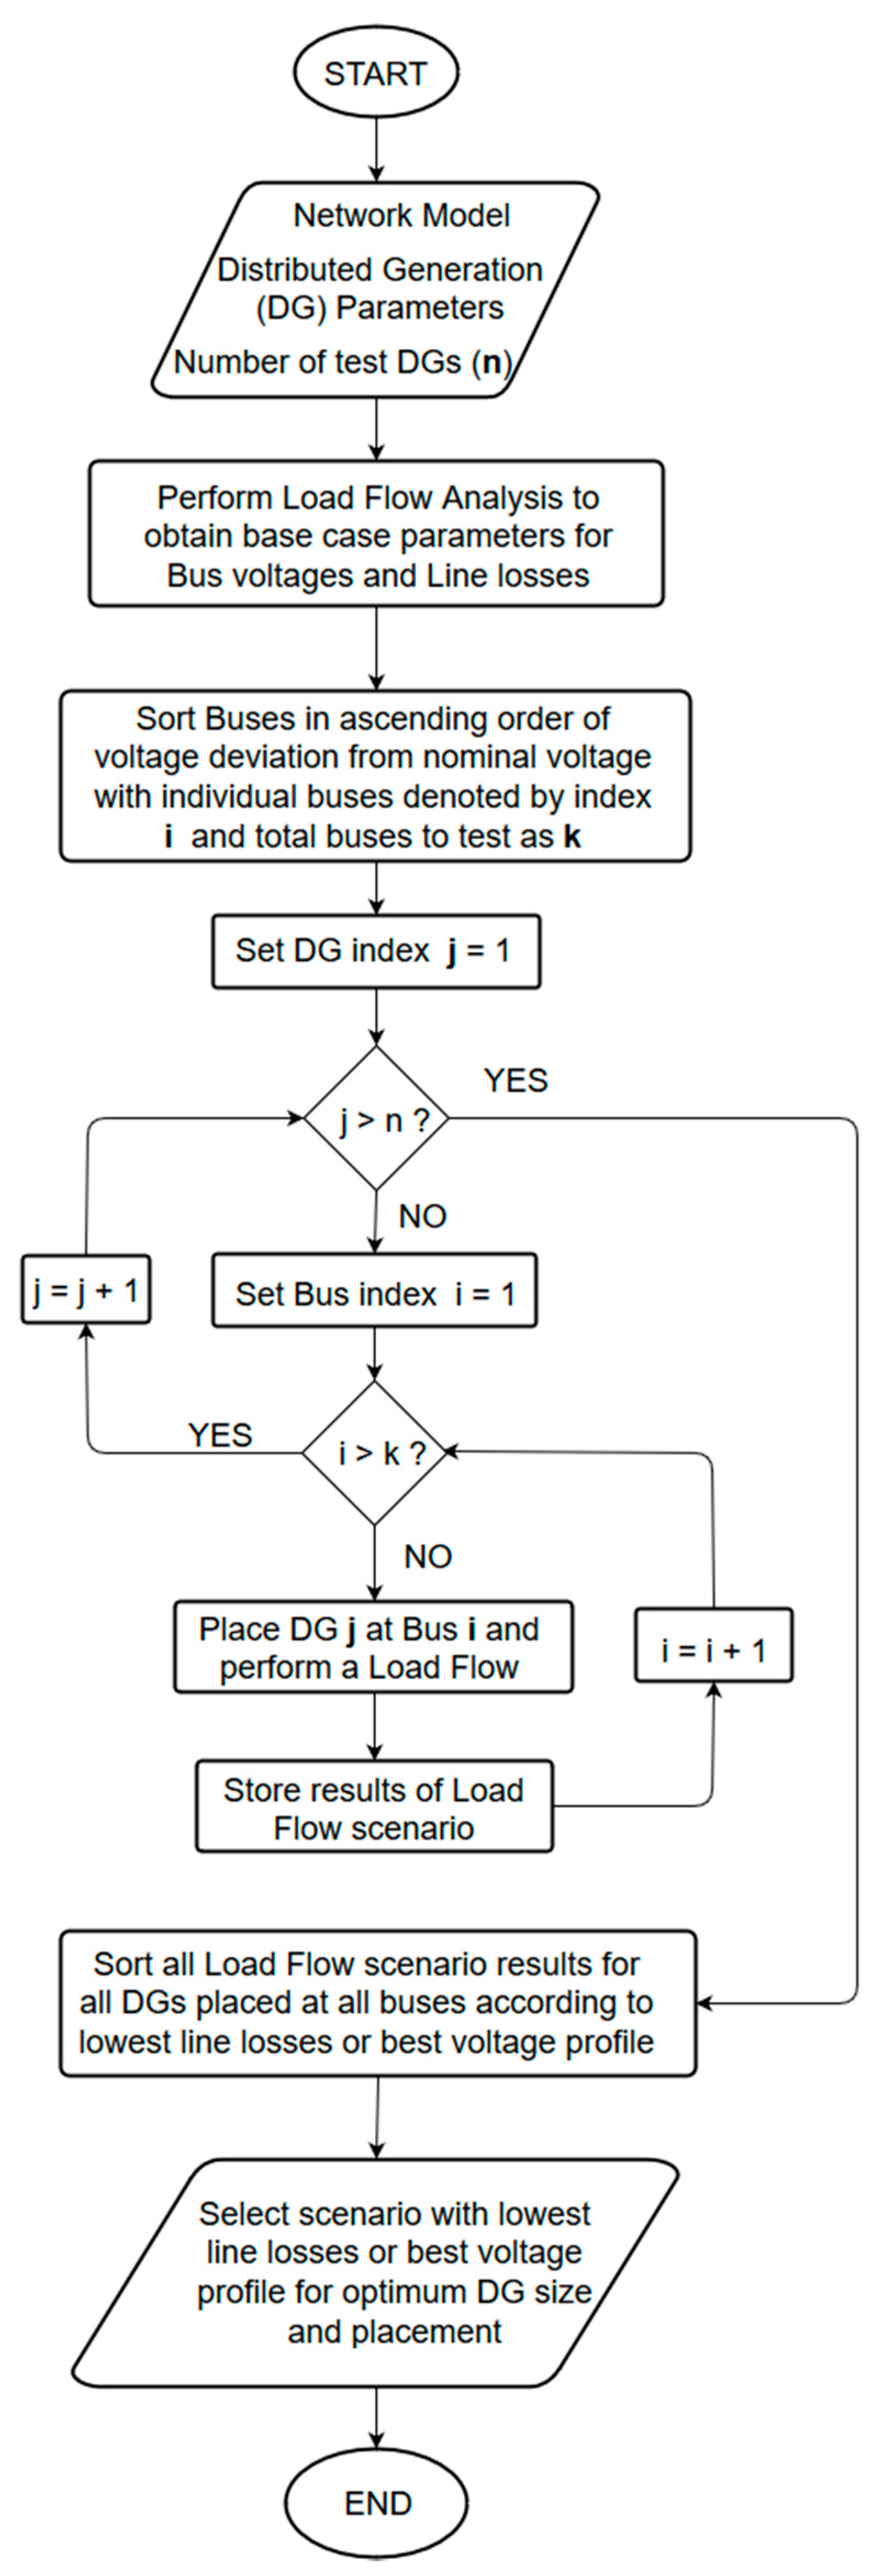
A decision-making algorithm for the optimum size and placement of a DG unit in distribution networks has been developed. The algorithm that is relatively simple, flexible to changes and modifications can estimate the optimum DG size, and can define the optimal location for a DG unit (of any type) to be installed, based on the improvement of voltage profiles and the reduction of the network’s total real and reactive power losses. The algorithm has been implemented in MATLAB and the load flow analysis is performed with the use of NEPLAN 360, one of the most reliable power systems software [19].
The flow chart of the developed decision-making algorithm is presented in Figure 1, and has the following structure:
- Step 1:
- Define Network Model, Distributed Generation (DG) parameters, and number of test DGs.
- Step 2:
- Perform Load Flow analysis to obtain steady-state base case parameters for Bus voltages and Line losses.
- Step 3:
- Sort Buses in ascending order of voltage deviation from nominal voltage for DG placement in the same order.
- Step 4:
- For each test DG, connect DG at given Bus, perform Load flow analysis and store the results as a scenario.
- Step 5:
- Repeat Step 4 for every Bus in ordered list.
- Step 6:
- Sort all Load flow scenario results for all DGs placed at all buses according to lowest line losses or best voltage profile.
- Step 7:
- Select a scenario with lowest line losses or best voltage profile for optimum DG size and placement.
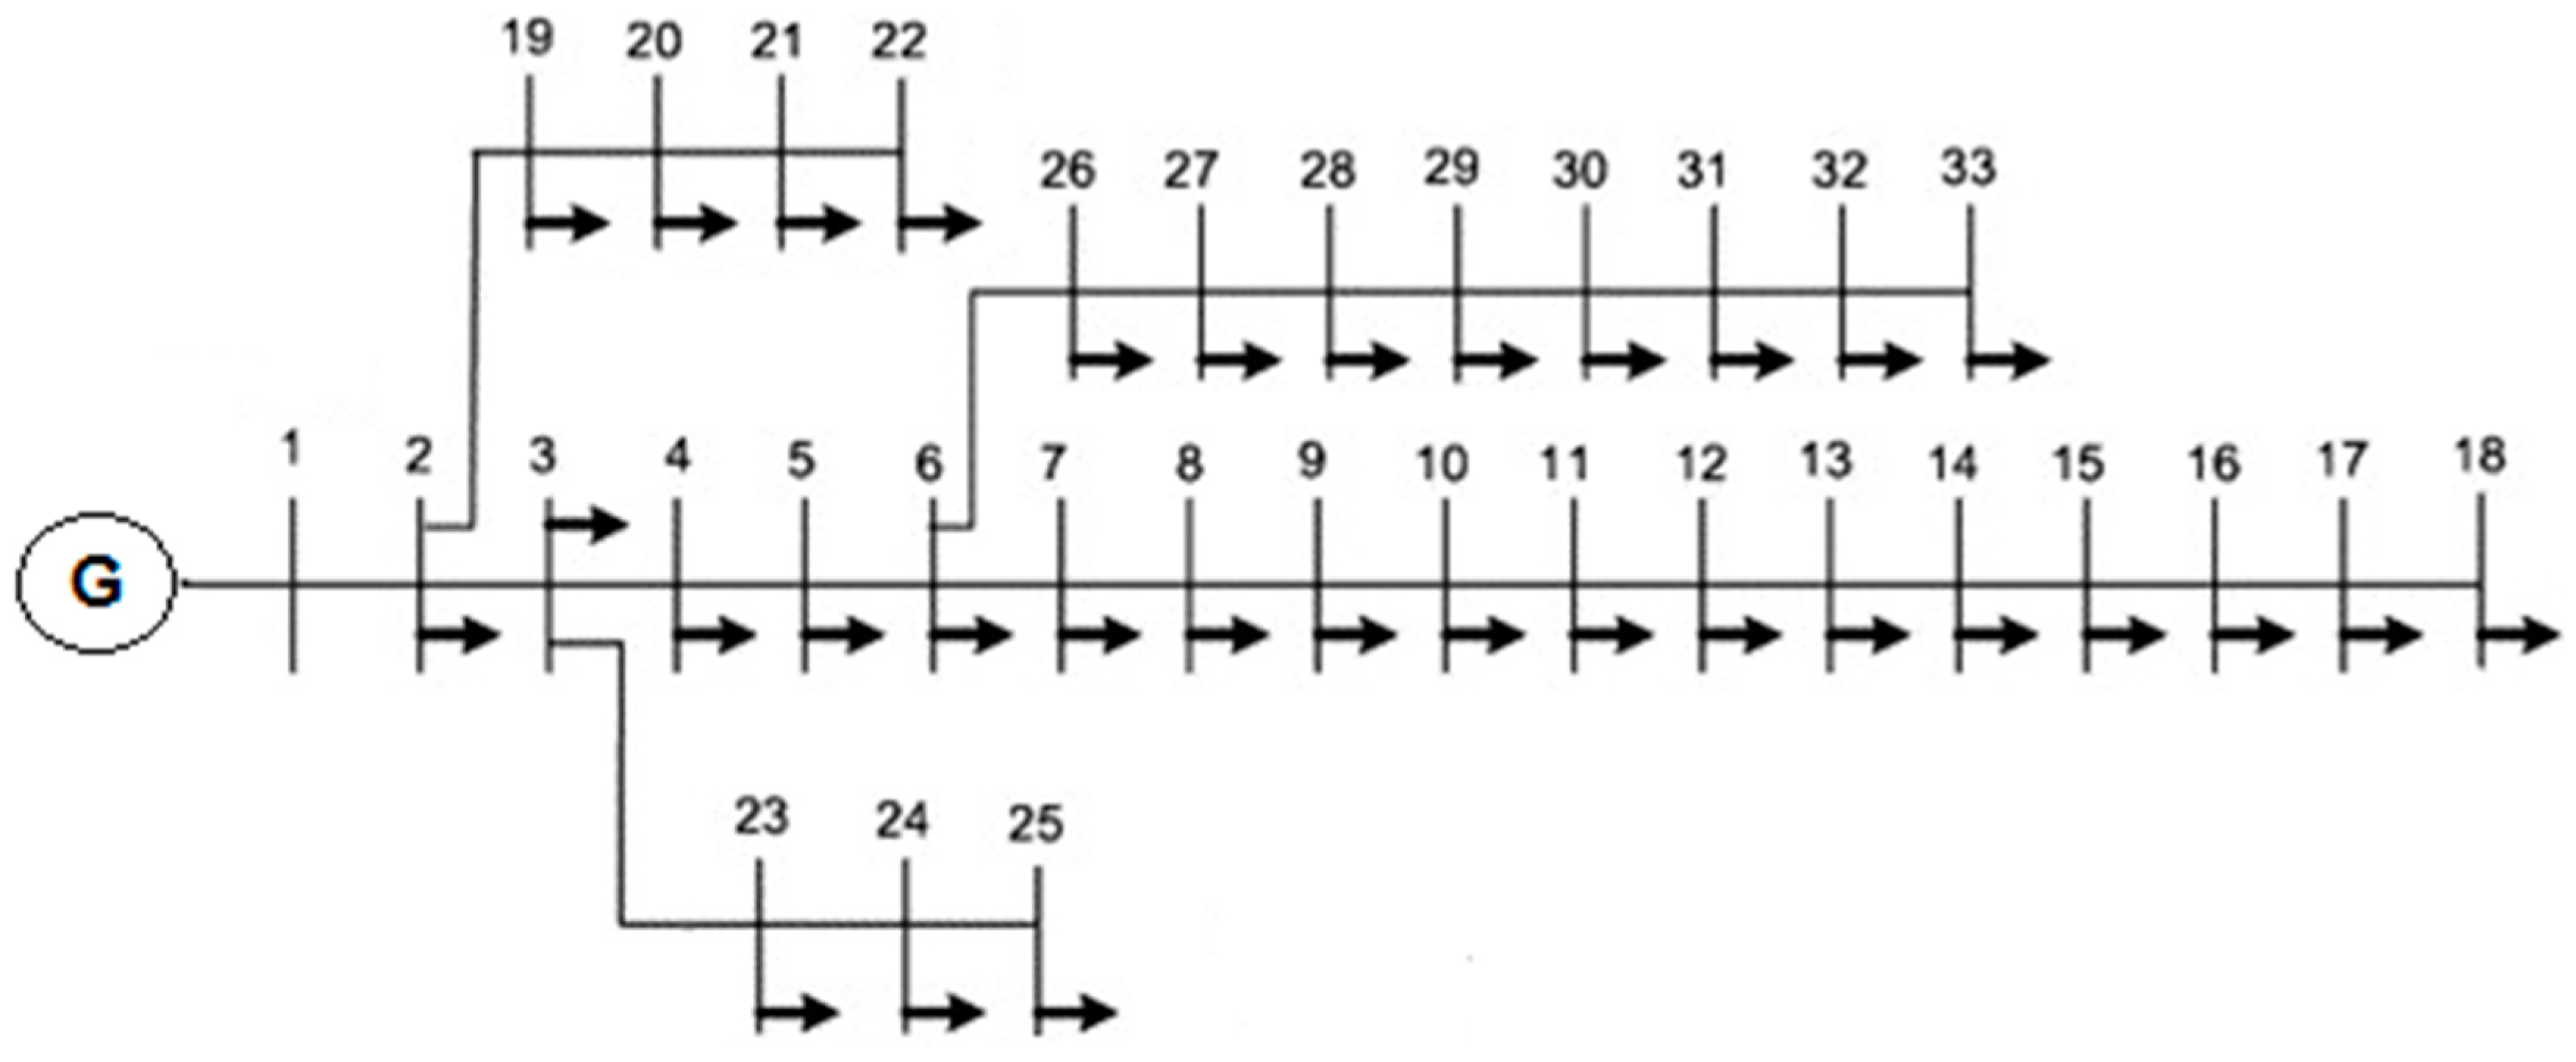
4. IEEE 33-Bus Radial Distribution System
The IEEE 33-bus radial distribution system is shown in Figure 2. It consists of thirty-three buses and thirty-two lines (branches). All of the buses have a voltage level of 12.66 kV. The maximum and minimum voltage limits for all buses are considered at ±5%. The network is fed by a synchronous generator, while it is loaded from 3.715 MW and 2.3 MVar connected to thirty-two buses of different power factors. Table 1 and Table 2 present the line data and load data of the examined system.
5. Results and Comparison
5.1. Produced Results
The IEEE 33-bus radial distribution system was modelled with the help of NEPLAN 360 software. Two different types of DGs (photovoltaic (PV) and wind generator) have been coupled with the examined distribution system in order to test the proposed decision-making algorithm. Four different sizes of PVs and three different sizes of wind generators, of typical type and commonly used in the distribution networks, have been selected for the above testing. Table 3 presents the sizes of the seven DG units that have been exploited in the simulations [21].
It must be mentioned that in all of the simulations the loads of all buses were kept constant with values equal with those presented in Table 2.
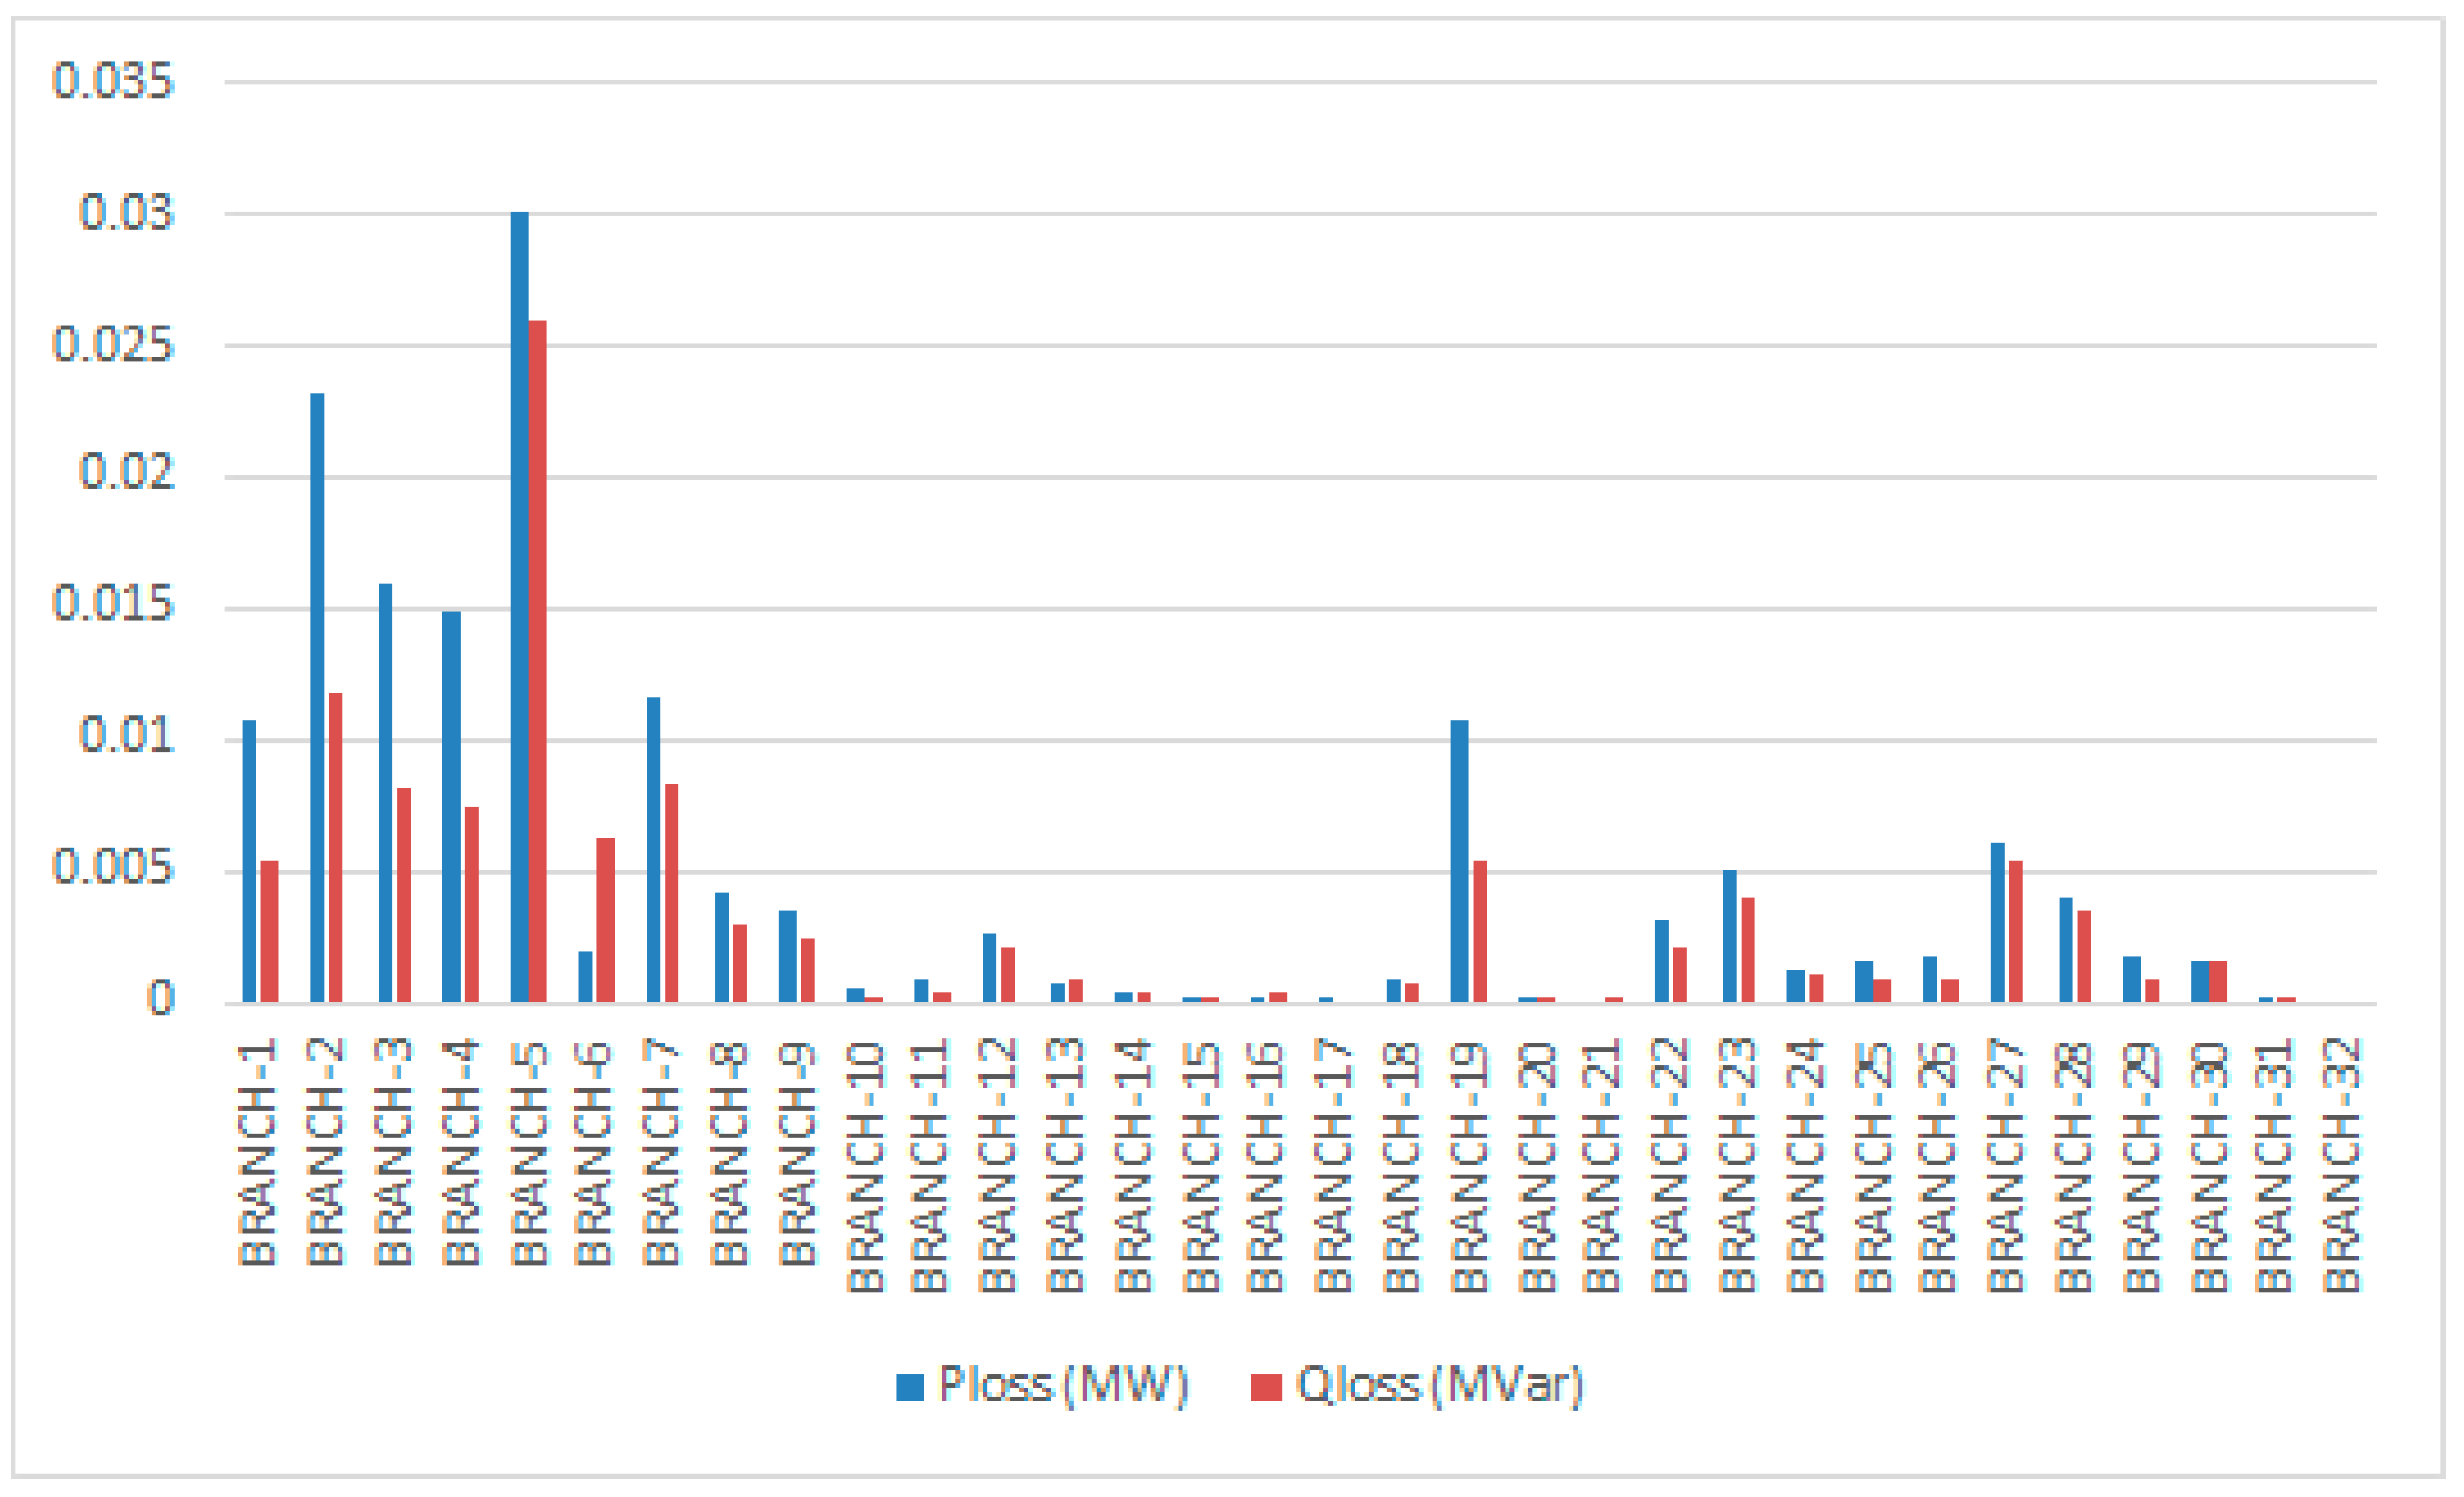
A load flow analysis using the extended Newton-Raphson method is performed to the examined distribution system without connecting any DG to the network (base case load flow). For each bus, the voltage profile is calculated. The base case voltage profiles and the nominal values in each bus are presented in Figure 3, while in Figure 4 are presented the base case power losses in each branch of the system.
Buses are sorted in ascending order considering the voltage deviation from the nominal voltage. Seventeen buses have violated the lower limit of 95%. Each one of the seven DG units has been connected to the seventeen buses and load flow analyses are conducted calculating the network’s voltage profiles and power losses (real and reactive). In total, one hundred and nineteen load flow analyses have been conducted.
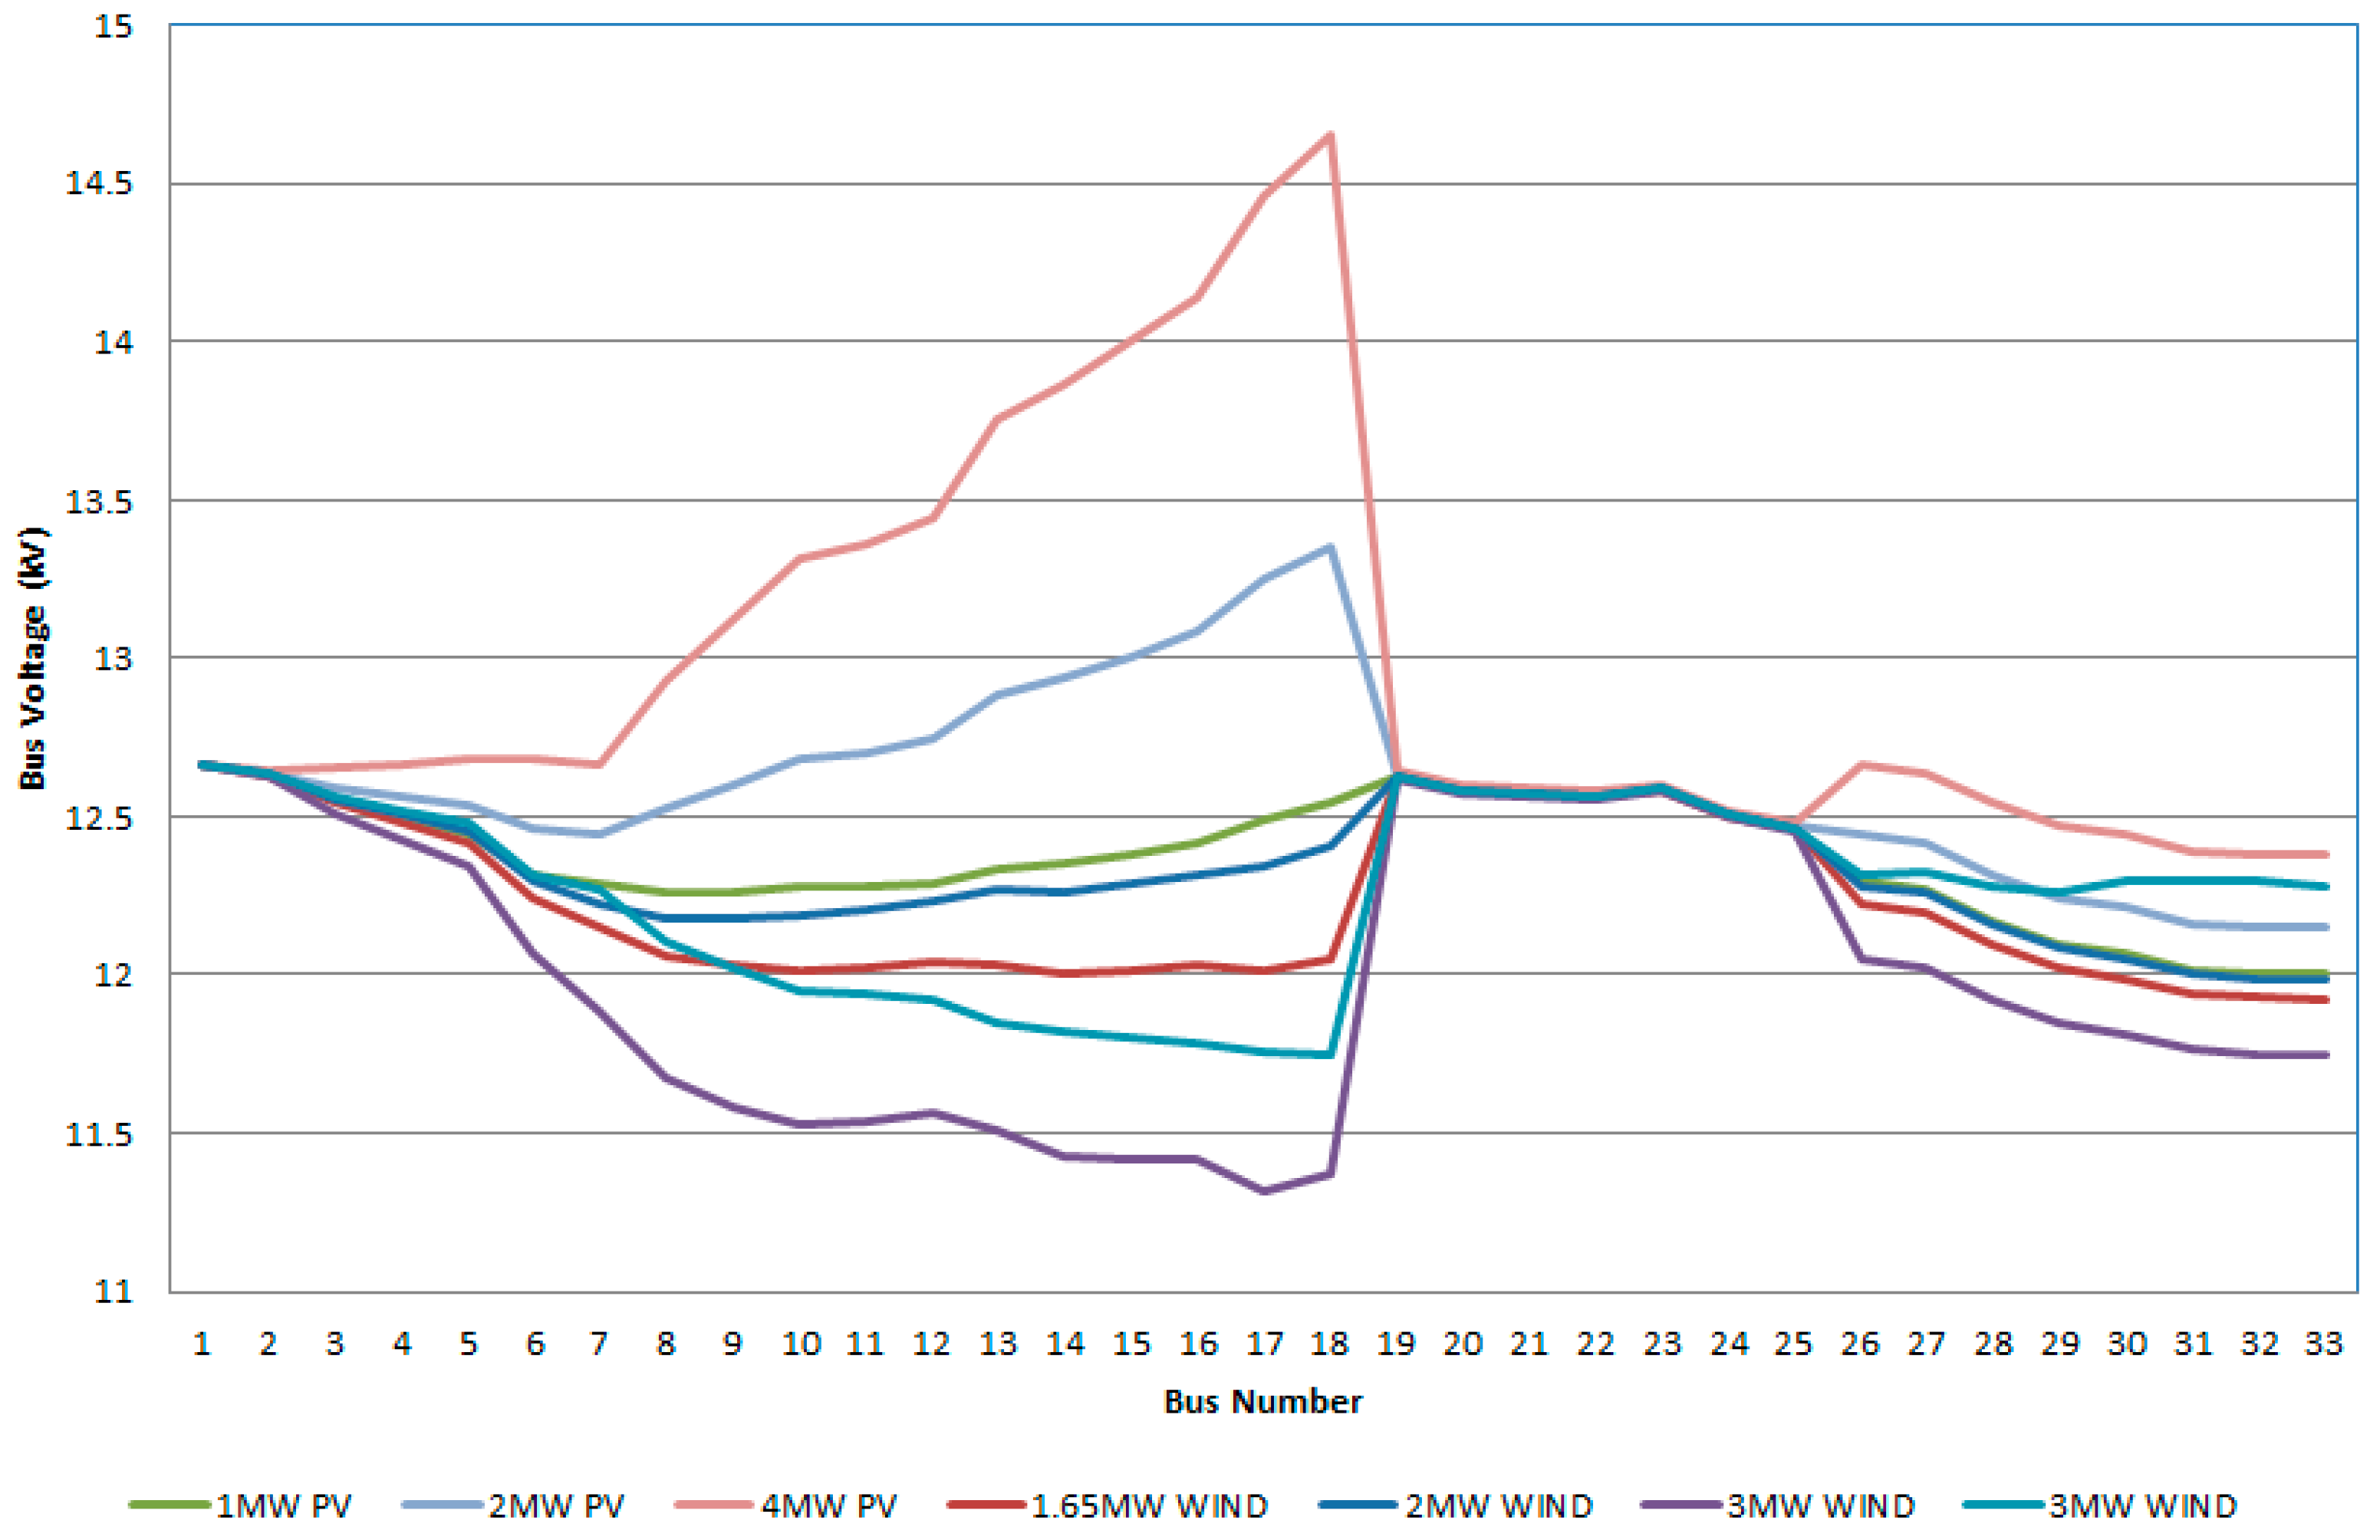
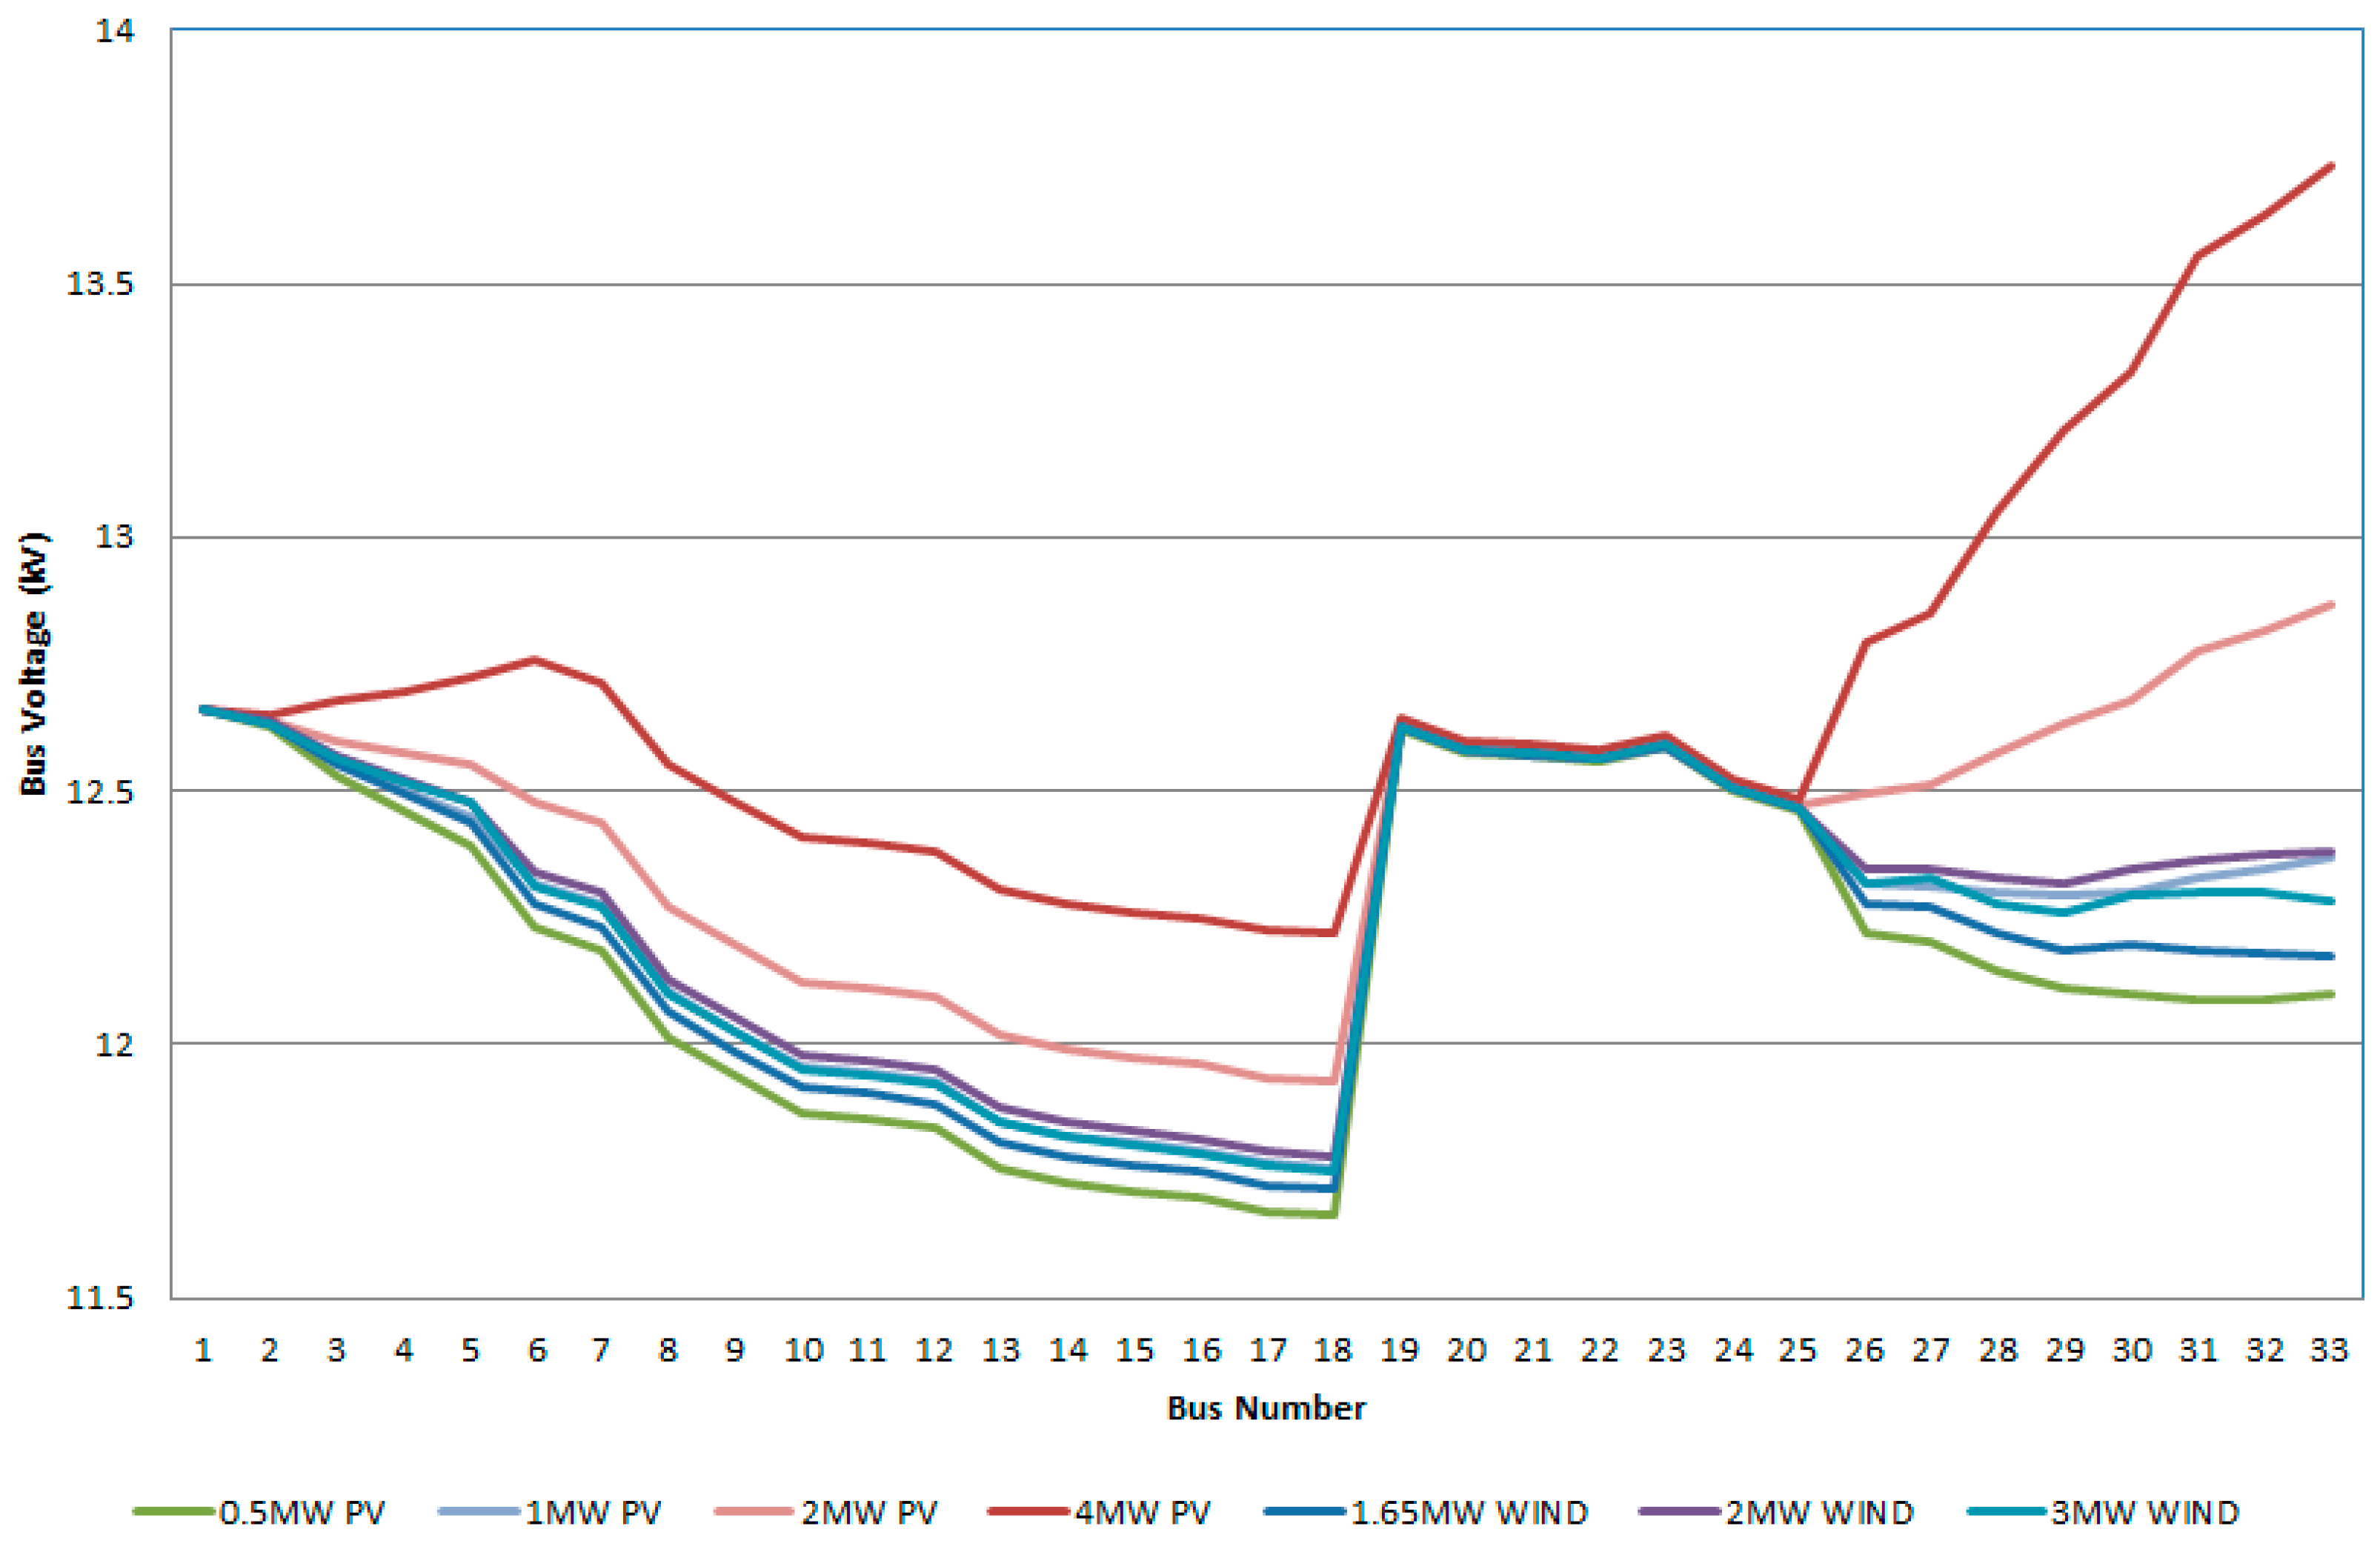
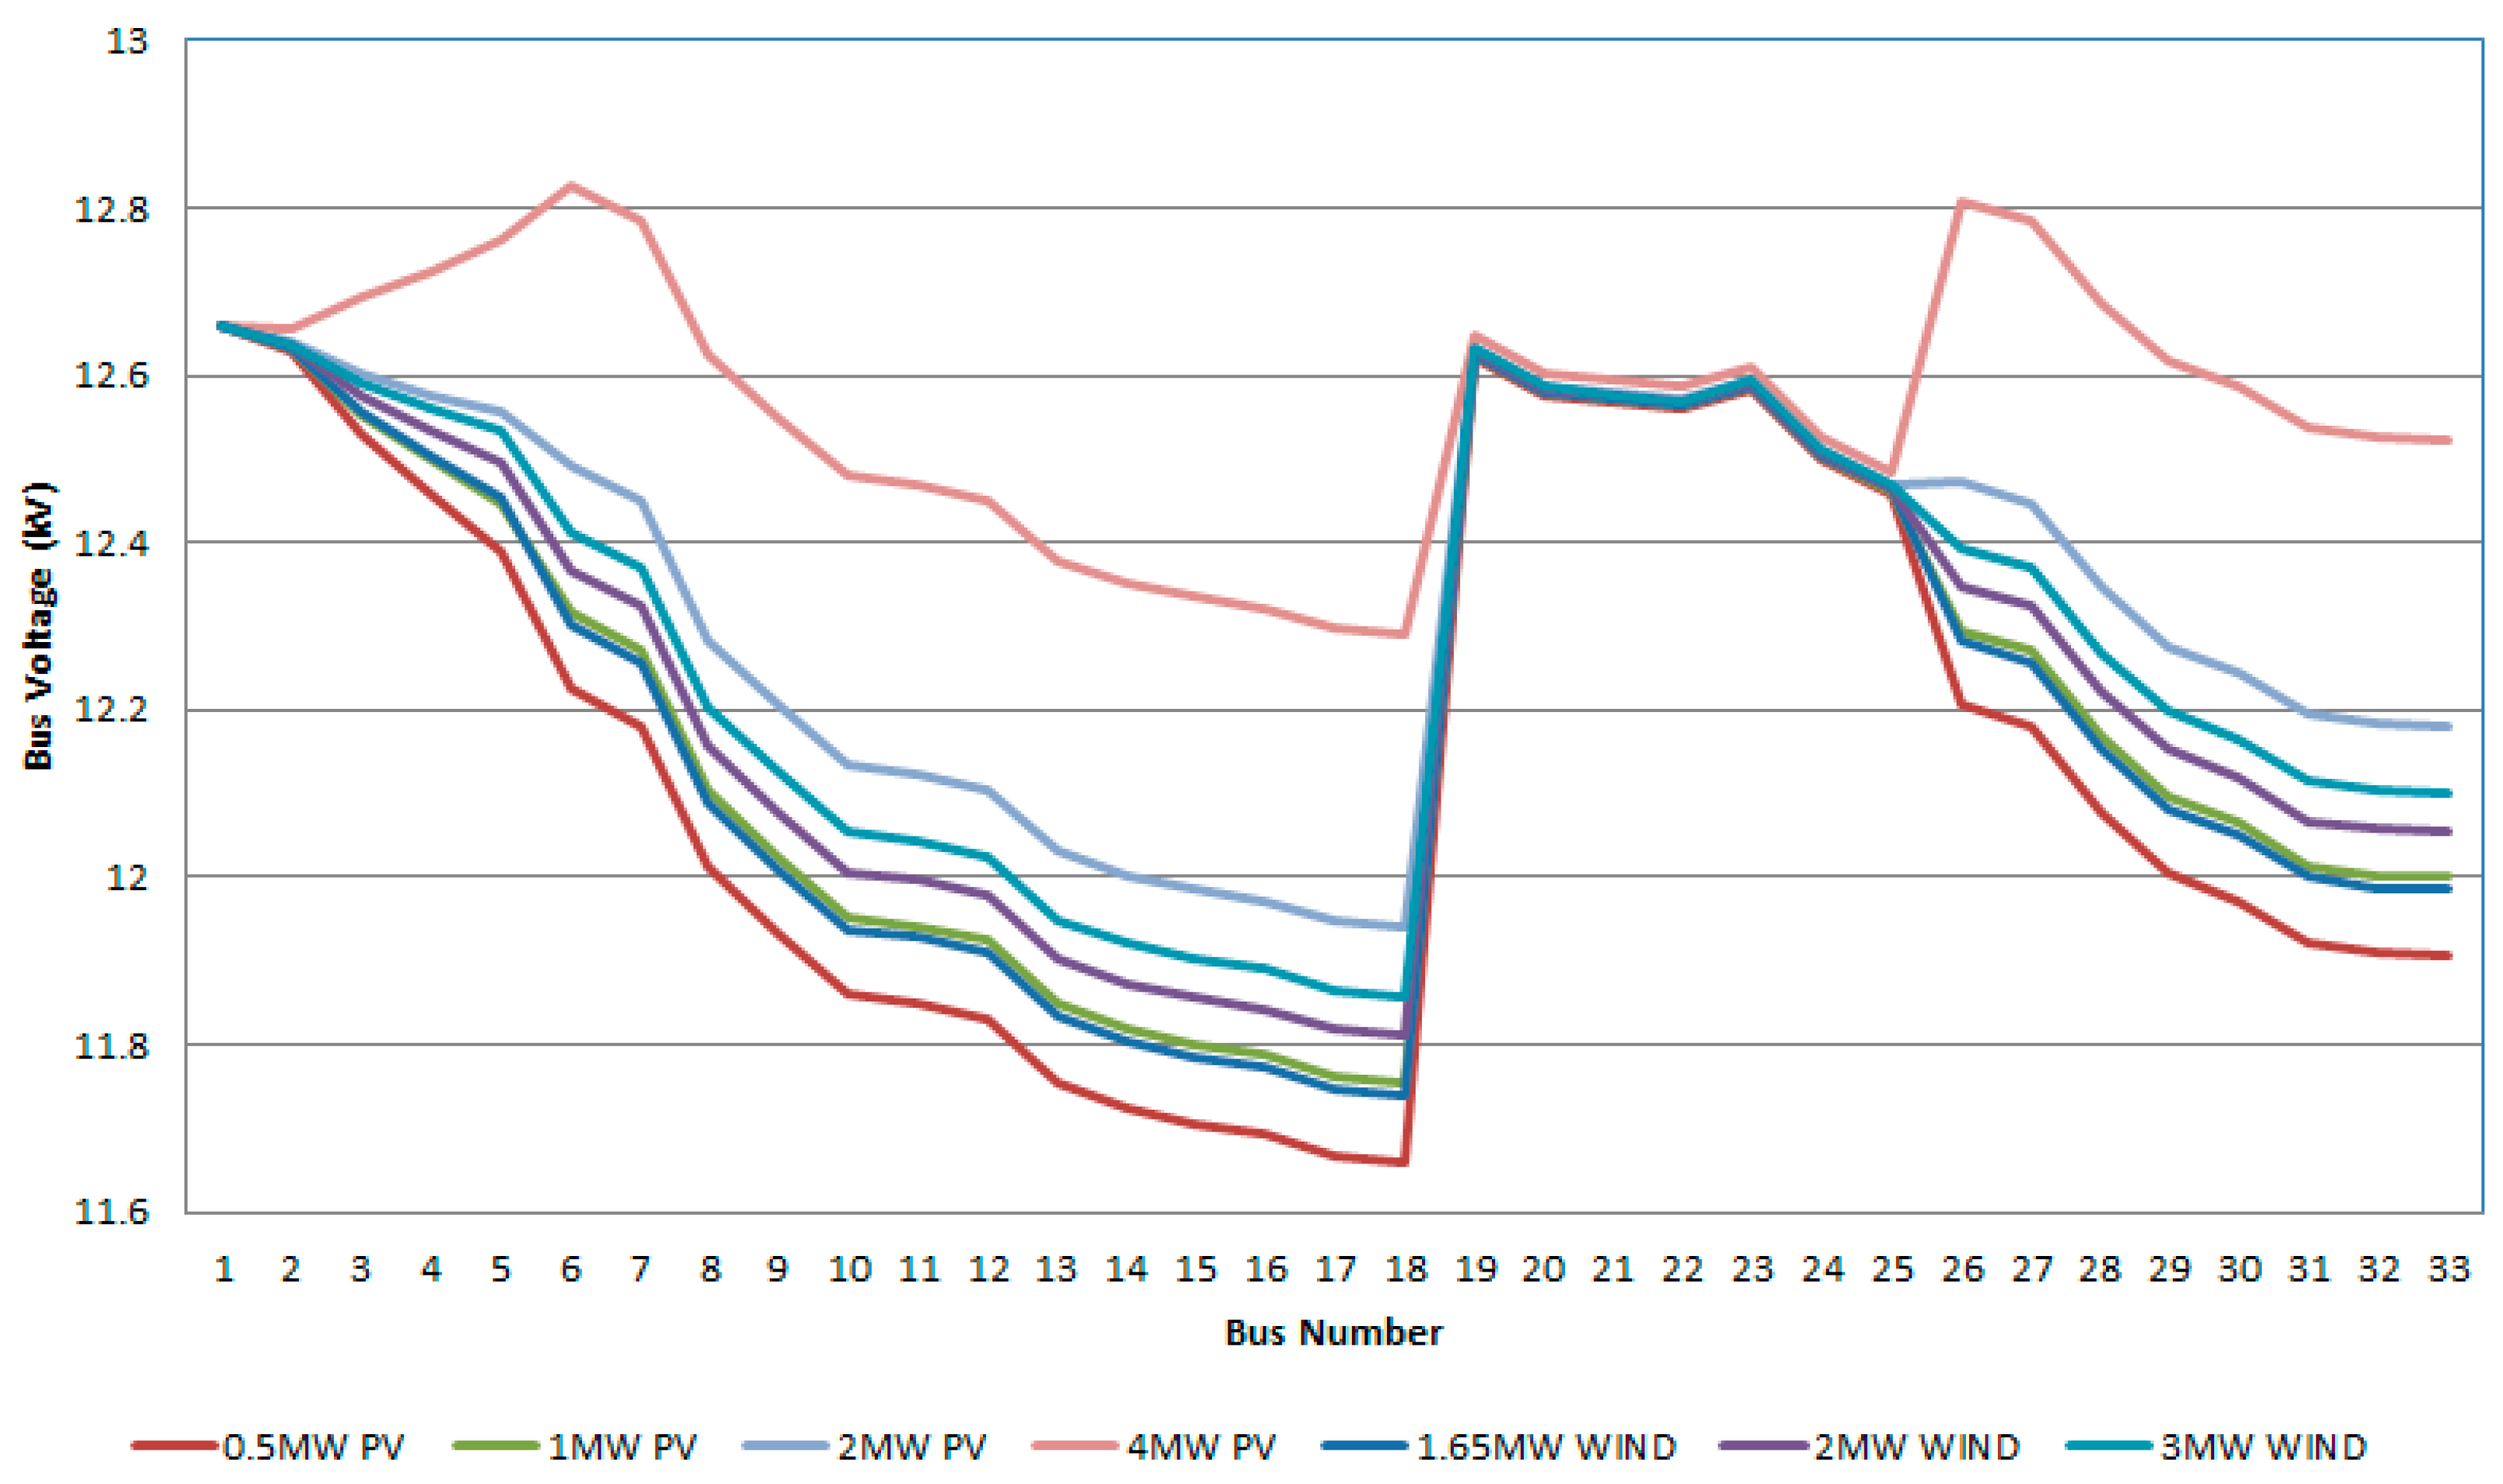
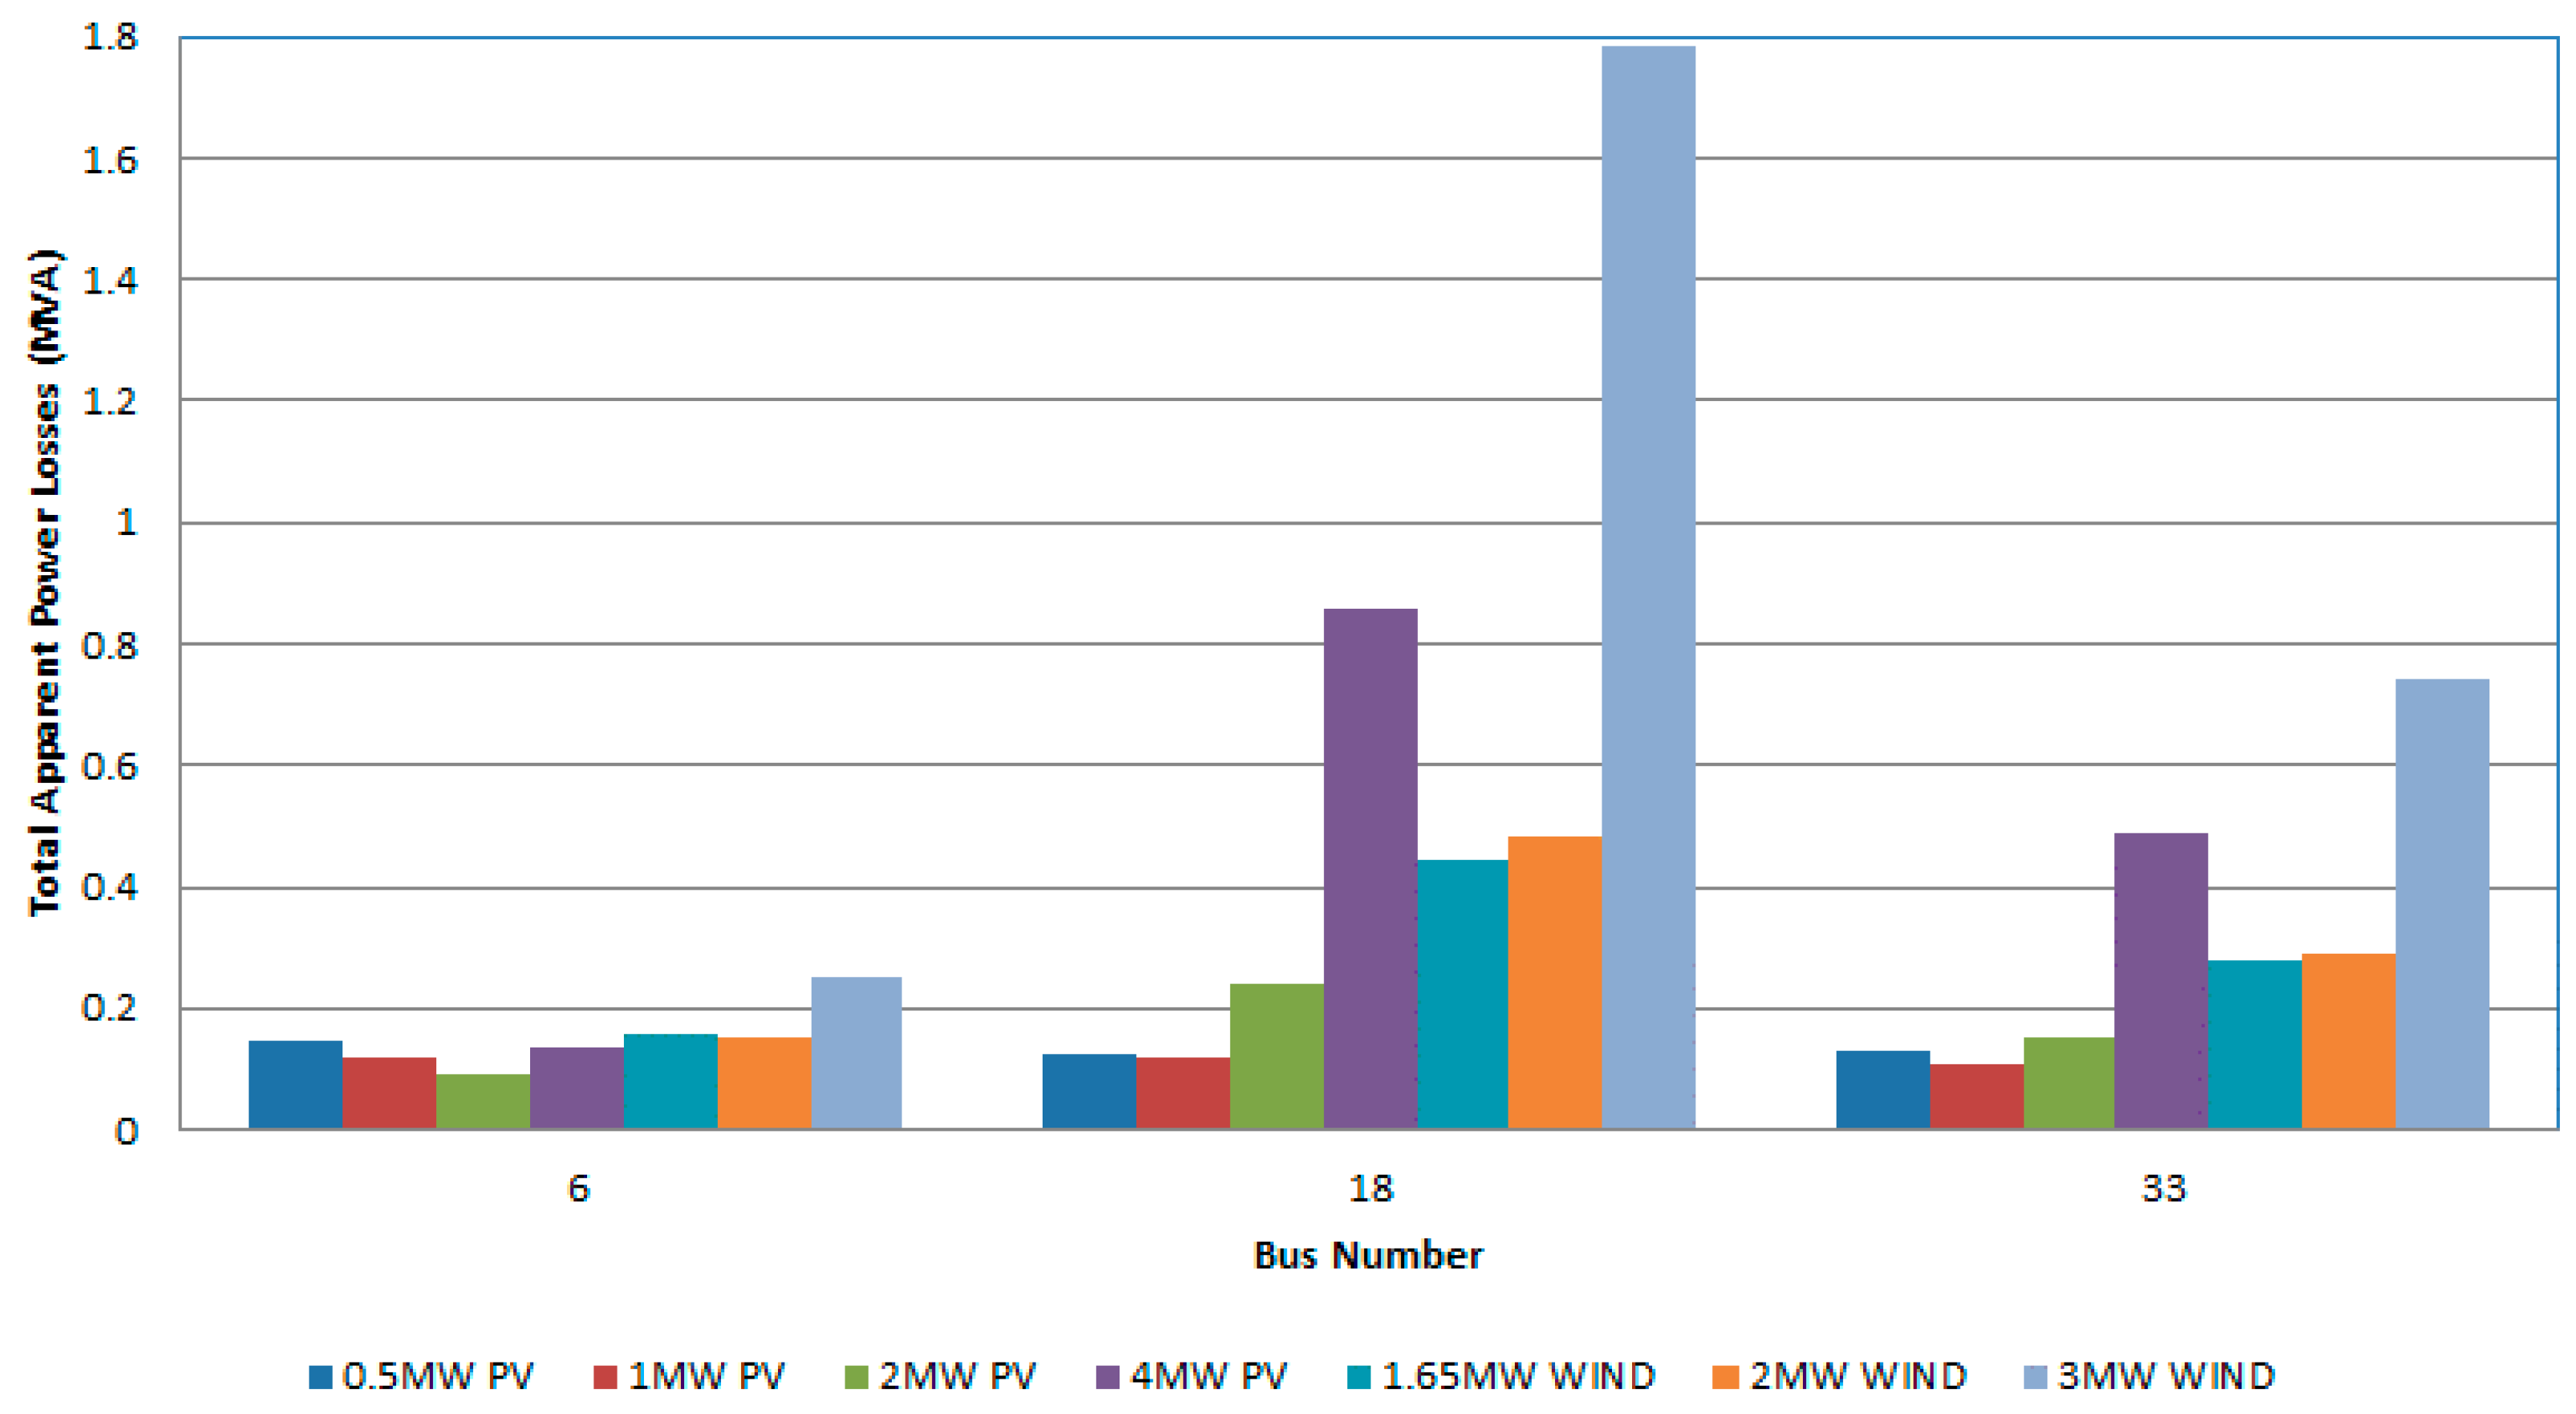
Representative results are presented for three selected buses in Figure 5, Figure 6, Figure 7 and Figure 8. The three selected buses are bus 18, which presents the lowest base case voltage profile within the network, bus 33 that presents the lowest base case voltage profile in the second longest branch of the network, and bus 6 for its “nodal”/strategically point within the network. Figure 5, Figure 6 and Figure 7 present the voltage profiles of network buses when each one of the seven DG units has been connected at buses 18, 33, and 6, respectively, while Figure 8 presents the total network apparent power losses when each one of the seven DG units has been connected at buses 18, 33, and 6, respectively.
5.2. Comparison of Results
Table 4 presents the produced results as well as the results of other methodologies that have been also applied and tested on the IEEE 33-bus radial distribution system and have been presented in [9,10,11]. The decision-making algorithm results are comparable to these produced by the other methodologies, something which clearly implies that the proposed decision-making algorithm is well working and has an acceptable accuracy.
6. Discussion
The produced results show that both DG types (PV that injects real power to the network and a wind generator that injects real power to the network but consumes reactive power) have a significant impact to the voltage profiles of the buses. In all of the examined cases the DG PV units have increased the voltage levels, with this increase to be proportional to the DG PV unit capacity. On the other hand, the DG wind generator units had presented a totally different impact on the voltage profiles of the distribution network. The improvement that has been achieved in the voltage profiles was not proportional to the DG wind generator unit capacity. Moreover, something that concerns both types of DG units (PV and wind generator) and has been observed throughout the simulations is that the connection position of DG unit is of paramount importance, not only to the bus that the DG is connected and to its neighboring buses, but also for the whole network since it can result in a totally different performance.
As far, concerning the total network power losses, the results have shown that the size of the connected DG, independently from the DG type, plays an important role since it has been observed that the bigger the size of the DG the bigger the impact on the total network power losses of the system. Furthermore, the position that is installed the DG unit (of any type) is of paramount importance, since its influence on the total power losses of the network (both real and reactive) is totally different. Moreover, it has been observed that the impact to the total power losses is proportional to the size of the DG unit.
The proposed decision-making algorithm results, produced for the IEEE 33-bus radial distribution system, have been compared with results obtained from previous methodologies for the same distribution system. The comparison has shown that the proposed algorithm is efficient and can provide good solutions for the optimum size and placement of DG units in distribution networks.
It should also be mentioned that parameters not been taken into account in the current work are the annual load variability and economic issues associated with the DG unit installation. Loads of a distribution network present considerable variations during days, weeks, and months resulting in substantial variations in network’s power losses and voltage profiles. The initial installation cost per kW of DG is generally higher than the one of large centralized plants, and moreover, the cost of different types of DGs varies. On the other hand the majority of the DGs are pollution free, have reduced running costs but even so significant differences among the different DG types should be taken into account when discussing their advantages. In an effort to promote and encourage the installation of DG units in the distribution networks, several European and national support mechanisms have been introduced. Among them, the most popular is the feed-in tariff, where the DG owners are compensated at a price that allows them to recover the cost of their investment in a relatively short period of time. As a future work, the before mentioned parameters will be studied and taken into account targeting the further development of the proposed algorithm and will also be applied to a study of an existent distribution network.
7. Conclusions
In this paper, a decision-making algorithm has been developed for the optimum size and placement of DG units in distribution networks. The proposed algorithm has been tested on the IEEE 33-bus radial distribution system and the obtained results have been compared with those of earlier studies, proving that the decision-making algorithm is well working and has an acceptable accuracy. The algorithm can assist engineers, electric utilities, and distribution network operators in the more efficient integration of new DG units in the current distribution networks. Future work will be the improvement of the proposed algorithm taking into consideration both the DG installation cost and the variability of the loads during the year, as well as the application of the algorithm in a real distribution network.
Conflicts of Interest
The author declare no conflict of interest.
References
- Reddy, S.C.; Prasad, P.V.N.; Laxmi, A.J. Power quality and reliability improvement of distribution system by optimal number, location and size of DGs using particle swarm optimization. In Proceedings of the 7th IEEE International Conference on Industrial and Information Systems (ICIIS), Chennai, India, 6–9 August 2012. [Google Scholar]
- Vita, V.; Alimardan, T.; Ekonomou, L. The impact of distributed generation in the distribution networks’ voltage profile and energy losses. In Proceedings of the 9th IEEE European Modelling Symposium on Mathematical Modelling and Computer Simulation, Madrid, Spain, 6–8 October 2015; pp. 260–265. [Google Scholar]
- Jamian, J.J.; Mustafa, M.W.; Mokhlis, H.; Abdullah, M.N. Comparative study on distributed generator sizing using three types of particle swarm optimization. In Proceedings of the 2012 Third International Conference on Intelligent Systems Modelling and Simulation (ISMS), Kota Kinabalu, Malaysia, 8–10 February 2012; pp. 131–136. [Google Scholar]
- Devabalaji, K.R.; Ravi, K. Optimal size and siting of multiple DG and DSTATCOM in radial distribution system using bacterial foraging optimization algorithm. Ain Shams Eng. J. 2016, 7, 959–971. [Google Scholar] [CrossRef]
- Ramamoorthy, A.; Ramachandran, R. Optimal siting and sizing of multiple DG units for the enhancement of voltage profile and loss minimization in transmission systems using nature inspired algorithms. Sci. World J. 2016. [Google Scholar] [CrossRef] [PubMed]
- Kotb, M.F.; Shebl, K.M.; El Khazendar, M.; El Husseiny, A. Genetic algorithm for optimum siting and sizing of distributed generation. In Proceedings of the 14th International Middle East Power Systems Conference, Cairo, Egypt, 19–21 December 2010; pp. 433–440. [Google Scholar]
- Moradi, M.; Abedini, M. A combination of genetic algorithm and particle swarm optimization for optimal DG location and sizing in distribution systems. Electr. Power Energy Syst. 2011, 34, 66–74. [Google Scholar] [CrossRef]
- Yadav, P.S.; Srivastava, L. Optimal location of combined DG and capacitor for real power loss minimization in distribution networks. Int. J. Electr. Electron. Eng. 2015, 7, 222–233. [Google Scholar]
- Parizad, A.; Khazali, A.; Kalantar, M. Optimal placement of distributed generation with sensitivity factors considering voltage stability and losses indices. In Proceedings of the 18th Iranian Conference on Electrical Engineering (ICEE), Isfahan, Iran, 11–13 May 2010; pp. 848–855. [Google Scholar]
- Injeti, S.K.; Kumar, N.P. Optimal planning of distributed generation for improved voltage stability and loss reduction. Int. J. Comput. Appl. 2011, 15, 40–46. [Google Scholar]
- Mahat, P.; Ongsakul, W.; Mithulananthan, N. Optimal placement of wind turbine DG in primary distribution systems for real loss reduction. In Proceedings of the Energy for Sustainable Development: Prospects and Issues for Asia, Phuket, Thailand, 1–3 March 2006; pp. 1–6. [Google Scholar]
- Shaaban, M.; Petinrin, J.O. Sizing and sitting of distributed generation in distribution systems for voltage improvement and loss reduction. Int. Smart Grid Clean Energy 2013, 2, 350–356. [Google Scholar] [CrossRef]
- Di Silvestre, M.L.; La Cascia, D.; Riva Sanseverino, E.; Zizzo, G. Improving the energy efficiency of an islanded distribution network using classical and innovative computation methods. Utilities Policy 2016, 40, 58–66. [Google Scholar] [CrossRef]
- Safigianni, A.S.; Koutroumpezis, G.N.; Poulios, V.C. Mixed distributed generation technologies in a medium voltage network. Electr. Power Syst. Res. 2013, 96, 75–80. [Google Scholar] [CrossRef]
- Balamurugan, K.; Srinivasana, D.; Reindlb, T. Impact of distributed generation on power distribution systems. Energy Procedia 2012, 25, 93–100. [Google Scholar] [CrossRef]
- Nieto, A.; Vita, V.; Maris, T.I. Power quality improvement in power grids with the integration of energy storage systems. Int. J. Eng. Res. Technol. 2016, 5, 438–443. [Google Scholar]
- Ceaki, O.; Seritan, G.; Vatu, R.; Mancasi, M. Analysis of power quality improvement in smart grids. In Proceedings of the 10th International Symposium on Advanced Topics in Electrical Engineering (ATEE), Bucharest, Romania, 23–25 March 2017; pp. 797–801. [Google Scholar]
- Hung, D.Q.; Mithulananthan, N. Multiple distributed generators placement in primary distribution networks for loss reduction. IEEE Trans. Ind. Electron. 2013, 60, 1700–1708. [Google Scholar] [CrossRef]
- NEPLAN AG. Available online: http://www.neplan.ch/ (accessed on 14 June 2017).
- University of Washington, Power Systems Test Case Archive. Available online: https://www.ee.washington.edu/research/pstca/ (accessed on 12 June 2017).
- Vestas Wind Systems A/S, General Specification, V82-165MW, V100-2MW, V90-3MW. Available online: www.vestas.com (accessed on 26 May 2017).
Figure 1.
The flow chart of the proposed decision-making algorithm.

Figure 2.
Single line diagram of the IEEE 33-bus radial distribution system [20].
Figure 2.
Single line diagram of the IEEE 33-bus radial distribution system [20].

Figure 3.
Base case voltage profiles of the IEEE 33-bus radial distribution system with no DG.

Figure 4.
Base case power losses of the IEEE 33-bus radial distribution system with no DG.

Figure 5.
Voltage profiles of network buses when different DG unit sizes have been connected at bus 18.
Figure 5.
Voltage profiles of network buses when different DG unit sizes have been connected at bus 18.

Figure 6.
Voltage profiles of network buses when different DG unit sizes have been connected at bus 33.
Figure 6.
Voltage profiles of network buses when different DG unit sizes have been connected at bus 33.

Figure 7.
Voltage profiles of network buses when different DG unit sizes have been connected at bus 6.
Figure 7.
Voltage profiles of network buses when different DG unit sizes have been connected at bus 6.

Figure 8.
Total network apparent power losses when different DG unit sizes have been connected at bus 6, 18 and 33 respectively.
Figure 8.
Total network apparent power losses when different DG unit sizes have been connected at bus 6, 18 and 33 respectively.


Table 1.
Line data of the IEEE 33-bus radial distribution system [20].
Table 1.
Line data of the IEEE 33-bus radial distribution system [20].
| Line Name | From Bus | To Bus | Length (km) | Line Impedance | |
|---|---|---|---|---|---|
| Resistance (Ohm/km) | Reactance (Ohm/km) | ||||
| BRANCH-1 | 1 | 2 | 1 | 0.0922 | 0.0470 |
| BRANCH-2 | 2 | 3 | 1 | 0.4930 | 0.2511 |
| BRANCH-3 | 3 | 4 | 1 | 0.3660 | 0.1864 |
| BRANCH-4 | 4 | 5 | 1 | 0.3811 | 0.1941 |
| BRANCH-5 | 5 | 6 | 1 | 0.8190 | 0.7070 |
| BRANCH-6 | 6 | 7 | 1 | 0.1872 | 0.6188 |
| BRANCH-7 | 7 | 8 | 1 | 1.7114 | 1.2351 |
| BRANCH-8 | 8 | 9 | 1 | 1.0300 | 0.7400 |
| BRANCH-9 | 9 | 10 | 1 | 1.0440 | 0.7400 |
| BRANCH-10 | 10 | 11 | 1 | 0.1966 | 0.0650 |
| BRANCH-11 | 11 | 12 | 1 | 0.3744 | 0.1238 |
| BRANCH-12 | 12 | 13 | 1 | 1.4680 | 1.1550 |
| BRANCH-13 | 13 | 14 | 1 | 0.5416 | 0.7129 |
| BRANCH-14 | 14 | 15 | 1 | 0.5910 | 0.5260 |
| BRANCH-15 | 15 | 16 | 1 | 0.7463 | 0.5450 |
| BRANCH-16 | 16 | 17 | 1 | 1.2890 | 1.7210 |
| BRANCH-17 | 17 | 18 | 1 | 0.7320 | 0.5740 |
| BRANCH-18 | 2 | 19 | 1 | 0.1640 | 0.1565 |
| BRANCH-19 | 19 | 20 | 1 | 1.5042 | 1.3554 |
| BRANCH-20 | 20 | 21 | 1 | 0.4095 | 0.4784 |
| BRANCH-21 | 21 | 22 | 1 | 0.7089 | 0.9373 |
| BRANCH-22 | 3 | 23 | 1 | 0.4512 | 0.3083 |
| BRANCH-23 | 23 | 24 | 1 | 0.8980 | 0.7091 |
| BRANCH-24 | 24 | 25 | 1 | 0.8960 | 0.7011 |
| BRANCH-25 | 6 | 26 | 1 | 0.2030 | 0.1034 |
| BRANCH-26 | 26 | 27 | 1 | 0.2842 | 0.1447 |
| BRANCH-27 | 27 | 28 | 1 | 1.0590 | 0.9337 |
| BRANCH-28 | 28 | 29 | 1 | 0.8042 | 0.7006 |
| BRANCH-29 | 29 | 30 | 1 | 0.5075 | 0.2585 |
| BRANCH-30 | 30 | 31 | 1 | 0.9744 | 0.9630 |
| BRANCH-31 | 31 | 32 | 1 | 0.3105 | 0.3619 |
| BRANCH-32 | 32 | 33 | 1 | 0.3410 | 0.5302 |
Table 2.
Load data of the IEEE 33-bus radial distribution system [20].
Table 2.
Load data of the IEEE 33-bus radial distribution system [20].
| Load | Location (Bus Bar) | Real Load (kW) | Reactive Load (kVAR) |
|---|---|---|---|
| L2 | 2 | 100 | 60 |
| L3 | 3 | 90 | 40 |
| L4 | 4 | 120 | 80 |
| L5 | 5 | 60 | 30 |
| L6 | 6 | 60 | 20 |
| L7 | 7 | 200 | 100 |
| L8 | 8 | 200 | 100 |
| L9 | 9 | 60 | 20 |
| L10 | 10 | 60 | 20 |
| L11 | 11 | 45 | 30 |
| L12 | 12 | 60 | 35 |
| L13 | 13 | 60 | 35 |
| L14 | 14 | 120 | 80 |
| L15 | 15 | 60 | 10 |
| L16 | 16 | 60 | 20 |
| L17 | 17 | 60 | 20 |
| L18 | 18 | 90 | 40 |
| L19 | 19 | 90 | 40 |
| L20 | 20 | 90 | 40 |
| L21 | 21 | 90 | 40 |
| L22 | 22 | 90 | 40 |
| L23 | 23 | 90 | 50 |
| L24 | 24 | 420 | 200 |
| L25 | 25 | 420 | 200 |
| L26 | 26 | 60 | 25 |
| L27 | 27 | 60 | 25 |
| L28 | 28 | 60 | 20 |
| L29 | 29 | 120 | 70 |
| L30 | 30 | 200 | 600 |
| L31 | 31 | 150 | 70 |
| L32 | 32 | 210 | 100 |
| L33 | 33 | 60 | 40 |
| Total load | 3715 | 2300 | |
Table 3.
The sizes of the distributed generation (DG) units used in the simulations [21].
Table 3.
The sizes of the distributed generation (DG) units used in the simulations [21].
| DG Name | Injected Real Power (MV) | Consumed Reactive Power (MVar) |
|---|---|---|
| DG1-PV | 0.5 | - |
| DG2-PV | 1.0 | - |
| DG3-PV | 2.0 | - |
| DG4-PV | 4.0 | - |
| DG1-WG | 1.65 | 0.731 |
| DG2-WG | 2.0 | 0.582 |
| DG3-WG | 3.0 | 0.875 |
© 2017 by the author. Licensee MDPI, Basel, Switzerland. This article is an open access article distributed under the terms and conditions of the Creative Commons Attribution (CC BY) license (http://creativecommons.org/licenses/by/4.0/).
Share and Cite
MDPI and ACS Style
Vita, V. Development of a Decision-Making Algorithm for the Optimum Size and Placement of Distributed Generation Units in Distribution Networks. Energies 2017, 10, 1433. https://doi.org/10.3390/en10091433
AMA Style
Vita V. Development of a Decision-Making Algorithm for the Optimum Size and Placement of Distributed Generation Units in Distribution Networks. Energies. 2017; 10(9):1433. https://doi.org/10.3390/en10091433
Chicago/Turabian StyleVita, Vasiliki. 2017. "Development of a Decision-Making Algorithm for the Optimum Size and Placement of Distributed Generation Units in Distribution Networks" Energies 10, no. 9: 1433. https://doi.org/10.3390/en10091433
Note that from the first issue of 2016, this journal uses article numbers instead of page numbers. See further details here.