
The Economic Feasibility of Residential Energy Storage Combined with PV Panels: The Role of Subsidies in Italy


Department of Industrial and Information Engineering and Economics, University of L’Aquila, Via G. Gronchi 18, 67100 L’Aquila, Italy
*
Author to whom correspondence should be addressed.
Energies 2017, 10(9), 1434; https://doi.org/10.3390/en10091434
Submission received: 31 July 2017
/
Revised: 26 August 2017
/
Accepted: 13 September 2017
/
Published: 18 September 2017
(This article belongs to the Section D: Energy Storage and Application)
Abstract
:A solar photovoltaic system produces electricity by converting energy from the sun. By the end of 2016, the global installed solar photovoltaic capacity reached 305 GW. Its growth is impressive in the last years; in fact, it was only equal to 41 GW in 2010. However, Europe has installed only 6.9 GW in 2016 (−1.7 GW in comparison to previous year) and this annual power installed is equal to 9% of global one in according to data released by Solar Power Europe. The profitability of PV systems in mature markets depends on the harmonization between demanded energy and produced one residential energy storage when combined with photovoltaic panels is able to increase the share of self-consumption. This work proposes a mathematical model, in which a Discounted Cash Flow analysis is conducted to evaluate the financial feasibility of photovoltaic-integrated lead acid battery systems in Italy. The indicator used is Net Present Value. Furthermore, a break-even point analysis, in terms of an increase of self-consumption, is conducted. The residential sector is investigated and energy storage system investment is incentivized by fiscal deduction and regional subsidies. The analysis provides several case studies, determined by combinations of the following variables: photovoltaic plant size, battery capacity, the increase of the share of self-consumption, and the useful lifetime of energy storage system. The same case studies are proposed also in four alternative scenarios, where is the modified the structure of subsidies. Results confirm that the profitability can be reached in presence of subsidies.
1. Introduction
In the last years, the energy crisis and the deteriorating environmental conditions have promoted the development of renewable sources [1,2]. Globally installed solar capacity is equal to 76.1 GW in 2016, while was equal to 51.2 GW in 2015, in accordance to data released by Solar Power Europe. From one side, the world’s top installer in 2016 is China (45%), followed by the United States of America (USA) (19%), and Japan (11%), from the other side only 6.9 GW are installed in Europe. China is the leader in terms of cumulative power installed with 77.7 GW, followed by Japan (43.0 GW), Germany (40.9 GW), USA (39.6 GW), and Italy (19.3 GW) [3]. An analysis of the Chinese market underlines as the best economic performances are reached in the territories with better solar radiation or where the electricity price is higher. Furthermore, the other two critical variables are investment cost and the regional Feed-In Tariffs (FIT) [4].
Photovoltaic (PV) sources can be competitive with other energy resources, as highlighted by International Energy Agency Report 2015. Levelized Cost of Electricity (LCOE) of solar PV residential, solar PV commercial, and solar PV large varies from 0.09 to 0.34 €/kWh, from 0.05 to 0.21 €/kWh, and from 0.05 to 0.27 €/kWh in Organisation for Economic Co-operation and Development (OECD) countries, respectively. A more recent study covering the Mediterranean region points out that the LCOE can be even lower than 0.05 €/kWh under certain conditions [5]. Solar energy is highly uncertain due to various perturbation effects, in fact it has an intermittency nature [6]. Energy storage system (ESS) provides a wide array of typologies of batteries, namely, lead acid, lithium ion, sodium-sulphur, and vanadium redox flow [7]. Lead-acid ESS is considered in this work in according to the choice presented by [8], in which is evaluated to the lead acid solution as the most cost-efficient technology in terms of an increase of self-consumption. To support this choice, the strengths of this technology in the residential sector are proposed also by [9]. However, the advantageous of ESS are verified also for commercial [10] and large-scale [11] PV plants. Furthermore, also lithium-ion technology seems to be the choice of manufacturers of inverters, in order to make them hybrid ones, and also since we are observing a rapid decrease in their price. In fact, several works underlines lithium-ion as even less costly in a long-term economic analysis [12,13].
The profitability of PV-integrated battery systems is a topic discussed in existing literature. Net Present Value (NPV) is an indicator that is typically used. It is equal to 150–500 €/kWh [14], 447–1650 $ [15], (−5640)–1780 € [16], and (−30,000)–(−5000) $ [17]. Other works confirms that the profitability varies in a meaningful way and ESS can be cost-effective only with a substantial costs reduction [18,19]. A crucial role is played also by the increase of self-consumption [16]. Also, this variable is characterized by a great variability. An increase by 10–24% points with ESS of 0.5–1.0 kWh per installed kW of PV power is proposed by [20], while a range more wide (20–50% points) is defined by [21]. The evaluation of residential energy storage combined with PV panels is extremely complex and there are other critical variables, as the presence of subsidies in PV production [22], the type of storage technology and its sizing [23], the demand of the consumers, and electricity prices [14]. Subsidies provides the feasibility in several contexts [24,25], but it should be stressed as greenhouse gas (GHG) emissions for battery production are equal to 110 kgCO2eq per kWh of storage capacity [26].
A comparison of different countries is proposed by [27], in which the economic feasibility of small-scale PV systems is evaluated. Australia, Germany and Italy present interesting opportunities. Consequently, Italy can be chosen as case study. A previous analysis has considered the profitability of PV systems in residential sector and 1 kW, 2 kW, 3 kW, 4 kW, 5 kW and 6 kW are considered as plants’ size [3]. For this motive, we have chosen the same sizes. This work investigates the financial feasibility of PV-integrated lead acid battery systems in an Italian region (Lombardia, Italy), proposing regional subsidies to favour the installation of ESS. In addition to 50% fiscal deduction, Net Present Value (NPV) is calculated in several case studies. Critical variables used are PV plant size, battery capacity, the increase of the share of self-consumption, and the useful lifetime of ESS.
The paper is organised as follows. Section 2 proposes the methodology used in this paper and the input data. NPV and break-even point (BEP) are calculated in Section 3 concerning PV projects and integrated systems with ESS. Four alternative scenarios based on subsidies are considered in Section 4 to give solidity to results obtained. Section 5 presents some concluding remarks.
2. Materials and Methods
The concept of Discounted Cash Flow (DCF) evaluation is based on the principle that the value of a project is inherently developed on its ability to generate cash flows for the providers of capital. An incremental approach, that considers only cash inflows and outflows, and an appropriate cost opportunity of capital is used to aggregate several cash flows. NPV is the financial index proposed in this work. It is the difference between the present value of cash inflows and the present value of cash outflows. NPV is used in capital budgeting to analyse the economic feasibility of a project. Furthermore, also the BEP analysis is proposed. It is the point at which forecasted revenues are exactly equal to the estimated costs [28].
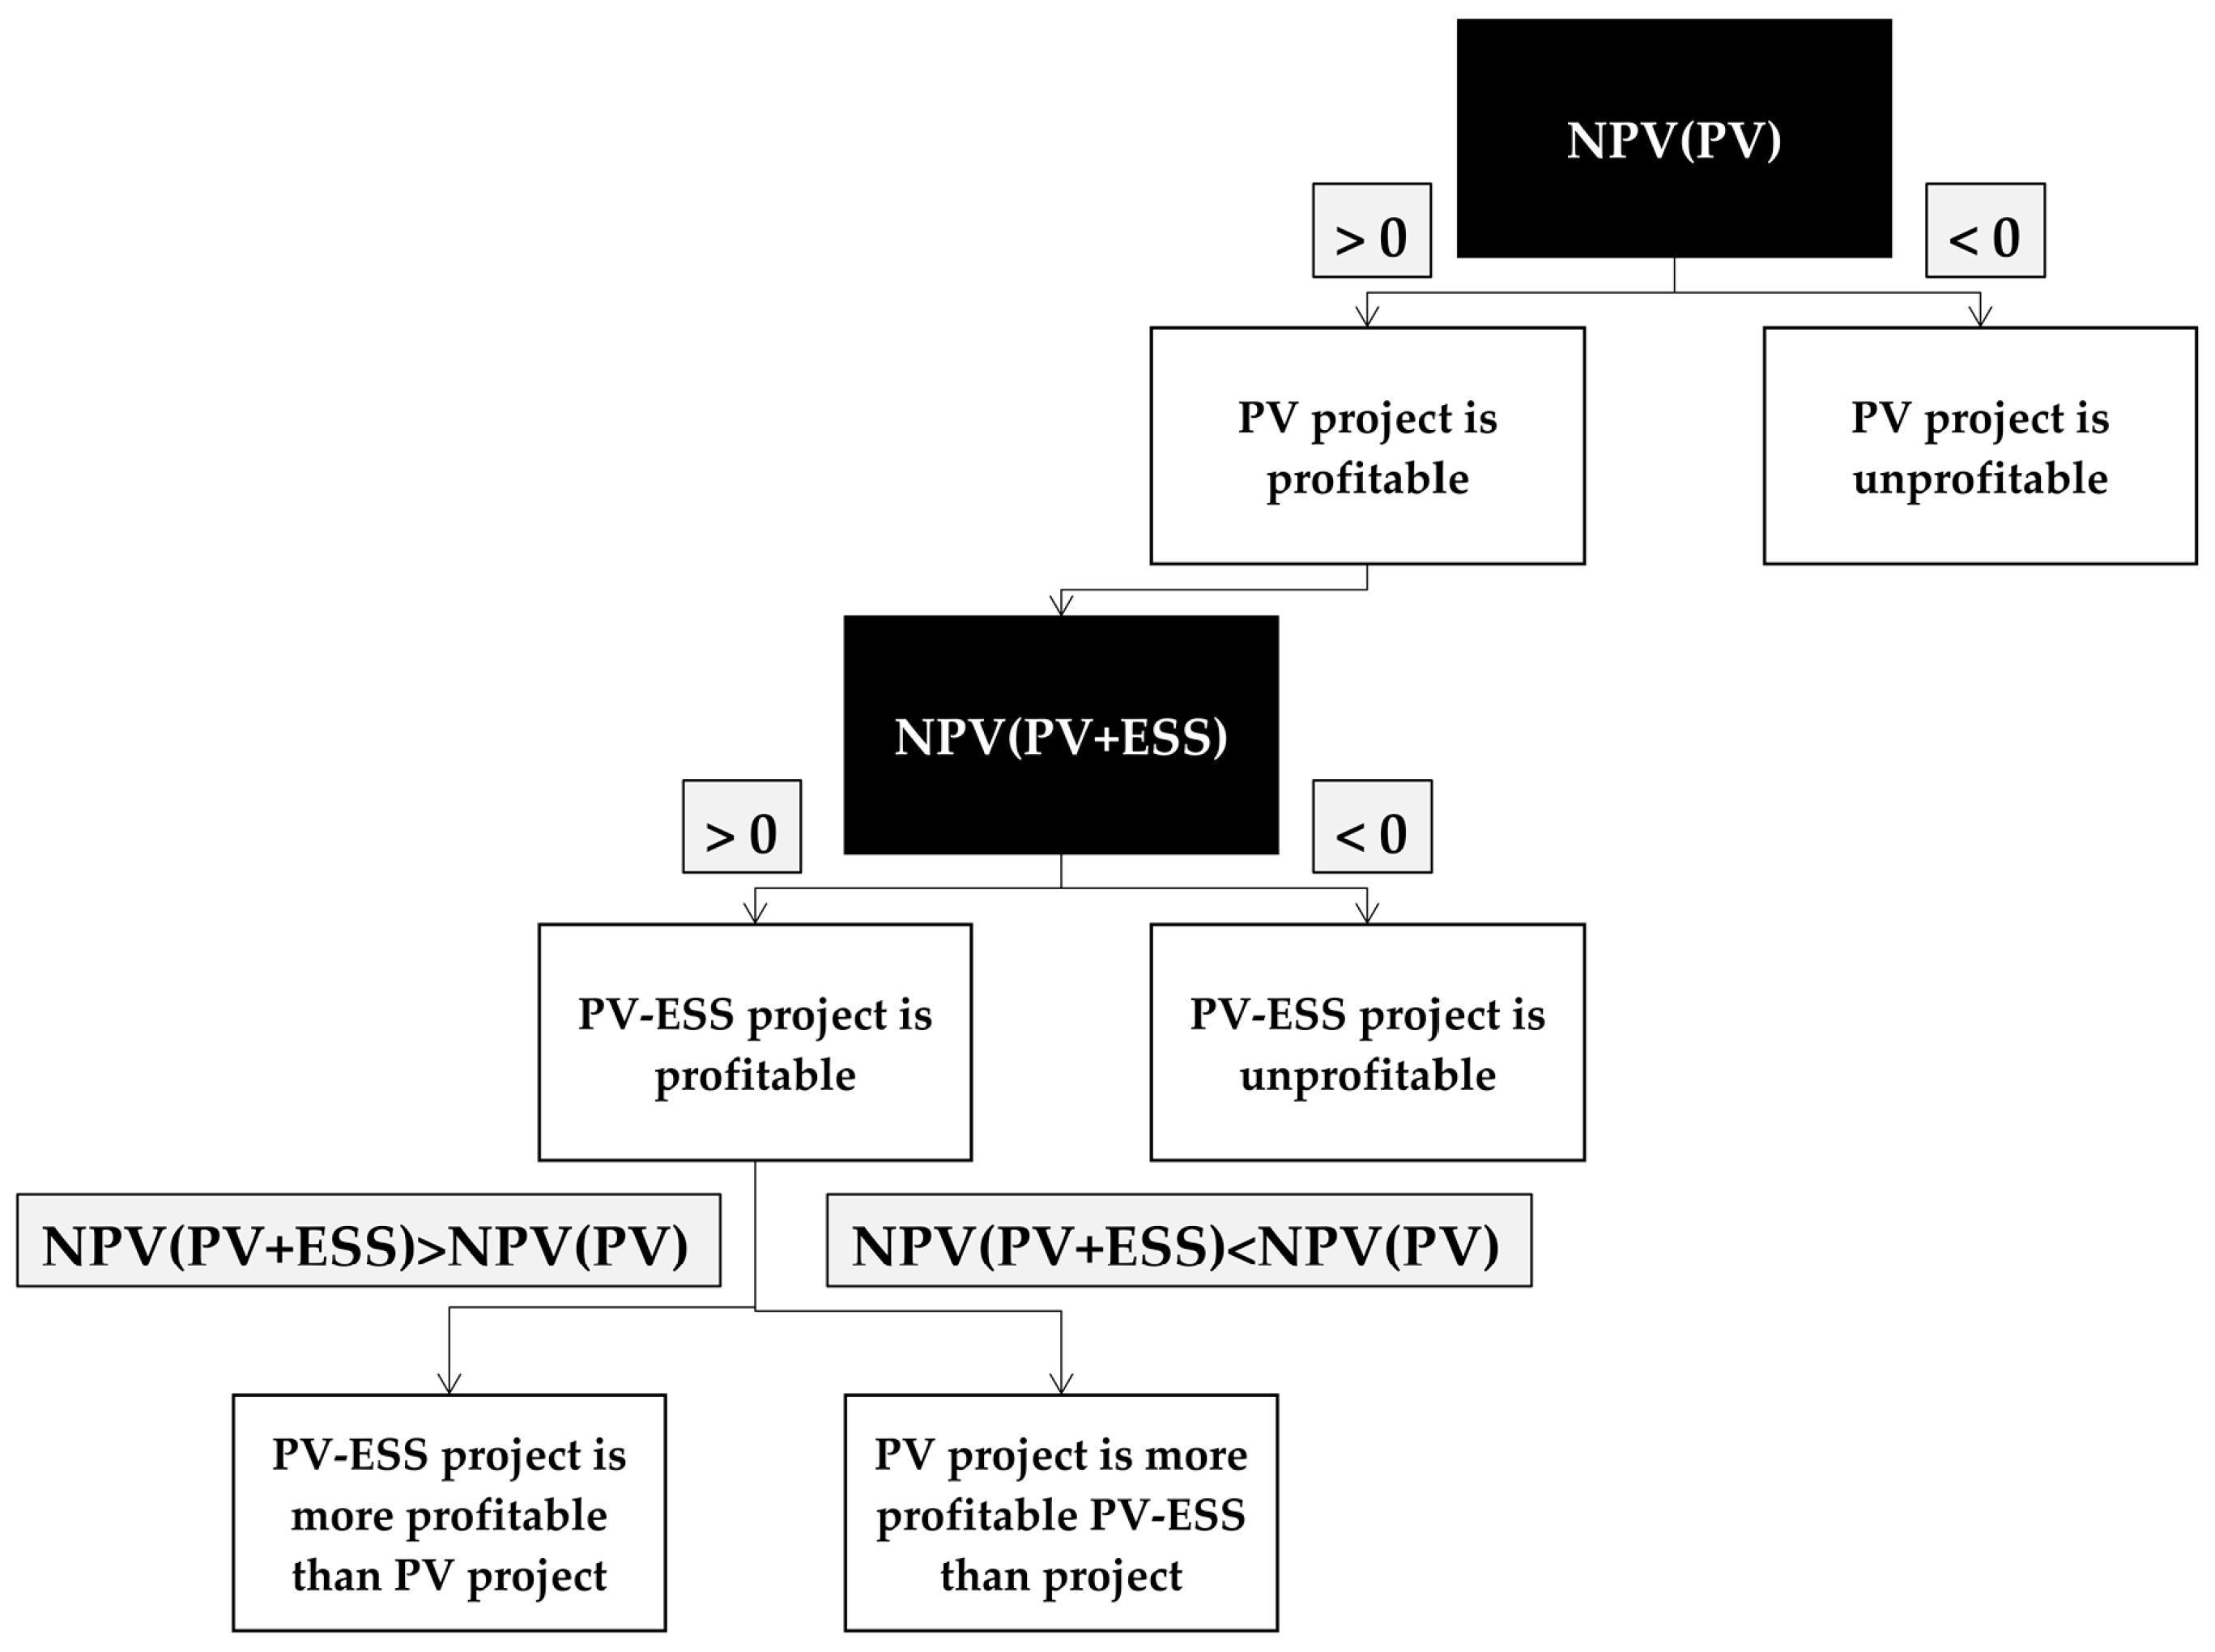
Several steps compose the decision-making process—Figure 1:
- The profitability of PV system is evaluated. When NPV is negative, the investment project is discarded.
- When, instead, NPV(PV) > 0 discounted cash inflows are greater than relative discounted cash outflows. In this way, the investor can also opt to install an ESS integrated to PV system.
- The profitability of PV-integrated battery system is evaluated. As in the first point the investment project is discarded with a negative NPV.
- NPV(PV + ESS) > 0 can be produced by two different scenarios.
- In the first case, ESS is characterized by economics in which discounted cash inflows are greater than the relative discounted cash outflows. In this way NPV(ESS) is positive, and consequently, as defined in Equation (6), NPV(PV + ESS) > NPV(PV). If the investor opts to install a PV-integrated battery system, can obtain more profits than PV system.
- In the second case, NPV(PV + ESS) < NPV(PV) defines as the decision maker opt to install only PV plant because is more profitable. In fact, NPV(ESS) is negative.
Italy is a PV developed market, in which Feed-in-Premium and Feed-in-Tariff are no longer provided. The sector is supported by a political choice, in which a 50% tax deduction (compared to the usual 36%) is provided to consumers that use PV system to produce electricity for self-consumption [29]. A 50% tax deduction is provided, also for energy storage applications. This amount is divided into ten equal rates [16]. In addition, a northern Italian Region, called Lombardia, had adopted a policy to encourage these investments. It provides funds non-repayable of up to 50% of the investment costs incurred for the installation of battery systems during the initial phase of the project (year zero). The incentive can be required for ESS integrated to PV plants up to 20 kW for a maximum of 5000 €. This measure can be cumulated with the 50% tax deduction, but in this scenario, the detraction is applied only to the portion of expenditure left uncovered by the regional incentive. In this way, three main revenues are: (i) regional subsidies; (ii) fiscal detraction; and (iii) avoided costs in energy bill. The adoption of storage increases the share of self-consumption (wself,c) and this option saves money on the electricity bills, cutting down also on the PV system payback times [30].
Starting by a previous paper [3], in which the profitability of PV systems (NPV(PV)) is evaluated, this work extend the analysis to application of ESS. Model assumptions and the input used are not completely repeated for space issues (see Supplementary content). However, it is necessary to define the critical variables used in the evaluation of PV systems in Italy. The saving of energy through internal consumption is evaluated in the function of electricity purchase price that can be assumed equal to 19 cent €/kWh. This value can be also called energy price per kWh for the final consumer and its evolution through time over the 20 years is calculated in according to rate of energy inflation (equal to 1.5%). The quantity of energy not self-consumed and sold to the grid is evaluated by increasing the electricity sales price in accordance with [31]. It varies from 9.8 cent €/kWh to 10.9 cent €/kWh, where this last value is applied when the net amount of electricity below 3750 kWh. Consequently, business models proposed in this work considering this reference value in function of both plant size and the share of self-consumption. For example, the electricity sales price is 10.9 cent €/kWh for all of the lifetime of the project for 1 kW and 2 kW plants with wself,c = 0, while it is 9.8 cent €/kWh for all of the lifetime of the project for 4 kW, 5 kW, and 6 kW plants with wself,c = 0. The role of Net-Metering policies in PV markets is explored by [32]. The rate of self-consumption represents the amount of self generated electricity that is consumed locally [24]. It varies in function of consumers’ use and a starting value of 30% is chosen [31]. Finally, starting by the initial value of 1900 €/kW [3], a reduction of 50 €/kW is proposed for unitary investment cost (without value added tax (Vat)). Consequently, the reference value is 1850 €/kW.
Instead, the mathematical model used to evaluate the profitability of battery systems (NPV(ESS)) is reported below:
The feasibility of ESS depends on all variables involved in the evaluation of profitability [22]. One-hundred and forty-four case studies are defined by the combinations of the following variables:
- PV plant size, where six distinct inputs are considered—1 kW, 2 kW, 3 kW, 4 kW, 5 kW, and 6 kW—[3].
- ESS plant size, in which four values are proposed for each PV plant size and are chosen in function of the ratio between the kWh battery capacity and the installed kW PV (B/S), that is equal to 0.5, 1.0, 1.5 and 2.0, respectively [16].
- the increase of self-consumption (Δwself,c) is chosen in the function of B/S—B/S = 0.5 (→ Δwself,c = 15%), B/S = 1.0 (→ Δwself,c = 20%), B/S = 1.5 (→ Δwself,c = 30%), and B/S = 2.0 (→ Δwself,c = 40%)—in according to [20]. The baseline value is increased/decreased of 5% and consequently, three values are proposed for this variable. The minimum increase is 10% (with B/S equal to 0.5), while one maximum is 45% (with B/S equal to 2.0).
- the useful lifetime of ESS, in which two values (6 and 8 years) are analysed [16].
Furthermore, all plants are located in Lombardia. This territory has a low level of solar irradiation than other Italian regions [33]. The quantity of energy produced is calculated in function of several technical data as highlighted in Equation (5)—[3]. An average solar irradiation equal to (1350 kWh/m2 × y) is considered in this work and starting by this value, the energy produced during the first year is 1452 kWh/kWp. When the lifetime of a PV plant is evaluated, also a reduction of performance is proposed (dEf) and evaluating this variable, an average value equal to 1347 kWh/kWp is obtained. The useful lifetime of the investment project is 20 years, and this value is equal to the lifetime of a PV plant. A review on this last topic defines as solar PV gets a 20 to 25 years lifespan [34] and the scenario with a time duration of 20 years is basically less profitable than one in 25 years when considering the low operative cost [35,36]. The choice of 20 years is considered more suitable in several works [3,37,38]. The cost opportunity of capital measure the return coming from an alternative project similar, in terms of risk level, to the considered one. This value is chosen equal to 5% [39]. Furthermore, the investment costs are covered by third party funds and it is composed by two components: loan capital share (Clcs) and loan interest share (Clis). Clcs is calculated by dividing the initial investment for the period of loan and constant rate are paid during this interval, while Clis is calculated on the difference between initial investment and Clcs for a specific interest rate on a loan. As defined by Equation (4), the price of installations of ESS depends on several factors. It varies from 701 € when considering a 1 kW plant with a battery capacity of 0.5 kWh to 4835 € considering a 6 kW plant with a battery capacity of 12 kWh. As above cited, a 50% tax deduction (compared to the usual 36%) is provided also for ESS. TaxDu-sr is consequently a public support, which aims to attract the investment in this sector. This measure is valid for the current year. For this motive, a baseline rate (TaxDu-br) is, instead, applied for the replacement of batteries during the lifetime of the entire project. Table 1 presents other technical and economic inputs.
3. Results
The installation of PV systems is able to produce economic opportunities and environmental improvements. In according to the decision making process proposed in Figure 1, two subsections are proposed in this section: (i) the profitability of PV systems; and (ii) The profitability of integrated PV-battery systems.
3.1. The Profitability of PV Systems
As highlighted in Section 1, the profitability of PV systems is strictly linked to the share of self-consumption in markets without subsidies. The consumer increases profits of his project, when the difference between demanded energy and produced one is reduced. The adoption of lead acid ESS towards this direction, and consequently, the first result of this work is to calculate NPV for six plant sizes in function of this critical variable (NPV(PV)). Table 2 presents several scenarios, where the extreme cases are wself,c equal to 0%, when all produced energy is sold and to 100% if all of the produced energy is consumed. In some scenarios characterized by a higher rate of self-consumption, Demand Side Management may be required [20,42], and consequently, values reported in Table 2 are overestimated in comparison to the real case study.
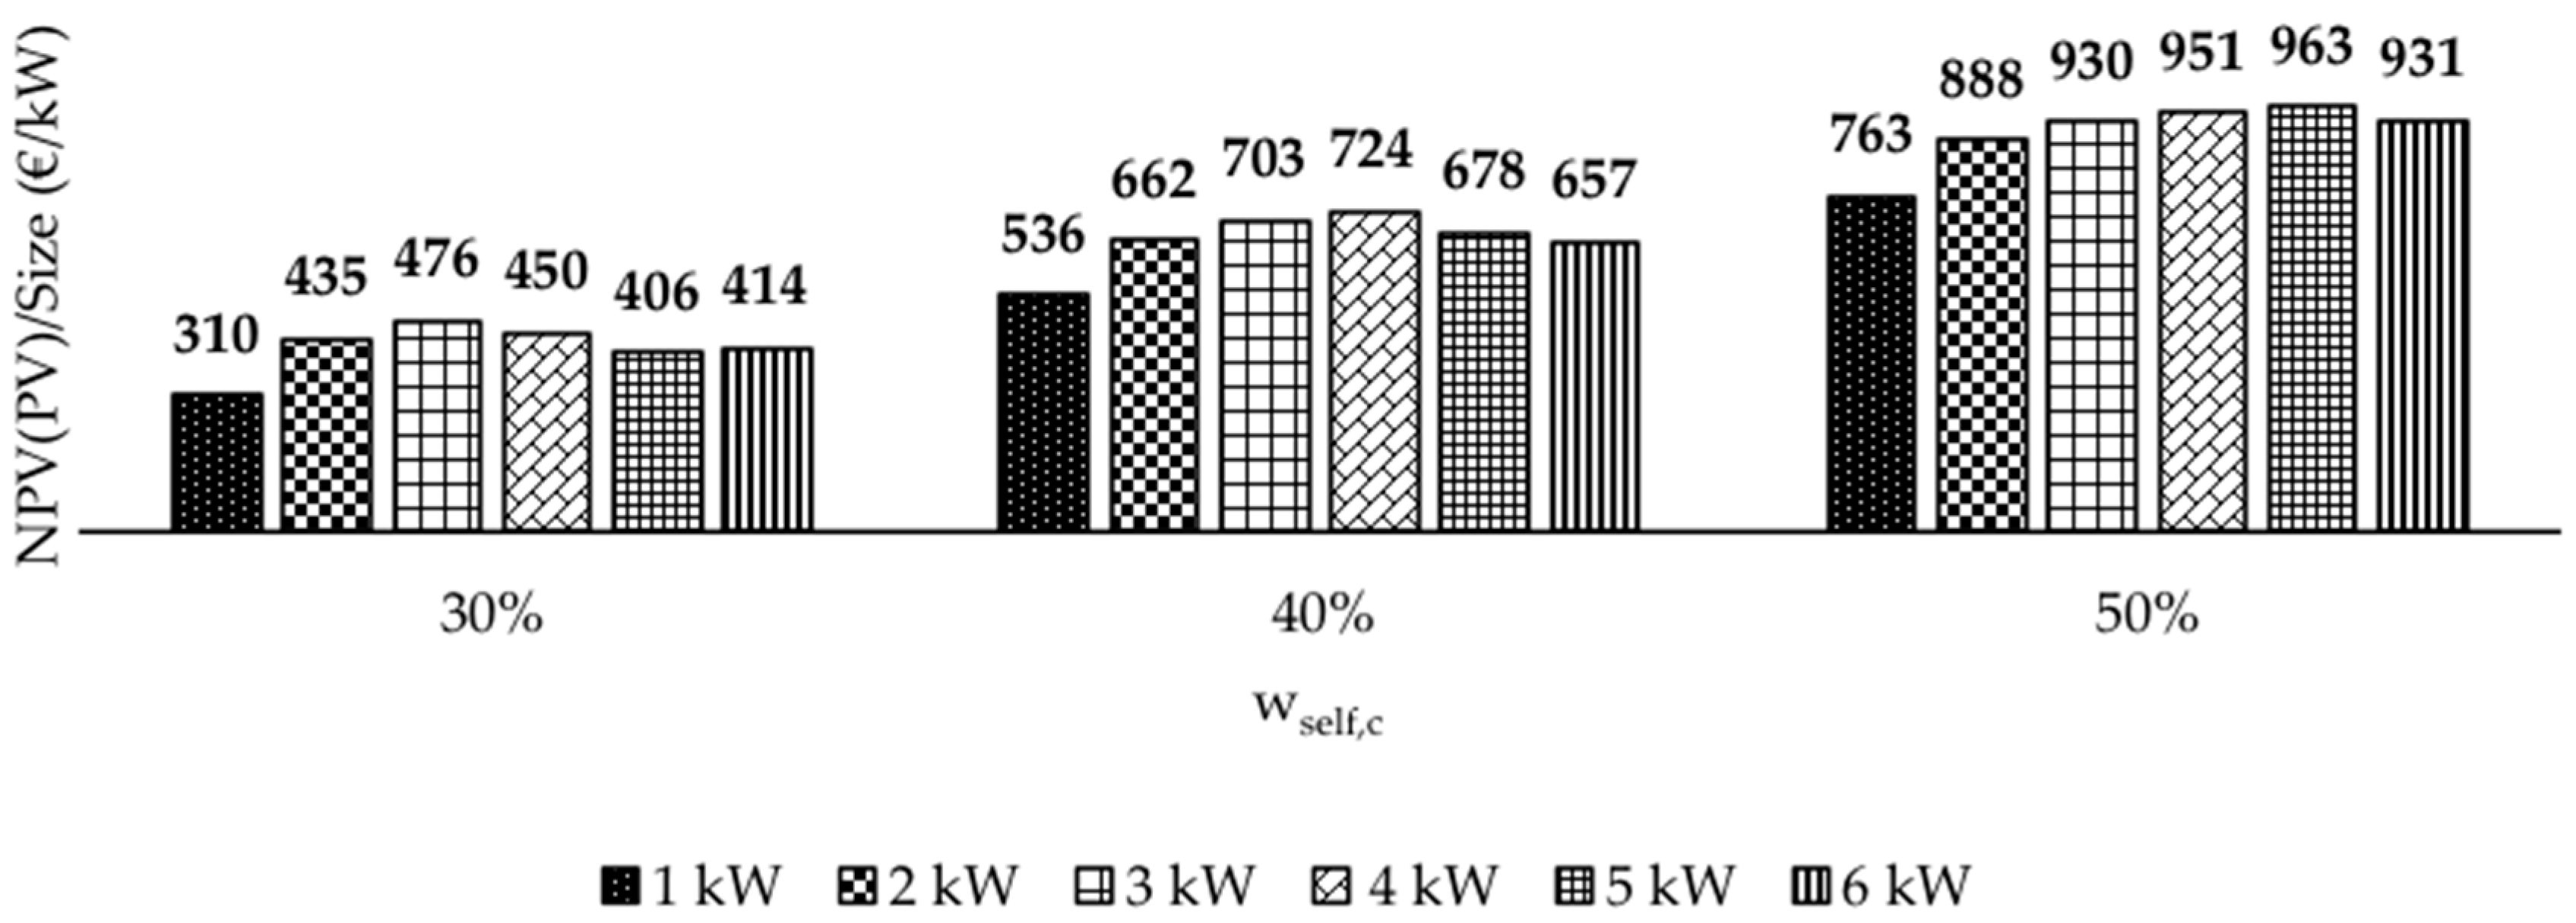
A comparison among several sizes is proposed in Figure 2. As underlined in Section 2, wself,c equal to 30% represents the baseline scenario and in this step of the work the ESS is not yet considered.
Results obtained in Table 2 define as the selling of the entire produced energy is unprofitable. Starting by this result, it is useful to calculate BEP in terms of wself,c. It gives a NPV(PV) equal to 0 when is equal to:
- 11% for 2 kW and 3 kW plants.
- 13% for 5 kW and 6 kW plants.
- 14% for 4 kW plant.
- 16% for 1 kW plant.
Basically, a PV system is characterized by profits and the profitability varies significantly in function of self-consumption. It ranges from 83 €/kW in 1 kW plant, with wself,c of 20% to 2209 €/kW in 6 kW plant with wself,c of 100%. Also, the size influences the financial result, but it has a lower impact. For example, 2 kW plant with wself,c of 35% has NPV(PV) equal to 548 €/kW, that is greater values obtained for plants from 3 to 6 kW with wself,c of 30% (in which, NPV(PV) varies from 406 to 476 €/kW). An investor that uses electricity during peaks of production solar is able to reduce the costs of energy bill and the analysis of consumption flows allows for defining the optimal size.
The growth of NPV(PV) is more significant, when there is an alignment between the increase of self-consumption and the increase of plant size. In fact, the values greater for plants with wself,c of 30% are obtained for 3 kW plant (476 €/kW). When the scenario proposed a wself,c of 40% or 50%, or 60%, the maximum NPV(PV) is obtained for 4 kW (724 €/kW), 5 kW (963 €/kW) and 6 kW (1198 €/kW) plants, respectively.
3.2. The Profitability of Integrated PV-Battery Systems
After the definition of NPV(PV), the following step is represented by the definition of economics resulting by the adoption of ESS applied to PV plant. From the revenues side, there are fiscal deductions, regional subsidies, and increases of self-consumption, and from the cost side, there are investment and operative items. The decision-maker can quantify if the cash inflows derived by ESS justify or less the cash outflows. It is verified when NPV(ESS) is positive—Table 3.
NPV(PV) measures only PV investment and NPV(ESS), instead, considers only ESS investment. In this way as defined in Equation (6), NPV(PV + ESS) is given by the sum of these two projects. If NPV(ESS) > 0, NPV(PV + ESS) > NPV(PV) and a PV-integrated battery system is more convenient than a PV plant. Starting by results of NPV(PV) presented in Table 2 with the initial value of wself,c equal to 30% and considering NPV(ESS) as obtained in Table 3, the financial feasibility of energy storage combined with PV panels is proposed in Table 4. For example, a 3 kW plant has NPV equal to 1429 € (see Table 2) and a 6 kWh ESS applied to this plant with Δwself,c of 35% presents a NPV equal to −260 € and 176 € with a lifetime of battery (NB) of six years and eight years, respectively. In the first case, ESS is not financial convenient and PV investment is more profitable than PV-integrated battery system—see Equation (7). While in the second case, ESS produces profits and an integrated system is more profitable than PV plant—see Equation (8).
The profitability of PV-integrated battery systems is verified in one hundred and forty case studies (97%). However, this project can be considered as an alternative to the installation of PV plants. Consequently, these profits must be compared. The profitability of ESS is verified only in forty-nine of case studies examined (34%) and so energy storage combined with PV panels is more convenient than one linked to the PV plant. Results underline clearly as the size of batteries play a key-role. In fact, when the ratio between the kWh battery capacity and the installed kW PV is equal to 2.0 and 1.5, NPV(ESS) is positive in thirty-two and fifteen scenarios, respectively. This derives from the structure of incentive used (public funds) that not distinguishes the size of batteries for the values of PV size proposed in this work. However, as underlined in Section 1, the production of ESS determines the release of GHG emissions. This aspect must be balanced with environmental improvements. In terms of the rate of self-consumption, ESS provides a positive support from the environmental point of view, when the grid is not able to absorb all of the produced energy. In fact, the reduction of emissions is verified when the production of energy from PV plants (or other renewables) is alternative to the use of fossil fuels. If the grid does not absorb all of the green produced energy, contextually the improvements obtained by a PV plant would be lower and could be recovered by using an ESS.
Furthermore, concerning the size of PV systems, it is possible to underline as the maximum number of profitable scenarios is ten (5 kW and 6 kW plants), while the minimum one is six (3 kW plant). Finally, lifetime of battery systems equal to 8 years presents thirty-one profitable scenarios, while only eighteen case studies are verified when it is equal to 6 years. Obviously, forty-nine case studies that have a positive NPV(ESS) provide the opportunity to the investor to obtain more profits installed a lead acid ESS integrated to a PV plant, in comparison to use of single PV system.
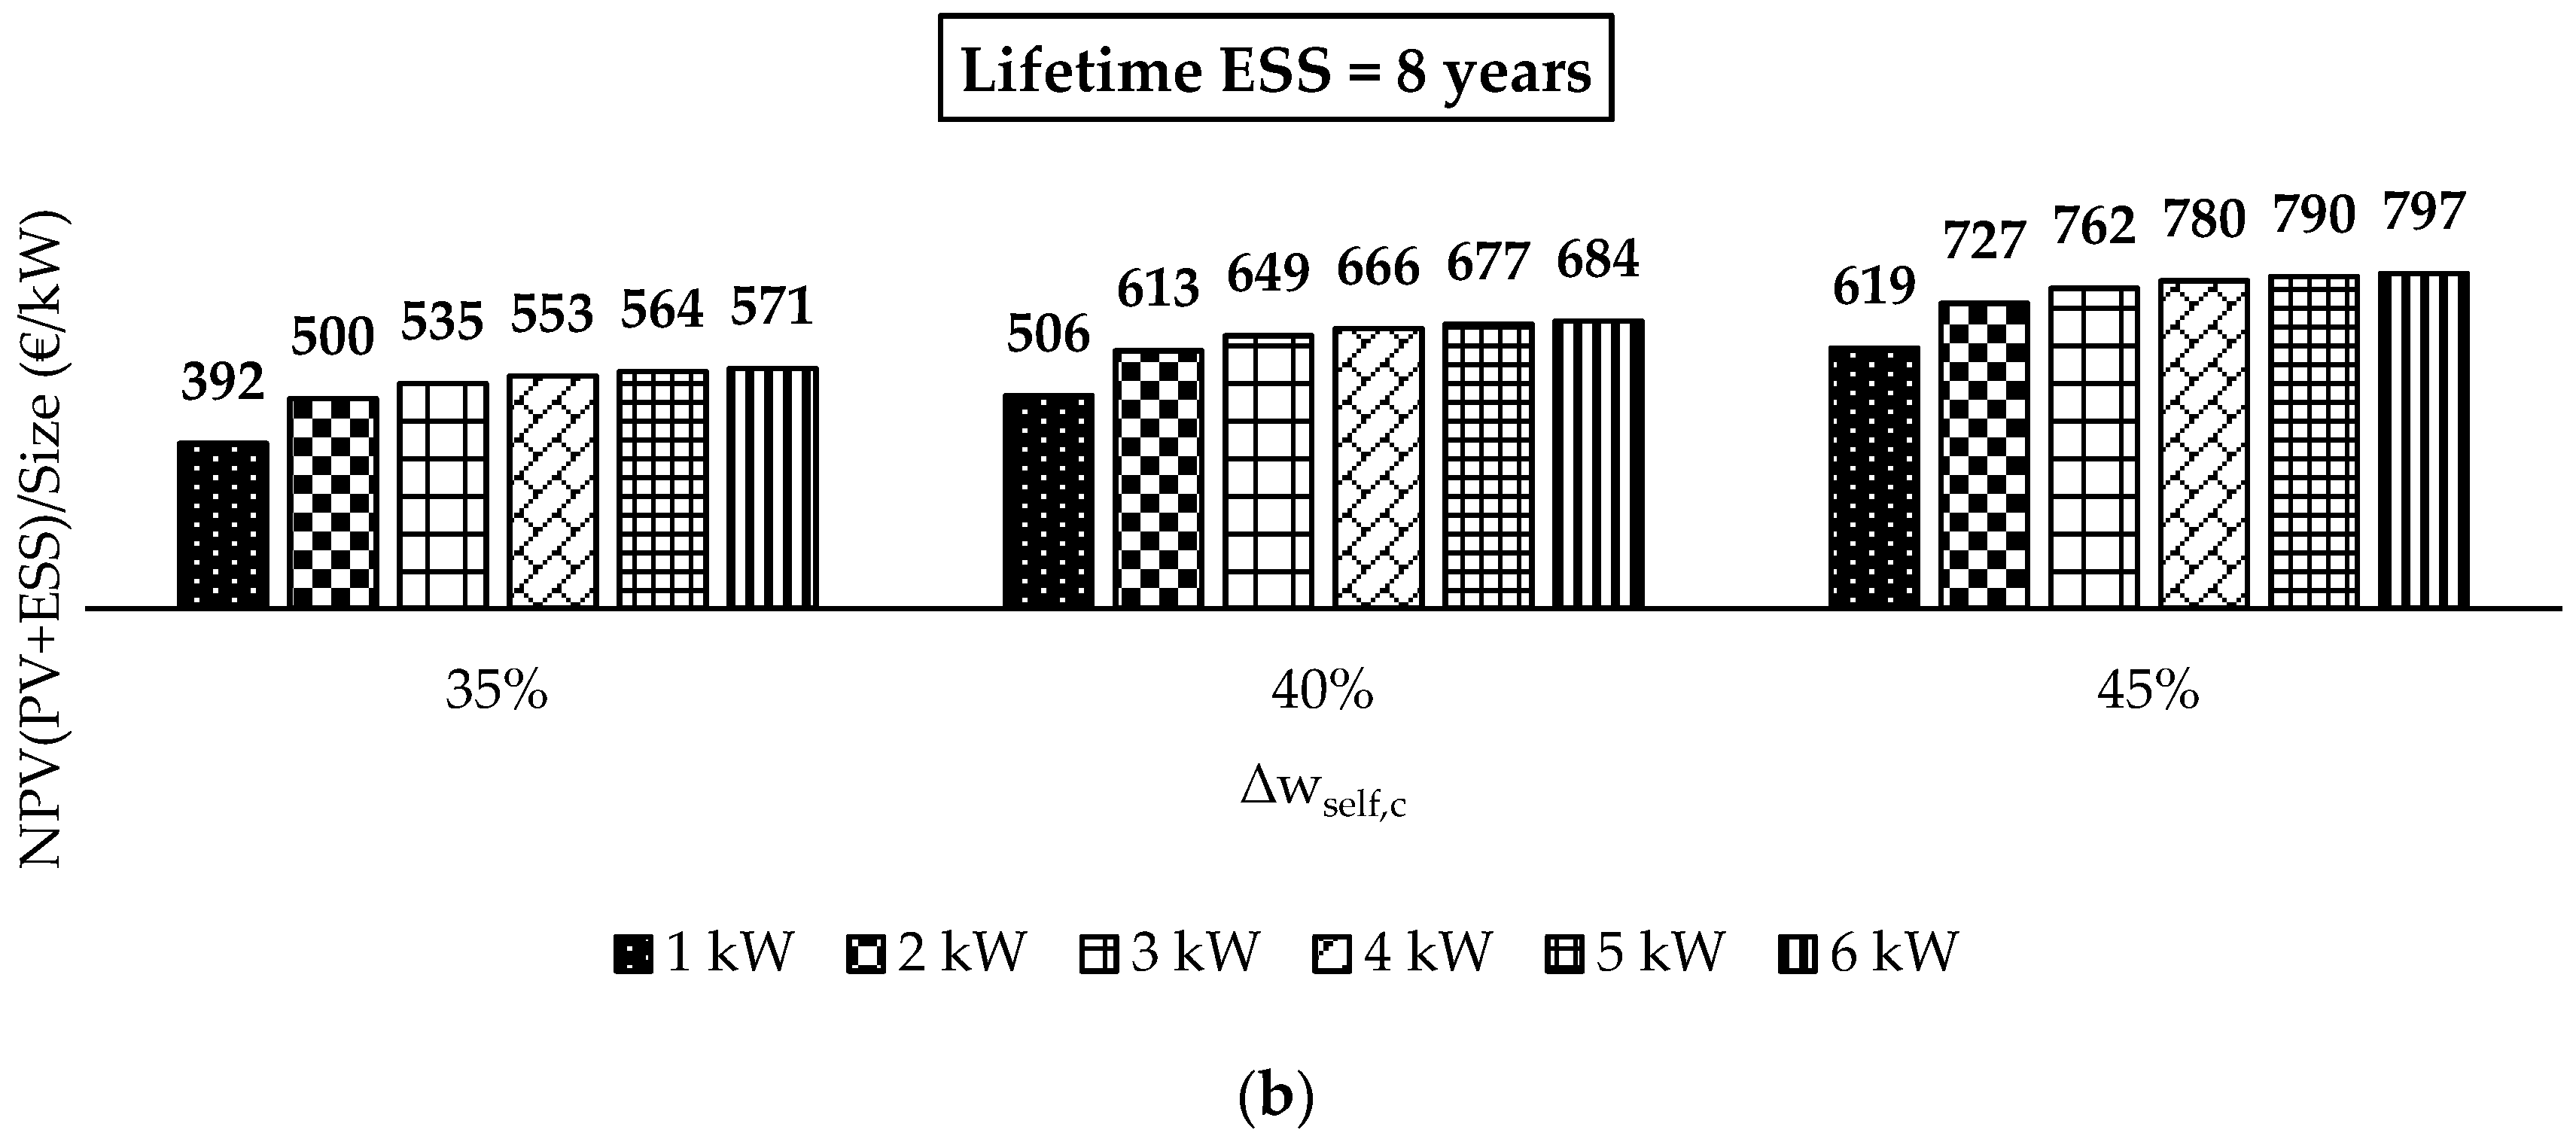
A comparison among several sizes is proposed in Figure 3a,b. It examines the application of the ratio B/S equal to 2.0. These values do not provide results different from previous ones, but underline it as the better performances are verified for 6 kW plant followed by the 5 kW one. NPV/Size varies from 425 to 652 €/kW considering a lifetime of ESS equal to 6 years and from 571 to 797 €/kW with a lifetime of ESS of 8 years. However, 5 kW plant provides the greater increases in comparison to the investment of a single PV plant. They are equal to 239 and 384 €/kW for a lifetime of ESS of 6 and 8 years, respectively. There is only a difference of 1 €/kW than the performance linked to the 6 kW plant. Consequently, these results confirm the opportunity to opt for larger sizes when the demanded energy permits this choice.
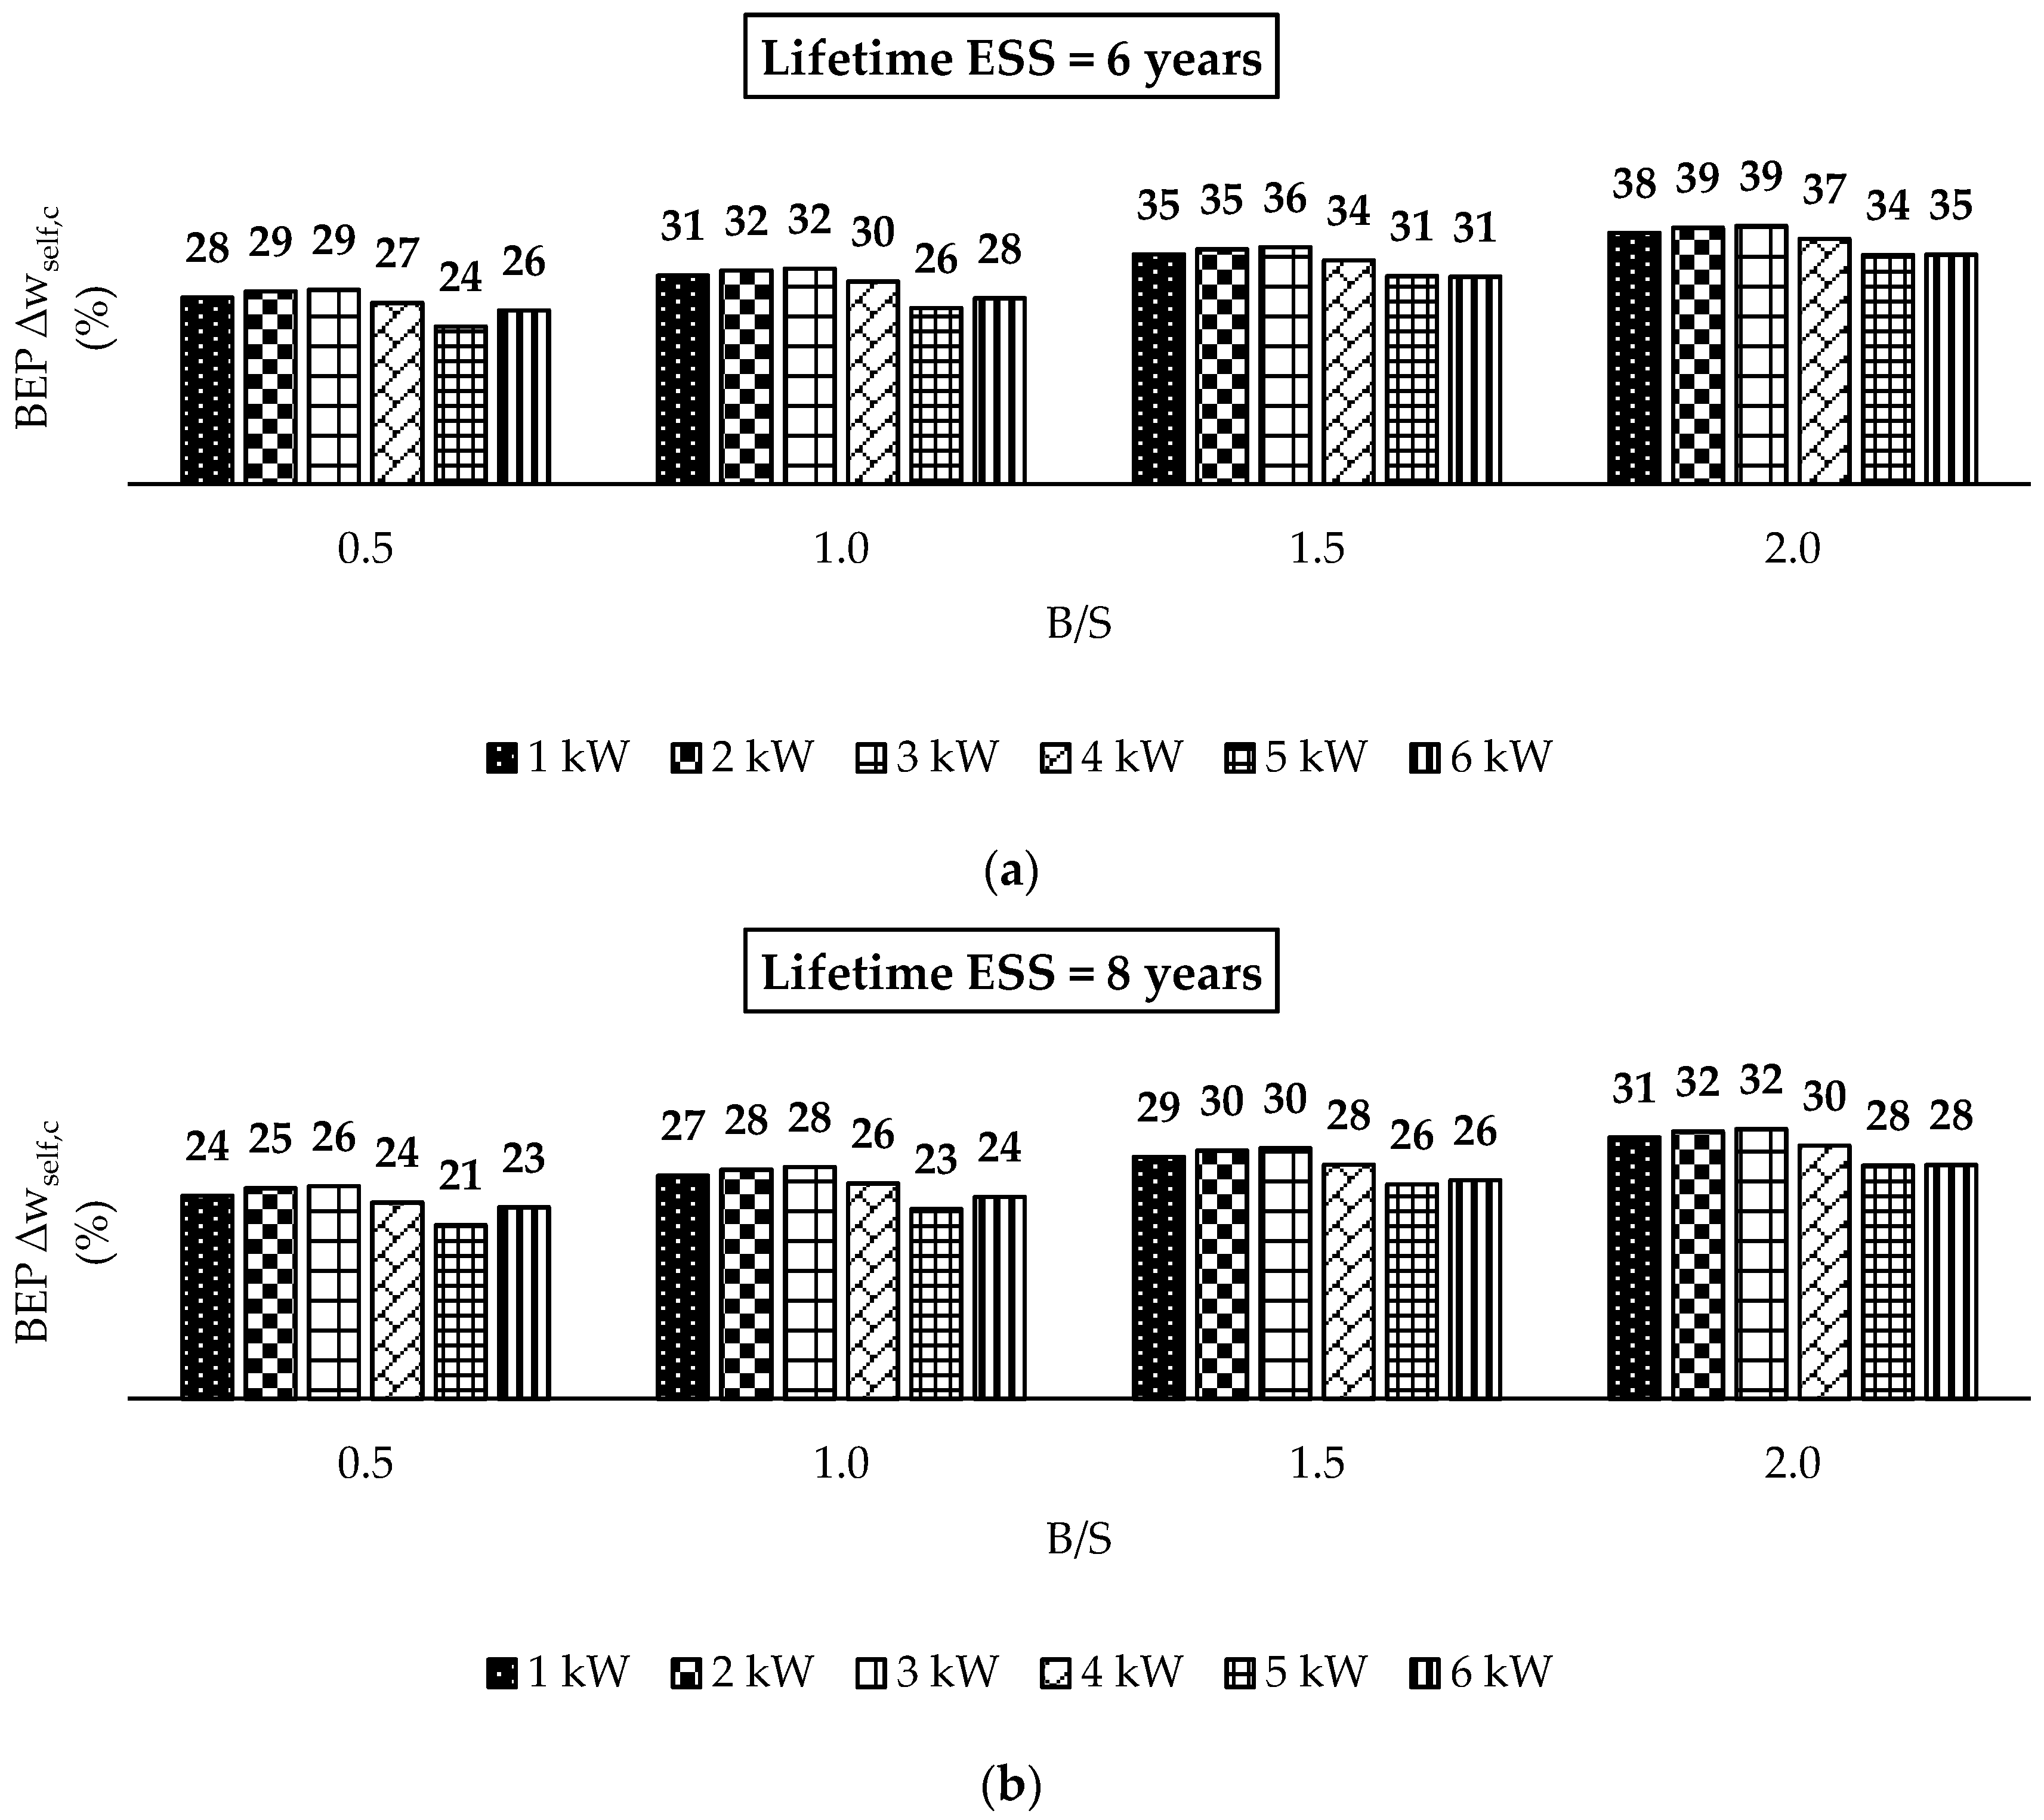
Also, for integrated systems a BEP analysis is proposed in terms of Δwself,c—Figure 4a,b. It gives a NPV(ESS) equal to 0 with the following min-max values:
- 21–29% with the ratio B/S = 0.5 (the baseline value is equal to 15%).
- 23–32% with the ratio B/S = 1.0 (the baseline value is equal to 20%).
- 26–36% with the ratio B/S = 1.5 (the baseline value is equal to 30%).
- 28–39% with the ratio B/S = 2.0 (the baseline value is equal to 40%).
These percentages confirm that the profitability can be reached with values lower than baseline ones. Literature presents increases of self-consumption that are very high in market without regional subsidies [16]. The presence of incentives can be seen as an excessive action of government in the market and this can be subject to possible criticisms [43]. For this motive, alternative scenarios will be proposed in the following section.
4. Sensitivity Analysis
Sensitivity analysis is a technique to predict the outcome of a decision given a certain range of input variables [44]. This section proposes alternative scenarios in which is conducted a sensitivity analysis on the variable concerning subsidies. Policy-makers of Lombardi have defined the key-role of ESS in the development of smart grid and the structure of regional incentive is proposed in Section 2. FIT scheme is not more applicable to new PV plants and baseline scenario provides regional subsidies for the installation of ESS (equal to 50% of initial investment in the year zero). In addition, also the 50% tax deduction is provided. This section proposes four alternative scenarios:
- “without subsidies”, where the regional subsidies are not provided. This situation is present in all Italian regions (Lombardia was the exception). Stakeholders that are against the monetary support to renewables—Table 5, welcome this action;
- “reduced subsidies”, in which the regional subsidies are given to 25% of initial investment in a single rate during the year zero and the 50% tax deduction is applied to the portion of expenditure left uncovered by the regional incentive. This choice is a midway between “baseline” scenario and “without subsidies” one—Table 6;
- “redefined subsidies”, where is considered the principle used for the fiscal detraction, but also for incentivizing the PV system through FIT scheme. So, the regional subsidies equal to 50% of the initial investment is given to investor in five constant rates during the first five years. In this way, certainly the profit will be lower, but public funds can be employed in other sustainable projects—Table 7; and,
- “new fiscal deduction”, in which is proposed the approach used by [3] defining the time of deduction equal to 5 years concerning PV investments—Table 8. In addition the regional subsidies, equal to 50% of initial investment, are given in five constant rate during the first five years (as in “redefined subsidies” scenario)—Table 9.
The profitability of ESS is verified only in eight case studies. This assumption is confirmed by the literature analysis [24,25], which confirms that the subsidies play a key-role in the feasibility of PV-integrated battery systems. The economic opportunities in this scenario are verified only when are verified three conditions: (i) a battery size double than PV plant capacity; (ii) a lifetime of ESS equal to 8 years; and, (iii) a substantial increase of the share of self-consumption.
Positive NPV(PV + ESS) varies from 326 €/kW (in 1 kW plant) to 550 €/kW (in 6 kW plant), with the ratio B/S as equal to 2.0. The “without subsidies” scenario is characterized by a reduction in comparison to the “baseline” one. It is equal to 247–266 €/kW and to 221–240 €/kW with the ratio B/S equal to 2.0 and 1.5, respectively (only 1 kW plant has different values). The reduction is more significant with greater sizes of battery, because the subsidies given are directly linked to the initial investment.
Another scenario proposed in this work is related to an incentive less consistent. In this way, it is expected a reduction than “baseline” scenario, and this decrease varies from 29 to 50 €/kW when considering all case studies. Positive NPV(PV + ESS) ranges from 311 €/kW (in 1 kW plant) to 756 €/kW (in 6 kW plant), with the ratio B/S of equal to 2.0.
The profitability of ESS is verified in forty case studies. Consequently, there are nine case studies that have no more financial feasibility in comparison to “baseline” scenario: 2 and 3 kW plants with NB = 6 y, Δwself,c = 40%, and B/S = 2.0; 5 and 6 kW plants with NB = 6 y, ∆wself,c = 35%, and B/S = 2.0; 1 and 4 kW plants with NB = 6 y, Δwself,c = 35% and B/S = 1.5; 1 and 2 kW plants with NB = 86 y, Δwself,c = 30% and B/S = 1.5, and 5 kW plant with NB = 8 y, Δwself,c = 25%, and B/S = 1.0. Several works define as the definition of subsidies, that they must require careful analysis and an evaluation of the socio-economic impact and energy policy [45,46].
FIT provides subsidies that are not concentrated in a single rate and a progressive reduction over time [47,48]. The “redefined subsidies” scenario is characterized by a reduction in comparison to a “baseline” one. In fact, NPV decreases when a cash inflow is not concentrated during the initial phase of the project, but it is distributed over time.
NPV(ESS) is positive in the same forty case studies presented in the previous scenario. The profitability of PV-integrated battery systems varies from 318 €/kW (in 1 kW plant) to 761 €/kW (in 6 kW plant), with the ratio B/S equal to 2.0. The reduction than the “baseline” scenario is equal to 25–43 €/kW when considering all case studies.
As highlighted also by [3], the fiscal deduction that is reduced to five years permits an increase of NPV(PV). This value is equal to 95 €/kW for all case studies examined because of the linear relationship between revenues and cash inflows provided by fiscal deduction. NPV(ESS) provides the same results as “redefined subsidies” scenario, and so it is registered in the same reduction (25–43 €/kW) in comparison to the “baseline” one. From one side, the financial feasibility of ESS is verified always in the same forty case studies proposed in two previous scenarios. From the other side, it is not possible to determine beforehand whether the NPV(PV + ESS) increases or decreases. The profitability ranges from 413 €/kW (in 1 kW plant) to 856 €/kW (in 6 kW plant), with the ratio B/S equal to 2.0.
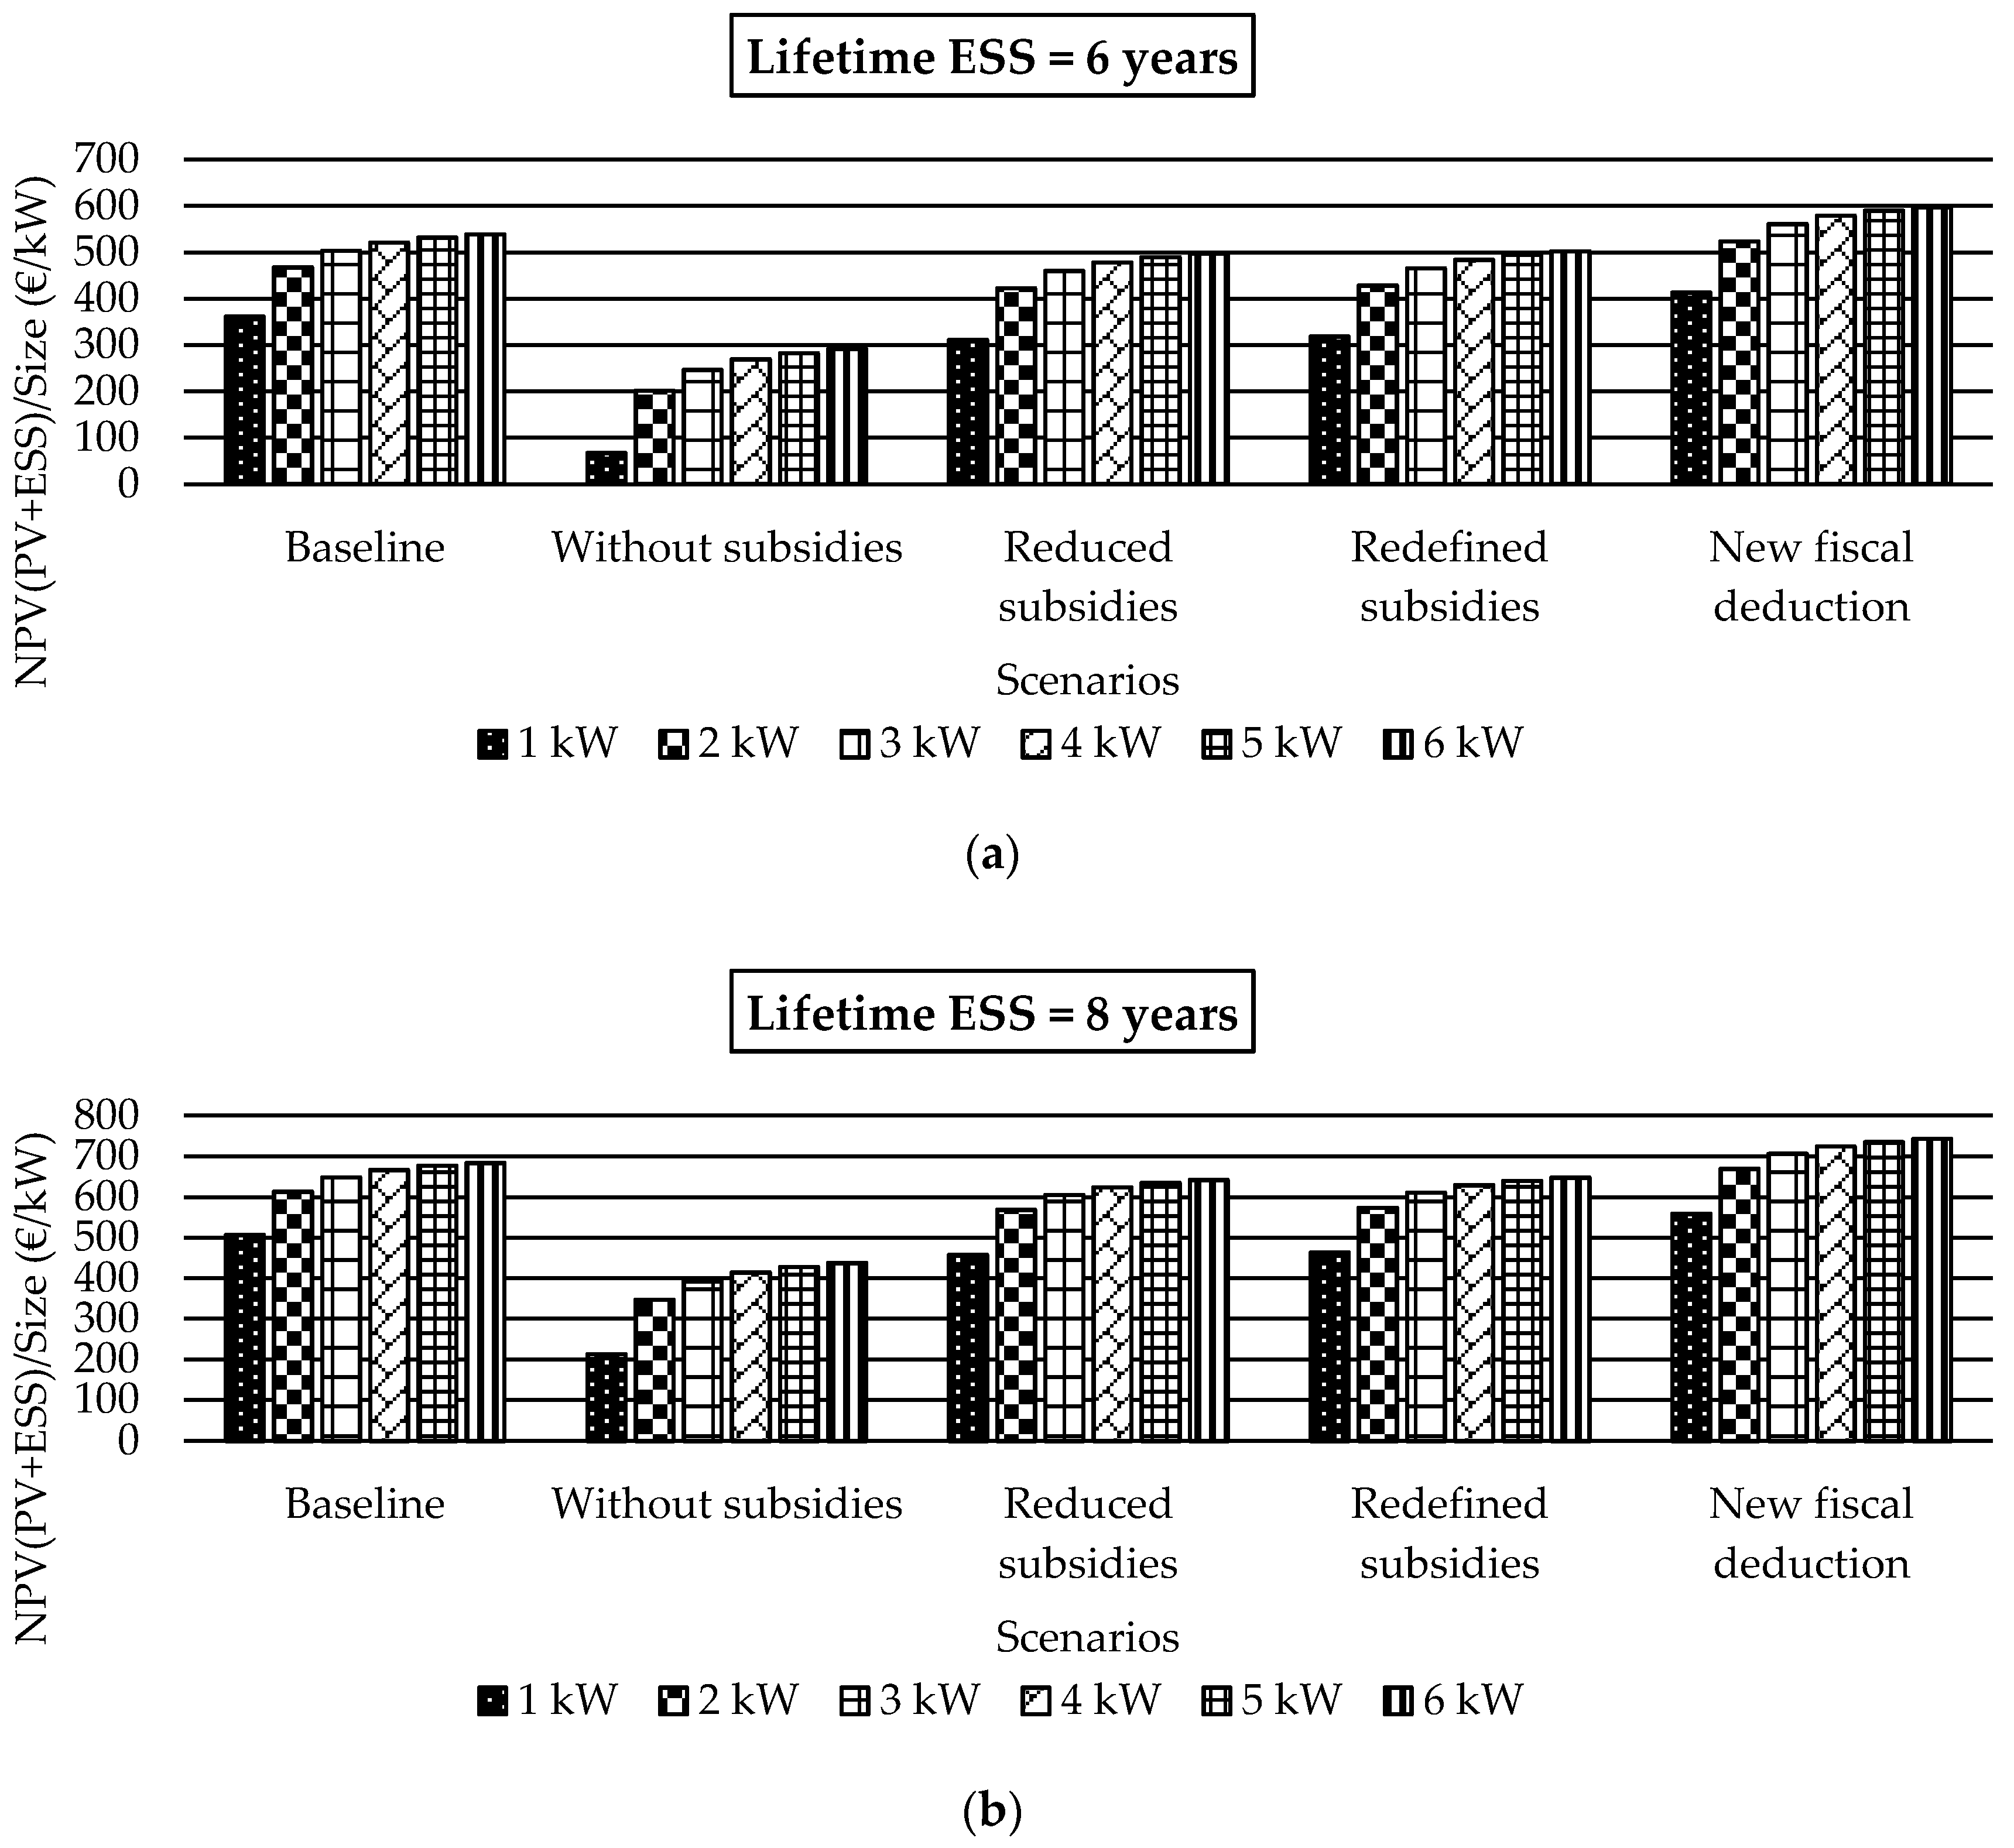
The last step of this work is represented by a comparison of NPV/Size among five scenarios examined. Considering a specific case study (battery capacity double than PV size with an increase of self-consumption of 40%), the best performances are reached with a “new fiscal deduction” scenario for all sizes proposed—Figure 5a,b. The maximum values, in terms of NPV/Size considering a lifetime ESS of six years, are equal to 413, 524, 561, 579, 590, and 598 €/kW in 1, 2, 3, 4, 5, and 6 kW plants, respectively. While, they are equal to 558, 669, 706, 724, 735 and 743 €/kW in 1, 2, 3, 4, 5 and 6 kW plants, respectively, with a lifetime ESS of eight years. Basically, these values are greater than 52–59 €/kW than the ones registered in “baseline” scenarios considering a ratio B/S of 2.0. However, this difference is present also in other case studies with different values of B/S varying from 56 to 71 €/kW.
The analysis of results highlights from one side that the “new fiscal deduction” scenario has a NPV(PV + ESS) that is greater than the “baseline” ones, but there is an opposite situation when is considered the number of case studies, in which is a more convenient a PV-integrated battery systems than only PV one. The motivation can be explained by examples. From one side, NPV(PV + ESS) is equal to 1047 € and 935 € in “new fiscal deduction”, and “baseline” scenarios, respectively, considering a 4 kWh ESS integrated to a 2 kW PV plant with NB = 6 y and Δwself,c = 40% (see Table 4 and Table 9). From the other side, NPV(PV) is 1060 € and 869 €, respectively, when is evaluated that a 2 kW PV plant with wself,c = 30%. The same result can be underlined also when it is considered that a 6 kWh ESS integrated to a 3 kW PV plant, in which NPV(PV + ESS) are equal to 1682 € and 1510 € in “new fiscal deduction” and “baseline” scenarios, respectively, while NPV(PV) is 1715 € and 1429 €, respectively (see Table 4 and Table 9). Four of the five scenarios present the same financial result of the PV plant, while “new fiscal deduction” one has a time of deduction of five years for PV investments (as an alternative of 10 years). In this way, it has changed the reference value used to compare a PV project with a PV-integrated battery system one. This value is greater, as proposed in Table 8.
5. Conclusions
The growth of installed PV power in the last years all over the world is the better response to the detractors who have assigned a marginal role to this renewable source. In fact, certainly the subsidies have favored the development of this sector, but there are great opportunities linked to its use. PV source plays a key-role in the recent sustainability challenges. The use of public funds requires a careful analysis, and in this work has not investigated if the benefits of the development of storage that are greater than these monetary resources. However, several countries have favored the application of PV-integrated battery systems with the principle of the national energy policy based on the diffusion of decentralized energy systems. In fact, ESS are able to minimize, and in the best cases, to delete the dependence by the grid. Lead-acid technology is considered in this work, but also lithium-ion one is extremely interesting.
Two typologies of investments are evaluated by decision-makers. The first, concerns the realization of a PV plant. NPV/Size varies from 310 to 476 €/kW in residential systems. With a self-consumption of 30%. An increase of 10% of this variable gives an increase of NPV/Size equal to 226–274 €/kW. The profitability of PV plants from 1 kW to 6 kW is confirmed also by BEP analysis, in terms of self-consumption, that varies from 11% to 16%. The second, regards lead acid batteries when combined with PV panels. NPV/Size varies from 320 to 797 €/kW in the function of several variables as capacity batteries, the lifetime ESS, and the increase of self-consumption. BEP analysis, in terms of increase of self-consumption, varies from 21% to 39%.
Alternative scenarios confirm that the profitability of PV-integrated battery system is strictly linked to two variables: (i) a substantial increase of self-consumption that is typically verified with larger sizes of battery; and, (ii) the presence of subsidies, represented by both 50% fiscal deduction and funds non-repayable of up to 50% of the investment costs. The “fiscal deduction” scenario defines also the opportunity to support the PV energy expansion policy in the residential sector through two measures: (i) 50% fiscal deduction, as an alternative to 36%; and, (ii) a time of deduction of five years, as an alternative of 10 years.
The reduction of emissions, economic opportunities for consumers, and the reduction of foreign imports are valid elements to support the re-start of the PV sector in a mature market, as an Italian one. In fact, the main aim of a sustainable society is to provide electricity produced by renewable resources to future generations.
Supplementary Materials
The following are available online at www.mdpi.com/1996-1073/10/9/1434/s1.
Author Contributions
The authors contributed equally to this work.
Conflicts of Interest
The authors declare no conflict of interest.
References
- Zhou, N.; Liu, N.; Zhang, J.; Lei, J. Multi-Objective Optimal Sizing for Battery Storage of PV-Based Microgrid with Demand Response. Energies 2016, 9, 591. [Google Scholar] [CrossRef]
- Kumar Sahu, B. A study on global solar PV energy developments and policies with special focus on the top ten solar PV power producing countries. Renew. Sustain. Energy Rev. 2015, 43, 621–634. [Google Scholar] [CrossRef]
- Cucchiella, F.; D’Adamo, I.; Gastaldi, M. Economic Analysis of a Photovoltaic System: A Resource for Residential Households. Energies 2017, 10, 814. [Google Scholar] [CrossRef]
- Rodrigues, S.; Chen, X.; Morgado-Dias, F. Economic analysis of photovoltaic systems for the residential market under China’s new regulation. Energy Policy 2017, 101, 467–472. [Google Scholar] [CrossRef]
- Koumparou, I.; Christoforidis, G.C.; Efthymiou, V.; Papagiannis, G.K.; Georghiou, G.E. Configuring residential PV net-metering policies—A focus on the Mediterranean region. Renew. Energy 2017, 113, 795–812. [Google Scholar] [CrossRef]
- Pinto, R.; Mariano, S.; Calado, M.; de Souza, J. Impact of Rural Grid-Connected Photovoltaic Generation Systems on Power Quality. Energies 2016, 9, 739. [Google Scholar] [CrossRef]
- De Oliveira e Silva, G.; Hendrick, P. Pumped hydro energy storage in buildings. Appl. Energy 2016, 179, 1242–1250. [Google Scholar] [CrossRef]
- Battke, B.; Schmidt, T.S.; Grosspietsch, D.; Hoffmann, V.H. A review and probabilistic model of lifecycle costs of stationary batteries in multiple applications. Renew. Sustain. Energy Rev. 2013, 25, 240–250. [Google Scholar] [CrossRef]
- De Oliveira e Silva, G.; Hendrick, P. Lead-acid batteries coupled with photovoltaics for increased electricity self-sufficiency in households. Appl. Energy 2016, 178, 856–867. [Google Scholar] [CrossRef]
- Mariaud, A.; Acha, S.; Ekins-Daukes, N.; Shah, N.; Markides, C.N. Integrated optimisation of photovoltaic and battery storage systems for UK commercial buildings. Appl. Energy 2017, 199, 466–478. [Google Scholar] [CrossRef]
- Lai, C.S.; Jia, Y.; Lai, L.L.; Xu, Z.; McCulloch, M.D.; Wong, K.P. A comprehensive review on large-scale photovoltaic system with applications of electrical energy storage. Renew. Sustain. Energy Rev. 2017, 78, 439–451. [Google Scholar] [CrossRef]
- Diouf, B.; Pode, R. Potential of lithium-ion batteries in renewable energy. Renew. Energy 2015, 76, 375–380. [Google Scholar] [CrossRef]
- De Oliveira e Silva, G.; Hendrick, P. Photovoltaic self-sufficiency of Belgian households using lithium-ion batteries, and its impact on the grid. Appl. Energy 2017, 195, 786–799. [Google Scholar] [CrossRef]
- Kaschub, T.; Jochem, P.; Fichtner, W. Solar energy storage in German households: Profitability, load changes and flexibility. Energy Policy 2016, 98, 520–532. [Google Scholar] [CrossRef]
- Khalilpour, K.R.; Vassallo, A. Technoeconomic parametric analysis of PV-battery systems. Renew. Energy 2016, 97, 757–768. [Google Scholar] [CrossRef]
- Cucchiella, F.; D’Adamo, I.; Gastaldi, M. Photovoltaic energy systems with battery storage for residential areas: An economic analysis. J. Clean. Prod. 2016, 131, 460–474. [Google Scholar] [CrossRef]
- Akter, M.N.; Mahmud, M.A.; Oo, A.M.T. Comprehensive economic evaluations of a residential building with solar photovoltaic and battery energy storage systems: An Australian case study. Energy Build. 2017, 138, 332–346. [Google Scholar] [CrossRef]
- Goebel, C.; Cheng, V.; Jacobsen, H.-A. Profitability of Residential Battery Energy Storage Combined with Solar Photovoltaics. Energies 2017, 10, 976. [Google Scholar] [CrossRef]
- Vieira, F.M.; Moura, P.S.; de Almeida, A.T. Energy storage system for self-consumption of photovoltaic energy in residential zero energy buildings. Renew. Energy 2017, 103, 308–320. [Google Scholar] [CrossRef]
- Luthander, R.; Widén, J.; Nilsson, D.; Palm, J. Photovoltaic self-consumption in buildings: A review. Appl. Energy 2015, 142, 80–94. [Google Scholar] [CrossRef]
- Nyholm, E.; Goop, J.; Odenberger, M.; Johnsson, F. Solar photovoltaic-battery systems in Swedish households—Self-consumption and self-sufficiency. Appl. Energy 2016, 183, 148–159. [Google Scholar] [CrossRef]
- Hesse, H.; Martins, R.; Musilek, P.; Naumann, M.; Truong, C.; Jossen, A. Economic Optimization of Component Sizing for Residential Battery Storage Systems. Energies 2017, 10, 835. [Google Scholar] [CrossRef]
- Lai, C.S.; McCulloch, M.D. Levelized cost of electricity for solar photovoltaic and electrical energy storage. Appl. Energy 2017, 190, 191–203. [Google Scholar] [CrossRef]
- Beck, T.; Kondziella, H.; Huard, G.; Bruckner, T. Optimal operation, configuration and sizing of generation and storage technologies for residential heat pump systems in the spotlight of self-consumption of photovoltaic electricity. Appl. Energy 2017, 188, 604–619. [Google Scholar] [CrossRef]
- Han, X.; Zhang, H.; Yu, X.; Wang, L. Economic evaluation of grid-connected micro-grid system with photovoltaic and energy storage under different investment and financing models. Appl. Energy 2016, 184, 103–118. [Google Scholar] [CrossRef]
- Peters, J.F.; Baumann, M.; Zimmermann, B.; Braun, J.; Weil, M. The environmental impact of Li-Ion batteries and the role of key parameters—A review. Renew. Sustain. Energy Rev. 2017, 67, 491–506. [Google Scholar] [CrossRef]
- Rodrigues, S.; Torabikalaki, R.; Faria, F.; Cafôfo, N.; Chen, X.; Ivaki, A.R.; Mata-Lima, H.; Morgado-Dias, F. Economic feasibility analysis of small scale PV systems in different countries. Sol. Energy 2016, 131, 81–95. [Google Scholar] [CrossRef]
- Oh, J.; Koo, C.; Hong, T.; Jeong, K.; Lee, M. An economic impact analysis of residential progressive electricity tariffs in implementing the building-integrated photovoltaic blind using an advanced finite element model. Appl. Energy 2017, 202, 259–274. [Google Scholar] [CrossRef]
- Orioli, A.; Franzitta, V.; Di Gangi, A.; Foresta, F. The Recent Change in the Italian Policies for Photovoltaics: Effects on the Energy Demand Coverage of Grid-Connected PV Systems Installed in Urban Contexts. Energies 2016, 9, 944. [Google Scholar] [CrossRef]
- Rodrigues, S.; Faria, F.; Ivaki, A.; Cafôfo, N.; Chen, X.; Mata-Lima, H.; Morgado-Dias, F. Tesla Powerwall: Analysis of its use in Portugal and United States. Int. J. Power Energy Syst. 2016, 36, 37–43. [Google Scholar] [CrossRef]
- Chiaroni, D.; Chiesa, V.; Colasanti, L.; Cucchiella, F.; D’Adamo, I.; Frattini, F. Evaluating solar energy profitability: A focus on the role of self-consumption. Energy Convers. Manag. 2014, 88, 317–331. [Google Scholar] [CrossRef]
- Christoforidis, G.; Panapakidis, I.; Papadopoulos, T.; Papagiannis, G.; Koumparou, I.; Hadjipanayi, M.; Georghiou, G. A Model for the Assessment of Different Net-Metering Policies. Energies 2016, 9, 262. [Google Scholar] [CrossRef]
- Cucchiella, F.; D’Adamo, I.; Koh, L.S.C. Environmental and economic analysis of building integrated photovoltaic systems in Italian regions. J. Clean. Prod. 2015, 98, 241–252. [Google Scholar] [CrossRef]
- Branker, K.; Pathak, M.J.M.; Pearce, J.M. A review of solar photovoltaic levelized cost of electricity. Renew. Sustain. Energy Rev. 2011, 15, 4470–4482. [Google Scholar] [CrossRef]
- Campos, P.; Troncoso, L.; Lund, P.D.; Cuevas, C.; Fissore, A.; Garcia, R. Potential of distributed photovoltaics in urban Chile. Sol. Energy 2016, 135, 43–49. [Google Scholar] [CrossRef]
- Squatrito, R.; Sgroi, F.; Tudisca, S.; Trapani, A.; Testa, R. Post Feed-in Scheme Photovoltaic System Feasibility Evaluation in Italy: Sicilian Case Studies. Energies 2014, 7, 7147. [Google Scholar] [CrossRef]
- Ramli, M.A.M.; Hiendro, A.; Sedraoui, K.; Twaha, S. Optimal sizing of grid-connected photovoltaic energy system in Saudi Arabia. Renew. Energy 2015, 75, 489–495. [Google Scholar] [CrossRef]
- Shezan, S.A.; Julai, S.; Kibria, M.A.; Ullah, K.R.; Saidur, R.; Chong, W.T.; Akikur, R.K. Performance analysis of an off-grid wind-PV (photovoltaic)-diesel-battery hybrid energy system feasible for remote areas. J. Clean. Prod. 2016, 125, 121–132. [Google Scholar] [CrossRef]
- Cucchiella, F.; D’Adamo, I.; Gastaldi, M. A profitability assessment of small-scale photovoltaic systems in an electricity market without subsidies. Energy Convers. Manag. 2016, 129, 62–74. [Google Scholar] [CrossRef]
- Hoppmann, J.; Volland, J.; Schmidt, T.S.; Hoffmann, V.H. The economic viability of battery storage for residential solar photovoltaic systems—A review and a simulation model. Renew. Sustain. Energy Rev. 2014, 39, 1101–1118. [Google Scholar] [CrossRef]
- Bortolini, M.; Gamberi, M.; Graziani, A. Technical and economic design of photovoltaic and battery energy storage system. Energy Convers. Manag. 2014, 86, 81–92. [Google Scholar] [CrossRef]
- Almeida Dávi, G.; López de Asiain, J.; Solano, J.; Caamaño-Martín, E.; Bedoya, C. Energy Refurbishment of an Office Building with Hybrid Photovoltaic System and Demand-Side Management. Energies 2017, 10, 1117. [Google Scholar] [CrossRef]
- Yu, H.; Duan, J.; Du, W.; Xue, S.; Sun, J. China’s energy storage industry: Develop status, existing problems and countermeasures. Renew. Sustain. Energy Rev. 2017, 71, 767–784. [Google Scholar] [CrossRef]
- Ramirez Camargo, L.; Franco, J.; Sarmiento Babieri, N.; Belmonte, S.; Escalante, K.; Pagany, R.; Dorner, W. Technical, Economical and Social Assessment of Photovoltaics in the Frame of the Net-Metering Law for the Province of Salta, Argentina. Energies 2016, 9, 133. [Google Scholar] [CrossRef]
- Bayod-R, A.A.; Burgio, A.; Leonowicz, Z.; Menniti, D.; Pinnarelli, A.; Sorrentino, N. Recent Developments of Photovoltaics Integrated with Battery Storage Systems and Related Feed-In Tariff Policies: A Review. Int. J. Photoenergy 2017, 2017, 12. [Google Scholar]
- Brusco, G.; Burgio, A.; Menniti, D.; Pinnarelli, A.; Sorrentino, N. The economic viability of a feed-in tariff scheme that solely rewards self-consumption to promote the use of integrated photovoltaic battery systems. Appl. Energy 2016, 183, 1075–1085. [Google Scholar] [CrossRef]
- Pyrgou, A.; Kylili, A.; Fokaides, P.A. The future of the Feed-in Tariff (FiT) scheme in Europe: The case of photovoltaics. Energy Policy 2016, 95, 94–102. [Google Scholar] [CrossRef]
- Ramírez, F.J.; Honrubia-Escribano, A.; Gómez-Lázaro, E.; Pham, D.T. Combining feed-in tariffs and net-metering schemes to balance development in adoption of photovoltaic energy: Comparative economic assessment and policy implications for European countries. Energy Policy 2017, 102, 440–452. [Google Scholar] [CrossRef]
Figure 1.
Decision-making process.

Figure 2.
Net Present Value (PV)/Size (€/kW).

Figure 3.
Net Present Value (PV + ESS)/Size (€/kW) with B/S equal to 2.0. (a) is expressed in €/kW with B/S equal to 2.0 and lifetime EES equal to six years; (b) is expressed in €/kW with B/S equal to 2.0 and lifetime EES equal to 8 years.
Figure 3.
Net Present Value (PV + ESS)/Size (€/kW) with B/S equal to 2.0. (a) is expressed in €/kW with B/S equal to 2.0 and lifetime EES equal to six years; (b) is expressed in €/kW with B/S equal to 2.0 and lifetime EES equal to 8 years.


Figure 4.
BEP analysis for PV-integrated battery systems (%). (a) is expressed in % with a lifetime EES equal to eight years; (b) is expressed in % with lifetime EES equal to 8 years.
Figure 4.
BEP analysis for PV-integrated battery systems (%). (a) is expressed in % with a lifetime EES equal to eight years; (b) is expressed in % with lifetime EES equal to 8 years.

Figure 5.
Net Present Value (PV + ESS)/Size (€/kW) with B/S equal to 2.0 and Δwself,c of 40%. (a) lifetime EES equal to 6 years; (b) lifetime EES equal to 8 years.
Figure 5.
Net Present Value (PV + ESS)/Size (€/kW) with B/S equal to 2.0 and Δwself,c of 40%. (a) lifetime EES equal to 6 years; (b) lifetime EES equal to 8 years.


| Acronym | Variable | Value |
|---|---|---|
| Acell | active surface | 7 m2/kWp |
| B | battery storage capacity | function of B/S |
| Cb,u | specific battery cost (bos) | 155 €/kWh |
| Cb-e,u | specific battery cost (energy) | 155 €/kW |
| Cb-p,u | specific battery cost (power) | 70 €/kW |
| Ceng | engineering cost | 165 € |
| Ci,u | specific inverter cost | 170 €/kW |
| Cinv | total investment cost of ESS | € |
| Clcs | loan capital share cost | € |
| Cm,u | specific maintenance cost | 22 €/kW |
| Crb | replacement battery cost | € |
| DCI | discounted cash inflows | € |
| DCO | discounted cash outflows | € |
| dEf | decreased efficiency of a system | 0.7% |
| EOut | energy output of the system | kWh |
| inf | rate of inflation | 2% |
| kf | optimum angle of tilt | 1.13 |
| N | lifetime of a PV system | 20 y |
| NB | lifetime of an ESS | 6–8 y |
| Ndebt | period of loan | 5 y |
| NTaxD | period of tax deduction | 10 y |
| ηbos | balance of system(bos) efficiency | 85% |
| ηf | number of PV modules to be installed | function of S |
| ηm | module efficiency | 16% |
| electricity purchase price | 19 cent €/kWh | |
| Pf | nominal power of a PV module | function of S |
| r | opportunity cost of capital | 5% |
| rd | interest rate on a loan | 4% |
| S | size of a PV system | 1-2-3-4-5-6 kW |
| t | single period | y |
| TaxDu-br | specific tax deduction (baseline rate) | 50% |
| TaxDu-sr | specific tax deduction (subsidized rate) | 36% |
| tr | average annual insolation | 1350 kWh/(m2 × y) |
| share of self-consumption | 30% | |
| increase of self-consumption | 10–45% |
Table 2.
Net Present Value (€) of residential Net Present Value (PV) systems in function of self-consumption.
Table 2.
Net Present Value (€) of residential Net Present Value (PV) systems in function of self-consumption.
| Self−Consumption | Plant Size | |||||
|---|---|---|---|---|---|---|
| 1 kW | 2 kW | 3 kW | 4 kW | 5 kW | 6 kW | |
| 0% | −371 | −491 | −1054 | −1342 | −1615 | −1889 |
| 10% | −144 | −38 | −69 | −370 | −400 | −430 |
| 20% | 83 | 416 | 749 | 602 | 815 | 1028 |
| 30% | 310 | 869 | 1429 | 1799 | 2030 | 2486 |
| 35% | 423 | 1096 | 1769 | 2413 | 2668 | 3215 |
| 40% | 536 | 1323 | 2109 | 2895 | 3391 | 3944 |
| 45% | 650 | 1549 | 2449 | 3349 | 4110 | 4734 |
| 50% | 763 | 1776 | 2789 | 3802 | 4815 | 5583 |
| 55% | 876 | 2003 | 3129 | 4256 | 5382 | 6424 |
| 60% | 990 | 2230 | 3469 | 4709 | 5949 | 7189 |
| 65% | 1103 | 2456 | 3809 | 5163 | 6516 | 7869 |
| 70% | 1217 | 2683 | 4150 | 5616 | 7083 | 8549 |
| 75% | 1330 | 2910 | 4490 | 6069 | 7649 | 9229 |
| 80% | 1443 | 3136 | 4830 | 6523 | 8216 | 9909 |
| 85% | 1557 | 3363 | 5170 | 6976 | 8783 | 10,590 |
| 90% | 1679 | 3607 | 5536 | 7465 | 9394 | 11,322 |
| 95% | 1825 | 3900 | 5975 | 8050 | 10,126 | 12,201 |
| 100% | 2000 | 4250 | 6501 | 8751 | 11,001 | 13,251 |
NPV(PV) > 0 is denoted in bolds.
Table 3.
Net Present Value (€) of ESSs.
| NB | 1 kW | 2 kW | 3 kW | 4 kW | 5 kW | 6 kW | ||||||
|---|---|---|---|---|---|---|---|---|---|---|---|---|
| 6 y | 8 y | 6 y | 8 y | 6 y | 8 y | 6 y | 8 y | 6 y | 8 y | 6 y | 8 y | |
| Δwself,c | ESS = 0.5 kWh | ESS = 1.0 kWh | ESS = 1.5 kWh | ESS = 2.0 kWh | ESS = 2.5 kWh | ESS = 3.0 kWh | ||||||
| 10% | −411 | −329 | −857 | −693 | −1305 | −1058 | −1563 | −1234 | −1971 | −1561 | −2548 | −2055 |
| 15% | −297 | −215 | −631 | −467 | −965 | −718 | −1109 | −780 | −1252 | −842 | −1758 | −1265 |
| 20% | −184 | −102 | −404 | −240 | −625 | −378 | −656 | −327 | −547 | −137 | −909 | −416 |
| ESS = 1.0 kWh | ESS = 2.0 kWh | ESS = 3.0 kWh | ESS = 4.0 kWh | ESS = 5.0 kWh | ESS = 6.0 kWh | |||||||
| 15% | −370 | −267 | −777 | −570 | −1183 | −874 | −1400 | −987 | −1617 | −1101 | −2195 | −1576 |
| 20% | −257 | −154 | −550 | −343 | −843 | −534 | −947 | −534 | −912 | −396 | −1346 | −727 |
| 25% | −144 | −41 | −323 | −116 | −503 | −194 | −493 | −80 | −345 | 171 | −505 | 114 |
| ESS = 1.5 kWh | ESS = 3.0 kWh | ESS = 4.5 kWh | ESS = 6.0 kWh | ESS = 7.5 kWh | ESS = 9.0 kWh | |||||||
| 25% | −217 | −93 | −468 | −220 | −722 | −349 | −784 | −287 | −709 | −87 | −942 | −197 |
| 30% | −103 | 21 | −241 | 7 | −382 | −9 | −331 | 166 | −142 | 480 | −177 | 568 |
| 35% | 10 | 134 | −15 | 233 | −42 | 331 | 123 | 620 | 425 | 1047 | 503 | 1248 |
| ESS = 2.0 kWh | ESS = 4.0 kWh | ESS = 6.0 kWh | ESS = 8.0 kWh | ESS = 10.0 kWh | ESS = 12.0 kWh | |||||||
| 35% | −63 | 82 | −161 | 130 | −260 | 176 | −169 | 413 | 61 | 788 | 66 | 938 |
| 40% | 51 | 196 | 66 | 357 | 81 | 517 | 284 | 866 | 628 | 1355 | 746 | 1618 |
| 45% | 164 | 309 | 293 | 584 | 421 | 857 | 737 | 1319 | 1194 | 1921 | 1426 | 2298 |
NPV(ESS) > 0 is denoted in bold.
Table 4.
Net Present Value (€) of integrated PV-battery systems.
| NB | 1 kW | 2 kW | 3 kW | 4 kW | 5 kW | 6 kW | ||||||
|---|---|---|---|---|---|---|---|---|---|---|---|---|
| 6 y | 8 y | 6 y | 8 y | 6 y | 8 y | 6 y | 8 y | 6 y | 8 y | 6 y | 8 y | |
| Δwself,c | ESS = 0.5 kWh | ESS = 1.0 kWh | ESS = 1.5 kWh | ESS = 2.0 kWh | ESS = 2.5 kWh | ESS = 3.0 kWh | ||||||
| 10% | −101 | −19 | 12 | 176 | 124 | 371 | 236 | 565 | 59 | 469 | −62 | 431 |
| 15% | 13 | 95 | 238 | 402 | 464 | 711 | 690 | 1019 | 778 | 1188 | 728 | 1221 |
| 20% | 126 | 208 | 465 | 629 | 804 | 1051 | 1143 | 1472 | 1483 | 1893 | 1577 | 2070 |
| ESS = 1.0 kWh | ESS = 2.0 kWh | ESS = 3.0 kWh | ESS = 4.0 kWh | ESS = 5.0 kWh | ESS = 6.0 kWh | |||||||
| 15% | −60 | 43 | 92 | 299 | 246 | 555 | 399 | 812 | 413 | 929 | 291 | 910 |
| 20% | 53 | 156 | 319 | 526 | 586 | 895 | 852 | 1265 | 1118 | 1634 | 1140 | 1759 |
| 25% | 166 | 269 | 546 | 753 | 926 | 1235 | 1306 | 1719 | 1685 | 2201 | 1981 | 2600 |
| ESS = 1.5 kWh | ESS = 3.0 kWh | ESS = 4.5 kWh | ESS = 6.0 kWh | ESS = 7.5 kWh | ESS = 9.0 kWh | |||||||
| 25% | 93 | 217 | 401 | 649 | 707 | 1080 | 1015 | 1512 | 1321 | 1943 | 1544 | 2289 |
| 30% | 207 | 331 | 628 | 876 | 1047 | 1420 | 1468 | 1965 | 1888 | 2510 | 2309 | 3054 |
| 35% | 320 | 444 | 854 | 1102 | 1387 | 1760 | 1922 | 2419 | 2455 | 3077 | 2989 | 3734 |
| ESS = 2.0 kWh | ESS = 4.0 kWh | ESS = 6.0 kWh | ESS = 8.0 kWh | ESS = 10.0 kWh | ESS = 12.0 kWh | |||||||
| 35% | 247 | 392 | 708 | 999 | 1169 | 1605 | 1630 | 2212 | 2091 | 2818 | 2552 | 3424 |
| 40% | 361 | 506 | 935 | 1226 | 1510 | 1946 | 2083 | 2665 | 2658 | 3385 | 3232 | 4104 |
| 45% | 474 | 619 | 1162 | 1453 | 1850 | 2286 | 2536 | 3118 | 3224 | 3951 | 3912 | 4784 |
| NPV(PV) 310 | 869 | 1429 | 1799 | 2030 | 2486 | |||||||
NPV(PV + ESS) > 0 is denoted in bold; NPV(PV + ESS) > NPV(PV) is denoted by a grey color.
Table 5.
Net Present Value (€) of integrated PV-battery systems without regional subsidies.
| NB | 1 kW | 2 kW | 3 kW | 4 kW | 5 kW | 6 kW | ||||||
|---|---|---|---|---|---|---|---|---|---|---|---|---|
| 6 y | 8 y | 6 y | 8 y | 6 y | 8 y | 6 y | 8 y | 6 y | 8 y | 6 y | 8 y | |
| Δwself,c | ESS = 0.5 kWh | ESS = 1.0 kWh | ESS = 1.5 kWh | ESS = 2.0 kWh | ESS = 2.5 kWh | ESS = 3.0 kWh | ||||||
| 10% | −317 | −235 | −363 | −199 | −410 | −164 | −458 | −129 | −795 | 16 | −1075 | −582 |
| 15% | −203 | −121 | −137 | 27 | −70 | 176 | −4 | 325 | −76 | 735 | −285 | 208 |
| 20% | −90 | −8 | 90 | 254 | 270 | 516 | 449 | 778 | 629 | 1440 | 564 | 1057 |
| ESS = 1.0 kWh | ESS = 2.0 kWh | ESS = 3.0 kWh | ESS = 4.0 kWh | ESS = 5.0 kWh | ESS = 6.0 kWh | |||||||
| 15% | −302 | −276 | −335 | −284 | −367 | −291 | −400 | −298 | −571 | −55 | −879 | −260 |
| 20% | −189 | −163 | −108 | −57 | −27 | 49 | 53 | 155 | 134 | 650 | −30 | 589 |
| 25% | −76 | −50 | 119 | 170 | 313 | 389 | 507 | 609 | 701 | 1217 | 811 | 1430 |
| ESS = 1.5 kWh | ESS = 3.0 kWh | ESS = 4.5 kWh | ESS = 6.0 kWh | ESS = 7.5 kWh | ESS = 9.0 kWh | |||||||
| 25% | −175 | −50 | −79 | 170 | 16 | 389 | 112 | 609 | 206 | 828 | 217 | 962 |
| 30% | −61 | 64 | 148 | 397 | 356 | 729 | 565 | 1062 | 773 | 1395 | 982 | 1727 |
| 35% | 52 | 177 | 374 | 623 | 696 | 1069 | 1019 | 1516 | 1340 | 1962 | 1662 | 2407 |
| ESS = 2.0 kWh | ESS = 4.0 kWh | ESS = 6.0 kWh | ESS = 8.0 kWh | ESS = 10.0 kWh | ESS = 12.0 kWh | |||||||
| 35% | −47 | 99 | 176 | 467 | 399 | 835 | 623 | 1204 | 845 | 1572 | 1068 | 1940 |
| 40% | 67 | 213 | 403 | 694 | 740 | 1176 | 1076 | 1657 | 1412 | 2139 | 1748 | 2620 |
| 45% | 180 | 326 | 630 | 921 | 1080 | 1516 | 1529 | 2110 | 1978 | 2705 | 2428 | 3300 |
| NPV(PV) 310 | 869 | 1429 | 1799 | 2030 | 2486 | |||||||
NPV(PV + ESS) > 0 is denoted in bolds; NPV(PV + ESS) > NPV(PV) is denoted by a grey color.
Table 6.
Net Present Value (€) of integrated PV-battery systems with reduced regional subsidies.
| NB | 1 kW | 2 kW | 3 kW | 4 kW | 5 kW | 6 kW | ||||||
|---|---|---|---|---|---|---|---|---|---|---|---|---|
| 6 y | 8 y | 6 y | 8 y | 6 y | 8 y | 6 y | 8 y | 6 y | 8 y | 6 y | 8 y | |
| Δwself,c | ESS = 0.5 kWh | ESS = 1.0 kWh | ESS = 1.5 kWh | ESS = 2.0 kWh | ESS = 2.5 kWh | ESS = 3.0 kWh | ||||||
| 10% | −138 | −56 | −52 | 113 | 34 | 280 | 119 | 448 | −86 | 325 | −233 | 259 |
| 15% | −24 | 58 | 174 | 339 | 374 | 620 | 573 | 902 | 633 | 1044 | 557 | 1049 |
| 20% | 89 | 171 | 401 | 566 | 714 | 960 | 1026 | 1355 | 1338 | 1749 | 1406 | 1898 |
| ESS = 1.0 kWh | ESS = 2.0 kWh | ESS = 3.0 kWh | ESS = 4.0 kWh | ESS = 5.0 kWh | ESS = 6.0 kWh | |||||||
| 15% | −101 | 2 | 20 | 226 | 142 | 452 | 264 | 677 | 247 | 763 | 93 | 712 |
| 20% | 12 | 115 | 247 | 453 | 482 | 792 | 717 | 1130 | 952 | 1468 | 942 | 1561 |
| 25% | 125 | 228 | 474 | 680 | 822 | 1132 | 1171 | 1584 | 1519 | 2035 | 1783 | 2402 |
| ESS = 1.5 kWh | ESS = 3.0 kWh | ESS = 4.5 kWh | ESS = 6.0 kWh | ESS = 7.5 kWh | ESS = 9.0 kWh | |||||||
| 25% | 48 | 172 | 319 | 568 | 590 | 963 | 862 | 1359 | 1133 | 1754 | 1320 | 2065 |
| 30% | 162 | 286 | 546 | 795 | 930 | 1303 | 1315 | 1812 | 1700 | 2321 | 2085 | 2830 |
| 35% | 275 | 399 | 772 | 1021 | 1270 | 1643 | 1769 | 2266 | 2267 | 2888 | 2765 | 3510 |
| ESS = 2.0 kWh | ESS = 4.0 kWh | ESS = 6.0 kWh | ESS = 8.0 kWh | ESS = 10.0 kWh | ESS = 12.0 kWh | |||||||
| 35% | 197 | 343 | 618 | 909 | 1039 | 1474 | 1460 | 2041 | 1881 | 2607 | 2301 | 3173 |
| 40% | 311 | 457 | 845 | 1136 | 1380 | 1815 | 1913 | 2494 | 2448 | 3174 | 2981 | 3853 |
| 45% | 424 | 570 | 1072 | 1363 | 1720 | 2155 | 2366 | 2947 | 3014 | 3740 | 3661 | 4533 |
| NPV(PV) 310 | 869 | 1429 | 1799 | 2030 | 2486 | |||||||
NPV(PV + ESS) > 0 is denoted in bold; NPV(PV + ESS) > NPV(PV) is denoted by a grey color.
Table 7.
Net Present Value (€) of integrated PV-battery systems with redefined regional subsidies.
| NB | 1 kW | 2 kW | 3 kW | 4 kW | 5 kW | 6 kW | ||||||
|---|---|---|---|---|---|---|---|---|---|---|---|---|
| 6 y | 8 y | 6 y | 8 y | 6 y | 8 y | 6 y | 8 y | 6 y | 8 y | 6 y | 8 y | |
| Δwself,c | ESS = 0.5 kWh | ESS = 1.0 kWh | ESS = 1.5 kWh | ESS = 2.0 kWh | ESS = 2.5 kWh | ESS = 3.0 kWh | ||||||
| 10% | −133 | −51 | −44 | 121 | 45 | 291 | 134 | 462 | −68 | 343 | −212 | 281 |
| 15% | −19 | 63 | 182 | 347 | 385 | 631 | 588 | 916 | 651 | 1062 | 578 | 1071 |
| 20% | 94 | 176 | 409 | 574 | 725 | 971 | 1041 | 1369 | 1356 | 1767 | 1427 | 1920 |
| ESS = 1.0 kWh | ESS = 2.0 kWh | ESS = 3.0 kWh | ESS = 4.0 kWh | ESS = 5.0 kWh | ESS = 6.0 kWh | |||||||
| 15% | −96 | 7 | 29 | 235 | 155 | 465 | 281 | 694 | 268 | 784 | 118 | 737 |
| 20% | 17 | 120 | 256 | 462 | 495 | 805 | 734 | 1147 | 973 | 1489 | 967 | 1586 |
| 25% | 130 | 233 | 483 | 689 | 835 | 1145 | 1188 | 1601 | 1540 | 2056 | 1808 | 2427 |
| ESS = 1.5 kWh | ESS = 3.0 kWh | ESS = 4.5 kWh | ESS = 6.0 kWh | ESS = 7.5 kWh | ESS = 9.0 kWh | |||||||
| 25% | 53 | 178 | 330 | 578 | 605 | 978 | 881 | 1378 | 1156 | 1778 | 1348 | 2093 |
| 30% | 167 | 292 | 557 | 805 | 945 | 1318 | 1334 | 1831 | 1723 | 2345 | 2113 | 2858 |
| 35% | 280 | 405 | 783 | 1031 | 1285 | 1658 | 1788 | 2285 | 2290 | 2912 | 2793 | 3538 |
| ESS = 2.0 kWh | ESS = 4.0 kWh | ESS = 6.0 kWh | ESS = 8.0 kWh | ESS = 10.0 kWh | ESS = 12.0 kWh | |||||||
| 35% | 204 | 349 | 629 | 920 | 1055 | 1491 | 1481 | 2063 | 1907 | 2633 | 2333 | 3204 |
| 40% | 318 | 463 | 856 | 1147 | 1396 | 1832 | 1934 | 2516 | 2474 | 3200 | 3013 | 3884 |
| 45% | 431 | 576 | 1083 | 1374 | 1736 | 2172 | 2387 | 2969 | 3040 | 3766 | 3693 | 4564 |
| NPV(PV) 310 | 869 | 1429 | 1799 | 2030 | 2486 | |||||||
NPV(PV + ESS) > 0 is denoted in bold; NPV(PV + ESS) > NPV(PV) is denoted by a grey colour.
Table 8.
Net Present Value (€) of residential PV systems with a new policy of fiscal deduction.
| Self-Consumption | Plant Size | |||||
|---|---|---|---|---|---|---|
| 1 kW | 2 kW | 3 kW | 4 kW | 5 kW | 6 kW | |
| 30% | 405 | 1060 | 1715 | 2180 | 2507 | 3058 |
| 35% | 518 | 1287 | 2055 | 2795 | 3144 | 3787 |
| 40% | 632 | 1513 | 2395 | 3277 | 3868 | 4516 |
| 45% | 745 | 1740 | 2735 | 3730 | 4587 | 5307 |
| 50% | 858 | 1967 | 3075 | 4184 | 5292 | 6155 |
| 55% | 972 | 2194 | 3415 | 4637 | 5859 | 6996 |
| 60% | 1085 | 2420 | 3755 | 5091 | 6426 | 7761 |
| 65% | 1199 | 2647 | 4096 | 5544 | 6993 | 8441 |
| 70% | 1312 | 2874 | 4436 | 5997 | 7559 | 9121 |
| 75% | 1425 | 3100 | 4776 | 6451 | 8126 | 9801 |
NPV(PV) > 0 is denoted in bolds.
Table 9.
Net Present Value (€) of integrated PV-battery systems with both redefined regional subsidies and a new policy of fiscal deduction.
Table 9.
Net Present Value (€) of integrated PV-battery systems with both redefined regional subsidies and a new policy of fiscal deduction.
| NB | 1 kW | 2 kW | 3 kW | 4 kW | 5 kW | 6 kW | ||||||
|---|---|---|---|---|---|---|---|---|---|---|---|---|
| 6 y | 8 y | 6 y | 8 y | 6 y | 8 y | 6 y | 8 y | 6 y | 8 y | 6 y | 8 y | |
| Δwself,c | ESS = 0.5 kWh | ESS = 1.0 kWh | ESS = 1.5 kWh | ESS = 2.0 kWh | ESS = 2.5 kWh | ESS = 3.0 kWh | ||||||
| 10% | −37 | 45 | 146 | 311 | 331 | 577 | 516 | 844 | 409 | 820 | 360 | 853 |
| 15% | 76 | 158 | 373 | 538 | 671 | 917 | 969 | 1297 | 1128 | 1539 | 1151 | 1644 |
| 20% | 189 | 271 | 600 | 765 | 1011 | 1257 | 1423 | 1751 | 1833 | 2244 | 1999 | 2492 |
| ESS = 1.0 kWh | ESS = 2.0 kWh | ESS = 3.0 kWh | ESS = 4.0 kWh | ESS = 5.0 kWh | ESS = 6.0 kWh | |||||||
| 15% | −1 | 102 | 220 | 426 | 441 | 751 | 662 | 1075 | 745 | 1261 | 691 | 1310 |
| 20% | 112 | 215 | 447 | 653 | 781 | 1091 | 1116 | 1529 | 1450 | 1966 | 1539 | 2158 |
| 25% | 226 | 329 | 674 | 880 | 1121 | 1431 | 1569 | 1982 | 2017 | 2533 | 2380 | 2999 |
| ESS = 1.5 kWh | ESS = 3.0 kWh | ESS = 4.5 kWh | ESS = 6.0 kWh | ESS = 7.5 kWh | ESS = 9.0 kWh | |||||||
| 25% | 149 | 274 | 521 | 769 | 891 | 1264 | 1262 | 1759 | 1633 | 2255 | 1920 | 2665 |
| 30% | 262 | 387 | 747 | 995 | 1231 | 1604 | 1716 | 2213 | 2200 | 2822 | 2685 | 3430 |
| 35% | 376 | 501 | 974 | 1222 | 1572 | 1945 | 2169 | 2666 | 2767 | 3389 | 3365 | 4110 |
| ESS = 2.0 kWh | ESS = 4.0 kWh | ESS = 6.0 kWh | ESS = 8.0 kWh | ESS = 10.0 kWh | ESS = 12.0 kWh | |||||||
| 35% | 300 | 445 | 820 | 1111 | 1342 | 1778 | 1862 | 2444 | 2384 | 3110 | 2905 | 3776 |
| 40% | 413 | 558 | 1047 | 1338 | 1682 | 2118 | 2315 | 2897 | 2950 | 3676 | 3585 | 4456 |
| 45% | 526 | 671 | 1273 | 1564 | 2022 | 2458 | 2769 | 3351 | 3517 | 4243 | 4265 | 5136 |
| NPV(PV) 405 | 1060 | 1715 | 2180 | 2507 | 3058 | |||||||
NPV(PV + ESS) > 0 is denoted in bolds; NPV(PV + ESS) > NPV(PV) is denoted by a grey color.
© 2017 by the authors. Licensee MDPI, Basel, Switzerland. This article is an open access article distributed under the terms and conditions of the Creative Commons Attribution (CC BY) license (http://creativecommons.org/licenses/by/4.0/).
Share and Cite
MDPI and ACS Style
Cucchiella, F.; D’Adamo, I.; Gastaldi, M. The Economic Feasibility of Residential Energy Storage Combined with PV Panels: The Role of Subsidies in Italy. Energies 2017, 10, 1434. https://doi.org/10.3390/en10091434
AMA Style
Cucchiella F, D’Adamo I, Gastaldi M. The Economic Feasibility of Residential Energy Storage Combined with PV Panels: The Role of Subsidies in Italy. Energies. 2017; 10(9):1434. https://doi.org/10.3390/en10091434
Chicago/Turabian StyleCucchiella, Federica, Idiano D’Adamo, and Massimo Gastaldi. 2017. "The Economic Feasibility of Residential Energy Storage Combined with PV Panels: The Role of Subsidies in Italy" Energies 10, no. 9: 1434. https://doi.org/10.3390/en10091434
Note that from the first issue of 2016, this journal uses article numbers instead of page numbers. See further details here.