
Electricity Interconnection in Chile: Prices versus Costs

Faculty of Economics and Business, Universidad Alberto Hurtado, Santiago 8340575, Chile
*
Author to whom correspondence should be addressed.
Energies 2017, 10(9), 1438; https://doi.org/10.3390/en10091438
Submission received: 20 August 2017
/
Revised: 9 September 2017
/
Accepted: 15 September 2017
/
Published: 18 September 2017
Abstract
:Having a well-adapted transmission network is key for reaching a sustainable energy system, where generators and consumers participate in an efficient market. The purpose of the present research is to estimate the impact on the final prices of the interconnection of the two largest electrical systems in Chile. To this end, an econometric model is used in which prices, among other variables, are explained by the level of marginal costs in the system (opportunity cost), the degree of concentration in the market (market power), and the variability of marginal costs projected by the agents (risk). The data corresponds to bilateral contracts between generators and major clients, from 2006 to 2014. The basic results indicate that the interconnection would benefit final customers by reducing equilibrium contract prices, as a result of the decreased variability of expected marginal costs and a lower concentration of existing generating companies. This study’s main contribution is to focus on the benefits of electricity interconnection under conditions of competition and risk, instead of using the simple estimation of direct costs, as has traditionally been done.
1. Introduction
All increases in a power system’s transmission capacity have effects that go beyond direct costs and benefits, normally associated with investment and operating cost variations, when comparing the power plant’s performance under different transmission scenarios. Nevertheless, in the context of evaluating the interconnection of power systems, as when discussing a transmission expansion, these direct costs are usually emphasized, limiting the analysis to a comparison between the interconnection cost and that of continuing the operation of each system, separately.
Consistent with this trend, the traditional approach in Chile for evaluating transmission expansions is that the benefits of demand are circumscribed to changes in the marginal cost or spot price of the system. This follows the idea that, at equilibrium, operation and investment costs should be reflected in this price. Regardless of whether these calculations are valid, they do not consider that the determination of contract prices is not only associated with the marginal cost of the system, but also to other relevant factors, such as those which highlight the degrees of competition and risk faced by agents. The international evidence [1,2,3,4,5] indicates that the effect of an interconnection on competition in the generation market is one of the main points to consider. This effect would be reflected by lower average prices, which is added to the change in price due to lowered operating and investment costs (expressed by a lowered expected marginal cost). Similarly, another factor for contract price determination is the risk assumed by suppliers, also affected by the interconnection, due to the possible changes in the variability of marginal costs in the context of an interconnection (in addition to the security conditions and stability of the operation).
In the present work, historical contractual information from the Chilean electricity market is used to evaluate the economic impact that an interconnection between the two largest power systems: Central Interconnected System (SIC) and Northern Interconnected System (SING) would have. To this end, a new methodology is used, not only for Chile, but also in the context of the international literature, which incorporates a price decision model for electricity supply contracts with the purpose of quantifying changes in the generation contract price as a product of an SIC-SING interconnection (mark-up margin). Previous literature mentioned above has focused on the effect in the short-term or spot market, instead of our approach, which works on the long-term contract market.
With regard to this methodology to quantitatively evaluate the aforementioned effects, there are two considerations to keep in mind. First, it is necessary to consider that there are two types of clients: regulated and free. The price determination process for the first type of clients involves public and regulated bids, while free clients operate via bilateral negotiations between generators and clients. For this reason, the data available from both markets are completely different. In the present work, only free contracts will be considered from the historical information provided by the Chilean National Energy Commission (CNE), which is the regulatory authority. For a study regarding regulated client markets, see [6].
Second, there is a non-trivial need to model price decisions by generators, as they depend on assumptions regarding the level of competition in the contract market. In this regard, the present work uses the most recent studies as theoretical reference points for the issue of competition in the Chilean electricity contract market [7,8,9,10,11]. This is in line with the experience compiled by the California Energy Commission, where the mark-up estimations based on historical market information are the preferred alternative. It should be noted in this context, as mentioned by [12], that this type of estimation is more likely to underestimate the benefits of a transmission expansion than to overestimate them. The aforementioned works are based on the assumption that a generator stabilizes income by means of long-term supply contracts, to capitalize on existing investments or to obtain finances for the construction of new plants. This ultimately assumes that generators are risk-adverse, which should be explicitly considered in price decisions.
Once the model has been estimated to determine the equilibrium contract price, to the effect of quantifying the impact of interconnection, expected spot prices for the electrical systems must then be projected, using scenarios with and without interconnection. To this end, we have used the CNE official estimations for the transmission rates 2014–2015 process, regarding expected spot prices under different scenarios. Finally, considering the expected change in the average estimated contract price, the possible effect on Gross Domestic Product (GDP) can be calculated, based on the existing economic literature regarding elasticities for electricity price and macroeconomic variables, such as employment, output, and investment.
This work’s most important contributions can be summarized in two points. First, a methodology is proposed and estimated for the analysis of how long-term electricity contract prices are determined. Once the primary determinants of prices are obtained, it is possible to study the potential impacts of relevant changes in these variables. Second, regarding electricity transmission policy, it is shown that only considering criteria such as investment and operating costs is insufficient to evaluate an expansion. In the event that not all economic impacts are considered, it is possible for projects with important economic benefits to be postponed.
From now on, the text will be structured as follows. Section 2 identifies the basic characteristics of the Chilean electricity market, presents the relevant literature, and explains the methodology used to estimate contract price determinants. Section 3 shows the econometric results and price projections for each scenario, with and without interconnection. Section 4 includes a short summary discussion of the results, including some references to related topics, and Section 5 concludes by summarizing key findings and policy recommendations.
2. Methods
The present section contains three parts. The first presents, as context, the main issues regarding the Chilean electricity market. The second describes the relevant international literature, as concerns the Chilean experience. The third explains the decision model of contract prices to be estimated econometrically.
2.1. Chilean Electricity Market
Geographically, there are two main regional power markets: the SIC covering the southern and central areas of the country, and the SING covering the northern part. There are other smaller and isolated systems in the South, but they have not been considered here. There is no connection or overlap between systems. Up to December 2015, the Chilean electricity market had a total installed capacity of 20,096 MW. Given that the focus of this paper is to analyze the benefits of a possible interconnection between those systems, it seems worthy to detail some basic characteristics of them. Table 1 shows the portfolio of the generating technologies in each one.
SIC is the bigger system, with a total installed capacity of 15,913 MW, serving 90% of the population of the country. SING has an installed capacity of 4183 MW. As a matter of comparison, the state of California has 79,000 MW of installed capacity. In terms of demand, 60% of SIC’s demand comes from regulated customers, mainly residential and commercial, while at SING, 90% comes from large customers, particularly from the mining industry. With this background, it is possible to predict that an interconnection between the two interconnected systems would change the composition of available technology to produce energy, which presumably would have relevant effects on the observed equilibrium marginal costs.
Due to the geographic characteristics of the Central and South part of Chile, under normal weather conditions, hydro-power represents more than 60% of SIC total generation. The installed hydro-generation capacity is 32% for the country as a whole, but 41% in SIC. Water resources can be stored to generate power at a later date. For this reason, SIC’s spot price is heavily influenced by the opportunity cost of water: using water to generate electricity the same day or leaving it for a future period. Also, water shortages can produce power outages, increasing spot market uncertainty.
The evolution of SIC’s technology mix since the mid-90s can be understood in terms of actual generation. By 1995, 70% of generation was based on hydropower and 30% on coal. After an international agreement with Argentina in 1995, imported natural gas became a major source for power generation due to its low marginal cost, medium investment cost, and short time-to-build. While the SIC was expanding natural gas generation, the most severe drought in thirty years occurred during 1998–1999. For the first time, oil-based generation became important to replace hydro-power for a short period.
After the 1998–1999 droughts, natural gas became the most important thermal source of generation until 2004. It would have continued to be so but an unexpected energy crisis in Argentina impacted the Chilean systems when restrictions over natural gas exports started in May 2004. This restriction reached over 50% of the Chilean demand in 2005, becoming even worse with time and finally no more natural gas from Argentina could be imported.
In terms of regulation, the Chilean Electricity Market is separated into three sectors: Generation, Transmission, and Distribution. Transmission and Distribution are seen as natural monopolies and remain under price regulation. Considering that there are no significant economies of scale in generation, the law envisioned a competitive environment among generators with open entry. The decision of investment is completely decentralized and all firms are privately owned. Each generator decides the timing, location, size, and technology of a new unit, depending on price signals.
Generators operate in a spot market and in a contract market at the same time. The spot market works as a short-term market where demand and supply meet instantaneously. The contract market operates as a long-term market where generators and customers contract supply and demand in advance.
The spot market is organized in Chile by an Independent System Operator called Load Economic Dispatch Center (CDEC). All generating plants report their operational costs and the CDEC can audit them. The CDEC sets the dispatch of generation power plants following a strict order of variable costs. It is a model of centralized power dispatch, independent from the contract market.
The spot price mechanism in the Chilean system follows a peak-load pricing scheme, which includes an energy price and a capacity charge. The marginal cost of generation is the energy price and it is equal to the most expensive unit of generation (variable cost) in use to balance demand and supply, taking into account transmission constraints and energy losses. In case of any shortage, the spot price is equal to an outage cost calculated by the CDEC. The outage cost is based on consumer willingness to accept compensation for a planned outage of a particular magnitude. The capacity charge, instead, is given by the lowest unitary capital cost of a generation unit to supply the peak of demand (it is calculated by the CNE). The energy price covers the variable costs of the marginal unit, while the capacity charge is an annual payment that it is allocated proportionally to the actual capacity of each plant to cover the peak demand.
In sum, spot prices indicate the short-term marginal cost of electricity generation, plus the opportunity cost of installing peak capacity. In theory, it gives the appropriate signal for an optimal operation of the spot market and an optimal decentralized investment decision to supply a growing demand. Given the absence of economies of scale, the peak-load pricing scheme allows for a variety of generating units with different sizes, variable costs, and technologies to balance supply and demand.
The purpose of contracts is to hedge spot market risk. There is uncertainty about future spot prices that are subject to an excess of capacity, potential entrants with lower generation costs, and hydrologic volatility, etc. A contract reduces the risk that a new plant has to face and it is sometimes a prerequisite for financing new units.
Contracts can be signed with distribution companies, for customers under price regulation, and with large firms or large consumers (with installed demand over 5 MW) also known as “free customers”. Free customers can contract directly with generators for power supply, while “regulated customers” are supplied by local distribution companies and cannot have any direct contract with generators. Generators are free to sign as many contracts with free or regulated customers as they want. Neither distribution companies nor free customers have access to the spot market.
The generation market exhibits a high market concentration in Chile, but has been decreasing over time. In 2005, 90% of the installed capacity and 95% of market share was in the hands of these four firms, while in 2015, those percentages were below 80%. Incumbents’ share of the market is dropping, particularly due to entrants in renewable energies.
There is evidence which shows that competition is possible and desirable in the generation segment. However, its operation needs many regulations based, among other factors, on the special features that the system operator has.
In the context of the pricing mechanism described above, the spot market represents the transactions that occur within the CDEC at the abovementioned marginal efficient prices (energy price calculated according to the variable cost of the last unit in operation—the more expensive—and a capacity charge). Likewise, at the contract market generators trade its capacity and energy at prices which are freely determined with unregulated customers (or may bid for the right to supply regulated customers at open and competitive auctions).
It is worth noting that this paper was carried out using prices traded between generating companies and non-regulated free customers (including capacity payment, but expressed in energy units), showing that the interconnection between systems has a significant impact on the determination of the equilibrium prices, based on, among other reasons, an increase in competition in the market and a diminish of expected risks.
There is evidence that in the market for free customers, prices are determined considering market risk, expected spot prices, and conditions for competitive behavior. Some analysis like [8,9] have shown econometric evidence of this contract behavior. All of these variables will be described in detail in our model of Section 2.3.
2.2. Relevant Literature
The liberalization of the electricity market in the 80s and 90s demonstrates a direct relationship between the transmission system and the competitive dimension of the generation market. In the case of lines becoming congested, localized generators in determined areas could exert local market power [13]. In this way, the issue of competition gained relevance, approaching the current situation, in that significant increases in transmission and interconnections are primarily based on objectives associated with increased competition between generators [14].
In the context of systems with price regulation in the spot market, as is the case in Chile, with a centralized dispatch based on declared and audited marginal costs, a transmission expansion also increases efficiency in terms of social welfare, due to increased competition in the generation spot market [15]. This is also valid in the case of interconnection between systems [16].
The simple utilization of the option with the lowest operating and investment cost, as was done under the vertically integrated electricity market paradigm, is no longer viable. As such, the discussion in specialized literature has concentrated on the definition of benefits that should be considered [16,17], how to decide in the face of changes in social welfare as well as private interests [2], and how to measure hard-to-quantify benefits such as an expansion option’s “trustworthiness” [2,18].
In practice, the independent operator of the California system (CAISO) put a comprehensive evaluation methodology into place, called the “Transmission Economic Assessment Methodology” (TEAM), in order to develop a cost-benefit analysis of a transmission expansion [12,19,20]. Its principal contributions have been the development of a benefit identification methodology, as well as the incorporation of electricity market prices in the analysis.
In the case of developing countries, the analysis of criteria for a transmission expansion or interconnection of systems has also become relevant in recent years [21]. The work of [22] evaluates the private and social aspects of power system integration in the Andean community (Colombia, Ecuador, Peru, Bolivia, and Chile). The same study focuses on quantifying the economic benefits on the supply side, measured by the reduction in operating margin (difference between the marginal cost and operating cost), as well as on the demand side, calculated as a reduction in the spot price, savings in systemic costs, and environmental impact measured by the decrease in polluting emissions. In the Chilean case of an SIC-SING interconnection, there is work on the interconnection’s impact on carbon emissions [23]. These works are recent; however, it must be noted that they both focus on the operating margin without considering the effects on contract prices, as discussed in the present text.
It is important to highlight that generation and transmission expansion planning exercises are usually carried out separately rather than in an integrated way. The expansion problem is generally considered to be a non-linear, non-convex optimization problem. So, generally, expansion problems are complex and take a long computation time. For these reasons, important simplifications are usually assumed. However, separated generation and transmission expansion planning exercises don’t guarantee minimizing the overall cost generally. The integration of these problems has been approached using different methods, models, and objective functions (for a review on the topic, see [24]). Our approach can be complementary both to an integrated and a non-integrated analysis. Any conventional generation and transmission expansion planning analysis estimates the direct costs for the power system without considering the impact on electricity prices. The results presented in this paper show that in some cases, were electricity markets are not entirely competitive or where uncertainty is high, any kind of expansion planning analysis has to consider the effect on prices rather than costs.
2.3. Econometric Models
The decision model used for long-term supply contract prices is as follows. It is assumed that the generator’s offering price corresponds to the cost of supply plus a mark-up margin, which is predominantly determined by the existence of market power, and the risk associated with the contract. For more details on a theoretical decision model for electricity contract prices, consult [10,11].
This estimation will be performed for the non-regulated or free client market. As stated above, the separation between free and regulated client markets is based on the fact that contract prices are determined in different ways for each case. In the case of regulated clients, prices are determined via competitive bids, where generators bid on the future required supply with several years of anticipation. For free clients, the price definition process depends on the bilateral negotiation between generators and clients. As a complement to the present work, which focuses on free client markets, we have developed estimations for regulated clients, which could be compared with these results, in [6].
In theory, it is expected that each generator defines its prices based on a set of variables that are generically associated with the following factors: competition levels in the market, expected costs of providing the service, contract characteristics (basically, length and size), the power system in question, and the contract risk. In formal terms, the basic estimation model is as follows:
where:
The generator’s offering price for contract i, at time t and system k.
Market Concentration Index at time t for system k, which indicates the degree of competition faced by the generator upon establishing its pricing policy. From a behavioral perspective, it is expected that as the concentration increases, prices will also increase, and thus it must be true that .
Cost of providing electricity for system k, at time t, which represents the estimation as a function of expectations at the time of the offer with respect to the cost of purchasing energy in the spot market to supply the contracts. It is expected that as the cost of supplying the contract increases, prices will also increase, and thus it must be true that .
Duration of each Contract i. It is expected that as the contract length increases, the contract will become more attractive to a competitive generator and offering prices will decrease, as a longer contract implies a decreased risk for the investor. Thus, it must be true that .
Size of Client i. From a behavioral perspective, it is expected that as the client size increases, prices will decrease, as this condition increases negotiating power against the respective generator, and thus it must be true that .
Dummy Variable for each year, which identifies possible structural changes in the market over time, which can reflect trends and determinants of contract prices that are not explained by the other variables.
Dummy Variable to identify system k, which reflects the possible diversity in price determination for each electrical system.
Expected Variability in the Marginal Cost of System k at time t, which represents the generator’s risk as a supplier at the time their contract takes effect. From a behavioral perspective, it is expected that as this variance increases (greater risk), prices will increase, and thus it must be true that . It should be noted that this variability can be calculated by eliminating the time series trend for prices, in a way that strictly reflects the “movement” of the expected price with regard to the said trend. To this end, the Hodrick and Prescott filter is used, which is a method for extracting the trend component of a time series, widely used in the study of economic cycles.
Given that the ultimate aim is to identify the effect on equilibrium prices of an interconnection between systems, it is important to note that the specifications described above contain certain variables that are expected to change significantly due to the interconnection itself. In particular, it is reasonable to assume that the concentration index and price variability would be affected in the direction of decreased equilibrium prices (lower concentration and price volatility). Similarly, it is possible that the cost of long-term supply could also be modified by the interconnection.
3. Results
In this section, the completed econometric estimations will be presented first, followed by the projected contract prices according to the interconnection scenarios.
3.1. Econometric Estimation
Thanks to the data provided by the CNE, a database of SIC and SING free clients was built for the period between January 2006 and August 2014. To the effect of estimating the base model described in the previous section, the following variables were used:
- P: average contract price. The average price over the first six months of the contract was used, in order to decrease the effect of extraordinary contractual charges that could occur for only one month at the beginning of the contract. This variable is expressed in dollars per megawatt hour (USD/MWh). This represents the price expressed in units of energy, which includes the capacity payment as well as energy (these services are paid for separately in Chile).
- C: as a determinant of the cost of supplying free contracts, the marginal cost associated with the transmission system bar corresponding to point of sale was used. Six bars were defined to this end, five in the SIC (Cardones 220, Quillota 220, Itahue 220, Charrua 220, and Valdivia 220) and one in the SING (Crucero 220). This cost is considered in each contract for the month of beginning of the contract. Alternately, the average for the contract month and the three previous months was used as a variable, as a way to stabilize possible abrupt short-term movements. Neither the estimations obtained nor the statistical significance changed in a relevant way for either case.
- Market Concentration Index (MCI): to measure concentration, the Herfindahl index (HHI) was used per group or generating conglomerate (HHI per group, considering the property structure of holdings). Given that the concentration is the variable in question, it was considered pertinent to group those companies that belong to the same generating group. It is worth noting that other definitions were also used (Herfindahl per Company, and market participation of the primary generating companies—Top 1, Top 2 and Top 3 by company and group of companies). Appendix A’ tables shows the summary statistics for Top 1, Top 2, and Top 3 variables for SIC and SING.
- D: duration of the contract in years.
- S: as a measure of size, the proportion of annual client consumption with respect to the total supply to free clients was used. Specifically, this variable was constructed as the annual client consumption (corresponding to all contracts associated with the client by name), divided by the annual consumption of energy by free clients in the respective system, for the same year.
- Volatility of Marginal Cost (VMC): standard deviation of the monthly marginal cost (without trends) for the system (on the Alto Jahuel bar for SIC and Crucero bar for SING), considering the two years prior to and two years after the month of in which the contract began. A standard deviation of 48 months was ultimately considered. In this way, the risk indicator includes the historic variability as well as the expected variability as of the start of the contract. This is based on the assumption that expectations on marginal cost variability are basically formed on short-term information. In the case of contracts signed after August 2012, only the months for which marginal cost information was available could be used.
Table 2 shows descriptive statistics for the presented variables. Out of a total 305 contracts, 80% correspond to the SIC supply. The average cost of a free contract is generally located above the spot price (marginal cost) and has greater variability. With regard to the concentration level, the Herfindahl index (HHI per group) is above 1800 points on average, which implies a high concentration in the contract market. In addition, the average contract duration is 7.2 years.
Table 3 shows the results of the econometric estimation. Econometric estimations with fixed effects were attempted, and there was no evidence that it backed the hypothesis of its existence. Similarly, it was proven that the dependent variable (average contract price) has no trend, which is why the pre-established linear estimation continues to be valid. The first column uses the HHI concentration index per group, while the remaining three columns consider the concentration indicator of the largest, two largest, and three largest companies by sales size (Top 1, Top 2, and Top 3, respectively). The results in terms of significant variables are similar in all estimations, except in the case of the concentration index. This is reasonable, as the greater coefficients in the cases of using the Top 1, Top 2, or Top 3 variables are explained by the fact that said variables possess variations that are lower than HHI in absolute terms. In the end, as specified by the model, the main determinants of free contract prices are the cost of supply, the concentration index, the variability of marginal costs, the corresponding electrical system, the contract length, and the year of the contract beginning. All coefficients associated with these variables show the expected signs.
The results indicate that for each increase of one dollar (per MWh) of the spot price (C), the average contract price increases by a third of a dollar. The SIC system systematically presents average prices that are lower than SING. As expected, the contract duration and size of the client decrease the average contract price. One year of additional contract length reduces the average contract price by at least 3 dollars, while each additional percentage point of the supplier’s participation in annual consumption under the free market leads to a 2 dollar decrease in the contract price.
The variable used to reflect contract risk, VMC, is significant and the coefficient’s signs are as expected. It should be appreciated that, in the Herfindahl index estimation, a reduction of the standard deviation for marginal costs at a point, reduces the average contract price by 1.606 USD/MWh. There is a relevant component of risk present in the contract price. If the variable VMC decreases with a standard deviation (9.6 in Table 1), the average price of free contracts could fall close to 15 USD/MWh.
The concentration index indicates that a market power component exists within the determination of average free prices. For each 100-point reduction in HHI, the average price falls by 1.1 USD/MWh. Finally, in considering the market participation of the two largest companies (Top 2) or three largest companies (Top 3) as a concentration index, a reduction of 1 percentage point in the market share reduces the average price by 0.53 and 0.61 USD/MWh.
Given these results, it can be determined that changes in some of the explanatory variables can imply relevant modifications in the average prices of free contracts. To analyze the effects of the interconnection, it will be necessary to project values for concentration, risk, and supply costs under scenarios with and without interconnection, which is done in the following section. The results of the estimations that will be used correspond to the model that uses HHI per group as a concentration index. The reason being that, although the other variables for estimating concentration also provide substantial results, the HHI has the most widespread acceptance and use. Having tried other indices has only helped demonstrate the consistency of the conceptual model in use, beyond the specific measurements of each variable.
3.2. Interconnection Impact
In order to quantify the impact of an interconnection, it is necessary to have projections for the electricity systems under scenarios with and without interconnection. We took these projections from the CNE study “Evaluation of Social and Economic Impacts of a SIC and SING Interconnection” completed in the year 2015. In this study, CNE makes an estimation of monthly spot prices for the period of 2014–2033. For this purpose, the CNE forecasts the demand and supply, as well as the input prices (i.e., oil prices). In terms of supply, the CNE determines an investment plan schedule for generation and transmission that minimizes the total cost of supply. This total cost is the present value of investment, operation, and potential rationing for the next twenty years. The investment plan considers the estimated demand and the present state of existing units of generation, as well as units under construction. There are also “suggested” units that are needed to balance supply with expected demand. The investment plan is an indicative plan, not a mandatory requirement.
Spot price estimations were provided by the CNE for different scenarios of technology expansion: Coal, Non-Conventional Renewable Energies (NCRE), Liquefied Natural Gas (LNG), ERNC with high penetration and Coal + Hydroelectricity, along with three options of interconnection between systems. In Chile, the law defines wind, hydroelectric up to 20 MW, biomass, biogas, geothermic, solar, and tidal energy as NCRE. The different investment costs used in each scenario are found in Table A1 of the Appendix A.
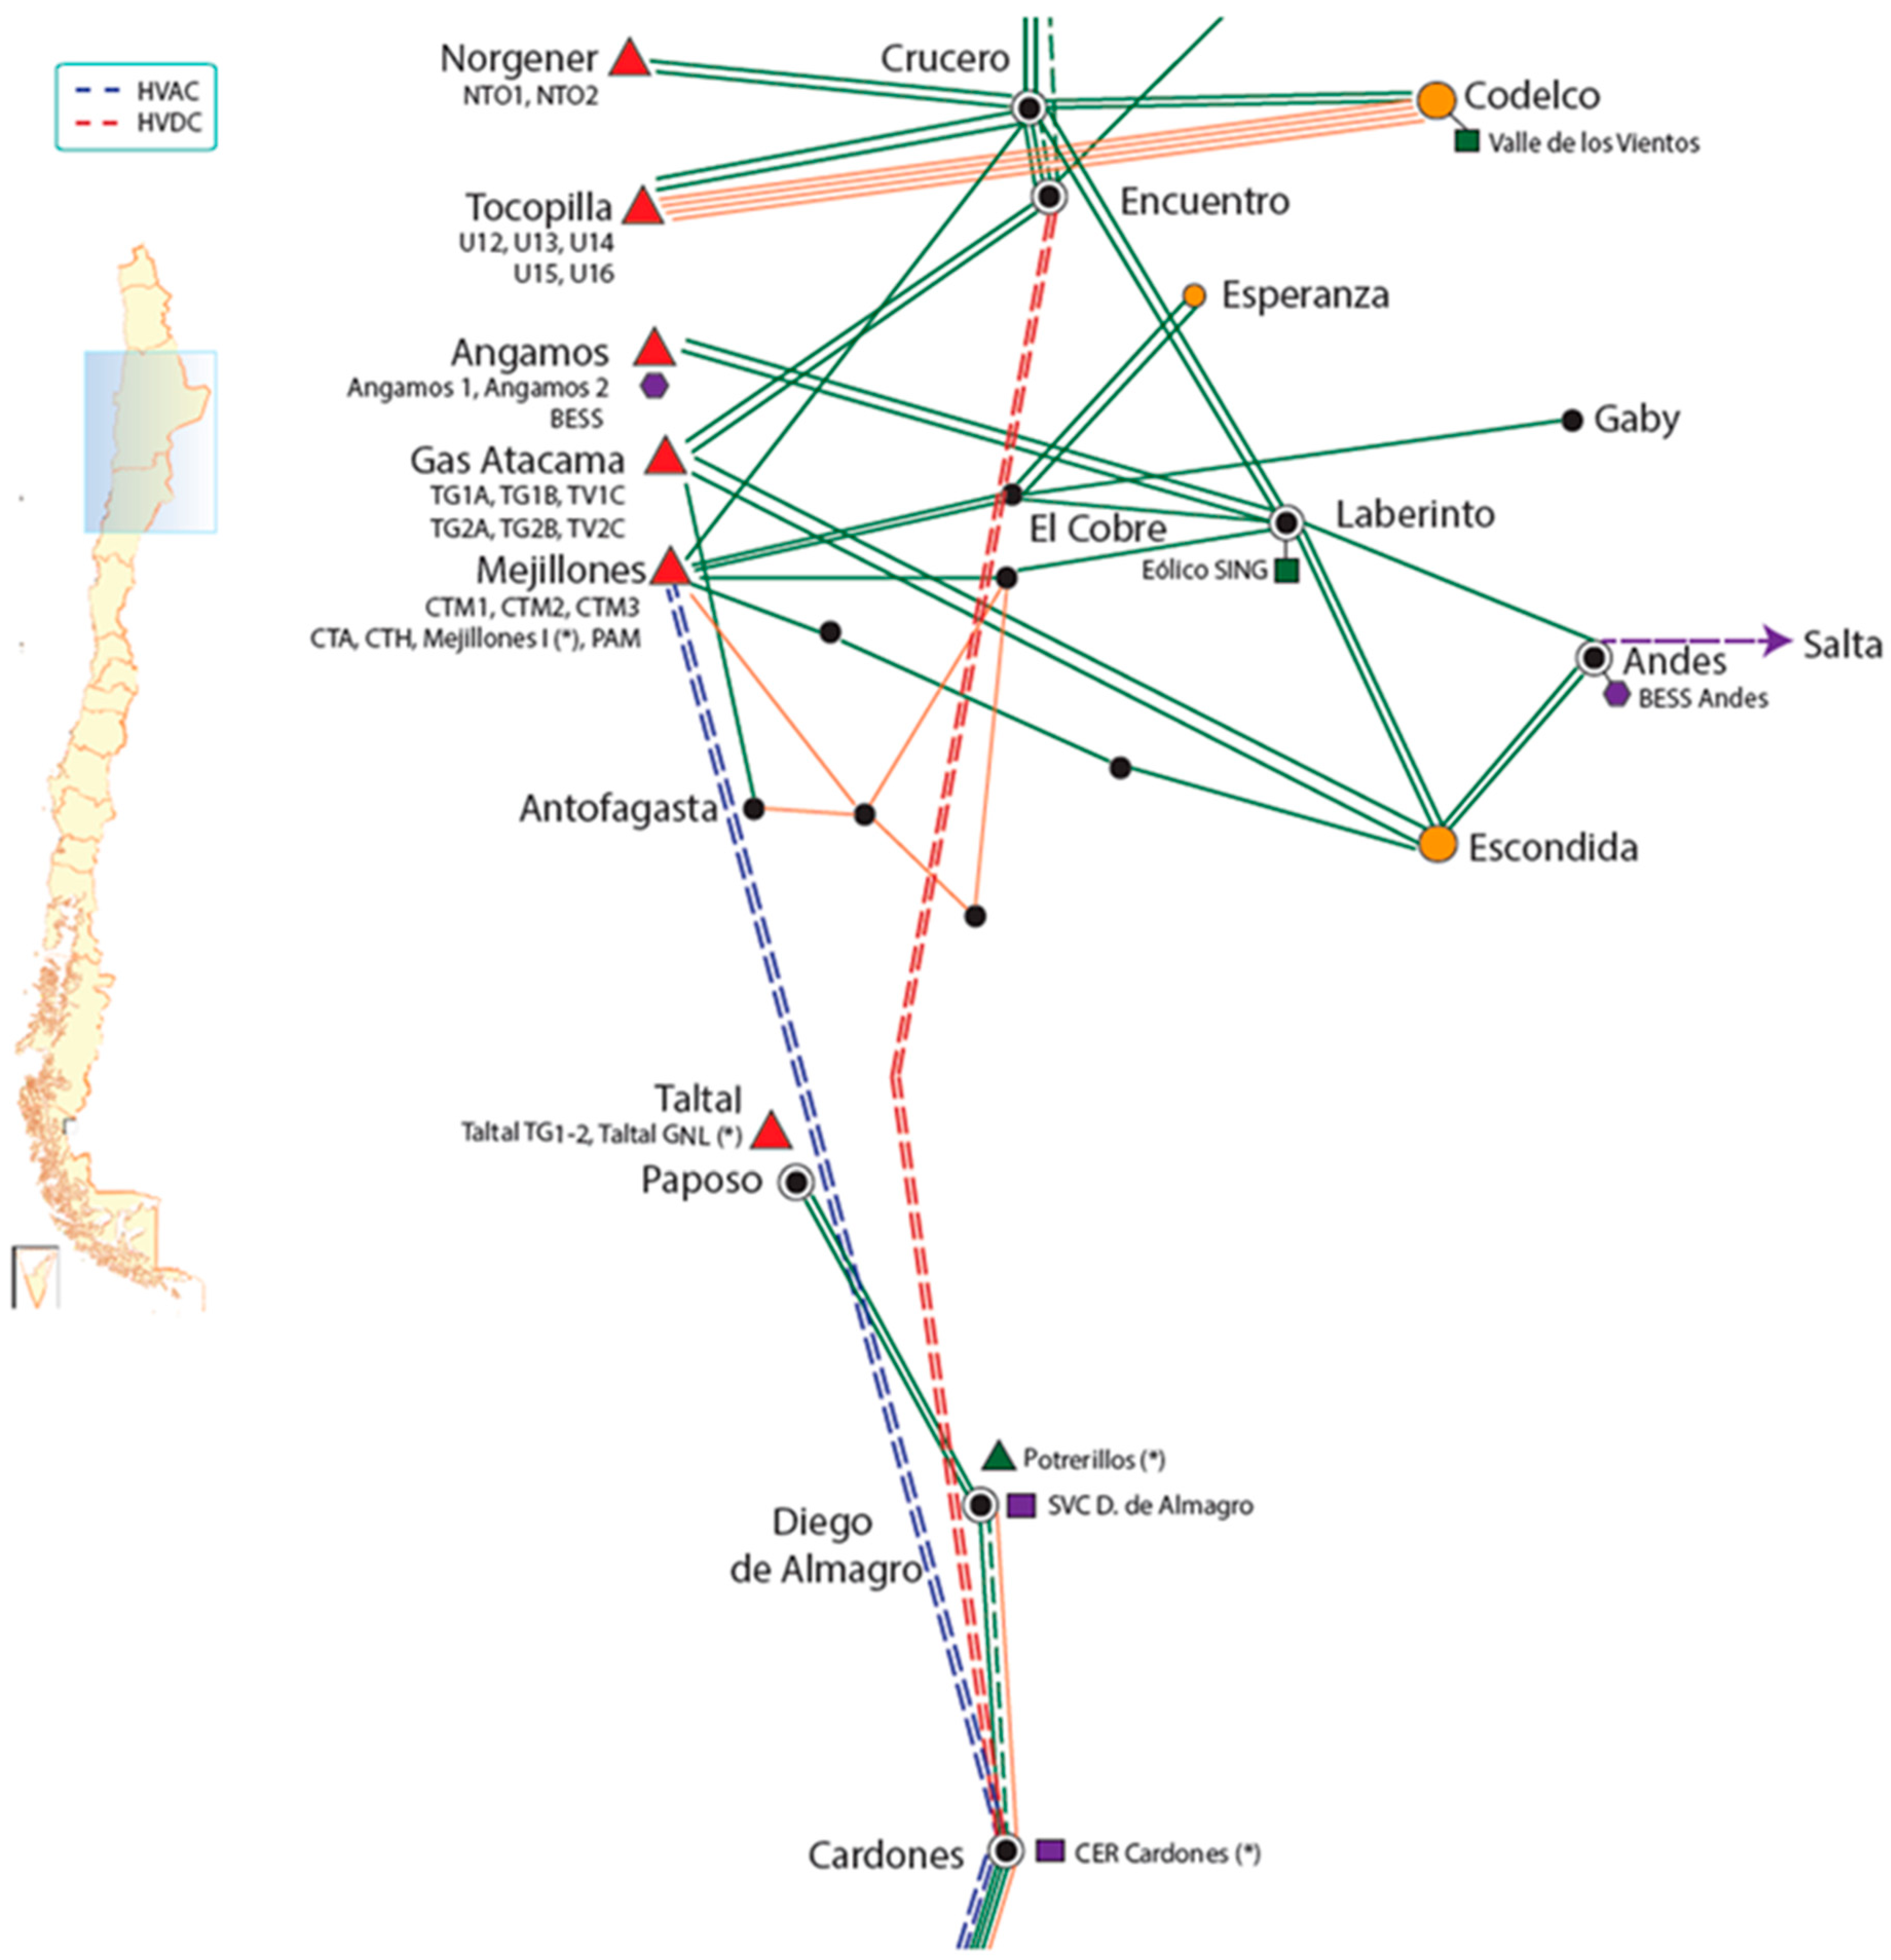
The selected expansion scenarios will be compared with three interconnection alternatives. The different options for an interconnection were provided by the CNE:
- Alternative 1: A transmission line from the substation zone (S/E) Nueva Crucero—Encuentro (SING) to the S/E Nueva Cardones (SIC).
- Alternative 2: A transmission project from the Mejillones zone (SING) to the S/E Nueva Cardones (SIC).
- Alternative 3: A combination of Alternatives 1 and 2.
Figure 1 shows a map of the interconnection alternatives as described. The first alternative was a high-voltage alternating current or HVAC interconnection to be ready by January 2018. A generating company based in SING was interested in carrying on this alternative. The second alternative was a high-voltage direct current or HVDC interconnection. Finally, there was a third scenario where the HVAC and the HVDC projects were built together.
To analyze the interconnection’s effects, the HHI index per group of companies was calculated for the months of January through August of 2014, considering the scenarios with and without interconnection. That is, in order to project the change in price with and without interconnection, we will assume the HHI levels present in the year 2014. It should be noted that HHI is higher in SING than in SIC. In the case of SING prior to interconnection, HHI reaches 4000 points, while only reaching 1900 points for SIC. The SIC + SING scenario, which simulates an interconnection between the systems, ends at a concentration level almost identical to the current concentration level for SIC. Thus, the de-concentration of power systems produces the greatest gain for SING.
According to the considered scenarios and simulations within the period of 2014 through 2033, the variability of trendless spot prices differs between systems (applying the Hodrick and Prescott filter). The SIC has a greater variability than the SING. As expected, the interconnection scenarios are within the range defined by the SIC (upper bound) and the SING (lower bound).
The final projection component for free client simulations corresponds to the spot prices per scenario under consideration. Again, the SIC has an average expected price for the period of July 2014 through June 2033 that is larger than that of the SING. As expected, the interconnection scenarios are within the range defined by the SIC (upper bound) and the SING (lower bound).
3.3. Average Contract Price Projection
Once projections were completed for the three variables defined above, the average prices for free clients were estimated by simulation scenarios (technology) and interconnection alternatives. The price differentials (in USD/MWh) are shown below for the scenarios without SIC and SING interconnection and for the interconnected scenarios for the case studies (five development technology and three interconnection designs).
The differing contract price estimates are displayed in each box, considering the modifications of the aforementioned three variables at the same time: concentration (HHI), risk (VMC), and expected marginal costs (C).
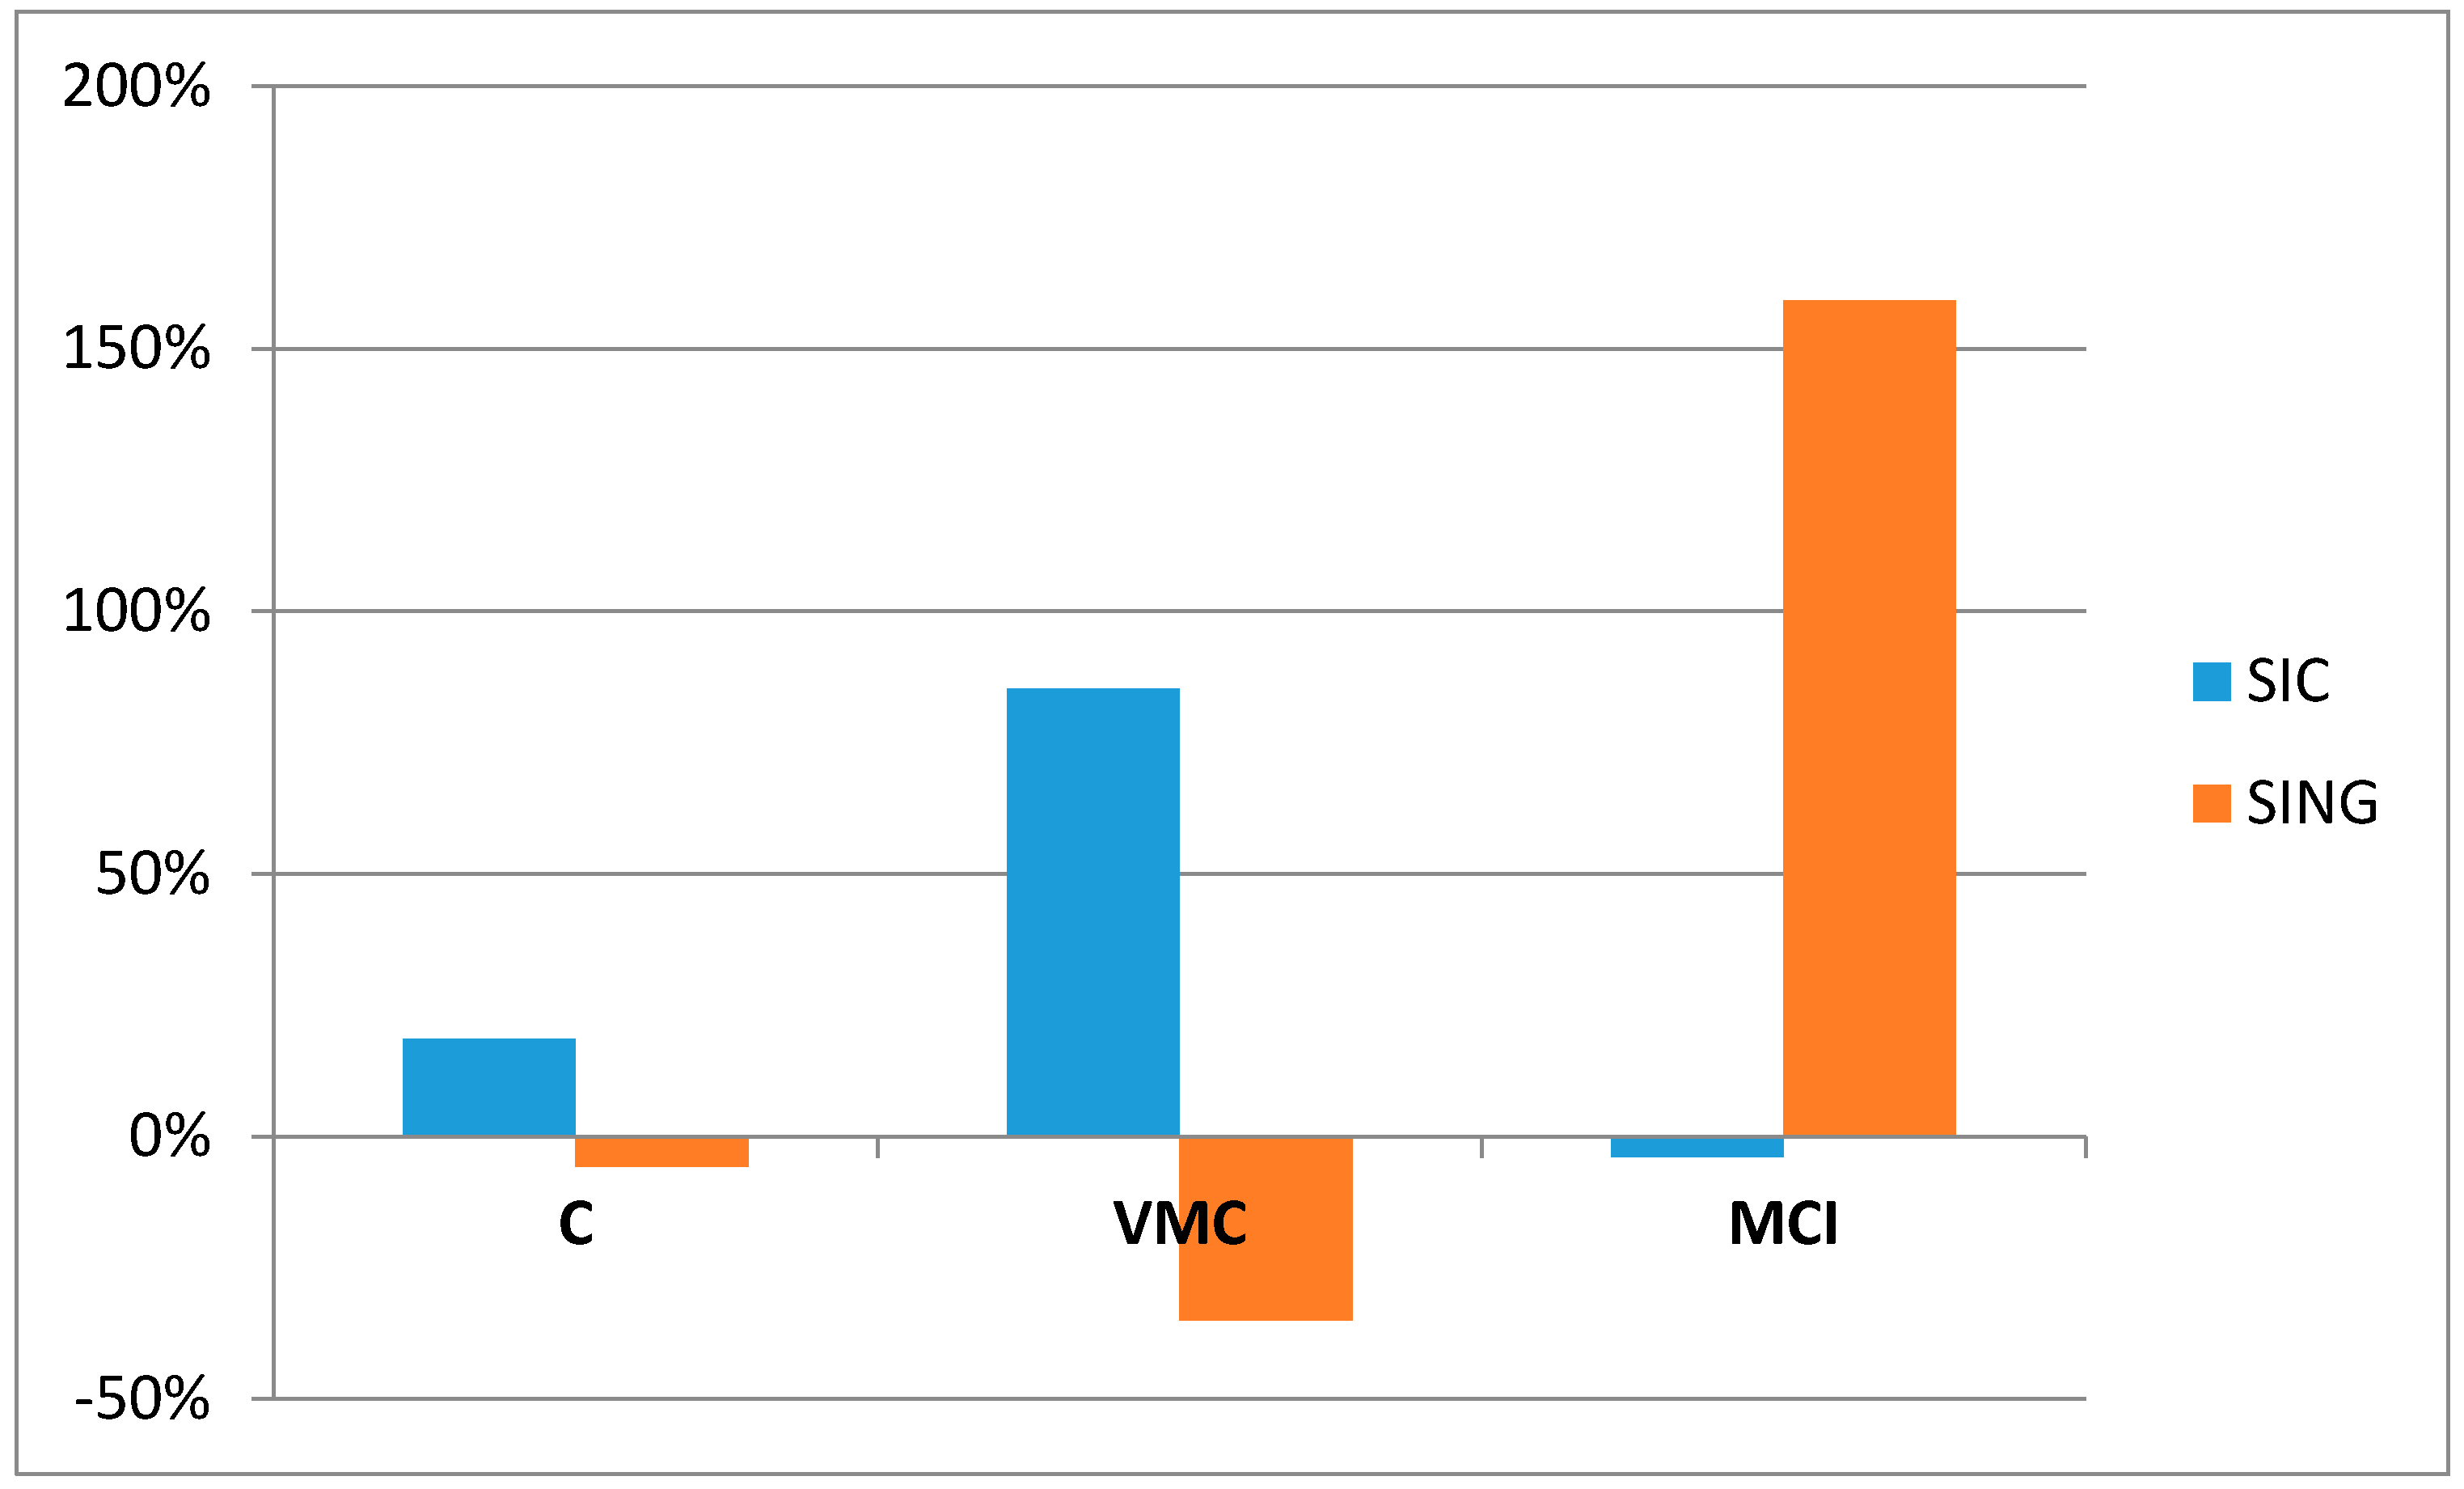
The price differentials are significant; on average, 8.6 USD/MWh for the SIC and 17 USD/MWh for the SING, across all simulations. The effect on prices is distributed differently between systems. For the SIC, 85% of the price reduction is due to a decrease in variability of expected marginal prices. For the SING, by contrast, given that the variability and spot price level increases, the effect is compensated for by a significant increase in competition, through lower concentration indices. See Appendix A, Figure A1, which shows that the total effect is broken down for each of the three modified variables (C, MCI, and VMC). It is shown that for the SIC, the reduced marketing margin is explained by C and VMC, while that of the SING can be entirely explained by MCI.
The effects on the price differentials are explained by three different variables: concentration, risk, and expected marginal costs. It is important to highlight that two of the variables imply net benefits to the society since a lower risk and lower expected marginal cost increase market efficiency. Only the increase in competition implies a partial transfer of wealth from generators to consumers. Since the risk variable explains most of the change in prices, considering both systems simultaneously, we can conclude that the majority of price differentials of the country as a whole are social benefits.
Planning expansions for generation and transmission facilities requires forecasting a set of variables: fuel prices, electricity demand, investment and operation cost of existing and new power plants, and hydrologic conditions, etc. Since several of these variables are largely uncertain, knowledge of the impact of these uncertain inputs is valuable. Uncertainty in power systems is becoming more relevant, especially with large amounts of stochastic renewable generations. The most important sources of uncertainty in our model are expected spot prices and their variance and expected degree of competition in contract markets. These three variables are the main determinants of expected contract prices. For that purpose, as we explain in Section 3.2, we use estimations of spot prices provided by the regulatory authority, CNE, which are the official estimations for the period of time under study. Sensitivity analyses of these expected spot prices were considered by the CNE during the transmission rates 2014–2015 process and included in the five scenarios that we have included in our work.
It is worth mentioning that performing sensitivity analysis is amply used in power system reliability planning and operational studies. However, the application of sensitivity analysis in the changing operating environment with emission constraints and penetration of the renewable energy sources is computationally expensive and often intractable. An alternative could be a global sensitivity analysis (GSA) that can determine the impact of input uncertainties on the output quantity of interest in a certain physical or mathematical model. This methodology is increasingly discussed for power systems simulations, as [25] shows, and it is useful to establish global relationships between inputs in order to generate stochastic models that are specific to a power system.
Our approach is based on an econometric estimation that looks for the relationship between contract prices and the before mentioned variables, using historical data. Once we obtain this relationship through reduced-form estimations, we estimate what could happen with different generation and transmission expansion plans using CNE data. In our approach to transmission expansion, GSA approaches are useful to improve forecasted spot prices and their variance, under different scenarios, that can be used to evaluate transmission expansions on market prices.
4. Discussion
An expected structural change in the average contract price has a substantial macroeconomic impact, as it affects the production costs of various sectors of the national economy. The effect on macroeconomic variables requires a special model according to national economic behavior. To this end, [26] studied how the cost of electrical energy is relevant to the interpretation of the Chilean economic cycle. The authors estimate that the price elasticities of electrical energy for GDP are −0.017 and −0.058 in the short and long term, respectively. It should be noted that the short term effect refers to one year, and the long term refers to 10 years.
In order to measure the macroeconomic effect of the change in price due to the interconnection, the percentage change in price for each different scenario was calculated. In Table A2, we have shown that the average change in prices by scenario and interconnection alternative goes from 9.70% to 10.69%. This effect includes the change in concentration, risk, and expected marginal costs as it was explained before. Once elasticities are identified, the long-term GDP increase due to the interconnection is between 1.559 and 1.718 billion dollars, via lower prices for free client contracts. To estimate this value, the effect on the regulated client market has been added to the price effect on free clients, based on the results in [6]. We have used the 2013 GDP from the database of the World Bank as a base. In the short term, the GDP effect fluctuates between 457 and 507 million dollars. The difference between the short-term and long-term effect is nonlinear since the elasticity is calculated based on a single shock that fades away in time.
In the traditional estimation of net benefits for an interconnection, we would have compared the cost of the transmission line to the direct benefit of lower investment and operation costs. For the five scenarios that were modeled, we have net benefits from 180 to 469 million dollars. If we do not include the benefits identified in our analysis, the recommendation would have been to reject the project of interconnection. The net direct benefits for each scenario are displayed in Table A3.
There are several important implications of the interconnection for the electricity that cannot be accounted for in our approach but we need to highlight. First of all, from an international perspective, it is interesting to note that even though natural gas imports from Argentina have not been available since the end of the previous decade, this could change in the future. Argentina is the second ranked country in the world in terms of unconventional natural gas resources after China [27]. A recent study from [28] shows that it is possible that natural gas exports to Chile could return if Argentina succeeds in creating and enabling a business environment which allows for the needed investments in natural gas exploration, production, and infrastructure to happen. Liquefied Natural Gas (LNG) is expected to keep playing a key role in the Chilean natural gas market, where, in a low investment scenario in Argentina, minor natural gas imports from Argentina are used to cope with the peak natural gas demand in the Central South part of the country. However, in a high investment scenario, Argentinean gas from unconventional sources will displace LNG imports from current and new LNG plants in Chile in the summer season, for SIC and SING, and these will take advantage of the current infrastructure of pipelines that exists between Argentina and Chile. SIC-SING interconnection plays an important role in that case, providing flexibility to the operation of the power system. The existent pipeline infrastructure between Argentina and Chile and the SIC-SING interconnection enable complementarities between the energy systems of both countries to have a more optimized use of Argentinean unconventional gas and LNG facilities and Chilean LNG facilities, with a more efficient energy system which can benefit them.
A second important effect of the interconnection is that it is related to the distribution and retail segment. Although it is not the focus of this paper to analyze a potential liberalization of the retail market in Chile, the SIC-SING interconnection can facilitate it. A competitive generation market is crucial for any policy of liberalization and granting free entry to the wholesale electricity market, since it would be possible to exercise market power in a centralized dispatch model like the Chilean one, as [29] shows. The liberalization of the retail market could generate welfare gains to consumers [30], a result that will be reinforced by allowing more competition among generators in the context of an interconnection of the two largest electrical systems in Chile. Likewise, the benefits of liberalization of retailing depend, besides other variables, on the intensity of competition [31]. Furthermore, when analyzing the possibility to move from an energy/capacity market to energy-only market design, it looks probable that more competition among generators will facilitate the eventual transition, avoiding market manipulations [32].
Another effect of the interconnection is related to the introduction of renewable generation. As Table 4 and Table 5 show, NCRE and NCRE++ scenarios under the different alternatives for interconnection have a larger impact on SING than on SIC prices. Considering that the potential of solar power in the country is located predominantly in the north, the SIC-SING interconnection could unleash this potential. A more integrated and flexible power system allows a higher proportion of variable sources as wind and solar, which has multiple benefits. A more renewable electricity matrix reduces GHG emissions, in line with 2015 United Nations Climate Change Conference goals for the country. Also, the Chilean government set a 20% target for non-conventional renewable energy production by 2025. As a second source of benefits, the technological change has decreased the cost of using renewable energies in the last five years in a dramatic way. In the case of Chile, the energy sector has been the leader in terms of national investment since 2015, mainly due to the new renewable capacity. In the next decade, the development of emerging technologies like electrical energy storage systems [33,34] or concentrating solar power [35] can have a profound impact on the electricity system, and their advantages for the whole country can only be used with an interconnection between the north and the south. Finally, there is a social benefit of an increasing concern of Chilean households on environmental issues, expressed in their support for the introduction of renewable energy sources by showing positive willingness to pay for it [36].
General results show that benefits of transmission expansion can also be fostered by public and private sector collaboration by strengthening the transmission grid. A good example of this type of collaboration in Chile was the construction of the liquefied natural gas regasification terminal in the period when Argentina stops exporting natural gas to Chile (2004–2005). Several private shareholders participated in the business, plus the national oil company (ENAP). This terminal began its operations in 2009. Nevertheless, it is clear, based on different experiences in Latin America, that public and private joint activity must be carefully supervised, highlighting the balance between economic efficiency and political and social perspectives, because of the different objectives which are not necessarily consistent with public interest [37].
Since it is common that investment in emerging technologies begins with small-size projects, the role of small and medium size enterprises could be important in the transition period. For this reason, competition is good news for new enterprises that may decide to enter the electricity market in Chile. Besides that, it is reasonable to think that interconnection will give the integrated system more stability, and therefore the probability of incurring outage costs will diminish. All the previously mentioned effects of the interconnection are not accounted for in our model but reinforce our results in favor of it.
5. Conclusions
From a conceptual perspective, there is evidence that electricity contract prices for free clients in Chile have a structural dependence on three basic variables: projected market prices (especially spot prices); a mark-up margin essentially determined by the market power of participating firms; and the risks associated with the contract agreements.
Upon a comparison of the simulated scenarios with and without interconnection, the result of the econometric estimation shows that expected prices with interconnection would be lower, due to: (a) a decrease in spot price, compared to predominating SIC prices without interconnection; (b) a lower variability in prices compared to predominating SIC prices without interconnection; and (c) a lower concentration of the interconnected market. This has significant results in macroeconomic terms.
Lower variability of prices and more competition, as a result of the interconnection, represent good news for potential entrants to the Chilean electricity market, in particular to small and medium projects based on renewable energy technologies. Therefore, the benefits are not only lower prices for consumers but also greater care of the environment. It is possible to implement transmission expansions that introduce more competition, reduce contractual risks, and facilitate a low-emission energy matrix.
Finally, it is worth mentioning that the SIC-SING interconnection was approved and it is under construction to be ready in 2018. The social benefit of it has already started. In 2016, auctions for long-term contracts for regulated customers there were an unusual amount of bidders (over 80) and some of the winners made bids considering generation from both SIC and SING, something that was not possible before.
The primary policy implication of this paper lies in the need to include impacts on prices instead of only considering direct costs upon the evaluation of transmission expansions. Otherwise, incorrect decisions can be made due to the under- or over-valuation of the benefits of modifying the transmission grid.
Acknowledgments
The present work was completed under the framework of the “Evaluation of Social and Economic Impacts of a SIC and SING Interconnection” study, commissioned by the National Energy Commission. The authors would like to gratefully acknowledge Mauricio Tejada’s comments. Any errors are the exclusive responsibility of the authors.
Author Contributions
Javier Bustos-Salvagno proposed the general methodology, developed the model, and performed the econometric estimations. Fernando Fuentes H. contributed to develop the economic approach, methodology, and conclusions. All the authors are responsible for analyzing and interpreting the data.
Conflicts of Interest
The authors declare no conflict of interest.
Appendix A

Table A1.
Investment Costs per kW installed by technology for each scenario.
| Investment Costs (USD/kW) | |||||
|---|---|---|---|---|---|
| Technologies | Coal | NCRE | NCREwith High Penetration | Coal-Hydro | LNG |
| Coal | 2750 | 3200 | 3200 | 2750 | 3200 |
| LNG | 1340 | 1340 | 1340 | 1340 | 1340 |
| Solar PV | 2500 | 2100 | 2100 | 2500 | 2500 |
| Wind | 2300 | 1800 | 1800 | 2300 | 2300 |
| Biomass | 2900 | 2400 | 2400 | 2900 | 2900 |
| Hydro | 2100 | 2100 | 2100 | 2100 | 2100 |
| Geothermal | 3550 | 3550 | 3550 | 3550 | 3550 |
Table A2.
Average price reductions by scenario and interconnection alternative.
| Scenarios | Alternative 1 | Alternative 2 | Alternative 3 |
|---|---|---|---|
| Coal | 10.42% | 10.38% | 9.79% |
| NCRE | 10.69% | 10.17% | 10.55% |
| LNG | 9.95% | 9.96% | 9.71% |
| NCREwith high penetration | 10.31% | 9.85% | 9.72% |
| Coal-Hydro | 9.81% | 9.70% | 9.72% |
Table A3.
Average net benefits (investment and operation) of interconnection by scenario.
| Scenario | Million USD |
|---|---|
| Coal | 355.39 |
| NCRE | 180.68 |
| LNG | 325.59 |
| NCRE with high penetration | 338.35 |
| Coal-Hydro | 469.12 |
Table A4.
Summary Statistics of Concentration Indexes.
| Variable | Obs. | Mean | St. Dev. | Min | Max |
|---|---|---|---|---|---|
| Top 1 SING | 305 | 35.92 | 4.46 | 25.25 | 45.06 |
| Top 2 SING | 305 | 54.98 | 5.17 | 41.92 | 61.37 |
| Top 3 SING | 305 | 70.92 | 5.42 | 57.84 | 79.21 |
| Top 1 SIC | 305 | 33.32 | 3.59 | 24.08 | 39.53 |
| Top 2 SIC | 305 | 56.64 | 7.55 | 38.04 | 66.34 |
| Top 3 SIC | 305 | 66.84 | 5.78 | 51.78 | 75.93 |
Figure A1.
Price differentials as a result of the Interconnection by System and Variable, in %.

References
- Wolak, F. Measuring the competitiveness benefits of a transmission investment policy: The case of the Alberta electricity market. Energy Policy 2015, 85, 426–444. [Google Scholar] [CrossRef]
- Awad, M.; Casey, K.; Geevarghese, A.; Miller, J.; Rahimi, A.F.; Sheffrin, A.; Zhang, M.; Toolson, E.; Drayton, G.; Hobbs, B.; et al. Economic Assessment of Transmission Upgrades: Application of the California ISO Approach. In Restructured Electric Power Systems: Analysis of Electricity Markets with Equilibrium Models; Zhang, X.-P., Ed.; Institute of Electrical and Electronics Engineers (IEEE) Press: Piscataway, NJ, USA, 2010. [Google Scholar]
- Spiecker, S.; Vogel, P.; Weber, C. Evaluating Interconnector Investments in the North European electricity System Considering Fluctuating wind power penetration. Energy Econ. 2013, 37, 114–127. [Google Scholar] [CrossRef]
- Lise, W.; Hobbs, B.F.; Hers, S. Market power in the European electricity market—The impacts of dry weather and additional transmission capacity. Energy Policy 2008, 36, 1331–1343. [Google Scholar] [CrossRef]
- Malaguzzi, L. Welfare and competition effects of electricity interconnection between Ireland and Great Britain. Energy Policy 2009, 37, 4679–4688. [Google Scholar] [CrossRef]
- Bustos-Salvagno, J.; Fuentes, F. Economic Effects of Transmission Expansions: The case of the Regulated Contract Market in Chile. IEEE Latin Am. Trans. 2016, 14, 4. [Google Scholar]
- Roubik, E.; Roudnick, H. Assessment of generators strategic behavior in long term supply contract auctions using portfolio concepts. In Proceedings of the IEEE Bucharest Power Tech Conference, Bucharest, Romania, 28 June–2 July 2009. [Google Scholar]
- Varas, P.; Rudnick, H. Empirical Studies of Competition in the Chilean Electricity Market. IEEE Latin Am. Trans. 2014, 12, 8. [Google Scholar] [CrossRef]
- Fabra, N.; Montero, J.P.; Reguant, M. La Competencia en el mercado eléctrico mayorista en Chile. In Informe Fiscalía Nacional Económica; FNE: Santiago, Chile, 2014. [Google Scholar]
- Bustos-Salvagno, J. Bidding behavior in the Chilean electricity market. Energy Econ. 2015, 51, 288–299. [Google Scholar] [CrossRef]
- Bustos-Salvagno, J. El Mercado de Contratos de Suministro Eléctrico en Chile. In Economía y Energía—La Experiencia Chilena, 1st ed.; García, C., Ed.; Ediciones Universidad Alberto Hurtado: Santiago, Chile, 2015. [Google Scholar]
- Wolak, F. Valuing Transmission Investment in a Wholesale Market Regime. In Proceedings of the California Independent System Operation TEAM Meeting, Berkeley, CA, USA, 3 February 2004; CAISO: Berkeley, CA, USA, 2004. [Google Scholar]
- Joskow, P.; Tirole, J. Transmission rights and market power on electric power networks. Rand J. Econ. 2000, 31, 450–487. [Google Scholar] [CrossRef]
- Borenstein, S.; Bushnell, J.; Stoft, S. The Competitive Effects of Transmission Capacity in a Deregulated Electricity Industry. Rand J. Econ. 2000, 31, 294–325. [Google Scholar] [CrossRef]
- Arellano, M.S.; Serra, P. The Competitive Role of the Transmission System in Price-Regulated Power Industries. Energy Econ. 2008, 30, 1568–1576. [Google Scholar] [CrossRef]
- De Nooij, M. Social cost-benefit analysis of electricity interconnector investment: A critical appraisal. Energy Policy 2011, 39, 3096–3105. [Google Scholar] [CrossRef]
- Skoteinos, I.; Orfanos, G.; Georgilakis, P.; Hatziargyriou, N. Methodology for assessing transmission investments in deregulated electricity markets. In Proceedings of the 2011 IEEE Trondheim PowerTech, Trondheim, Norway, 19–23 June 2011; pp. 1–6. [Google Scholar]
- Awad, M.; Casey, K.; Geevarghese, A.; Miller, J.; Rahimi, A.F.; Sheffrin, A.; Zhang, M.; Toolson, E.; Drayton, G.; Hobbs, B.; et al. Using market simulations for economic assessment of transmission upgrades: Application of the California ISO approach. In Restructured Electric Power Systems; Zhang, X.-P., Ed.; John Wiley & Sons Inc.: Hoboken, NJ, USA, 2004. [Google Scholar]
- CAISO. Economic evaluation of Transmission interconnection in a restructured market. In Report Prepared by the California Energy Commission for the Consortium of Electric Reliability Technology Solutions; CAISO: Berkeley, CA, USA, 2004. [Google Scholar]
- Sheffrin, A. Gains from trade and benefits of transmission expansion for the IEEE Power Engineering Society. In Proceedings of the Power Engineering Society General Meeting, San Francisco, CA, USA, 16 June 2005. [Google Scholar]
- Dong, J.; Zhang, J. Transmission Planning in China. Electr. J. 2009, 22, 77–85. [Google Scholar] [CrossRef]
- Sauma, E.; Jerardino, S.; Barria, C.; Marambio, R.; Brugman, A.; Mejía, J. Electric-systems integration in the Andes community: Opportunities and threats. Energy Policy 2011, 39, 936–949. [Google Scholar] [CrossRef]
- Ulloa, H. Interconexión SIC-SING y Emisiones de Carbono del Sector Eléctrico. Master’s Thesis, Pontificia Universidad Católica de Chile, Santiago, Chile, July 2012. [Google Scholar]
- Hemmati, R.; Hooshmand, R.; Khodabakhshian, A. Comprehensive review of generation and transmission expansion planning. IET Gener. Transm. Distrib. 2013, 7, 955–964. [Google Scholar] [CrossRef]
- Ni, F.; Nijhuis, M.; Nguyen, P.; Cobben, J. Variance-Based Global Sensitivity Analysis for Power Systems. IEEE Trans. Power Syst. 2017. [Google Scholar] [CrossRef]
- Fuentes, F.; García, C.J.; Pinto, F. Energía y Ciclo Económico en la Economía Chilena. In Economía y Energía—La Experiencia Chilena, 1st ed.; García, C., Ed.; Ediciones Universidad Alberto Hurtado: Santiago, Chile, 2015. [Google Scholar]
- Energy Information Administration. Technically Recoverable Shale Oil and Shale Gas Resources: An Asseessment of 137 Shale Formations in 41 Countries outside the United States; U.S. Energy Information Administration: Washington, DC, USA, 2013.
- Chávez-Rodríguez, M.; Varela, D.; Rodrigues, F.; Bustos-Salvagno, J.; Köberle, A.; Vasquez-Arroyo, E.; Rabinovich, G.; Rainieri, R. The role of LNG and unconventional gas in the future natural gas markets of Argentina and Chile. J. Nat. Gas Sci. Eng. 2017, 45, 584–598. [Google Scholar] [CrossRef]
- Arellano, M.; Serra, P. A Model of Market Power in Electricity Industries Subject to Peak Load Pricing. Energy Policy 2007, 35, 5130–5135. [Google Scholar] [CrossRef]
- Palacios, M.; Saavedra, E. Alternative policies for the Liberalization of Retail electricity Markets in Chile. Util. Policy 2017, in press. [Google Scholar] [CrossRef]
- Galetovic, A.; Muñoz, C. Regulated Electricity Retailing in Chile. Energy Policy 2011, 39, 6453–6465. [Google Scholar] [CrossRef]
- Galetovic, A.; Muñoz, C.; Wolak, F. Capacity Payments in a Cost-Based Wholesale Electricity Market: The Case of Chile. Electr. J. 2015, 28, 80–96. [Google Scholar] [CrossRef]
- Kyriakopoulos, G.; Arabatzis, G. Electrical energy storage systems in electricity generation: Energy policies, innovative technologies, and regulatory regimes. Renew. Sustain. Energy Rev. 2016, 56, 1044–1067. [Google Scholar] [CrossRef]
- Nissila, E. Levelized cost of HCPV-generated electricity in Chile and Turkey. AIP Conf. Proc. 2015, 1679. [Google Scholar] [CrossRef]
- Mata-Torres, C.; Escobar, R.; Cardemil, J.; Simsek, Y.; Matute, J. Solar polygeneration for electricity production and desalination: Case studies in Venezuela and northern Chile. Renew. Energy 2017, 101, 387–398. [Google Scholar] [CrossRef]
- Aravena, C.; Hutchinson, W.; Longo, A. Environmental pricing of externalities from different sources of electricity generation in Chile. Energy Econ. 2012, 34, 1214–1225. [Google Scholar] [CrossRef]
- Henisz, W.; Zelner, B. The cycling of power between private and public sectors: Electricity generation in Argentina, Brazil, and Chile. In The Manufacturing of Markets: Legal, Political and Economic Dynamics; Cambridge University Press: Cambridge, UK, 2013; pp. 253–270. [Google Scholar]
Figure 1.
Map of Interconnections.

Table 1.
Installed capacity participation by technology in 2015. SIC: Sistema Interconectado Central; SING: Sistema Interconectado del Norte Grande.
Table 1.
Installed capacity participation by technology in 2015. SIC: Sistema Interconectado Central; SING: Sistema Interconectado del Norte Grande.
| Technology | SIC | SING |
|---|---|---|
| Coal | 16.2% | 50.7% |
| Natural Gas | 17.0% | 35.1% |
| Oil | 15.6% | 8.7% |
| Hydropower dams | 21.4% | |
| Run-of-river | 19.3% | 0.4% |
| Wind | 5.2% | 2.2% |
| Solar | 2.8% | 2.5% |
| Others | 2.7% | 0.4% |
Table 2.
Descriptive Statistics.
| Variable | Obs. | Mean | St. Dev. | Min | Max |
|---|---|---|---|---|---|
| Average Free Price | 305 | 153.3 | 65.4 | 33.7 | 456.8 |
| Marginal Cost | 305 | 145.7 | 53.5 | 15.3 | 289.2 |
| HHI per group | 305 | 2564.9 | 800.7 | 1567.1 | 4790.9 |
| VMC | 305 | 40.1 | 9.6 | 15.0 | 49.8 |
| D | 305 | 7.2 | 4.7 | 0.4 | 21.7 |
| S | 305 | 3.8 | 5.4 | 0.0 | 23.8 |
| System | 305 | 0.8 | 0.4 | 0.0 | 1.0 |
Table 3.
Econometric Results.
| Variables | Market Concentration Index | |||
|---|---|---|---|---|
| HHI by Group | Top 1 | Top 2 | Top 3 | |
| C | 0.355 *** | 0.341 *** | 0.357 *** | 0.351 *** |
| MCI | 0.0112 ** | 0.774 * | 0.531 ** | 0.608 ** |
| VMC | 1.606 ** | 1.521 * | 1.727 ** | 1.293 * |
| System | −55.75 ** | −55.72 ** | −67.67 *** | −56.75 ** |
| D | −3.135 *** | −3.034 *** | −3.104 *** | −3.174 *** |
| S | −2.255 *** | −2.221 *** | −2.267 *** | −2.246 *** |
| Observation | 305 | 305 | 305 | 305 |
| R2 | 0.878 | 0.878 | 0.879 | 0.879 |
*** p < 0.01, ** p < 0.05, * p < 0.1.
Table 4.
Average free price differential in simulated scenarios for the SIC, in US$/MWh.
| Scenarios | SIC—Alternative 1 | SIC—Alternative 2 | SIC—Alternative 3 |
|---|---|---|---|
| Coal | 11.41 | 11.34 | 10.68 |
| NCRE | 7.67 | 8.18 | 8.12 |
| LNG | 8.51 | 8.40 | 8.21 |
| NCRE with High Penetration | 6.69 | 7.27 | 6.54 |
| Coal-Hydro | 8.78 | 8.80 | 8.81 |
Table 5.
Average free price differential in simulated scenarios for the SING, in US$/MWh.
| Scenarios | SING—Alternative 1 | SING—Alternative 2 | SING—Alternative 3 |
|---|---|---|---|
| Coal | 12.96 | 12.89 | 12.23 |
| NCRE | 20.02 | 20.53 | 20.47 |
| LNG | 17.43 | 17.32 | 17.14 |
| NCRE with High Penetration | 19.88 | 20.46 | 19.73 |
| Coal-Hydro | 15.06 | 15.07 | 15.08 |
© 2017 by the authors. Licensee MDPI, Basel, Switzerland. This article is an open access article distributed under the terms and conditions of the Creative Commons Attribution (CC BY) license (http://creativecommons.org/licenses/by/4.0/).
Share and Cite
MDPI and ACS Style
Bustos-Salvagno, J.; H., F.F. Electricity Interconnection in Chile: Prices versus Costs. Energies 2017, 10, 1438. https://doi.org/10.3390/en10091438
AMA Style
Bustos-Salvagno J, H. FF. Electricity Interconnection in Chile: Prices versus Costs. Energies. 2017; 10(9):1438. https://doi.org/10.3390/en10091438
Chicago/Turabian StyleBustos-Salvagno, Javier, and Fernando Fuentes H. 2017. "Electricity Interconnection in Chile: Prices versus Costs" Energies 10, no. 9: 1438. https://doi.org/10.3390/en10091438
Note that from the first issue of 2016, this journal uses article numbers instead of page numbers. See further details here.