Characteristics of the Sliding Electric Contact of Pantograph/Contact Wire Systems in Electric Railways


School of Electrical Engineering, Southwest Jiaotong University, Chengdu 610031, China
*
Authors to whom correspondence should be addressed.
Energies 2018, 11(1), 17; https://doi.org/10.3390/en11010017
Submission received: 6 November 2017
/
Revised: 9 December 2017
/
Accepted: 18 December 2017
/
Published: 22 December 2017
(This article belongs to the Section F: Electrical Engineering)
Abstract
:The sliding electric contact of pantograph/contact wire systems plays a significant part in the current collection stability and operation life of pantograph/contact wire systems. This paper addresses the evolutionary process of sliding electric contact of pantograph/contact wire systems by analyzing three key characteristics including contact resistance, temperature distribution and microstructure. The influence of electric current on contact resistance was interpreted. Furthermore, the evolution of the spatial temperature distribution of the carbon strip was obtained in the zigzag movement, while the dominant role of electric effect in temperature rise was demonstrated. In the end, the wear morphology differences under pure friction and current-carrying conditions were analyzed. The formation of radial cracks was illustrated and its influenced on the wear process was discussed.
1. Introduction
Electric contact widely exists in modern engineering, from circuit breakers, electromagnetic guns, electric motors, to pantograph and catenary systems in electrified railways [1,2,3]. In recent years, high-speed railways have been rapidly developing due to their punctuality, conveniences and low environmental pollution in many countries all over the world. In China, according to what has been named the “Mid- and long-term railway network plan”, passenger lines exceeding 16,000 km will be built by the year of 2020. Meanwhile, the work reliability and safety issues of electric railway are gaining more and more attention, and the service property of pantograph/contact wire systems has become a research hotspot [4,5].
The pantograph/contact wire system plays a core role in the energy transit from an overhead contact system to a high-speed train, and a stable current collection for trains is imperative. Ensuring excellent contact between the pantograph and the catenary system is always a goal for many researchers. However, the contact performances are still far from satisfactory at present, as the pantograph and catenary systems inevitably suffer from synthetic impacts of multiple factors, such as wear/friction, arc ablation, as well as environmental erosion, and so forth. The evolutionary process of sliding electric contact for this requires more comprehensive research.
Previous research on pantograph and catenary systems has mainly focused on pantograph arcing phenomena and current-carrying frictions. The electrical parameters of pantograph arcing were systematically investigated under different conditions using AC or DC power sources, and the asymmetry of voltage/current waveforms of pantograph arcing was found, which was closely related to the sliding speed, current and other factors [6,7]. Liu established a pantograph arcing model based on the Mayr’s equation and analyzed the harmonic frequency of electric current [8]. Tellini pointed out that the electromagnetic interference (EMI) level in a process of pantograph rising was much higher than a process of pantograph lowering [9]. Wang studied influences of load characters and power factors on the arc energy, arc voltage and current [10]. Jia and Guan studied the wear resistance of different materials of catenary wires and pantograph strips, respectively [11,12]. In our recent work, the effects of arc ablation on abrasion losses of pantograph strips were investigated [13]. Furthermore, a model of pantograph arcing was established and temperature distributions of pantograph strips and catenary wires were analyzed in the presence of arc discharge [14].
However, contact resistance, as one of the key parameters reflecting the current collection performance, has been paid insufficient attention. The variations of contact resistance of pantograph and catenary system under various electric current and normal forces were analyzed in the static contact condition [15,16]. The variation of contact resistance with time was studied, and the temperature distribution of a carbon strip was obtained in a static contact condition [17]. Moreover, the sliding contact will cause friction effects and arc discharge due to the disconnection between pantograph strips and catenary wires, which are expected to have a significant influence on temperature rise and microstructure. It is believed that the spatial temperature distribution would be an effective reference for estimating the contact status [18], while the microstructure analysis could be used to make out wear mechanisms. Therefore, comprehensive research on sliding electric contact would be helpful for the further comprehension of the service properties of pantograph/contact wire systems.
In this paper, several key characteristics of sliding electric contact, including contact resistance, temperature distribution and microstructure, were investigated. During the zigzag movement, contact resistance was deduced by the recorded voltage and current waveforms, while the synchronized spatial temperature distribution was obtained by an infrared thermometer. The microstructure of carbon strips were analyzed by a scanning electron microscope (SEM) and an energy dispersive spectrometer (EDS) Section 2 describes the laboratorial setup and approach. In Section 3, experimental results are given and discussed. Finally, the major conclusions are given in Section 4.
2. Experimental Setup and Test Details
2.1. Experimental Apparatus
A simulation device of a pantograph and catenary system has been developed. It can simulate a zigzag movement and a vertical vibration of pantograph strips, respectively. As shown in Figure 1, the simulation device consists of a single-phase power supply, resistances, an inductance, the wheel, the catenary wire and the pantograph strip.
The AC power supply efficiently realizes a stable output current from 0 to 200 A using electrical electronic technology, and the multiple load characteristics of trains can be simulated through adjustable resistances and inductance loads. The catenary wire is fixed around the rotary wheel driven by the adjustable frequency motor, whose linear speeds are obtained through controlling the motor speed. Figure 2 shows photographs of motion units, and the reciprocating motion of carbon strips in the left and right directions is controlled by a rotation of roller screws, which are driven by servo motors. Meanwhile, the lifting motion of carbon strips is also carried out through servo motors. Different normal force can be simulated by means of changing the cylinder pressure. During the course of the experiment, electric current comes from a single-phase power supply, flowing through the catenary wire, the pantograph strip, an inductance, resistances, and finally returns to the power supply.
2.2. Parameters of the Catenary Wire and Pantograph Strip
The catenary wire is made of copper magnesium alloy materials, and the pure carbon strip is widely applied in high-speed railway. Physical dimensions of the pure carbon strip are 200 mm in length, 30 mm in width and 20 mm in thickness. Table 1 shows basic parameters of the catenary wire. Meanwhile, Table 2 and Table 3 show chemical components and physical parameters of the carbon strip.
2.3. Measurement Details and Test Parameters
As shown in Figure 1, contact voltages between the axle of a rotary wheel and a carbon strip were measured by a high voltage probe (TPP0250, Tektronix (China) Co., Ltd., Shanghai, China) and currents were measured by an AC current clamp (i400, Fluke (Shanghai) Corporation, Shanghai, China). In addition, two-dimension infrared imageries of carbon strips were obtained by an infrared camera of NEC InfRec R500 series (Nippon Avionics Co., Ltd., Tokyo, Japan) and the measurement range of infrared cameras is from 0 to 2000 °C. The accuracy of temperature measurement is ±1 °C, and the temperature resolution is 0.05 °C. After experiments, pure carbon strips were disassembled for microstructure examination by a scanning electron microscope (JSM-7001F, JEOL (Beijing) Co., Ltd., Beijing, China) and an energy dispersive spectrometer (QX200, Bruker (Beijing) technology Co., Ltd., Beijing, China).
The experimental parameters of currents were set as 40, 60, 80, 100, 120, 140 and 160 A, and the speed was set as 30 km/h. The normal force was set as 80 N, which was in accordance with operating conditions [19].
3. Results and Discussion
3.1. Contact Resistance
Figure 3 shows the typical contact voltage and electric current waveforms under a speed of 30 km/h, a current of 80 A and a normal force of 80 N. Those are present in the shape of sinusoid as a whole, and the distortion of the voltage waveform between 379.95 s and 380 s demonstrates the generation of pantograph arcing, which results from the disconnection of pantograph and catenary system. The voltage amplitude reaches about 2 V when the contact status between carbon strips and contact wires keeps well.
In the graph below, phases of contact voltage and electric current waveforms remain the same because of the electrical resistance property in contact zones. Hence contact resistances can be acquired by means of Ohm’s law. Contact resistances were one of the key parameters of the electric contact property, and the normal force had a highly influence on contact resistances [15,16]. Therefore contact resistance can reflect the contact status between carbon strips and contact wires.
The variation of contact resistances under different electric currents was shown in Figure 4. The speed and normal force did not change. Each data of contact resistance in the diagram is an average value through several measurements. In the graph above, at first the resistance value decreases quickly with an increase of electric current. Finally, the resistance value decreases from 0.073 Ω to 0.027 Ω when the current changes from 40 A to 160 A. Nevertheless, the resistance value decreases slowly from 0.034 Ω to 0.027 Ω when the current increases from 100 A to 160 A.
During the sliding electric contact, a few contact spots in the contact zone have a physical connection because of the contact material surfaces are not flat. Contact spots providing the conducting paths for the transfer of electric current are termed a-spots. When the current flows past contact spots, joule heat is produced at the contact surface. Meanwhile, the temperature rise caused by the joule heat, friction heat and pantograph arcing brings about a change in physical properties of the contact materials. On the one hand, the metal hardness has a negative exponent relation to the temperature. As the current increases, the hardness of the catenary wire decreases due to an increase of the contact surface temperature Contact materials will even soften because of the high temperature. The real contact area of friction pairs enlarges under the effect of the normal force, which causes the enlargement of the radius of contact spots and the amount of contact spots. Finally, the value of contact resistance decreases due to the enhancement of the real contact area [20]. On the other hand, the catenary wire surface will be covered with some oxide films at room temperature, which has a lubrication action in the contact surface. Oxide films will be cracked due to the action of the normal force and shear force during the zigzag movement [21]. Then the amount of contact spots increases because of the fracture of oxide films, and the contact resistance finally decreases. However, the electrical resistivity of copper increases as the current increasing continually, and the oxide films will form on the contact wire surface because of the high temperature. The above results hinder the decreases of contact resistance. In addition, the surface profiles of carbon strips become much rougher as electric current increasing [13], and then the real contact area reduces, which also prevents the contact resistance from decreasing. Therefore, the reduction of contact resistance becomes slow with the continued increase of electric current.
3.2. Temperature Characteristics of the Carbon Strip
The research of sliding electrical contact is normally linked to an evolution of the transient temperature rise of contact pairs. During the continuously sliding, the contact surface temperature affects several important material properties and causes wear loss of pantograph strips increasing. Compared with a measuring method of using thermocouples, the temperature distribution acquired through an infrared camera can reflect a processes of heat conduction inside carbon strips with time. As well, the heat concentrated area of carbon strips can be found through analyzing the temperature distribution, and contact materials at the heat concentrated area will be easily destroyed. Hence, it is very important to investigate the temperature distribution in order to better understand a degradation process of carbon strips.
Typical infrared images of strips without or with electric current were obtained in a laboratory simulation test, as shown in Figure 5. The sliding speed, electric current and normal force was set as 30 km/h, 80 A and 80 N, respectively. It is clearly observed that temperature rise of the pure carbon strip under current-carrying condition is significantly higher than under pure friction condition by comparing Figure 5a with Figure 5b. First of all, the whole carbon strip temperature has increased by about 3 °C relative to the 20 °C environment temperature after half an hour, which is equally distributed, as shown in Figure 5a. Secondly the highest temperature region is focused on the contact area, and temperature of the pure carbon strip decreases gradually with greater distances away from contact points in Figure 5b. In addition, temperature of the catenary wire is obviously lower than carbon strips.
During the zigzag movement without current, partial mechanical energy is converted into the heat at the contact interface through the friction effect. The strip temperature finally reaches to 22.8 °C after 30 min. Once electric current is loaded, the contact surface suffers from the friction effect, joule heat and arc discharge. Temperature of the pure carbon strip reaches to about 100 °C after half an hour. Therefore, the current has a dominant influence on temperature rise of carbon strips. Meanwhile the thermal conduction phenomenon can be clearly observed due to the existence of temperature gradient as shown in Figure 5b, which finally brings about an increase of the bulk temperature of carbon strips with time. In addition, temperature of the catenary wire remains at a lower level because of the rotation of the catenary wire and the thermal conductivity of copper is significantly higher than that of carbon.
Figure 6 shows a change of temperature distribution of pure carbon strips five seconds after the generation of pantograph arcing. Electric current, normal force, and the speed were set as 80 A, 80 N and 30 km/h, respectively. As shown in Figure 6a, temperature of the catenary wire reaches about 50 °C at 0.4 s in area A. Because the joule heat and friction heat are very small at the beginning of the experiment, the sudden rise of temperature can be considered the effect of pantograph arcing. Then the catenary wire and pantograph strip have a good contact in Figure 6b, and meanwhile the heat generated by pantograph arcing will conduct to the low temperature region of the pure carbon strip. As shown in Figure 6f, two heat accumulation regions are formed in area A at 4.2 s as a result of heat conduction process inside the pure carbon strip. In addition, two heat accumulation regions gradually merge together and become a local area with high temperature at area A in Figure 6g,h with time because of the effect of heat conduction. Since the temperature distribution of the pure carbon strip at area B in Figure 6b is quite similar to that at area A in Figure 6f, it can be considered that the formation of heat accumulation regions at area B in Figure 6b are also caused by pantograph arcing. The generation of arc in area B is occurs earlier than that in area A. Finally the temperature increases in most areas of the pure carbon strip. Therefore, it is supposed that the heat accumulation regions will be formed in different locations of the pure carbon strip during the zigzag movement. In the end, the bulk temperature of the pure carbon strip will increase in a short time with the diffusion and meld of heat accumulation regions.
Temperature of the contact point with time is extracted from the recorded infrared images, as shown in Figure 7. When electric current is in absence, the temperature value experiences a fluctuation with time, as shown in Figure 7a. During the sliding contact, the normal force of pantograph and catenary system presents a vibration in a certain range [22], which results in the change of friction heat. It is obviously found that the friction heat has little contribution to the temperature rise of the carbon strip when the speed is 30 km/h, which is no more than 3 °C after 30 min. When electric current is loaded, the temperature of the contact point rises fast with time initially, and reaches a steady state at last, as shown in Figure 7b. The power consumption caused by contact resistance is converted into joule heat on the contact surface while the current flows past contact spots. Besides the heat generated by pantograph arcing brings about the temperature rise of a local area of the pure carbon strip in a short time. Finally, the temperature rise of the contact point is no less than 80 °C when the current is 80 A, which is much greater than the previous 3 °C when the current is zero. Hence the electric effect plays a dominant role in temperature rise of the pure carbon strip.
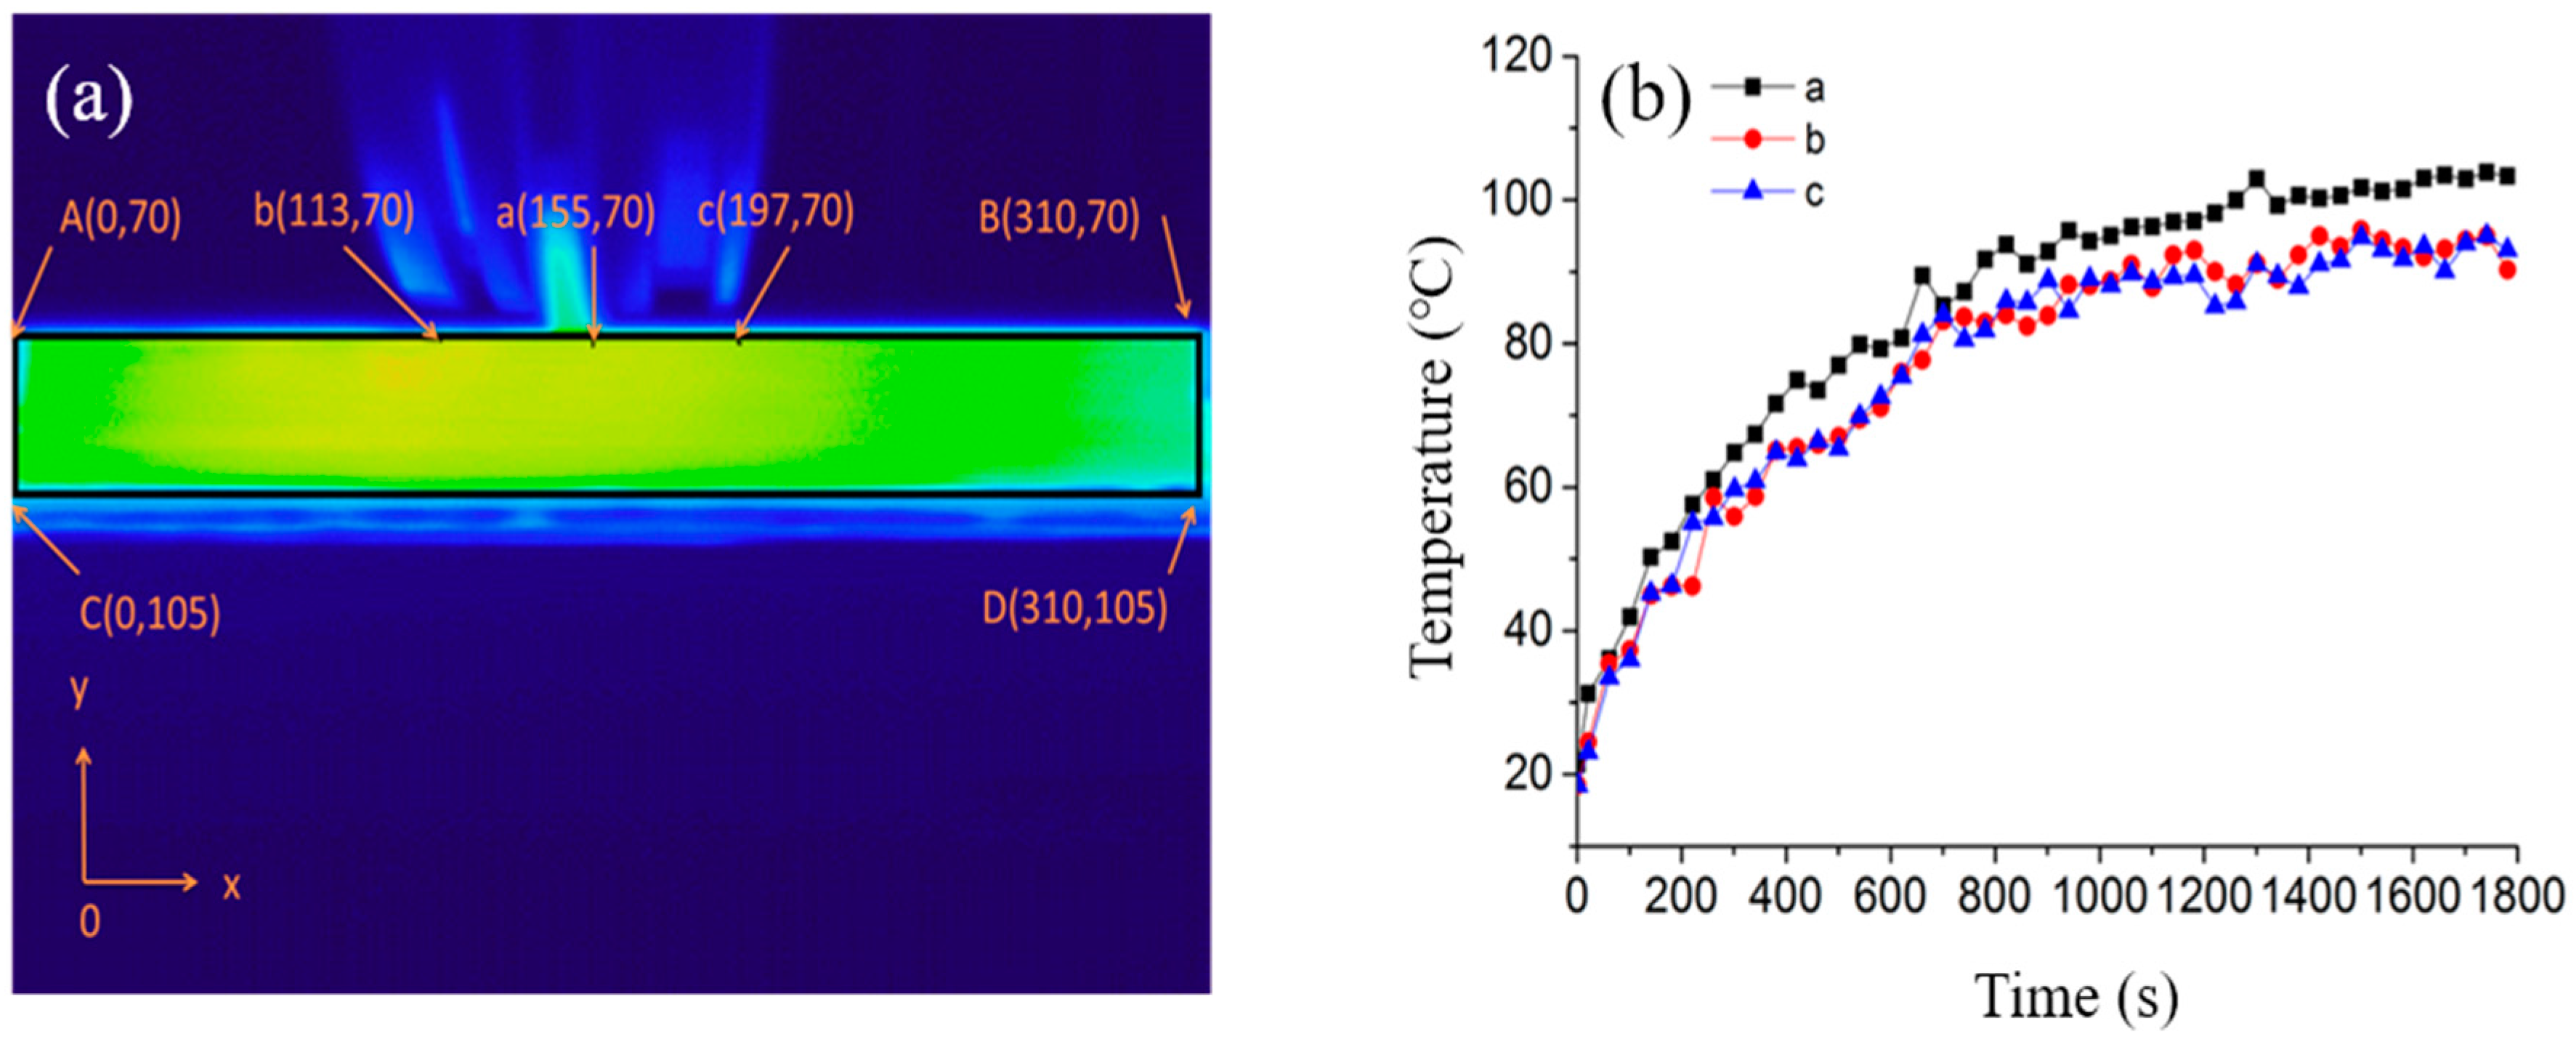
To acquire a quantitative knowledge about the temperature variation of different locations of the pure carbon strip, three specific points are chosen within a moving coordinate system in Figure 8a. Temperatures of the three contact points present a similar variation tendency, whilst the temperature values of point b and c are slight lower than the central point a, as shown in Figure 8b. The larger temperature gradient to the outward carbon strip of point b and c leading to a more efficient thermal conduction, is attributed to the lower temperature value compared with that of point a. In addition, temperatures of point b and c keep pace with each other all the time, which suggests a good symmetry of the spatial temperature distribution.
3.3. Morphology of the Pure Carbon Strip
Worn morphologies of the strip are provided in Figure 9. The original surface of a pure carbon strip is quite smooth with no visible scrape as shown in Figure 9a. After half an hour of sliding contact with or without electric current, the surface morphologies of strips appear remarkable differences from color to morphologies, as shown in Figure 9b,c, which can be divided into seven typical areas.
Material transfer areas (region 1)—The worn surface is covered with a thin layer of rust-red materials, which can be inferred as oxide of copper. The friction between pantograph strip and catenary wire will make major contributions to the phenomenon of material transfer without current.
Uneven distribution areas (region 2)—Parts of the surface are not evenly coated with the rush-red materials unlike the region 1, which can be the evidence of the fluctuation of normal force as the same in operating condition. Elementary compositions of the uneven distribution area are given in Table 4.
Bright areas (region 3)—The bright area is smoother and brighter than the original surface, and it may result from the formation and deposition of oxide. Elementary compositions of the bright area are given in Table 5. Abundant element oxygen can be found compared with the element percentage of the original strip.
Pits (region 4)—There are many pits distributed widely on the worn surface, which have a much smaller diameter than the crater. The pits are generally supposed to be a result of the spark discharge (with lower energy than the pantograph arcing).
Dark stream lines (region 5)—Dark stream lines can be found following the same direction as the catenary wire sliding. The trajectory of the dark stream line is a direct reflection of the arc root transferring. As a result of the arc ablation, the copper oxide (with a darker color than the carbon strip material) will gradually be deposited on the pure carbon strip along the arc root trajectory.
Dull-red areas (region 6)—There are some dull-red areas around dark stream lines, which demonstrates that catenary wire materials are gradually transferred to the pure carbon strip.
Craters (regions 7)—The macroscopic craters with typical diameter of millimeter level are located in the arc ablation zone, attributing to the direct impact of arc discharge. The formation process will be shown in the following part.
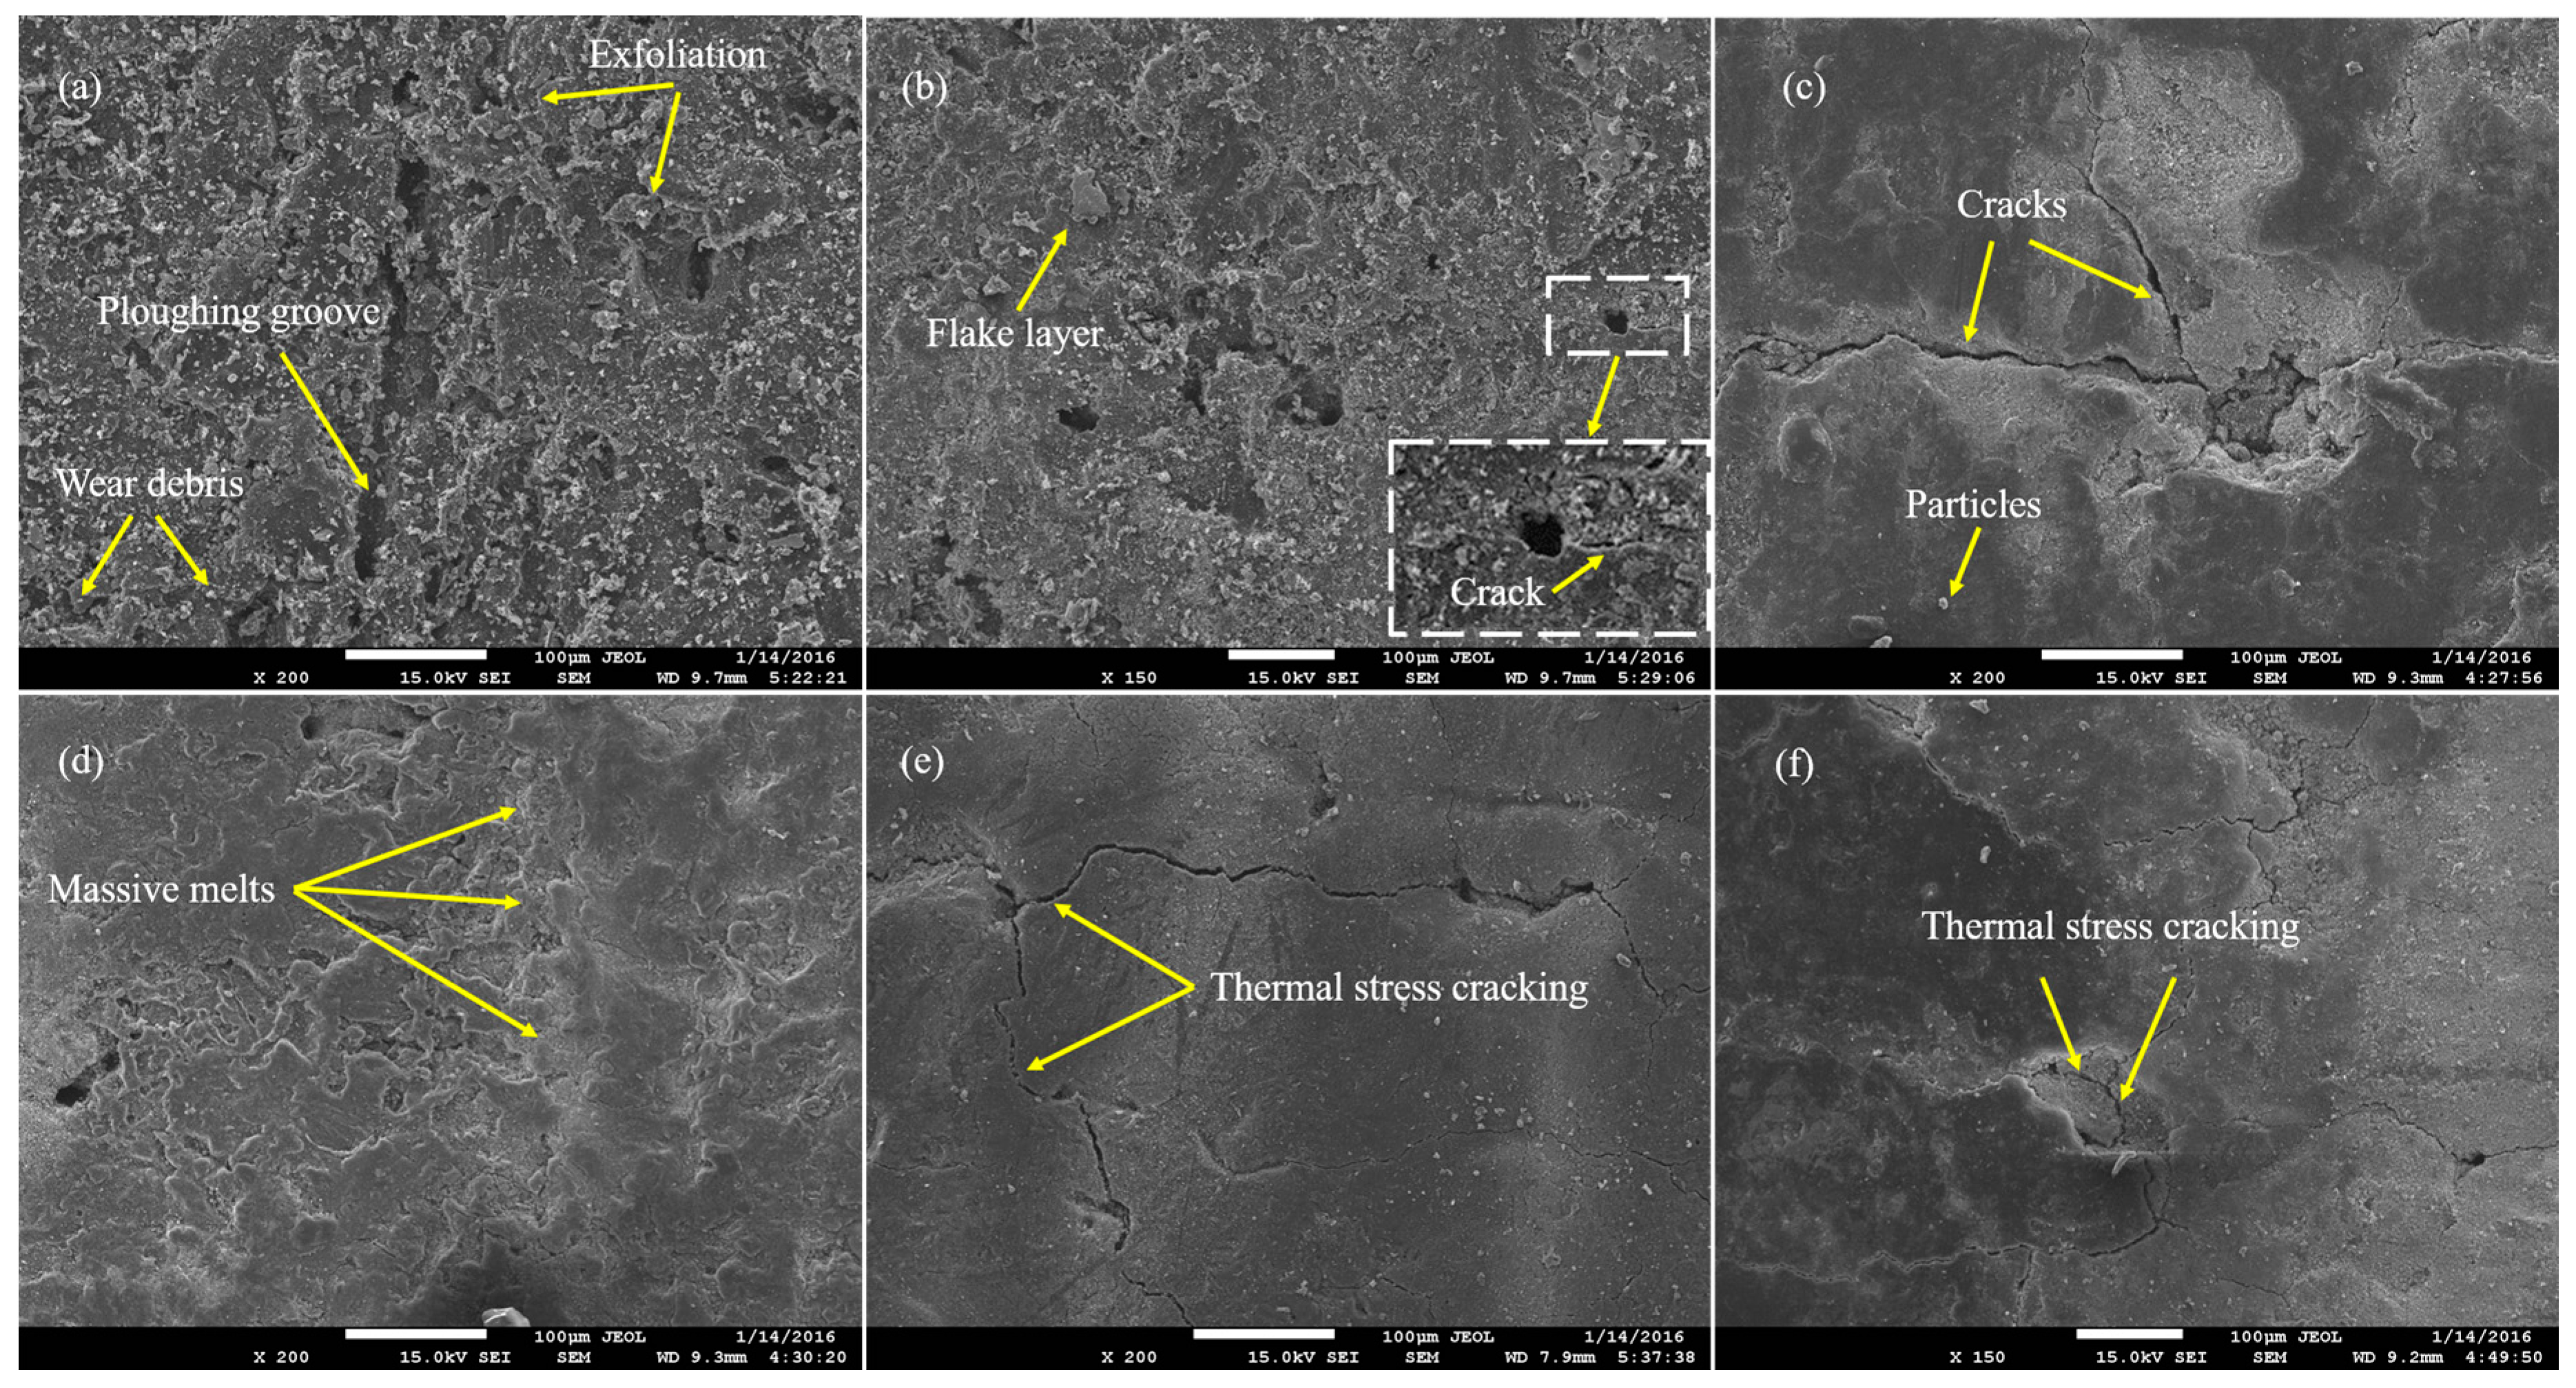
The SEM images of different regions of pure carbon strips without or with electric current are shown in Figure 10, respectively. From the comparison between Figure 10a,b and Figure 10c–f, we can see that the strip surface after pure sliding friction is rather rough, covered with wear debris, while the loading of current will significantly improve the surface morphology. Due to the action of electric current, the strip surface will be soften or even melted while the wear debris may be wrapped in the molten metal-oxide with the effect of normal pressure and friction. Finally, the strip surface can turn into a much denser and smoother status with less wear debris during the current-carrying sliding process.
Figure 10a presents the enlarged pictures of uneven distribution areas, where slightly ploughing grooves, wear debris and exfoliation on the worn surface can be found. The flake layer and cracks can be found in Figure 10b, which corresponds to the material transfer area. The comparison between Figure 10a and Figure 10b implies that the transferred copper material through the friction effect has no significant influence on microstructures of the pure carbon strip on this occasion. The formation of the abundant wear debris can be understood from the following process. At the interface of catenary wires and carbon strips, the effective contact is realized by coupled salient points on the micro level. The temperature of coupled salient points will reach a relatively high degree by local friction effect and stick together, becoming the so-called “adhesion points”. Then, the adhesion points are sheared and fractured by the shear stresses in the process of sliding contact without current. Finally, the materials that are removed during the shearing process provide the wear debris. Furthermore, the formed wear debris which are squeezed between the friction couple scratch the strip surface during the sliding process, and then ploughing grooves appearance on the strip surface. The above mentioned wear debris and groove provide evidences for the adhesion wear and abrasive wear mechanisms. Moreover, formation of the crack, the exfoliation and the flake layer can be explained from the aspect of fatigue wear. The catenary wire and carbon strip suffer from the repeated shock and squeezing by compressive stresses. The stresses result in an elastic deformation and a plastic deformation of materials, bringing out the material fatigue. Once the materials come into the fatigue status, micro-cracks will take place, grow, and then connect together with the action of friction. Finally, materials of the pure carbon strip flake off.
SEM images of bright areas are shown in Figure 10c,d. Both phenomena of the massive melts and cracks can be found. The massive melts highly suggest the existence of the transferred metal materials or their oxides. As given in Table 5, the corresponding energy dispersive x-ray (EDS) analysis for the bright areas provides direct evidence for the above judgment. Figure 10e,f present the partial enlarged details of pits and craters. The heat energy generated by spark or pantograph arcing causes the formation of thermal stress cracks, simultaneously resulting in melting metal materials and gasifying carbon materials. Then, pits and arc ablation craters are formed on the worn surface, and the thermal stress cracks can be found in Figure 10e,f. The maximum width of thermal stress cracks reaches up to 3 μm, as shown in Figure 10e. Meanwhile, the EDS analysis, as given in Table 6, indicates that the phenomenon of material transfer occurs due to the abundant copper in the crater. Compared to the mechanical stress crack under the pure friction condition, as shown in Figure 10b, the thermal stress cracking is a particular morphology due to the high temperature caused by electric current. In addition, it is interesting to note that the different cracks trace gather together in the area of pits or the arc ablation craters.
When the air gap between the catenary wire and carbon strip is broken down by the electrode field, an arc occurs along with the formation of electric channels. The electrons bombard the electrode surface with a high speed, converting kinetic energy into the heat energy. Whereafter carbon strip materials will be gasified or oxidated by the high temperature caused by the arc. At the same time, the intense heat released by pantograph arcing is injected into a rather small region, resulting in a great temperature gradient, and then the corresponding thermal stress leads to the final formation of the radial cracks, as shown in Figure 10e,f. Because the temperature gradient of carbon strip materials at arc root is extremely high after the generation of the arc, carbon strip materials will dilate due to the thermal stress, and then the materials will shrink with the extinction of the arc. Moreover, the intense expansion and contraction will bring about the thermal fatigue of carbon strip materials, making the original cracks further expand. Finally, the crack region may have a risk of the fracture of carbon strip materials, causing a malfunction of the high speed train. In addition, the surface profiles of the pure carbon strip become much rougher due to the formation of arc ablated carters, which brings about an increase of wear loss of pantograph strips.
4. Conclusions
This paper addresses the evolutionary process of sliding electric contact of pantograph and catenary system by analyzing the three key characteristics, including contact resistance, temperature distribution and microstructure. The major conclusions are drawn as follows:
- (1)
- Contact resistance decreases rapidly at first as an increase of current, and then the reduction of contact resistance becomes slow. When electric current increases from 100 A to 160 A, the resistance value decreases from 0.034 Ω to 0.027 Ω.
- (2)
- The electric effect takes a dominant role in the temperature rise of carbon strips through comparative tests, and heat accumulation regions are formed due to pantograph arcing. A local area with high temperature is formed with the diffusion and meld of heat accumulation regions. In addition, the spatial temperature of the strip possesses a rather symmetrical distribution. The temperature of the strip rises fast with time initially, and finally comes to a steady state.
- (3)
- The wear morphology differences under pure friction and current-carrying conditions are found. From the macro-morphology, the worn surface is blanketed with a layer of rust-red materials transferred from the catenary wire, while the loading current can significantly change the rust-red layer into a much more complex morphology. From the micro-structures, the worn surface is rather rough and covered with much wear debris in pure friction condition. However, the worn surface can turn into a much denser and smoother status with some melts in current-carrying condition.
- (4)
- The radial cracks are formed in pits or craters after the arc ablation, and the crack region may have a risk of the fracture of carbon strip materials, which will become vulnerable spots during the current-carrying wear process.
- (5)
- This work will be useful to understand a degradation process of carbon strips in operating conditions, and may have a guiding significance in predicting the service life of carbon strips.
Acknowledgments
Authors are grateful for supports of National Natural Science Foundation of China (Grant Number: 51577158, 51325704, 51607147), and the Special Funds of Basic Scientific Research for Central University of the Ministry of Education (2682016CX039).
Author Contributions
Wenfu Wei, Guoqiang Gao and Guangning Wu designed the experiments; Wenfu Wei, Jie Wu and Yue Zhou carried out the experiment; Zefeng Yang and Guoqiang Gao analyzed the experimental data; Wenfu Wei and Jie Wu and Guangning Wu wrote the papers. Jie Wu and Zefeng Yang revised the paper.
Conflicts of Interest
No conflict of interest exits in this manuscript, which is approved by all authors for publication.
References
- Bulucea, C.A.; Rosen, M.A.; Nicola, D.A.; Mastorakis, N.E.; Bulucea, C.A. Approaching the Processes in the Generator Circuit Breaker at Disconnection through Sustainability Concepts. Sustainability 2013, 5, 1161–1176. [Google Scholar] [CrossRef]
- Meyer, R.T.; DeCarlo, R.A.; Dickerson, J. Energy Transfer Efficiency Optimization in an Electromagnetic Railgun. IEEE Trans. Plasma Sci. 2017, 45, 702–710. [Google Scholar] [CrossRef]
- Wang, J.; Yang, Z.; Lin, F.; Cao, J. Harmonic Loss Analysis of the Traction Transformer of High-Speed Trains Considering Pantograph-OCS Electrical Contact Properties. Energies 2013, 6, 5826–5846. [Google Scholar] [CrossRef]
- Bucca, G.; Collina, A. A procedure for the wear prediction of collector strip and contact wire in pantograph-catenary system. Wear 2009, 266, 46–59. [Google Scholar] [CrossRef]
- Yang, H.; Chen, G.; Gao, G.; Wu, G.; Zhang, W. Experimental research on the friction and wear properties of a contact strip of a pantograph-catenary system at the sliding speed of 350 km/h with electric current. Wear 2015, 332, 949–955. [Google Scholar] [CrossRef]
- Midya, S.; Bormann, D.; Schutte, T.; Thottappillil, R. Pantograph arcing in electrified railways—Mechanism and influence of various parameters: Part II—With AC traction power supply. IEEE Trans. Power Deliv. 2009, 24, 1940–1950. [Google Scholar] [CrossRef]
- Midya, S.; Bormann, D.; Schutte, T.; Thottappillil, R. Pantograph arcing in electrified railways—Mechanism and influence of various parameters: Part I—With DC traction power supply. IEEE Trans. Power Deliv. 2009, 24, 1931–1939. [Google Scholar] [CrossRef]
- Liu, Y.; Chang, G.; Huang, H. Mayr’s Equation-Based Model for Pantograph Arc of High-Speed Railway Traction System. IEEE Trans. Power Deliv. 2010, 25, 2025–2027. [Google Scholar] [CrossRef]
- Tellini, B.; Macucci, M.; Giannetti, R.; Antonacci, G.A. Conducted and radiated interference measurements in the line-pantograph system. IEEE Trans. Instrum. Meas. 2001, 50, 1661–1664. [Google Scholar] [CrossRef]
- Wang, B.; Wu, G.; Zhou, L.; Gao, G.; Wang, W.; Liu, D.; Li, D.; Li, T. Pantograph Arc’s Energy Characters under Various Load. In Proceedings of the 2011 IEEE 57th Holm Conference on Electrical Contacts, Minneapolis, MN, USA, 11–14 September 2011; pp. 1–5. [Google Scholar]
- Jia, S.; Liu, P.; Ren, F.; Tian, B.; Zheng, M.; Zhou, G. Sliding wear behavior of copper alloy contact wire against copper-based strip for high-speed electrified railways. Wear 2007, 262, 772–777. [Google Scholar] [CrossRef]
- Guan, B.; Zhang, Y.; Xing, J.; Sun, L.; Chen, Y. Comparative Study on Wear Behaviors of Metal Impregnated Carbon Material and C/C Composite under Electrical Sliding. Tribol. Trans. 2010, 53, 933–938. [Google Scholar] [CrossRef]
- Ding, T.; Chen, G.; Li, Y.; Yang, H.; He, Q. Arc erosive characteristics of a carbon strip sliding against a copper contact wire in a high-speed electrified railway. Tribol. Int. 2014, 79, 8–15. [Google Scholar] [CrossRef]
- Zhu, G.; Gao, G.; Wu, G.; Gu, Z.; Wu, J.; Hao, J. Modeling Pantograph-Catenary Arcing. Proc. Inst. Mech. Eng. Part F J. Rail Rapid Transit 2016, 230, 1687–1697. [Google Scholar] [CrossRef]
- Ocoleanu, C.F.; Manolea, G.; Cividjian, G. Experimental Study of Contact Resistance Variation for Pantograph-Contact Line Contact. In Proceedings of the International Conference on Risk Management, Assessment and Mitigation, Bucharest, Romania, 20–22 April 2010; pp. 101–105. [Google Scholar]
- Wang, W.; Dong, A.; Wu, G.; Gao, G.; Zhou, L. Study on Characterization of Electrical Contact between Pantograph and Catenary. In Proceedings of the 2011 IEEE 57th Holm Conference on Electrical Contacts, Minneapolis, MN, USA, 11–14 September 2011; pp. 1–6. [Google Scholar]
- Wu, G.; Wei, W.; Gao, G.; Wu, J.; Zhou, Y. Evolution of the electrical contact of dynamic pantograph-catenary system. J. Mod. Transport. 2016, 24, 132–138. [Google Scholar] [CrossRef]
- Ge, X.; Liu, W.; Yang, Z.; Wang, Y. The Study on Electrical Temperature Characteristics of High Speed Pantograph. In Proceedings of the 2014 IEEE Transportation Electrification Conference and Expo (ITEC Asia-Pacific), Beijing, China, 31 August–3 September 2014; pp. 1–4. [Google Scholar]
- Wu, J. Pantograph and Catenary System; Southwest Jiaotong University Press: Chengdu, China, 2010; pp. 36–37. [Google Scholar]
- Kogut, L.; Komvopoulos, K. Electrical contact resistance theory for conductive rough surfaces. J. Appl. Phys. 2003, 94, 3153–3162. [Google Scholar] [CrossRef]
- Wang, Y.; Li, J.; Yan, Y.; Qiao, L. Effect of electrical current on tribological behavior of copper-impregnated metallized carbon against a Cu-Cr-Zr alloy. Tribol. Int. 2012, 50, 26–34. [Google Scholar] [CrossRef]
- Zhou, N.; Zhang, W. Investigation on dynamic performance and parameter optimization design of pantograph and catenary system. Finite Elem. Anal. Des. 2011, 47, 288–295. [Google Scholar] [CrossRef]
Figure 1.
Schematic of the experimental apparatus, involving (S) a power supply, (L) an electric reactor, (R) resistor discs, (W) a steel wheel, (CW) contact wires, (A) an AC current clamp, (V) a high-voltage probe, (P) pantograph strips, (C) an infrared camera and (MR) a multichannel recorder.
Figure 1.
Schematic of the experimental apparatus, involving (S) a power supply, (L) an electric reactor, (R) resistor discs, (W) a steel wheel, (CW) contact wires, (A) an AC current clamp, (V) a high-voltage probe, (P) pantograph strips, (C) an infrared camera and (MR) a multichannel recorder.
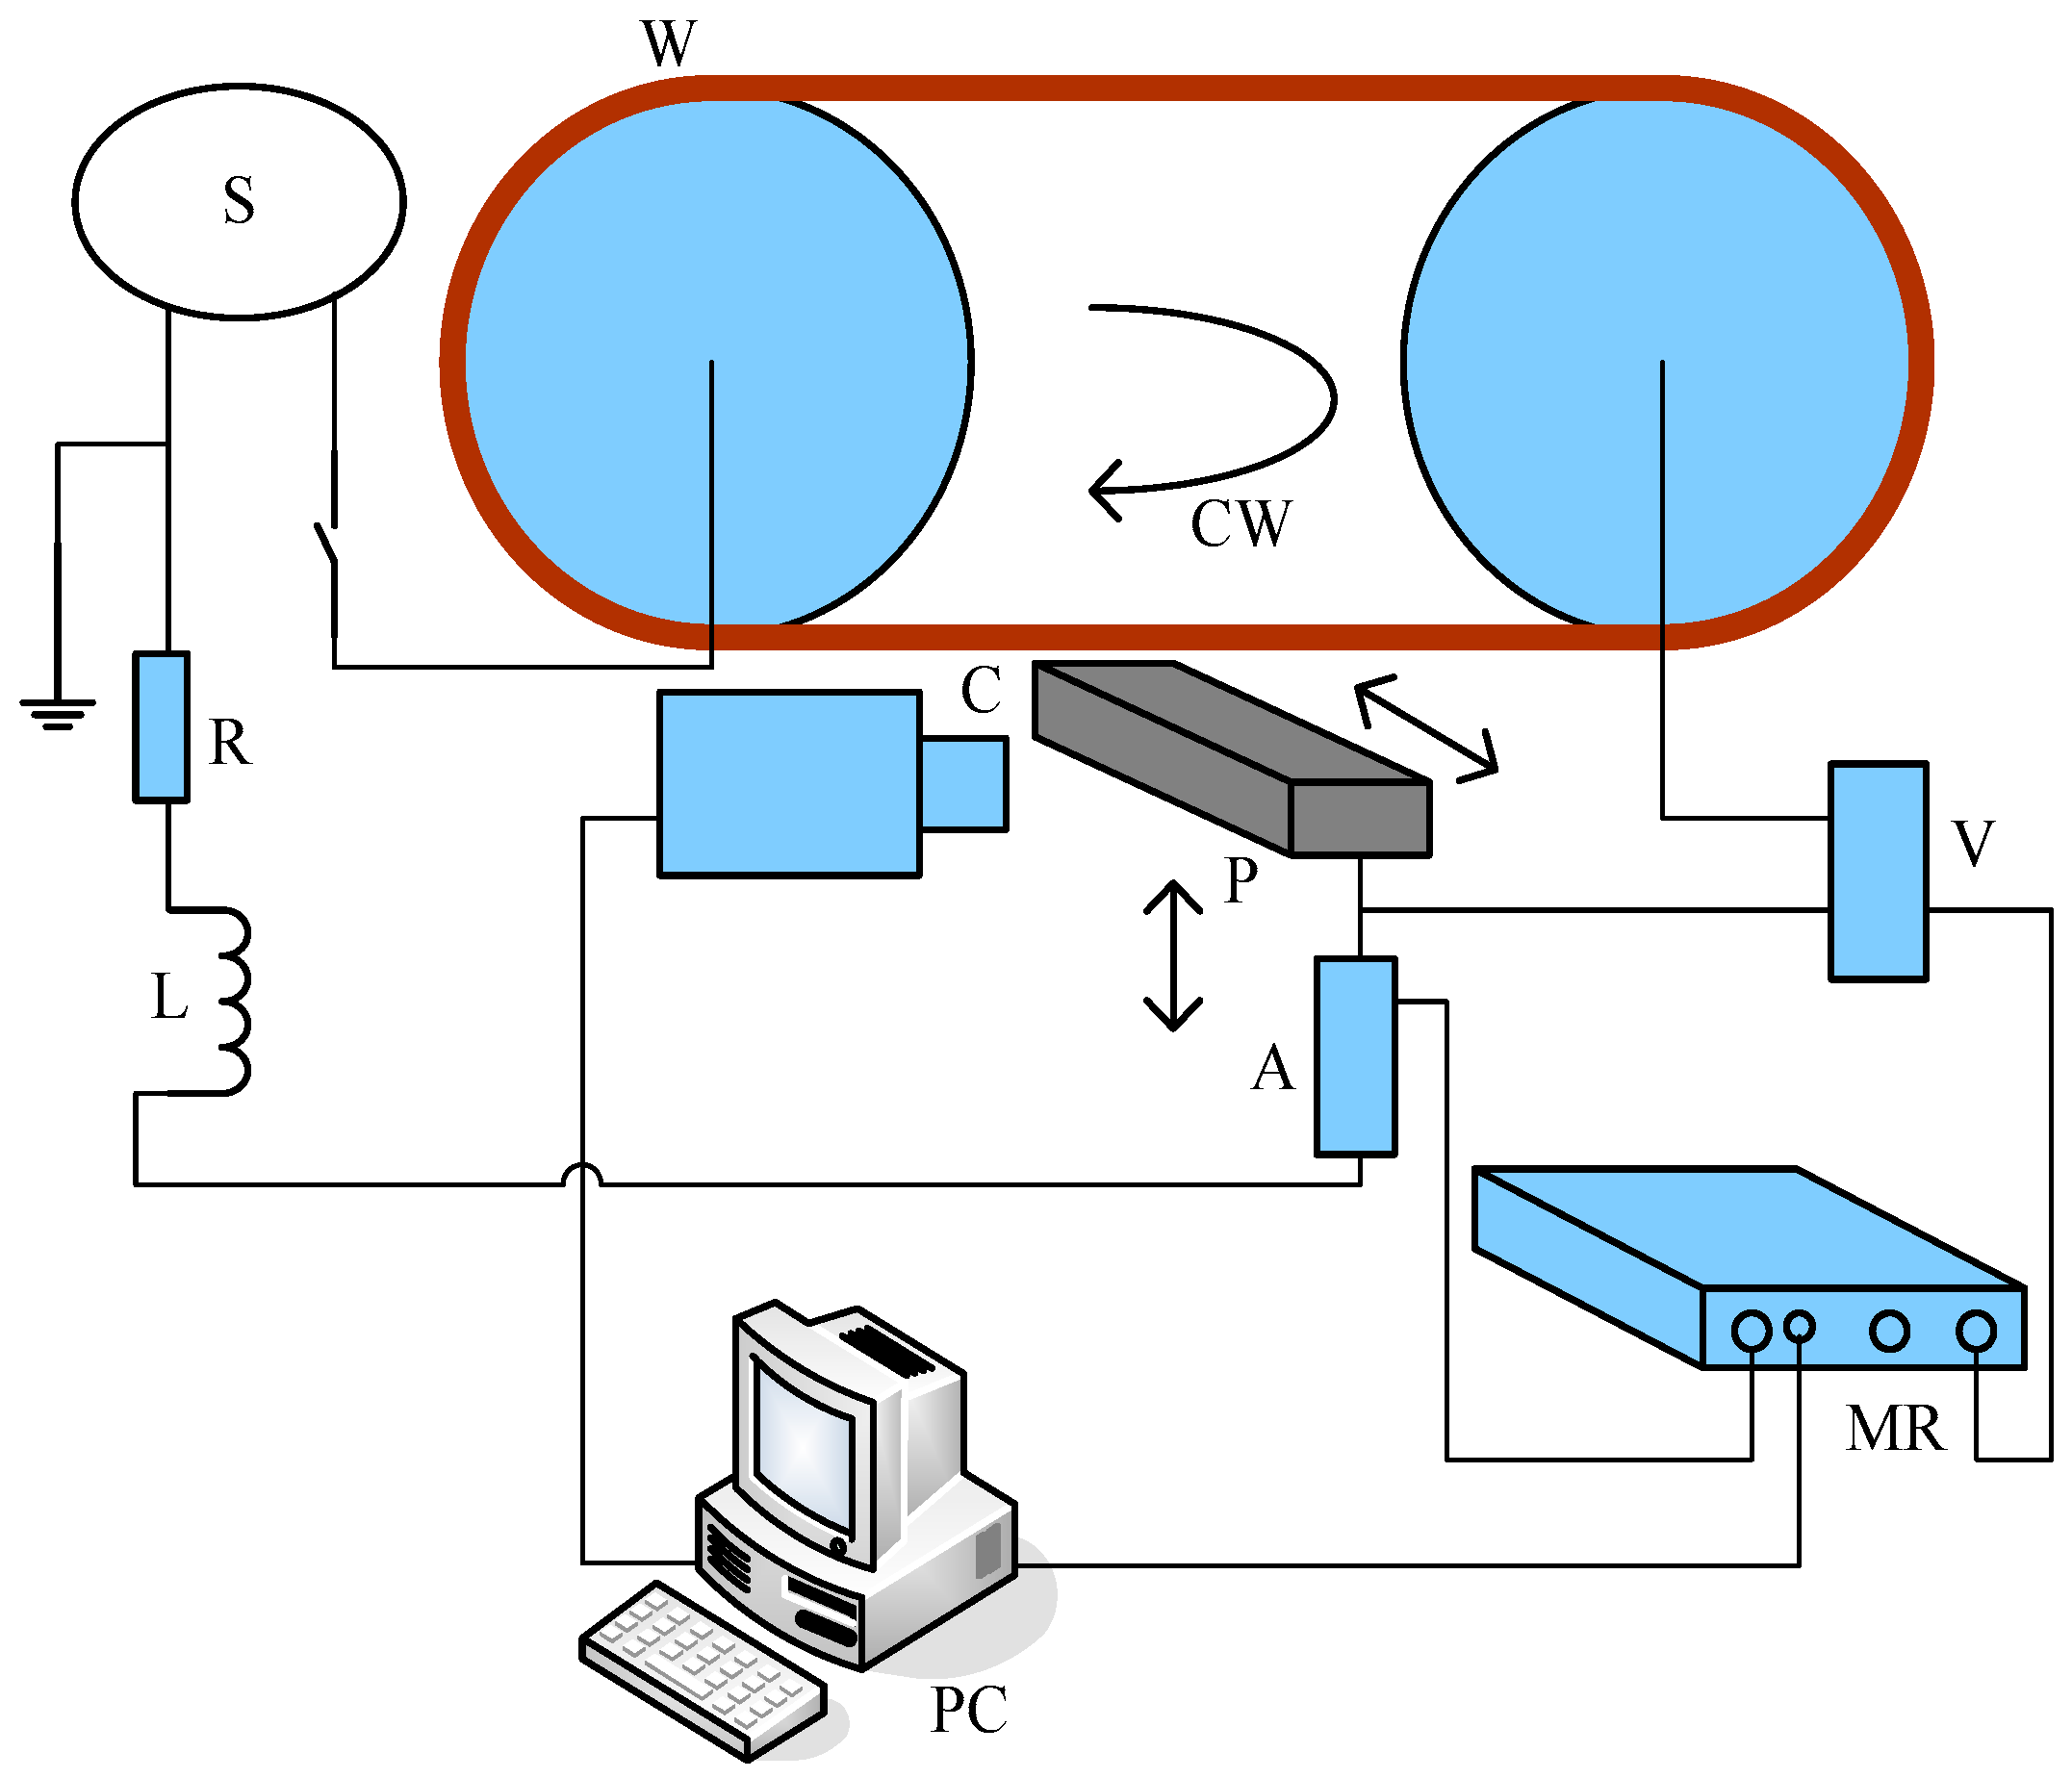
Figure 2.
Photographs of the experimental apparatus.

Figure 3.
Electric current and voltage waveforms with time.

Figure 4.
Variation of contact resistances with electric current.
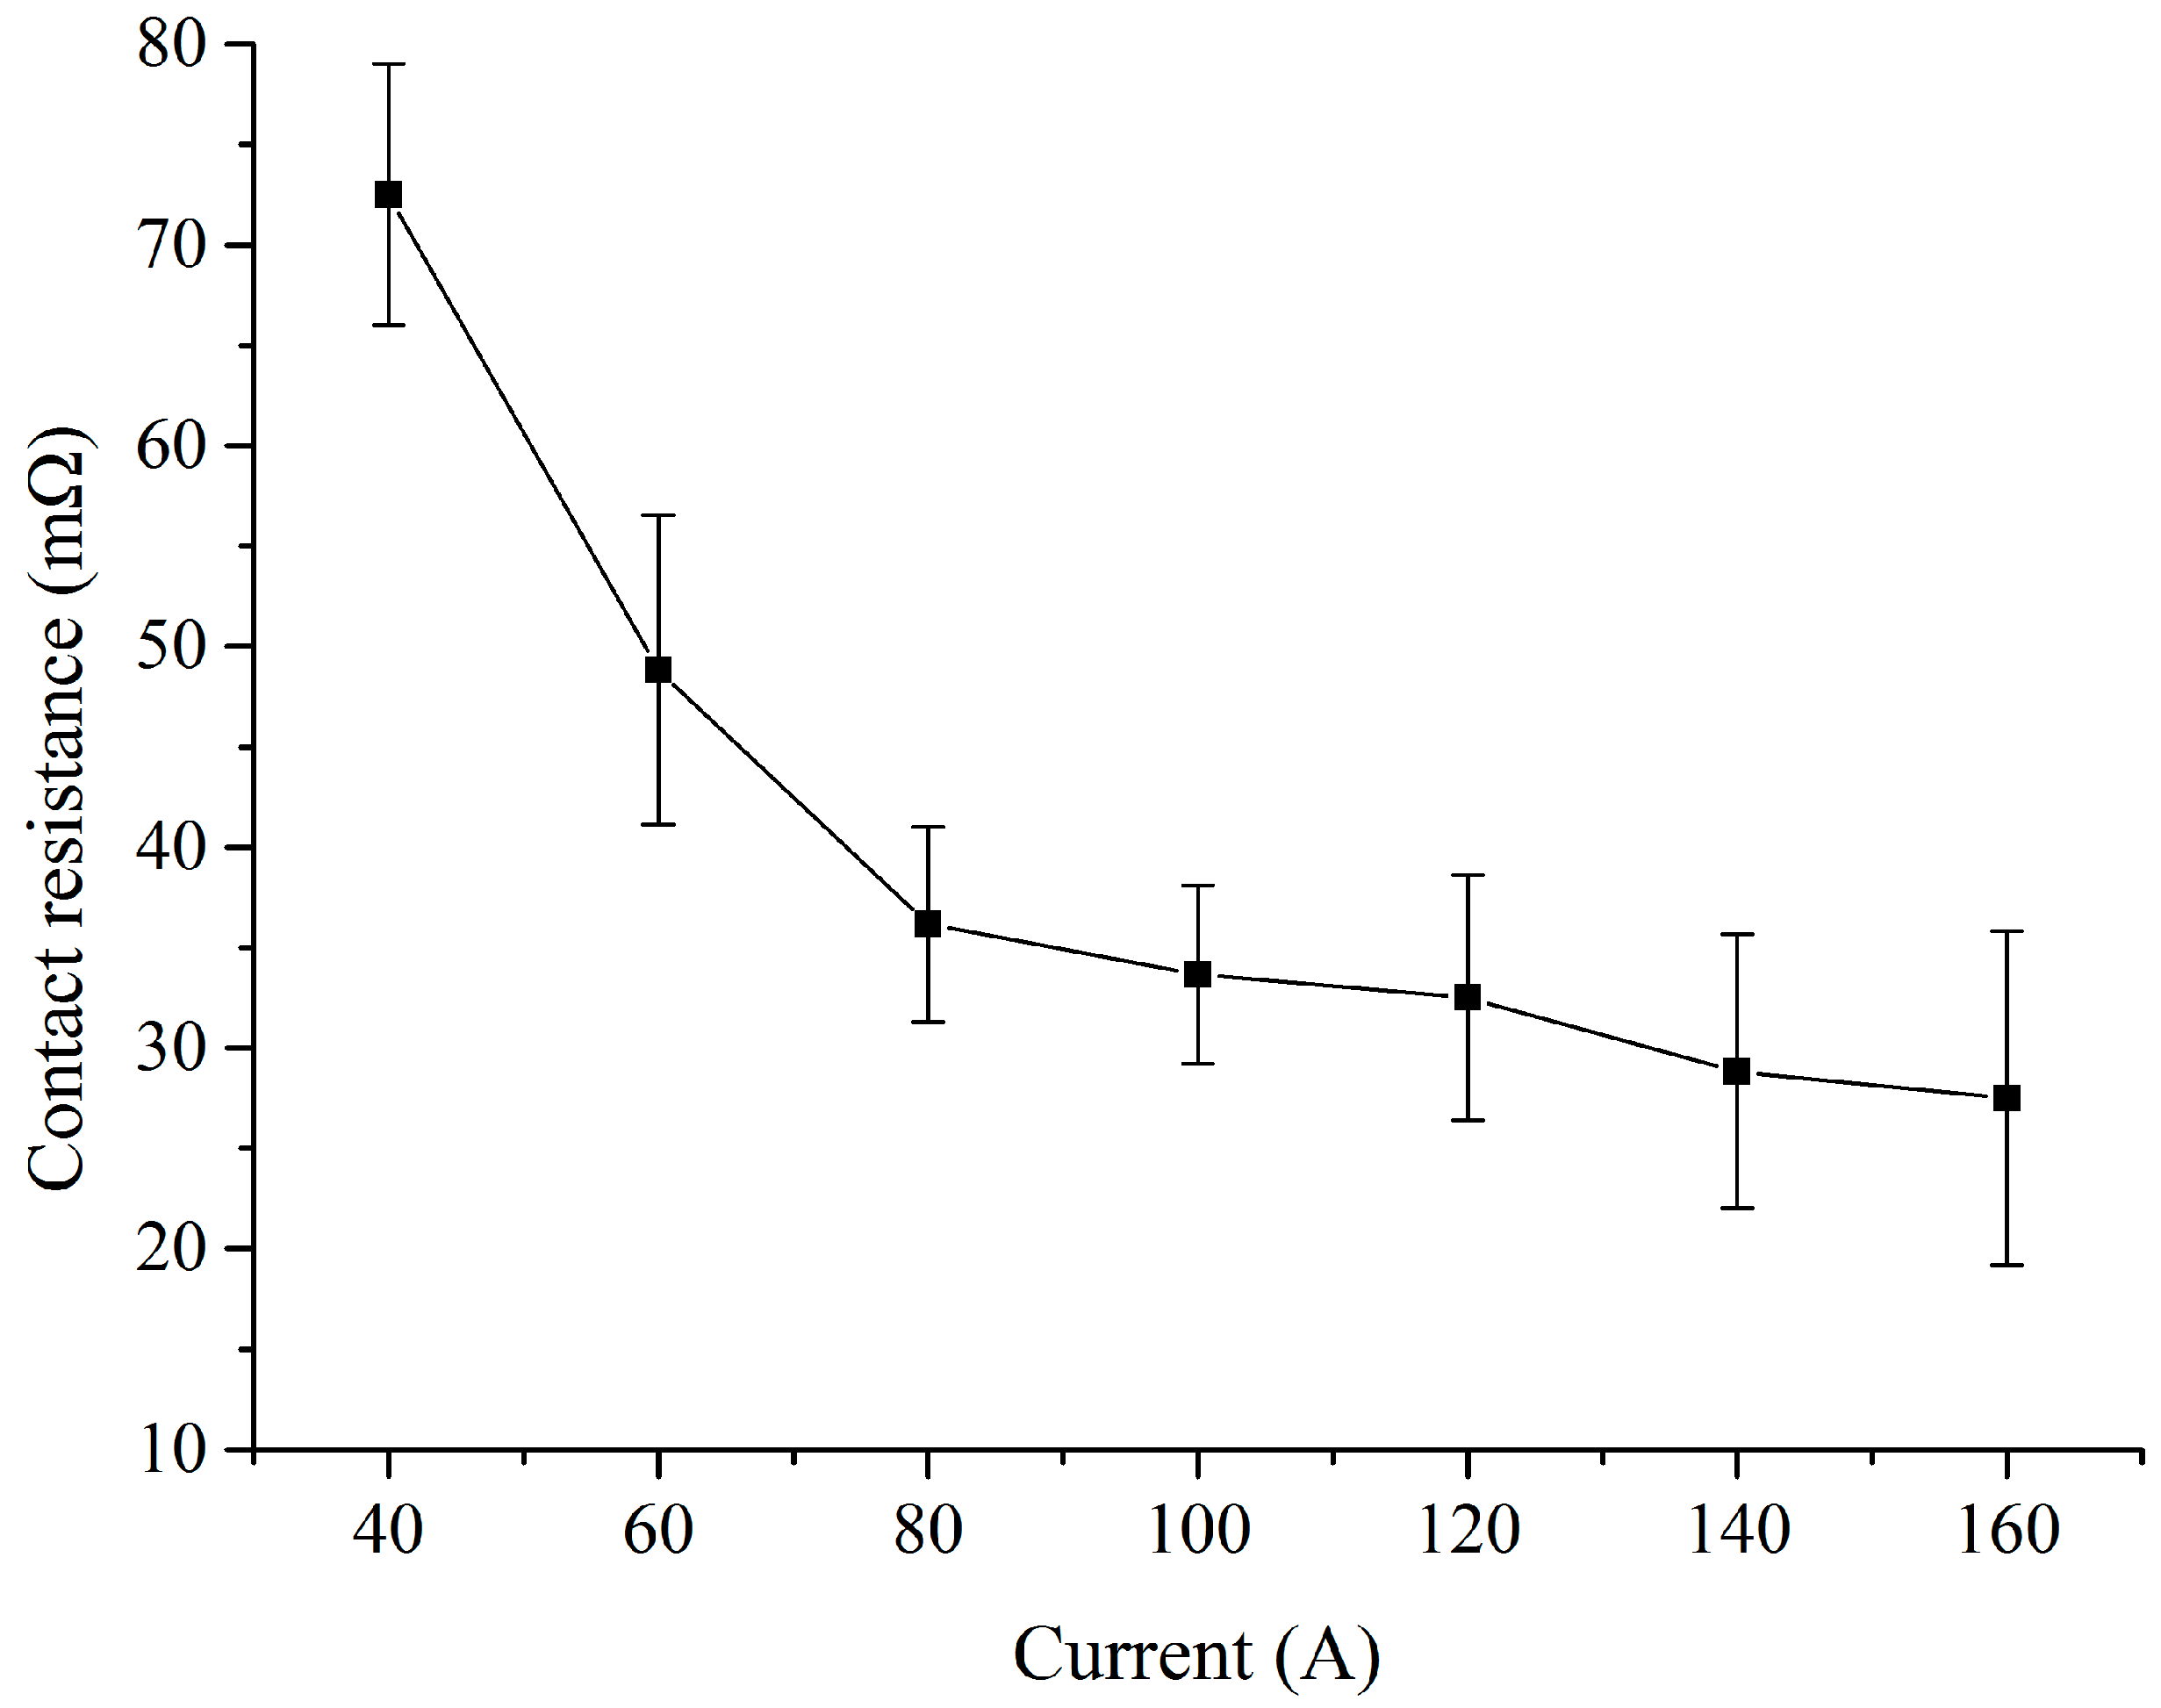
Figure 5.
Infrared images of carbon strips: (a) I = 0 A; (b) I = 80 A.
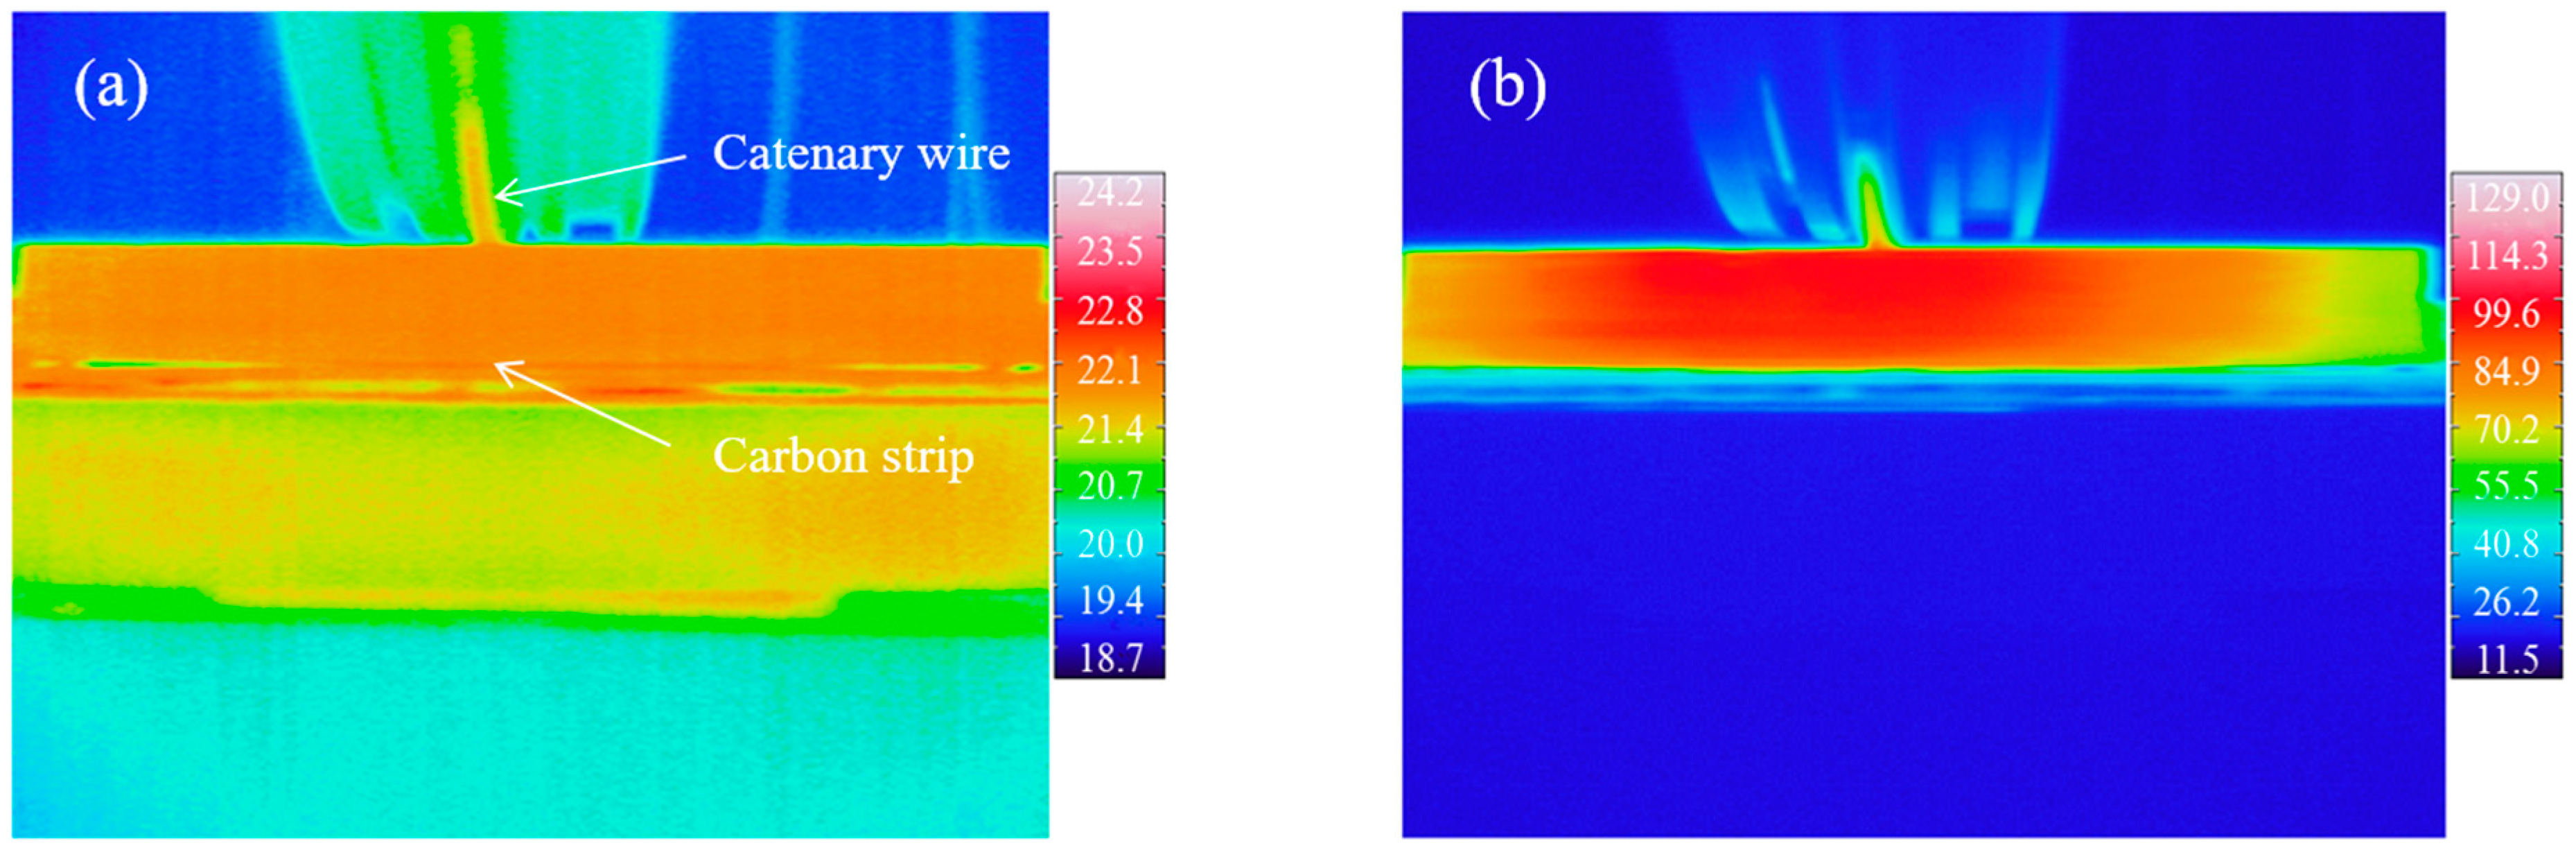
Figure 6.
Temperature distribution of the carbon strip in the presence of pantograph arcing: (a) 0.4 s; (b) 1.0 s; (c) 1.8 s; (d) 2.6 s; (e) 3.4 s; (f) 4.2 s; (g) 5.0 s; (h) 5.4 s.
Figure 6.
Temperature distribution of the carbon strip in the presence of pantograph arcing: (a) 0.4 s; (b) 1.0 s; (c) 1.8 s; (d) 2.6 s; (e) 3.4 s; (f) 4.2 s; (g) 5.0 s; (h) 5.4 s.
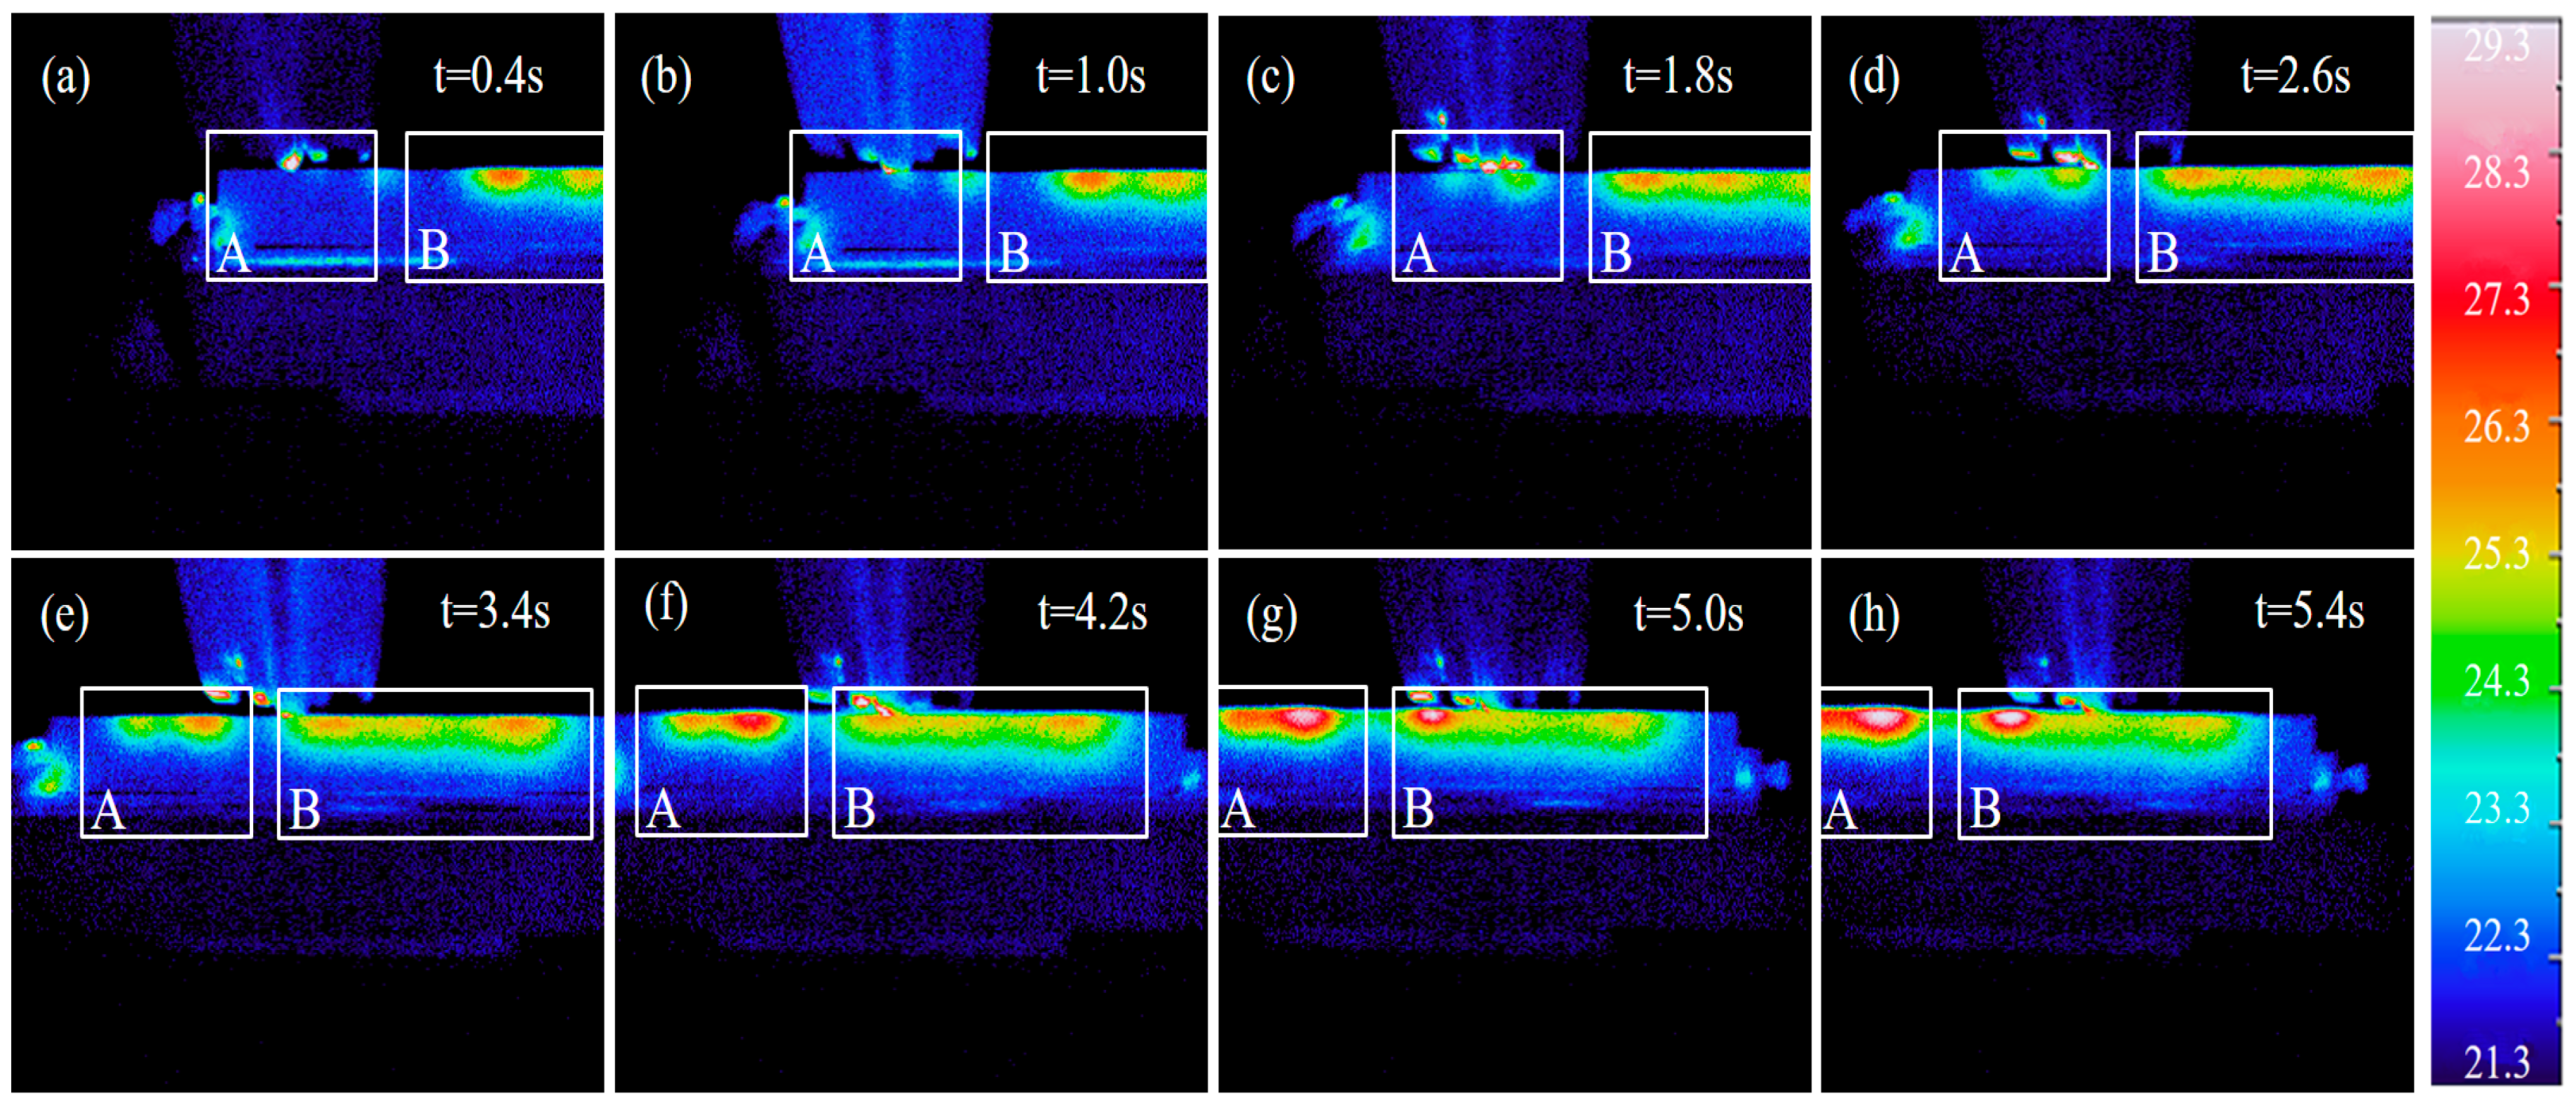
Figure 7.
Variation of the contact point temperature with time: (a) I = 0 A; (b) I = 80 A.
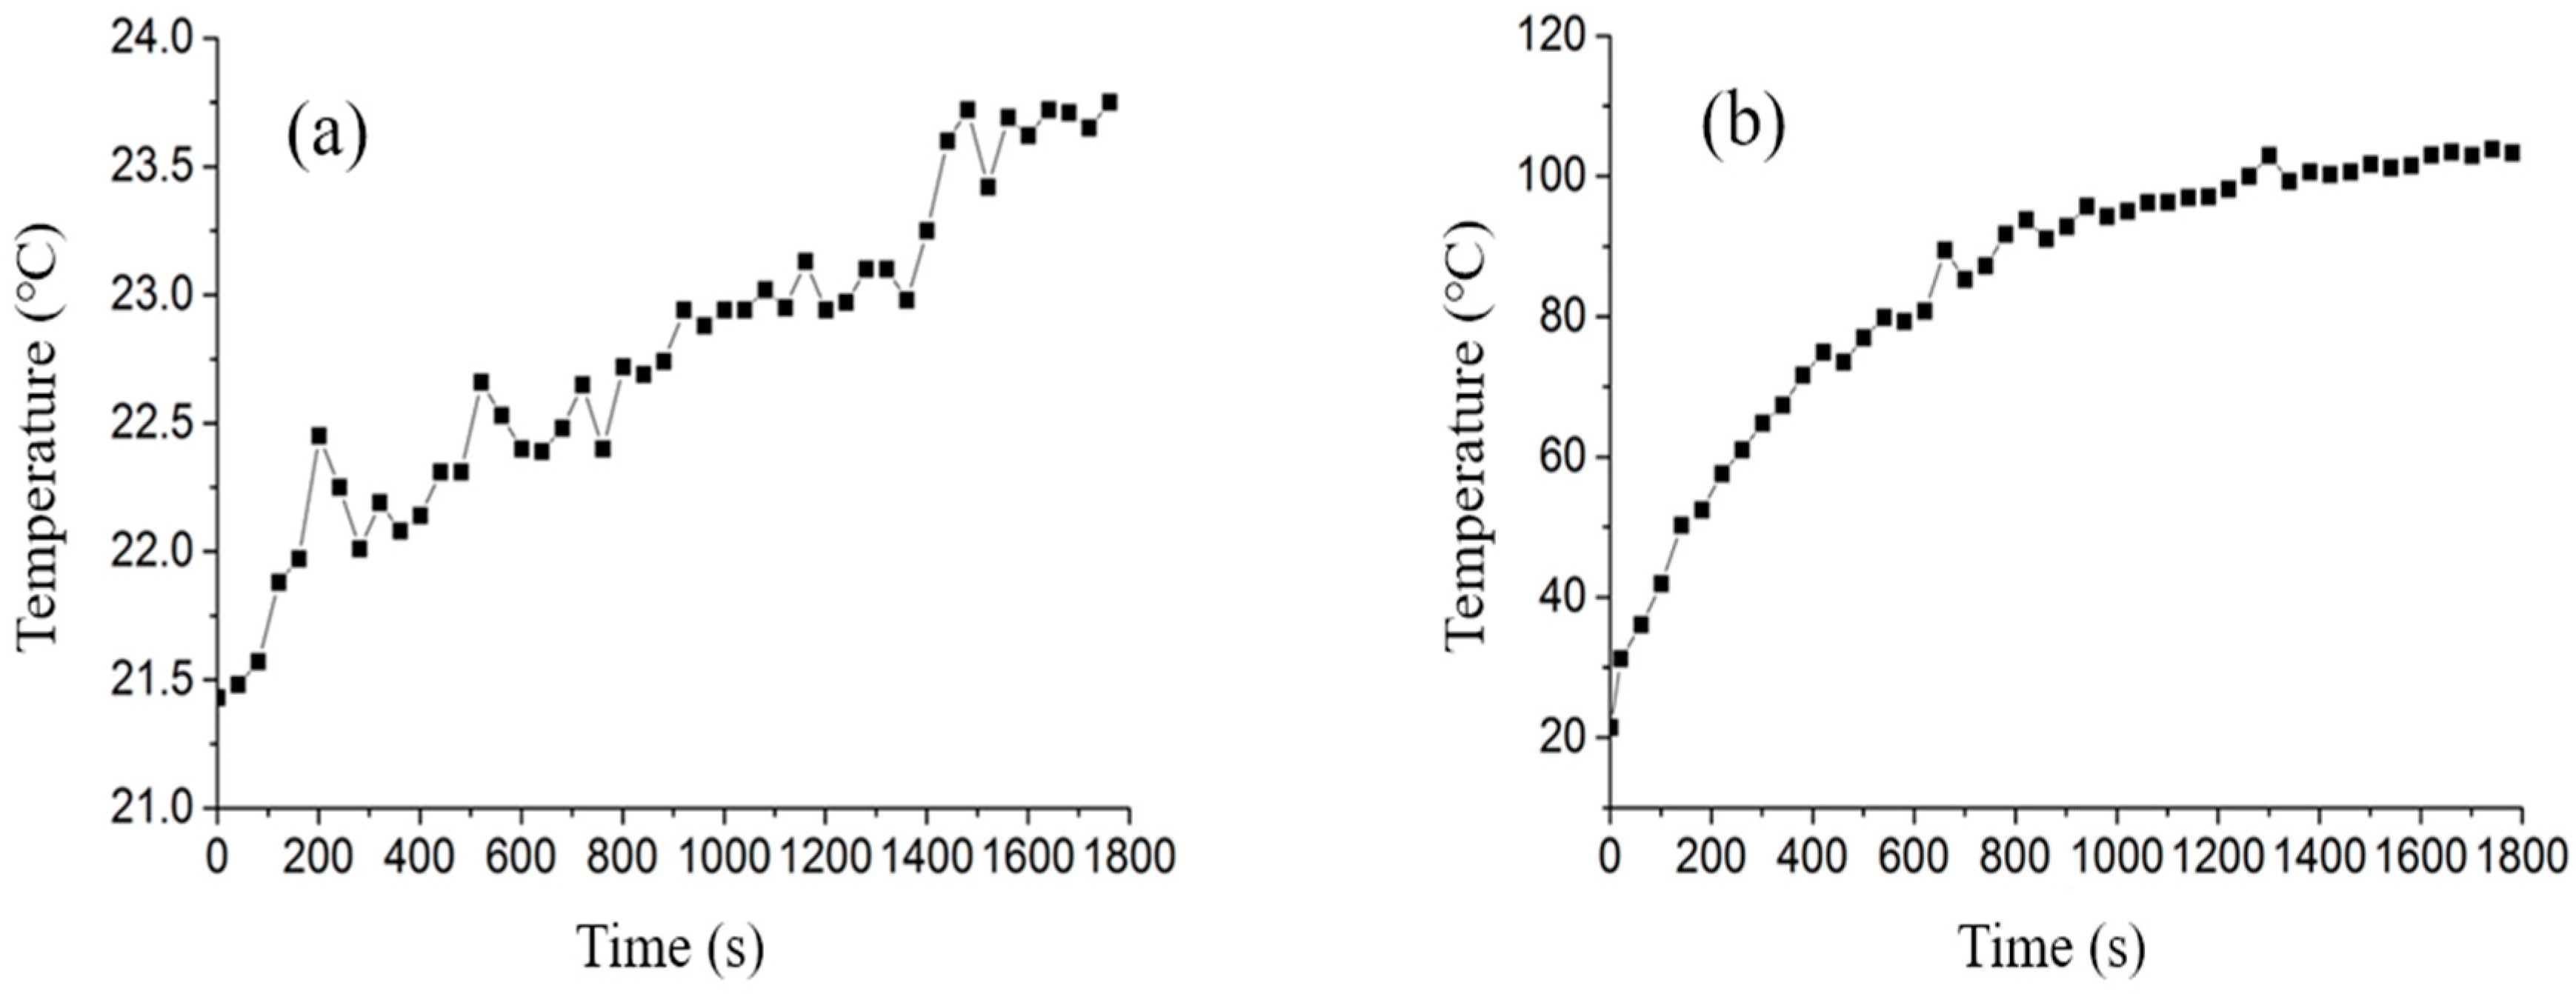
Figure 8.
Variation of the fixed point temperature with time: (a) the infrared camera images; (b) the extracted temperature rise curve with time for fixed points.
Figure 8.
Variation of the fixed point temperature with time: (a) the infrared camera images; (b) the extracted temperature rise curve with time for fixed points.

Figure 9.
Worn morphologies of carbon strips: (a) before tests; (b) after tests (I = 0A); (c) after tests (I = 80 A).
Figure 9.
Worn morphologies of carbon strips: (a) before tests; (b) after tests (I = 0A); (c) after tests (I = 80 A).

Figure 10.
Scanning electron microscope pictures of carbon strips: (a) Uneven distribution areas (I = 0 A); (b) Material transfer areas (I = 0 A); (c) and (d) Bright areas (I = 80 A), (e) Pits, (f) Craters (I = 80 A).
Figure 10.
Scanning electron microscope pictures of carbon strips: (a) Uneven distribution areas (I = 0 A); (b) Material transfer areas (I = 0 A); (c) and (d) Bright areas (I = 80 A), (e) Pits, (f) Craters (I = 80 A).

Table 1.
Basic parameters of the catenary wire.
| Pattern | Elongation (%) | Resistivity (Ω/km) | Breaking Force (kN) |
|---|---|---|---|
| RIM120 | 5.0 | 0.239 | 57 |
Table 2.
Chemical components of the carbon strip (wt. %).
| C | Al | Ti | Fe | Si |
|---|---|---|---|---|
| 99.991 | 0.0014 | 0.003 | 0.0026 | 0.002 |
Table 3.
Physical parameters of the carbon strip.
| Density (g/cm3) | Hardness (HB) | Resistivity (μΩ m) | Bending Strength (Mpa) |
|---|---|---|---|
| 1.7 | 85 | 30 | 45 |
Table 4.
Elementary components of uneven distribution areas (region 2).
| Element | Chemical Compositions (wt. %) | Atomic Percent (%) |
|---|---|---|
| C | 9.69 | 24.59 |
| O | 20.55 | 39.17 |
| Si | 4.58 | 4.97 |
| Cu | 65.18 | 31.27 |
Table 5.
Elementary components of bright areas (region 3).
| Element | Chemical Compositions (wt. %) | Atomic Percent (%) |
|---|---|---|
| C | 26.90 | 49.21 |
| O | 24.86 | 34.12 |
| Cu | 48.24 | 16.67 |
Table 6.
Elementary components of craters (region 7).
| Element | Chemical Compositions (wt. %) | Atomic Percent (%) |
|---|---|---|
| C | 2.27 | 8.75 |
| O | 9.28 | 26.83 |
| Cu | 88.45 | 64.42 |
© 2017 by the authors. Licensee MDPI, Basel, Switzerland. This article is an open access article distributed under the terms and conditions of the Creative Commons Attribution (CC BY) license (http://creativecommons.org/licenses/by/4.0/).
Share and Cite
MDPI and ACS Style
Wu, G.; Wu, J.; Wei, W.; Zhou, Y.; Yang, Z.; Gao, G. Characteristics of the Sliding Electric Contact of Pantograph/Contact Wire Systems in Electric Railways. Energies 2018, 11, 17. https://doi.org/10.3390/en11010017
AMA Style
Wu G, Wu J, Wei W, Zhou Y, Yang Z, Gao G. Characteristics of the Sliding Electric Contact of Pantograph/Contact Wire Systems in Electric Railways. Energies. 2018; 11(1):17. https://doi.org/10.3390/en11010017
Chicago/Turabian StyleWu, Guangning, Jie Wu, Wenfu Wei, Yue Zhou, Zefeng Yang, and Guoqiang Gao. 2018. "Characteristics of the Sliding Electric Contact of Pantograph/Contact Wire Systems in Electric Railways" Energies 11, no. 1: 17. https://doi.org/10.3390/en11010017
Note that from the first issue of 2016, this journal uses article numbers instead of page numbers. See further details here.