Impact of Electric Vehicle Charging Station Load on Distribution Network


1
Centre for Energy, Indian Institute of Technology, Guwahati 781039, Assam, India
2
Department of Mechanical Engineering, Aalto University, 02150 Espoo, Finland
3
Department of Mechanical Engineering, Indian Institute of Technology, Guwahati 781039, Assam, India
*
Authors to whom correspondence should be addressed.
Energies 2018, 11(1), 178; https://doi.org/10.3390/en11010178
Submission received: 19 November 2017
/
Revised: 19 December 2017
/
Accepted: 20 December 2017
/
Published: 15 January 2018
Abstract
:Recent concerns about environmental pollution and escalating energy consumption accompanied by the advancements in battery technology have initiated the electrification of the transportation sector. With the universal resurgence of Electric Vehicles (EVs) the adverse impact of the EV charging loads on the operating parameters of the power system has been noticed. The detrimental impact of EV charging station loads on the electricity distribution network cannot be neglected. The high charging loads of the fast charging stations results in increased peak load demand, reduced reserve margins, voltage instability, and reliability problems. Further, the penalty paid by the utility for the degrading performance of the power system cannot be neglected. This work aims to investigate the impact of the EV charging station loads on the voltage stability, power losses, reliability indices, as well as economic losses of the distribution network. The entire analysis is performed on the IEEE 33 bus test system representing a standard radial distribution network for six different cases of EV charging station placement. It is observed that the system can withstand placement of fast charging stations at the strong buses up to a certain level, but the placement of fast charging stations at the weak buses of the system hampers the smooth operation of the power system. Further, a strategy for the placement of the EV charging stations on the distribution network is proposed based on a novel Voltage stability, Reliability, and Power loss (VRP) index. The results obtained indicate the efficacy of the VRP index.
1. Introduction
The perpetually escalating demands for energy and the finite nature of the fossil fuel supply, accompanied by global warming and climate change are the main concerns of environmentalists and researchers in the 21st century. The CO2 emissions from the transportation sector are one of the main causes of global warming and climate change [1,2,3]. Researchers have stressed the positive impact of replacing Internal Combustion Engine (ICE) driven vehicles with Electric Vehicles (EVs) to minimize the greenhouse gas contributions of the transport sector. The paradigm shift from conventional vehicles to EVs has many environmental and economic advantages. The increasing number of EVs is however accompanied by a rise in charging demand. Hence, the development of the charging infrastructure as well as efficient Inductive Power Transfer (IPT) [4] has become necessary to meet the requirements of substantial operation of the EVs [5]. For instance, in the United States (US), the National Program Charging Point America has taken an initiative of building nearly 5000 EV charging stations to offer charging services in nine regions of the U.S. [6]. Even a developing country like Bhutan has taken an initiative to set up charging infrastructure for the promotion of the EVs [7]. The establishment of charging stations imposes an additional burden on the power grid, as the high charging loads of fast EV charging stations will degrade the operating parameters of the distribution network. The degradation of voltage profile, increase in peak load, harmonic distortions are some of the consequences of the uncoordinated charging of EVs. Many references demonstrate the adverse impact of EV charging loads on different parameters of the distribution network like voltage profile [8,9,10,11,12,13,14], harmonics [15,16,17,18] and peak load [19,20,21,22,23,24].
The potential impact of EV charging station loads on the voltage profile of distribution networks has been investigated by a number of researchers. In [8] the authors analysed the impact of the EV charging station loads on a low voltage distribution network in Europe for different EV penetration scenarios. It was concluded in [8] that the network was robust enough to support a low intake of EVs 1–2%. However, it was observed that the voltage profile of the node where multiple charging stations were placed degraded to some extent and the high loads of EV charging stations caused degradation of the voltage profile of the weak buses of the system. In [9] the authors examined the impact of EV charging loads on a 13 node distribution network for different EV penetration scenarios. In [10] the authors analysed the impact of EV charging loads on a standard distribution network with 14 buses. It was concluded that the transient voltage stability index degraded for high penetration of EVs. The impact of EV charging loads on the voltage stability of distribution network was also analysed in [11,12,13,14]. From the findings of [11,12,13,14], it is observed that most of the distribution networks could withstand the penetration of EVs up to a certain level. However, networks designed a decade ago are not equipped to withstand any large-scale integration of EVs.
Harmonics being a crucial outcome of EV integration have been analysed in depth by researchers in recent years. In [15] the authors investigated the effect of EV charging loads on the harmonic voltages of distribution system by applying statistical analysis. The authors classified the chargers based on the total harmonic distortion (THDI) produced and concluded that even with 45% EV penetration there was negligible harmonic distortion during summer. The effect of non-linear EV charging loads on power quality of the distribution system was analysed in [16], where it was reported that the lifecycle of distribution network assets was reduced by the harmonic distortion produced by the EV loads. In [17] the authors reported that the EV battery charging loads caused harmonic distortion of even 50% in the most extreme cases. In [18] the authors simulated the harmonics caused by Plug-in Hybrid Electric Vehicle (PHEV) chargers by a probabilistic Monte Carlo approach considering the uncertainties. It was concluded that residential Level 1 chargers (1.8 kW) had a severe impact on the power quality.
In recent years researchers have concentrated on quantifying the variation of peak load demand after the placement of EV charging stations in the distribution network. In [19] the authors examined the effect of the PHEV loads on the metropolitan distribution network of Australia, concluding that with uncoordinated charging and 100% PEV penetration 43% peak load shifting was required to enable smooth operation of the distribution network. In [20] the authors analysed the effect of the uncontrolled EV charging on the daily load profile. The improvement in load profile by incorporating coordinated charging was also illustrated in [20]. In [21] the authors concluded that disorderly charging would increase the peak load demand and recommended tariff based charging. In [22] the authors analysed the impact of EV charging on daily load demand in the parking lots and devised an optimal strategy for controlling the charging activities in the parking lots. In [23] the authors analysed the impact of fast EV chargers on a retail building’s load demand and concluded that 38% of the PHEV load demand could be absorbed by demand management and photovoltaics. In [24] the authors proposed a two stage demand response model to control the increase in peak load due to the charging of EVs.
The different detrimental impacts of EV charging station loads like voltage instability, harmonic distortion, and power losses on distribution network are analysed in [8,9,10,11,12,13,14,15,16,17,18,19,20,21,22,23,24]. However, there is a dearth of literature focusing on the impact of the EV charging station load on all the aforementioned parameters considered together. The analysis is usually performed for one or two parameters separately. All the aforementioned limitations of the existing literature are addressed in this work and the major contributions of the work are summarized as follows:
- Profound analysis of the impact of the EV charging station loads on the voltage stability of the distribution network.
- Detailed analysis of the impact of the EV charging station loads on the customer and energy oriented reliability indices.
- Comprehensive analysis of the economic losses incurred in terms of the penalty paid by the utility due to introduction of the EV charging station loads.
- Comparative analysis of the EV charging load on different parameters of the distribution network such as the voltage stability, reliability and power losses.
- Placement of the charging stations in the distribution network based on VRP index.
The rest of the paper is organized as follows: Section 2 illustrates the computational methodology of voltage stability, reliability, power loss, and economic loss. Section 3 demonstrates the mathematical formulation of VRP index and the problem formulation for the optimal placement of the charging stations based on VRP index. Section 4 presents the results of the impact of the charging station load on the distribution network as well as the optimal locations of the charging stations in the IEEE 33 bus test network. Section 5 presents a brief discussion on the findings of the work. Finally, Section 6 concludes the work.
2. Methodology
The voltage stability, reliability, and power losses are the three important operational parameters of the distribution network. A brief overview of the methodology to compute voltage stability, reliability, power losses, and economic loss of the distribution network is elaborated in this section. Further, the overall computational methodology adopted for analysing the impact of EV charging station load on distribution network is also presented in this section.
2.1. Voltage Stability
The voltage stability problem has concerned power system engineers for many years. Voltage stability is the power system’s capability to maintain steady acceptable voltages at all the system buses under normal operating conditions and when an external disturbance is applied [25,26]. During voltage instability phenomena, the bus voltage of the network declines progressively and uncontrollably. The system may become unstable because of sudden disturbances, fault conditions, single or multiple contingencies, line overloading or load increases. A voltage stability criterion used in many stability studies is that voltage of all the system buses must be within acceptable limits. Voltage stability is indeed a local phenomenon but in some cases, it may lead to severe voltage collapse [25]. In this work Voltage Sensitivity Factor (VSF), Voltage Stability Index (VSI) are used for voltage stability analysis.
2.1.1. Voltage Sensitivity Factor
Voltage stability studies generally obey a static approach as the factors affecting it are slow in nature. The voltage stability is analysed based on the determination of VSF from the PV curve [25,27,28]. The PV curve is a graphical representation of active power and voltage [25]. It signifies the trend of voltage change with increasing active power as shown in Figure 1.
The first step for drawing the PV curve is the determination of the voltage of all the buses of the distribution network. For determination of voltage of a radial distribution network, the typical methods of load flow analysis like the Newton Raphson method have their limitations because of high R/X ratio. The R/X ratio is quite predominant in distribution system compared to transmission system due to low inductance of the line The Jacobian matrix may become singular because of high R/X ratio. Hence, the voltage of the buses is determined by the forward and backward sweep algorithm [29]. From the PV curve shown in Figure 1 it is clear that as the active power increases, the voltage decreases up to a point where the active power is highest (Pmax, Vcritical). That point corresponds to the critical operating condition known as the limit of stable operation. VSF is the ratio of change in voltage and change in loading. Mathematically, it is expressed as:
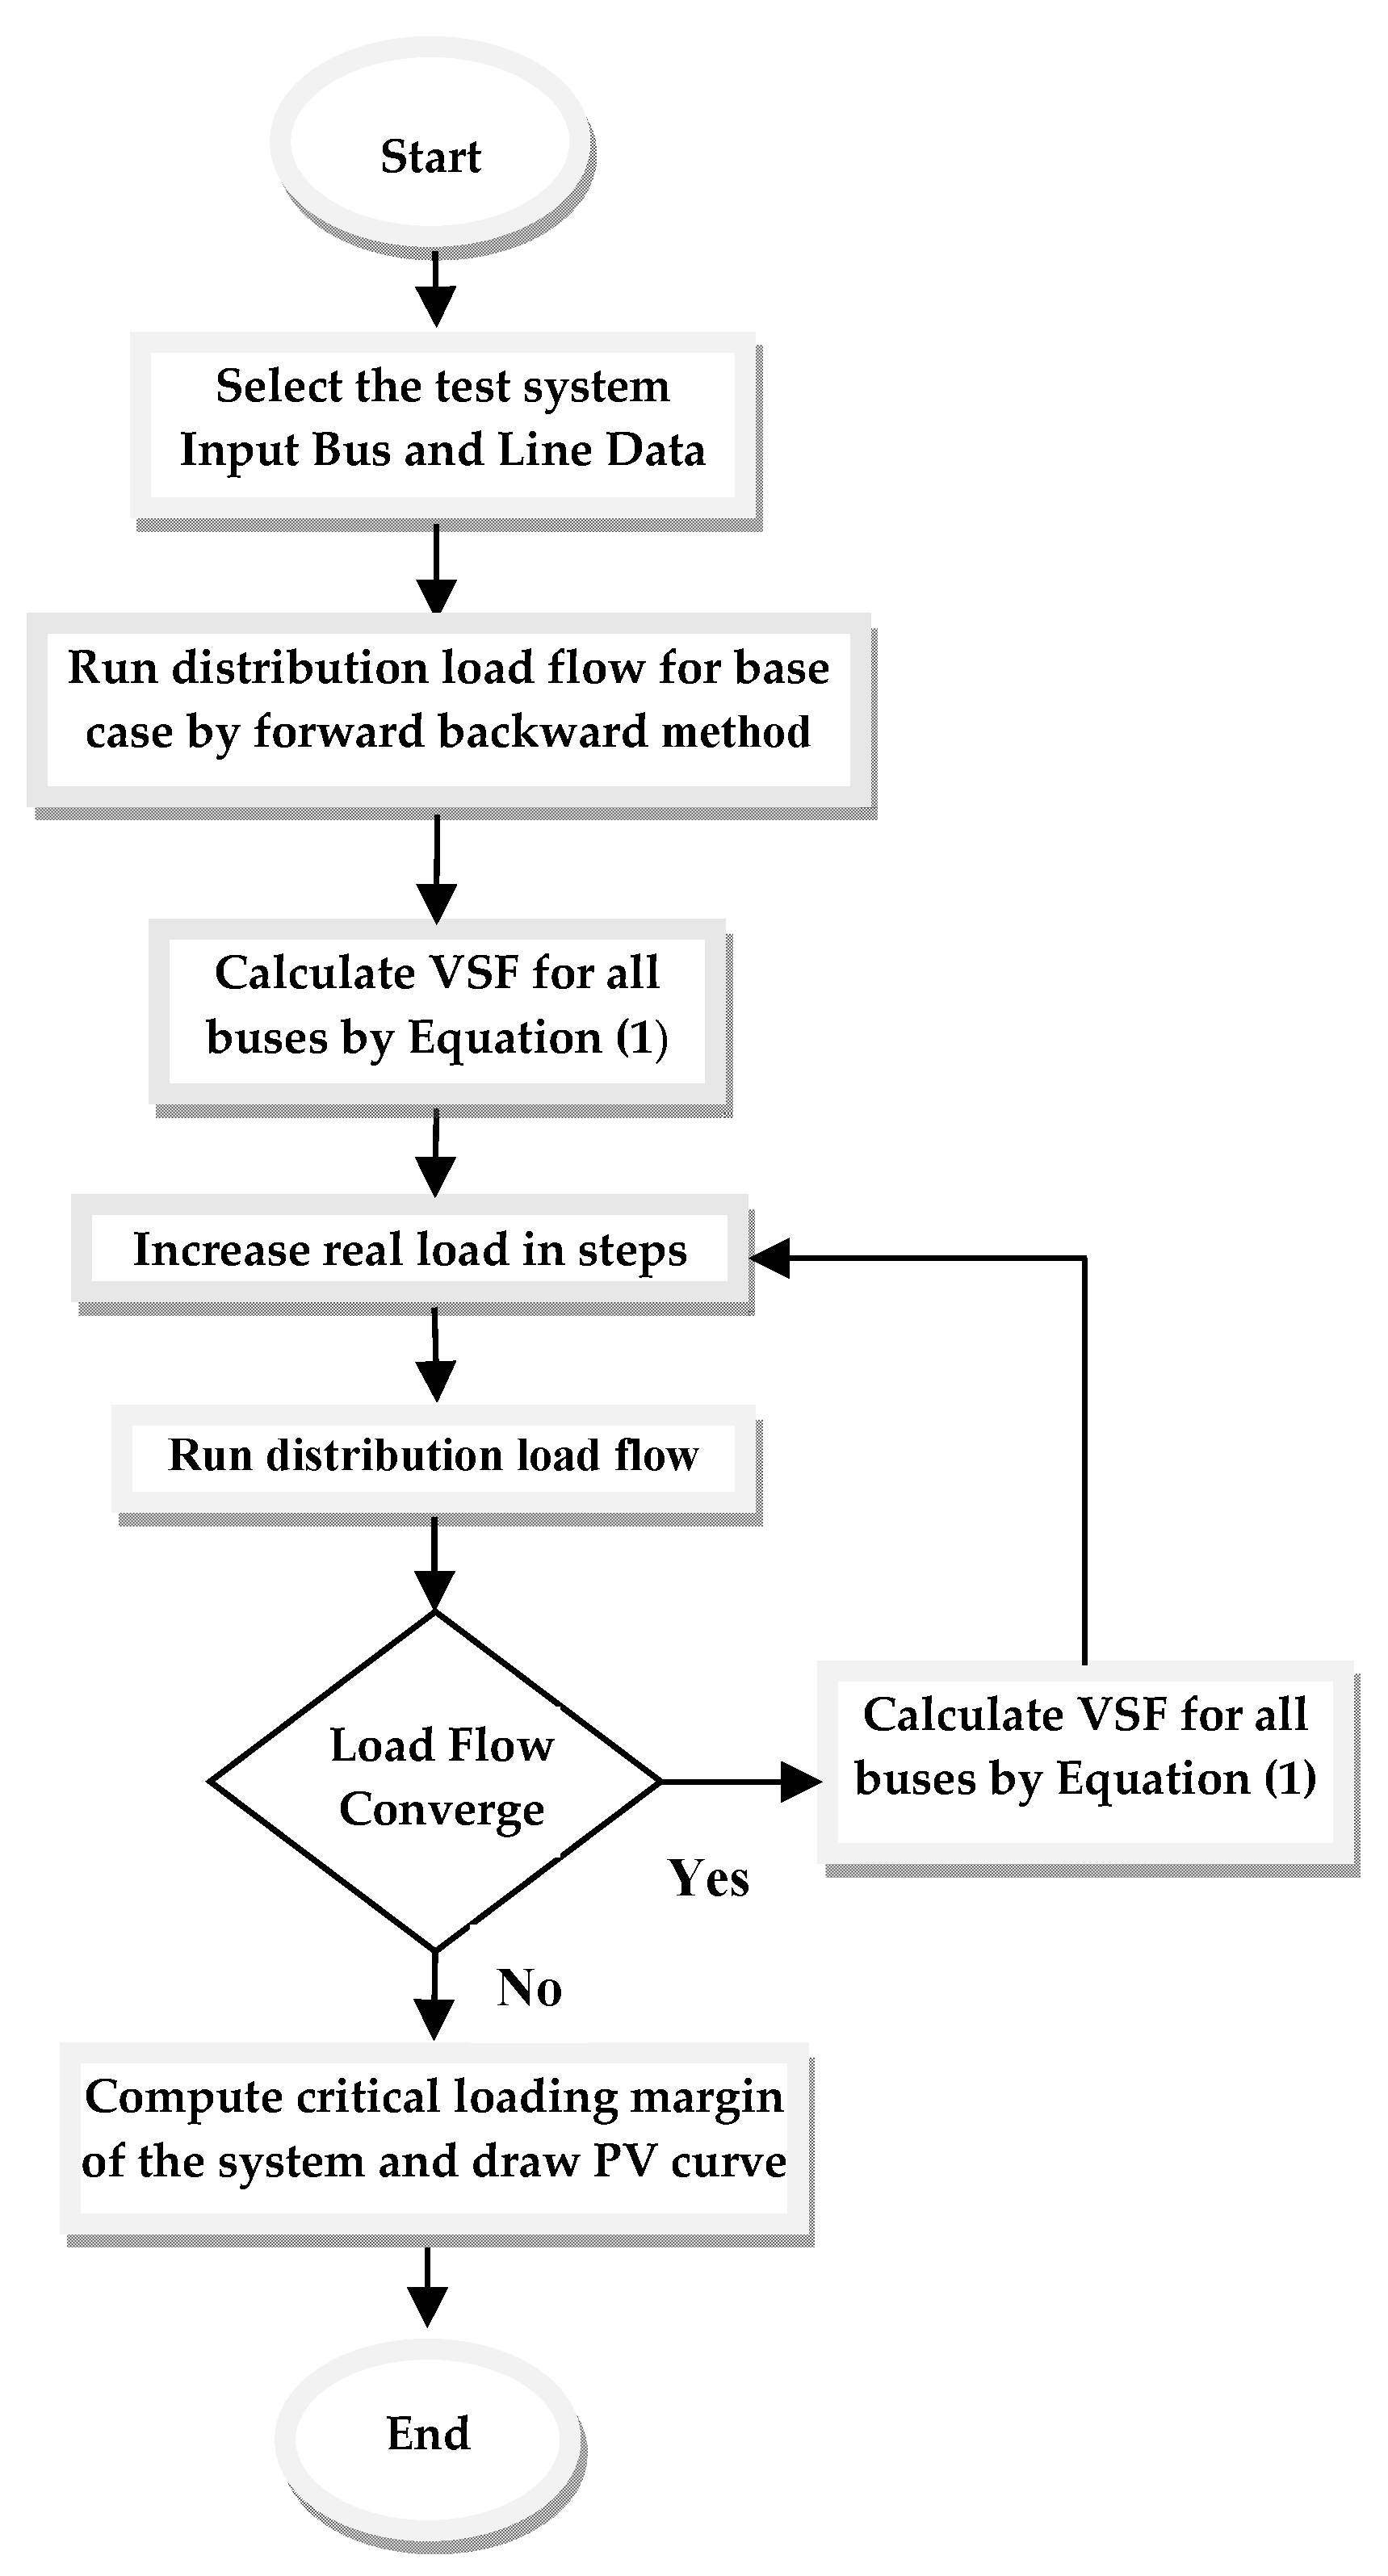
A high VSF value indicates that even for a small change in loading, there is a considerable voltage drop, thereby signifying weakness of the bus [28]. In voltage stability analysis of distribution networks, the voltage of all the buses must be within an acceptable limit (6% of their nominal value). The VSFs of all the buses are determined for increasing loading factor. The loading for which the voltages of all the buses are within acceptable range is called the realistic loading margin of the system [28]. The flowchart illustrating the methodology of computation of VSF is shown in Figure 2.
2.1.2. Bus Voltage Stability Index
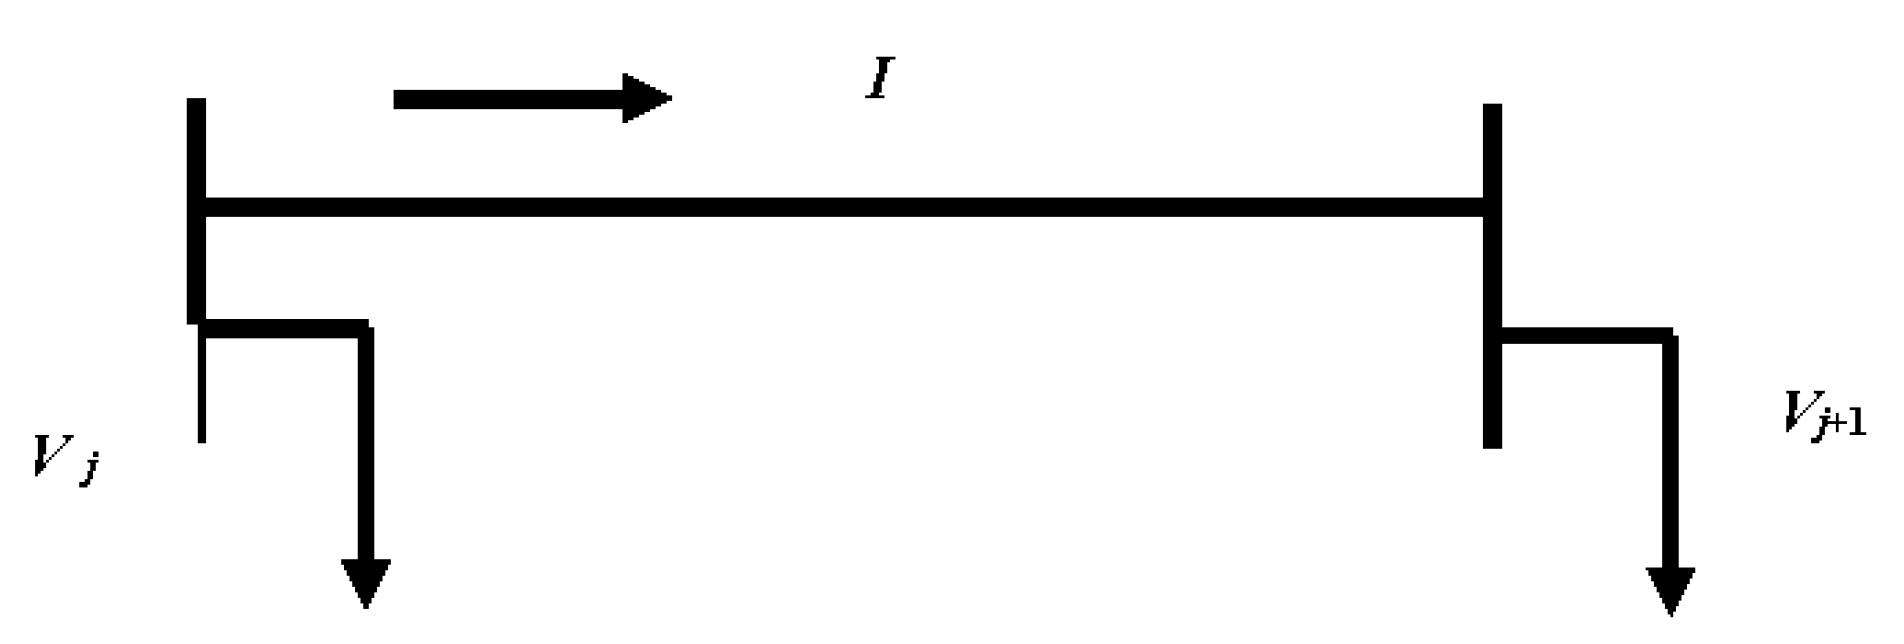
The voltage stability index developed by Eminoglu et al. [30] is utilized in this work. The mathematical formulation of the index is illustrated by taking an example of a simple 2 bus system as shown in Figure 3. The mathematical formulation of this index is elaborated by Equation (2) to Equation (8).
Figure 3 illustrates the single line diagram of a two bus system where j and j + 1 are the two buses of the system. Vj < δj and Vj+1 < δj+1 are the voltage at bus j and bus j + 1 respectively. I is the current flowing through the branch having resistance r and impedance x:
Substituting value of I in Equation (3), equating real parts and on further simplification Equation (4) is obtained:
From Equation (4) the transferrable active and reactive power can be written as in Equations (5) and (6), respectively:
where , and .
where: , and: .
Thus, the conditions of existence of transferrable active and reactive power are as in Equation (7):
Substituting the actual values of N, Q and adding them leads to the inequality defining the stability criterion of the system:
The value of Equation (8) is known as VSI. This is a criterion for determination of voltage stability. VSI will decrease with increase of active power. Increasing the active power beyond a certain limit will cause the system to become unstable. The flowchart illustrating the methodology of computation of VSI is shown in Figure 4.
2.2. Reliability
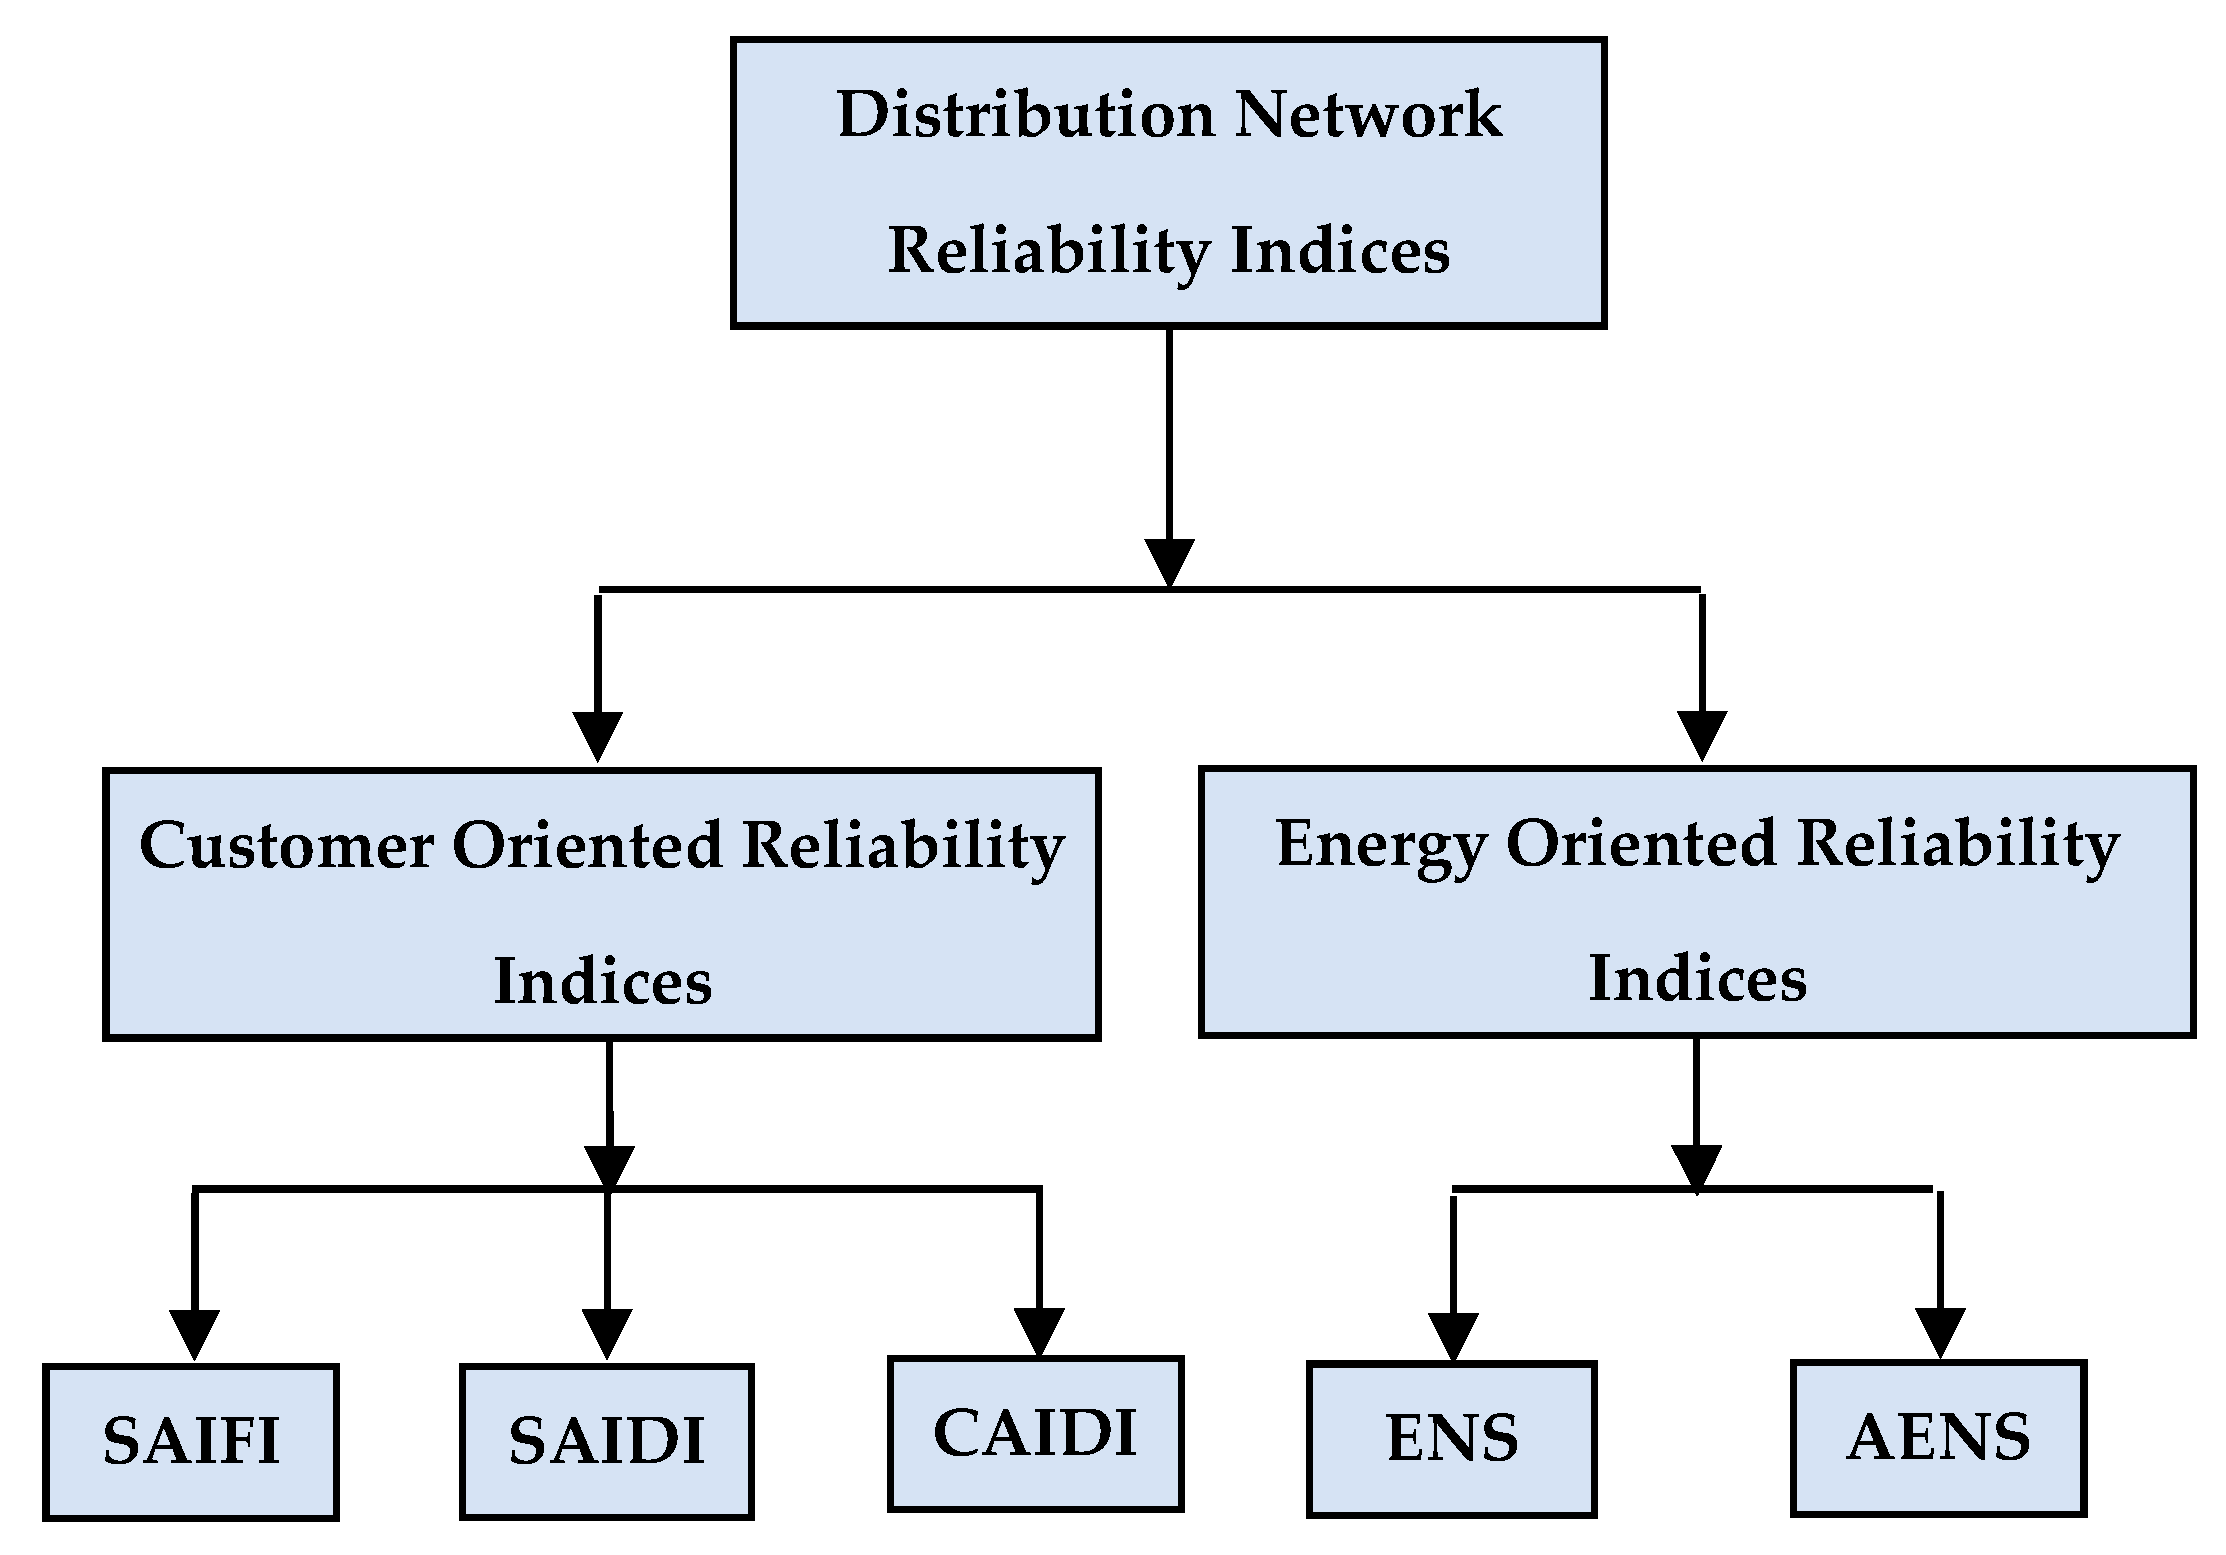
The reliability analysis of the power system has emerged as an exigent arena of research. Reliability is the probability that a system will operate satisfactorily for a given period of time under a given set of operating conditions [31]. In power system reliability analysis, the emphasis is laid on the reliability of generation, transmission, as well as distribution. The reliability of the distribution network is closely related to the satisfaction level of the customers. For evaluation of the reliability indices of the distribution network, statistical data of failure rate, repair rate, average outage duration, and number of consumers of the buses or load points of the distribution network are required [31,32]. The detailed categorization of the distribution network reliability indices is as shown in Figure 5. As mentioned in Figure 5 the reliability indices of distribution network are broadly categorized into customer oriented and energy oriented reliability indices. SAIFI, SAIDI, and CAIDI are the three major classifications of customer oriented reliability indices. The energy oriented reliability indices can be again sub divided into ENS and AENS.
A comprehensive overview and the formulae of different customer and energy-oriented reliability indices are presented in Table 1. SAIFI and SAIDI are related to frequency and duration of interruption respectively. CAIDI gives a measure of customer dissatisfaction because of interruption. AENS can be regarded as the average load curtailment index because of interruption of service. The typical causes of the interruption are as follows:
- Outages resulting in interruption
- Equipment failure disrupting the operation of the power system
- Sudden increase in load demand resulting in load shedding
- Scheduled maintenance requiring an interruption
- Extreme weather damaging the infrastructure
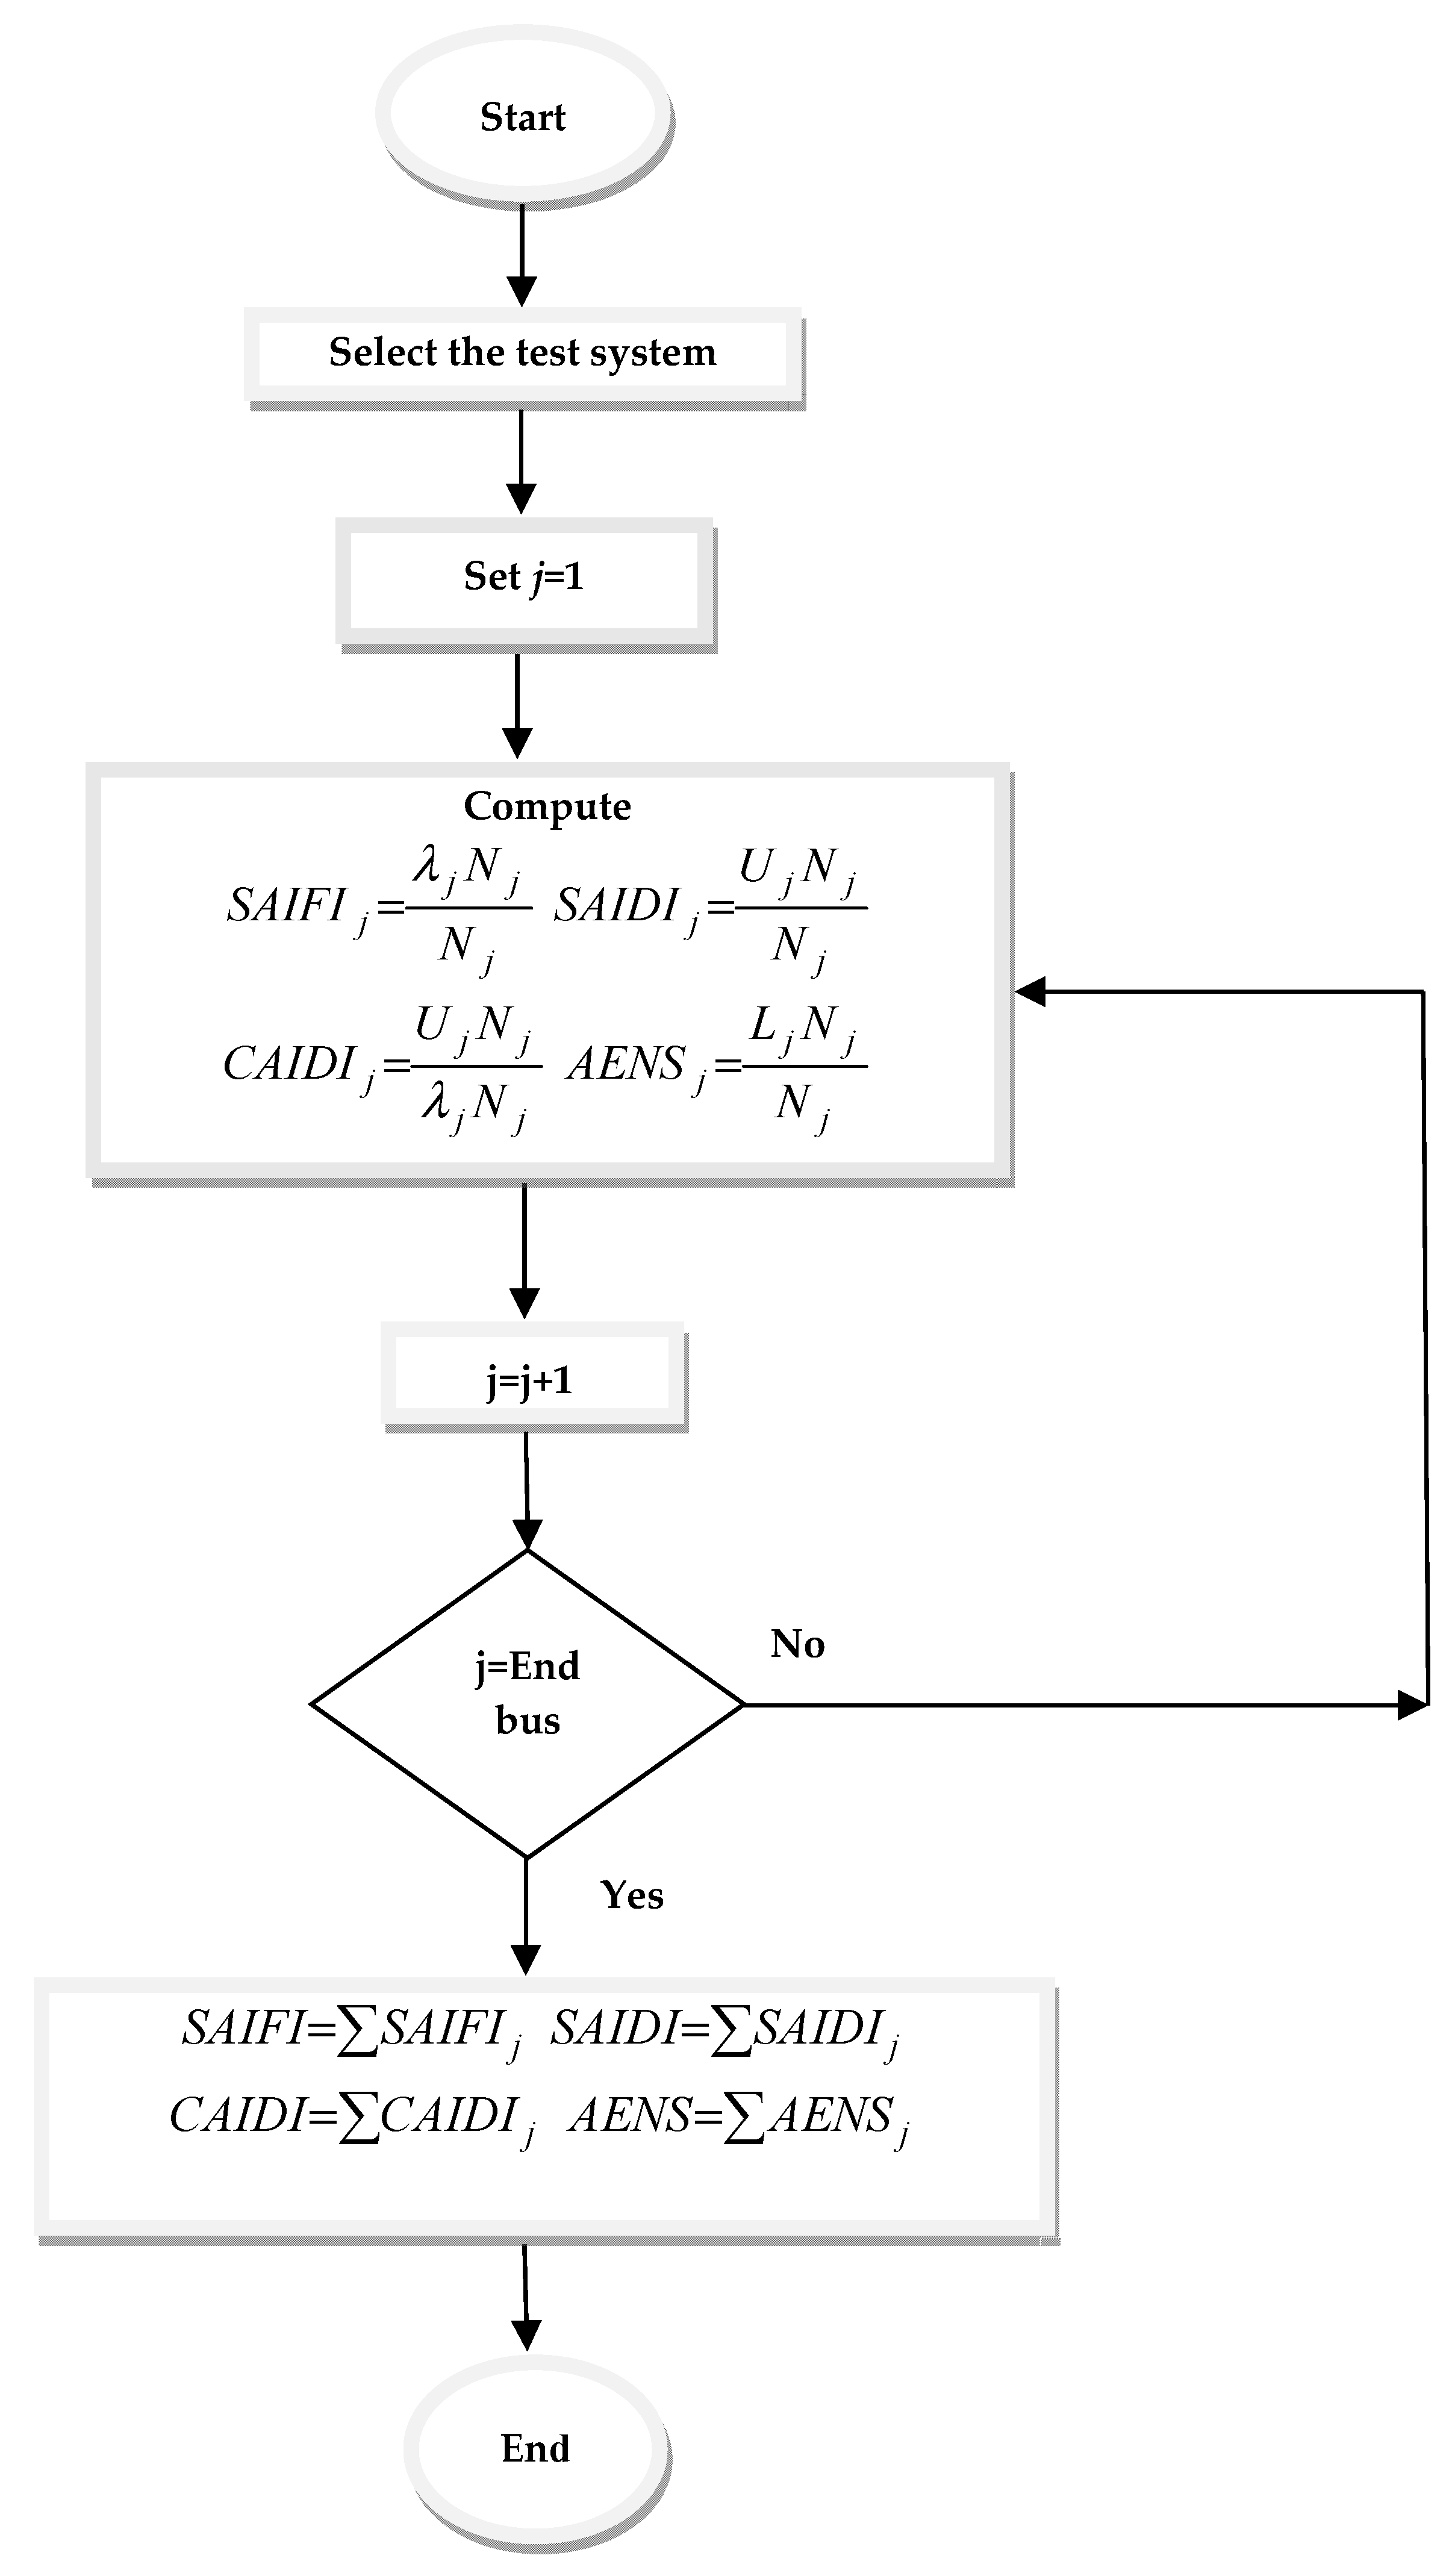
For further elaboration the flowchart for computation of the reliability indices is presented in Figure 6.
2.3. Power Losses
Power losses of a distribution network refer to typical I2R losses of the line [29]. For the two bus system represented in Figure 3 the mathematical expression for computing the line losses is as given in Equation (9):
and the total power losses of the system are given as in Equation (10):
From Equation (9) and Equation (10) it is clear that increase in load demand of even a single bus will contribute to net increase in power losses of the distribution network.
2.4. Economic Losses
Voltage deviation beyond a certain limit and AENS are critical for the system and impose penalty on the utility thereby causing economic loss. For the IEEE 33 bus system the voltage beyond which penalty is imposed is 0.9 per unit. The penalty imposed is given as in Equation (11):
All the reliability indices explained in Section 2.2 can be utilized to decide a criterion for penalty imposed on utility. In this work penalty imposed for unreliability is expressed in terms of AENS. Numerically it is 0.18 $/kWh energy not served.
2.5. Computational Methodology for Analyzing the Impact of EV Charging Station Load on Distribution Network
It is anticipated that the coming years will witness a rapid and significant EV charging load integration to the power distribution network. In this context, the impact of EV charging station load on economic loss and different operating parameters of the distribution network must be analysed for different scenarios of placement of EV charging stations.
The methodology adopted in the work for analysing the impact of EV charging station load on the distribution network is illustrated in Figure 7.
3. VRP Index
In power system studies there is a dearth of indices giving information about the three main operating parameters like voltage stability, reliability, and power losses together. Hence, a new index named Voltage Stability, Reliability and Power loss (VRP) index is formulated in this work. This index gives information about three prime operating parameters of the distribution network after the network is subjected to any sort of disturbance. This index can be applied for:
- Optimal placement of charging stations.
- Distribution network planning in presence of distributed generation.
- Microgrid planning.
- Reconfiguration of distribution networks.
The mathematical formulation of the VRP index is exemplified in this subsection by Equation (12) to Equation (16):
Charging Station Placement Based on VRP Index
As a motivating example for the usage of the VRP index, we present briefly a novel methodology for the placement of the charging stations in the distribution network based on this index. The main objective of charging station placement problem is optimal allocation of EV charging stations in the distribution network in such a way that the operating parameters of the distribution network are least affected. Thus, VRP index is selected as the objective function for charging station placement problem because of its capability of taking into account voltage stability, reliability and power losses under a single umbrella.
The decision variables, objective functions, and constraints for the optimal placement of charging stations in the distribution network based on VRP index are presented in this sub-section.
The decision variables are:
- Buses of the distribution network in which charging stations will be placed, d
- Number of fast charging stations placed at the buses, f
- Number of slow charging stations placed at the buses, s
The optimization is aimed at minimization of VRP index. Mathematically:
Subject to the following constraints:
In addition to the aforementioned constraints, the power flow balance equation must be taken as an equality constraint. A flowchart illustrating the optimal placement of charging stations based on the VRP index is shown in Figure 8, where as shown, the EV charger load is first modelled and the test cases are simulated. Then, the impact of the EV charging station load on voltage stability, reliability, and power loss is evaluated for all the test cases A comparative analysis of the impact of the EV charging station load on the aforementioned parameters is made so that appropriate weights can be assigned to all the terms of the VRP index. The weights assignment of the individual terms of the VRP index is based on the change in the operating parameters after the introduction of the EV charging station load. The most severely affected parameter is assigned the highest weight. After formulation of the VRP index the charging station placement problem is formulated. Lastly, optimization is performed and charging stations are allocated optimally in the distribution network.
4. Results
Massive penetration of EVs increases the load demand thereby degrading the operating parameters of the distribution network. The impact of the EV charging station load on voltage stability, power loss, reliability, and economic losses of the distribution network were analysed for different scenarios and a charging station placement scheme based on the VRP index is presented in this work. The results of the aforementioned analyses are presented in this section.
4.1. Description of the Test System and Different Scenarios Considered for Analysis
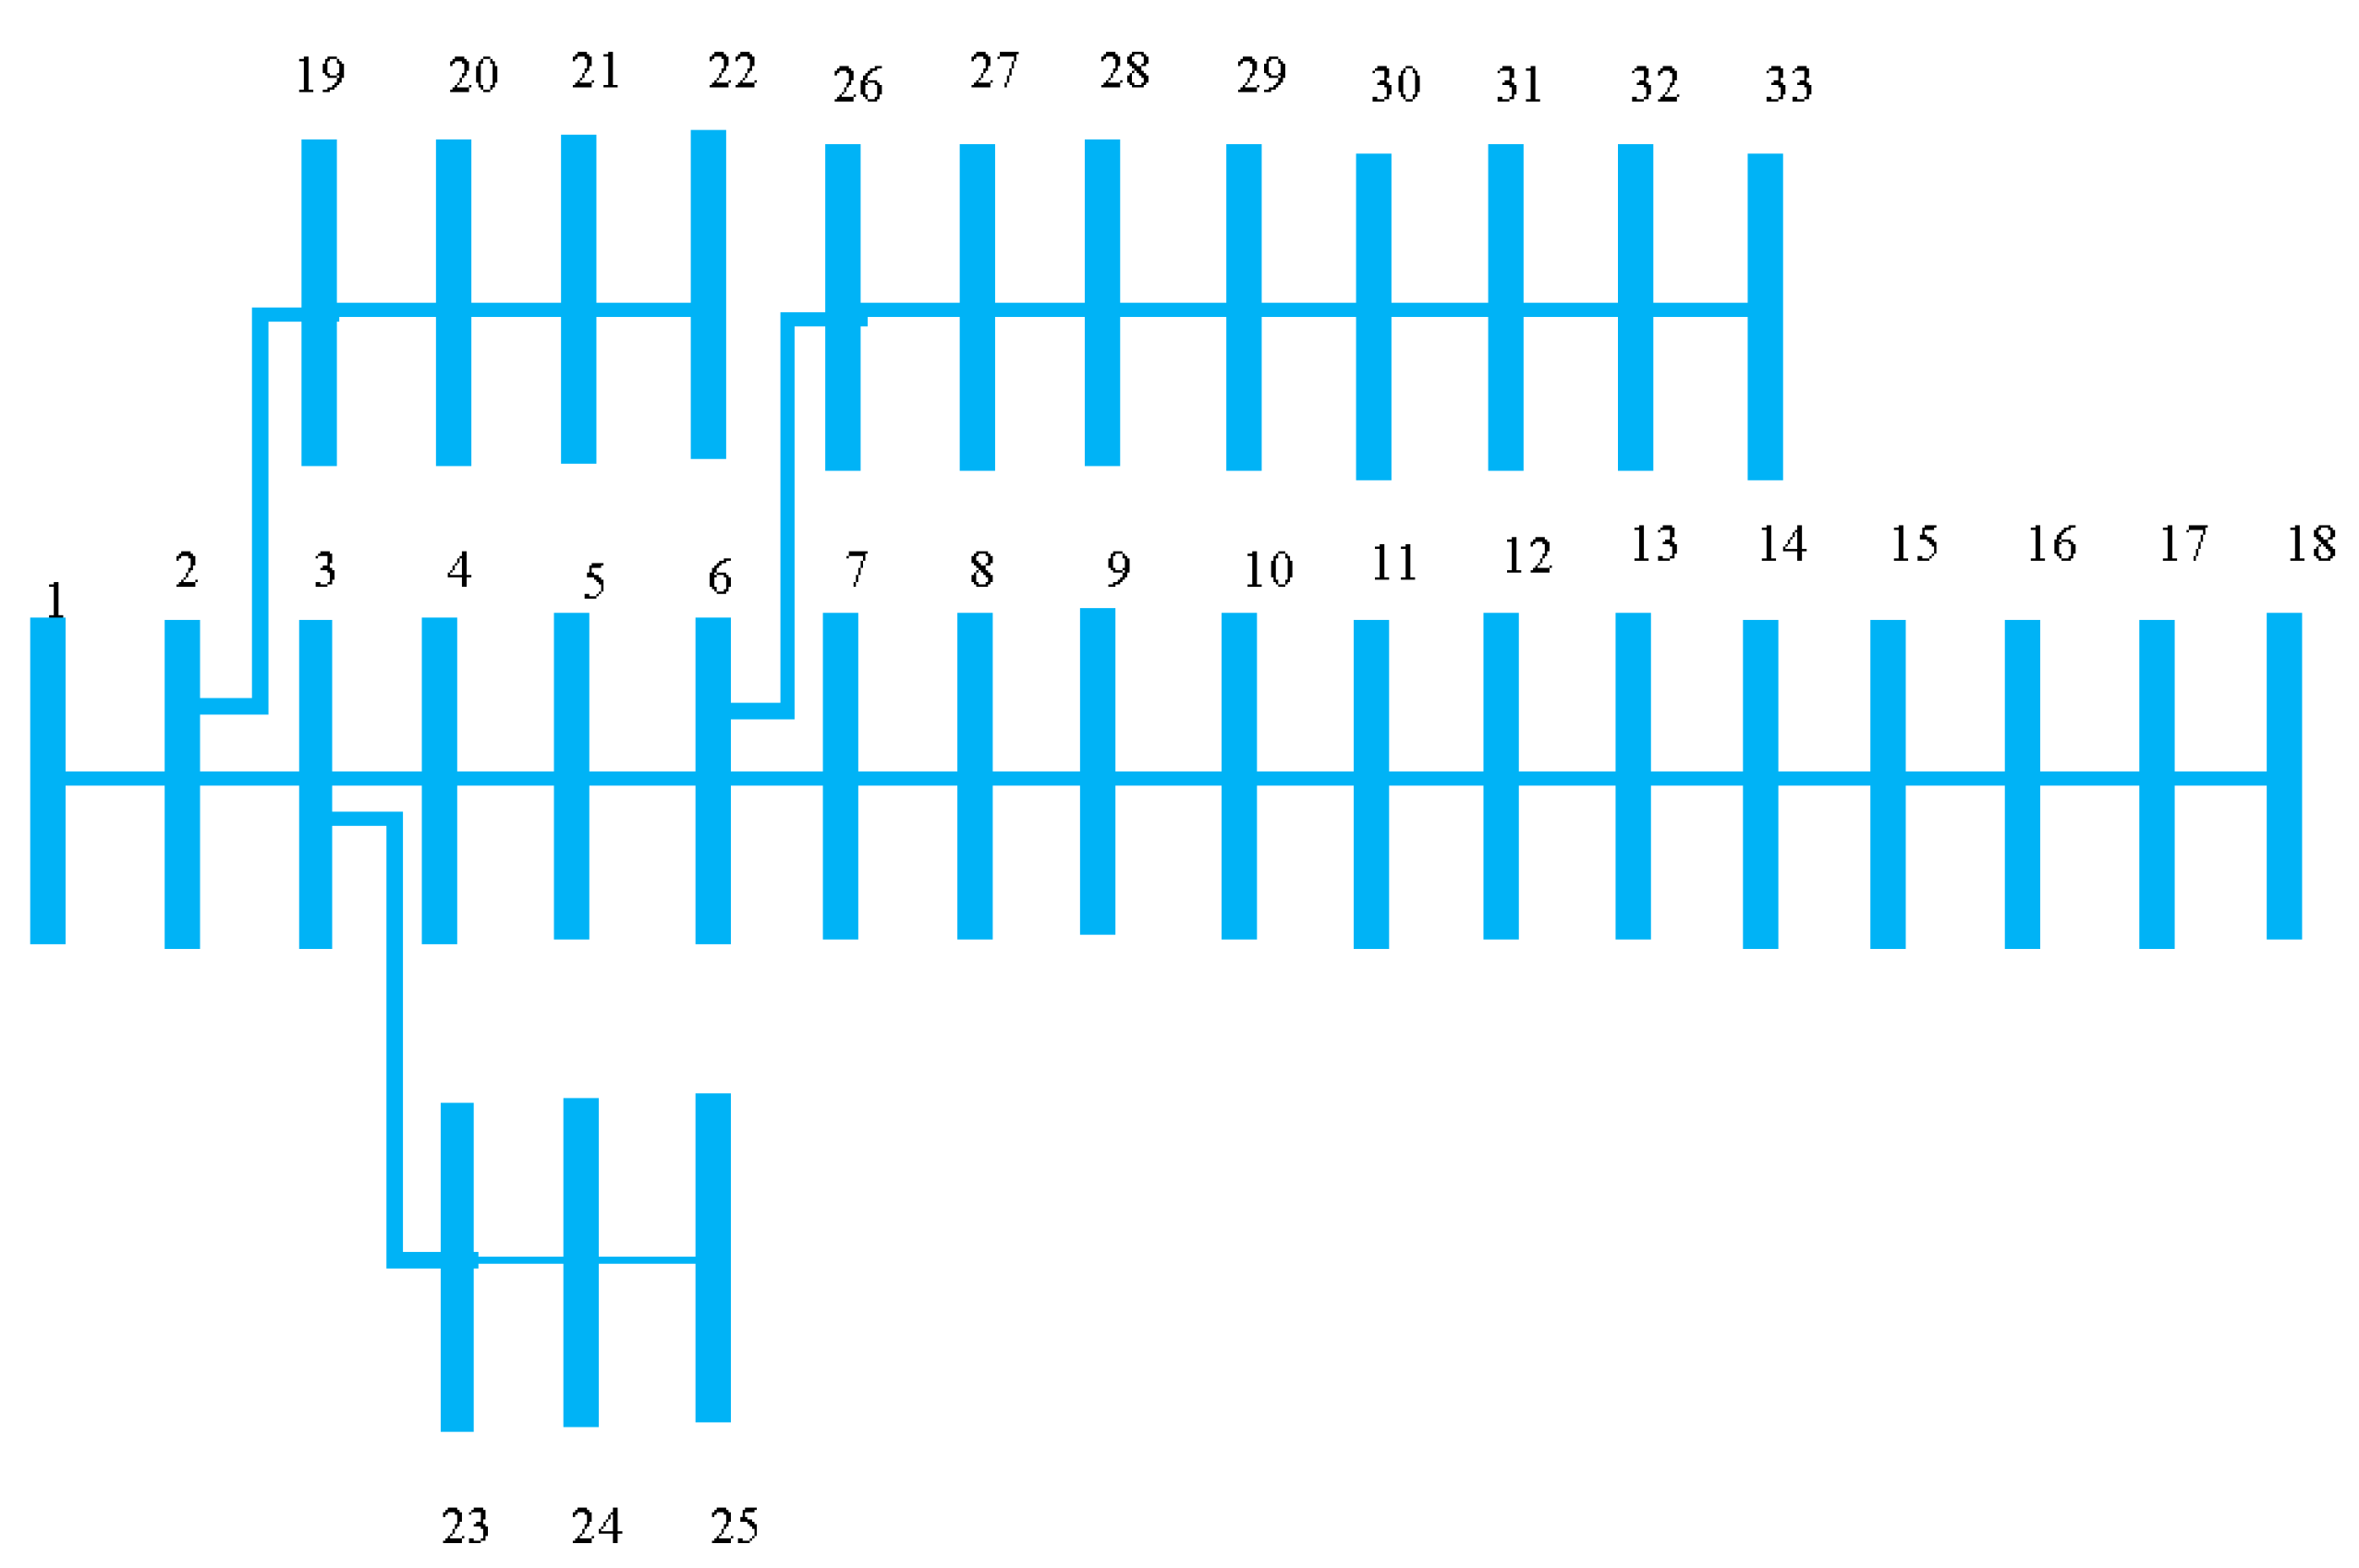
The entire analysis was performed on IEEE 33 bus test system. This network is a radial network as illustrated in Figure 9. It is a distribution network with 33 bus and 32 branches. The line data, branch data, as well as reliability data of this test network were taken from references [33,34] (See Table A1, Table A2 and Table A3).
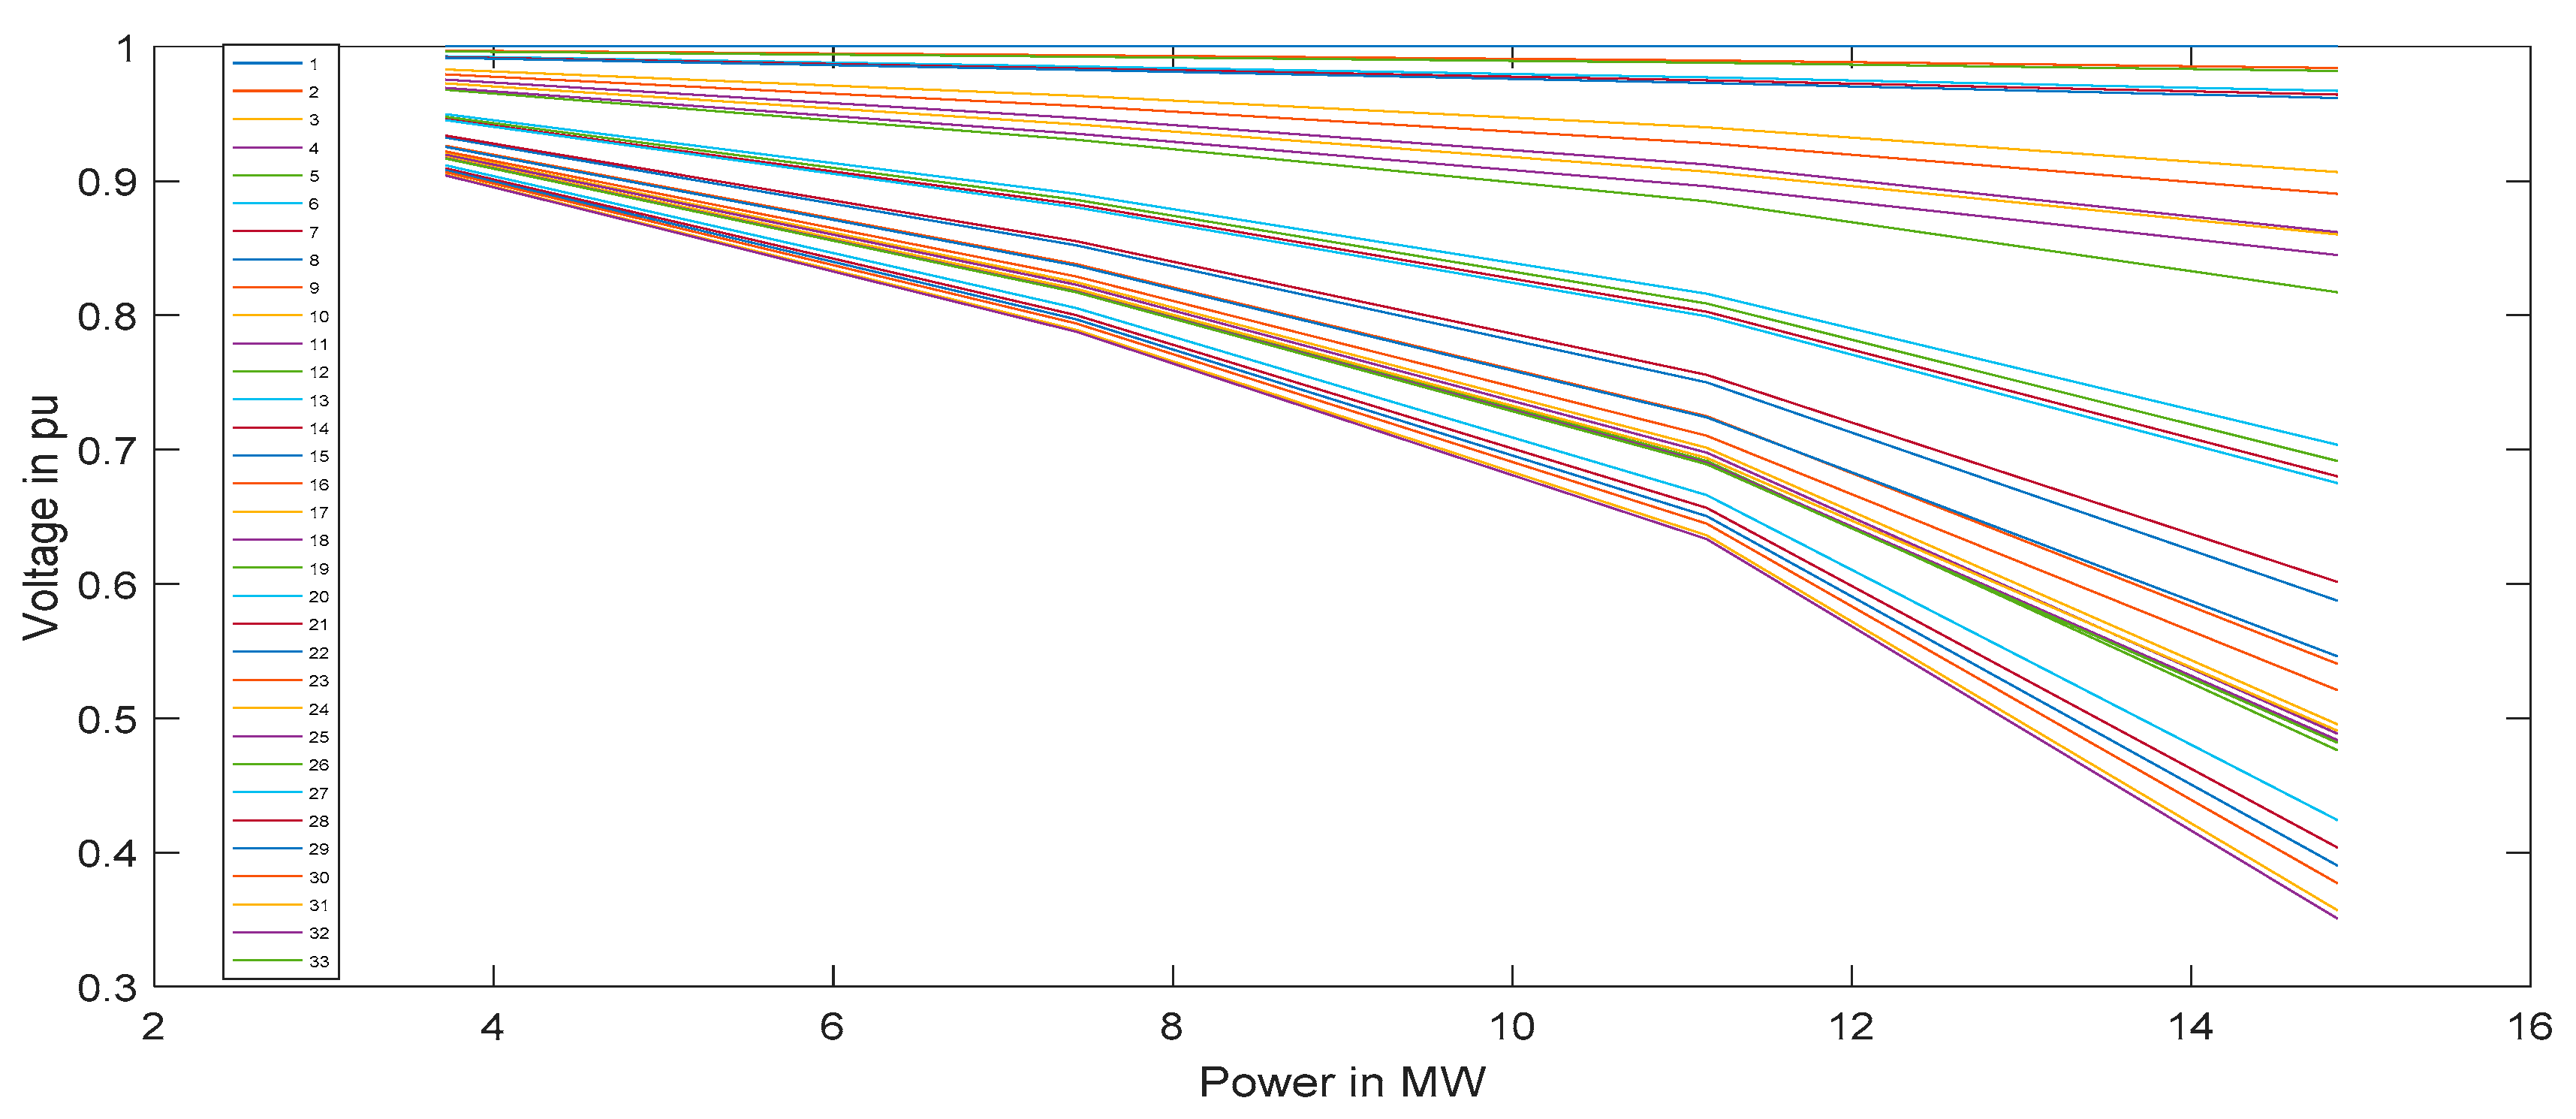
Based on the methodology of computing VSF of the buses described in Equation (1) of Section 2.1.1 the strong and weak buses of the system were determined. Figure 10 illustrates the PV curve of the IEEE 33 bus system for different loading factors. From the figure, it is clear that as the loading of the system increases the deviation of the bus voltage from base values becomes more and more prominent. Table 2 reports the VSF of all the buses for different loading factor. The VSF of bus 14 for loading factor 2, 3, and 4 were 0.1163, 0.2707, and 0.5533, respectively. The values of VSF of bus 14 were highest in comparison to the other buses. Thus, bus 14 was regarded as the weakest bus of the system. Similarly, the VSF of bus 2 was least for all the loading factors making it the strongest bus of the system. The VSF values also signify that bus 19 and bus 15 were the second strongest and second weakest bus respectively.
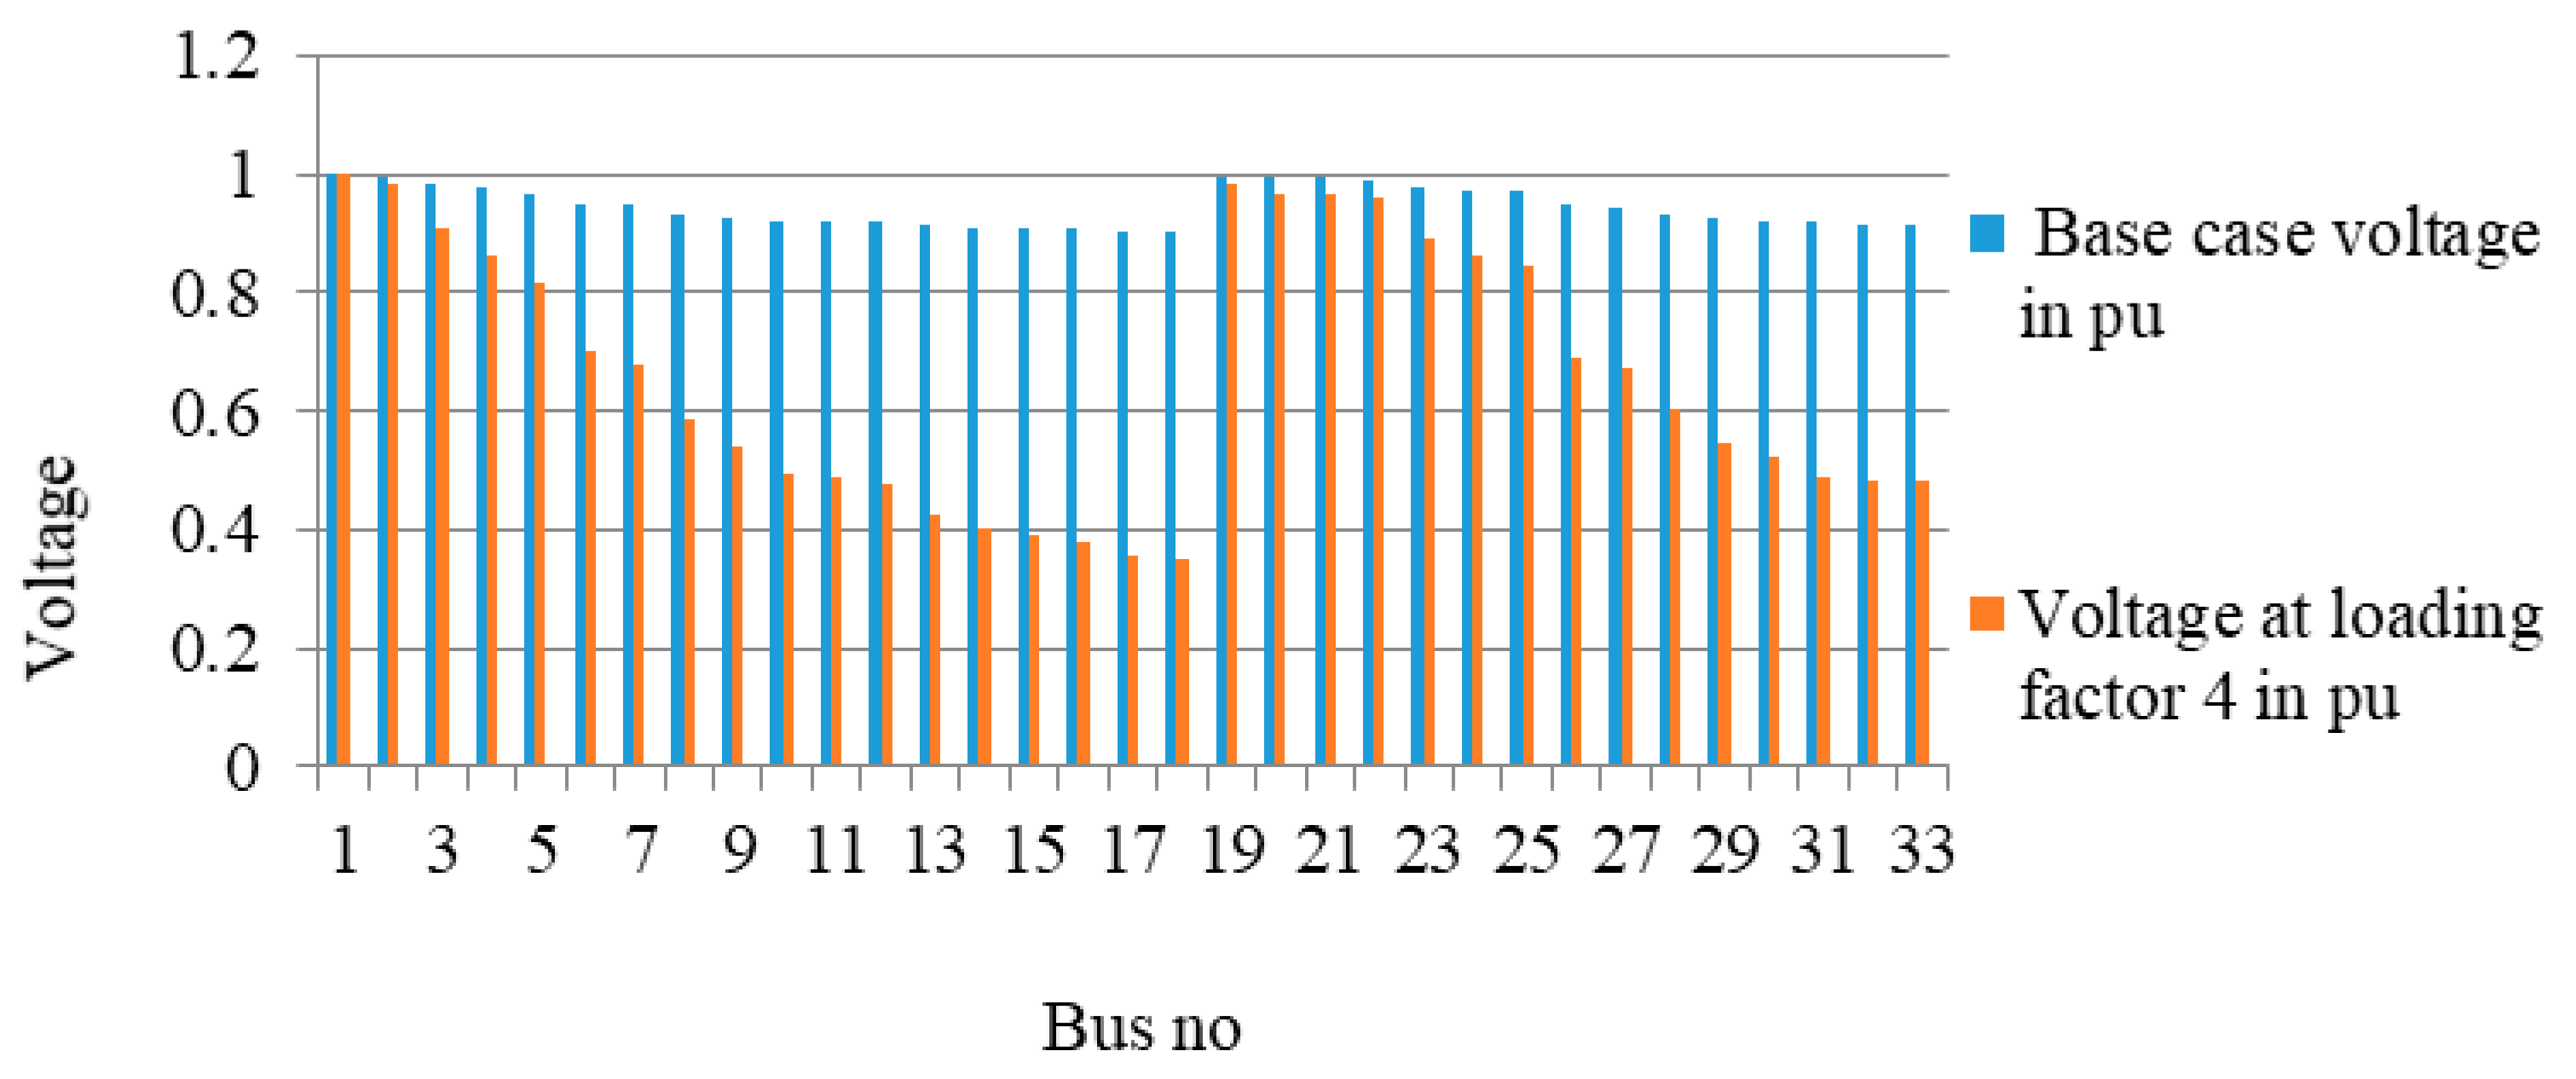
Figure 11 gives the comparative analysis of voltage of all the buses for the base case and critical loading. From the figure, the deviation of voltage of all the buses is quite prominent.
The EV charger load was modelled as in [28] and based on the data that a fast EV charger consumes 50 kW power [35] (See Table A4) the entire analysis was performed for all the cases illustrated in Table 3.
Case 1 was considered as the base case without charging stations in the entire analysis. In case 2 a fast charging station was placed at bus 2 representing the strongest bus of the system with 30 serving points. Assuming that each charger consumes 50 kW the charging station possessed the capability of charging 30 EVs simultaneously. In case 3 two charging stations were placed at bus 2 and in case 4 five fast charging stations were placed at bus 2. In case 5 a fast charging station was placed at bus 2 and 19 representing the strongest and second strongest bus respectively. In case 6 a single fast charging station was placed at bus 14 representing the weakest bus of the system. In case 7 a fast charging station was placed at bus 14 and 15 representing the weakest and second weakest bus respectively.
4.2. Impact of EV Charging Station Load on Distribution Network
The impact of EV charging station load on voltage stability, reliability, power losses, and economic losses of the distribution network was analysed for all the cases as mentioned in Table 3 and the results of this analyses are reported in this sub section.
4.2.1. Impact of EV Charging Station Load on Voltage Stability
The impact of EV charging load on voltage stability of IEEE 33 bus test network is reported in this sub section. The value of VSI is calculated for all the buses by utilizing the methodology elaborated in Section 2.1.2.
Table 4 reports the VSI for the base case and different cases of the placement of the EV charging station. It is observed that for case 7 where charging station was placed at the weakest bus the VSI of bus 14 was as low as 0.2073. Thus, placement of charging station at the weakest bus caused severe degradation of the voltage stability.
Table 5 lists the voltage of all the buses for the base case as well as after placing charging stations for all the cases mentioned in Table 3. The voltage of bus 14 for case 2 was 0.9082 pu. Thus, the magnitude of the voltage of bus 14 for case 2 was less than the base case voltage, but still within the acceptable range. However, for case 4 when five charging stations were placed at bus 2 the voltages of bus 17 and bus 18 dropped to 0.8984 pu and 0.8978 pu respectively. These values were not within the tolerance limit. In case 5 where a single charging station of 1500 kW was placed at bus 2 and bus 19 respectively it is observed that voltage drops of all the buses were less than that of case 3 where a single charging station of 3000 kW was placed at bus 2. Thus, distributing the charging stations between a number of buses is advantageous than concentrating the charging stations at a single bus. In case 6 where the charging station was placed at bus 14 representing a weak bus the voltage dropped to 0.7351 which cannot be tolerated. Similarly, for case 7 where two charging stations are placed at the two weak buses the voltage drop was prominent.
4.2.2. Impact of EV Charging Station Load on Reliability
The impact of EV charging station load on the reliability of the distribution network was analysed for all the cases mentioned in Table 3. The results of this analysis are reported in this sub-section. The failure rate, repair rate and outage duration of the system for increased load demand were computed based on unitary method [33].
Table 6 reports the impact of the placement of the EV charging stations on different reliability indices. The value of SAIFI for case 2 was 0.1195 interruption/customer yr. This value was more than the base case SAIFI but less than the critical or dead zone value of SAIFI. Similar trend is observed for SAIDI, CAIDI, as well as AENS. It is observed that for case 6 and case 7 the reliability indices degraded to a value that cannot be tolerated. Thus, for an increased load demand due to EV charging load the interruption, duration of interruption per customer increased. These were the chief causes of customer dissatisfaction.
For further analysis, Table 7 reports the equivalent events like increase in the number of customers responsible for degrading the reliability indices. Table 7 reports that the establishment of charging infrastructure of 30, 60, and 150 EVs is equivalent to increasing the number of customer of the distribution network by 106, 154, and 254 respectively in terms of the degradation of SAIFI.
4.2.3. Impact of EV Charging Station Load on Power Loss
The impact of the EV charging station load on the power loss of the distribution network were analysed for all the cases as mentioned in Table 3 and the results of this analysis are reported in this subsection. The power loss of the distribution network was computed by Equation (10).
Table 8 reports the magnitude of power loss of the network for different cases of placement of charging station. The power loss of the distribution network after the placement of charging stations was high as compared to without the charging stations. The power loss of case 5 is less than that of case3 signifying the advantage of distributing the charging station load between two buses. For case 6 and 7 where charging stations were placed at weak buses, the power losses were 0.0090 and 0.0247 respectively. Thus, these values were quite high in comparison to the base case.
4.2.4. Impact of EV Charging Station Load on Economic Loss
A detailed analysis of the economic losses incurred because of degradation of voltage profile and reliability indices are reported in this subsection. Table 9 reports the economic losses incurred by the utility due degradation of voltage profile and reliability after placement of charging stations. For case 2, case 3 and case 4 where charging stations were placed at the strongest bus of the network the penalty for voltage deviation was almost negligible. However, for case 4 the penalty for AENS was 56.610 $. On the other hand, when charging station was placed at bus 14 the penalty for voltage deviation was as high as 70,289 $. Despite the fact that improper placement of charging station results in economic losses the EVs must be welcomed as the net benefit earned by implementing V2G scheme cannot be neglected.
4.2.5. Comparative Analysis of EV Charging Station Load on Voltage Stability, Power Loss, and Reliability
A comparative analysis of the impact of EV charging station load on different operational parameters of the system like voltage stability, power loss, and reliability was performed and the results are in this sub-section.
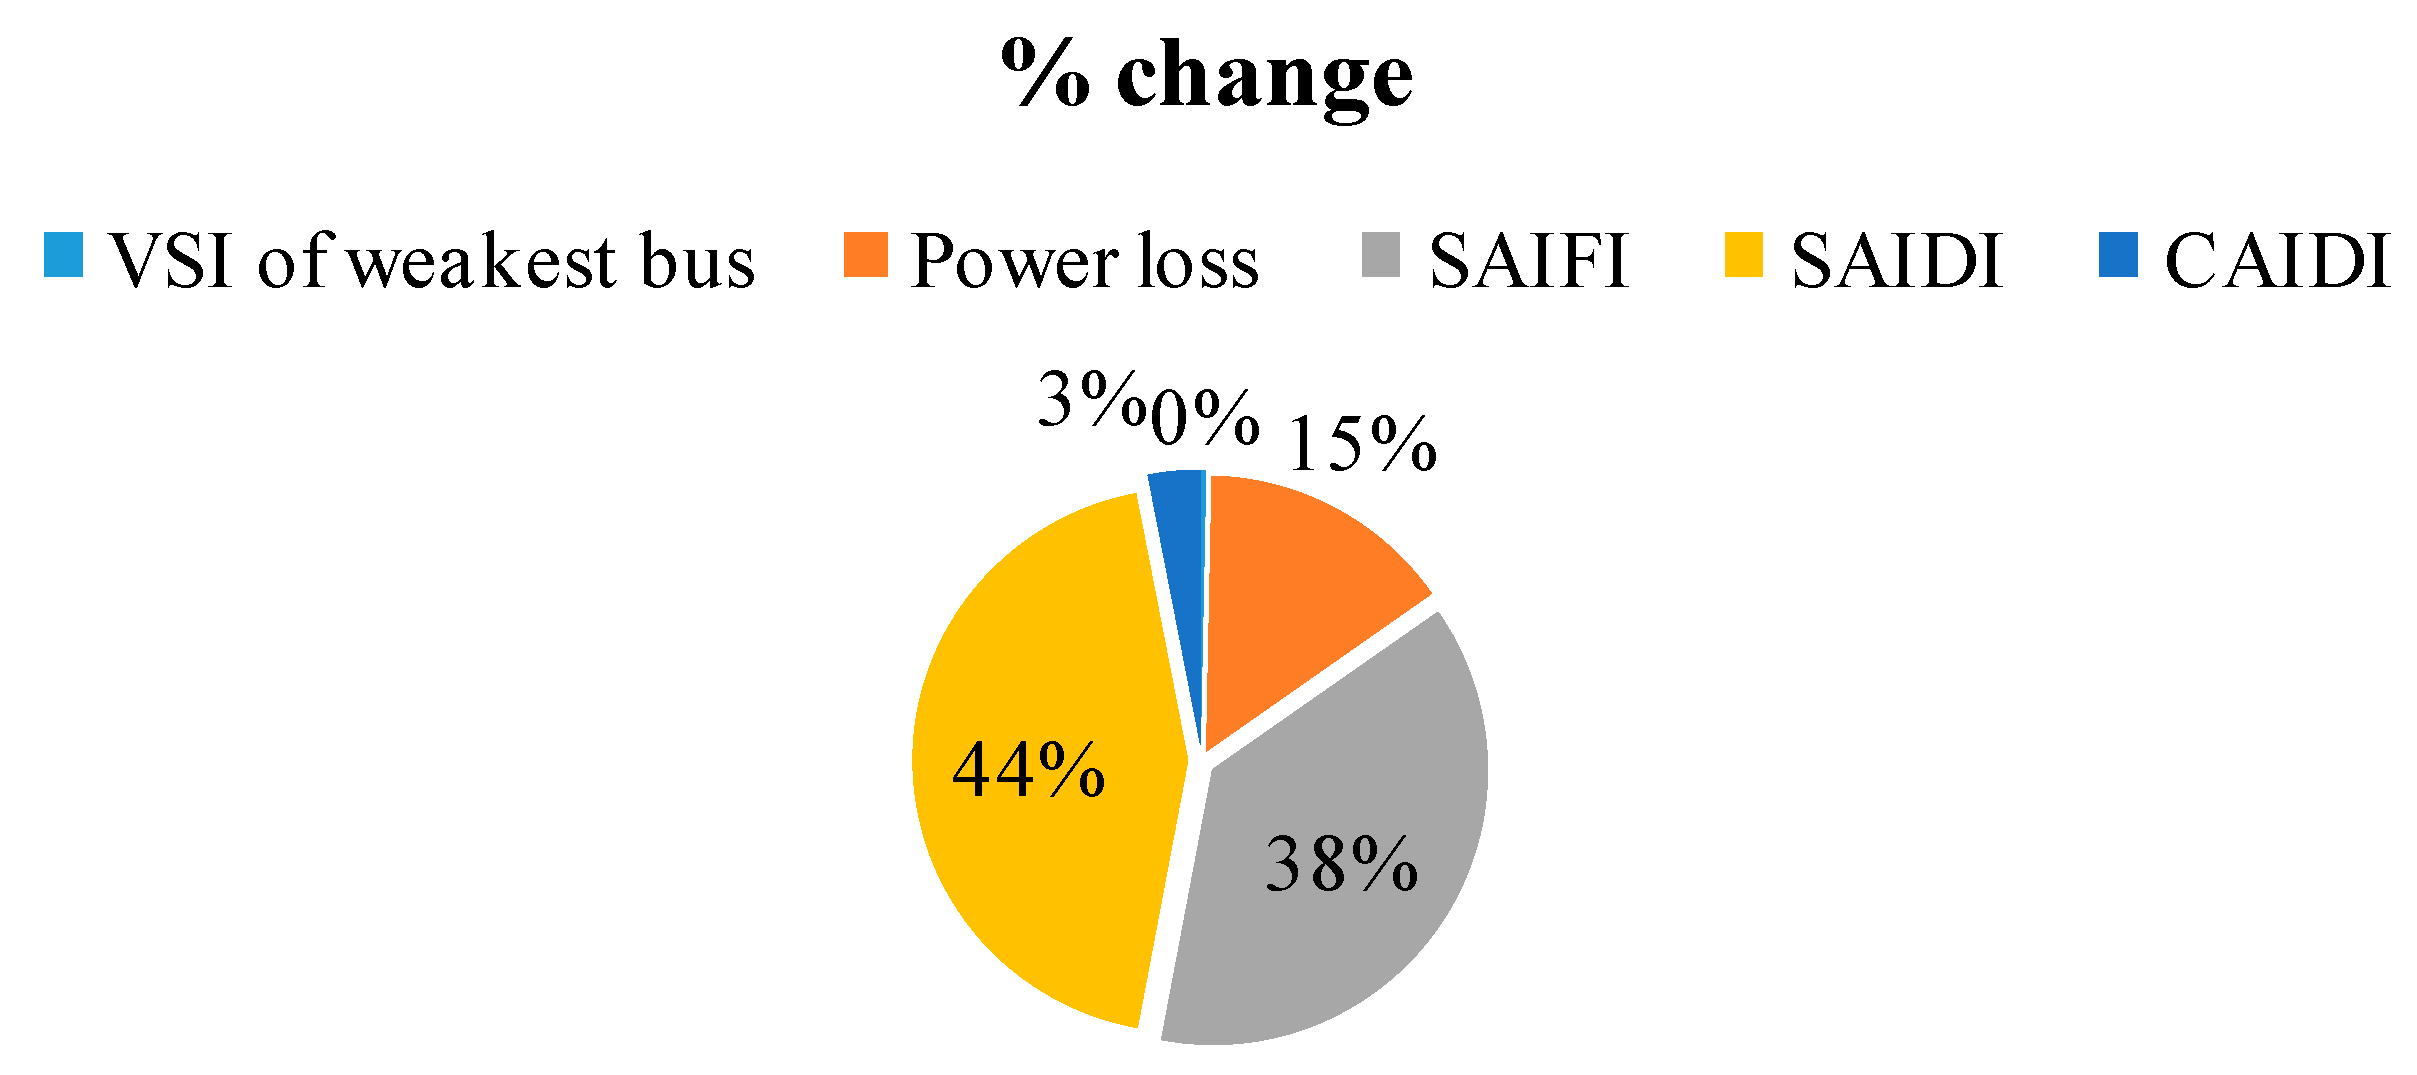
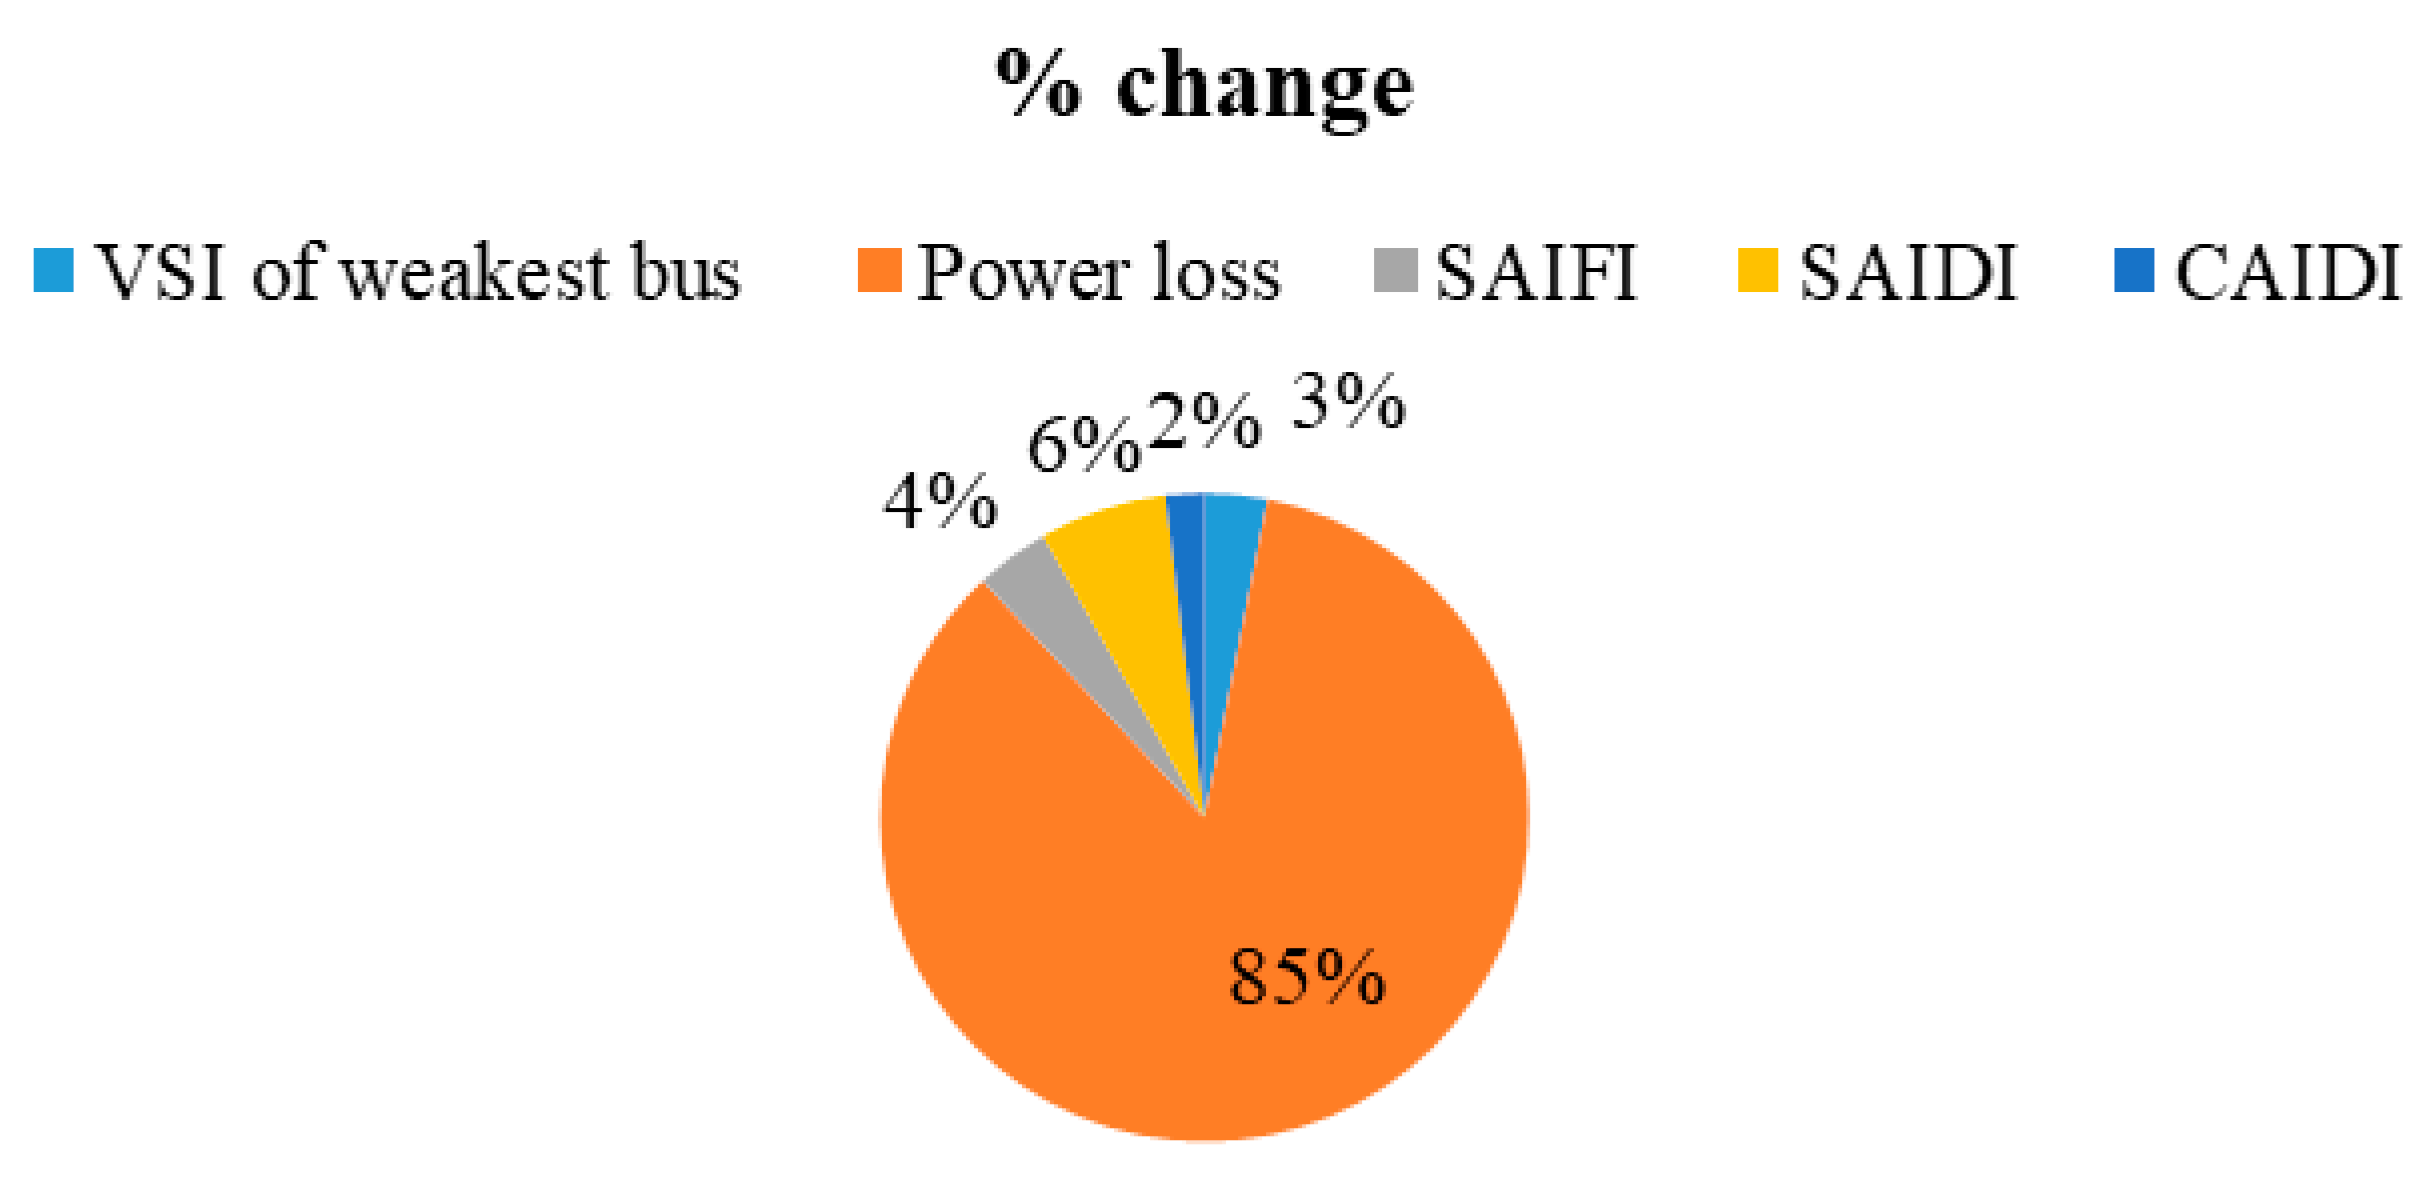
Table 10 gives a comparative analysis of the effect of EV charging station load on different indices of the distribution network. From this table it is clear that the reliability indices were more affected than power loss and voltage stability for case 2, case 3 and case 4 where charging station was placed at strong buses. However, for case 7 where charging stations were placed at bus 14 and 15 power loss was most severely affected. As illustrated in Figure 12 for case 4 the power loss is affected less than reliability indices. On the other hand, as illustrated in Figure 13 the % change in power loss for case 7 is 85%.
4.3. Optimal Placement of Charging Stations Based on VRP Index
As a motivating example for the usage of VRP index, we present briefly a novel methodology for the placement of the charging stations in the distribution network based on the VRP index. Genetic algorithm (GA) was used for solving the optimization problem. The results of the optimal placement of the charging stations are reported in this subsection. Table 11 reports the values of the different input parameters required for performing optimization. Table 12 reports the optimal locations of the charging stations in the IEEE 33 bus distribution network computed based on VRP index. The optimal locations were bus number 19, 20, and 2. The number of fast charging stations placed at bus number 19, 20, and 2 were 2, 1, and 2 respectively. The number of slow charging stations placed at bus number 19, 20, and 2 were 3, 2, and 1 respectively.
5. Discussion
EVs reduce the local emissions and have a positive impact on the environment. However, the detrimental impact of the EV charging station loads on the electricity distribution network cannot be neglected. The focus of this work was to present a detailed analysis of the impact of the EV charging station load on the different technical as well as economic parameters of the IEEE 33 bus system. The impact of the EV charging stations on the voltage stability, reliability, power loss, and economic loss were analysed profoundly in this work and the key findings of the work are summarized as follows:
- (1)
- The IEEE 33 bus test system was robust enough to withstand the placement of four charging stations at bus 2 representing the strongest bus of the system. It is observed that when five charging stations were placed at bus 2 the SAIDI increased by 44%. Thus, for increasing the number of charging stations beyond four up gradation of the network was required.
- (2)
- The placement of the fast charging station at the weak bus of the network was detrimental to the security of the system. On placement of even a single charging station at the weakest bus the voltage of the weakest bus dropped to 0.7351 per unit. The reliability indices also deteriorated significantly on placement of fast charging stations at the weak buses. Moreover, it is observed that on placement of a single charging station at bus 14 and 15 representing the weak buses of the network the power losses increased by 85%. However, slow charging stations of 19.2 kW could be placed even at the weak buses.
- (3)
- Distributing the charging stations between a number of buses was advantageous than concentrating the charging stations at a single bus in terms of voltage deviation, reliability as well as power loss. Also, in some cases, if the strong nodes of the distribution network and nodes of the road network with high traffic concentration merge then the routes leading to that node will be too congested. Therefore, another advantage of distributing the charging station is making the charging facility accessible to a larger number of EVs plying in different routes. This in turn will reduce the traffic congestion of the specific routes leading to the bus in which charging stations are concentrated.
- (4)
- A considerable economic loss was incurred by the utility for placement of charging stations at the weak buses. It is observed that on placement of even a single fast charging station at the weakest bus 1,397,700.5 $ of economic loss is incurred. However, despite the fact that improper placement of charging station results in economic losses the EVs must be welcomed as the net benefit earned by implementing V2G scheme cannot be neglected. In V2G scheme the charging stations can earn revenue by selling the electricity back to the grid when the charging demand is low.
- (5)
- The reliability indices were more affected than power loss and voltage stability for case 2, case 3 and case 4 where the charging station was placed at strong buses. However, for case 7 where charging stations are placed at bus 14 and 15 power loss was most severely affected.
All the aforementioned findings must be taken into account while dealing with the problem of optimal placement of charging stations. From the results obtained it is obvious that voltage stability, power loss as well as reliability indices degraded with the addition of EV charging station loads. Thus, for optimal placement of charging stations in the distribution network all the three parameters must be considered. A novel index named VRP index taking into account the voltage stability, reliability and power loss was also formulated. The novelty of VRP index lies in the fact that has the capability of considering voltage stability, power loss, and reliability together under a common frame. Further, a strategy for the placement of the charging stations in the distribution network based on VRP index was presented in this work. The results of the optimal placement of the charging stations based on VRP index established the efficacy of the index. Future possible research directions in this area are:
- (1)
- Mitigation of the negative impacts of EV charging station placement by reconfiguration of the network.
- (2)
- Analysis of the positive impact of the Vehicle to Grid (V2G) scheme.
- (3)
- Real time planning of EV charging stations based on VRP index.
6. Conclusions
EVs are a favorable alternative to reduce the emissions of the transport sector. The growing popularity of EVs has led to the establishment of charging stations; however the detrimental impact of the resulting EV charging station loads on the distribution network cannot be neglected. This work meticulously analysed the impact of EV charging station loads on the voltage stability, reliability indices, power losses, and economic loss of the IEEE 33 bus test system. The results obtained showed that the impact of placing fast charging stations at the weak buses affected the smooth operation of the power distribution network. A considerable amount of economic loss was also incurred if fast charging stations were placed at the weak buses of the network. However, the system was strong enough to withstand the placement of charging stations at the strong buses. Further, the placement of the charging stations in the distribution network based on a new VRP index was proposed in this work. GA was used to solve the charger location problem with VRP index as the objective function. The results obtained indicate the efficacy of the VRP index in finding the most suitable locations for charging stations in the IEEE 33 bus test network. Thus, this work will serve as a guide to the power system engineers and help in planning of distribution networks in presence of EV charging loads.
Acknowledgments
The authors would like to thank Henry Ford Foundation Finland for support.
Author Contributions
The work is performed by Sanchari Deb under the supervision of Karuna Kalita, Pinakeshwar Mahanta and Kari Tammi. Kari Tammi participated in drafting the research problem, outlining the solution procedure, and checking the methodology and results. Karuna Kalita and Pinakeshwar Mahanta helped in writing the article.
Conflicts of Interest
The authors declare no conflict of interest.
Nomenclature
| EV | Electric Vehicle |
| VRP | Voltage Stability, Reliability, and Power loss Index |
| ICE | Internal Combustion Engine |
| IPT | Inductive Power Transfer |
| PHEV | Plugged In Hybrid Electric Vehicle |
| PV curve | Power and Voltage curve |
| VSF | Voltage Sensitivity Factor |
| VSI | Voltage Stability Index |
| SAIFI | System Average Interruption Frequency Index |
| SAIDI | System Average Interruption Duration Index |
| CAIDI | Customer Average Interruption Duration Index |
| ENS | Energy Not Served |
| AENS | Average Energy Not Served |
| Vj < δj | Voltage of bus j |
| Vj+1 < δj+1 | Voltage of bus j + 1 |
| I | Current flowing through the branch having resistance r and impedance x |
| Pj+1 | Active power of the bus j + 1 |
| Qj+1 | Reactive power of bus j + 1 |
| Z | Impedance of branch j |
| λj | Failure rate of bus j |
| Nj | Number of consumers connected at bus j |
| Uj | Annual outage duration of bus j |
| Lj | Load demand of bus j |
| Pj | Power losses through jth branch |
| Pt | Total power losses of the network |
| Weight assigned to A | |
| Weight assigned to B | |
| Weight assigned to C | |
| VSI after increase in load | |
| SAIFI after increase in load | |
| SAIDI after increase in load | |
| CAIDI after increase in load | |
| VSIbase | Base value of VSI |
| SAIFIbase | Base value of SAIFI |
| SAIDIbase | Base value of SAIDI |
| CAIDIbase | Base value of CAIDI |
| Power losses after increase in load | |
| Power losses for the base case | |
| Sub weight assigned to SAIFI | |
| Sub weight assigned to SAIDI | |
| Sub weight assigned to CAIDI | |
| i | Index of strong bus of the network |
| n | Number of charging stations placed at bus i |
| nfastCS | Maximum number of fast charging stations that can be placed at each bus |
| nslowC | Maximum number of slow charging stations that can be placed at each bus |
| Smin | Lower bound of reactive power |
| Smax | Upper bound of reactive power |
| Lmax | Loading margin of the network |
Appendix A

Table A1.
Bus Data of IEEE 33 bus test system [34].
Table A1.
Bus Data of IEEE 33 bus test system [34].
| Bus No. | Real Power (pu) | Reactive Power (pu) |
|---|---|---|
| 1 | 0 | 0 |
| 2 | 0.0010 | 0.0006 |
| 3 | 0.0009 | 0.0004 |
| 4 | 0.0012 | 0.0008 |
| 5 | 0.0006 | 0.0003 |
| 6 | 0.0006 | 0.0002 |
| 7 | 0.0020 | 0.0010 |
| 8 | 0.0020 | 0.0010 |
| 9 | 0.0006 | 0.0002 |
| 10 | 0.0006 | 0.0002 |
| 11 | 0.0004 | 0.0003 |
| 12 | 0.0006 | 0.0004 |
| 13 | 0.0006 | 0.0004 |
| 14 | 0.0012 | 0.0008 |
| 15 | 0.0006 | 0.0001 |
| 16 | 0.0006 | 0.0002 |
| 17 | 0.0006 | 0.0002 |
| 18 | 0.0009 | 0.0004 |
| 19 | 0.0009 | 0.0004 |
| 20 | 0.0009 | 0.0004 |
| 21 | 0.0009 | 0.0004 |
| 22 | 0.0009 | 0.0004 |
| 23 | 0.0009 | 0.0005 |
| 24 | 0.0042 | 0.0020 |
| 25 | 0.0042 | 0.0020 |
| 26 | 0.0006 | 0.0003 |
| 27 | 0.0006 | 0.0003 |
| 28 | 0.0006 | 0.0002 |
| 29 | 0.0012 | 0.0007 |
| 30 | 0.0020 | 0.0060 |
| 31 | 0.0015 | 0.0007 |
| 32 | 0.0021 | 0.0010 |
| 33 | 0.0006 | 0.0004 |
Table A2.
Line Data of IEEE 33 bus test system [34].
Table A2.
Line Data of IEEE 33 bus test system [34].
| Line No. | Starting Bus | End Bus | R (pu) | X (pu) |
|---|---|---|---|---|
| 1 | 1 | 2 | 0.0575 | 0.0298 |
| 2 | 2 | 3 | 0.3076 | 0.1567 |
| 3 | 3 | 4 | 0.2284 | 0.1163 |
| 4 | 4 | 5 | 0.2378 | 0.1211 |
| 5 | 5 | 6 | 0.5110 | 0.4411 |
| 6 | 6 | 7 | 0.1168 | 0.3861 |
| 7 | 7 | 8 | 1.0678 | 0.7706 |
| 8 | 8 | 9 | 0.6426 | 0.4617 |
| 9 | 9 | 10 | 0.6489 | 0.4617 |
| 10 | 10 | 11 | 0.1227 | 0.0406 |
| 11 | 11 | 12 | 0.2336 | 0.0772 |
| 12 | 12 | 13 | 0.9159 | 0.7206 |
| 13 | 13 | 14 | 0.3379 | 0.4448 |
| 14 | 14 | 15 | 0.3687 | 0.3282 |
| 15 | 15 | 16 | 0.4656 | 0.3400 |
| 16 | 16 | 17 | 0.8042 | 1.0738 |
| 17 | 17 | 18 | 0.4567 | 0.3581 |
| 18 | 2 | 19 | 0.1023 | 0.0976 |
| 19 | 19 | 20 | 0.9385 | 0.8457 |
| 20 | 20 | 21 | 0.2555 | 0.2985 |
| 21 | 21 | 22 | 0.4423 | 0.5848 |
| 22 | 3 | 23 | 0.2815 | 0.1924 |
| 23 | 23 | 24 | 0.5603 | 0.4424 |
| 24 | 24 | 25 | 0.5590 | 0.4374 |
| 25 | 6 | 26 | 0.1267 | 0.0645 |
| 26 | 26 | 27 | 0.1773 | 0.0903 |
| 27 | 27 | 28 | 0.6607 | 0.5826 |
| 28 | 28 | 29 | 0.5018 | 0.4371 |
| 29 | 29 | 30 | 0.3166 | 0.1613 |
| 30 | 30 | 31 | 0.6080 | 0.6008 |
| 31 | 31 | 32 | 0.1937 | 0.2258 |
| 32 | 32 | 33 | 0.2128 | 0.3308 |
Table A3.
Outage Data of IEEE 33 bus test system [33].
Table A3.
Outage Data of IEEE 33 bus test system [33].
| Bus No. | Failure Rate (Failure/Year) | Outage Duration (h/Year) | No. of Consumer | Load (kW) |
|---|---|---|---|---|
| 2 | 0.0500 | 0.3000 | 26 | 100 |
| 3 | 0.0400 | 0.3000 | 23 | 90 |
| 4 | 0.0600 | 0.3000 | 31 | 120 |
| 5 | 0.0300 | 0.2000 | 16 | 60 |
| 6 | 0.0300 | 0.2000 | 16 | 200 |
| 7 | 0.0900 | 0.6000 | 52 | 200 |
| 8 | 0.0300 | 0.6000 | 52 | 60 |
| 9 | 0.0300 | 0.2000 | 15 | 60 |
| 10 | 0.0200 | 0.2000 | 15 | 45 |
| 11 | 0.0300 | 0.1000 | 12 | 60 |
| 12 | 0.0300 | 0.2000 | 16 | 60 |
| 13 | 0.0600 | 0.2000 | 16 | 120 |
| 14 | 0.0300 | 0.3000 | 31 | 60 |
| 15 | 0.0300 | 0.2000 | 16 | 60 |
| 16 | 0.0300 | 0.2000 | 16 | 60 |
| 17 | 0.0300 | 0.2000 | 16 | 60 |
| 18 | 0.0400 | 0.2000 | 23 | 90 |
| 19 | 0.0400 | 0.2000 | 23 | 90 |
| 20 | 0.0400 | 0.2000 | 23 | 90 |
| 21 | 0.0400 | 0.2000 | 23 | 90 |
| 22 | 0.0400 | 0.2000 | 23 | 90 |
| 23 | 0.0400 | 0.2000 | 23 | 90 |
| 24 | 0.1900 | 1.1000 | 109 | 420 |
| 25 | 0.1900 | 1.1000 | 109 | 420 |
| 26 | 0.0300 | 0.2000 | 16 | 60 |
| 27 | 0.0300 | 0.2000 | 16 | 60 |
| 28 | 0.0300 | 0.2000 | 16 | 60 |
| 29 | 0.5400 | 0.3000 | 31 | 120 |
| 30 | 0.0900 | 0.5000 | 25 | 120 |
| 31 | 0.0700 | 0.4000 | 39 | 150 |
| 32 | 0.1000 | 0.6000 | 35 | 210 |
| 33 | 0.0300 | 0.2000 | 16 | 60 |
Table A4.
Charging station specifications for EV [35].
Table A4.
Charging station specifications for EV [35].
| Type | Load Consumed (kW) |
|---|---|
| Level 1 | Up to 1.8 |
| Level 2 | Up to 19.2 |
| DC Fast charging | (50–150) |
References
- Wang, Z.; Yang, L. Delinking indicators on regional industry development and carbon emissions: Beijing–Tianjin–Hebei economic band case. Ecol. Indic. 2015, 48, 41–48. [Google Scholar] [CrossRef]
- Wang, Q.; Rongrong, L.; Rui, J. Decoupling and Decomposition Analysis of Carbon Emissions from Industry: A Case Study from China. Sustainability 2016, 10, 1059–1076. [Google Scholar] [CrossRef]
- Blesl, M.; Das, A.; Fahl, U.; Remme, U. Role of energy efficiency standards in reducing CO2 emissions in Germany: An assessment with TIMES. Energy Policy 2007, 35, 772–785. [Google Scholar] [CrossRef]
- Alam, M.M.; Mekhilef, S.; Seyedmahmoudian, M.; Horan, B. Dynamic Charging of Electric Vehicle with Negligible Power Transfer Fluctuation. Energies 2017, 10, 701. [Google Scholar] [CrossRef]
- Foley, A.M.; Winning, I.J.; Gallachóir, B.P. State-of-the-art in electric vehicle charging infrastructure. In Proceedings of the Vehicle Power and Propulsion (VPPC), Lille, France, 1–3 September 2010; pp. 1–6. [Google Scholar]
- Shi, R.; Zhang, X.P.; Kong, D.C.; Wang, P.Y. Dynamic Impacts of Fast-charging Stations for Electric Vehicles on Active Distribution Networks. In Proceedings of the Innovative Smart Grid Technologies, Tianjin, China, 21–24 May 2012; pp. 1–6. [Google Scholar]
- Zhu, D.; Patella, D.P.; Steinmetz, R.O.; Peamsilpakulchorn, P. The Bhutan Electric Vehicle Initiative: Scenarios, Implications, and Economic Impact; World Bank Publications: Washington, WA, USA, 2016. [Google Scholar]
- Geske, M.; Komarnicki, P.; Stötzer, M.; Styczynski, Z.A. Modeling and simulation of electric car penetration in the distribution power system—Case study. In Proceedings of the International Symposium on Modern Electric Power Systems, Wroclaw, Poland, 1 September 2011; pp. 1–6. [Google Scholar]
- Juanuwattanakul, P.; Masoum, M.A. Identification of the weakest buses in unbalanced multiphase smart grids with plug-in electric vehicle charging stations. In Proceedings of the Innovative Smart Grid Technologies, Perth, Australia, 13–16 November 2011; pp. 1–5. [Google Scholar]
- Zhang, C.; Chen, C.; Sun, J.; Zheng, P.; Lin, X.; Bo, Z. Impacts of electric vehicles on the transient voltage stability of distribution network and the study of improvement measures. In Proceedings of the IEEE Asia Pacific Power and Energy Engineering Conference(APPEEC), Hong Kong, China, 7–10 December 2014; pp. 1–6. [Google Scholar]
- Dharmakeerthi, C.H.; Mithulananthan, N.; Saha, T.K. Impact of electric vehicle fast charging on power system voltage stability. Int. J. Electr. Power Energy Syst. 2014, 57, 241–249. [Google Scholar] [CrossRef]
- Ul-Haq, A.; Cecati, C.; Strunz, K.; Abbasi, E. Impact of electric vehicle charging on voltage unbalance in an urban distribution network. Intell. Indus. Syst. 2015, 1, 51–60. [Google Scholar] [CrossRef]
- De Hoog, J.; Muenzel, V.; Jayasuriya, D.C.; Alpcan, T.; Brazil, M.; Thomas, D.A.; Jegatheesan, R. The importance of spatial distribution when analysing the impact of electric vehicles on voltage stability in distribution networks. Energy Syst. 2015, 6, 63–84. [Google Scholar] [CrossRef]
- Zhang, Y.; Song, X.; Gao, F.; Li, J. Research of voltage stability analysis method in distribution power system with plug-in electric vehicle. In Proceedings of the IEEE Asia Pacific Power and Energy Engineering, Xi’an, China, 25–28 October 2016; pp. 1–6. [Google Scholar]
- Staats, P.T.; Grady, W.M.; Arapostathis, A.; Thallam, R.S. A statistical analysis of the effect of electric vehicle battery charging on distribution system harmonic voltages. IEEE Trans. Power Deliv. 1998, 13, 640–646. [Google Scholar] [CrossRef]
- Gómez, J.C.; Medhat, M.M. Impact of EV battery chargers on the power quality of distribution systems. IEEE Trans. Power Deliv. 2003, 18, 975–981. [Google Scholar] [CrossRef]
- Basu, M.; Gaughan, K.; Coyle, E. Harmonic distortion caused by EV battery chargers in the distribution systems network and its remedy. In Proceedings of the 39th International Universities Power Engineering Conference, Bristol, UK, 6–8 September 2004; pp. 1–6. [Google Scholar]
- Jiang, C.; Torquato, R.; Salles, D.; Xu, W. Method to assess the power-quality impact of plug-in electric vehicles. IEEE Trans. Power Deliv. 2014, 29, 958–965. [Google Scholar] [CrossRef]
- McCarthy, D.; Wolfs, P. The HV system impacts of large scale electric vehicle deployments in a metropolitan area. In Proceedings of the 20th Australasian Universities Power Engineering Conference, Christchurch, New Zealand, 5–8 December 2010; pp. 1–6. [Google Scholar]
- Putrus, G.A.; Suwanapingkarl, P.; Johnston, D.; Bentley, E.C.; Narayana, M. Impact of electric vehicles on power distribution networks. In Proceedings of the Vehicle Power and Propulsion Conference, Dearborn, MI, USA, 7–10 September 2009; pp. 1–6. [Google Scholar]
- Fan, Y.; Guo, C.; Hou, P.; Tang, Z. Impact of Electric Vehicle Charging on Power Load Based on TOU Price. Energy Power Eng. 2013, 5, 1347–1352. [Google Scholar] [CrossRef]
- Di Silvestre, M.L.; Riva Sanseverino, E.; Zizzo, G.; Graditi, G. An optimization approach for efficient management of EV parking lots with batteries recharging facilities. J. Ambient. Intell. Hum. Comput. 2013, 4, 641–649. [Google Scholar] [CrossRef]
- Fakeha, S.; Manisa, P.; Rahman, S. Demand management to mitigate impacts of plug-in electric vehicle fast charge in buildings with renewables. Energy 2017, 120, 642–651. [Google Scholar]
- Hüls, J.; Anne, R. Coordinated charging strategies for plug-in electric vehicles to ensure a robust charging process. In Proceedings of the 10th EAI International Conference on Performance Evaluation Methodologies and Tools on 10th EAI International Conference on Performance Evaluation Methodologies and Tools, Taormina, Italy, 25–28 October 2016. [Google Scholar]
- Kundur, P. Power System Stability and Control; Balu, N.J., Lauby, M.G., Eds.; McGraw-Hill: New York, NY, USA, 1994; Volume 7. [Google Scholar]
- Kessel, P.; Glavitsch, H. Estimating the voltage stability of a power system. IEEE Trans. Power Deliv. 1986, 1, 346–354. [Google Scholar] [CrossRef]
- Lis, R.A. Voltage Stability Assessment Using Bus PQ Curve. Available online: http://www.wseas.us/e-library/conferences/2013/Nanjing/SCIE/SCIE-01.pdf (accessed on 18 July 2017).
- Rahman, M.M.; Barua, S.; Zohora, S.T.; Hasan, K.; Aziz, T. Voltage sensitivity based site selection for PHEV charging station in commercial distribution system. In Proceedings of the Asia Pacific Power and Energy Engineering Conference, Hong Kong, China, 8–11 December 2013; pp. 1–6. [Google Scholar]
- Rupa, J.A.M.; Ganesh, S. Power flow analysis for radial distribution system using backward/forward sweep method. Int. J. Electr. Comput. Electron. Commun. Eng. 2014, 10, 1540–1544. [Google Scholar]
- Eminoglu, U.; Hocaoglu, M.H. A voltage stability index for radial distribution networks. In Proceedings of the 2007 42nd International Universities Power Engineering Conference, Brighton, UK, 4–6 September 2007; pp. 408–413. [Google Scholar]
- Chowdhury, A.; Koval, D. Power Distribution System Reliability: Practical Methods and Applications; John Wiley & Sons: Hoboken, NJ, USA, 2015. [Google Scholar]
- Billinton, R.; Alen, R. Reliability Evaluation of Power Systems, 2nd ed.; Plenum: New York, NY, USA, 1994; pp. 400–442. [Google Scholar]
- Bhadra, J.; Chattopadhyay, T.K. Analysis of distribution network by reliability indices. In Proceedings of the International Conference on Energy, Power, and Environment: Towards Sustainable Growth (ICEPE), Shillong, India, 12–13 June 2015; pp. 1–5. [Google Scholar]
- Aslanzadeh, S.; Mohammad, K.; Alireza, G. Comparison of voltage stability indicators in distribution systems. Indian J. Sci. Res. 2014, 2, 5–10. [Google Scholar]
- Dubey, A.; Surya, S. Electric Vehicle Charging on Residential Distribution Systems: Impacts and Mitigations. IEEE Access 2015, 3, 1871–1893. [Google Scholar] [CrossRef]
Figure 1.
Active Power Voltage Curve (PV curve).
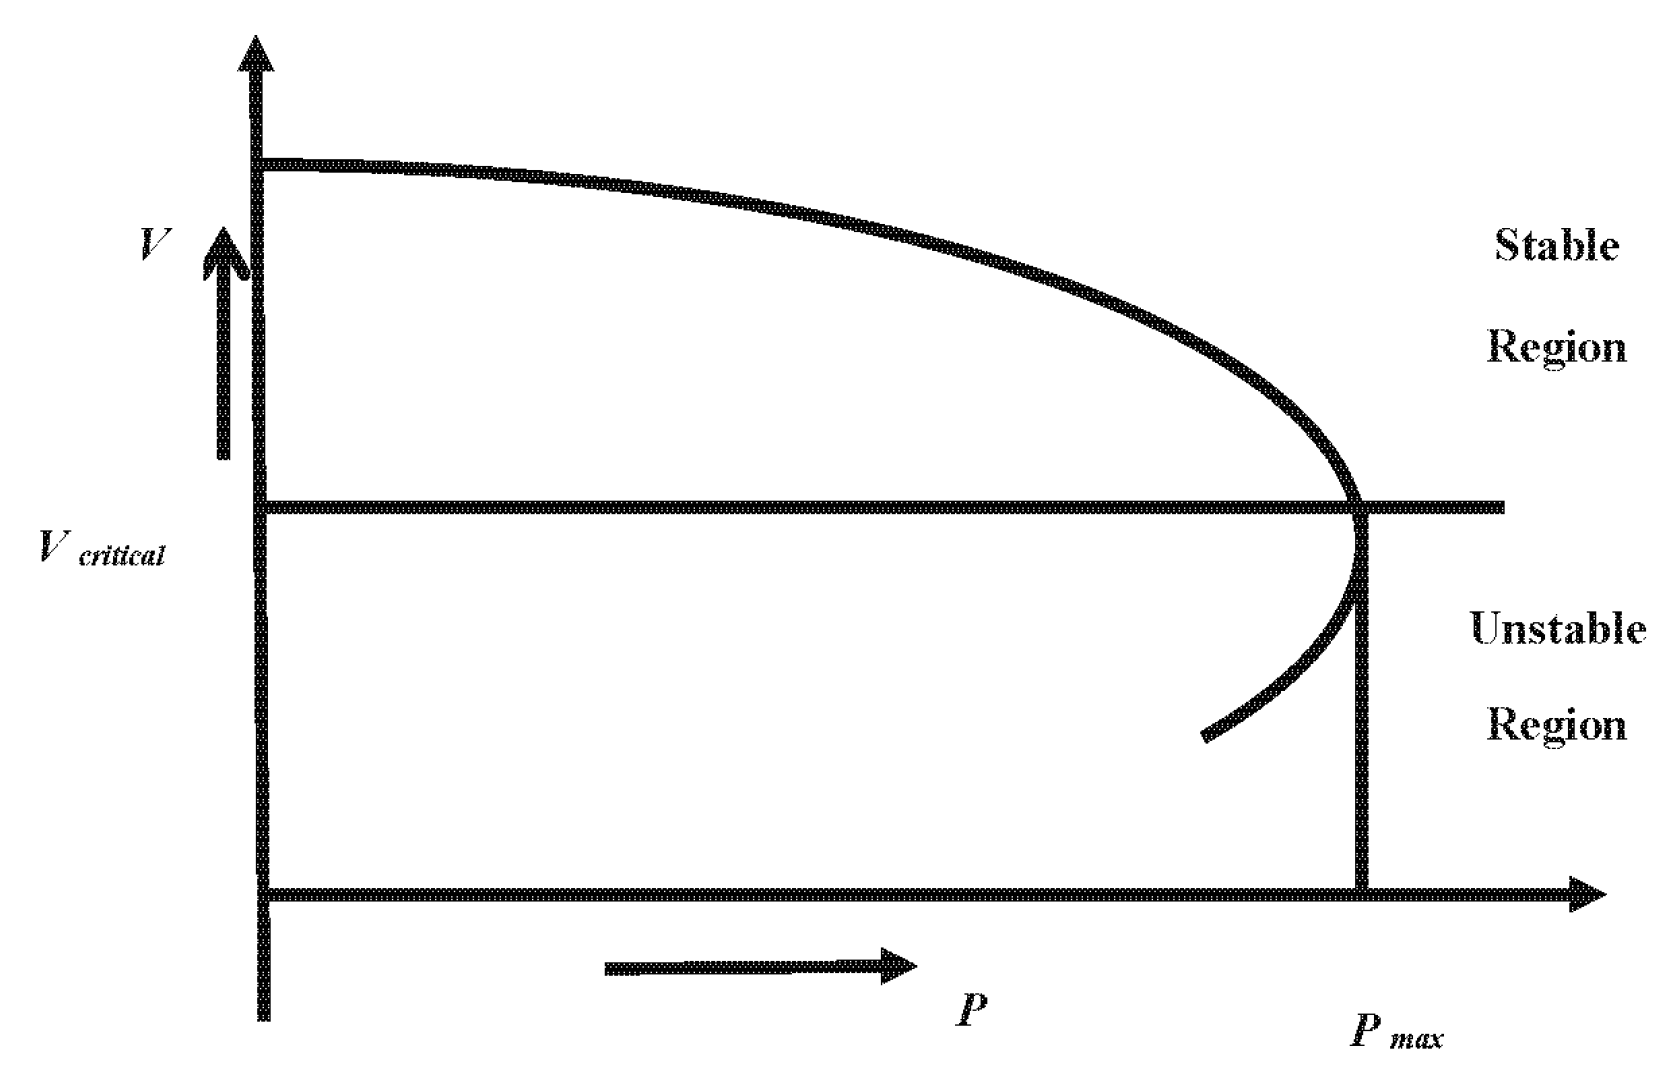
Figure 2.
Flowchart for computation of VSF.

Figure 3.
Single line diagram of a simple two bus system.

Figure 4.
Flowchart for computation of VSI.
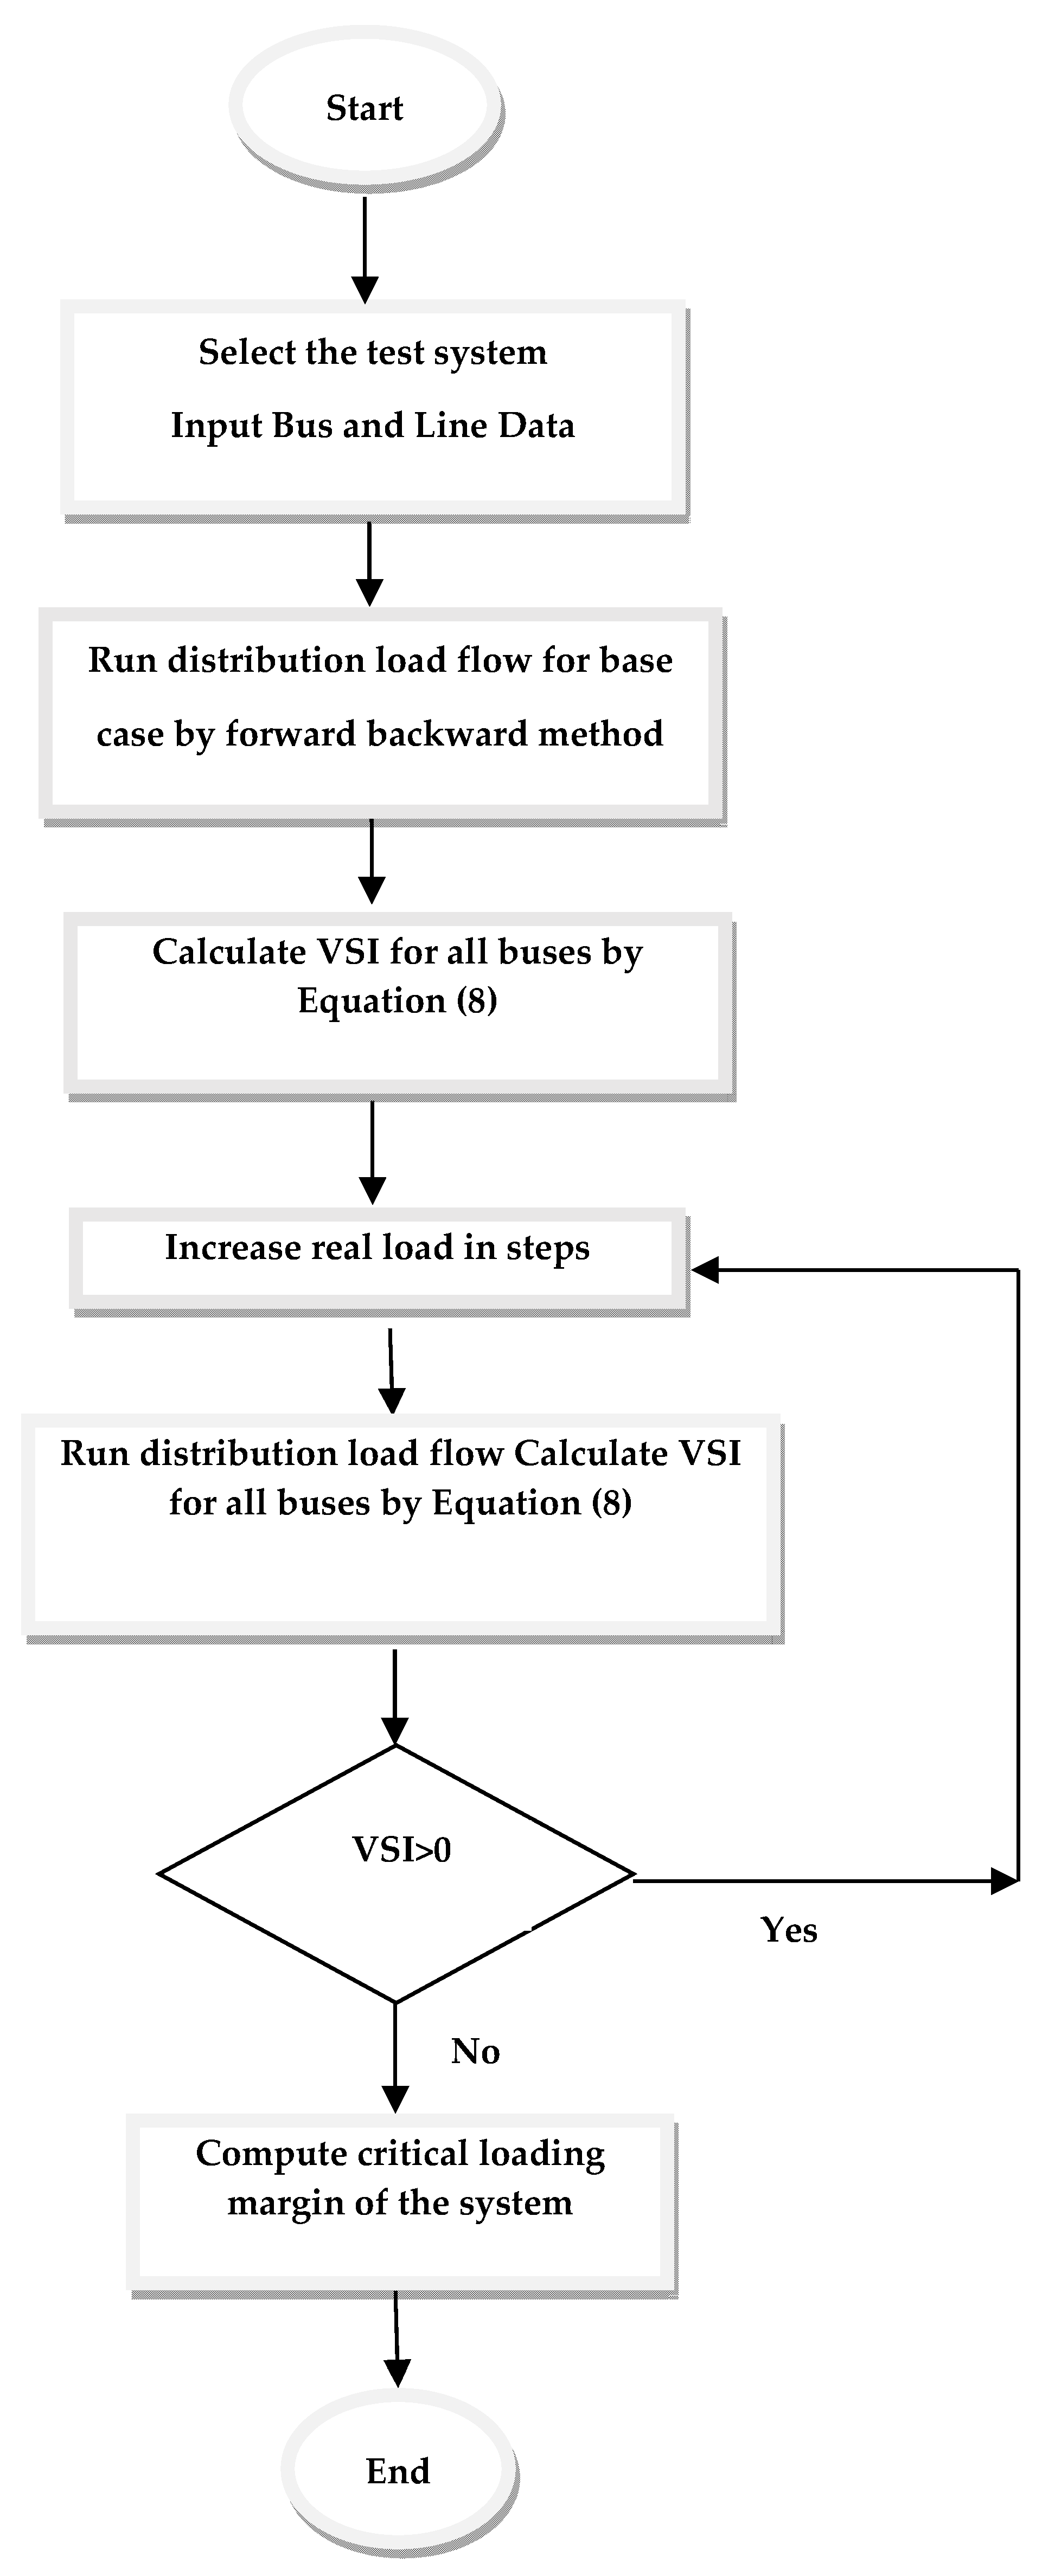
Figure 5.
Distribution Network Reliability Indices.

Figure 6.
Flowchart for computation of reliability indices.

Figure 7.
Flowchart of computational methodology for analyzing impact of EV charging station load on Distribution Network.
Figure 7.
Flowchart of computational methodology for analyzing impact of EV charging station load on Distribution Network.
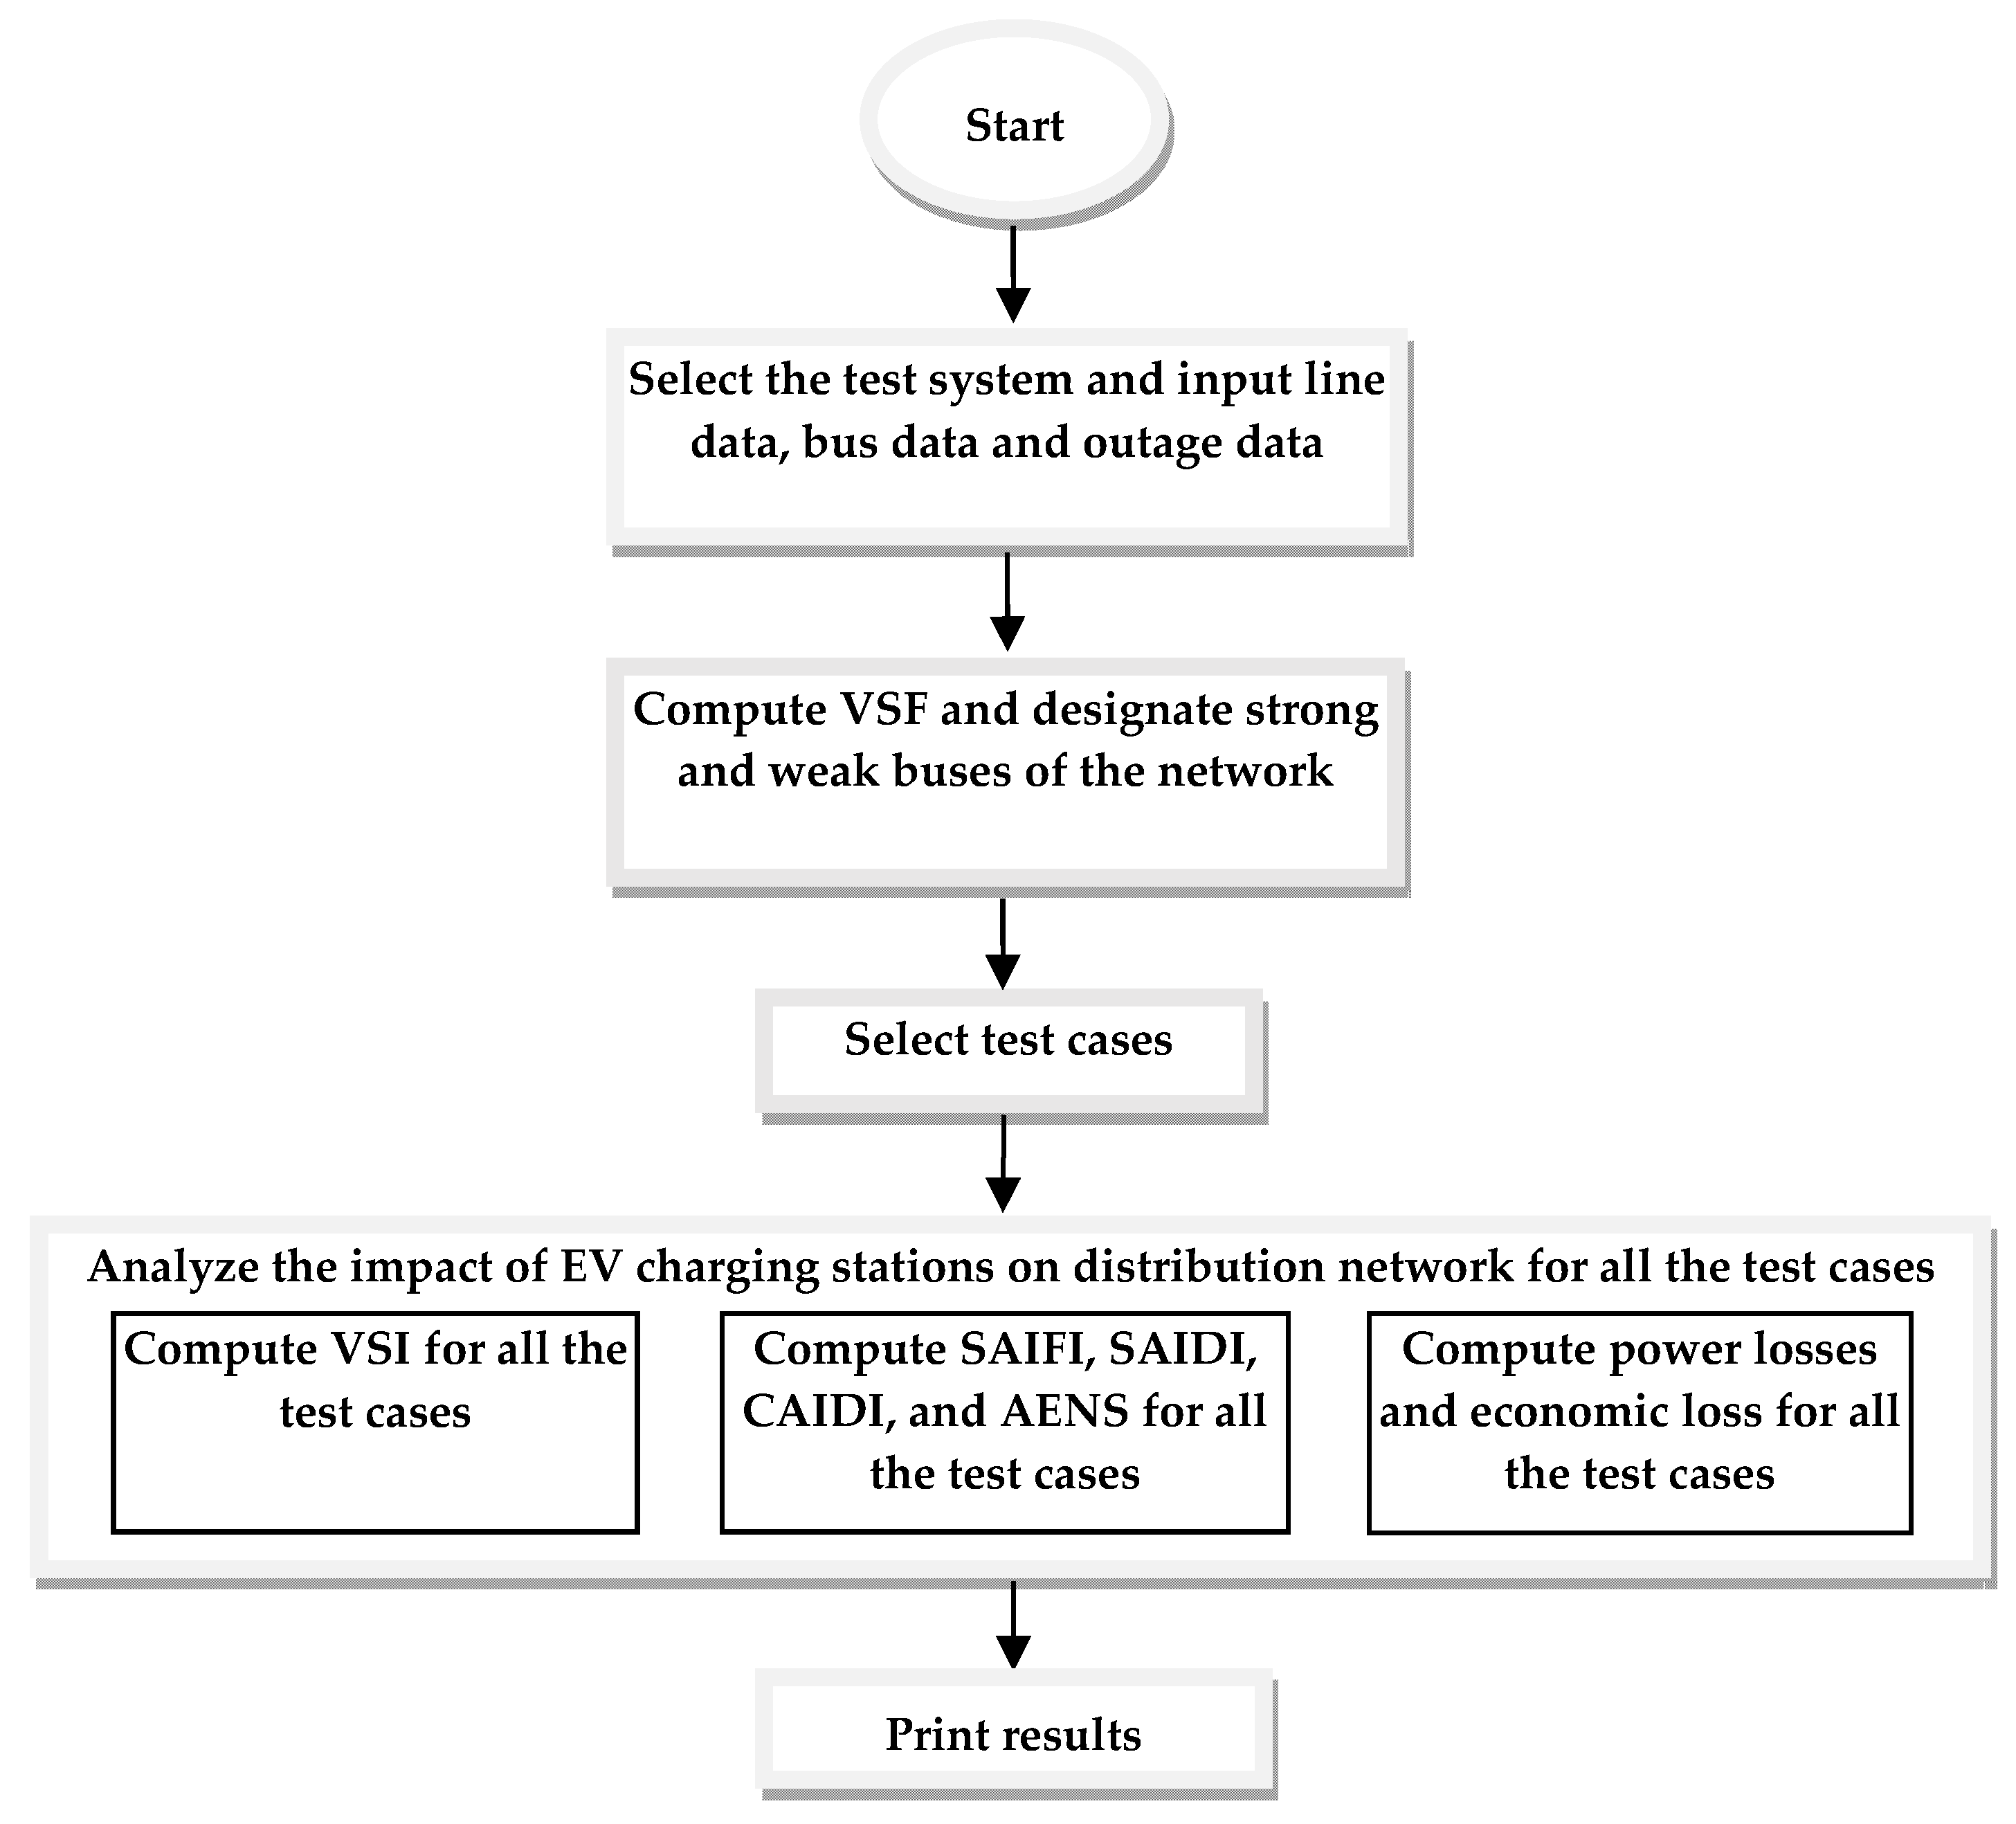
Figure 8.
Flowchart for charging station placement based on VRP index.
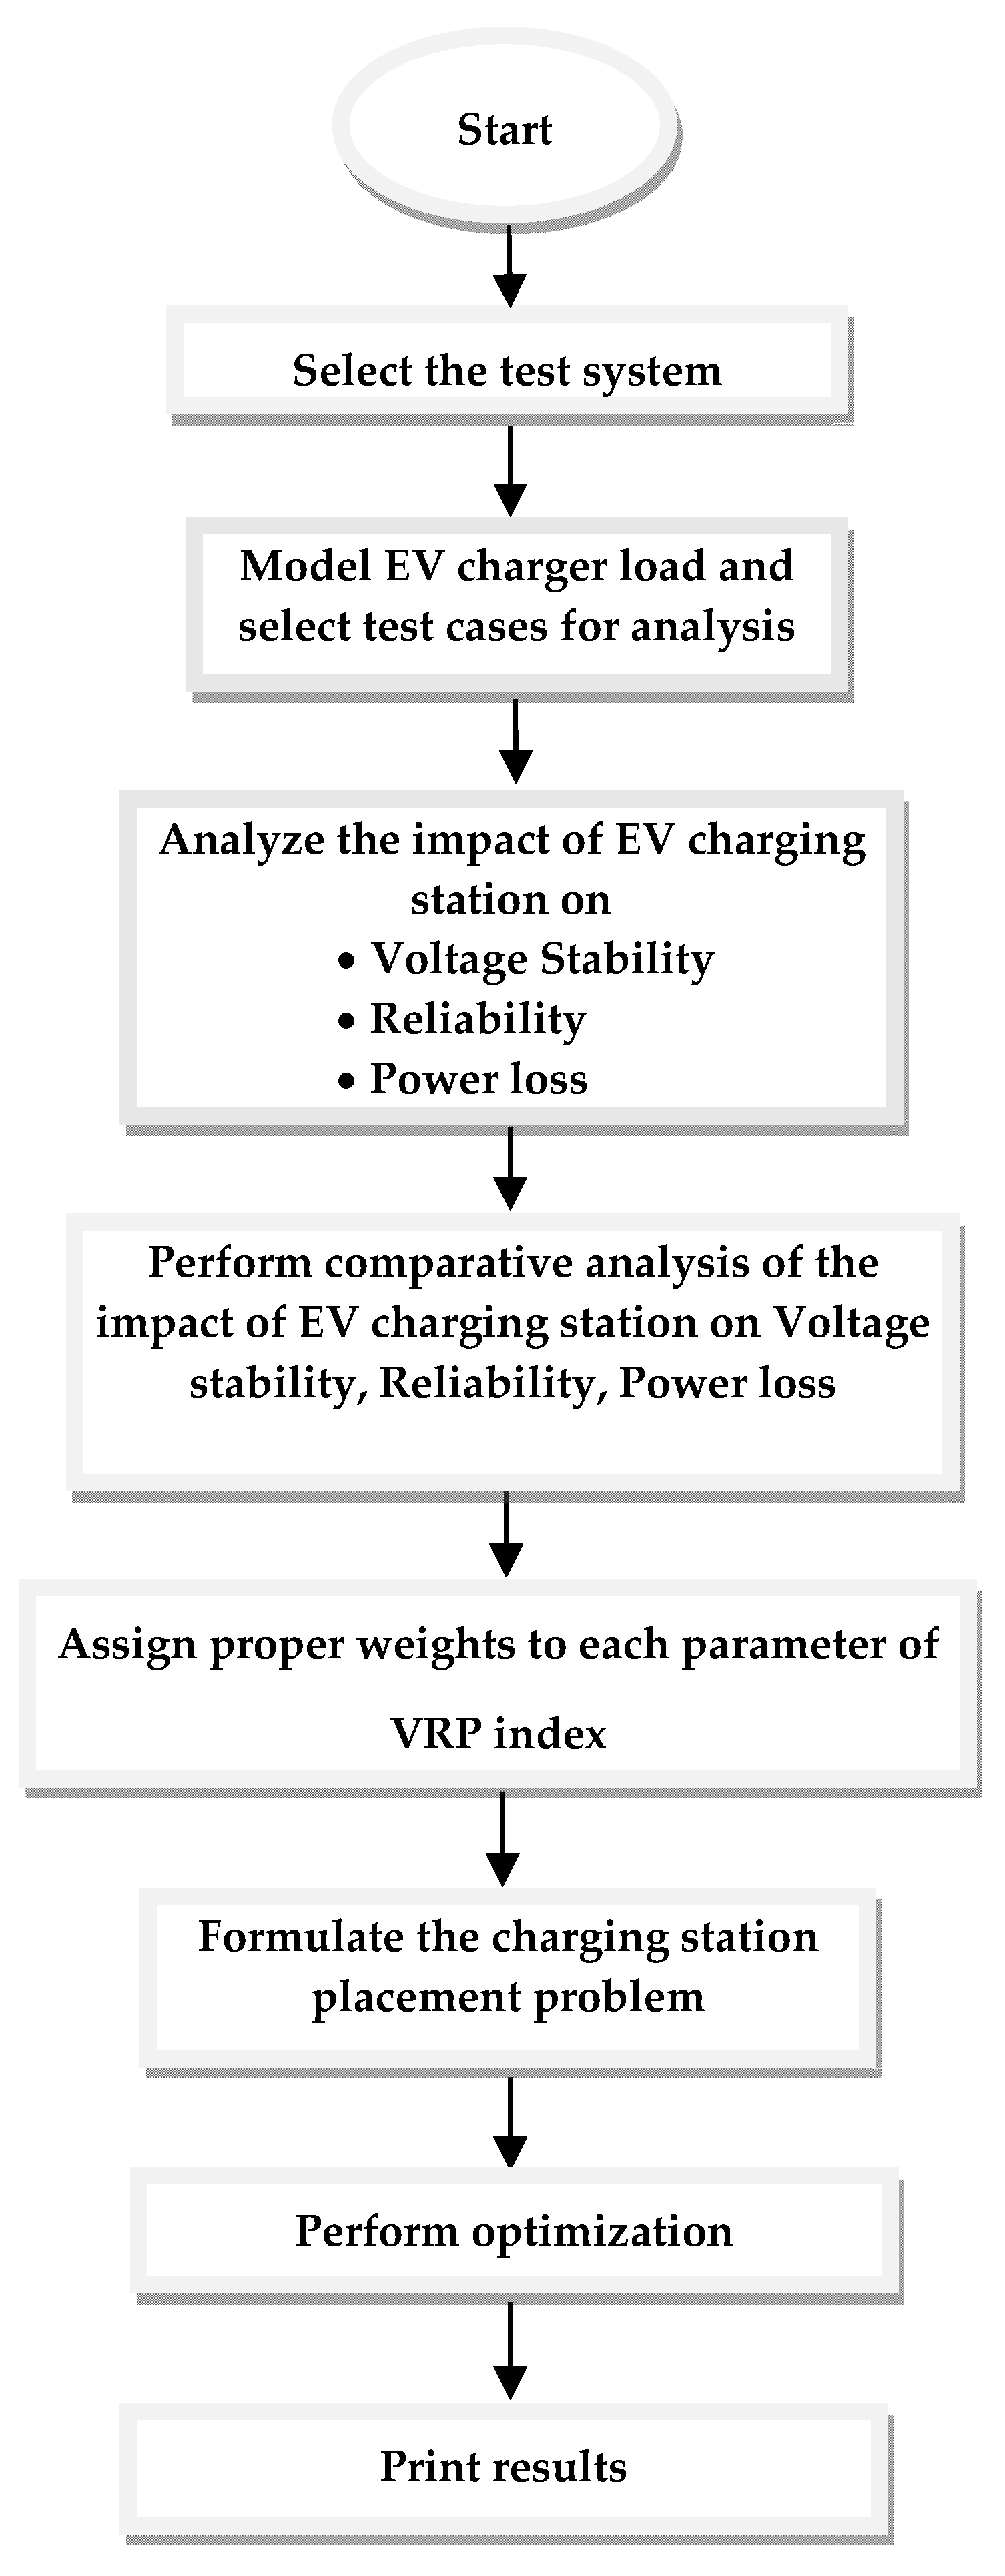
Figure 9.
IEEE 33 bus Test Network.

Figure 10.
PV curve with load increased in steps in all the buses.

Figure 11.
Comparison between voltage of base case and critical loading case for all buses in per unit.
Figure 11.
Comparison between voltage of base case and critical loading case for all buses in per unit.

Figure 12.
Comparative analysis of placement of charging station on VSI, power loss and reliability indices for Case 4.
Figure 12.
Comparative analysis of placement of charging station on VSI, power loss and reliability indices for Case 4.

Figure 13.
Comparative analysis of placement of charging station on VSI, power loss and reliability indices for Case 7.
Figure 13.
Comparative analysis of placement of charging station on VSI, power loss and reliability indices for Case 7.
| Index | Definition | Formula | Physical Significance |
|---|---|---|---|
| SAIFI | Number of times a system customer experiences interruption during a particular time period | SAIFI illustrates the condition of the system in terms of interruption | |
| SAIDI | Average interruption duration per customer served | SAIDI illustrates the condition of the system in terms of duration of interruption | |
| CAIDI | Average interruption duration time for those customers interrupted during a year | CAIDI gives the average outage duration that any given customer would experience. | |
| ENS | ENS gives the total energy not supplied by the system. | ENS is an indicator of energy deficiency of the system | |
| AENS | AENS is regarded as the average system load curtailment index | AENS is the index giving an idea of how much energy is not served during a particular time period. |
Table 2.
VSF at different loading factor.
| Bus No. | VSF at Loading Factor 2 | VSF at Loading Factor 3 | VSF at Loading Factor 4 |
|---|---|---|---|
| 2 | 0.0034 | 0.0074 | 0.0129 |
| 3 | 0.0196 | 0.0431 | 0.0764 |
| 4 | 0.0284 | 0.0631 | 0.1134 |
| 5 | 0.0372 | 0.0831 | 0.1509 |
| 6 | 0.0593 | 0.1335 | 0.2461 |
| 7 | 0.0636 | 0.1436 | 0.2662 |
| 8 | 0.0803 | 0.1826 | 0.3452 |
| 9 | 0.0882 | 0.2015 | 0.3857 |
| 10 | 0.0956 | 0.2192 | 0.4250 |
| 11 | 0.0967 | 0.2218 | 0.4311 |
| 12 | 0.0986 | 0.2265 | 0.4420 |
| 13 | 0.1064 | 0.2458 | 0.4877 |
| 14 | 0.1163 | 0.2707 | 0.5533 |
| 15 | 0.1156 | 0.2687 | 0.5477 |
| 16 | 0.1129 | 0.2621 | 0.5297 |
| 17 | 0.1112 | 0.2576 | 0.5179 |
| 18 | 0.1093 | 0.2530 | 0.5060 |
| 19 | 0.0039 | 0.0085 | 0.0146 |
| 20 | 0.0076 | 0.0158 | 0.0257 |
| 21 | 0.0083 | 0.0173 | 0.0279 |
| 22 | 0.0089 | 0.0186 | 0.0299 |
| 23 | 0.0234 | 0.0510 | 0.0890 |
| 24 | 0.0305 | 0.0659 | 0.1126 |
| 25 | 0.0341 | 0.0733 | 0.1245 |
| 26 | 0.0617 | 0.1389 | 0.2563 |
| 27 | 0.0647 | 0.1460 | 0.2701 |
| 28 | 0.0786 | 0.1780 | 0.3324 |
| 29 | 0.0886 | 0.2015 | 0.3796 |
| 30 | 0.0930 | 0.2118 | 0.4011 |
| 31 | 0.0981 | 0.2241 | 0.4273 |
| 32 | 0.0993 | 0.2268 | 0.4332 |
| 33 | 0.0996 | 0.2277 | 0.4351 |
Table 3.
Different cases considered for analyzing the impact of placement of charging station.
| Case | Description | Increase in Load (kW) |
|---|---|---|
| 2 | Fast Charging station is placed at bus 2 | 1500 |
| 3 | Fast charging station is placed at bus 2 | 3000 |
| 4 | Fast Charging station is placed at bus 2 | 7500 |
| 5 | Fast Charging station is placed at bus 2 and bus 19 | 3000 (1500 each) |
| 6 | Fast Charging station is placed at bus 14 | 1500 |
| 7 | Fast Charging station is placed at bus 14 and bus 15 | 3000 (1500 each) |
Table 4.
Impact of EV charging station load on VSI.
| Bus No. | VSI for Base Case | VSI for Case 2 | VSI for Case 3 | VSI for Case 4 | VSI for Case 5 | VSI for Case 6 | VSI for Case 7 |
|---|---|---|---|---|---|---|---|
| 2 | 0.9998 | 0.9981 | 0.9981 | 0.9908 | 0.9981 | 0.9998 | 0.9997 |
| 3 | 0.9868 | 0.9834 | 0.9834 | 0.9696 | 0.9799 | 0.9815 | 0.9743 |
| 4 | 0.9327 | 0.9294 | 0.9294 | 0.9161 | 0.9261 | 0.9054 | 0.8709 |
| 5 | 0.9051 | 0.9018 | 0.9018 | 0.8887 | 0.8985 | 0.8622 | 0.8090 |
| 6 | 0.8766 | 0.8734 | 0.8734 | 0.8604 | 0.8701 | 0.8171 | 0.7438 |
| 7 | 0.8126 | 0.8095 | 0.8095 | 0.7971 | 0.8064 | 0.7248 | 0.6209 |
| 8 | 0.7961 | 0.7930 | 0.7930 | 0.7807 | 0.7899 | 0.6984 | 0.5788 |
| 9 | 0.7558 | 0.7528 | 0.7528 | 0.7408 | 0.7498 | 0.6052 | 0.4403 |
| 10 | 0.7355 | 0.7326 | 0.7326 | 0.7208 | 0.7296 | 0.5555 | 0.3687 |
| 11 | 0.7180 | 0.7151 | 0.7151 | 0.7034 | 0.7121 | 0.5114 | 0.3092 |
| 12 | 0.7151 | 0.7122 | 0.7122 | 0.7005 | 0.7093 | 0.5034 | 0.2984 |
| 13 | 0.7092 | 0.7063 | 0.7063 | 0.6947 | 0.7034 | 0.4871 | 0.2745 |
| 14 | 0.6905 | 0.6877 | 0.6877 | 0.6762 | 0.6848 | 0.4290 | 0.2073 |
| 15 | 0.6845 | 0.6816 | 0.6816 | 0.6702 | 0.6788 | 0.4180 | 0.1860 |
| 16 | 0.6800 | 0.6772 | 0.6772 | 0.6658 | 0.6744 | 0.4146 | 0.1792 |
| 17 | 0.6753 | 0.6725 | 0.6725 | 0.6612 | 0.6697 | 0.4109 | 0.1768 |
| 18 | 0.6695 | 0.6667 | 0.6667 | 0.6554 | 0.6639 | 0.4064 | 0.1739 |
| 19 | 0.9879 | 0.9846 | 0.9846 | 0.9708 | 0.9780 | 0.9834 | 0.9777 |
| 20 | 0.9837 | 0.9804 | 0.9804 | 0.9667 | 0.9709 | 0.9792 | 0.9735 |
| 21 | 0.9713 | 0.9680 | 0.9680 | 0.9544 | 0.9586 | 0.9669 | 0.9611 |
| 22 | 0.9680 | 0.9647 | 0.9647 | 0.9511 | 0.9553 | 0.9636 | 0.9579 |
| 23 | 0.9329 | 0.9296 | 0.9296 | 0.9163 | 0.9262 | 0.9059 | 0.8720 |
| 24 | 0.9138 | 0.9105 | 0.9105 | 0.8973 | 0.9072 | 0.8871 | 0.8535 |
| 25 | 0.8892 | 0.8859 | 0.8859 | 0.8729 | 0.8827 | 0.8628 | 0.8297 |
| 26 | 0.8136 | 0.8105 | 0.8105 | 0.7980 | 0.8073 | 0.7258 | 0.6220 |
| 27 | 0.8069 | 0.8038 | 0.8038 | 0.7914 | 0.8007 | 0.7195 | 0.6162 |
| 28 | 0.7972 | 0.7941 | 0.7941 | 0.7818 | 0.7910 | 0.7103 | 0.6077 |
| 29 | 0.7589 | 0.7559 | 0.7559 | 0.7439 | 0.7529 | 0.6743 | 0.5744 |
| 30 | 0.7316 | 0.7286 | 0.7286 | 0.7168 | 0.7257 | 0.6485 | 0.5506 |
| 31 | 0.7208 | 0.7179 | 0.7179 | 0.7062 | 0.7150 | 0.6384 | 0.5413 |
| 32 | 0.7091 | 0.7062 | 0.7062 | 0.6946 | 0.7033 | 0.6274 | 0.5312 |
| 33 | 0.7069 | 0.7040 | 0.7040 | 0.6924 | 0.7011 | 0.6253 | 0.5293 |
Table 5.
Impact of EV charging station load on voltage profile.
| Bus No. | Voltage for Base Case | Voltage for Case 2 | Voltage for Case 3 | Voltage for Case 4 | Voltage for Case 5 | Voltage for Case 6 | Voltage for Case 7 |
|---|---|---|---|---|---|---|---|
| 2 | 0.9970 | 0.9959 | 0.9947 | 0.9913 | 0.9948 | 0.9954 | 0.9931 |
| 3 | 0.9829 | 0.9818 | 0.9806 | 0.9771 | 0.9807 | 0.9724 | 0.9580 |
| 4 | 0.9754 | 0.9743 | 0.9731 | 0.9696 | 0.9732 | 0.9584 | 0.9350 |
| 5 | 0.9680 | 0.9669 | 0.9657 | 0.9621 | 0.9658 | 0.9442 | 0.9114 |
| 6 | 0.9496 | 0.9484 | 0.9472 | 0.9436 | 0.9473 | 0.9084 | 0.8528 |
| 7 | 0.9461 | 0.9449 | 0.9437 | 0.9401 | 0.9438 | 0.8969 | 0.8322 |
| 8 | 0.9325 | 0.9313 | 0.9300 | 0.9264 | 0.9301 | 0.8501 | 0.7407 |
| 9 | 0.9262 | 0.9249 | 0.9237 | 0.9200 | 0.9238 | 0.8239 | 0.6867 |
| 10 | 0.9203 | 0.9191 | 0.9178 | 0.9141 | 0.9179 | 0.7979 | 0.6319 |
| 11 | 0.9195 | 0.9182 | 0.9170 | 0.9132 | 0.9171 | 0.7938 | 0.6228 |
| 12 | 0.9179 | 0.9167 | 0.9155 | 0.9117 | 0.9155 | 0.7863 | 0.6057 |
| 13 | 0.9118 | 0.9105 | 0.9093 | 0.9055 | 0.9094 | 0.7508 | 0.5264 |
| 14 | 0.9095 | 0.9082 | 0.9070 | 0.9032 | 0.9071 | 0.7351 | 0.4910 |
| 15 | 0.9081 | 0.9068 | 0.9056 | 0.9018 | 0.9056 | 0.7333 | 0.4752 |
| 16 | 0.9067 | 0.9054 | 0.9042 | 0.9004 | 0.9042 | 0.7316 | 0.4726 |
| 17 | 0.9047 | 0.9034 | 0.9022 | 0.8984 | 0.9022 | 0.7291 | 0.4688 |
| 18 | 0.9041 | 0.9028 | 0.9016 | 0.8978 | 0.9016 | 0.7284 | 0.4677 |
| 19 | 0.9965 | 0.9954 | 0.9942 | 0.9908 | 0.9921 | 0.9948 | 0.9926 |
| 20 | 0.9929 | 0.9918 | 0.9906 | 0.9872 | 0.9885 | 0.9912 | 0.9890 |
| 21 | 0.9922 | 0.9911 | 0.9899 | 0.9865 | 0.9878 | 0.9905 | 0.9883 |
| 22 | 0.9916 | 0.9904 | 0.9893 | 0.9858 | 0.9871 | 0.9899 | 0.9876 |
| 23 | 0.9793 | 0.9782 | 0.9770 | 0.9735 | 0.9771 | 0.9688 | 0.9543 |
| 24 | 0.9727 | 0.9715 | 0.9703 | 0.9668 | 0.9704 | 0.9620 | 0.9475 |
| 25 | 0.9693 | 0.9682 | 0.9670 | 0.9635 | 0.9671 | 0.9587 | 0.9441 |
| 26 | 0.9477 | 0.9465 | 0.9453 | 0.9417 | 0.9454 | 0.9064 | 0.8506 |
| 27 | 0.9451 | 0.9439 | 0.9427 | 0.9391 | 0.9428 | 0.9037 | 0.8478 |
| 28 | 0.9337 | 0.9325 | 0.9313 | 0.9276 | 0.9314 | 0.8917 | 0.8350 |
| 29 | 0.9255 | 0.9243 | 0.9231 | 0.9193 | 0.9231 | 0.8831 | 0.8258 |
| 30 | 0.9220 | 0.9207 | 0.9195 | 0.9158 | 0.9196 | 0.8794 | 0.8218 |
| 31 | 0.9178 | 0.9166 | 0.9153 | 0.9116 | 0.9154 | 0.8750 | 0.8172 |
| 32 | 0.9169 | 0.9156 | 0.9144 | 0.9107 | 0.9145 | 0.8741 | 0.8161 |
| 33 | 0.9166 | 0.9154 | 0.9141 | 0.9104 | 0.9142 | 0.8738 | 0.8158 |
Table 6.
Impact of EV charging station load on different reliability indices.
| Case | SAIFI (Interruption/Year) | SAIDI (h/Year) | CAIDI (h/Interruption) | AENS (kWh/Year) |
|---|---|---|---|---|
| Base case | 0.0982 | 0.5048 | 5.1385 | 1.9369 |
| 2 | 0.1195 | 0.6321 | 5.2915 | 10.2612 |
| 3 | 0.1407 | 0.7594 | 5.3984 | 33.27 |
| 4 | 0.2043 | 1.1413 | 5.5858 | 314.5049 |
| 5 | 0.1361 | 0.7155 | 5.2558 | 16.3547 |
| 6 | 0.1235 | 0.7578 | 6.1341 | 15.1578 |
| 7 | 0.1366 | 0.8448 | 6.1850 | 23.9717 |
Table 7.
Equivalent events producing the SAIFI similar to addition of charging station.
| Case | Number of EVs That Can Be Charged | SAIFI | Increase in Load Producing Same SAIFI (kW) | Increase in Number of Consumers Producing Same SAIFI |
|---|---|---|---|---|
| 2 | 30 | 0.1195 | 407.69 | 106 |
| 3 | 60 | 0.1407 | 590.095 | 154 |
| 4 | 150 | 0.2043 | 976.45 | 254 |
Table 8.
Impact of EV charging station load on power loss.
| Case | Power Loss (pu) |
|---|---|
| Base case | 0.0021 |
| 2 | 0.0022 |
| 3 | 0.0024 |
| 4 | 0.003 |
| 5 | 0.0023 |
| 6 | 0.0090 |
| 7 | 0.0247 |
Table 9.
Impact of EV charging station load on economic loss.
| Case | Penalty for Voltage Deviation ($) | Penalty for Energy Not Supplied ($) |
|---|---|---|
| 2 | 0 | 1.84 |
| 3 | 0 | 5.9886 |
| 4 | 0.4892 | 56.610 |
| 5 | 0 | 2.9438 |
| 6 | 70,289 | 2.728 |
| 7 | 1,397,700 | 4.3149 |
Table 10.
Comparative Analysis of different parameters after placement of charging stations.
| Case | Change in | ||||
|---|---|---|---|---|---|
| VSI | Power Loss | SAIFI | SAIDI | CAIDI | |
| 2 | 0.00173 | 0476 | 0.2169 | 0.2521 | 0.0297 |
| 3 | 0.00362 | 0.1428 | 0.4327 | 0.5043 | 0.0505 |
| 4 | 0.00912 | 0.42857 | 1.08044 | 1.26 | 0.08762 |
| 5 | 0.00347 | 0.0952 | 0.3859 | 0.417 | 0.0228 |
| 6 | 0.1950 | 2.1904 | 0.417 | 0.5011 | 0.1937 |
| 7 | 0.3299 | 8.9523 | 0.0228 | 0.67022 | 0.2036 |
Table 11.
Input Parameters.
| Parameter | Value |
|---|---|
| 0.1 | |
| 0.7 | |
| 0.2 | |
| 0.2 | |
| 0.4 | |
| 0.1 | |
| nfastCS | 2 |
| nslowCS | 3 |
Table 12.
Optimal Placement of Charging Stations based on VRP index.
| Bus No. | Number of Fast Charging Stations | Number of Slow Charging Stations |
|---|---|---|
| 19 | 2 | 3 |
| 20 | 1 | 2 |
| 2 | 2 | 1 |
© 2018 by the authors. Licensee MDPI, Basel, Switzerland. This article is an open access article distributed under the terms and conditions of the Creative Commons Attribution (CC BY) license (http://creativecommons.org/licenses/by/4.0/).
Share and Cite
MDPI and ACS Style
Deb, S.; Tammi, K.; Kalita, K.; Mahanta, P. Impact of Electric Vehicle Charging Station Load on Distribution Network. Energies 2018, 11, 178. https://doi.org/10.3390/en11010178
AMA Style
Deb S, Tammi K, Kalita K, Mahanta P. Impact of Electric Vehicle Charging Station Load on Distribution Network. Energies. 2018; 11(1):178. https://doi.org/10.3390/en11010178
Chicago/Turabian StyleDeb, Sanchari, Kari Tammi, Karuna Kalita, and Pinakeshwar Mahanta. 2018. "Impact of Electric Vehicle Charging Station Load on Distribution Network" Energies 11, no. 1: 178. https://doi.org/10.3390/en11010178
Note that from the first issue of 2016, this journal uses article numbers instead of page numbers. See further details here.