Industrial Consumers’ Smart Grid Adoption: Influential Factors and Participation Phases


Center for Energy Informatics, Mærsk Mc-Kinney Møller Institute, University of Southern Denmark, Campusvej 55, 5230 Odense M, Denmark
*
Author to whom correspondence should be addressed.
Energies 2018, 11(1), 182; https://doi.org/10.3390/en11010182
Submission received: 11 December 2017
/
Revised: 30 December 2017
/
Accepted: 9 January 2018
/
Published: 12 January 2018
(This article belongs to the Special Issue Industrial Energy Efficiency 2018)
Abstract
:The participation of industrial consumers in smart grid transition is important due to their consumption footprint, heavy energy use and complexity in the implementation of smart energy technologies. Active involvement of industrial consumers in the development of smart grid solutions is important to ensure the energy system transformation. Despite the importance of industrial consumers has been identified, the empirical studies on the smart grid still mainly address residential and commercial consumers. Therefore, based on four case studies with two industrial consumers, one energy consulting company and one electricity retailer, this paper investigates the factors that influence industrial consumers’ acceptance of smart grid solutions, and how the influential factors are relevant to the smart grid adoption phases. Eleven influential factors are identified that impact on four stages for industrial consumers’ adoption of smart grid solutions (inscription, translation, framing, and stabilization stages). The eleven influential factors are: awareness of multiple contexts, shared support, return-of-investment, ease of use, flexibility and dynamic pricing, liberalization and energy tariff structure, customer focus, solution integration, process improvement, service quality, and company’s green image.
1. Introduction
The existing methods of electricity generation have greatly contributed to greenhouse gas emissions and climate change [1,2]. The emergent need for transformation of the electricity industry is recognized worldwide [1]. In order to insure the transformation in the energy sector of member states, the European Union in 2012 has adopted the Energy Efficiency Directive [3]. The directive primary goal is to ensure the reduction in energy consumption of the member states by 20% by the year 2020 [3].
The literature indicates that the smart grid concept has been pursued to establish a foundation for the future energy system [2,4]. The smart grid has been recognized as one of the most effective and economic solutions on the path to a future energy system independent from fossil energy sources [4]. Moreover, it requires innovation in the production, management and use of electricity [5].
The smart grid functionality depends on the collaboration and integration of different stakeholders, adoption of new technologies, regulations and business models [2,6,7,8]. However, active consumer participation in the smart grid is crucial for smart grid success [9,10,11,12]. The recent studies on electricity consumption emphasize the importance of consumers as energy co-providers in smart grids [13]. An active consumer involvement in electricity network refers to the concept of consumer engagement [14] and demand response management. Moreover, the existing literature indicates the importance of end-user communities for the smart grid realization [2,3,15].
Recent research regarding consumers’ adoption of smart grids reveals consumers’ positive attitude toward smart grid technologies [2,16,17,18]. Yet, there are still many issues regarding consumers’ needs that must be addressed in order to achieve full consumer participation and acceptance [17]. Meanwhile, the consumer management in smart grids is a challenge due to a high variability of consumers’ preferences, interests and supplied amount of energy to the grid [19]. Moreover, Giordano, et al. [17] emphasize that: “Consumers, their daily routines and the social context in which they operate, should be more central in the smart grid community, where the focus is still mainly on technological issues and economic incentive”. Therefore understanding consumers’ needs and behavior in smart grid is essential as it lies at the foundation of the EU energy market’s design [20].
Smart grid customers are divided by Samad and Kiliccote [2] into the following categories: (1) residential, (2) commercial (i.e., buildings and multi-building facilities), and (3) industrial. The participation of industrial consumers in smart grids is important due to their consumption footprint, heavy energy use and complexity in smart grid technology implementation [2]. Thus, an active involvement of industrial consumers in the development of smart grid solutions is important to ensure the transformation to the future energy system.
Although the importance of industrial consumers has been identified, most empirical studies on smart grids still mainly address the residential consumer sector [2,14] and few focus on industrial consumers/communities’ involvement or their contribution to the development and adoption of smart grid solutions [2,3]. Therefore, this paper tries to fill the gap and: (1) investigate the factors that influence industrial consumers’ acceptance of smart grid solutions; (2) explore how the influential factors are relevant to smart grid adoption phases. To accomplish these goals, this paper conducts a qualitative analysis of four case studies with two industry consumers, one electricity retailer and one energy consulting company.
2. Research Background
The smart grid concept is built upon the intersection of technology, people and infrastructure for intelligent generation, transmission, distribution and consumption of electricity [13]. Moreover, Heiskanen [6] has emphasized that smart grid development and adoption is influenced by the technological as well as the social environment. Following this perspective, smart grids can be defined in terms of the socio-technical network with enhanced two-ways communication and active management of information and energy flows that allow controlling the practices of distributed generation, storage, consumption and flexible demand [16]. However, there are many different definitions of smart grid that emphasizes different aspects. From a functionality and components’ point of view, a smart grid can be defined as: “an electricity network that uses digital and other advanced technologies to monitor and manage the transport of electricity from all generation sources to meet the varying electricity demands of end-users. Smart grids co-ordinate the needs and capabilities of all generators, grid operators, end-users and electricity market stakeholders to operate all parts of the system as efficiently as possible, minimizing costs and environmental impacts while maximizing system reliability, resilience and stability” [21].
This definition emphases the socio-technical nature of the smart grid and allows one to analyze the role and application of information and communications technology (ICT) in smart grids [5]. ICT is seen as a cornerstone of smart grids [5]. Meanwhile, the challenges of smart grid deployment and adoption are highly related to the innovative ICT application [5,21,22].
The integration of ICT in a smart grid allows one to increase the efficiency in electricity generation regarding production, transmission and use and hence reduce greenhouse gas (GHG) emissions [23]. The term information systems refers not only to the ICT that is used by an organization, but also to the human interaction surrounding technology [24]. According to Dedrick [23], research on green information systems focuses on environmental problem solutions. Thereby, the studies on smart grid adoption should be discussed in the information system research.
In the information system research, the concept of consumer participation has been widely explored in the study of technology adoption [25]. For instance, Cooper and Zmud [26] and Saga and Zmud [27] argue that an information technology-based innovation adoption includes three stages: (1) pre-acceptance, (2) acceptance and (3) post-acceptance [28]. The pre-acceptance stage of technology adoption refers to the increasing awareness or need for innovation because of individuals’ dissatisfaction on the current situation [26,29]. Meanwhile, the acceptance stage refers to the decision making regarding technology acceptance or rejection [26] based on technology users’ initial believes or perceptions on innovation [29]. The post-acceptance stage refers to the confirmation process of initial decisions by the technology users. Thus, the socio-technical context of smart grid can be addressed by exploring the technology adoption in the information system field with thorough investigation and evaluation of the theories and models.
2.1. Demand Response
Denmark has the highest integration of renewable energy sources (e.g., wind power) in its electricity supply system compared to other countries [30]. Approximately 93% of wind generation is supplied to the distribution grid [30]. The integration of renewable energy sources in the smart grid leads to a higher grid sensibility and volatility due to intermittency and unpredictability of renewable generation [2]. With unpredictability, it extends the generation domain of the energy value chain to more active demand management and consumer involvement [2]. Moreover, activation of demand response contributes to balancing of increasing renewable energy utilization in the grid and it allows efficient use of the grid’s infrastructure [2]. The Union of the Electricity Industry [31] defines demand response as: “the changes in electric usage by end-use customers from their normal consumption patterns in response to changes in the electricity price or incentive payments designed to alter timing, level of instantaneous demand or total electricity consumption”.
The demand response can be categorized as (1) price-based and (2) incentive-based. Price-based demand response assumes that electricity consumers will alter their electricity consumption due to a price signal that is provided at a different time [31]. Meanwhile, incentive-based demand response assumes that electricity consumers can achieve rebates or billing credit if they alter their consumption due to a technical signal [31]. The role of demand response in the electric system planning and operations is visualized in Figure 1.
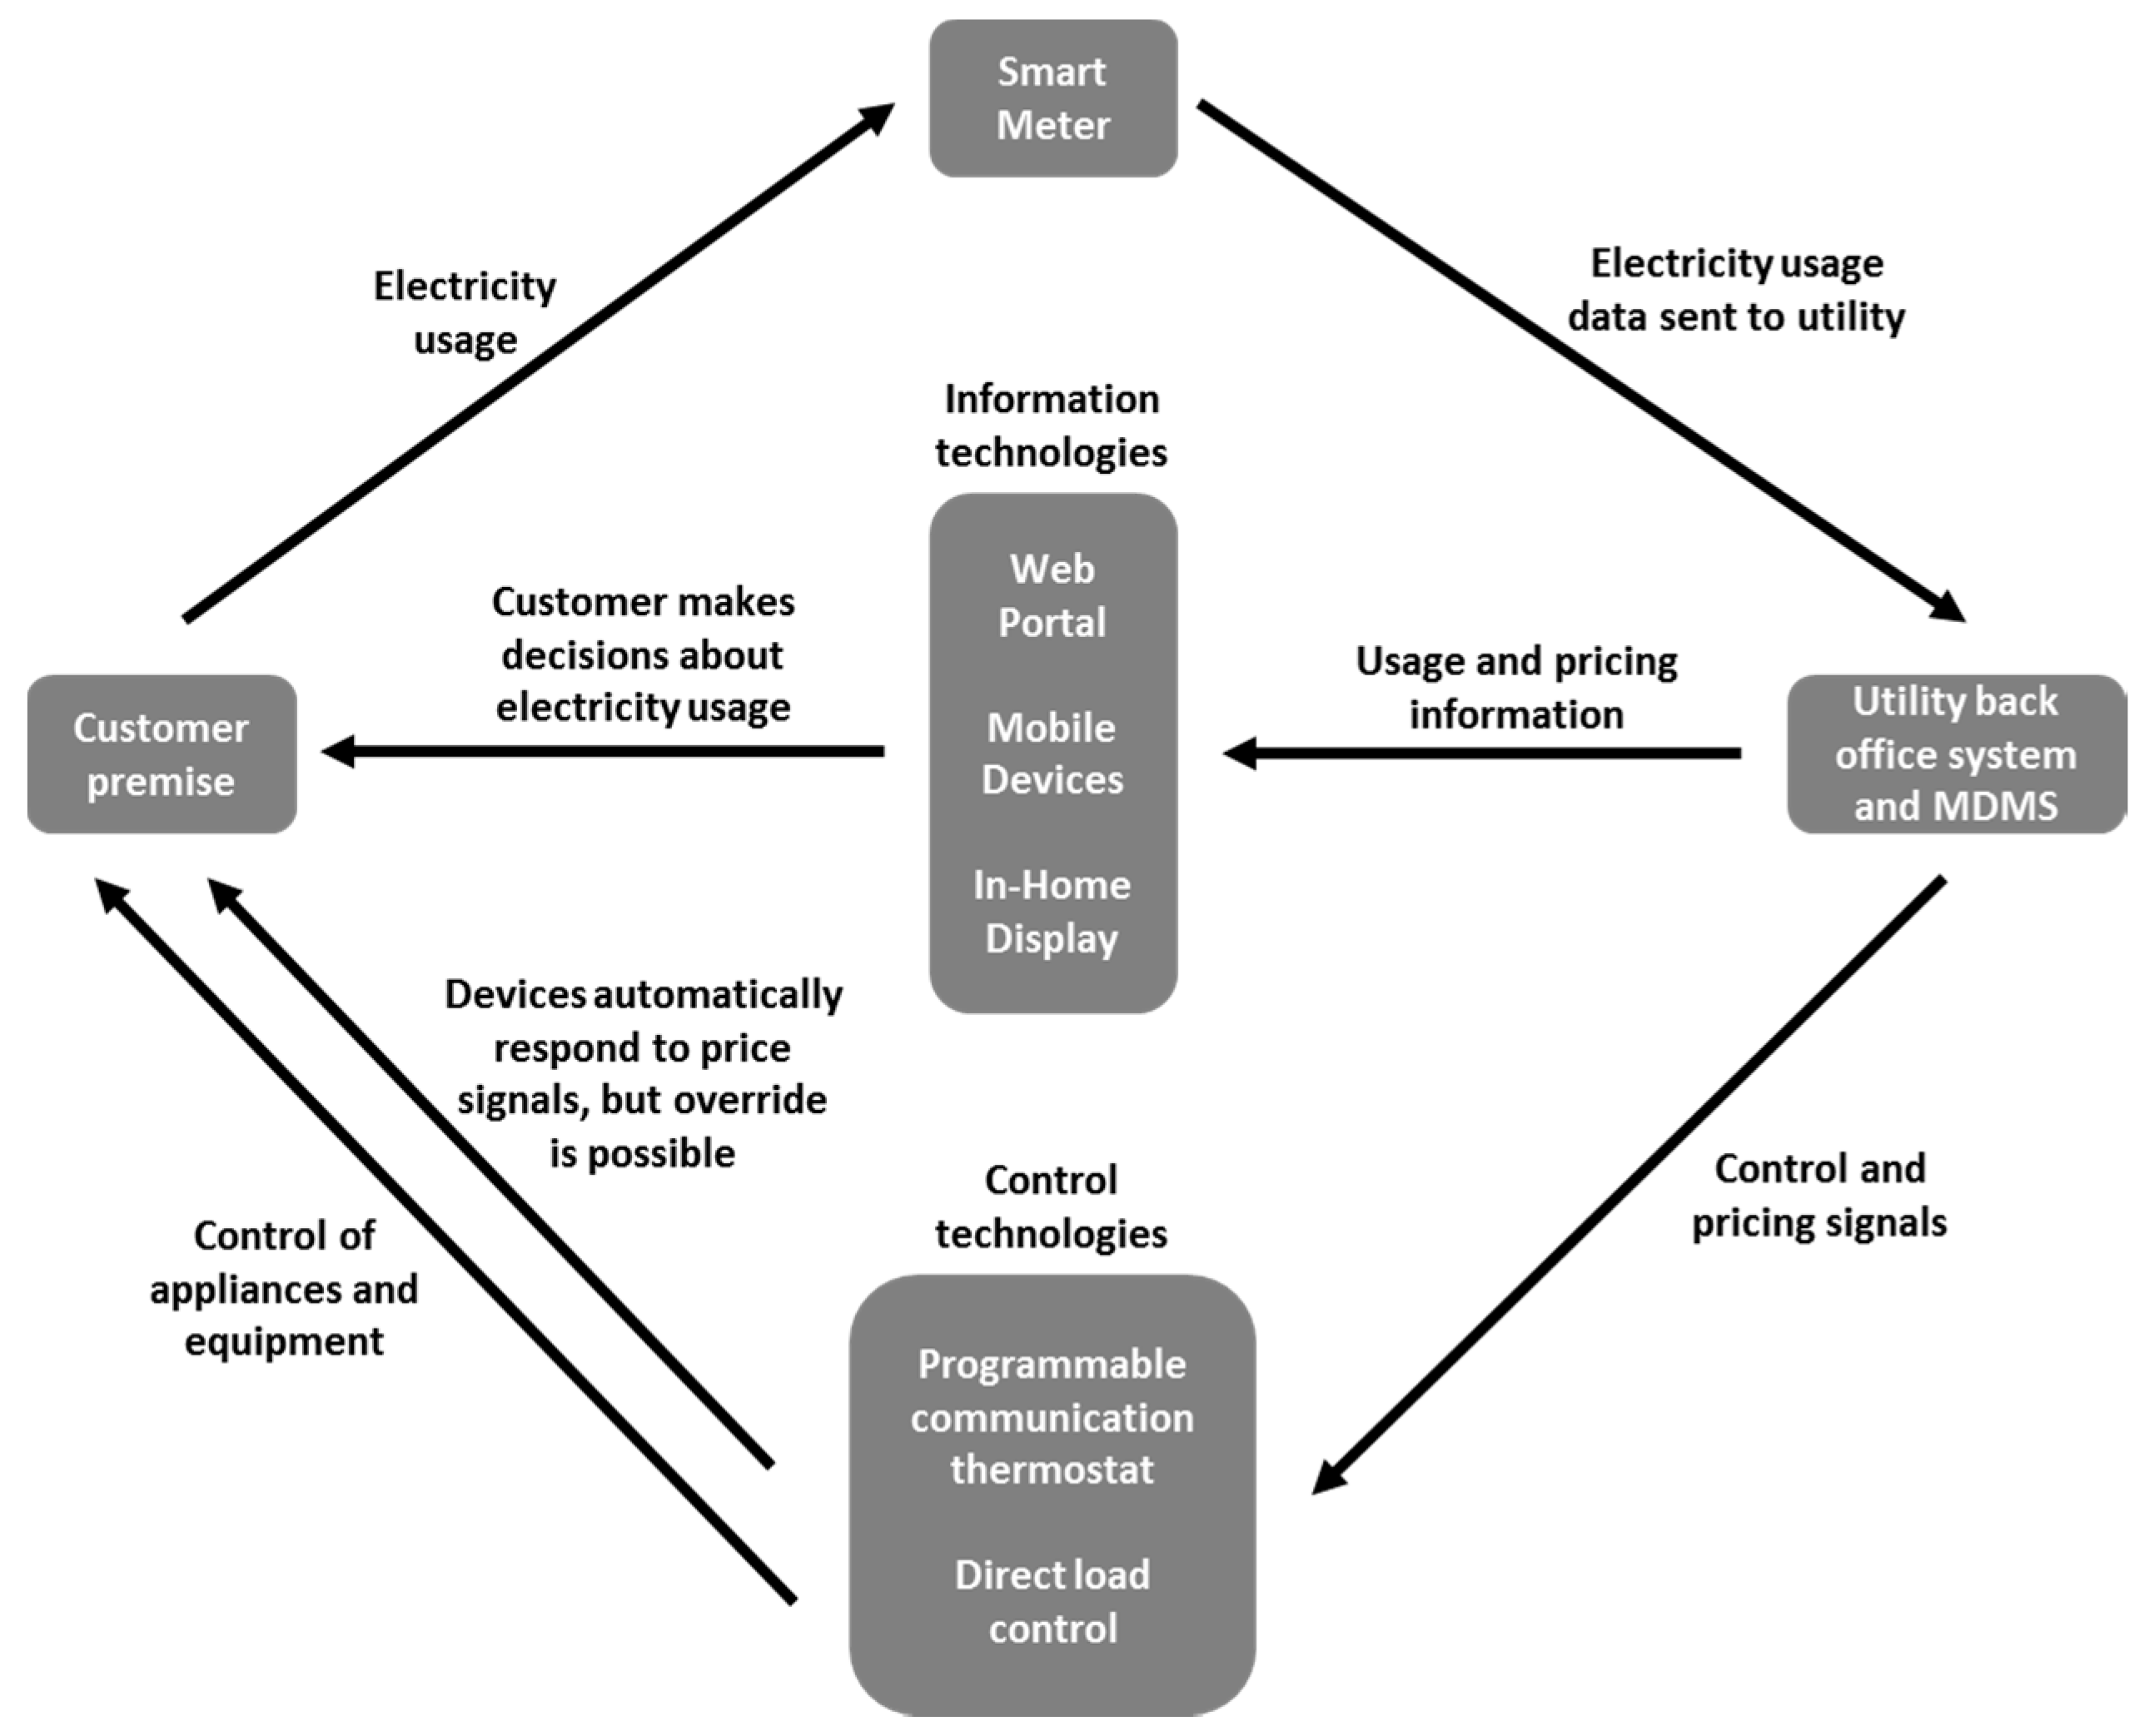
The use of price signals (variable grid tariffs and real-time electricity price) shall motivate energy consumers to participate in the demand response and to shift their electricity consumption or production (i.e., provide flexibility to the grid) in accordance to the power system need [34]. The utilization of consumers’ flexibility allows grid companies to reduce investment in the distribution grid (e.g., due to growing electricity demand) [34]. Moreover, consumers’ flexibility can be used by TSOs (transmission system operators) to balance the power system [34]. The technical activation of demand response is mainly determined by the integration of the ICT solution—AMI (advanced metering infrastructure) in the grid [35]. Figure 2 provides an overview of devices and systems (e.g., AMI) for demand response realization. However, the activation of demand response also ultimately rests on the willingness of users to change.
2.2. Industrial DR
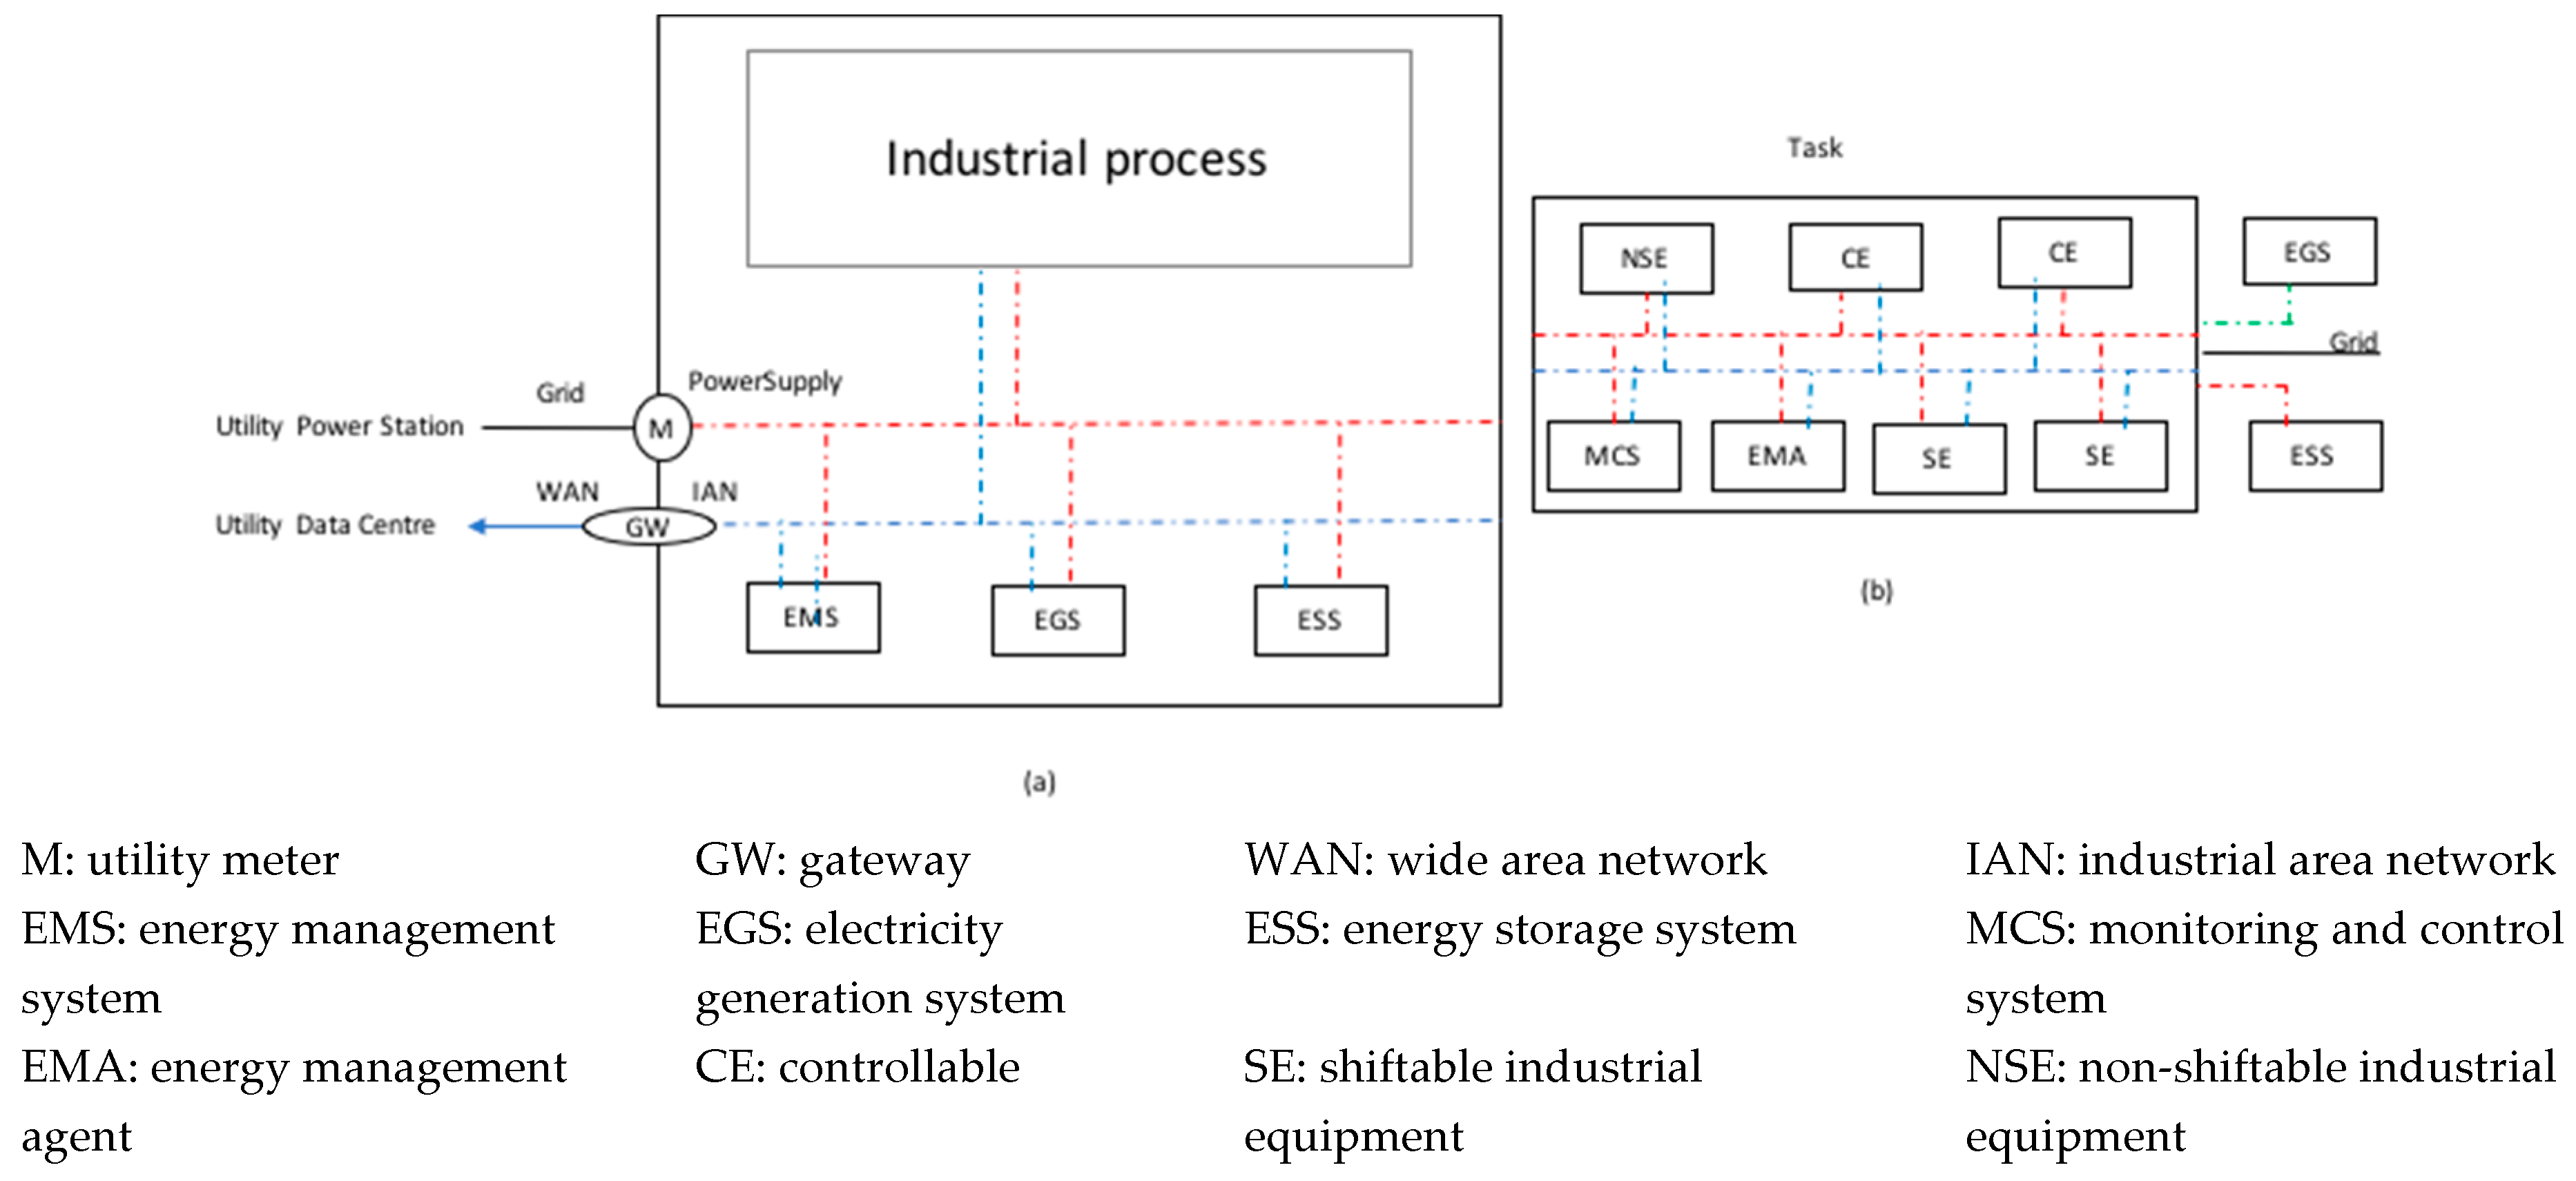
Ding and Hong [36] developed the conceptual model of demand response energy management system for industrial facilities. The model outlines the architecture and relationships between different elements of the industrial DR management system.
The boundary of the customer domain is drawn by the utility meter (M) and the gateway (GW). The utility meter function is to measure electricity consumption. The utility gateway enables the exchange of information between a wide area network (WAN) and industrial area network (IAN). The generated power by utilities is transmitted and distributed to industrial consumers’ demand side trough the grid (shown in Figure 3a). The demand side includes following components: (1) energy management system (EMS), (2) electricity generation system (EGS), that includes waste heat recovery and wind turbines, (3) energy storage system (ESS) that includes electric batteries and pumped hydro storage, (4) IAN, (5) power supply network, and (5) industrial process [36].
Figure 3b illustrates a task’s structure that includes: (1) monitoring and control system (MCS), (2) energy management agent (EMA), (3) power source switch, and (4) controllable (CE), shiftable (SE)-, and non-shiftable industrial equipment (NSE). The shiftable industrial equipment can be turned on/off to balance the electricity supply and demand. The electricity demand for non-shiftable equipment (non-scheduled) must be satisfied right away. The controllable equipment (e.g., packaging machine), is the equipment that supports processes on different levels of operations with different electricity demands. As a rule of thumb, some of the schedulable category equipment should be controllable or shiftable [36].
2.3. Consumers’ Flexibility Potential
A crucial ICT related task in the smart grid is to foster demand response [32], and it is determined by customer flexibility [37]. Consumers’ energy flexibility means “customer, or an appliance connects to the power system, changes its behavior to meet a need from the power system” [34].
Jingchao, et al. [38] argues that an energy saving demand-led user is an end user/electricity consumer with a high energy consumption, and the electricity cost of such electricity consumers occupies a significant proportion of their production costs. The energy saving demand-led users are mainly represented by: (1) high energy consumption enterprises, (2) industrial parks, (3) energy consumers within iron and steel, nonferrous metals, chemicals, cement, (4) logistics enterprises [38]. In Denmark, the manufacturing sector is the heaviest industrial energy consumer [39] and consume high energy (shown in Table 1).
The Danish Energy Agency has pointed out that energy intensive industrial consumers (e.g., consumers with a high electricity consumption) are obvious candidates for altering electricity consumption due to electricity price [41]. These industrial consumers are: (1) foundries, (2) cold stores/refrigeration companies, (3) dryers, (4) industrial furnaces, (5) greenhouses, (6) street lighting, (7) air-conditioning/ventilation, (8) electric heating, (9) large IT systems [42]. The potential flexibility (calculated in MW) that can be offered by the Danish industries to the grid is presented in Table 2.
The flexibility potentials can be accommodated by different processes in industry and agriculture (shown in Table 3). The refrigeration companies/cold stores have especially high load shift potentials with the duration of several hours [42]. There are several ways to make electricity from refrigerators/freezers more flexible. For example, cold stores can cool products to a lower temperature when electricity price is low to avoid products’ cooling when the electricity price is high [42]. It is also possible to apply different solutions for cold storage.
The demand response options toward flexibility can be categorized as: (1) peak shaving, (2) load shifting and (3) valley filling [31]. According to Wattjes, et al. [45], flexibility from a process point of view can be described in terms of: (1) flexibility speed, (2) flexibility duration, (3) flexibility of power. Generally, industrial loads include production (part of the production process) and support services (e.g., lighting) [2]. The flexibility affects the customers’ behavior by offering the monetary and social benefits [34]. Therefore, the flexibility activation also depends on consumers’ potentials to shift the loads [34,36,45].
2.4. Impact of Consumer Behavior
European Environment Agency (EEA) study [3] points out that new technology adoption is influenced by energy consumer behavior, habits and consumption practices [46]. Thus, behavioral factors (i.e., factors that affect energy consumer behavior, habits) may affect the smart grid adoption by industrial consumers and therefore they should be integrated into the smart grid transition.
Shove [47] also states that there is a dependency between behaviors and infrastructure (e.g., smart grids, heating systems). For instance, energy sector’s infrastructure impacts people’s perception of the “normal way of life” because the interaction with new energy technologies is far from straightforward [3]. Therefore, the energy sector restructure (via implementation of the wholesale model) affects electricity consumers’ behavior. Moreover, the routine consumption (e.g., electricity consumption) is to a high degree impacted by social norms (e.g., the emergence and transformation of collective conventions) and economic factors [47].
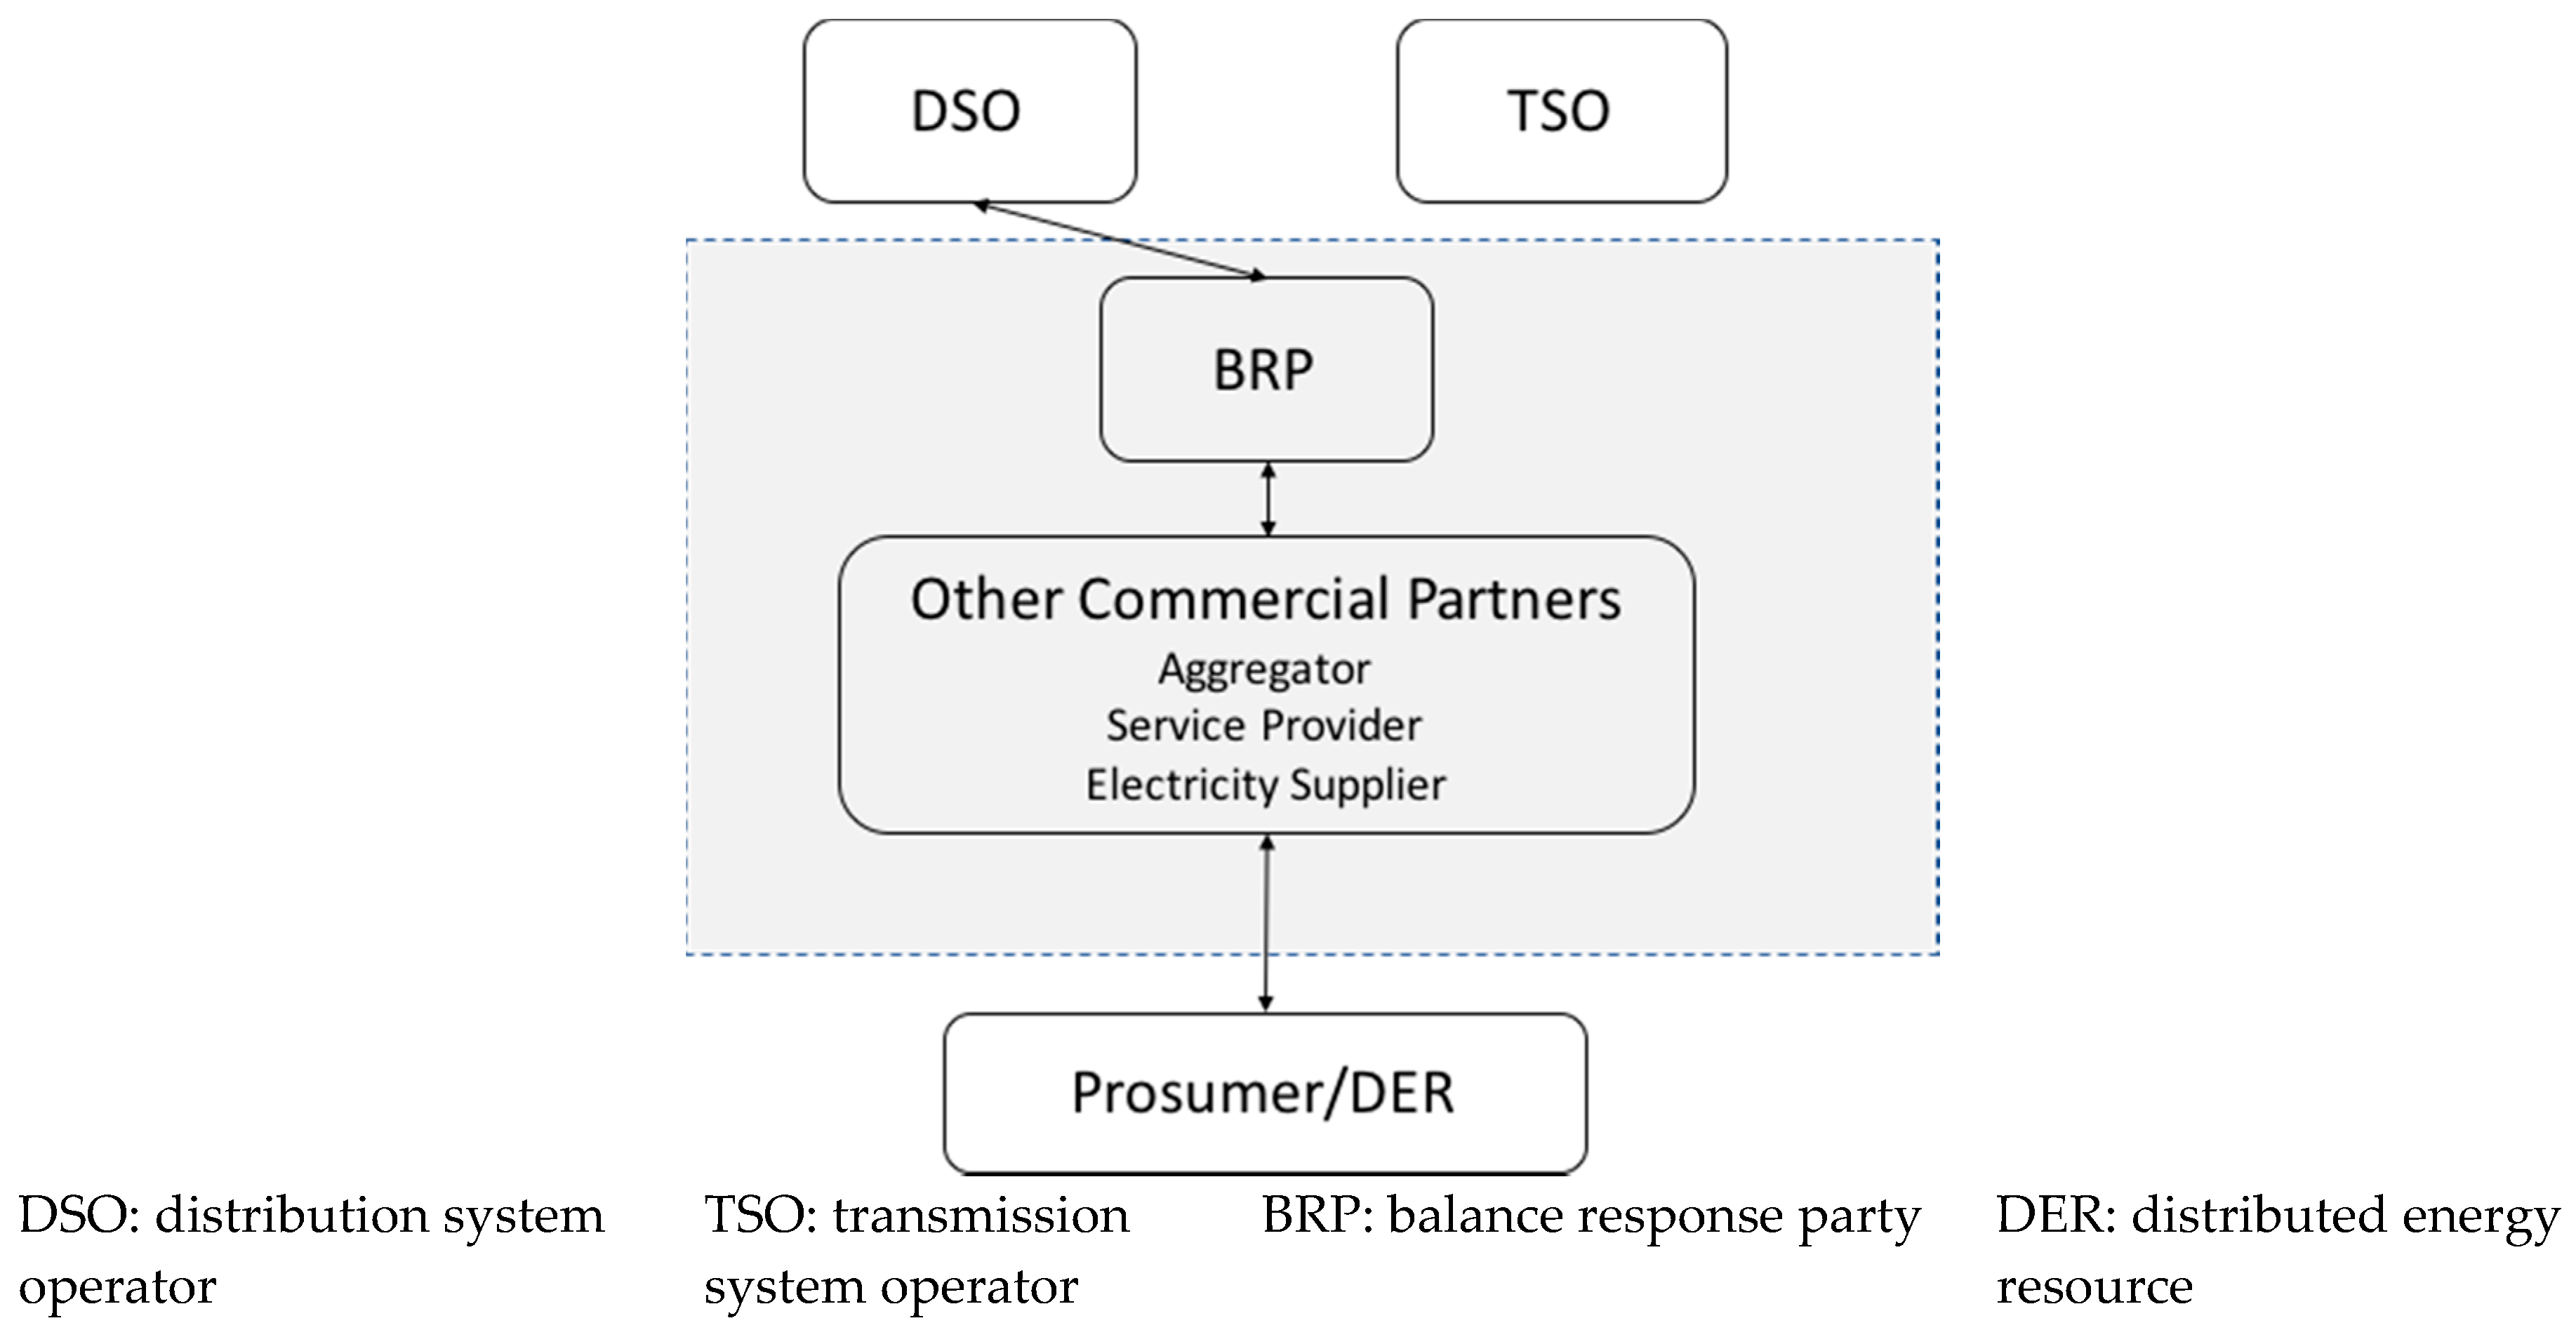
The flexibility activation determines the smart grid success, and it depends on the collaboration of all smart grid stakeholders [34]. The flexibility activation might require the agreement between different actors (shown in Figure 4). The agreement between aggregator and prosumers might be related to: security of supply on time from prosumers’ side, comfort requirements from prosumers’ side, billing framework, and aggregators’ active marketing role to engage consumers in the delivery of flexibility products [48]. The flexibility activation depends on the introduction of dynamic prices, use of price signals and consumer behavior change [34]. Geelen, et al. [13] emphasize that: “Once end users have been provided with smart grid products and services, they may have to change their behavior to utilize the system in ways that are favorable for both end user and electric power system”.
3. Methodology
The primary characteristic of the qualitative approach is non-numerical and focuses on the significance that can be achieved from data [49]. Dedrick, et al. [50] apply an exploratory qualitative approach to study factors that influence smart grid technologies adoption by the U.S. utilities. The primary goal of the study is to enhance the understanding of industrial consumers’ acceptance to the smart grid solutions. Therefore, this study applies a qualitative method [50].
The case study approach has been widely used, because it may offer insights that might not be achieved with other approaches. The case study research is especially applied to social sciences, organization (internal) and economy studies [51]. Meanwhile, Dubois and Gadde [52] argue that case studies are also used in the industrial network research. This study adopts the case study approach to investigate the smart grid adoption by industrial consumers that is a less explored area without clear boundaries between phenomenon and context [53]. Moreover, the application of multiple-case studies can ensure the research generalization.
To reduce the number of bias of the case study approach (e.g., researchers’ bias, case selection bias), the selected case studies should fulfil the criteria of “highly knowledgeable informants” that can enlighten the phenomena from different perspectives [51]. Thus, this study selects four cases (shown in Table 4) that can represent different smart grid stakeholders to explore phenomena from different perspectives. According to the literature, cold stores/refrigeration companies have a high potential for altering electricity consumption due to high electricity price [41]. Moreover, cold stores/refrigeration companies have been especially investigated in the demand response studies [11,36]. Meanwhile, manufacturing companies are also high energy consumers [40]. These industrial consumers can be claimed as the potential early adopters of smart grid solutions [41]. TSOs and electricity retailers play leading roles in the smart energy development and deployment. Thus, TSOs and electricity retailers are also relevant to the study.
3.1. Data Collection
The data collection includes seven in-depth interviews with the selected companies. The interviews are opted to apply to the current research due to their wide application in the case studies [54]. This study adopts semi-structured open interviews [55] which are appropriate to apply in cases studies with limited knowledge. The interview guide is developed based on the generated literature review and modified ICT adoption model by Chinedu Eze et al. [56]. The interview guide is altered in the process to meet company’s specific context. Meanwhile, the main interview content remains the same. The interviews last approximately 60–90 min and they were recorded for transcription.
3.2. Data Analysis
The data analysis process follows the logic developed by Rasmussen, et al. [49]. After the collection, the data are transcribed. Thereafter, the data are studied, codified and merged into major categories (the coded data for the four cases are shown in Table 5, Table 6, Table 7 and Table 8). The following techniques are used in the process of data coding: (1) data presentation, (2) condensation and (3) interpretation [49]. To enhance the trustworthiness of the research, the data coding follows the guide developed by Spiggle [57]. Moreover, practical coding guide is adopted from Chinedu Eze, et al. [56].
To explore the smart grid adoption, this paper applies the ICT adoption model created by Eze [56,58] to categorize influential factors found from the four cases. The application of the ICT adoption model allows this research to investigate smart grid adoption from the technological and social perspective as a dynamic process [59]. The four stages of the ICT adoption model are: inscription, translation, framing, and stabilization:
● Inscription stage
According to Chinedu Eze, et al. [56], the inscription stage of emerging technology adoption includes three activities: (1) problem assessment and evaluation, (2) concept generation and evaluation, and (3) concept specification. The end-user involvement (e.g., energy consumer) in the described activities (i.e., decision making process regarding new technology use) can promote the emerging technology acceptance by the end-user [25].
● Translation stage
The key activities at this stage are: (1) role delegation/product outsourcing and (2) alignment of interests [56]. The ICT adoption tasks may be outsourced to third parties [58]. These parties may operate independent from the key actors [56]. The ICT perceptions and opinions are different between the key actors and third parties.
● Framing stage
At the framing stage, the technology is becoming “transformed into physical objects” [56]. The product testing and modification are important activities at this stage. These activities support the reliable and workable product development. The end-user involvement in the emerging ICT use and modification can reveal problems due to technology immaturity. Moreover, the end users’ involvement (e.g., energy consumers) in the product development or value creation allows to tailor the innovation to the users’ specific needs and it promotes technology designers’ competitiveness [60]. Moreover, the end users’/energy consumers’ involvement in R & D decision making can promote the developed products/solutions adoption [61].
● Stabilization stage
The main activities at this stage are: adaptation and problem redefinition [56]. ICT adoption cannot be predicted due to the organization change. Therefore, the alteration of the companies’ processes may occur especially due to the poor ICT performance and new problems may arise [56]. The alteration of the organizational process may induce learning process (an indication of adaptation) that contributes to ICT institutionalization/adoption by the organization and new change [56].
4. Results
There are eleven factors founded that impact on industrial consumers’ acceptance of the smart grid solutions. Based on the results of the case studies, these factors can be allocated into four stages of the ICT adoption model (shown in Table 9).
● Awareness of multiple context
According to Eze, et al. [58]: “Awareness of multiple contexts is the ability to take into account all options available and to ensure that the impending challenges are thoroughly evaluated”. Eze, et al. [58] argues that awareness of multiple contexts affects the initial stage of the smart grid adoption. However, the result shows that the awareness of multiple contexts also affects the later stages (both inscription and stabilization stages).
Awareness of multiple contexts refers not only consumer awareness of a single ICT adoption, but also all emerging situations and stakeholders that confine new ICT adoption [58]. EU commission has indicated the importance of energy consumers’ awareness for the initiation of the smart grid deployment [62]. A wider recognition of the term of smart grid, flexible consumption and demand response by electricity consumers are necessary to trigger the transition to the future smart grid [63]. Generally, the escalation of consumers’ smart grid knowledge and awareness are required to enhance consumer engagement in smart grid [58]. Nevertheless, the limited consumer knowledge of confidence and choice for new systems diminishes the potential benefits of the smart grid application [64].
Consumers’ knowledge and awareness can be enhanced via educational and informational campaigns [63]. Also, the feedback of energy consumption allows raising industrial consumers’ energy awareness, which can be divided into four categories: direct feedback, indirect feedback, inadvertent feedback, and energy audits [3]. The types of feedbacks have a major impact on the energy-awareness and consumers’ attitudes toward energy consumption [3]. Meanwhile, some feedback measurements can be activated after smart meter implementation, such as availability of real-time pricing.
● Shared support
Shared support refers to open participation and collaboration across stakeholders. It determines the realization of stakeholders’ shared goals. For an example in Denmark, the electricity industry is responsible for initiation and coordination of the shared roadmap for smart grid deployment and continuous development [63]. Meanwhile, research institutions, commercial companies, big industrial players and authorities are also highly responsible for different tasks regarding the smart grid deployment [63]. In Denmark, there is close collaboration across research institutions and firms for the ICT development regarding communication, electronics, wireless technology, control technology, embedded systems and software [65]. The open standards and communication in the Danish future smart grid model not only mitigates the consumers’ dependence on a particular producer, but also promotes innovative solutions [63].
According to [58], shared support is recognized at the translation, framing and stabilization stages. However, the result shows that shared support mainly influences the translation stage. Moreover, shared support ensures industrial consumers continuously participate in the adoption process (i.e., further translation to the framing stage). The case studies reveal that industrial consumers do not proactively seek involvement in the smart grid activities. Thus, a key actor should actively presume and involve the industrial consumers (e.g., demand response). Despite collaboration with network actors is driven by the company’s commercial interest, Claus Sørensen A/S aligns their interest with their partners. Meanwhile, the interest alignment at the translation stage and ensures a stronger actor-network. The stronger network has a higher potential to realize the shared goal and establish the dominant technological standard.
● Return on investment (ROI) and adoption cost
The smart grid deployment requires investment and development that concern the entire electricity value chain, and especially within the electricity consumers’ domain [2]. According to Farhangi [66], ROI grows with the increasing functionality of the smart grid.
The existing literature indicates that the adoption rates of energy efficiency technology by industrial consumers are higher in smart grid related projects with shorter payback time and lower costs [67]. Industrial consumers are especially concerned with upfront costs rather than annual savings. The emerging ICT solutions are unlikely to be adopted if they cannot generate ROI in a foreseen period. The ROI affects the early adoption stages due to the profit expectation.
One key factor that determines an emerging ICT- adoption is the adoption cost [58]. Consumers determine the adoption cost of a technology by comparing benefits and the additional cost of the emerging ICT use in companies [56,68]. For instance, the adoption cost of smart meters can be divided into the initial cost and on-going cost. The initial cost includes purchasing, installing and integrating costs, and the on-going cost includes data transmission, maintenance, training, billing and electricity costs. Therefore, distribution system operators (DSOs) usually own the smart meters and do the maintenance.
The ROI and adoption cost has an impact on the inscription (evaluation and conceptualization of ICT), translation and stabilization stages. However, the adoption cost has an especially main impact on translation and stabilization stages. Stakeholders negotiate the price at the translation stage, and further renegotiation at the stabilization stage.
● Ease of use
Ease of use is defined as “the capacity of the emerging ICT to allow people with limited knowledge or limited ICT skills to accomplish complex tasks” [58]. This factor is applied to both individual and organizational ICT adoption [3]. The research on the residential consumer engagement in smart grid indicates that several variables (e.g., understanding of smart grid, understanding of compatibility between existing technologies and emerging ICT) influence consumers’ perception on ease of use and acceptance of a new system [22]. The limited smart grid understanding by consumers is due to the poor understanding of smart grid terminology [69].
Eze, et al. [58] propose that the connectivity and compatibility between existing technologies and emerging ICTs determine the ICT integration. The connectivity is highly dependent on the availability of communication channels for all stakeholders (including electricity consumers) [5]. While the compatibility relies on the similarity degree of the value and the way of use between existing and emerging technologies [70].
Ease of use influences inscription, framing, and stabilization stages [58]. However, the result shows that the compatibility between existing technologies and emerging ICT appears at the framing stage [58]. In case of Claus Sørensen A/S, at the framing stage, ease of use is the equipment requirement. The company’s engineer points out: “We brainstorm together with GridManager. Sometimes we get the ideas when we work with equipment. It happens spontaneously. We provide feedback about the portal’s functionality and contribute with the suggestions”.
● Flexibility and dynamic pricing
Flexibility affects the inscription stage due to the importance of flexibility awareness. However, flexibility has the main impact at the translation and framing stages, because the energy capacity optimization depends on stakeholders’ negotiations (e.g., dynamic pricing) and actions (e.g., implementation of smart meters) [34]. Flexibility may impact the stabilization stage due to potential consumer management by load profiles [45]. Meanwhile, dynamic pricing mainly affects the adoption process from the translation to stabilization stages.
The electricity retailer, TREFOR, points out that it is the retailers’ responsibility to make consumers aware of the dynamic pricing options. This may motivate consumers to offer flexibility and lead to behavioral change. Furthermore, the project manager points out that majority of industrial consumers adopt the Nord Pool spot price (the Nordic electricity wholesale market) option offered by TREFOR. It shows that dynamic pricing influences consumers. However, consumers have not received any benefit by choosing the spot-price option yet, because the spot price is calculated according to grid areas’ average profile. The implementation of the wholesale model should ensure consumers’ individual benefit due to behavioral change.
The industrial consumer, Claus Sørensen A/S, emphasizes that electricity price may vary daily and hourly in the future. Thus, night hour electricity may not be the cheapest. Therefore, it is critical for companies to have access to the Nord Pool spot price. Moreover, the consumer portal could be more useful if it could be online and the data could be downloaded directly into the portal. At the same time, rules and regulations in the industry should be adjusted based on different smart grid requirements.
It is important to mention that Claus Sørensen A/S utilizes the heat removed from products in the cooling process to heat its own facilities, but the company generates more heat that it can use. Meanwhile, the company does not have the possibility to sell the heat. This hampers the behavioral change. The company may collaborate with neighbor companies for the heat sale, but this option is not available yet. Meanwhile, the automatic control of equipment is important for Claus Sørensen A/S. However, it should be also possible for consumers to interfere the load control process if it is necessary.
● Energy tariff structure and liberalization
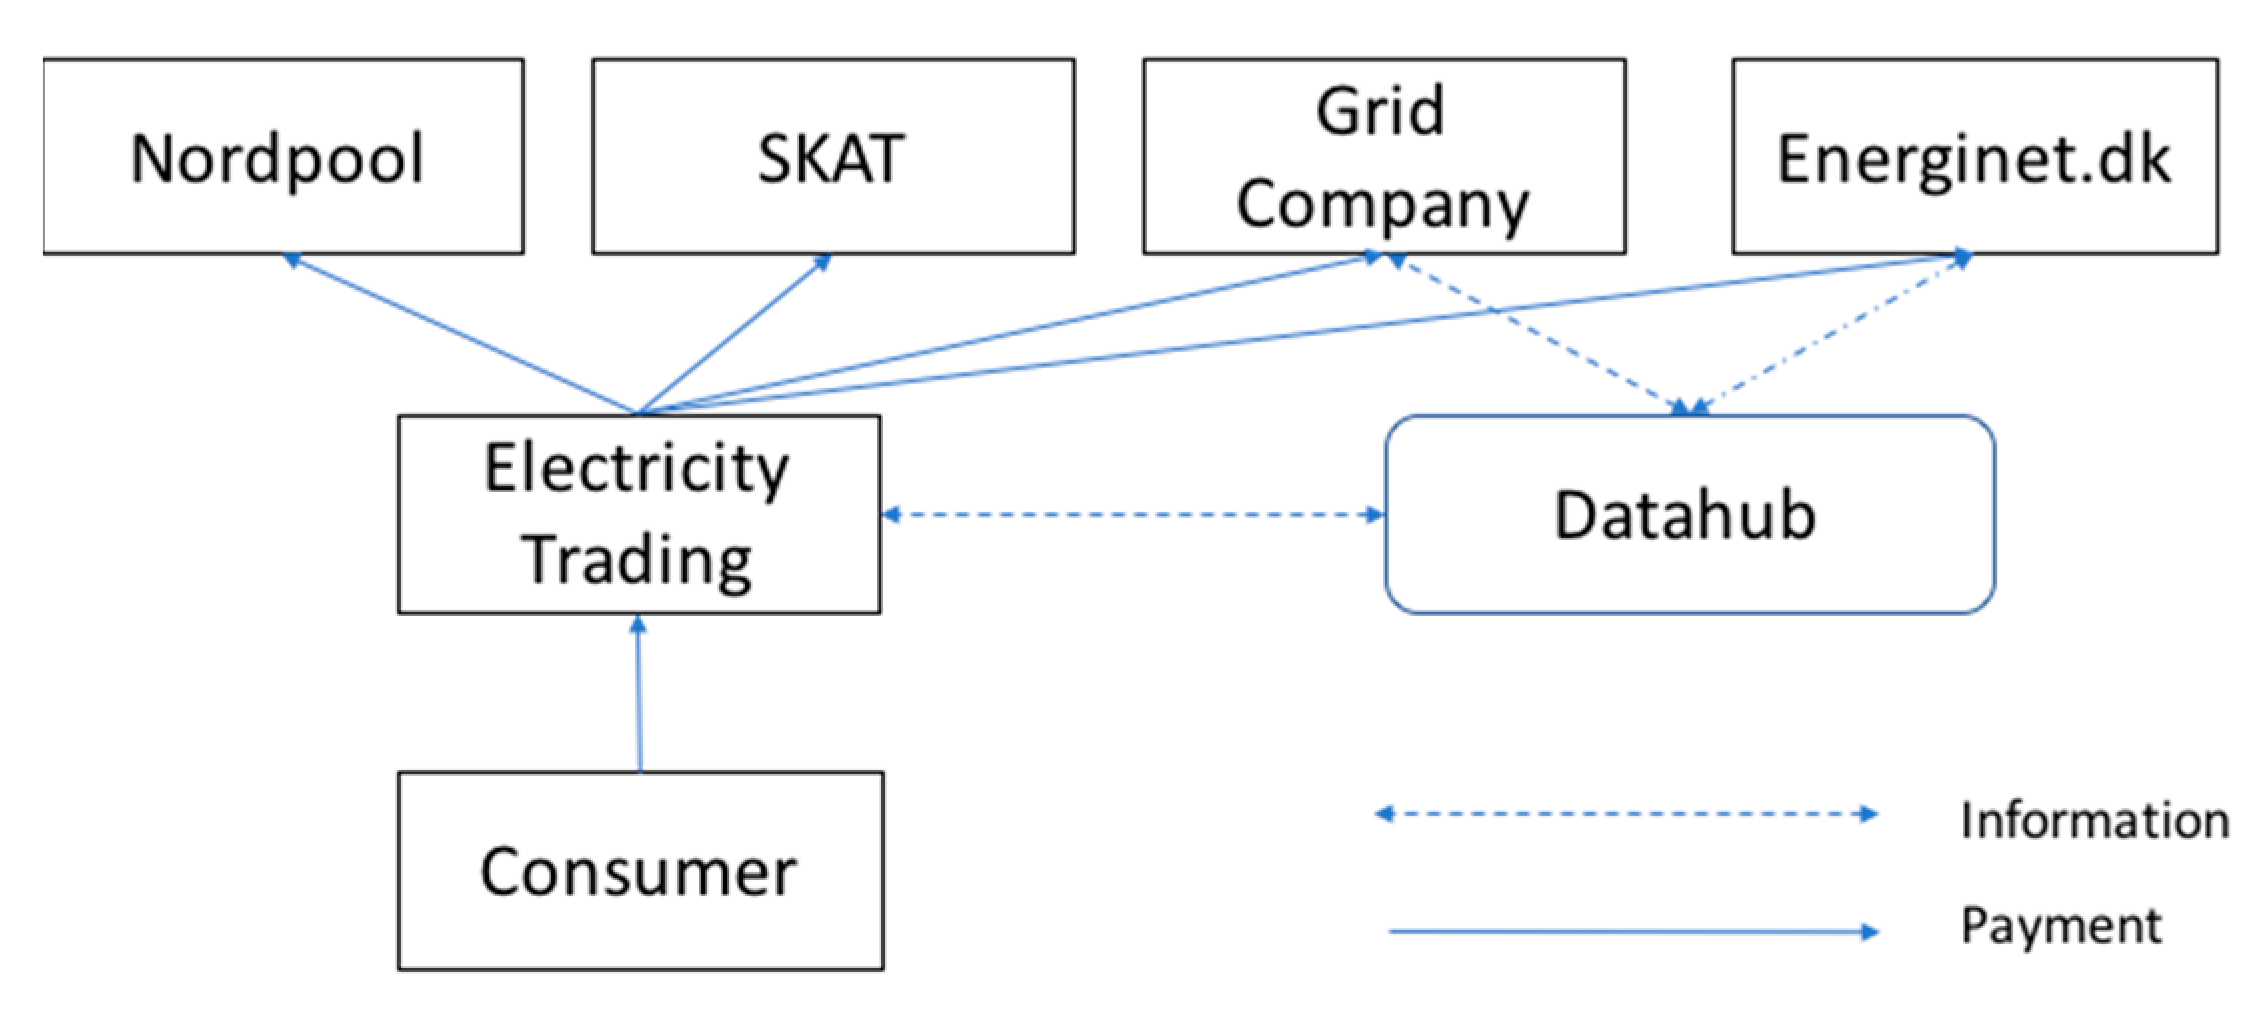
The structural shifts of electricity industry are determined by ICT application. According to the EEA [3], there are two types of structural factors impact on consumer behavior and engagement in the smart grid: liberalization and energy tariffs structure. For example, the liberalization of the energy retail market provides consumers the possibility to switch energy retailers [3]. The Danish parliament has passed a regulation regarding the electricity market liberalization that makes consumers the focus [48]. This model implies a closer contact between electricity retailers and consumers in the retail market (shown in Figure 5).
Moreover, a number of tariff structure issues should be solved to ensure active consumer evolvement [3]. For instance, a survey shows that electricity consumers (with electricity consumption more than 100,000 kWh per year) do not move consumption along with the real-time electricity price, because the real-time price variation does not provide adequate incentives to change their behavior [35]. Thus, to motivate consumers to provide flexibility, the grid companies should consider the variable tariffs [35]. At the same time, the alignment of the tariff structure in the value chain is required (e.g., between grid companies and electricity retailers), because the variety of the tariff structures can have a negative effect to the economic efficiency [3]. The project manager at TREFOR emphasizes that the tariff structure should be adjusted not only according to grid companies’ and electricity retailers’ needs, but also to consumers’ needs.
The structural factor of energy market liberalization affects the inscription stage, because it triggers the smart grid transition. The factor also influences the translation stage because the continuous release of liberalization packages has to be potentially translated by the network [4]. Moreover, the energy tariff structure impacts the adoption process on the framing and stabilization stages due to technology alteration, consumer behavior change, and network change.
● Customer focus and green image
Customer focus is a key factor that drives industrial consumers’ engagement of the technology adoption. It triggers translation to the framing stage. Customer focus refers to the technological solutions (i.e., smart grid solution) to improve industrial consumers’ core processes and retain their customers, i.e., achievement of competitive advantage is a primary motivator for companies. Customer focus emphasizes that companies’ concern about their customers’ satisfaction and retention [58], and customers impact on companies’ decision making. Moreover, customer focus is a key factor that impacts on/drives industrial consumers’ engagement at the inscription stage and continuous participation.
A new factor that motivates Claus Sørensen A/S network participation is a desire to brand the company as a “green company”. Branding as “green company” impacts at the inscription stage. However, this factor also interconnects to customer focus.
● Solution integration
Traditional smart grid solutions include only energy screening or solution development and implementation. This study reveals that industrial consumers prefer a one-stop smart grid solution/offering or an integrated solution provided/executed by one organization/supplier (rather than separation into several organizations). This one-stop smart grid solution/offering affects the inscription stage. The energy consulting company, Udvikling Fyn, points-out that consumers prefer the one-stop solution/offering that their project “Effective Energy” provides, rather than a separated energy screening and offering. Meanwhile, energy audits, advertisement, bandwagon, and grid companies’ visits to the customers’ sites also can enhance consumer awareness of the energy conservation.
● Service quality and process improvement
Service of quality (QoS) is defined by as “capability of emerging ICT to deliver efficient results to end-users” and also refers to the ICT possibility to improve companies’ (i.e., energy consumer) processes, profit and deliver service at reduced costs [58]. Eze, et al. [58] argue that poor service quality can negatively affect the adoption process. Service quality can also be defined in terms of delay (e.g., information delay), throughput, loss (% of lost information), availability and ICT-security [71]. The wired and wireless communication technologies have different QoS capabilities and this may impact consumers’ technology choice [71]. Service quality affects the later stages of the smart grid adoption process due to the challenges of outage management after new equipment installation. According to Eze, et al. [58], service quality affects the adoption process at the stabilization stage. However, the result shows that service quality affects both framing and stabilization stages due to the challenges of outage management after new equipment installation [71].
The result shows a new factor—process improvement also impacts on the adoption process. This factor refers to the ICT’s ability that enhances energy users’ business processes and stabilize the adoption [56]. Process improvement mainly influences the framing stage. In the adoption of smart grid solutions, this factor can be defined as the technological solution possibility (i.e., smart grid solution) to improve industrial consumers’ business processes.
5. Discussions
The results show that the majority of industrial consumers are not aware of the smart grid transition. Industrial consumers’ adoption of smart grid solutions is driven by their needs, beliefs, social relations and previous pattern of use (e.g., technology, energy). Limited financial resources and poor knowledge about the possible energy conservation solutions can impede the involvement. Uncertainty about the future can also impede smart grid adoption. Moreover, positive ROI considerations also influence industrial consumers’ adoption of smart grid solutions. The result also indicates that regulation and legislation influence industrial consumers’ smart grid adoption, although regulation and legislation significantly affect electricity suppliers and producers, but not industrial consumers.
The adoption of smart grid solutions is determined by top management’s commitment and engagement with other smart grid stakeholders. The result shows that industrial consumers’ awareness can be enhanced via bandwagon effects and visits by utility companies (e.g., electricity suppliers). The term “bandwagon” means that industrial consumers participate in energy conservation projects because of other companies’ (who industrial consumers communicate with) participation.
However, there is trust issue for industrial consumers to collaborate with commercial players. Industrial consumers are more willing to trust impartial companies. The case studies reveal that industrial consumers do not proactively get involved in smart grid activities. Thus, a key actor to actively prompt and involve the industrial consumers (e.g., demand response) is needed. The results reveal that network organizations can promote industrial consumers’ engagement. Moreover, the concept of business ecosystem can promote industrial consumers’ involvement. In the ecosystem, impartial companies are the strong ties (responsible for relationship establishment with industrial consumers) to industrial consumers, but not commercial players.
The result also shows that trust issues also appear after collaboration is established, because industrial consumers doubt the energy saving predictions provided by impartial companies. However, the trust issue can be resolved via active feedback. Moreover, shared support among industrial consumers helps to reduce consumers’ resistance to the smart grid implementation and promote consumer engagement, and ensures that industrial consumers continuously participate in the adoption process. The co-interest alignment among industrial consumers enhances higher potentials to achieve the shared goals and establish the dominant technological standards.
The adoption of smart grid solutions can provide a series of benefits to industrial consumers. For instance, smart grid solutions can improve industrial consumers’ business processes (e.g., lighting quality). However, this factor does not significantly affect industrial consumers’ decision-making. The adoption of smart grid solutions includes new evaluation routine (e.g., equipment testing) and the use and modification of emerging ICT can help to find technological problems and allow technology refinement and customization. The result shows that industrial consumers’ involvement in product modification drives their organizational learning (e.g., via participation in the concept generation). Meanwhile, a ‘green image’ from the adoption of smart grid solutions can improve their customers’ relationship.
Smart grid solutions need to fulfil industrial consumers’ preferences. For instance, industrial consumers prefer a one-stop solution/offering or an integrated solution. Ease of use (e.g., easy to install and maintain) also influences industrial consumers’ adoption willingness. The result reveals that smart grid solutions need to be more interactive and intuitive to industrial consumers (e.g., visualization of energy consumption in the facilities via sensors). The study also reveals that payback is more important to industrial consumers compared to the annual saving.
It is important to notice that equipment automatic control (in response to the electricity price signal) is possible in the future. However, industrial consumers prefer to fully control their process and possibility to interfere the automatic load control. Meanwhile, Wissner [32] argues that: “If automation leads to manual interference by its users, it no longer makes sense and leads to a decrease in energy savings”. Thus, the implementation of automatic load control can be challengeable. Meanwhile, smart grid solutions should not significantly change consumers’ existing routine in a short period.
6. Conclusions
This paper tries to explore smart grid adoption by industrial consumers. To address the research aim and objectives, an ICT adoption model is applied. Furthermore, the ICT model is adjusted to the smart grid context. The influential factors and activities of smart grid adoption by industrial consumers are investigated with the literature exploration and case studies. Eleven influential factors found in this research that impact the adoption stages of smart grid solutions are: awareness of multiple contexts, shared support, ROI, ease of use, flexibility and dynamic pricing, liberalization and energy tariff structure, customer focus, solution integration, process improvement and service quality, and company’s green image.
This research identifies new factors and tendencies that may influence smart grid adoption by industrial consumers. Meanwhile, this research integrates influential factors with the adoption model of smart grid solutions that provide a systematic approach to the understanding of industrial consumers’ acceptance and participation in smart grid. This research brings a focus on the path dependency between technical and social smart grid dimensions. The generated knowledge is especially valuable due to the limited number of available studies on industrial consumers’ engagement and management in a smart grid scenario. The research findings could be used by authorities and smart grid stakeholders to develop strategies and policies to promote smart grid acceptance and active participation by industrial consumers.
This research adopts a qualitative research approach to generate a deep insight of the smart grid adoption by industrial consumers. The data analysis was generated from the four Danish Companies: Claus Sørensen A/S, Udvikling Fyn, TREFOR and ITW GSE—AXA Power. Thus, this research is limited by the interpretive nature of the qualitative approach, a number of investigated cases and stakeholders. Therefore, further qualitative or quantitative approaches are recommended to ensure the generalization and validation of the research findings. Moreover, the research findings only reflect the Danish smart grid scenario. Denmark is a pioneering country in the development of the future flexible and intelligent electricity grid. Thus, further research to addresses this topic with cross-national comparisons is recommended.
Author Contributions
Zheng Ma designed the methodology; Alla Asmussen contributed data collection and primary data analysis; Zheng Ma and Bo Nørregaard Jørgensen wrote the paper.
Conflicts of Interest
The authors declare no conflict of interest.
References
- Sutanto, D. Electronic controlled energy storage devices and applications in future smart grid. J. Electron. Sci. Technol. 2011, 9. [Google Scholar] [CrossRef]
- Samad, T.; Kiliccote, S. Smart grid technologies and applications for the industrial sector. Comput. Chem. Eng. 2012, 47, 76–84. [Google Scholar] [CrossRef]
- European Environment Agency (EEA). Achieving Energy Efficiency through Behaviour Change: What Does it Take? European Union: Brussels, Belgium, 2013. [Google Scholar]
- Dansk Energi and Energinet.dk. Smart Grid i Danmark; Dansk Energi and Energinet.dk: Vejle, Denmark, 2010. [Google Scholar]
- Mickoleit, A. ICT Applications for the Smart Grid: Opportunities and Policy Implications; OECD Digital Economy Papers, No. 190; OECD Publishing: Paris, France, 2012. [Google Scholar]
- Heiskanen, E.; Matschoss, K. Exploring emerging customer needs for smart grid applications. In Proceedings of the 2011 2nd IEEE PES International Conference and Exhibition on Innovative Smart Grid Technologies (ISGT Europe), Manchester, UK, 5–7 December 2011; pp. 1–7. [Google Scholar]
- Gungor, V.C.; Sahin, D.; Kocak, T.; Ergut, S.; Buccella, C.; Cecati, C.; Hancke, G.P. Smart Grid Technologies: Communication Technologies and Standards. IEEE Trans. Ind. Inform. 2011, 7, 529–539. [Google Scholar] [CrossRef]
- Vukojevic, A.; Milošević, B. Utilities of future. In Proceedings of the 2010 IEEE International Conference on Sustainable Energy Technologies (ICSET), Kandy, Sri Lanka, 6–9 December 2010; pp. 1–6. [Google Scholar]
- Palensky, P.; Dietrich, D. Demand Side Management: Demand Response, Intelligent Energy Systems, and Smart Loads. IEEE Trans. Ind. Inform. 2011, 7, 381–388. [Google Scholar] [CrossRef]
- Liu, W.-H.E.; Liu, K.; Pearson, D. Consumer-centric smart grid. In Proceedings of the Innovative Smart Grid Technologies (ISGT), Anaheim, CA, USA, 17–19 January 2011; pp. 1–6. [Google Scholar]
- Rahnama, S.; Stoustrup, J.; Rasmussen, H. Model predictive control for integration of industrial consumers to the smart grid under a direct control policy. In Proceedings of the 2013 IEEE International Conference on Control Applications (CCA), Hyderabad, India, 28–30 August 2013; pp. 515–520. [Google Scholar]
- Verbong, G.P.J.; Beemsterboer, S.; Sengers, F. Smart grids or smart users? Involving users in developing a low carbon electricity economy. Energy Policy 2013, 52, 117–125. [Google Scholar] [CrossRef]
- Geelen, D.; Reinders, A.; Keyson, D. Empowering the end-user in smart grids: Recommendations for the design of products and services. Energy Policy 2013, 61, 151–161. [Google Scholar] [CrossRef]
- Gangale, F.; Mengolini, A.; Onyeji, I. Consumer engagement: An insight from smart grid projects in Europe. Energy Policy 2013, 60, 621–628. [Google Scholar] [CrossRef]
- Mengolini, A.; Vasilevska, J. The Social Dimension of Smart Grids: Consumer, Community, Society; JRC Scientific and Policy Reports; Publications Office of the European Union: Luxembourg, 2013. [Google Scholar]
- Throndsen, W.; Ryghaug, M. Material participation and the smart grid: Exploring different modes of articulation. Energy Res. Soc. Sci. 2015, 9, 157–165. [Google Scholar] [CrossRef]
- Giordano, V.; Meletiou, A.; Covrig, C.F.; Mengolini, A.; Ardelean, M.; Fulli, G.; Jimenez, M.S.; Filiou, C. Smart Grid Projects in Europe: Lessons Learned and Current Developments; Publications Office of the European Union: Luxembourg, 2013. [Google Scholar]
- Dedrick, J.; Zheng, Y. Smart Grid Adoption: A Strategic Institutional Perspective. In Proceedings of the Industry Studies Association Annual Conference, Pittsburgh, PA, USA, 31 May–3 June 2011. [Google Scholar]
- Rathnayaka, A.J.D.; Potdar, V.; Ou, M.H. Prosumer management in socio-technical smart grid. In Proceedings of the CUBE International Information Technology Conference, Pune, India, 3–5 September 2012. [Google Scholar]
- Council of European Energy Regulators (CEER). 2020 Vision for Europe’s Energy Customers; CEER: Brussels, Belgium, 2014. [Google Scholar]
- Elzinga, D.; Heinen, S. Technology Roadmap: Smart Grids; OECD/IEA: Paris, France, 2011. [Google Scholar]
- Park, C.K.; Kim, H.J.; Kim, Y.S. A study of factors enhancing smart grid consumer engagement. Energy Policy 2014, 72, 211–218. [Google Scholar] [CrossRef]
- Dedrick, J. Green IS: Concepts and Issues for Information Systems Research. Commun. Assoc. Inf. Syst. 2010, 27, 173–184. [Google Scholar]
- Kroenke, D.M. Experiencing Management Infromation Systems: Upper Saddle River; Pearson Prentice-Hall: Upper Saddle River, NJ, USA, 2008. [Google Scholar]
- Rowe, G.; Frewer, L.J. Public Participation Methods: A Framework for Evaluation. Sci. Technol. Hum. Values 2000, 25, 3–29. [Google Scholar] [CrossRef]
- Cooper, R.B.; Zmud, R.W. Information technology implementation research: A technological diffusion approach. Manag. Sci. 1990, 36, 123–139. [Google Scholar] [CrossRef]
- Saga, V.L.; Zmud, R.W. The Nature and Determinants of IT Acceptance, Routinization, and Infusion. In Proceedings of the IFIP TC8 Working Conference on Diffusion, Transfer and Implementation of Information Technology, Pittsburgh, PA, USA, 11–13 October 1993. [Google Scholar]
- Sorgenfrei, C.; Ebner, K.; Smolnik, S.; Jennex, M.E. From Acceptance to Outcome: Towards an Integrative Framework for Information Technology Adoption. In Proceedings of the 22nd European Conference on Information Systems, Tel Aviv, Israel, 9–11 June 2014; p. 8. [Google Scholar]
- Rogers, E.M. Diffusion of Innovations, 4th ed.; The Free Press: New York, NY, USA, 1983. [Google Scholar]
- Justus, D. International Energy Technology Collaboration and Climate Change Mitigation—Case Study 5: Wind Power Integration into Electricity Systems; Organisation for Economic Co-operation and Development: Paris, France, 2005. [Google Scholar]
- Mandatova, P.; Lorenz, G. Network Tariff Structure for a Smart Energy System; Union of the Electricity Industry—EURELECTRIC aisbl: Brussels, Belgium, 2013. [Google Scholar]
- Wissner, M. The Smart Grid—A saucerful of secrets? Applied Energy 2011, 88, 2509–2518. [Google Scholar] [CrossRef]
- DOE (US Department of Energy). Benefits of Demand Response in Electricity Markets and Recommendations for Achieving Them; A Report to the United States Congress Pursuant to Section 1252 of the Energy Policy Act of 2005; US Department of Energy: Washington, DC, USA, 2006.
- Energinet.dk. Smart Grid in Denmark 2.0. Implementation of Three Key Recomendations form the Smart Grid Network; Energinet.dk: Vejle, Denmark, 2011. [Google Scholar]
- Danish Ministry of Climate Energy and Building. Smart Grid Strategy—The Intelligent Energy System of the Future; Danish Ministry of Climate Energy and Building: Copenhagen, Denmark, 2013.
- Ding, Y.; Hong, S.H. A model of demand response energy management system in industrial facilities. In Proceedings of the 2013 IEEE International Conference on Smart Grid Communications (SmartGridComm), Vancouver, BC, Canada, 21–24 October 2013; pp. 241–246. [Google Scholar]
- Smale, R.; van Vliet, B.; Spaargaren, G. When social practices meet smart grids: Flexibility, grid management, and domestic consumption in The Netherlands. Eng. Res. Soc. Sci. 2017, 34, 132–140. [Google Scholar] [CrossRef]
- Zhang, J.; Wang, Z.; Niu, Y.; Song, N.; Chen, Z.; Li, X. Study on the behaviors of electric power consumers in smart grid environment. In Proceedings of the 2012 China International Conference on Electricity Distribution (CICED), Shanghai, China, 10–14 September 2012; pp. 1–4. [Google Scholar]
- Ma, Z.; Friis, H.T.A.; Mostrup, C.G.; Jørgensen, B.N. Energy Flexibility Potential of Industrial Processes in the Regulating Power Market. In Proceedings of the 6th International Conference on Smart Cities and Green ICT Systems, Porto, Portugal, 23–27 April 2017; pp. 109–115. [Google Scholar]
- Ma, Z.; Asmussen, A.; Jørgensen, B.N. Industrial consumers’ acceptance to the smart grid solutions: Case studies from Denmark. In Proceedings of the 2015 IEEE Innovative Smart Grid Technologies—Asia (ISGT ASIA), Bangkok, Thailand, 3–6 November 2015; pp. 1–6. [Google Scholar]
- Danish Energy Agency. Energy Statistics 2015; Danish Energy Agency: Copenhagen, Denmark, 2017.
- Christoffersen, L.B.; Larsen, A.; Togeby, M. Empirical analysis of energy management in Danish industry. J. Clean. Prod. 2006, 14, 516–526. [Google Scholar] [CrossRef]
- Danish Energy Agency. Redegørelse om Mulighederne for Anvendelse af Prisfleksibelt Elforbrug I Det Danske Elsystem; Danish Energy Agency: Copenhagen, Denmark, 2006.
- Ea-energianalyse. Kortlægning af Potentialet for Fleksibelt Elforbrug I Industri, Handel og Service; Energinet: Vejle, Denmark, 2011. [Google Scholar]
- Wattjes, F.; Janssen, S.; Slootweg, J.G. Framework for estimating flexibility of commercial and industrial customers in Smart Grids. In Proceedings of the 2013 4th IEEE/PES Innovative Smart Grid Technologies Europe (ISGT EUROPE), Lyngby, Denmark, 6–9 October 2013; pp. 1–5. [Google Scholar]
- Energinet and Dansk Energi. Delrapport Arbejdsgruppe 24. Roadmap for Smart Grid i Danmark Med Særlig Vægt på Netselskabernes Rolle; Energinet and Dansk Energi: Vejle, Denmark, 2012. [Google Scholar]
- Shove, E. Converging Conventions of Comfort, Cleanliness and Convenience. J. Consum. Policy 2003, 26, 395–418. [Google Scholar] [CrossRef]
- Darnton, A. Practical Guide: An Overview of Behaviour Change Models and Their Uses; GSR (Government Social Research Unit) Behaviour Change Knowledge Review; Government Social Research Unit, HM Treasury: London, UK, 2008. [Google Scholar]
- Rasmussen, E.S.; Østergaard, P.; Beckmann, S.C. Essentials of Social Science Research Methodology; University Press of Southern Denmark: Odense, Denmark, 2006. [Google Scholar]
- Dedrick, J.; Venkatesh, M.; Stanton, J.; Zheng, Y.; Ramnarine-Rieks, A. Adoption of smart grid technologies by electric utilities: Factors influencing organizational innovation in a regulated environment. Electron. Mark. 2015, 25, 17–29. [Google Scholar] [CrossRef]
- Eisenhardt, K.M.; Graebner, M.E. Theory building from cases: Opportunities and chalanges. Acad. Manag. J. 2007, 50, 25–32. [Google Scholar] [CrossRef]
- Dubois, A.; Gadde, L.-E. Systematic combining: An abductive approach to case research. J. Bus. Res. 2002, 55, 553–560. [Google Scholar] [CrossRef]
- Rowley, J. Using case studies in research. Manag. Res. News 2002, 25, 16–27. [Google Scholar] [CrossRef]
- Yin, R.K. Case Study Research: Design and Methods; Sage Publications: Thousand Oaks, CA, USA, 1994. [Google Scholar]
- Breakwell, G.M. Interviewing. In Research Methods in Psychology; Breakwell, G.M., Hammond, S., Fife-Schaw, C., Eds.; SAGE: London, UK, 1995; pp. 293–301. [Google Scholar]
- Eze, S.C.; Duan, Y.; Chen, H. Examining emerging ICT’s adoption in SMEs from a dynamic process approach. Inf. Technol. People 2014, 27, 63–82. [Google Scholar]
- Spiggle, S. Analysis and Interpretation of Qualitative Data in Consumer Research. J. Consum. Res. 1994, 21, 491–503. [Google Scholar] [CrossRef]
- Eze, S.; Duan, Y.; Chen, H. Factors Affecting Emerging ICT Adoption in SMEs: An Actor Network Theory Analysis. In Contemporary Research on E-business Technology and Strategy; Khachidze, V., Wang, T., Siddiqui, S., Liu, V., Cappuccio, S., Lim, A., Eds.; Springer: Berlin/Heidelberg, Germany, 2012; pp. 361–377. [Google Scholar]
- Callon, M. Some Elements of Sociology of Translation: Domestication of the Scallops and the Fishermen of the Brieuc Bay; Routledge: London, UK, 1986. [Google Scholar]
- Prahalad, C.K.; Ramaswamy, V. Co-creating unique value with customers. Strategy Leadersh. 2004, 32, 4–9. [Google Scholar] [CrossRef]
- Davis, F.D.; Bagozzi, R.P.; Warshaw, P.R. User Acceptance of Computer Technology: A Comparison of Two Theoretical Models. Manag. Sci. 1989, 35, 982–1003. [Google Scholar] [CrossRef]
- European Commission. Communication from the Commission to the European Parliament, the Council, the European Economic and Social Committee and the Committee of the Regions. In SmartGrids: From Innovation to Deployment; European Commission: Brussels, Belgium, 2017. [Google Scholar]
- Danish Ministry of Climate Energy and Building. Main Report-The Smart Grid Network’s Recommendations; Danish Ministry of Climate Energy and Building: Copenhagen, Denmark, 2011.
- European Commission. EU Commission Task Force for Smart Grids, Vision and Work Programme; European Commission: Brussels, Belgium, 2010.
- Troi, A.; Jørgensen, B.N.; Larsen, E.M.; Blaabjerg, F.; Mikkelsen, G.L.; Slente, H.P.; Madsen, H.; Østergaard, J. The Smart Grid Research Network. Road Map for Smart Grid Research, Development and Demonstration up to 2020; Technical Report; Danish Ministry of Energy, Utilities and Climate: Copenhagen, Denmark, 2013.
- Farhangi, H. The path of the smart grid. IEEE Power Energy Mag. 2010, 8, 18–28. [Google Scholar] [CrossRef]
- Anderson, S.T.; Newell, R.G. Information programs for technology adoption: The case of energy-efficiency audits. Resour. Energy Econ. 2004, 26, 27–50. [Google Scholar] [CrossRef]
- Adner, R. The Wide Lens of Innovation—A New strategy for Innovation; Portfolio/Penguin: New York, NY, USA, 2012. [Google Scholar]
- Smart Grid Consumer Collaborative (SGCC). Consumer Voice: Results of Baseline Focus Groups; SGCC: Atlanta, GA, USA, 2010. [Google Scholar]
- Wu, J.-H.; Wang, S.-C. What drives mobile commerce? An empirical evaluation of the revised technology acceptance model. Inf. Manag. 2005, 42, 719–729. [Google Scholar] [CrossRef]
- Mo, Y.; Kim, T.H.H.; Brancik, K.; Dickinson, D.; Heejo, L.; Perrig, A.; Sinopoli, B. Physical Security of a Smart Grid Infrastructure. Proc. IEEE 2012, 100, 195–209. [Google Scholar]
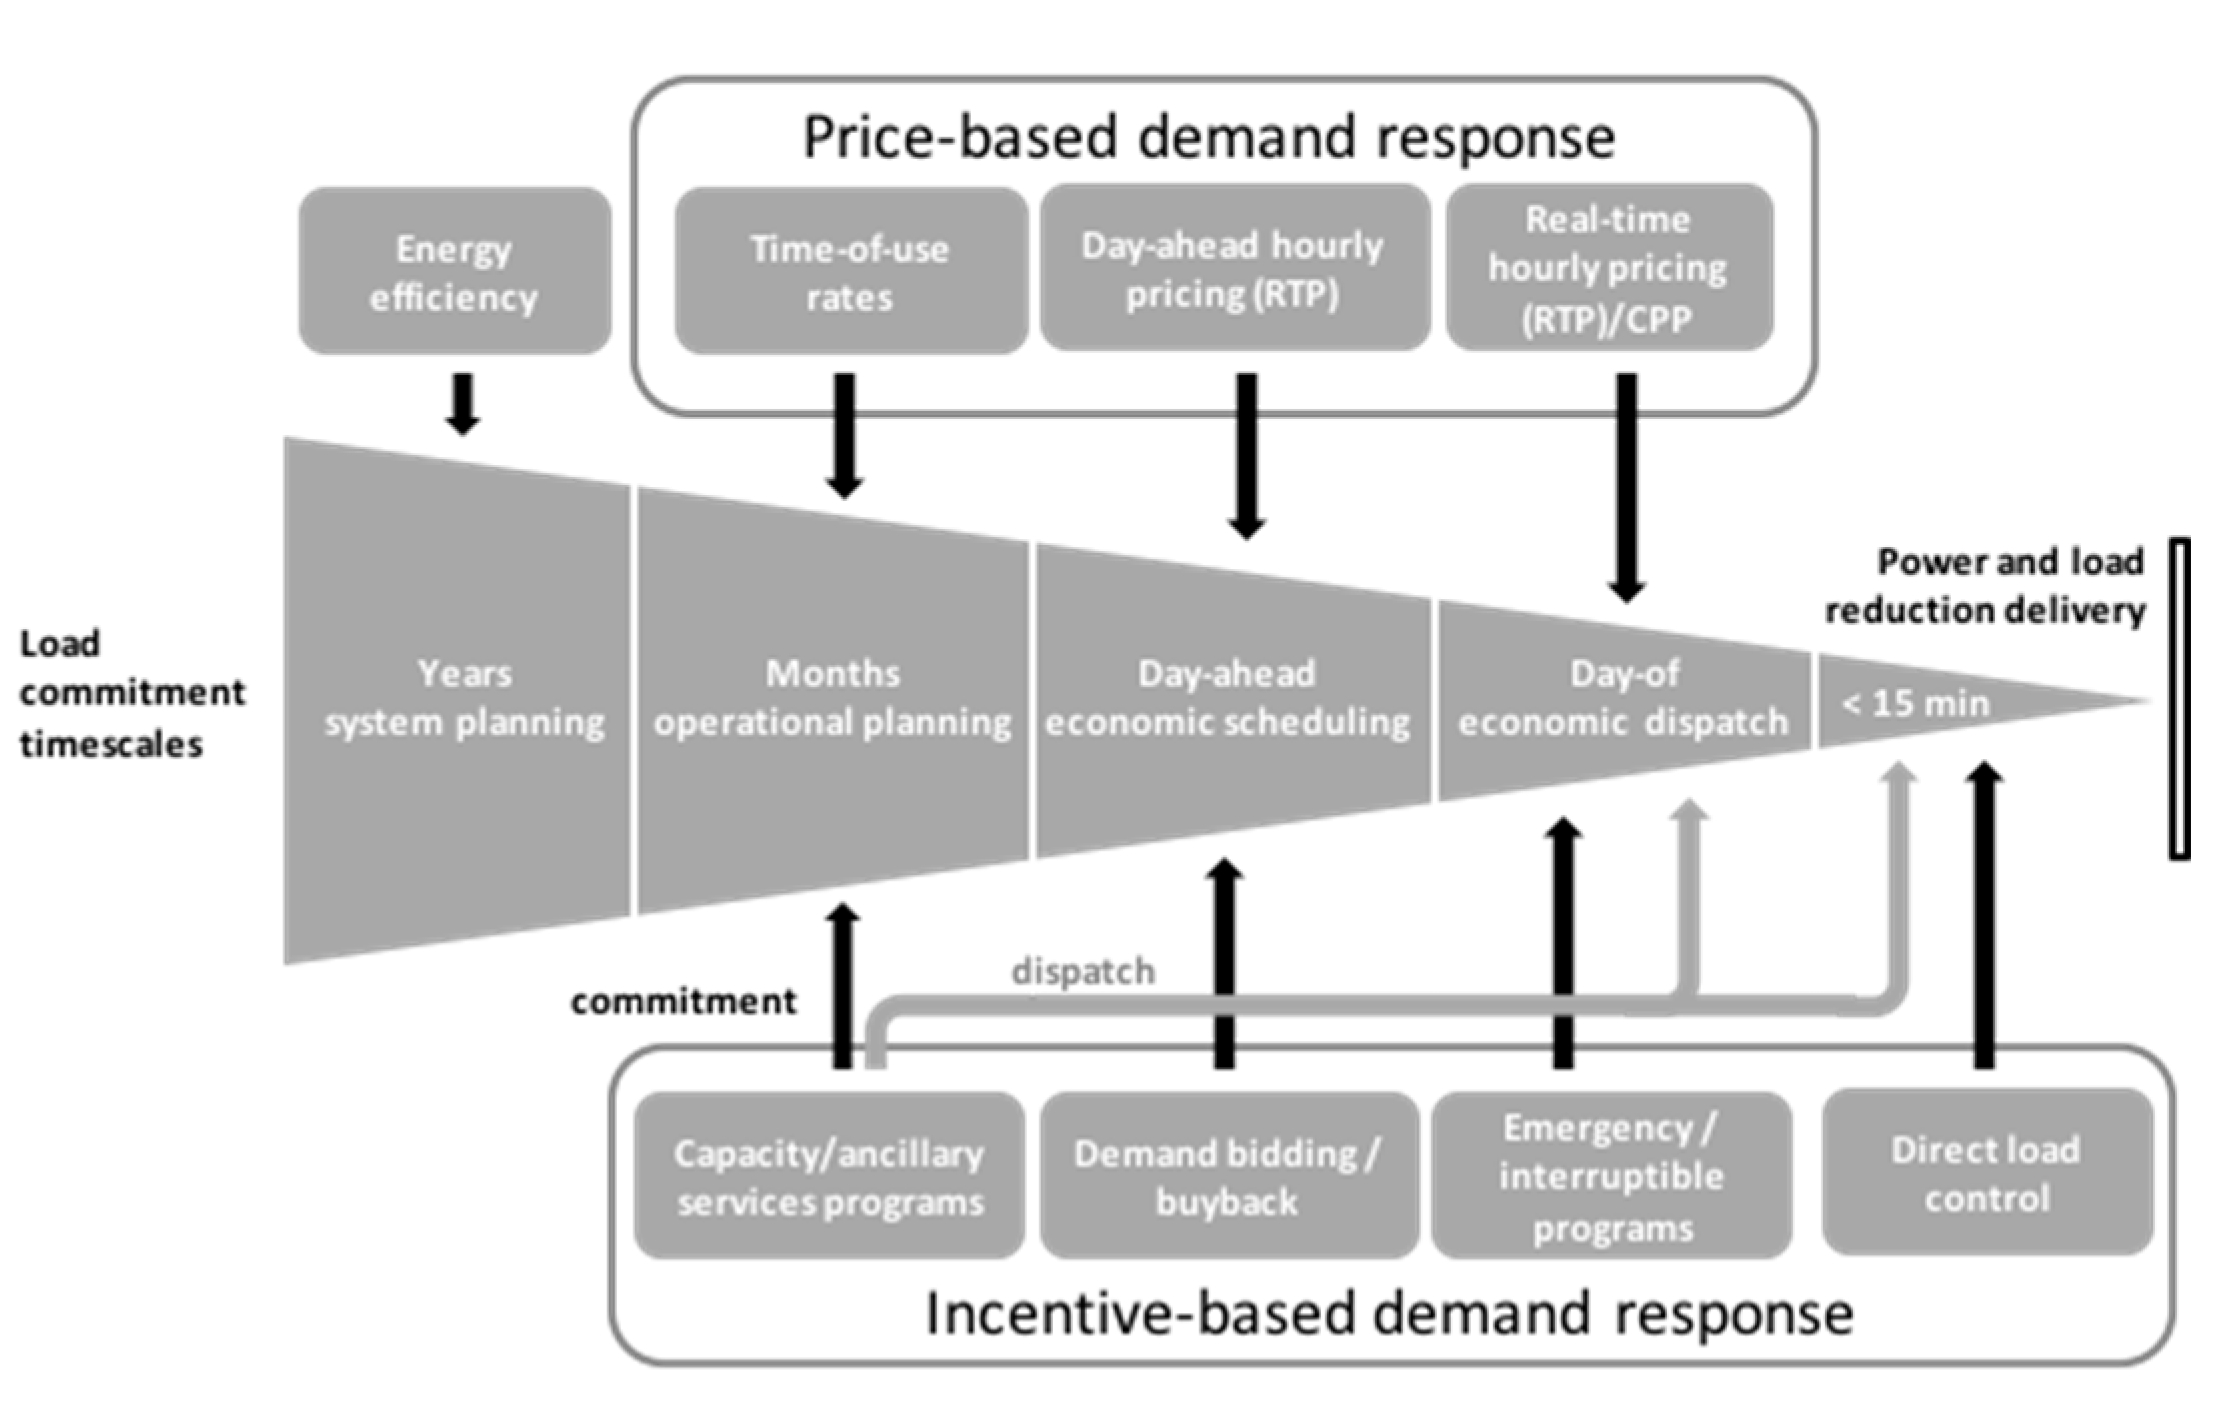
Figure 2.
Demand side devices and systems for electricity consumption management, adapted from [35].
Figure 2.
Demand side devices and systems for electricity consumption management, adapted from [35].

Figure 3.
Model architecture of industrial demand response: (a) architecture, (b) structure of tasks, adapted from [36].
Figure 3.
Model architecture of industrial demand response: (a) architecture, (b) structure of tasks, adapted from [36].

Figure 4.
Contractual framework for delivery of flexibility to DSO/grid company for bottleneck management, adapted from [48].
Figure 4.
Contractual framework for delivery of flexibility to DSO/grid company for bottleneck management, adapted from [48].

Figure 5.
The relationship between the stakeholders in a smart grid with enhanced flexibility, adapted from [48].
Figure 5.
The relationship between the stakeholders in a smart grid with enhanced flexibility, adapted from [48].


Table 1.
Energy consumption in the Danish manufacturing sector [40].
Table 1.
Energy consumption in the Danish manufacturing sector [40].
| Title | Energy Consumption in 1000 GJ | ||
|---|---|---|---|
| Electricity | District Heating | Gas | |
| Denmark, total | 117,366 | 103,744 | 75,290 |
| Manufacturing sector, total | 31,043 | 5910 | 56,081 |
| Manufacturing sector with number of employees | |||
| 0–19 | 1420 | 130 | 1068 |
| 20–49 | 3526 | 422 | 5621 |
| 50–99 | 4466 | 721 | 4226 |
| 100–199 | 5300 | 2306 | 16,342 |
| 200–499 | 8361 | 1408 | 19,443 |
| 500 | 7970 | 923 | 9382 |
Table 2.
Flexible electricity consumption potential [43].
Table 2.
Flexible electricity consumption potential [43].
| Industry | Electricity Consumption, GWh/Year (2001) | Flexibility Potential, MW | ||||
|---|---|---|---|---|---|---|
| Eastern Denmark | Western Denmark | Total | East | West | Total | |
| Agriculture | 405 | 2.150 | 2.555 | 13 | 69 | 82 |
| Food and beverage | 518 | 1.738 | 2.526 | 13 | 43 | 56 |
| Textile | 14 | 194 | 208 | 0 | 4 | 4 |
| Wood industry | 123 | 281 | 404 | 2 | 6 | 8 |
| Paper and printing industry | 228 | 527 | 755 | 5 | 11 | 16 |
| Chemical industry | 1116 | 1.079 | 2.195 | 17 | 16 | 33 |
| Stone, clay and glass industry | 211 | 719 | 930 | 4 | 15 | 20 |
| Iron and steel mills | 528 | 117 | 645 | 26 | 6 | 32 |
| Foundries | 196 | 196 | 0 | 10 | 10 | |
| Iron and metal | 447 | 1.304 | 1.751 | 20 | 59 | 79 |
| Trade & Service | 1.507 | 2.206 | 3.173 | 54 | 79 | 134 |
Table 3.
Potential for load flexibility of different processes in agriculture and industry [44].
Table 3.
Potential for load flexibility of different processes in agriculture and industry [44].
| Energy Consumption Sources | Period (2004–2009) | Flexibility Potential | ||||
|---|---|---|---|---|---|---|
| Energy Consumption (TJ) | Potential % | Total Flexibility Potential (TJ) | Hours | Days | Permanently (TJ) | |
| Lighting | 3.790 | 5 | 190 | 0 | 190 | |
| Pumping | 4.583 | 20 | 917 | 458 | 458 | |
| Cooling/freezing | 3.026 | 50 | 1513 | 1513 | ||
| Ventilation | 8.004 | 30 | 2401 | 2401 | ||
| Compressed and process air | 3.977 | 20 | 795 | 795 | ||
| Electric motors | 10.754 | 5 | 538 | 538 | ||
| Computers and electronics | 378 | 5 | 19 | 19 | ||
| Other electricity consumption | 418 | 0 | 0 | |||
| Total | 34.930 | 6.372 | 5.725 | 458 | 190 | |
Table 4.
Participating companies.
| Smart Grid Stakeholder | Role | Current State | Short Description |
|---|---|---|---|
| Claus Sørensen A/S | Industrial consumer (cold stores/refrigeration) | Active smart energy participant | Implemented demand response infrastructure |
| ITW GSE-AXA Power | Industrial consumer (manufactures/supplies the ground support products to the aviation industry) | Slightly aware of the Smart energy transition | Plan to change the lighting system in the production facilities |
| TREFOR Group | DSO and electricity retailer | Active Smart energy participant | Responsible for grid operation and sells electricity |
| Udvikling Fyn | Energy consulting | Active Smart energy participant | Offers smart energy solutions for the industrial consumers (e.g., light, ventilation) |
Table 5.
Influential factors for smart energy adoption and activities (Claus Sørensen A/S).
| Factor | Description |
|---|---|
| Awareness of multiple contexts |
|
| Return Of Investment (ROI) |
|
| Customer focus |
|
| Company’s brand | The company participates in the network:
|
| Shared support |
|
| Safety and security |
|
| Ease of use |
|
| Dynamic pricing |
|
| Flexibility |
|
| Process improvement |
|
| Awareness of multiple factors |
|
| Energy tariff structure |
|
Table 6.
Influential factors for smart energy adoption and activities (ITW GSE—AXA Power).
| Factor | Description |
|---|---|
| Awareness of multiple contexts |
|
| Company focus |
|
| Community participation | The company may participate in the community if:
|
| Shared support |
|
| Ease of use |
|
| Motivation |
|
| Possibilities for energy flexibility |
|
| ROI | The implementation of energy flexibility solution depends:
|
| Impediments for energy efficiency and flexibility |
|
Table 7.
Influential factors for smart energy adoption and activities (Udvikling Fyn).
| Factors | Description |
|---|---|
| Awareness of multiple contexts |
|
| Safety and security |
|
| Offering |
|
| Shared support |
|
| ROI |
|
| Process improvement |
|
| Ease of use |
|
| Quality improvement (not a primary motivator) |
|
| Customer focus |
|
| Energy management |
|
| Costs |
|
| Inform the customers(about the participation in the community) |
|
| Promote customers participation in the community (sale of the “waste heat”) |
|
| Customer motivation |
|
| Customer Impediment |
|
| Possibilities for energy flexibility |
|
| Impediments for energy flexibility |
|
Table 8.
Influential factors for smart energy adoption and activities (TREFOR).
| Factors | Description |
|---|---|
| Liberalization |
|
| Tariff structure |
|
| Dynamic pricing |
|
| Customer motivation |
|
| Authority requirement |
|
| Market motivation |
|
| Tariff structure | be adjusted not only according to:
|
| Energy management |
|
Table 9.
Impact factors of industrial consumers’ acceptance and continuous participation in Smart Grid.
Table 9.
Impact factors of industrial consumers’ acceptance and continuous participation in Smart Grid.
| Factors | Inscription | Translation | Framing | Stabilization |
|---|---|---|---|---|
| Awareness of multiple contexts | ||||
| Shared support | ||||
| ROI and adoption cost | ||||
| Ease of use | ||||
| Flexibility and dynamic pricing | ||||
| Liberalization | ||||
| Energy tariff structure | ||||
| Customer focus | ||||
| Company’s green image | ||||
| Solution integration | ||||
| Service quality and process improvement |
© 2018 by the authors. Licensee MDPI, Basel, Switzerland. This article is an open access article distributed under the terms and conditions of the Creative Commons Attribution (CC BY) license (http://creativecommons.org/licenses/by/4.0/).
Share and Cite
MDPI and ACS Style
Ma, Z.; Asmussen, A.; Jørgensen, B.N. Industrial Consumers’ Smart Grid Adoption: Influential Factors and Participation Phases. Energies 2018, 11, 182. https://doi.org/10.3390/en11010182
AMA Style
Ma Z, Asmussen A, Jørgensen BN. Industrial Consumers’ Smart Grid Adoption: Influential Factors and Participation Phases. Energies. 2018; 11(1):182. https://doi.org/10.3390/en11010182
Chicago/Turabian StyleMa, Zheng, Alla Asmussen, and Bo Nørregaard Jørgensen. 2018. "Industrial Consumers’ Smart Grid Adoption: Influential Factors and Participation Phases" Energies 11, no. 1: 182. https://doi.org/10.3390/en11010182
Note that from the first issue of 2016, this journal uses article numbers instead of page numbers. See further details here.