Prospects of Appliance-Level Load Monitoring in Off-the-Shelf Energy Monitors: A Technical Review


Department of Informatics (I-13), Bolzmanstr. 3, Technical University Munich, 85748 Garching, Germany
*
Author to whom correspondence should be addressed.
Energies 2018, 11(1), 189; https://doi.org/10.3390/en11010189
Submission received: 14 December 2017
/
Revised: 5 January 2018
/
Accepted: 8 January 2018
/
Published: 12 January 2018
Abstract
:The smart grid initiative has encouraged utility companies worldwide to roll-out new and smarter versions of energy meters. Before an extensive roll-out, which is both labor-intensive and incurs high capital costs, consumers need to be incentivised to reap the long-term benefits of such smart meters. Off-the-shelf energy monitors (e-monitors) can provide consumers with an insight into such potential benefits. As e-monitors are owned by the consumer, the consumer has greater control over the data, which significantly reduces the privacy and data confidentiality concerns. Because only limited online technical information is available about e-monitors, we evaluate several existing e-monitors using an online technical survey directly from the vendors. Besides automated e-monitoring, the use of different off-the-shelf e-monitors can also help to demonstrate state-of-the-art techniques such as non-intrusive load monitoring (NILM), data analytics, and the predictive maintenance of appliances. Our survey indicates a trend towards the incorporation of such state-of-the-art capabilities, particularly the appliance-level e-monitoring and load disaggregation. We have also discussed some essential requirements to implement load disaggregation in the next generation e-monitors. In future, these intelligent e-monitoring techniques will encourage effective consumer participation in the demand-side management (DSM) programs.
1. Introduction
The recent transition in energy policy from traditional fossil fuels to cleaner renewable energy resources has fostered the wide acceptability of green energy technology [1,2]. The smart grid concept is expected to embed the necessary digital intelligence in our electrical system from generation to the transmission, distribution, consumption, and pricing of electrical energy. The discussions regarding the smart grid are often centered on energy generation, for which most of the energy saving is expected [3]. Apart from generation, considerable savings can be achieved through the proper monitoring and planning of efficient energy usage through demand-side management (DSM) [4,5].
The integration of weather-driven renewable energy into the system requires more flexibility in the generation, distribution, and utilization [6]. To some extent, this flexibility can be achieved through advanced metering infrastructure (AMI), providing better load forecasting and anomaly detection [7], and also through proactive grid management [8]. Consumers play an important role in the future grid, as renewables are expected to increase on the demand side. Being at the heart of any smart grid infrastructure, consumers need to gain an adequate understanding of smart metering solutions. Consumers can be incentivized to participate effectively if provided with adequate information to help them understand the potential advantages of the smart grid.
The primary aim of any household or building manager is to intelligently utilize appliances with regard to user comfort and preferences while emphasizing energy efficiency. To manage the amount of energy spent, it is necessary to measure how and where this energy is consumed. Under the smart grid paradigm, the next-generation smart buildings will require bidirectional power and data communication to reduce demand during high wholesale market prices or grid malfunctions [9]. This situation calls for highly interactive metering technologies that act as middleware to seamlessly gather data regardless of the vendor or communication protocol.
The concept of electricity monitoring emerged immediately after the inception of electricity generation and distribution systems during the late 19th century. The first commercial use of electricity was direct current (DC), and electrochemical meters were introduced initially to measure electricity consumption [10]. These meters were labor-intensive as they required the periodic removal and weighing of plates from an electrolytic cell. Electrochemical meters were then replaced by electromechanical meters, also known as induction meters or Ferraris meters [11]. The early electromechanical meters measured charge in ampere-hours and calculated energy consumed during the billing period.
In the beginning, electricity was primarily utilized by lighting systems and to a lesser extent for operating electric loads such as electric motors. As more industries shifted from oil and gas to electricity, there was an enormous increase in energy demand and hence the need to measure electricity use accurately. Modern buildings, both residential and commercial, constitute a major portion of the electricity demand. It is estimated that around 73% of electricity in the United States is consumed by buildings [12]. From 1999 to 2004, the consumption of electricity in the residential sector of European Union (EU) alone has increased by 10.8% [13]. In Europe, the energy consumption in buildings accounts for 41% of the primary energy consumption, for which a major chunk of this primary energy (85%) is utilized to achieve a comfortable room temperature (mostly through oil and gas heating), and the remaining 15% is consumed as electrical energy [14].
With this paper, we explore the different energy monitors (e-monitors) currently available to consumers. The main goal of our work is to help researchers, building managers, and consumers choose the e-monitor best suited for their specific applications. Although some of these e-monitors are appropriate to manage renewables and can provide added features, such as load disaggregation for appliance-level monitoring, they are often overlooked as a result of a lack of available technical data about their capabilities. Similarly, as compared to a smart meter, which is owned by the utility company, the e-monitor is bought and managed by the consumer. The e-monitor allows consumers to have more control over data. The consumer can even share non-private data collected by the e-monitor with the utility company to facilitate in load-forecasting.
The main contributions of this paper are listed below.
- Through our online survey, we directly contacted 54 different companies to obtain technical information regarding 79 different e-monitors.
- We obtained useful information regarding the architecture and operation of 27 e-monitors, a response ratio of 34.1%. Some technical information is not publicly available.
- We also explored the available online literature from 9 companies for 14 different products. These companies did not participate in the survey but provided enough technical information as technical notes.
- We provide an in-depth analysis of non-intrusive load monitoring (NILM) and highlight key requirements for NILM-enabled data acquisition (DAQ) systems. This helped us to understand how the state-of-the-art e-monitors can be upgraded to perform load disaggregation.
The rest of the paper is organized as follows. Section 2 describes the e-monitoring basics with relevant technical details. In Section 3, we explain our survey results, while Section 4 gives an overview of NILM. Section 5 lists key requirements of any DAQ system capable of performing load disaggregation, and Section 6 includes key findings and suitable suggestions for choosing e-monitors. In Section 7, we conclude our study.
2. Basic Energy Monitoring
Before going into detail, it is necessary to differentiate between a smart meter and an e-monitor. A smart meter is the next-generation meter capable of linking a building with the utility company to enable two-way communication and power exchange between them [15]. A smart meter also assists in remote billing and instant load feedback to the utility for load forecasting. As it is owned by the utility, the smart meter comes with inherent drawbacks related to data confidentiality and privacy [16,17,18]. On the contrary, an e-monitor is owned by the consumer and works independently alongside existing energy meters, without any direct effect on the billing. E-monitors are preferred because of their ability to observe energy consumption patterns in real-time through a user-friendly visual interface, and they are helpful in making informed energy-conservation decisions. They can be easily installed by clipping their current sensors around a current-carrying wire or directly inserting them into a power plug. As a result of local and private cloud storage, the e-monitor can minimize privacy concerns and added features, such as disaggregation and the efficient integration of renewables, and can encourage consumers and building managers to participate in DSM effectively.
For a fair comparison, it is important to view how different vendors and platforms measure and calculate energy consumption. For load monitoring, there are two main categories of e-monitors available on the market: single- and multi-point e-monitors. The single-point e-monitors capture the aggregate energy consumption of the whole house, building or industrial facility. The multi-point e-monitors constantly capture measurement data at several locations and are preferred for detailed load monitoring, such as monitoring the power usage of individual appliances. Monitoring at the appliance-level can result in more engaged consumer participation as consumers can better identify power-hungry appliances and accordingly manage their peak load. For a rational comparison of e-monitors, we have outlined six dimensions, the types of parameters, the sampling frequency, the accuracy, the resolution, the application area, and the cost of monitoring equipment on which we base our comparisons.
2.1. Parameter Type
Except for voltage and current, most of the parameters (if utilized) are calculated using standard mathematical formulations. These parameters are derived internally, and for the most part, a subset of these parameters is utilized and displayed to consumers. Some basic parameters are described below.
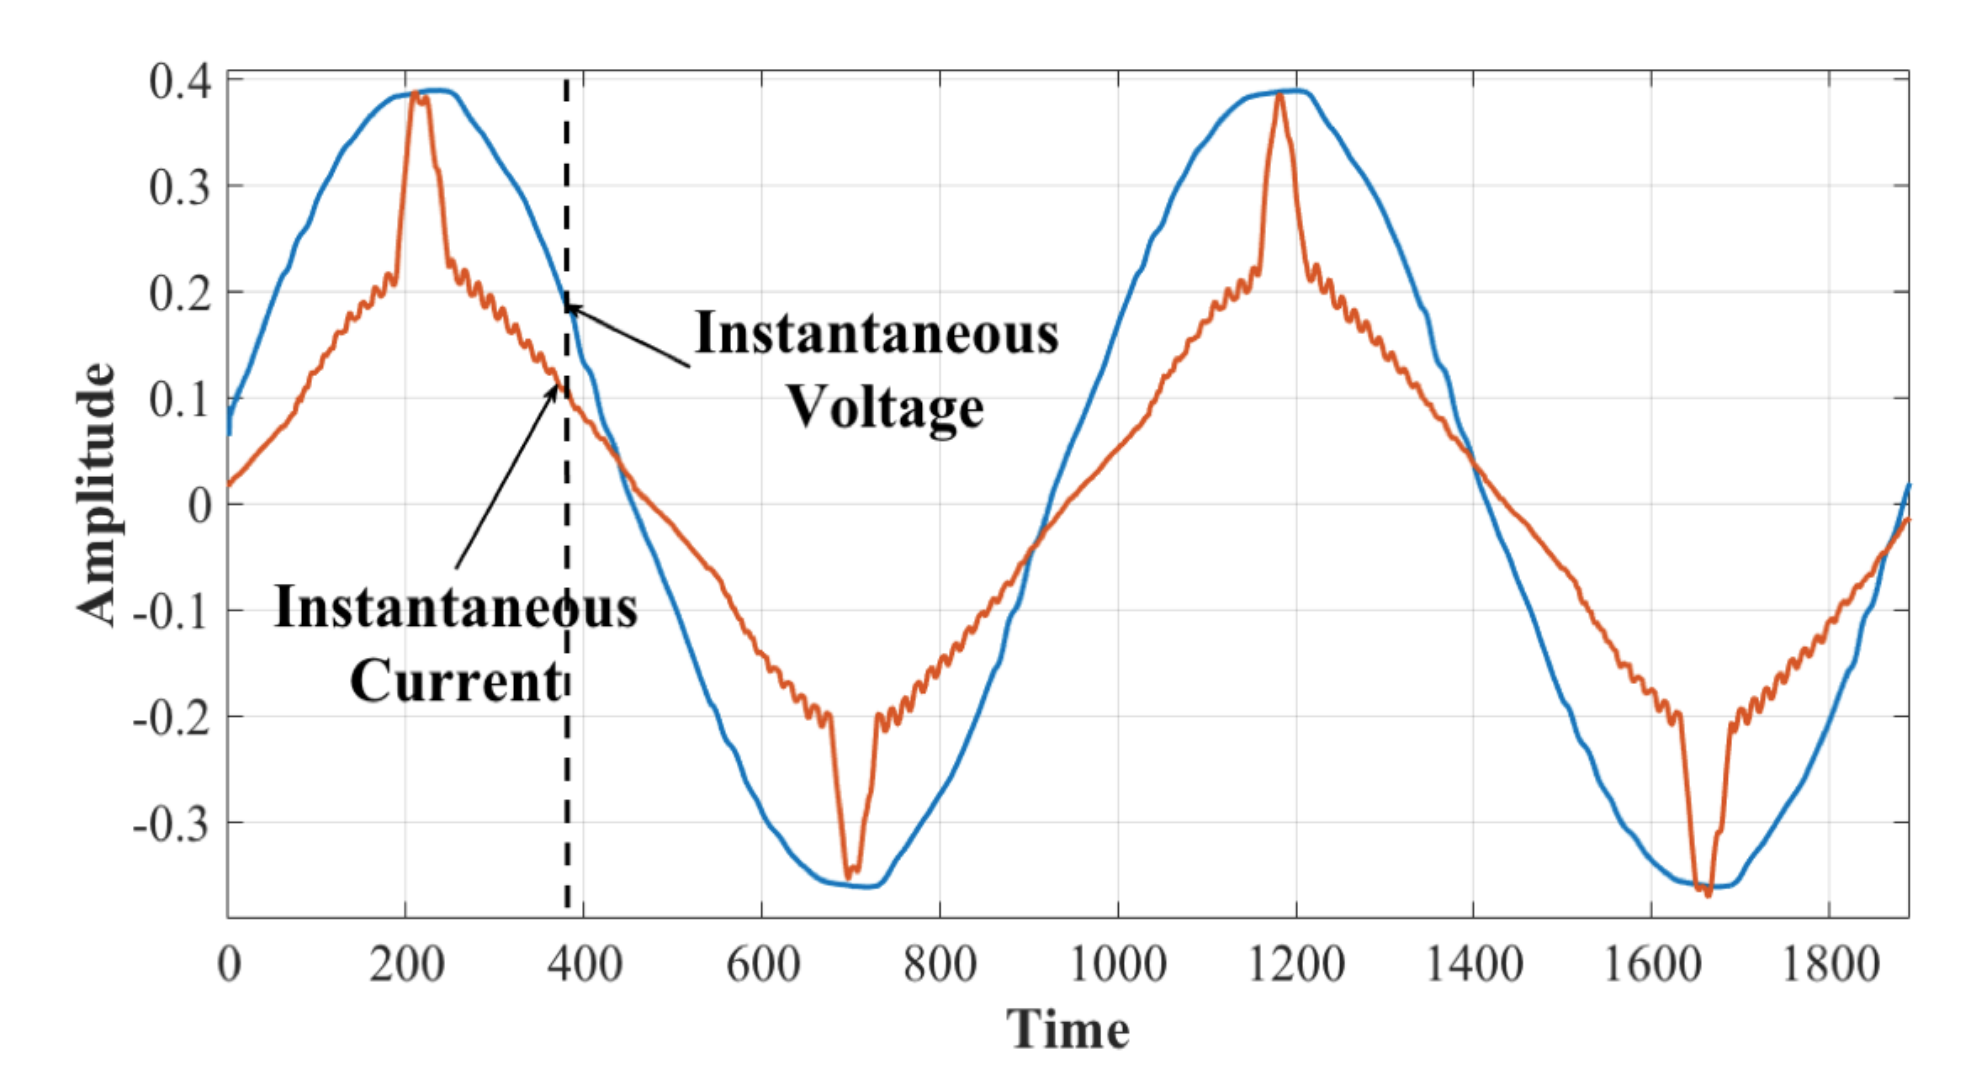
2.1.1. Voltage and Current Waveform
Voltage waveform measurement assists in making corrective measures against harmful low and high voltage levels. Usually, the voltage transformers (AC–AC adaptors) are used to measure the peak and root-mean-square (RMS) voltages of the line. Unlike the voltage waveform, the current waveforms are not stable sine waves; they vary considerably depending upon the type of operating load, as illustrated in Figure 1. Each load type (resistive, inductive or capacitive load) has a different influence on the current curve, and often the inrush current features are used for appliance segregation using NILM.
2.1.2. Power and Power Factor
The main feature used by almost every energy-metering device is the real power. This is the true rate at which energy is used and is calculated through the voltage and current measurements [19]. Similarly, the power factor is used to distinguish between resistive, inductive and capacitive appliances. It determines the phase difference caused by the inductive and capacitive components. A positive phase angle indicates a net inductive reactance of the circuit, where the current lags voltage. On the contrary, a negative phase angle indicates a net capacitive reactance of the circuit as the current leads the voltage.
2.1.3. Harmonics
Harmonics or higher-frequency components occur as a result of pulsating devices (such as frequency drive, electric welders, etc.), resulting in system heating and overvoltage [20]. The harmonics are created by different electronic components present in the appliance circuitry. They produce a new distinct waveform as a result of the superposition of different harmonics. The fast Fourier transform (FFT) resolves the superimposed waves into their constituent waves. In e-monitors, another term commonly associated with harmonics is the total harmonic distortion (THD). This refers to the presence of harmonic distortion caused by the non-linear loads. THD determines the power quality of the system, where a lower THD indicates a reduction in heating, peak currents, and losses [21]. As a result of these distinctive features, the higher-order harmonics are useful for power disaggregation applications.
2.2. Resolution
The resolution is determined by the number of bits of the analog to digital converters (ADCs) and defines the number of codes that can be formed digitally using these bits. Because the voltage and current signals are continuous in nature (analog), to calculate the other set of features (e.g., real power, RMS voltage and current, power factor, etc.), analog signals need to be converted to digital signals. The uncertainty in the digital signal is determined by the measurement accuracy in the analog input and is known as the resolution of the signal. The resolution is determined by the number of bits used to represent each variable (bits of ADCs), which defines the quantization levels and hence the uncertainty.
2.3. Sampling Frequency
For e-monitoring, the choice of any specific sampling frequency or sampling rate depends upon the amount of information we are interested in obtaining from these signals. The sampling frequency may range from the hourly reading to the high-frequency (MHz) range. In general, to observe the harmonics and transient switching response of the appliances, it is better to utilize a higher sampling frequency. It is also important to mention that the sampling done for analog to digital conversion might not be the same as samples reported for display. Although all e-monitors have a sampling rate sufficient to satisfy the Nyquist criteria and accurately calculate the consumed power, most of the modern e-monitors downsample to lower sampling rates to reduce storage requirements.
2.4. Accuracy
The accuracy is determined by the difference between the measured and the true consumption. A study on commercial smart meters indicated an accuracy of around 99.96% within a +/−2% accuracy range [22]. Generally, the accuracy is considered the most specified feature for any meter, and often a 0.5% minimum accuracy is considered adequate for revenue billing [20]. The inaccuracies mainly stem from the ADCs and transformers (both voltage and current). The ADCs introduce a quantization error, which can be reduced using a higher-bit ADC corresponding to the smaller step-size.
2.5. Application Environment
The e-monitors are utilized almost everywhere electricity monitoring is required, but how they are utilized differs on the basis of the area of application. The residential sector consists of housing units; the commercial sector consists of non-manufacturing business establishments (e.g., warehouses, hotels, restaurants, etc.), and the industrial sector consists of manufacturing units with fixed machinery (e.g., motors, drives, generators, etc.) [23]. In residential and commercial buildings, the aggregate load is mostly monitored using electromechanical meters. This single-point sensing can be single- or three-phase monitoring at the whole house or building level. If one is interested in more detailed energy consumption information, circuit-level monitoring can be applied, which can be termed as multi-point energy sensing.
2.6. Cost
Cost is one of the most important factors when purchasing an e-monitor. A large-scale longitudinal survey was carried out by the Department of Energy and Climate in the United Kingdom to estimate the cost of different monitoring solutions for electricity and gas. The survey results recommend three different e-monitoring packages ranging from £210 to £950 per dwelling [24].
3. Survey and Comparison Results
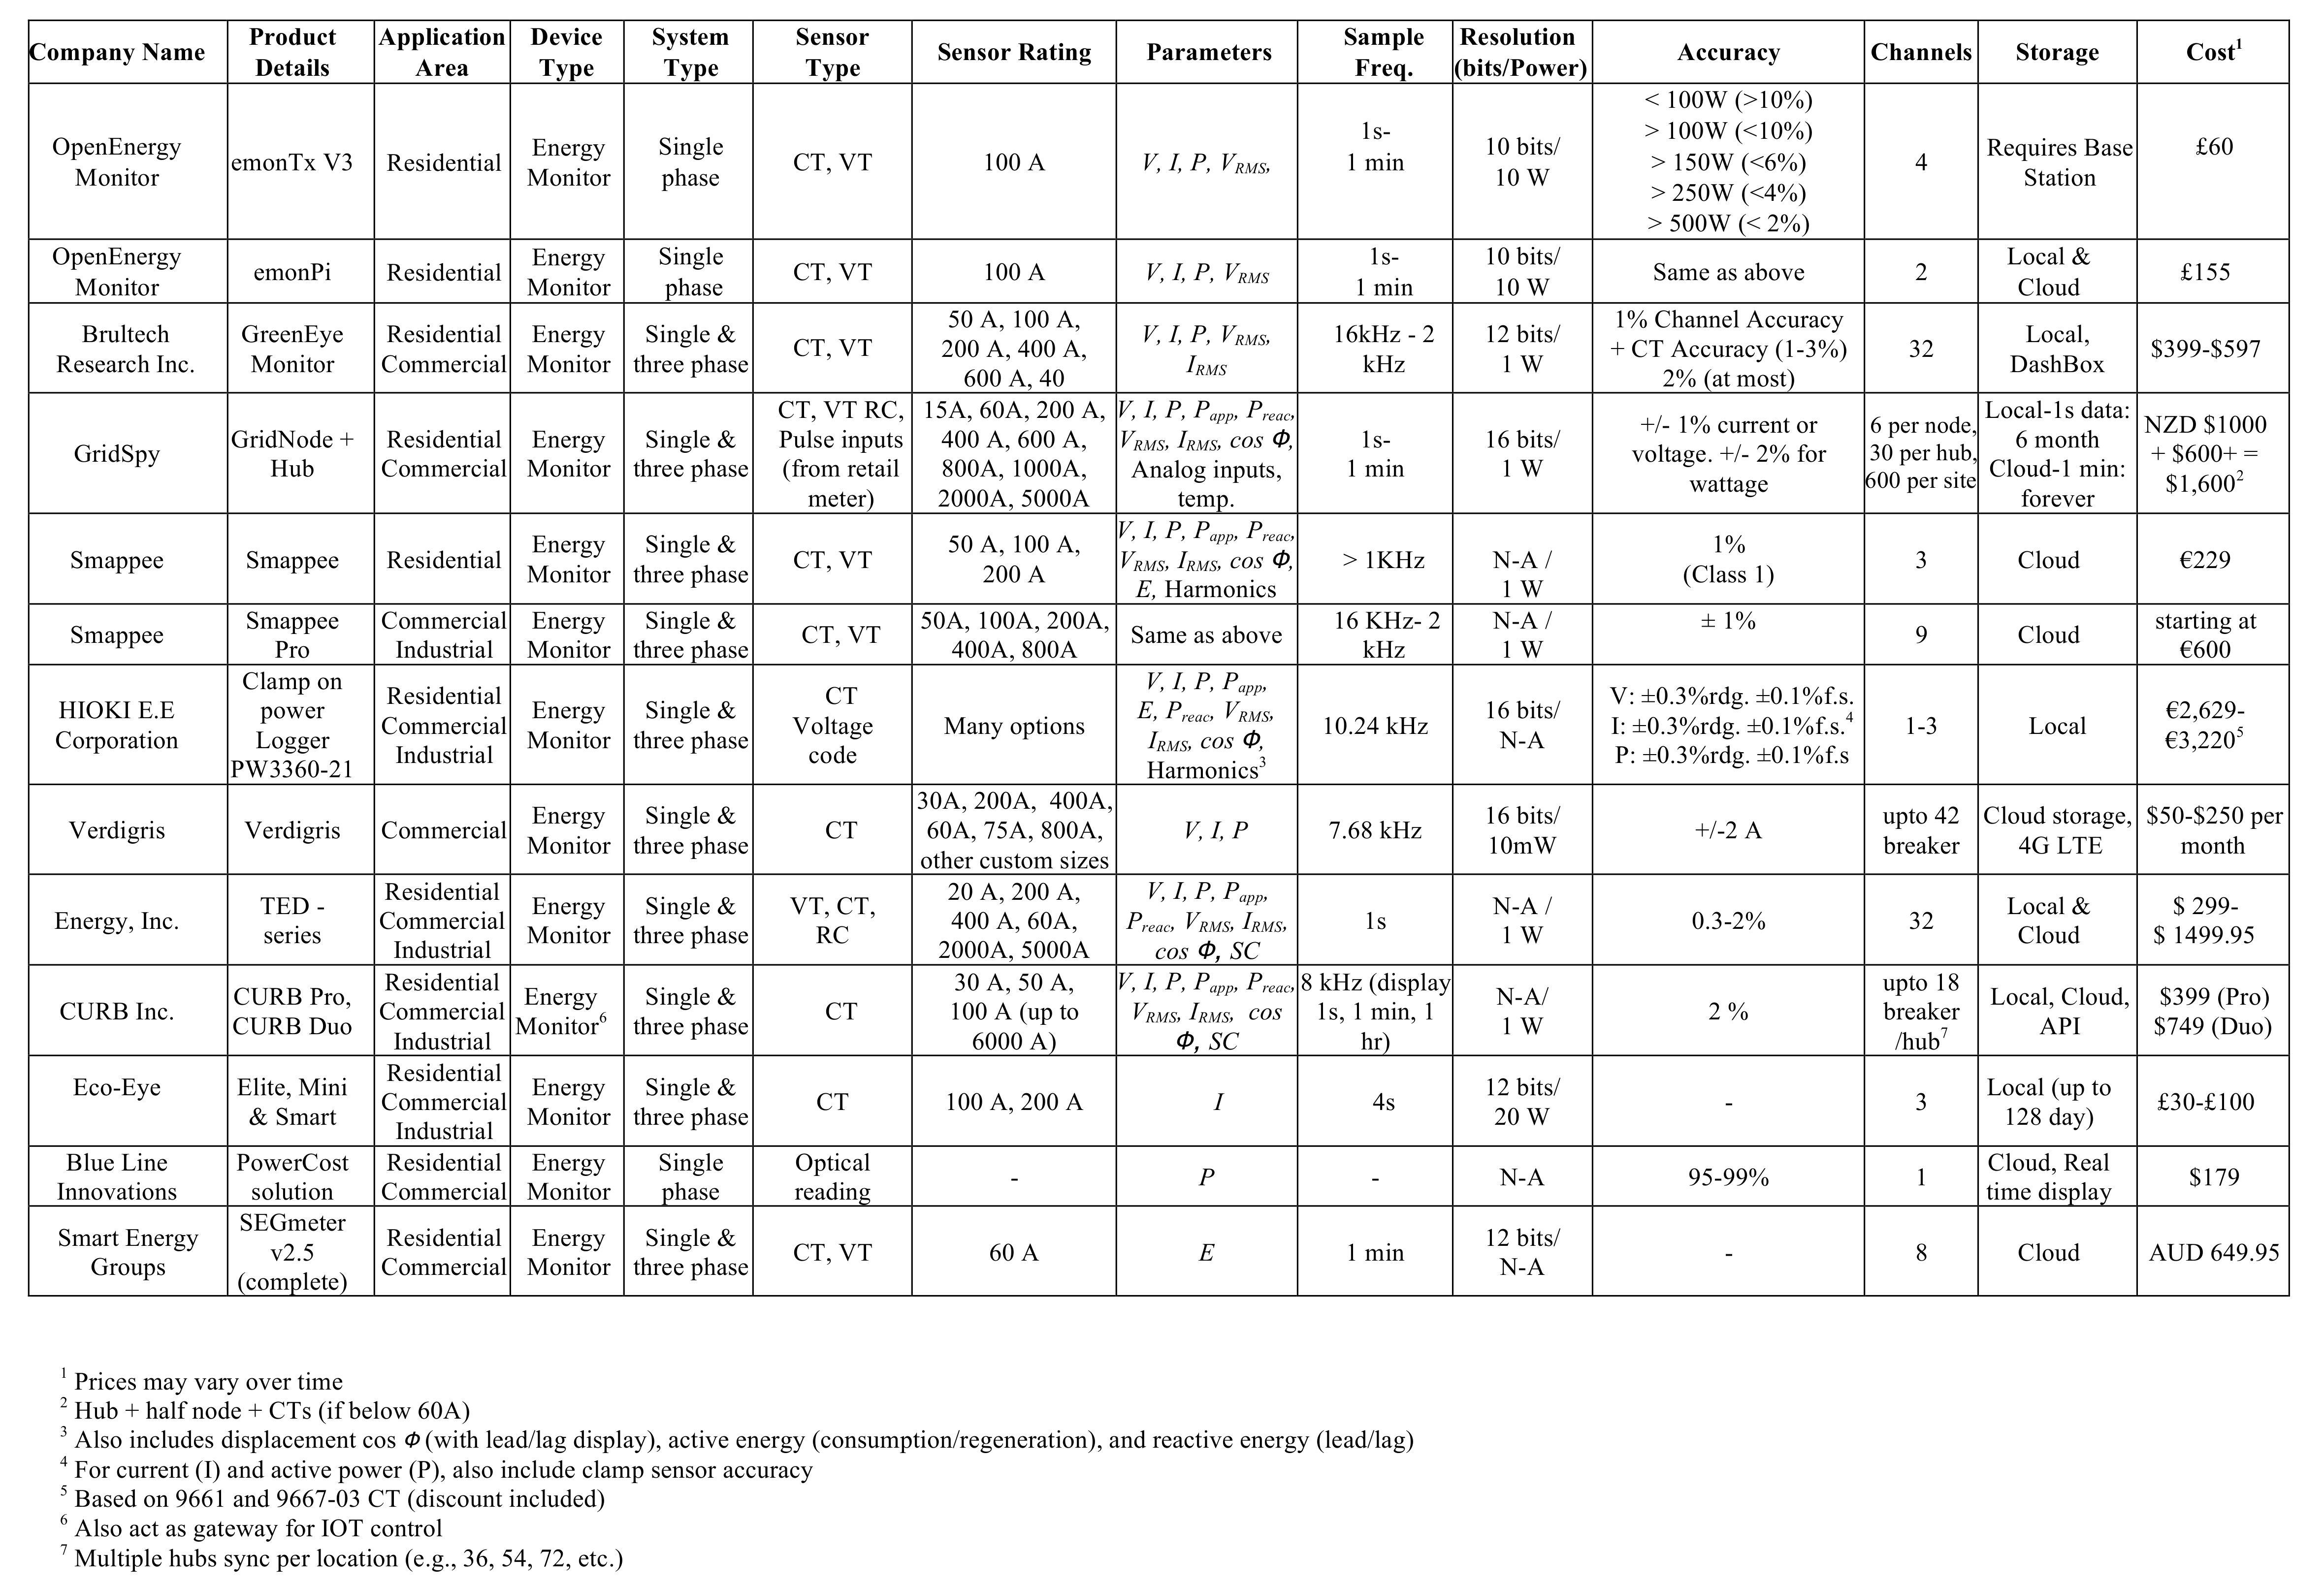
For this research, we conducted a comprehensive online survey [25] of various e-monitoring solutions available on the market. The purpose of the online survey was to obtain detailed technical information regarding e-monitors, as limited information is publicly available. A total of 54 different companies were shortlisted and invited to participate in the survey. The survey included 79 different e-monitors, all of which were off-the-shelf monitors and hence owned directly by the customers. For three respondents, we were not allowed to publish the data, but their information is included in the results. We received responses from 18 companies for 27 e-monitors through the online forms, a response ratio of 34.1%. We further collected information from 9 companies on their 14 e-monitors through online literature. In the survey, we grouped similar monitors from the same vendor together. For complete data, please refer to our technical note in Appendix A.
3.1. Application Environment
We identified the applications of the available e-monitors and divided these into three main categories: residential, commercial (including buildings and offices) and industry. Some of these e-monitors could be deployed in multiple environments. According to the survey, more than 90% of the e-monitors could be utilized in the residential sector, while over 60% could be utilized for commercial use. Similarly, more than 30% of the e-monitors could be utilized for industrial use.
3.2. Monitor Categories
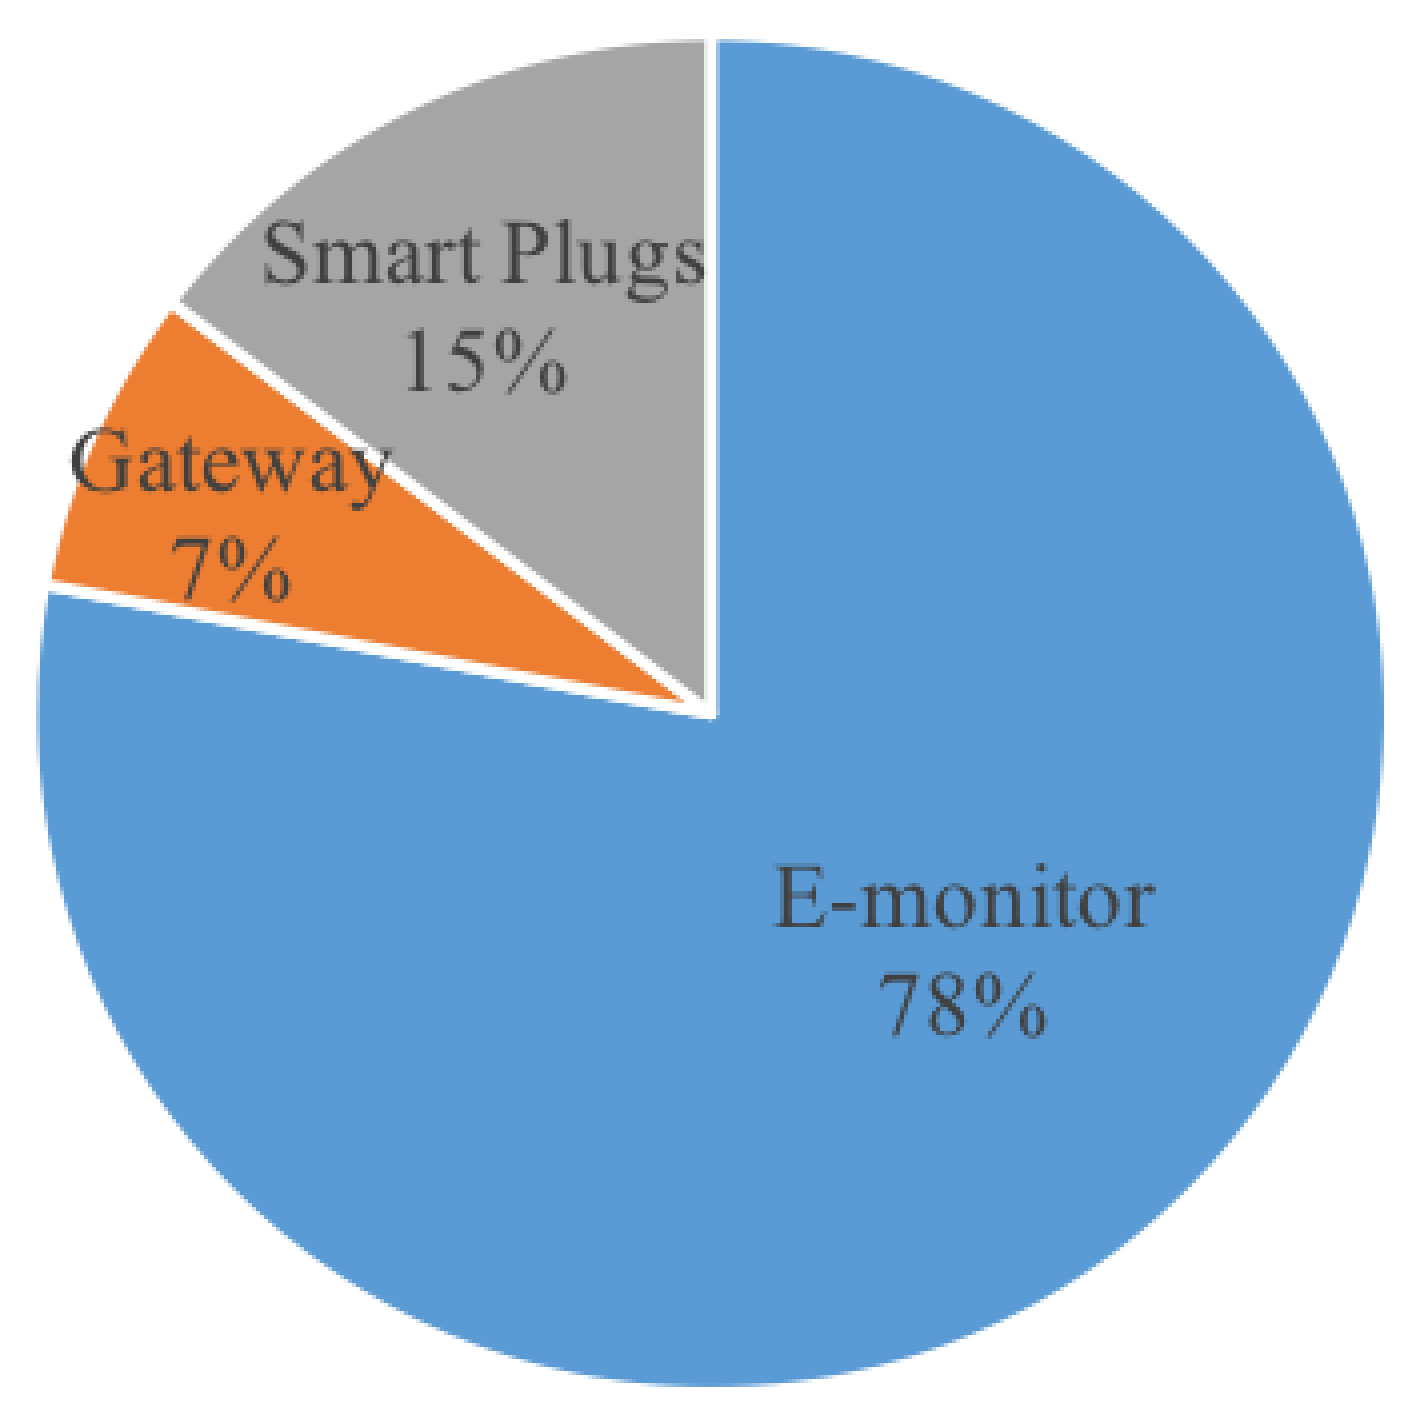
For our survey, we categorized different monitors on the basis of their installation and measurement position in the electrical network of buildings. These included smart plugs, which are mounted on the wall outlet to measure individual end appliances. These smart plugs are utilized for the collection and validation of turn-on/off events to establish ground truth, to verify the load disaggregation algorithms. The smart e-monitors, such as smart-me, are installed between the electricity mains and distribution box inside the building. Because these monitors were owned and controlled directly by the customer, they were included in the survey. The majority of the e-monitors included in this study were installed in the fuse box or attached directly to the electric main and meters. These e-monitors usually incorporated electricity monitoring and analytics aimed at reducing the monthly electric bill through effective customer participation. This study also includes the gateways installed between the e-monitoring unit and the Internet to upload information directly to a cloud. Over 75% of the surveyed e-monitors included e-monitors followed by the smart plugs (Figure 2).
3.3. System Compatability
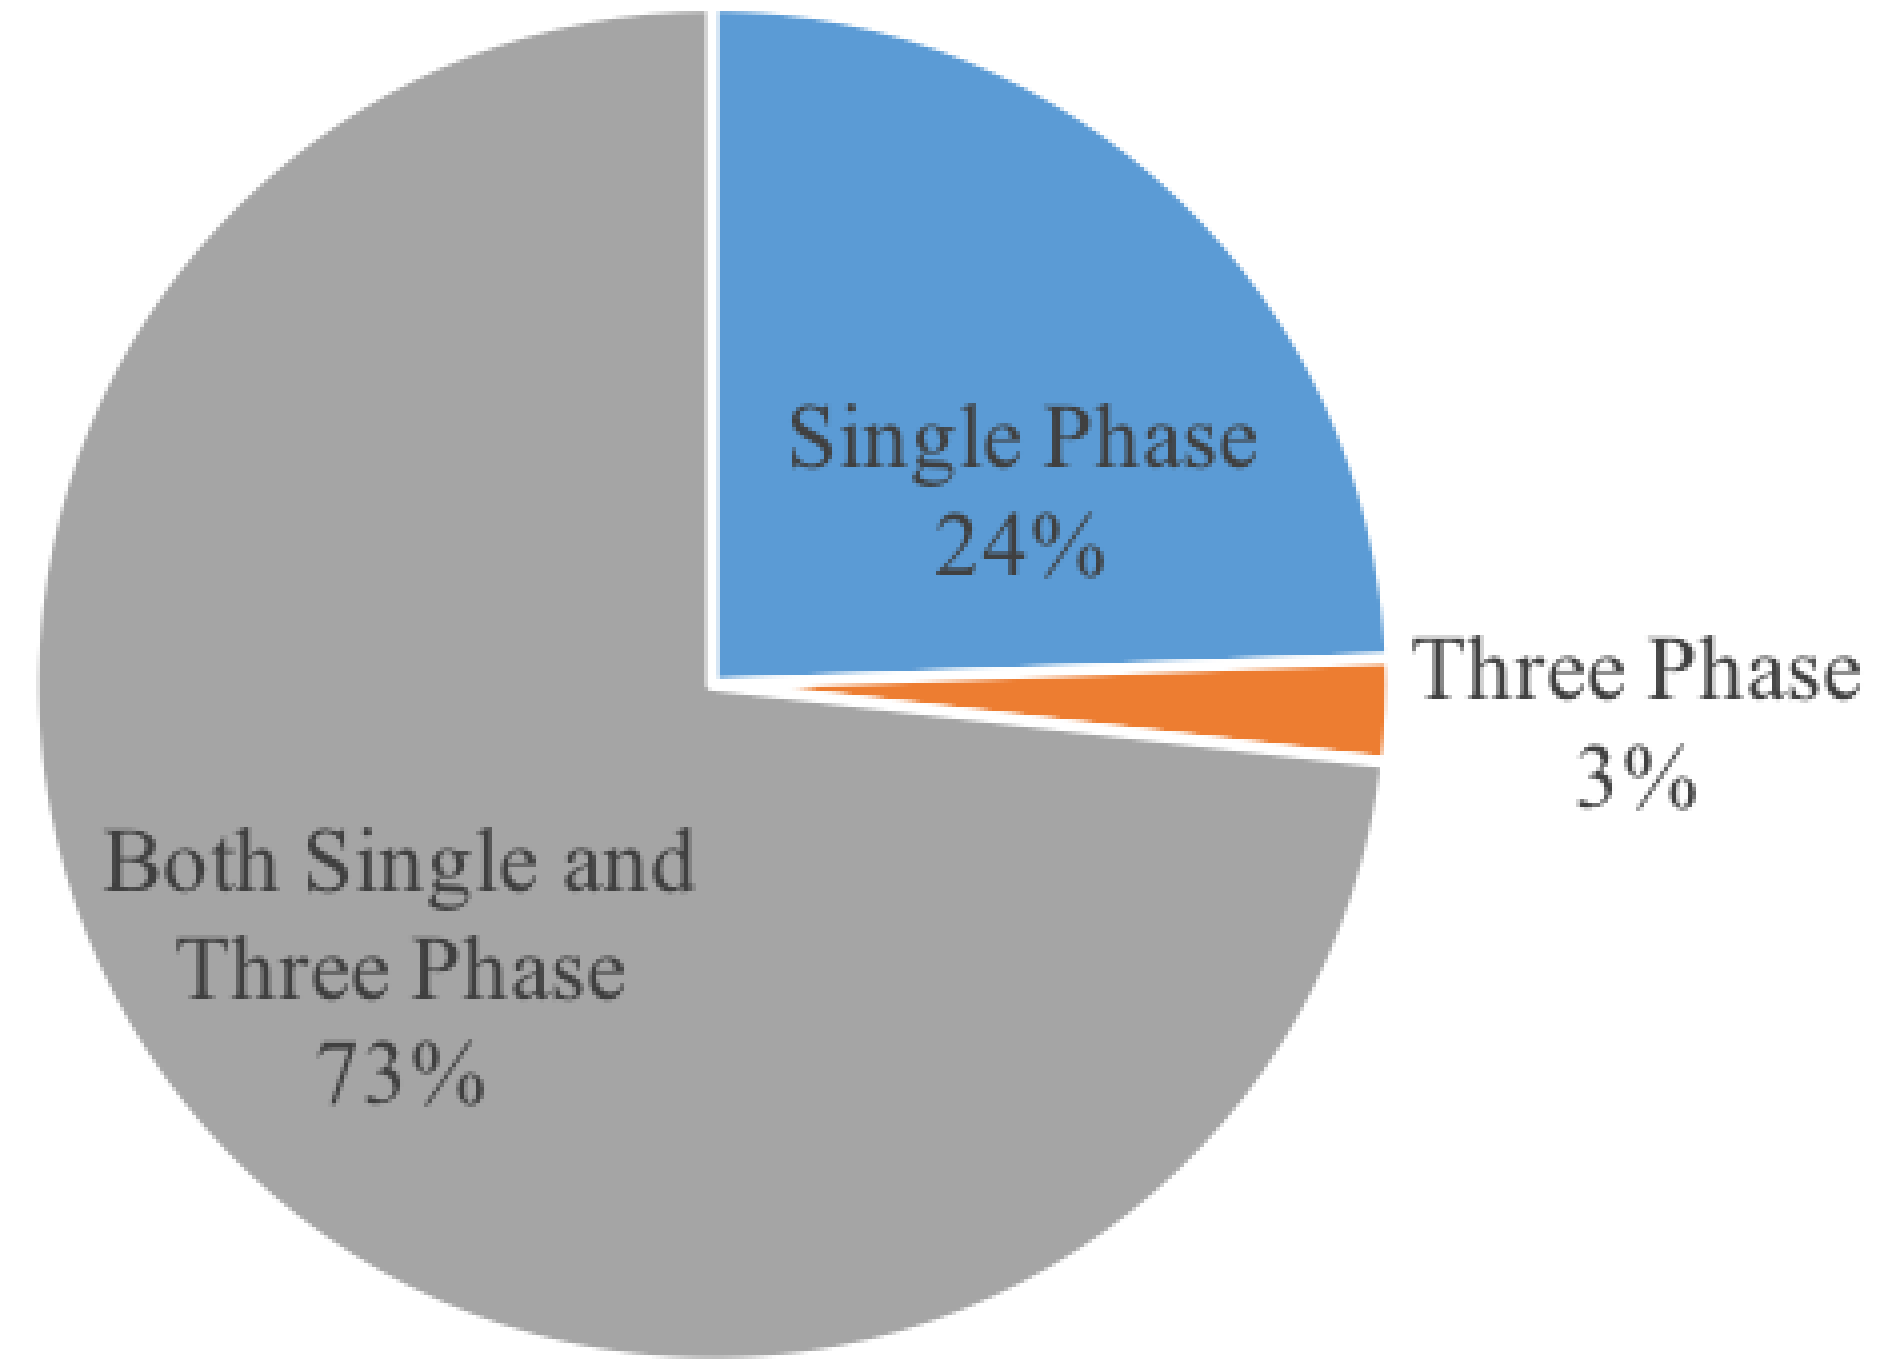
We surveyed the different monitoring solutions and their compatibility with either single- or three-phase systems. According to our survey, over 70% of the e-monitors were compatible with both single- and three-phase systems (Figure 3). The single-phase e-monitors could be scaled to three phases by using multiple units, and they could be calibrated using a pure resistive load so that the voltage and current curves did not mismatch.
3.4. Sensor Type
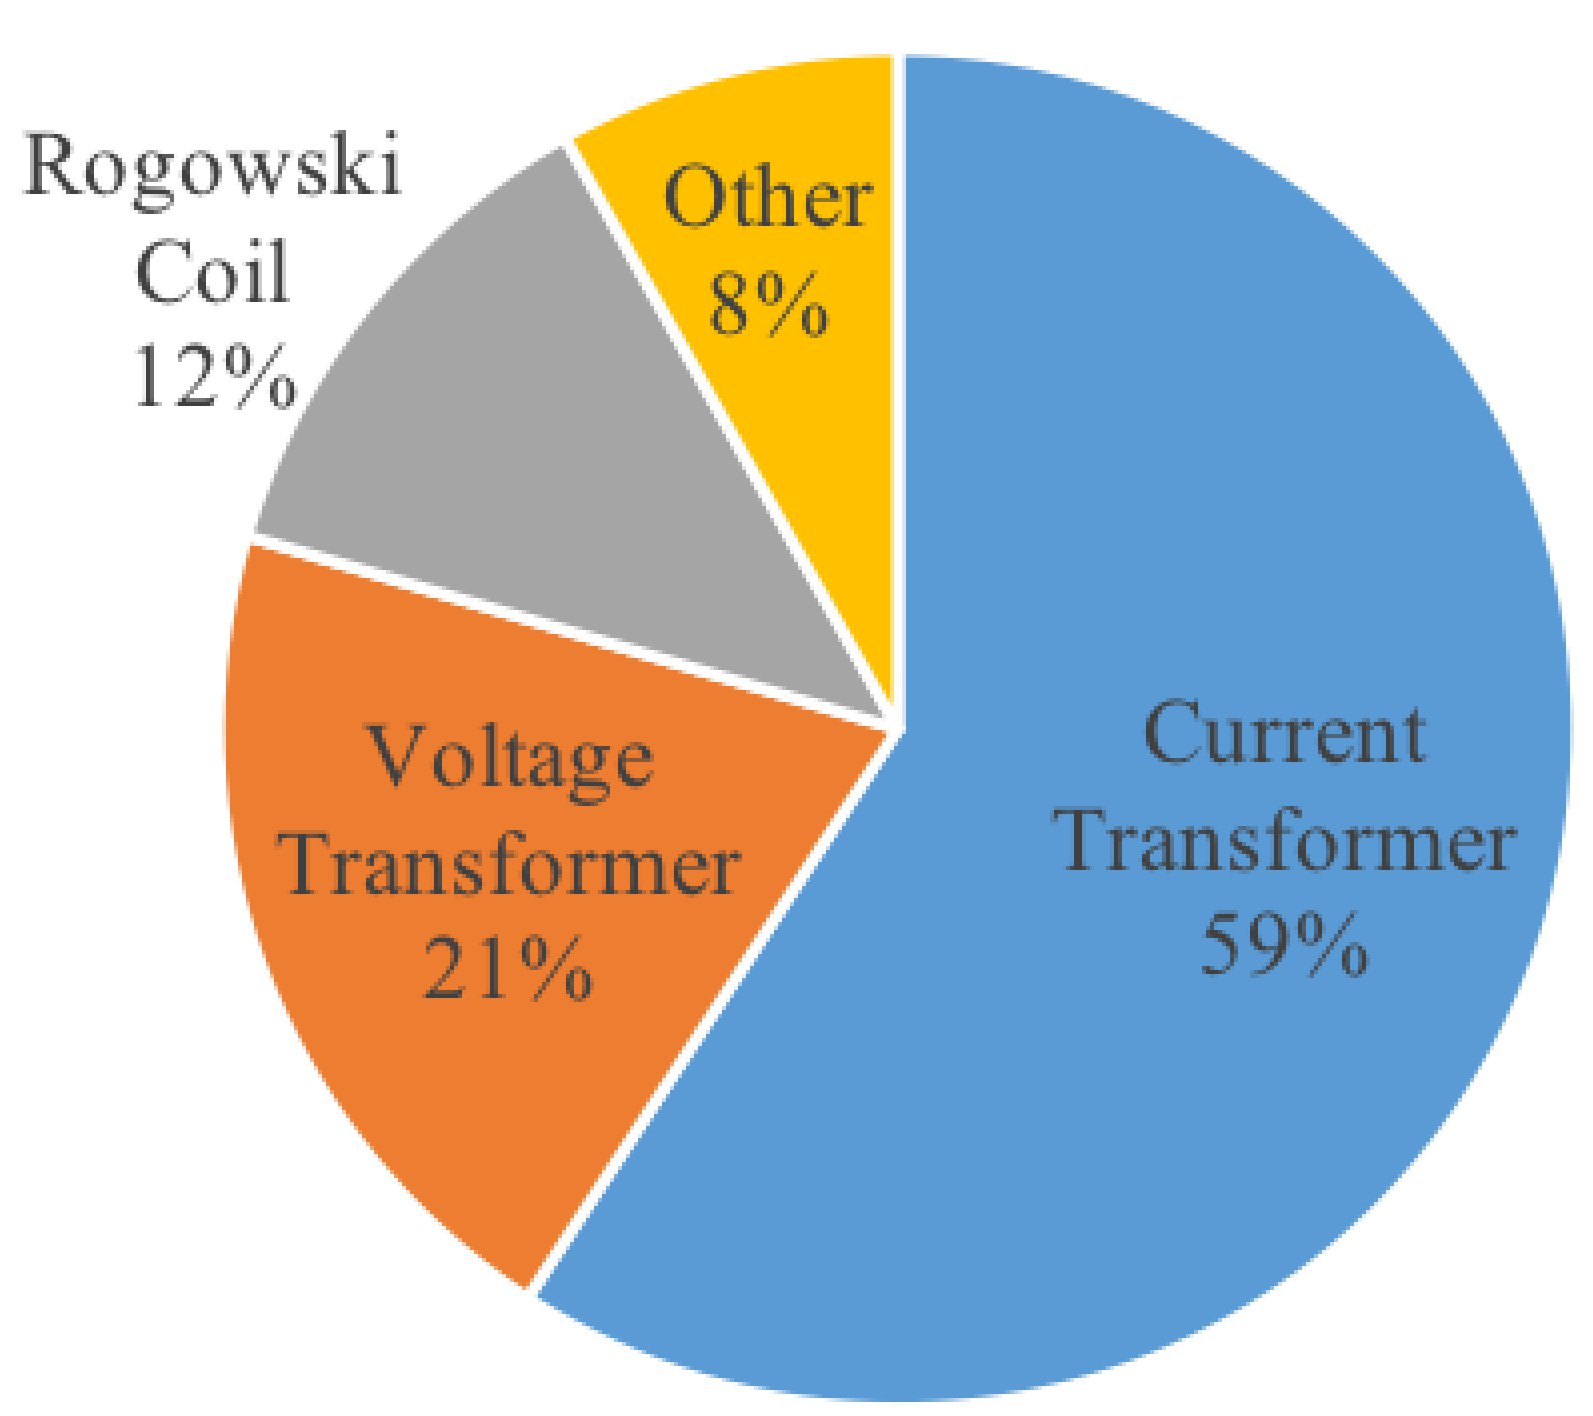
Some e-monitors only measure the current of the system while assuming a constant voltage; for three-phase systems, it is essential to include the voltage for at least one phase, if not for all phases. The three phases are ideally considered balanced, but if the load is not evenly distributed in each phase, which is very often the case, then different phases tend to have different voltages. The survey results indicate that nearly 60% of the monitoring systems used current transformers (CTs) and some utilized Rogowski coils for the measurement of the current (Figure 4).
Although Rogowski coils are safer to use than regular CTs and offer a broader measurement range, they are still underutilized. A recent study [26] compared Rogowski coil-equipped digital meters with Ferraris principle-based electromechanical meters. The experiments indicated an increased reading of 376% as compared to conventional meters, which was mainly caused by electromagnetic interference in digital meters. A higher cost, as compared to the CT, is also a factor for the underdeployment of Rogowski coils. It is also noteworthy that only 21% of the e-monitoring solutions independently measured voltage. Some monitoring solutions directly used a shunt, pulse count, and optical measurement from the meter (see Appendix A).
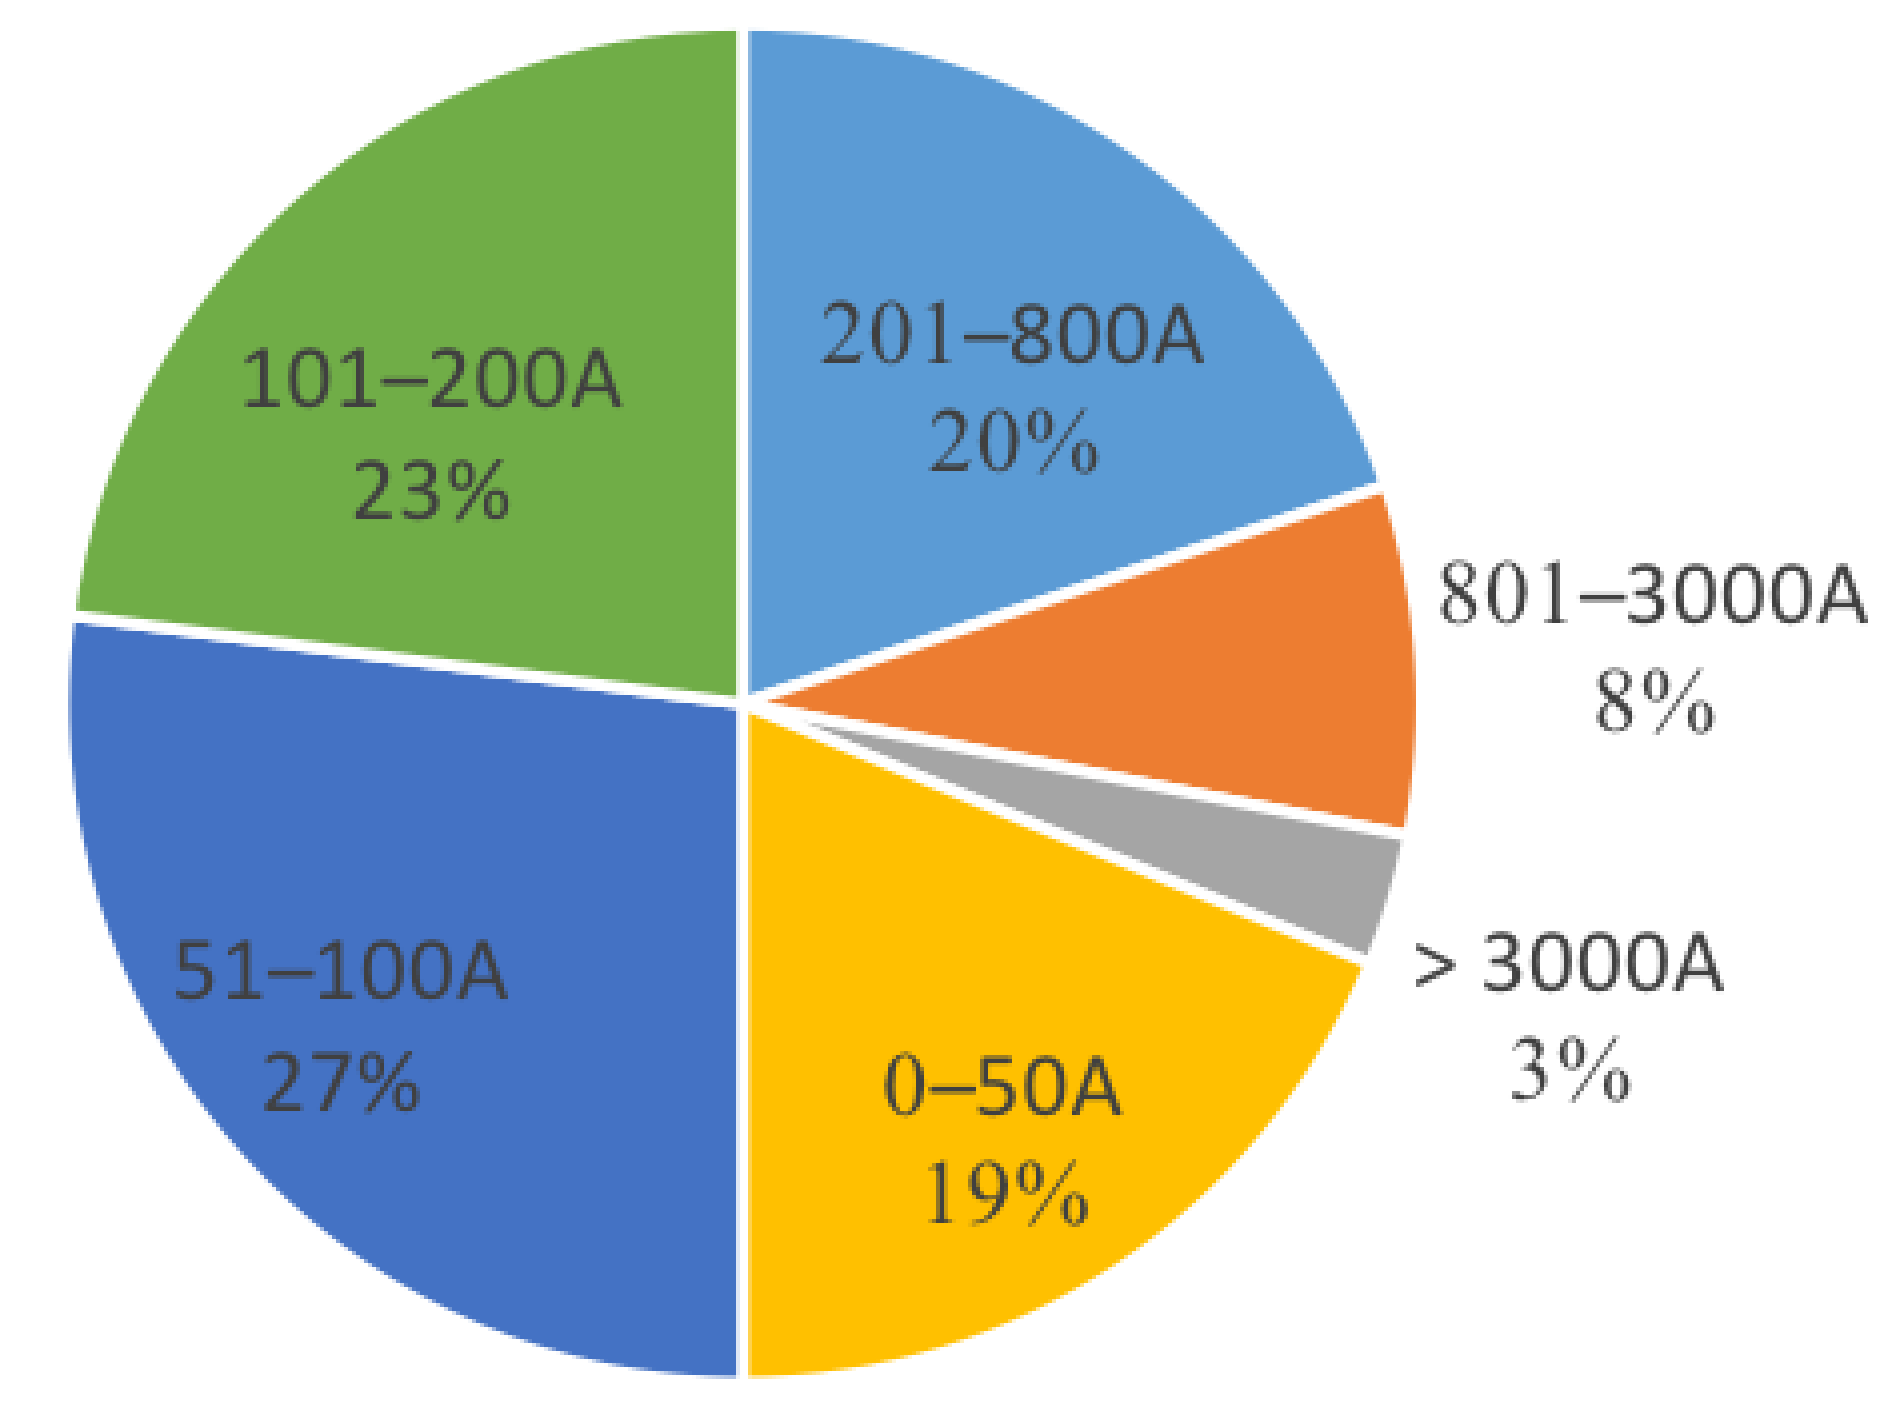
3.5. Sensor Rating
The type of sensor utilized depends on the application and is defined by the maximum load to be measured. A CT consists of an iron core with primary and secondary coils wrapped around it. The survey results indicate a wide variety of CTs utilized by different e-monitors (Figure 5). The results also indicate that around 70% of the CTs were rated up to 200 A. This was due to the extensive use of e-monitors in the residential sector, for which the maximum load at any given time does not typically exceed 200 A.
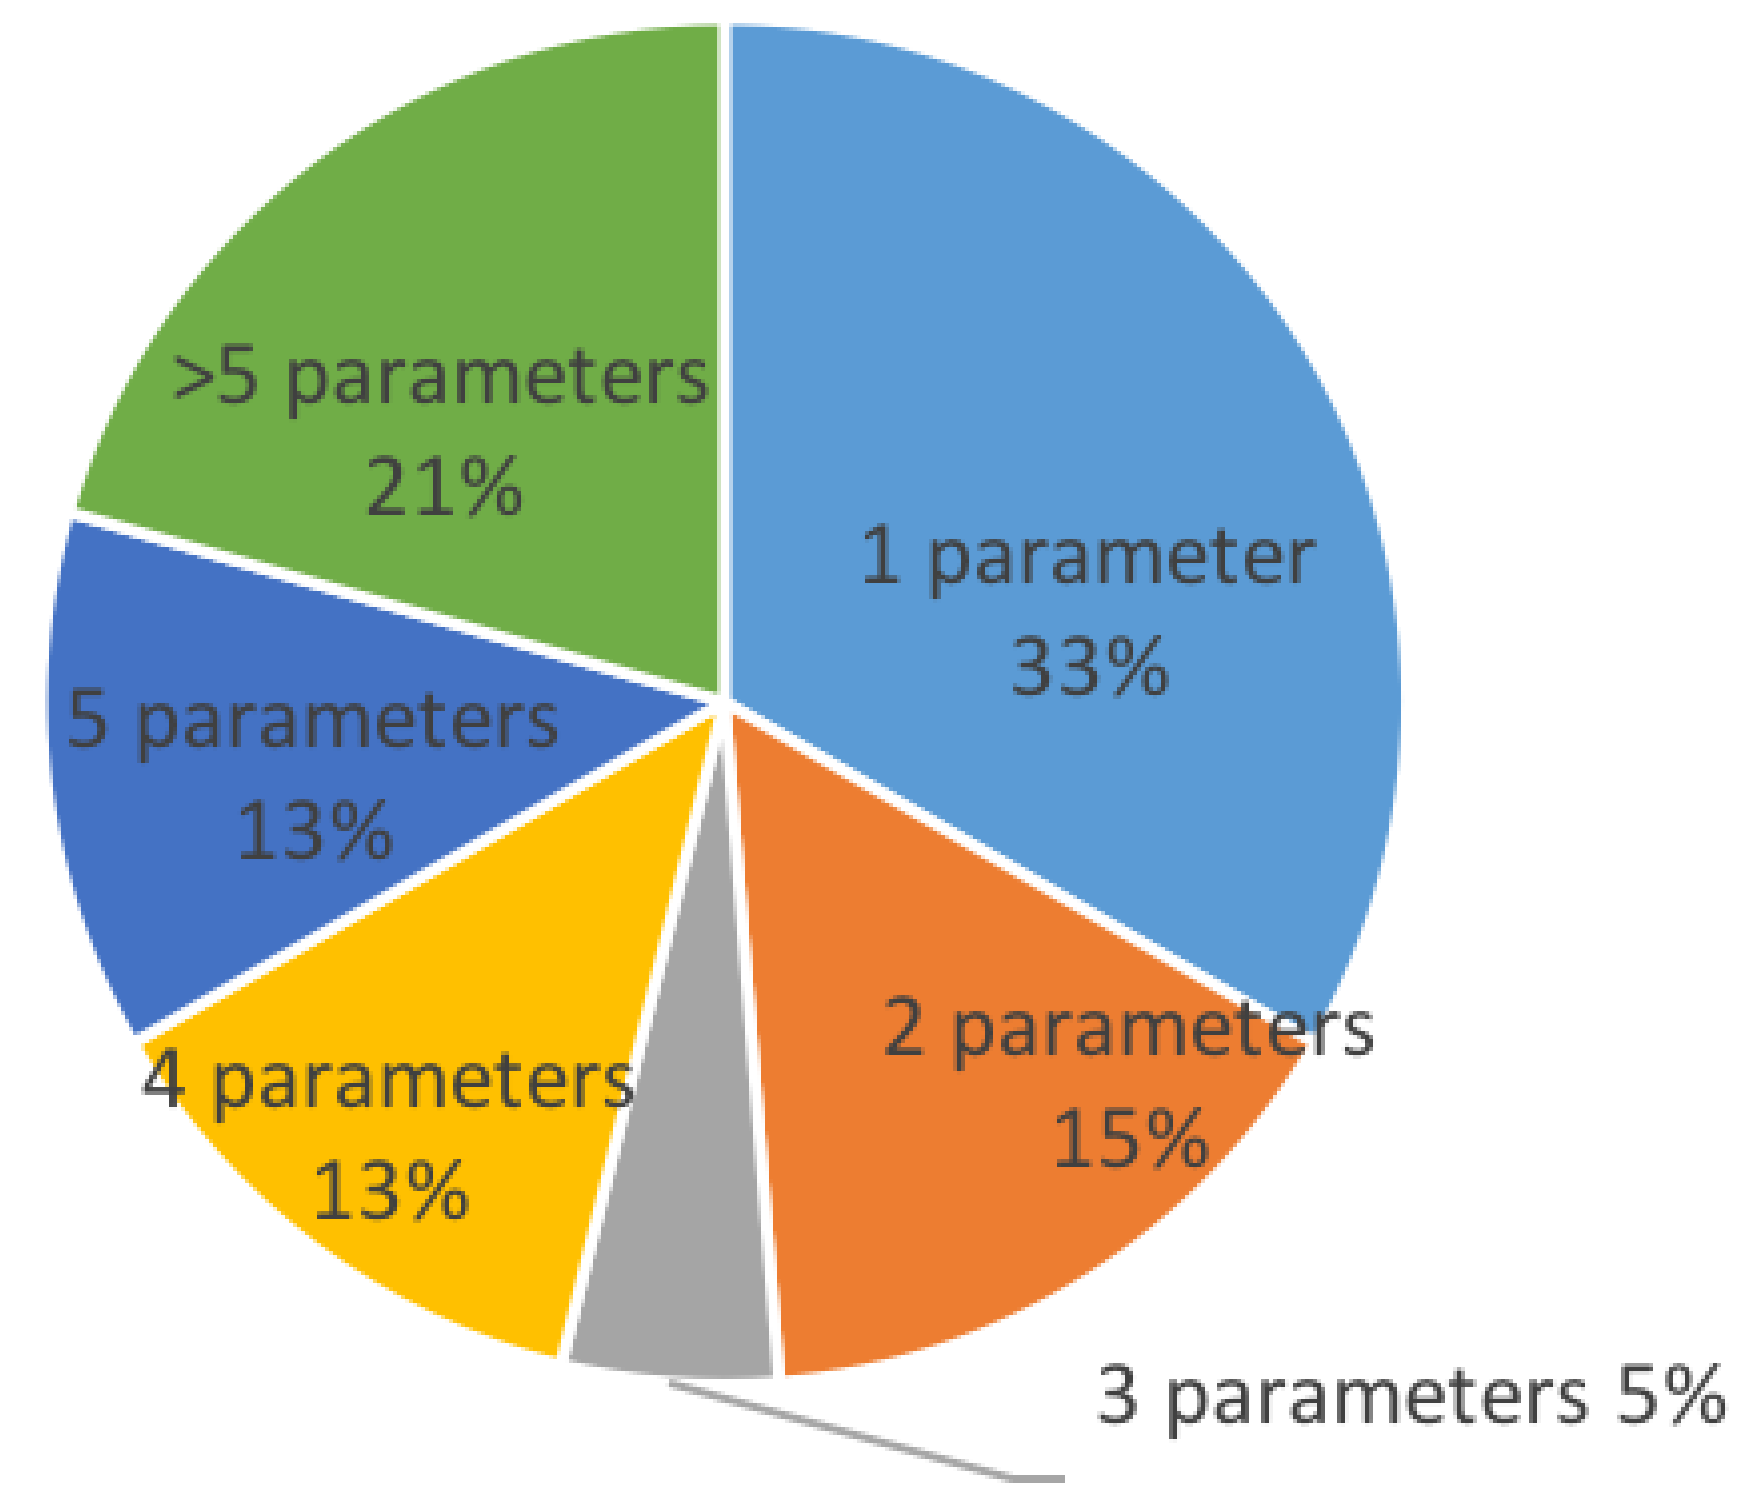
3.6. Parameters
E-monitors primarily measure the system voltage and current passing through a point at any given point in time. On the basis of these measurements, many different parameters can be calculated. According to the survey results, most of the e-monitors utilized a single parameter, followed by the use of five or more parameters (Figure 6). Although almost all of the e-monitors measured the voltage and current (except when the voltage was assumed constant), these measurements were not necessarily displayed to the user. Approximately 80% of e-monitors utilize current and real power to indicate load, followed by voltage (Figure 7). The inclusion of load-specific parameters enhances the distinction among the appliances. In our survey, some e-monitors utilized up to nine distinct parameters.
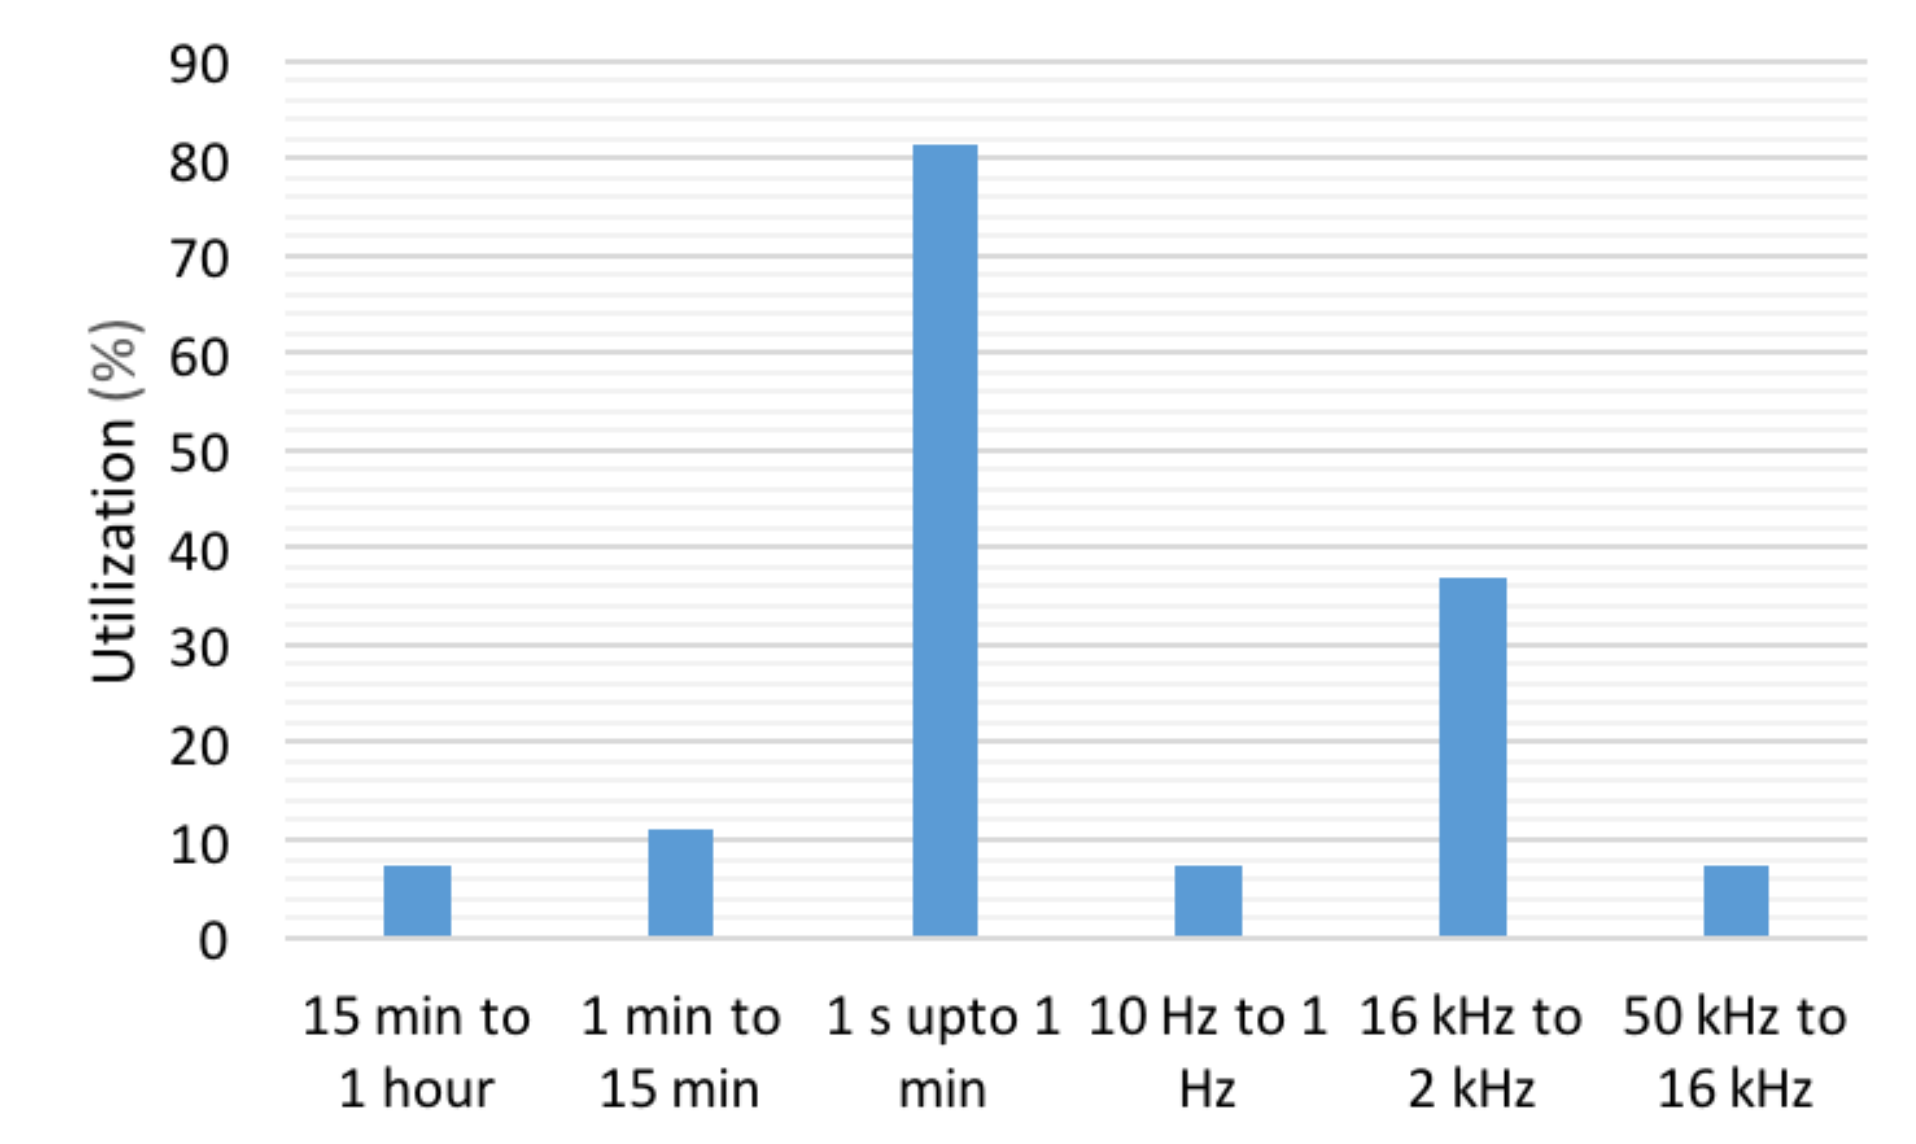
3.7. Sampling Frequency
The sampling frequency is an important dimension for comparison and is required for the proper conversion of an analog signal to digital. The voltage waveform is usually quite stable and can be reconstructed easily, but the current waveform is not even close to a proper sine-wave and hence requires increased sampling for proper digital reconstruction. Our survey indicated that a 1 s to 1 min sampling rate was commonly used by these e-monitors (Figure 8).
Not all the participants disclosed the number of bits, but most ADCs lay between 10 and 16 bits. From the received data, most of the monitors were using 16-bit ADCs. Another important parameter associated with resolution is the power resolution, that is, the minimum level of power measured by these appliances. Most e-monitors have a power resolution of between 1 and 5 W, making them capable of exact and accurate metering.
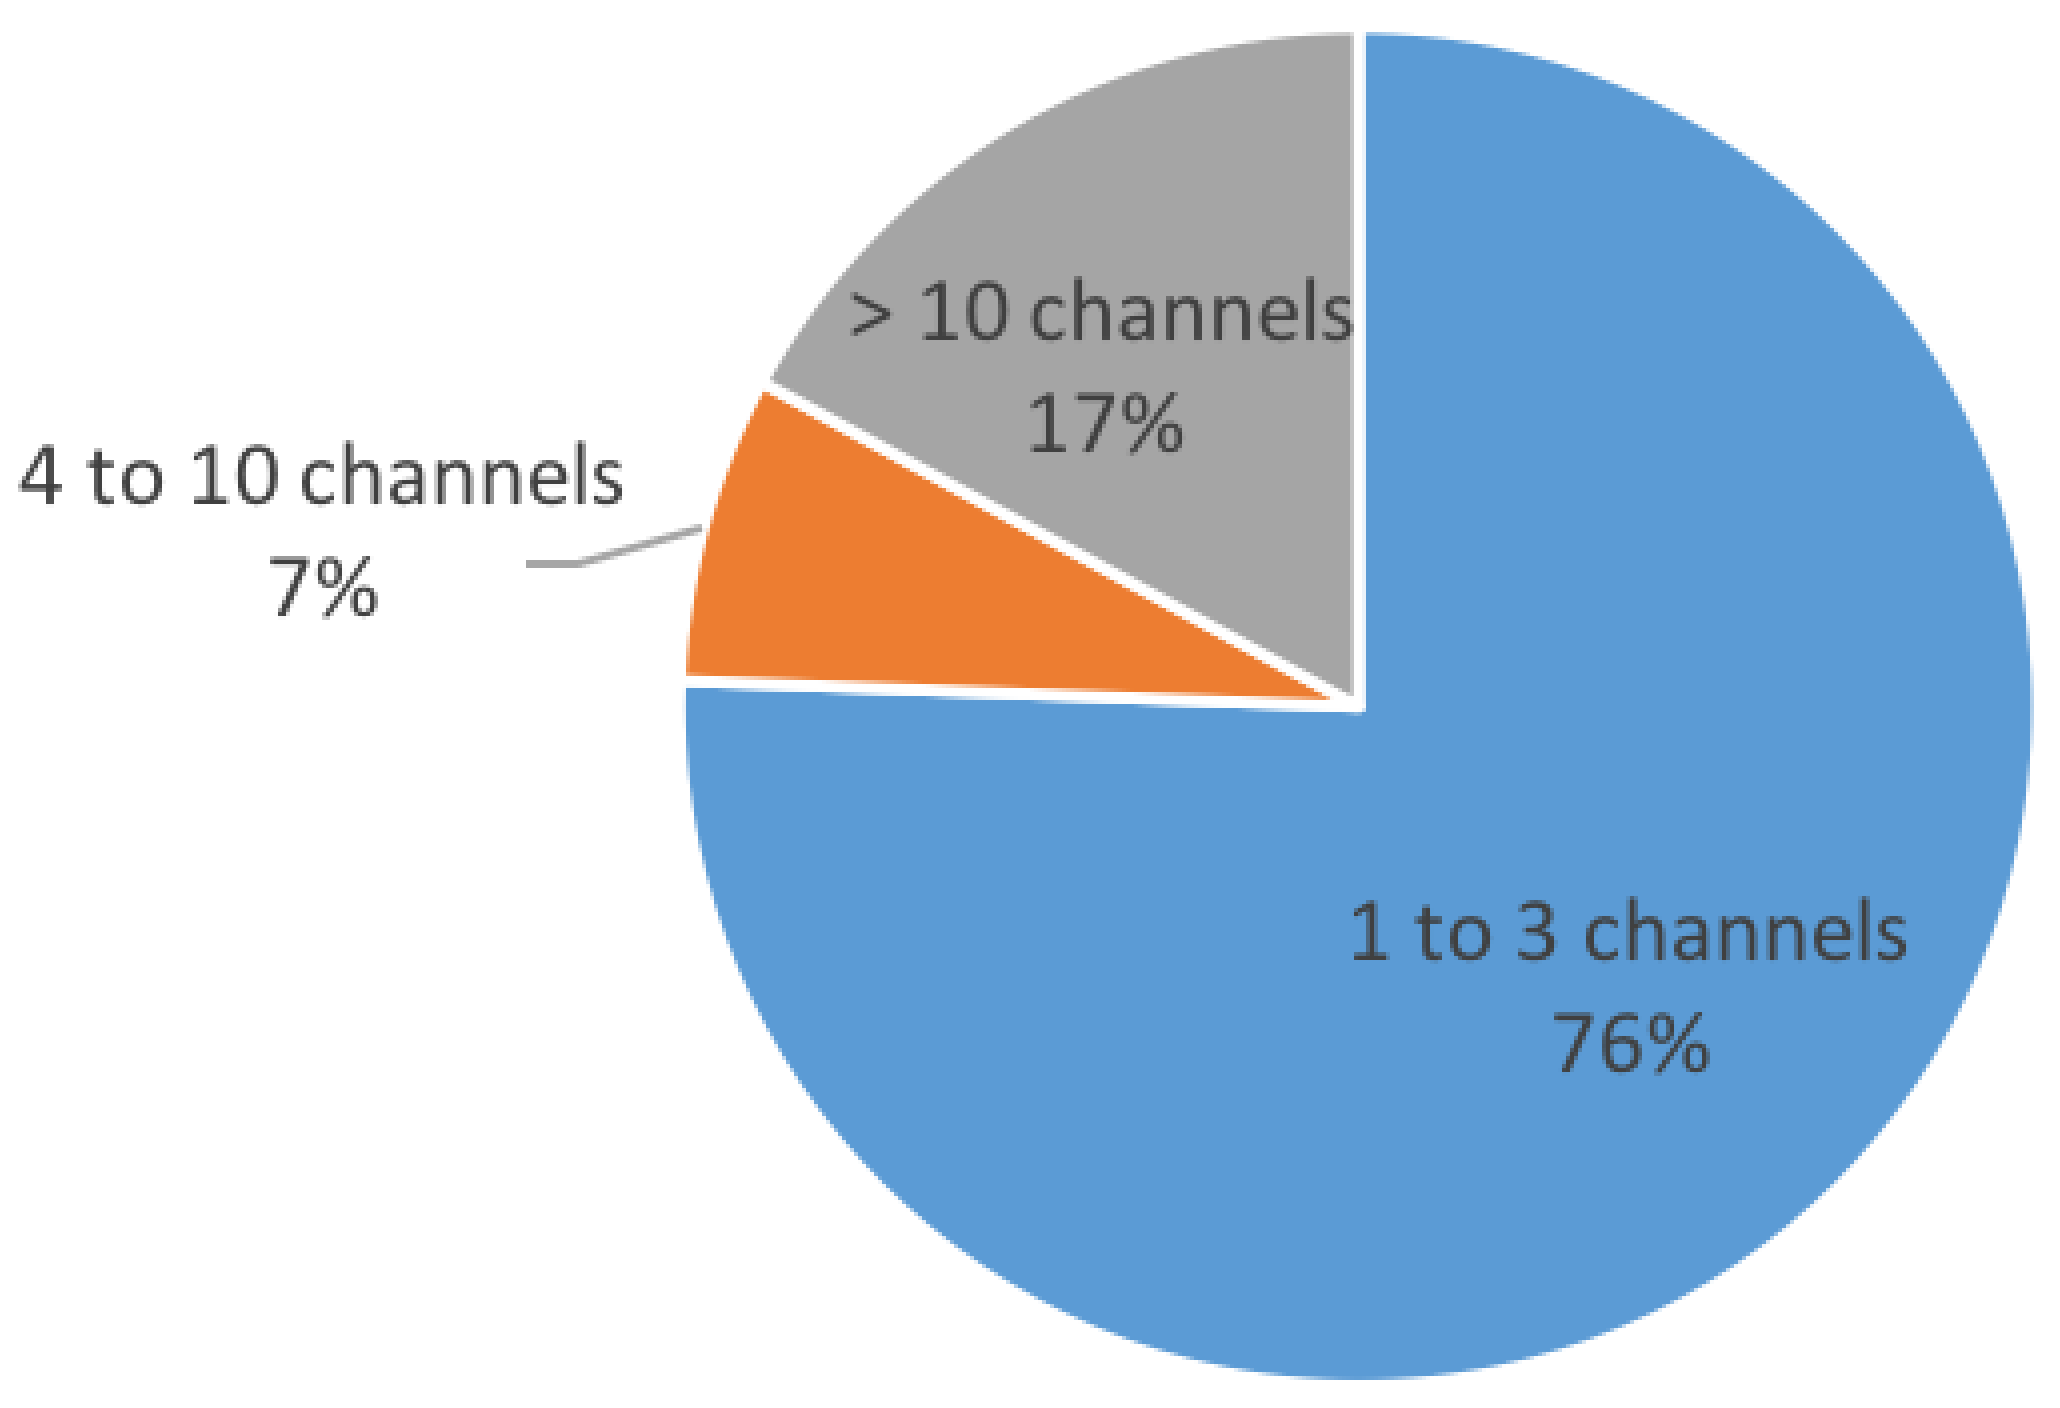
3.8. Measurement Channels
Some load appliances rely on three-phase measurement, while others operate on a single phase, consequently affecting the number of channels that can be monitored. More than 75% of appliances support the measurement of one to three distinct channels (Figure 9). With three input channels, one can either measure three separate single phases or one three-phase. Some e-monitors can simultaneously measure multiple channels (at the circuit and breaker level) in an electric cabinet. Circuit-level energy measurement can help in the disaggregation process, as an individual circuit has fewer appliances as compared to an entire house. As a result of the reduced set of appliances, there is also a smaller probability of appliances switching on or off at the same time. With Verdigris, one can accurately measure about 42 different channels/circuits [27]. GridSpy [28] is another example of a system capable of measuring six circuits per node (wireless data collector) and 30 circuits per hub (collects and uploads data) and can scale up to 600 circuits per site. CURB Pro is also capable of monitoring 18 breakers per hub and this breaker level measurement (hardware disaggregation) facilitates disaggregation algorithms, as the type of load appliance on a particular breaker is already known [29].
3.9. Storage
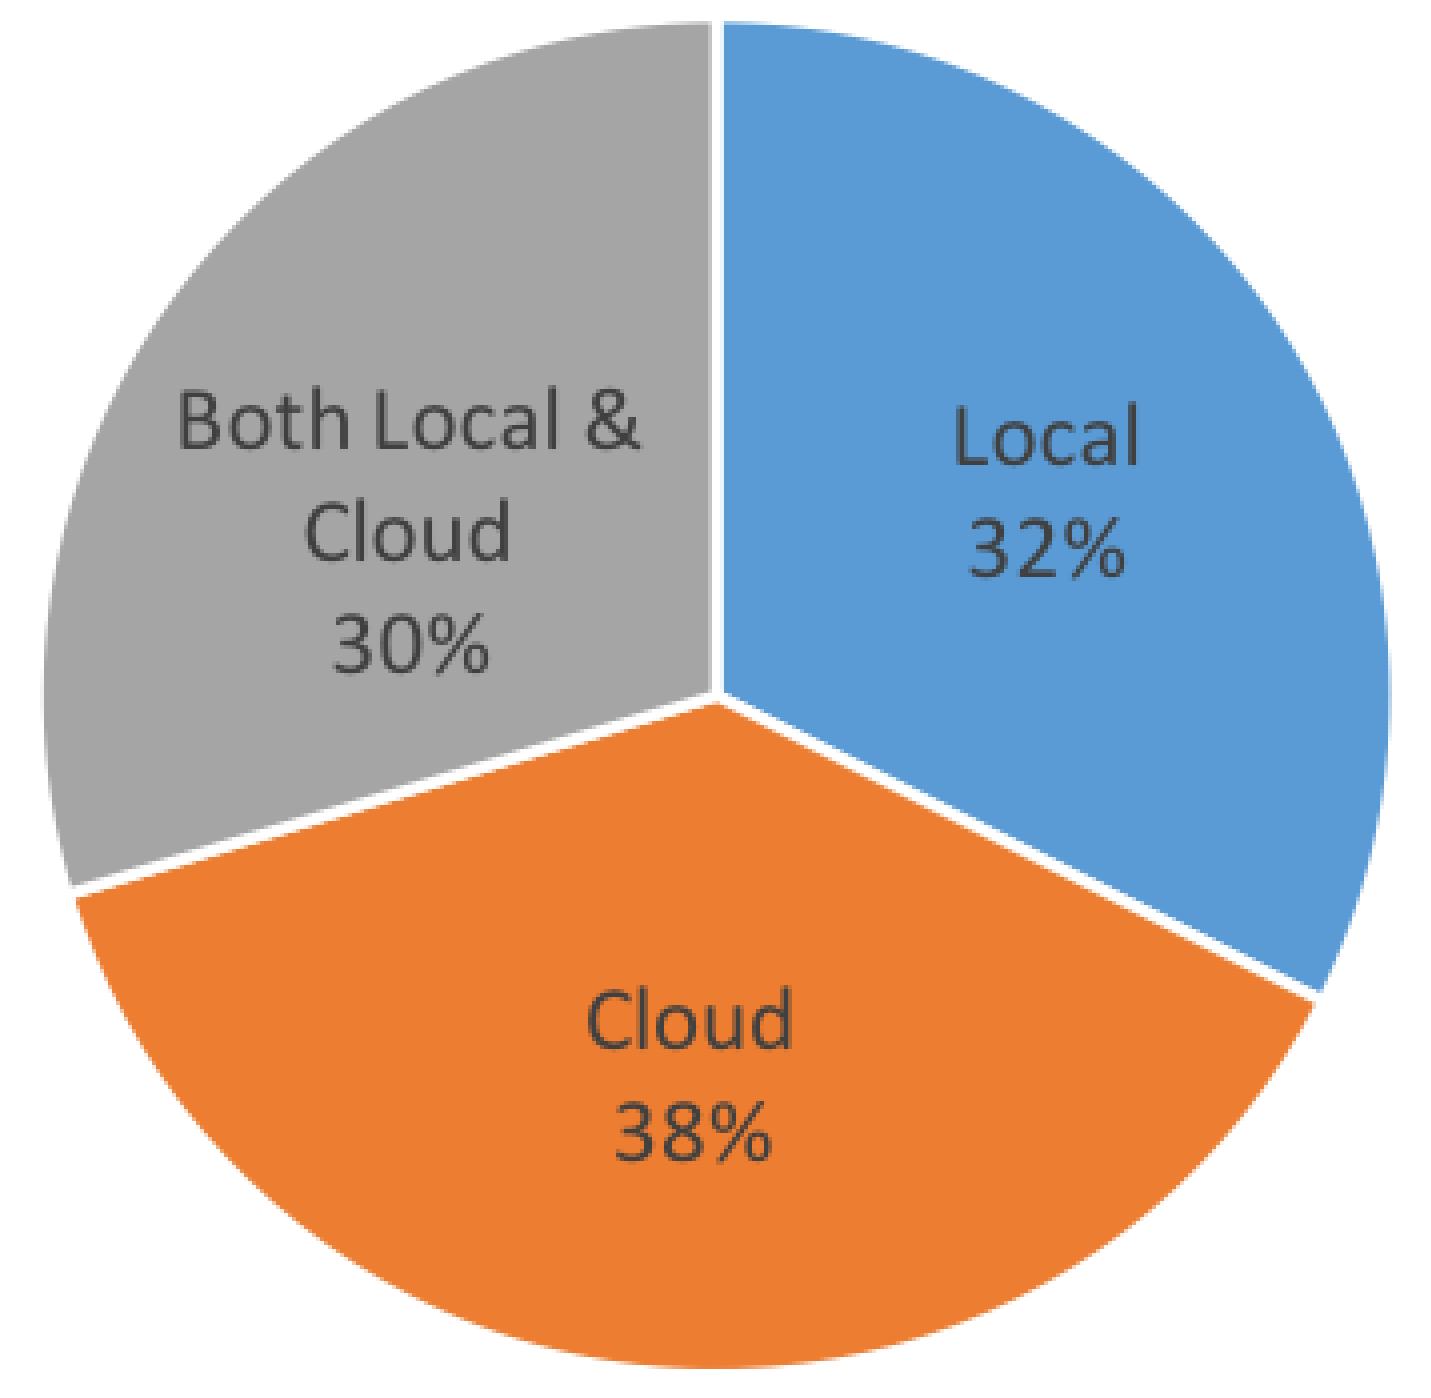
E-monitors are capable of storing data either locally or by uploading to a cloud to perform further analytics. Most e-monitors prefer to upload data to a cloud, while others have the dual capability to store data locally and, at the same time, upload it to a cloud (Figure 10). Issues such as data privacy and confidentiality can be decreased by using local or private cloud storage. With such data, arrangements can be made for the consumer to take advantage of load disaggregation and compute the appliance-level power consumption.
3.10. Cost
To compare costs, we converted all prices into euro to help consumers find the best-suited solution according to their application requirements and budget constraints. According to our survey, the cost of e-monitors varies between €38 and €3220 for a single product according to its application. The typical price range is €452 to around €655, depending upon single- or three-phase systems and accessories utilized with the e-monitors. The prices of smart plugs range between €15 and €79, with an average price of around €48.
4. Non-Intrusive Load Monitoring
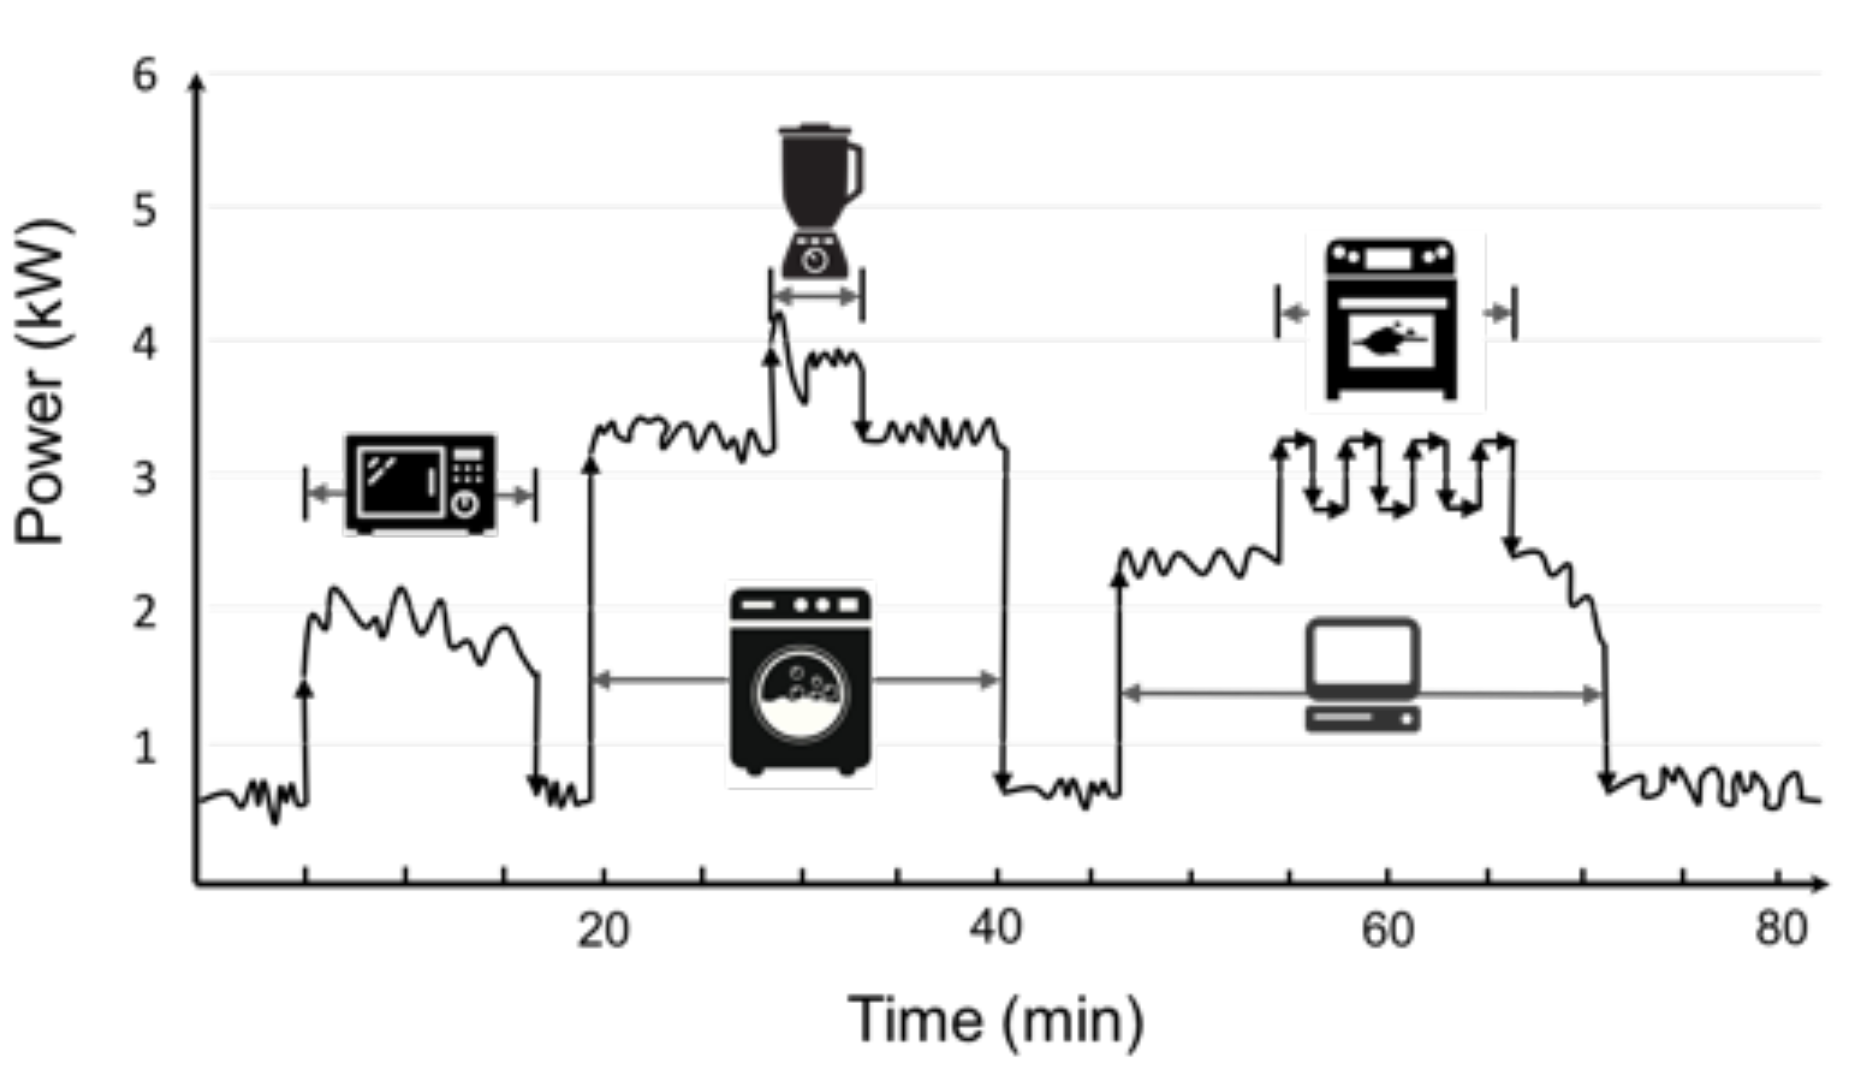
Recently, the use of NILM has increased, as it takes advantage of single-point sensing (i.e., at electricity mains) to identify the operating electrical appliances [30,31]. NILM, as shown in Figure 11, breaks down aggregate power consumption to essentially differentiate between specific individual loads. As compared to the ILM or other traditional approaches, NILM helps to achieve an enhanced appliance load profile at a reduced cost. Since its inception in the 1980’s, NILM research has evolved considerably and has now produced new tools for feature extraction and load-disaggregation algorithms [32].
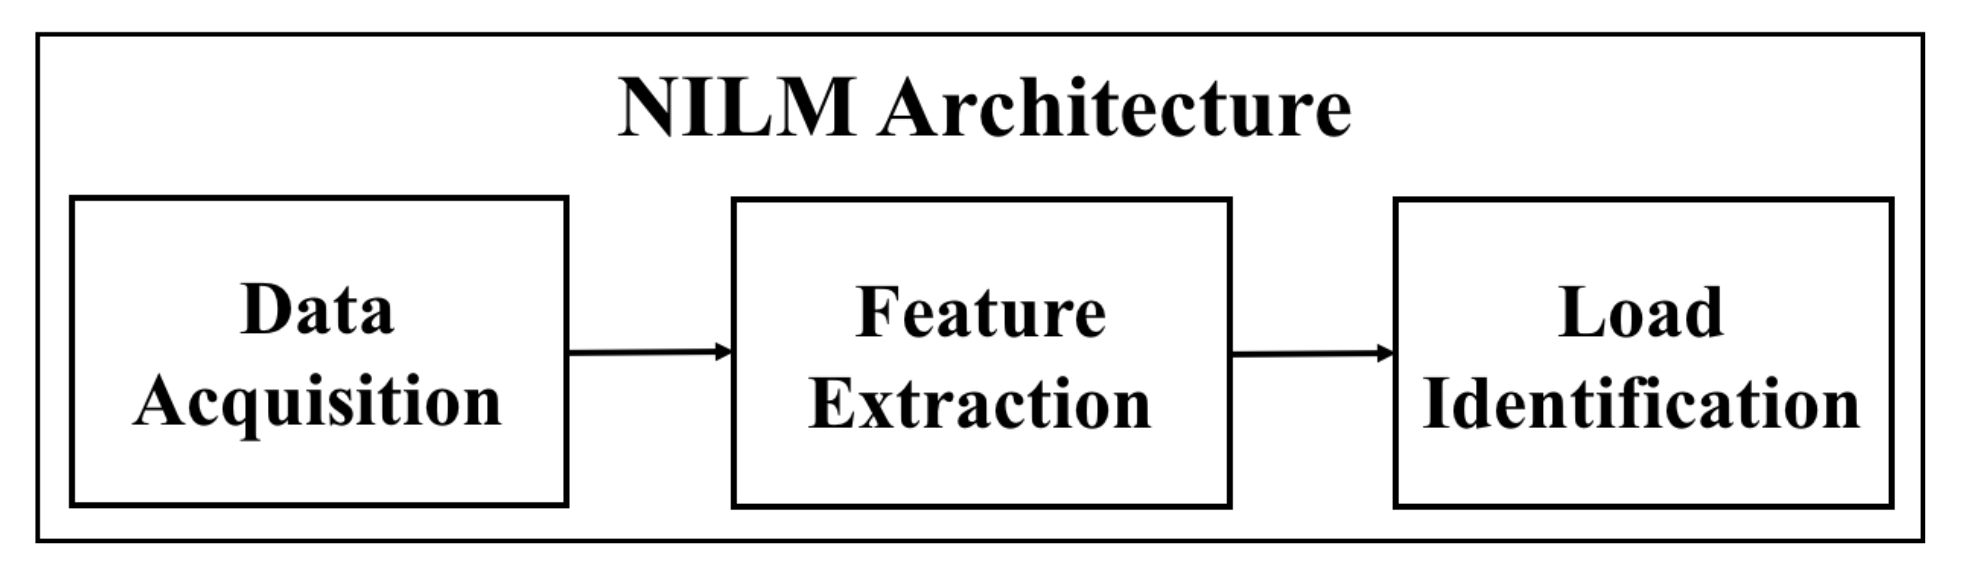
NILM is a combination of three main modules, as shown in Figure 12. The DAQ module is responsible for measuring the aggregate load of a house or building. Depending on the disaggregation algorithm and the area of application, data can be acquired at a low frequency (smart meter) or a high frequency (in kHz to MHz range) [31]. In the feature extraction module, raw data is processed to detect and extract individual appliance events (on/off). There exist two main classes of feature extraction:
The steady-state load signatures concentrate on the signal amplitude and its smooth variations from high to low and vice versa. These amplitude changes are not abrupt and hence do not require fast sampling; they are preferred for appliances with a high power rating. The load identification module analyzes these features through the application of different disaggregation algorithms [34]. On the other hand, the transient features capture the abrupt changes in the current waveform to identify appliances. Transient load signatures essentially capture the unique pattern an appliance follows, particularly when it is switched on/off [35].
Earlier NILM approaches focused on feature selection and extraction with little emphasis on learning and inference techniques [36,37]. The advances in computer science and machine learning techniques have led to innovations in data prediction and disaggregation techniques. Existing machine learning algorithms such as the support vector machine (SVM) [38], k-nearest neighbor (k-NN) [39], and artificial neural network (ANN) [40,41,42] algorithms have had a significant impact on the development of NILM. However, much effort is still required to bring the error caused by different prediction and disaggregation algorithms to within an acceptable range. Once data is acquired, proper handling and screening is required to appropriately present it for disaggregation. Different compression and storage methods have been suggested in the literature [43,44]. Apart from acquiring transient features, using high-frequency DAQ also enables load disaggregation in near real-time [31]. The consumers can take advantage of near-real-time disaggregation feedback to adequately utilize DSM programs and reduce their load during peak hours. Such data can also be used for occupancy detection and can capture the occupant specific energy consumption [45].
The load or energy consumption profiles help to determine the pattern of energy usage with respect to time [46]. For consumers, these patterns are helpful in finding energy leakage. Utility companies use these patterns as a statistical tool for load forecasting. A precise and appliance-level consumption profile can be produced either through multi-point e-monitoring by using smart plugs or through load disaggregation techniques using NILM [47]. In addition to calculating power consumed by the appliance at a particular point in time, the shape of the power consumption profile also provides useful insight into the energy usage behavior. Consumption profiles are also useful in distinguishing the multi-state appliances on the basis of identical patterns of peaks during their operation.
5. Key NILM DAQ Requirements
To incorporate NILM and load disaggregation techniques in the next-generation e-monitors, we have listed some key requirements for NILM. The specific requirements may vary according to the specific application area of these e-monitors.
5.1. Sampling Frequency
One key requirement for any NILM system is to detect the appliances from the aggregate load accurately. Accurate appliance detection requires an adequate sampling rate to detect appliance switching events from the aggregate load. For precise appliance identification, many factors, such as appliance diversity, the number of appliances, the operating states of the appliances (e.g., washing machine, dishwasher, etc.), and the least amount of power consumed by an appliance under observation, need to be considered. As a general rule for disaggregation, a higher sampling frequency allows us to distinguish more appliances in near real-time. For example, with a sampling frequency of 10 to 40 kHz, one can differentiate 20 to 40 appliances. Increasing the sampling frequency beyond 1 MHz can help to distinguish 40 to 100 unique appliances [31]. To be considered for NILM-related operation, the sampling frequency can either be high or adjustable to fit the specific application.
5.2. High-Resolution
As discussed earlier, the resolution of any DAQ system is determined by the number of bits of the ADC. In terms of NILM, this resolution determines the uncertainty introduced by the DAQ system and hence decides the accuracy of event detection. In general, the sampling frequency is responsible for the uncertainty along the x-axis, whereas the number of ADC bits defines the uncertainty along the y-axis during analog to digital conversion. Thus, a high resolution is important to accurately detect the events from the aggregate load and reduce the chances of simultaneous events.
Similarly, the resolution of ADCs defines the minimum change in the signal level (e.g., power, current, etc.) detectable from the aggregate load. Assuming no external noise, a house with 50 A demand can detect a minimum load of 11.23 W using a 10 bit ADC, whereas a minimum detectable load using a 16 bit ADC for the same house is 0.17 W. The survey results indicate most of the available e-monitors are capable of measuring a 1–5 W load, which is quite suitable for load disaggregation.
5.3. Accuracy
Throughout the NILM literature, various accuracy definitions have been used and are broadly covered in some recent studies [31,48,49,50]. At times, accuracy is defined in terms of the fraction of correctly recognized events, while sometimes the fraction of correctly explained total energy determines the accuracy [36]. Norford et al. [34] determined the accuracy by utilizing the difference in the estimated and apparent power drawn by an appliance.
Similarly, some other NILM accuracy definitions include classification accuracy [51,52], the appliance-wise fraction of load duration and the fraction of correctly identified or missed switching events [53], and the receiving operating characteristic (ROC) curve [48]. Makonin et al. [54] utilized classification and estimation performance (at both the overall and appliance level) for reporting the NILM accuracy. To compare the accuracies of different NILM studies, Batra et al. [32] developed a toolkit to check the quality and accuracy of different datasets compared against predefined NILM algorithms.
5.4. Multi-Environment Operability
Another requirement for NILM is the ability to acquire the consumption data from multiple channels. The commercial and industrial environments require at least three channel measurements for measuring three-phase systems. Similarly, sometimes the residential households are also equipped with a three-phase system; thus a three-channel DAQ system is required to adequately handle the simultaneous measurements. The number of inputs is doubled if both the voltage and current are measured simultaneously. Apart from a couple of e-monitors and the smart plugs, the surveyed e-monitors fulfil the criteria of a three-phase measurement. Some NILM-enabled e-monitors such as Smappee [55], Verdgris, and CURB acquire the aggregate load at the circuit-level, which facilitates in appliance classification and detection using the NILM algorithms as a result of a reduced appliance number in a single circuit.
5.5. Simultaneous Event Detection
Most NILM studies follow the switch continuity principle (SCP) [56], which states that at a given instant, only one appliance is switched (on/off). Such an assumption may lead to error when a number of appliances are operating, such as in the office environment, or when more than one multi-state appliance, such as a washing machine and dish-washer, is operating together. One way to deal with this issue is to increase the resolution and sampling frequency of the aggregate DAQ. The effect of data granularity in an office environment can be observed in Figure 13. The spikes indicate the switching events caused by the switched-mode power supply (SMPS)-equipped office appliances. For a single current waveform at 250 kHz (5000 sample points), the switching events are easy to detect, whereas the downsampled 25 kHz (500 sample points) current waveform introduces two or more simultaneous events, which are difficult to detect using available disaggregation algorithms.
5.6. Appliance Identification Parameters
Apart from basic parameters such as the current, power, energy, and harmonics [58], the new range of e-monitors are expected to be equipped with advanced sensors and a high processing power to acquire transient appliance features. These features or parameters are utilized to detect appliance switching from the aggregate load using machine learning algorithms. Khal et al. [59] have identified 36 such features, including wavelet analysis, voltage-current (V-I) trajectory, inrush current ratio, waveform approximation, and log attack time, along with other spectral and temporal features. When considering load disaggregation, it is always better to incorporate more parameters, as certain parameters work better for particular load types [33,60].
Similarly, the instantaneous admittance waveform (IAW) [49] is a robust feature, as it simplifies the calculations because small differences in impedance are harder to observe as compared to admittance (inverse of impedance) [61]; this can introduce some numerical instability as a result of sharp spikes as the voltage approaches zero. Similarly, the current waveform for dynamic loads such as air-conditioners varies from cycle to cycle. To capture these variations, we usually perform eigenvalue (EIG) analysis by rearranging the time-series current waveform into matrix form. The study on appliance load signatures [49] indicates that power-hungry appliances usually have higher first EIG features. Even the second and third EIG features of these appliances show a good correlation and can be utilized as a feature for appliance identification.
In addition to the main features or parameters discussed above, external parameters are also helpful in the e-monitoring of individual appliances and are known as side-channel features. Features such as the time of day, weather information, the appliance location in the circuit (single- or three-phase), and the appliance usage pattern can help to boost the appliance detection process [62]. The side-channel-assisted NILM can significantly enhance the ground truth verification capabilities of the NILM-based systems. In addition to external parameters, light, sound, and the electromagnetic field (EMF) are also utilized as side-channel features. To obtain the appliance switching information, the electromagnetic sensors are placed in close proximity to the appliance under observation (usually a 5–10 cm range) [63]. Similarly, the channel electrical noise can also assist in the appliance identification, but this has a strong dependency on the electrical wiring system—the main drawback of using this approach [64].
5.7. Scalability
Scalability is one basic requirement for any DAQ system, and in terms of NILM, scalability can be considered as the ability of the e-monitor to detect newly added appliances. This can be achieved either through supervised or unsupervised learning techniques [65]. Generally, appliances are identified through their unique load signature in the current waveform during their start-up. Disaggregation algorithms scan for these abrupt changes to begin the process of classification, inference, and learning. Once a new appliance is added to the system, the disaggregation algorithms try to match the features of these newly added appliances with the already developed appliance feature database. Another use-case regarding scalability is to apply the disaggregation at a district level [66]. This can help to detect the power-hungry appliances in the district and help the utility companies to manage the distribution by incorporating more renewable energy.
5.8. Reliability
One of the main requirements regarding NILM-enabled e-monitors is to reliably scan for appliance switching events from the aggregate load. As a result of the unpredictable nature of appliance switching, the e-monitors are required to acquire the measurement data around the clock for a long time (ideally forever). To ensure reliability, an e-monitor is expected to withstand small network and power outages. The use of the on-board buffers, mass storage devices, and battery banks for backup power is encouraged. The increase in the sampling frequency and the number of measurement channels adds to the challenge of maintaining reliability.
5.9. Privacy and Data Confidentiality
Besides many benefits regarding NILM, one drawback often associated with the NILM technique is the lack of consumer privacy. The fine-grained energy utilization information cannot only reveal one’s presence in the house, but such data can also help to deduce the activities and habits of the consumer [67,68]. Lisovich et al. [69] experimented to determine what kind of information can be extracted from the energy consumption data. They concluded that even with just a 15 s data resolution, they were able to accurately identify the major operating appliances to infer the eating habits and sleeping cycles of the residents.
One way to solve this problem is to use a local storage and utilize on-site disaggregation algorithms to build load profiles. Our survey indicates that more than 60% of the e-monitors are capable of local storage, which can enable local disaggregation.
5.10. Efficient Data Storage and Analytics
As most of the available disaggregation algorithms work on the precollected measurement data, the measurement data needs to be collected and stored by the e-monitor. With the simultaneous measurement of multiple channels, collecting error-free data is a major challenge. The data collection and storage challenge increases further with the high-frequency measurements requiring large volumes of data to be stored at a steady rate. It is also important to use well-established file formats to store the data. HDF5 is a commonly used data format in the NILM research community [32] as a result of its superior data handling. HDF5 is compatible with input from multiple simultaneous streams and supports large, complex, and heterogeneous data. Once the data is collected and stored, different machine learning and data analytic techniques are applied to accurately detect appliances from the aggregate load.
5.11. Cost-Effective and User-Friendly
The adaptability of new technology in the public domain is mainly attributed to factors such as the equipment cost, ease of installation, and user-friendly operation. Our survey indicates an average price of €375 for NILM-enabled e-monitors. The cost of equipment depends upon the single- or three-phase system and utilized accessories. Similarly, the NILM-enabled e-monitors in the survey mostly come with split-core CTs, which can be easily installed by clipping around the mains cable of an electric meter. The appliance-level energy consumption information captured by these e-monitors is available to the users through dedicated apps. Disaggregation is an automated process and depends on whether supervised or unsupervised learning approaches are used, as discussed in Section 5.7.
6. Findings, Observations, and Recommendations
The primary purpose of this study was to gather technical information to facilitate researchers, facility managers, and general consumers in selecting an e-monitoring system that best fits their requirements. Commonly, e-monitors are used to track and display the amount of utilized and conserved energy. The critical differences in e-monitors originate from the application area, the sampling frequency, the resolution, the system configuration, and the sensor type. Because the power consumed by e-monitors is quite small, we have not considered it in our study.
We believe that consumers can participate efficiently in DSM programs once they are provided with real-time energy consumption information, particularly at the appliance level. Information regarding appliance-level energy consumption can help to identify energy-hungry appliances and facilitate demand response. Some of the surveyed e-monitors, such as Smappee, Smappee Pro, Neurio, Verdigris, CURB Pro, and CURB Duo, which made up around 18% of the surveyed e-monitors, already claim to utilize NILM techniques. Similarly, most of the other e-monitors possess enough resolution, parameter diversity, processing power, and sampling frequency to employ disaggregation.
In some cases, monitoring appliance health is critical to the overall system operation, particularly for industrial applications. The load disaggregation techniques can facilitate the prediction of faults and recommend appliance maintenance before complete breakdown. Similarly, in addition to being a labor-intensive task, some of the most significant hurdles in the speedy roll-out of smart meters are data confidentiality and privacy concerns. As a result of the private storage and ownership of both the e-monitor and data, consumers can virtually experience smart grid benefits without compromising on privacy.
Most e-monitors can be used in multiple settings and configurations, as they come with numerous options regarding the sensor rating, the number of inputs, and the application area. Furthermore, the utility companies can also take advantage of the data from e-monitors (if allowed) to obtain detailed information regarding high-power appliances operating in an area and enhance the renewable integration through DSM programs.
Although NILM has been around for three decades, the technology never made its way into the public domain until recently. This was mainly due to a high equipment cost and a lack of disaggregation accuracy. Our survey indicates the presence of a new and affordable range of e-monitors, most of which can be easily upgraded to support NILM and disaggregation.
7. Conclusions
Recently, there has been a growing interest in appliance-level e-monitoring to help consumers view fine-grained energy consumption information at the appliance level. The NILM approach utilizes single-point sensing and machine learning techniques to help disaggregate energy data and estimate the appliance-specific energy consumption. The goal of this study was to compare different state-of-the-art e-monitors available on the market and determine their ability to utilize load disaggregation. Through the online technical survey and detailed product review, we compared 41 e-monitors on the basis of several dimensions, including measured and derived parameters, the sampling frequency, the accuracy, the resolution, the area of application and the cost.
The comparison suggests that most e-monitors possess enough capabilities and processing power to incorporate advanced monitoring techniques and upgrade into next-generation intelligent energy metering units. In the future, these intelligent meters can act as the point of contact between smart buildings for local demand response and renewable resource sharing. Before the complete roll-out of smart meters, consumers can realize the offered advantages by selecting and using intelligent off-the-shelf e-monitors.
Acknowledgments
This work is supported in part by research grants from HEC-DAAD, the Alexander von Humboldt foundation established by the government of the Federal Republic of Germany, German Research Foundation (DFG) and the Technical University of Munich (TUM) in the framework of the Open Access Publishing Program. The authors would like to thank all the participating companies for providing the required technical details and allowing us to publish this information.
Conflicts of Interest
The authors declare no conflict of interest.
Appendix A
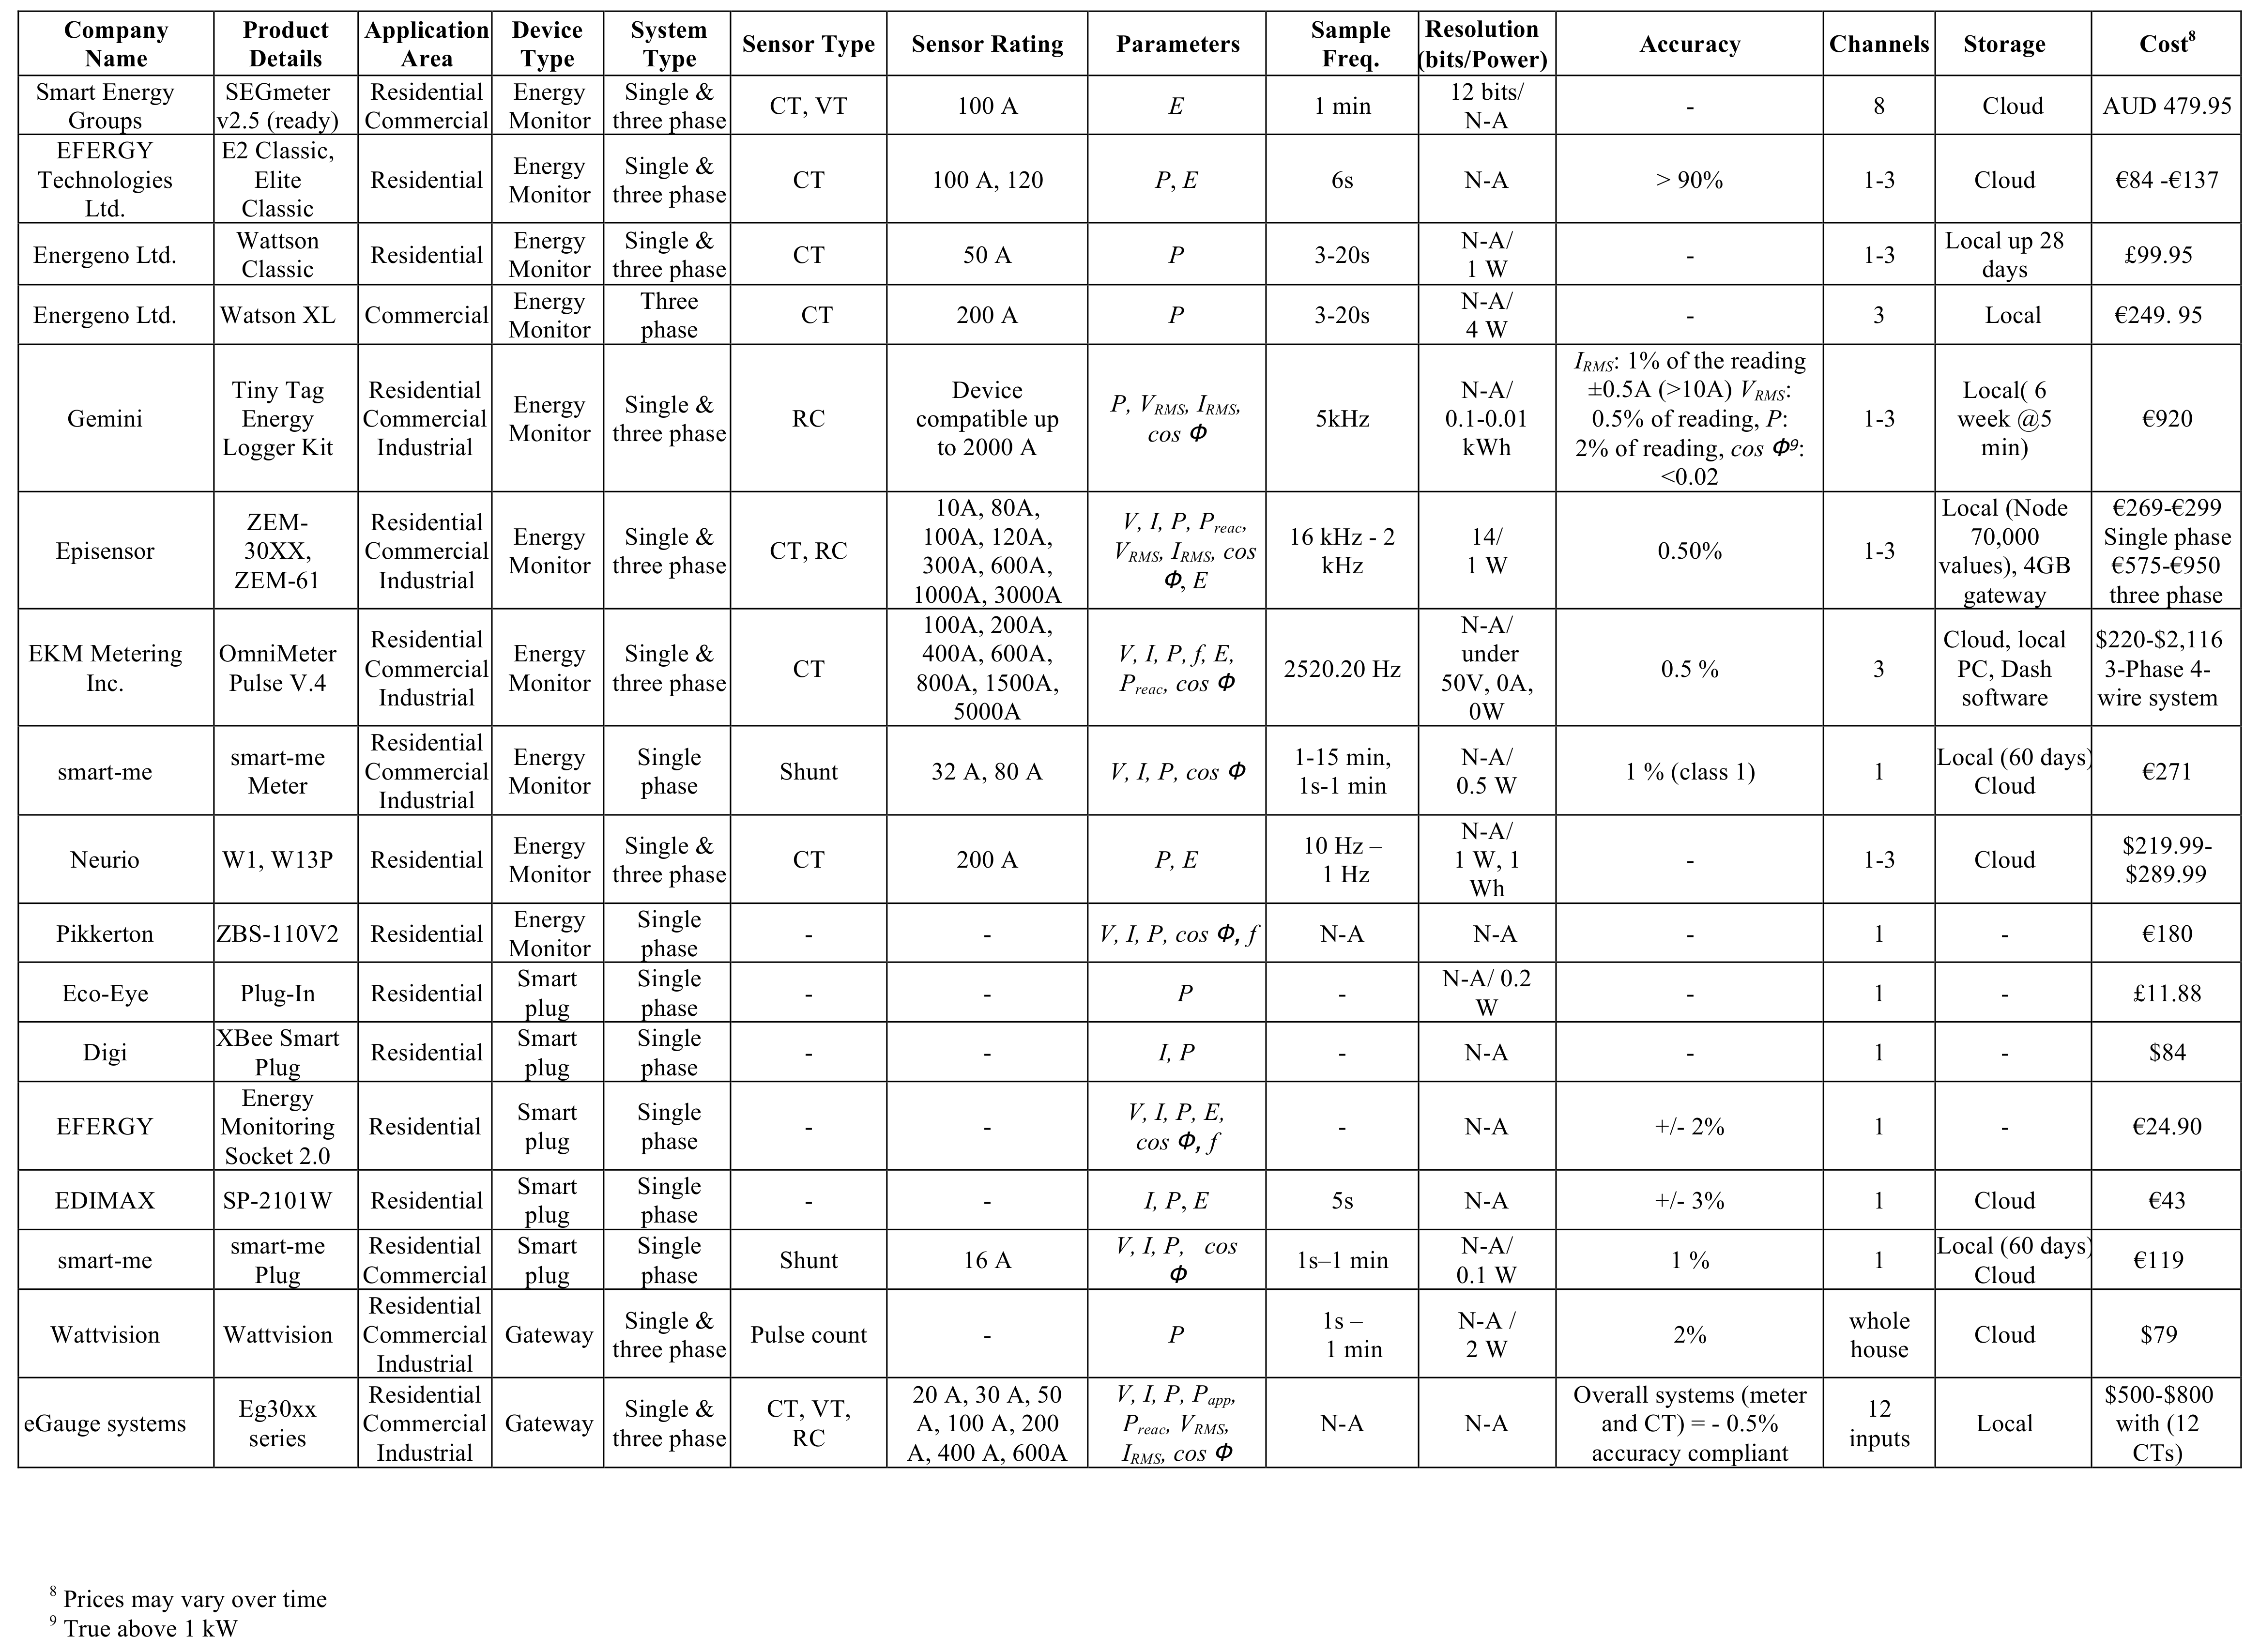
The abbreviations used in the technical note are explained in Table A1. The technical note, as shown in Figure A1 and Figure A2, lists all the information collected from different vendors [27,28,55,70,71,72,73,74,75,76,77,78,79,80,81,82,83,84,85,86,87,88,89,90,91,92,93,94].

Table A1.
Abbreviations used in the technical note.
| Parameter | Notation |
|---|---|
| Voltage | V |
| Current | I |
| Real power | P |
| Apparent power | Papp |
| Reactive power | Preac |
| Power factor | cos |
| Energy | E |
| Frequency | f |
| RMS voltage | VRMS |
| RMS current | IRMS |
| Current transformer | CT |
| Voltage transformer | VT |
| Rogowski coil | RC |
| Side-channel information | SC |
Figure A1.
Technical note.

Figure A2.
Technical note.

References
- Kabalci, E. A smart monitoring infrastructure design for distributed renewable energy systems. Energy Convers. Manag. 2015, 90, 336–346. [Google Scholar] [CrossRef]
- IEC. Grid Integration of Large-Capacity Renewable Energy Sources and Use of Large-Capacity Electrical Energy Storage: White Paper; October 2012; International Electrotechnical Commission: Geneva, Switzerland, 2012. [Google Scholar]
- Opto-22. Energy Monitoring for Profit: Introducing Demand Response. Temecula, CA, USA, 2012. Available online: http://documents.opto22.com/1993_Demand_Response_white_paper.pdf (accessed on 9 January 2018).
- Strbac, G. Demand side management: Benefits and challenges. Energy Policy 2008, 36, 4419–4426. [Google Scholar] [CrossRef]
- Costanzo, G.T.; Zhu, G.; Anjos, M.F.; Savard, G. A system architecture for autonomous demand side load management in smart buildings. IEEE Trans. Smart Grid 2012, 3, 2157–2165. [Google Scholar] [CrossRef]
- Milligan, M.; Frew, B.; Zhou, E.; Arent, D.J. Advancing System Flexibility for High Penetration Renewable Integration; Technical Report; National Renewable Energy Laboratory (NREL): Golden, CO, USA, 2015. [Google Scholar]
- Hu, Z.; Mohagheghi, S.; Sartipi, M. Efficient data acquisition in advanced metering infrastructure. In Proceedings of the 2015 IEEE Power & Energy Society General Meeting, Denver, CO, USA, 26–30 July 2015; pp. 1–5. [Google Scholar]
- Giri, J. Proactive management of the future grid. IEEE Power Energy Technol. Syst. J. 2015, 2, 43–52. [Google Scholar] [CrossRef]
- Fang, X.; Misra, S.; Xue, G.; Yang, D. Smart grid: The new and improved power grid: A survey. IEEE Commun. Surv. Tutor. 2012, 14, 944–980. [Google Scholar] [CrossRef]
- Edison, T.A. Electric Meter. U.S. Patent 242,901, 14 June 1881. [Google Scholar]
- Blitiiy, O. Electric Meter for Alternating Current. U.S. Patent 423,210, 11 March 1890. [Google Scholar]
- Conti, J.J.; Holtberg, P.D. Annual Energy Outlook 2015 with Projections to 2040; Technical Report; U.S. Energy Information Administration (EIA), U.S. Department of Energy: Washington, DC, USA, April 2015.
- Bertoldi, P.; Atanasiu, B. Electricity Consumption and Efficiency Trends in the Enlarged European Union; Technical Report; Institute for Environment and Sustainability: Ispra (VA), Italy, 2007. [Google Scholar]
- Siemens. Building Automation Impact on Energy Efficiency. Technical Report; Siemens Building Technologies. Siemens Switzerland Ltd., 2007. Available online: http://w3.siemens.dk/home/dk/dk/buildingtechnologies/vaerd_at_vide/energioptimering/documents/rapport_om_energieffektiviseringer.pdf (accessed on 9 January 2018).
- Smart Meter Systems: A metering industry perspective. In A Joint Project of the EEI and AEIC Meter Committees; Edison Electric Institute: Washington, DC, USA, March 2011.
- Li, R.; Dane, G.; Finck, C.; Zeiler, W. Are building users prepared for energy flexible buildings?—A large-scale survey in the Netherlands. Appl. Energy 2017, 203, 623–634. [Google Scholar] [CrossRef]
- Wei, D.; Lu, Y.; Jafari, M.; Skare, P.M.; Rohde, K. Protecting smart grid automation systems against cyberattacks. IEEE Trans. Smart Grid 2011, 2, 782–795. [Google Scholar] [CrossRef]
- Zou, H.; Jiang, H.; Yang, J.; Xie, L.; Spanos, C. Non-intrusive occupancy sensing in commercial buildings. Energy Build. 2017, 154, 633–643. [Google Scholar] [CrossRef]
- TI-Designs. Single-Phase Electric Meter with Isolated Energy Measurement; Technical Report; Taxes Instruments: Dallas, TX, USA, 2016. [Google Scholar]
- Schlobohm, R. Electronic Power Meters Guide for Their Selection and Specification. Technical Report; GE Specification Engineer. 2005. Available online: http://apps.geindustrial.com/publibrary/checkout/METER-GUIDE?TNR=White%20Papers%7CMETER-GUIDE%7Cgeneric (accessed on 9 January 2018).
- Wakileh, G.J. Power Systems Harmonics: Fundamentals, Analysis and Filter Design; Springer Science & Business Media: Berlin, Germany, 2001. [Google Scholar]
- Evaluation of Advanced Meter System Deployment in Texas—Meter Accuracy Assessment; Technical Report; Navigant Consulting (PI) LLC: Austin, TX, USA, 30 July 2010.
- Joshi, H. Residential, Commercial and Industrial Electrical Systems: Network and Installation; Tata McGraw-Hill Education: New Dehli, India, 2008; Volume 2. [Google Scholar]
- Palmer, J.; Terry, N. Costing Monitoring Equipment for a Longitudinal Energy Survey; Technical Report; Department of Energy and Climate Change: London, UK , 3 August 2015. [Google Scholar]
- Energy Monitors Technical Survey Form. Available online: https://www.i13.in.tum.de/ (accessed on 13 December 2017).
- Leferink, F.; Keyer, C.; Melentjev, A. Static energy meter errors caused by conducted electromagnetic interference. IEEE Electromagn. Compat. Mag. 2016, 5, 49–55. [Google Scholar] [CrossRef]
- Verdigris. Available online: http://verdigris.co (accessed on 13 December 2017).
- GridSpy. Available online: https://gridspy.com/devices.html (accessed on 13 December 2017).
- CURB Inc. Available online: http://energycurb.com/product/ (accessed on 13 December 2017).
- Giri, S.; Bergés, M. An energy estimation framework for event-based methods in Non-Intrusive Load Monitoring. Energy Convers. Manag. 2015, 90, 488–498. [Google Scholar] [CrossRef]
- Armel, K.C.; Gupta, A.; Shrimali, G.; Albert, A. Is disaggregation the holy grail of energy efficiency? The case of electricity. Energy Policy 2013, 52, 213–234. [Google Scholar] [CrossRef]
- Batra, N.; Kelly, J.; Parson, O.; Dutta, H.; Knottenbelt, W.; Rogers, A.; Singh, A.; Srivastava, M. NILMTK: An open source toolkit for non-intrusive load monitoring. In Proceedings of the 5th International Conference on Future Energy Systems, Cambridge, UK, 11–13 June 2014; ACM: New York, NY, USA, 2014; pp. 265–276. [Google Scholar]
- Zoha, A.; Gluhak, A.; Imran, M.A.; Rajasegarar, S. Non-intrusive load monitoring approaches for disaggregated energy sensing: A survey. Sensors 2012, 12, 16838–16866. [Google Scholar] [CrossRef] [PubMed] [Green Version]
- Norford, L.K.; Leeb, S.B. Non-Intrusive electrical load monitoring in commercial buildings based on steady-state and transient load-detection algorithms. Energy Build. 1996, 24, 51–64. [Google Scholar] [CrossRef]
- Chang, H.H. Non-intrusive demand monitoring and load identification for energy management systems based on transient feature analyses. Energies 2012, 5, 4569–4589. [Google Scholar] [CrossRef]
- Hart, G.W. Nonintrusive appliance load monitoring. Proc. IEEE 1992, 80, 1870–1891. [Google Scholar] [CrossRef]
- Norford, L.K.; Mabey, N. Non-Intrusive Electric Load Monitoring in Commercial Buildings; Technical Report; Energy Systems Laboratory, TAMU: College Station, TX, USA, 1992; Available online: http://hdl.handle.net/1969.1/92921 (accessed on 9 January 2018).
- Onoda, T.; Rätsch, G.; Müller, K.R. Applying support vector machines and boosting to a non-intrusive monitoring system for household electric appliances with inverters. In Proceedings of the Second ICSC Symposium on Neural Computation, Berlin, Germany, 23–26 May 2000. [Google Scholar]
- Fomby, T.B.; Barber, T. K-Nearest Neighbors Algorithm: Prediction and Classification; Southern Methodist University: Dallas, TX, USA, 2008; pp. 1–5. [Google Scholar]
- Gomes, L.; Fernandes, F.; Sousa, T.; Silva, M.; Morais, H.; Vale, Z.; Ramos, C. Contextual intelligent load management with ANN adaptive learning module. In Proceedings of the 2011 16th International Conference on Intelligent System Application to Power Systems (ISAP), Hersonissos, Greece, 25–28 September 2011; pp. 1–6. [Google Scholar]
- Kelly, J.; Knottenbelt, W. Neural NILM: Deep neural networks applied to energy disaggregation. In Proceedings of the 2nd ACM International Conference on Embedded Systems for Energy-Efficient Built Environments, Seoul, Korea, 4–5 November 2015; ACM: New York, NY, USA, 2015; pp. 55–64. [Google Scholar]
- Ruzzelli, A.G.; Nicolas, C.; Schoofs, A.; O’Hare, G.M. Real-time recognition and profiling of appliances through a single electricity sensor. In Proceedings of the 2010 7th Annual IEEE Communications Society Conference on Sensor, Mesh and Ad Hoc Communications and Networks (SECON), Boston, MA, USA, 21–25 June 2010; pp. 1–9. [Google Scholar]
- Ringwelski, M. The Effect of Data Granularity on Load Data Compression. In Proceedings of the Energy Informatics: 4th DA-CH Conference, EI 2015, Karlsruhe, Germany, 12–13 November 2015; Springer: Cham, Switzerland, 2016; Volume 9424, p. 69. [Google Scholar]
- Unterweger, A.; Engel, D. Resumable load data compression in smart grids. IEEE Trans. Smart Grid 2015, 6, 919–929. [Google Scholar] [CrossRef]
- Rafsanjani, H.N.; Ahn, C.R.; Alahmad, M. A review of approaches for sensing, understanding, and improving occupancy-related energy-use behaviors in commercial buildings. Energies 2015, 8, 10996–11029. [Google Scholar] [CrossRef]
- Heidarinejad, M.; Cedeño-Laurent, J.G.; Wentz, J.R.; Rekstad, N.M.; Spengler, J.D.; Srebric, J. Actual building energy use patterns and their implications for predictive modeling. Energy Convers. Manag. 2017, 144, 164–180. [Google Scholar] [CrossRef]
- Barsim, K.S.; Streubel, R.; Yang, B. An approach for unsupervised non-intrusive load monitoring of residential appliances. In Proceedings of the 2nd International Workshop on Non-Intrusive Load Monitoring, Austin, TX, USA, 3 June 2014. [Google Scholar]
- Zeifman, M.; Akers, C.; Roth, K. Nonintrusive Appliance Load Monitoring (NIALM) for Energy Control in Residential Buildings: Review and Outlook. IEEE Trans. Consum. Electron. 2011, 57. [Google Scholar] [CrossRef]
- Liang, J.; Ng, S.K.; Kendall, G.; Cheng, J.W. Load signature study—Part I: Basic concept, structure, and methodology. IEEE Trans. Power Deliv. 2010, 25, 551–560. [Google Scholar] [CrossRef]
- Hao, X.; Tang, B.; Hulu, L.; Wang, Y. On the balance of meter deployment cost and NILM accuracy. In Proceedings of the 24th International Conference on Artificial Intelligence, Buenos Aires, Argentina, 25–31 July 2015; AAAI Press: Palo Alto, CA, USA, 2015; pp. 2603–2609. [Google Scholar]
- Srinivasan, D.; Ng, W.; Liew, A. Neural-network-based signature recognition for harmonic source identification. IEEE Trans. Power Deliv. 2006, 21, 398–405. [Google Scholar] [CrossRef]
- Berges, M.; Goldman, E.; Matthews, H.S.; Soibelman, L. Learning systems for electric consumption of buildings. In Proceedings of the ASCE International Workshop on Computing in Civil Engineering, Austin, TX, USA, 24–27 June 2009; Volume 38, pp. 1–10. [Google Scholar]
- Farinaccio, L.; Zmeureanu, R. Using a pattern recognition approach to disaggregate the total electricity consumption in a house into the major end-uses. Energy Build. 1999, 30, 245–259. [Google Scholar] [CrossRef]
- Makonin, S.; Popowich, F. Nonintrusive load monitoring (NILM) performance evaluation. Energy Effic. 2015, 8, 809–814. [Google Scholar] [CrossRef]
- Smappee. Available online: http://www.smappee.com/us/ (accessed on 5 January 2018).
- Makonin, S. Investigating the Switch Continuity Principle Assumed in Non-Intrusive Load Monitoring (NILM). In Proceedings of the IEEE Canadian Conference on Electrical and Computer Engineering (CCECE), Vancouver, BC, Canada, 15–18 May 2016; IEEE: Piscataway, NJ, USA, 2016. [Google Scholar]
- Haq, A.U.; Kriechbaumer, T.; Kahl, M.; Jacobsen, H.A. CLEAR: A circuit level electric appliance radar for the electric cabinet. In Proceedings of the 2017 IEEE International Conference on Industrial Technology (ICIT), Toronto, ON, Canada, 22–25 March 2017; pp. 1130–1135. [Google Scholar]
- Bouhouras, A.S.; Gkaidatzis, P.A.; Chatzisavvas, K.C.; Panagiotou, E.; Poulakis, N.; Christoforidis, G.C. Load Signature Formulation for Non-Intrusive Load Monitoring Based on Current Measurements. Energies 2017, 10, 538. [Google Scholar] [CrossRef]
- Kahl, M.; Ul Haq, A.; Kriechbaumer, T.; Jacobsen, H.A. A Comprehensive Feature Study for Appliance Recognition on High Frequency Energy Data. In Proceedings of the Eighth International Conference on Future Energy Systems, Hong Kong, China, 16–19 May 2017; ACM: New York, NY, USA, 2017; pp. 121–131. [Google Scholar]
- Lin, Y.H.; Tsai, M.S. Development of an Improved Time–Frequency Analysis-Based Nonintrusive Load Monitor for Load Demand Identification. IEEE Trans. Instrum. Meas. 2014, 63, 1470–1483. [Google Scholar] [CrossRef]
- Dalen, A.; Weinhardt, C. Evaluating the impact of data sample-rate on appliance disaggregation. In Proceedings of the 2014 IEEE International Energy Conference (ENERGYCON), Cavtat, Croatia, 13–16 May 2014; pp. 743–750. [Google Scholar]
- Kolter, J.Z.; Johnson, M.J. REDD: A public data set for energy disaggregation research. In Proceedings of the Workshop on Data Mining Applications in Sustainability (SIGKDD), San Diego, CA, USA, 21–24 August 2011; ACM: New York, NY, USA, 2011; Volume 25, pp. 59–62. [Google Scholar]
- Rowe, A.; Berges, M.; Rajkumar, R. Contactless sensing of appliance state transitions through variations in electromagnetic fields. In Proceedings of the 2nd ACM Workshop on Embedded Sensing Systems for Energy-Efficiency in Building, Zurich, Switzerland, 3–5 November 2010; ACM: New York, NY, USA, 2010; pp. 19–24. [Google Scholar]
- Gupta, S.; Reynolds, M.S.; Patel, S.N. ElectriSense: single-point sensing using EMI for electrical event detection and classification in the home. In Proceedings of the 12th ACM International Conference on Ubiquitous Computing, Copenhagen, Denmark, 26–29 September 2010; ACM: New York, NY, USA, 2010; pp. 139–148. [Google Scholar]
- Aiad, M.; Lee, P.H. Unsupervised approach for load disaggregation with devices interactions. Energy Build. 2016, 116, 96–103. [Google Scholar] [CrossRef]
- Pedersen, T.; Ravn, A.P.; Skou, A. INTrEPID: A project on energy optimization in buildings. In Proceedings of the 4th International Conference on Wireless Communications, Vehicular Technology, Information Theory and Aerospace & Electronic Systems (VITAE), Aalborg, Denmark, 11–14 May 2014; IEEE: Piscataway, NJ, USA, 2014. [Google Scholar]
- Kement, C.E.; Gultekin, H.; Tavli, B.; Girici, T.; Uludag, S. Comparative Analysis of Load Shaping Based Privacy Preservation Strategies in Smart Grid. IEEE Trans. Ind. Inform. 2017, 13, 3226–3235. [Google Scholar] [CrossRef]
- Engel, D.; Eibl, G. Wavelet-based multiresolution smart meter privacy. IEEE Trans. Smart Grid 2017, 8, 1710–1721. [Google Scholar] [CrossRef]
- Lisovich, M.; Wicker, S. Privacy concerns in upcoming residential and commercial demand-response systems. IEEE Proc. Power Syst. 2008, 1, 1–10. [Google Scholar]
- emonTx V3. Available online: http://openenergymonitor.org/emon/modules/emonTxV3 (accessed on 13 December 2017).
- emonPi. Available online: https://shop.openenergymonitor.com/emonpi-3/ (accessed on 13 December 2017).
- GreenEye Monitor. Available online: http://www.brultech.com/greeneye/ (accessed on 5 January 2018).
- Energeno Wattson. Available online: http://smarthomeenergy.co.uk/sites/smarthomeenergy.co.uk/files/Wattson_range_brochure_UK_1.2.pdf (accessed on 13 December 2017).
- HIOKI Clamp on Power Logger. Available online: https://www.hioki.com/en/products/detail/?product_key=5589 (accessed on 13 December 2017).
- TED—The Energy Detective. Available online: http://www.theenergydetective.com/# (accessed on 5 January 2018).
- Eco-Eye Elite-200. Available online: http://www.eco-eye.com/product-commercial-monitor-elite-200 (accessed on 13 December 2017).
- Eco-Eye Plug-In. Available online: http://www.eco-eye.com/product-mains-monitor-plug-in (accessed on 13 December 2017).
- Eco-Eye Smart 600. Available online: http://www.eco-eye.com/product-commercial-monitor-smart-600 (accessed on 13 December 2017).
- Blue Line Innovations. Available online: http://www.bluelineinnovations.com/ (accessed on 13 December 2017).
- SEGmeter V2.5. Available online: https://smartenergygroups.com (accessed on 5 January 2018).
- EFERGY E2 Classic. Available online: http://efergy.com/media/download/datasheets/e2classicv2_uk_datasheet_web2011.pdf (accessed on 5 January 2018).
- EFERGY Energy Monitoring Socket 2.0. Available online: http://efergy.com/media/download/manuals/ems_uk_instructions_web2011.pdf (accessed on 13 December 2017).
- Tinytag Energy Logger Kit. Available online: http://www.geminidataloggers.de/data-loggers/tinytag-energy-data-logger/tge-0001 (accessed on 13 December 2017).
- Episensor Wireless Three-Phase Electricity Monitor. Available online: http://static.episensor.com/wpcontent/uploads/ESD-003-00_Data_Sheet_ZEM-61.pdf (accessed on 13 December 2017).
- EKM Metering Omnimeter. Available online: http://documents.ekmmetering.com/EKM_OmniMeter_UL_User_Manual_Spec_Sheet_Submeter.pdf (accessed on 5 January 2018).
- EKM OmiMeter Pulse V.4. Available online: http://documents.ekmmetering.com/EKM_Metering_LCD_Display_Value_Reading.pdf (accessed on 5 January 2018).
- Smart-Me Metering. Available online: http://smart-me.com/Description/Products.aspx (accessed on 5 January 2018).
- Neurio Sensor W1. Available online: http://support.neur.io/customer/en/portal/articles/1847880-neurio-user-manual (accessed on 5 January 2018).
- Pikkerton ZBS 110V2. Available online: http://www.pikkerton.com/_objects/1/16.htm (accessed on 13 December 2017).
- Digi XBee Smart Plug. Available online: http://www.digi.com/products/xbee-rf-solutions/rangeextenders/xbee-smart-plug-zb#specifications (accessed on 13 December 2017).
- Edimax Smart Plug Switch. Available online: http://www.edimax.com/edimax/mw/cufiles/files/download/datasheet/SP-2101W_Datasheet_English_EU_type.pdf (accessed on 5 January 2018).
- WattVision. Available online: http://www.wattvision.com/sensors (accessed on 13 December 2017).
- Energeno Wattson XL. Available online: http://smarthomeenergy.co.uk/sites/smarthomeenergy.co.uk/files/Wattson_range_brochure_UK_1.2.pdf (accessed on 13 December 2017).
- eGauge Main Units. Available online: http://www.egauge.net/products/ (accessed on 13 December 2017).
Figure 1.
Instantaneous voltage and current waveforms.

Figure 2.
Different categories of e-monitors.

Figure 3.
E-monitor utilization system.

Figure 4.
Types of sensor used by e-monitors.

Figure 5.
Rating of current transformers.

Figure 6.
Number of e-monitor parameters used.

Figure 7.
Parameters used by the e-monitors.

Figure 8.
Sampling frequency used by e-monitors.

Figure 9.
Number of channels measured by e-monitor.

Figure 10.
Different storage options for e-monitors.

Figure 11.
Disaggregation using non-intrusive load monitoring (NILM) (adapted from [33]).
Figure 11.
Disaggregation using non-intrusive load monitoring (NILM) (adapted from [33]).

Figure 12.
Non-intrusive load monitoring (NILM) architecture (adapted from [33]).
Figure 12.
Non-intrusive load monitoring (NILM) architecture (adapted from [33]).

Figure 13.
Current waveform acquired at 250 kHz using CLEAR [57] and downsampled at different sampling frequencies.
Figure 13.
Current waveform acquired at 250 kHz using CLEAR [57] and downsampled at different sampling frequencies.

© 2018 by the authors. Licensee MDPI, Basel, Switzerland. This article is an open access article distributed under the terms and conditions of the Creative Commons Attribution (CC BY) license (http://creativecommons.org/licenses/by/4.0/).
Share and Cite
MDPI and ACS Style
Haq, A.U.; Jacobsen, H.-A. Prospects of Appliance-Level Load Monitoring in Off-the-Shelf Energy Monitors: A Technical Review. Energies 2018, 11, 189. https://doi.org/10.3390/en11010189
AMA Style
Haq AU, Jacobsen H-A. Prospects of Appliance-Level Load Monitoring in Off-the-Shelf Energy Monitors: A Technical Review. Energies. 2018; 11(1):189. https://doi.org/10.3390/en11010189
Chicago/Turabian StyleHaq, Anwar Ul, and Hans-Arno Jacobsen. 2018. "Prospects of Appliance-Level Load Monitoring in Off-the-Shelf Energy Monitors: A Technical Review" Energies 11, no. 1: 189. https://doi.org/10.3390/en11010189
Note that from the first issue of 2016, this journal uses article numbers instead of page numbers. See further details here.