Optimal Scheduling of an Regional Integrated Energy System with Energy Storage Systems for Service Regulation

1
School of Electrical Engineering, Wuhan University, Wuhan 430072, China
2
Department of Electrical and Computer Engineering, University of Denver, Denver, CO 80210, USA
3
State Grid Jilin Province Electric Power Supply Company, Changchun 130021, China
*
Author to whom correspondence should be addressed.
Energies 2018, 11(1), 195; https://doi.org/10.3390/en11010195
Submission received: 19 December 2017
/
Revised: 5 January 2018
/
Accepted: 5 January 2018
/
Published: 14 January 2018
(This article belongs to the Section D: Energy Storage and Application)
Abstract
:Ancillary services are critical to maintaining the safe and stable operation of power systems that contain a high penetration level of renewable energy resources. As a high-quality regulation resource, the regional integrated energy system (RIES) with energy storage system (ESS) can effectively adjust the non-negligible frequency offset caused by the renewable energy integration into the power system, and help solve the problem of power system frequency stability. In this paper, the optimization model aiming at regional integrated energy system as a participant in the regulation market based on pay-for-performance is established. Meanwhile YALMIP + CPLEX is used to simulate and analyze the total operating cost under different dispatch modes. This paper uses the actual operation model of the PJM regulation market to guide the optimal allocation of regulation resource in the regional integrated energy system, and provides a balance between the power trading revenue and regulation market revenue in order to achieve the maximum profit.
1. Introduction
With a large number of Renewable Energy Sources (RES) integrated into the power grid and the construction of the Energy Internet, it can be expected that by 2050, renewable energy generation as a proportion of total energy consumption may reach 80%. The World Wide Fund for Nature (WWF) predicts that the world will be powered by 100% renewable energy by the middle of this century. Such a change in power and energy systems will bring significant benefits in terms of economic efficiency, energy supply security, and environmental protection [1]. Renewable energy usually has the characteristics of intermittence and volatility. Non-negligible frequency offset may appear under high penetration level of renewable energy, which causes power system frequency stability issues. Therefore, additional regulation capability is required to provide regulation services. The Regional Integrated Energy System (RIES) with electrical energy storage system (ESS), a concept originated from the Energy Internet, has been employed as an effective technology to solve this problem [2,3].
The Energy Internet can be divided into two parts, energy primary network and regional integrated energy system [4,5,6,7,8]. The initial purpose of using ESS in the RIES is to generate profits by utilizing energy price arbitrage opportunities, known as load shifting or peak shaving [9,10,11]. It solves the renewable energy consumption problem and makes arbitrage by charging energy when prices are low or during times of low demand, and discharging energy when prices are high, or during times of peak demand. Therefore, the overall operating costs of RIES can be reduced. With the development of RIES and the decreasing cost of energy storage systems, many researchers have suggested that the flexibility of the energy storage system can be used to provide regulation services to protect power systems when the power system load changes dramatically.
In China, enabling energy storage technology and its ancillary services to participate in the power grid regulation is still in an early stage. However, in some countries, the application of the energy storage technology has gradually matured. The Federal Energy Regulatory Commission (FERC) issued Order No. 755 in 2011, requiring the Regional Transmission Organization (RTO) and the Independent System Operator (ISO) to further compensate electricity suppliers who provide regulation services, and for the first time put forward compensations according to the adjustment effect. Motivated by this order, as a regulation resource with faster response time and more accurate regulation effect, ESS, has more fair and reasonable compensation price. The Order No. 784 issued in 2013 further created an opportunity for electric energy storage system to enter the ancillary service market. The regional power market ISO/RTO, such as the Pennsylvania-New Jersey-Maryland PJM-interconnection, made a detailed provision under the framework of the Order No. 784. A complete and effective regulation market is established.
Since Order No. 755 issued in 2011, many studies have been conducted in the ancillary service market. However, in previous studies on the regulation market, compensation revenue based on performance was not considered. On the other hand, the established market model is relatively simple. It does not include how to select appropriate regulation resources when there are multiple regulation resources. Eyer et al. [12] and Rittershausen et al. [13] summarized the potential revenue streams of profit since the electrical ESS participated into the regulation market, which is energy arbitrage and participation in the regulation market. Graves et al. [14] summarized various profit patterns. Byrne et al. [15] calculated the revenue without considering the regulation performance compensation based on CAISO data. Byrne et al. [16], in another paper, combined the data from Electricity Reliability Council of Texas (ERCOT), and analyzed the characteristics of different energy storage systems and their operating constraints. The economy of their participation in regulation service is also assessed.
Currently, Power Grid of China is using the PJM market operating mechanism as a reference to draw up a regulation service compensation plan based on pay-for-performance. Such a mechanism is more in line with the actual situation. China also expects to establish a “quasi-market” in regulation service field. Therefore, it is necessary to study the specific pricing mode and operation strategy of PJM regulation market. The existing studies on the ESS participating into the regulation market only consider the ESS operating condition. However, in actual operation scenario, the operation of ESS generally rely on the RIES. Therefore, not only should the constraints of ESS and the regulation service pricing method be considered, but also the constraints of different equipment contained in the RIES, such as source equipment and energy conversion equipment, need to be considered. On this basis, an operation strategy for the RIES with ESS participating in the regulation market needs to be developed. Yet, this question is not mentioned in the relevant studies.
To solve the problems described above, a detailed RIES with ESS as a participant in the regulation market based on pay-for-performance and the actual operation scenario is established. On this basis, a real-time dispatching strategy for ESS participating as regulation service based on the day-ahead price of power market is designed and completed. In this strategy with multiple resources, the regulation market uses parameters such as benefits factor, historical performance score, and mileage rate to compare the performance of regulation resource, so that regulation resources with better performance are more likely to be selected. By real-time adjusting the state of charge (SOC) of the ESS in real time, the RIES with ESS can be ensured that it participates in the regulation service of the ancillary market after completing the maximum renewable energy consumption, and reducing the overall operating costs of RIES.
2. Regional Integrated Energy System
2.1. Structure of the Regional Integrated Energy System
ETH Zurich proposed the concept of Energy Hub and Energy Interconnect [17]. The Energy Hub model can represent the generation and transformation between various energies. Energy Hub is an abstract model of multiple practical devices and their relationships. Energy Hub has been widely used in many different fields, such as optimal design and optimal scheduling [18,19]. An Energy Hub is considered as a unit where multiple energy resources can be converted, conditioned, and stored. It represents an interface between different energy infrastructures and/or loads. Energy hubs consume power from their input ports which are connected to generation units such as electricity and natural gas infrastructures, and provide certain required energy services such as electricity, heating, cooling, compressed air, etc. through the output ports. The RIES is a multi-energy flow supply system that connects natural gas networks, distributed power generation, CCHP systems, energy storage devices, etc. through the use of information and communication technologies, so Energy Hub can be used to describe energy coupling relationship in RIES. In Figure 1, the structure diagram of Energy Hub of the RIES includes electrical/gas energy inputs and power/thermal energy outputs [20]. The figure shows the connection between the various devices in the RIES and the energy flow. In RIES, not only various types of distributed generation equipment (photo-voltaic Cell, PV; wind turbine, WT; gas turbine, GT) exist, but also it contains various forms of energy input and output (gas boiler, GB). In addition, the system also contains energy storage equipment (energy storage, ES; thermal storage, TS) and energy conversion equipment (waste heat boiler, WHB; electric refrigerator, ER; electric boiler, EB).
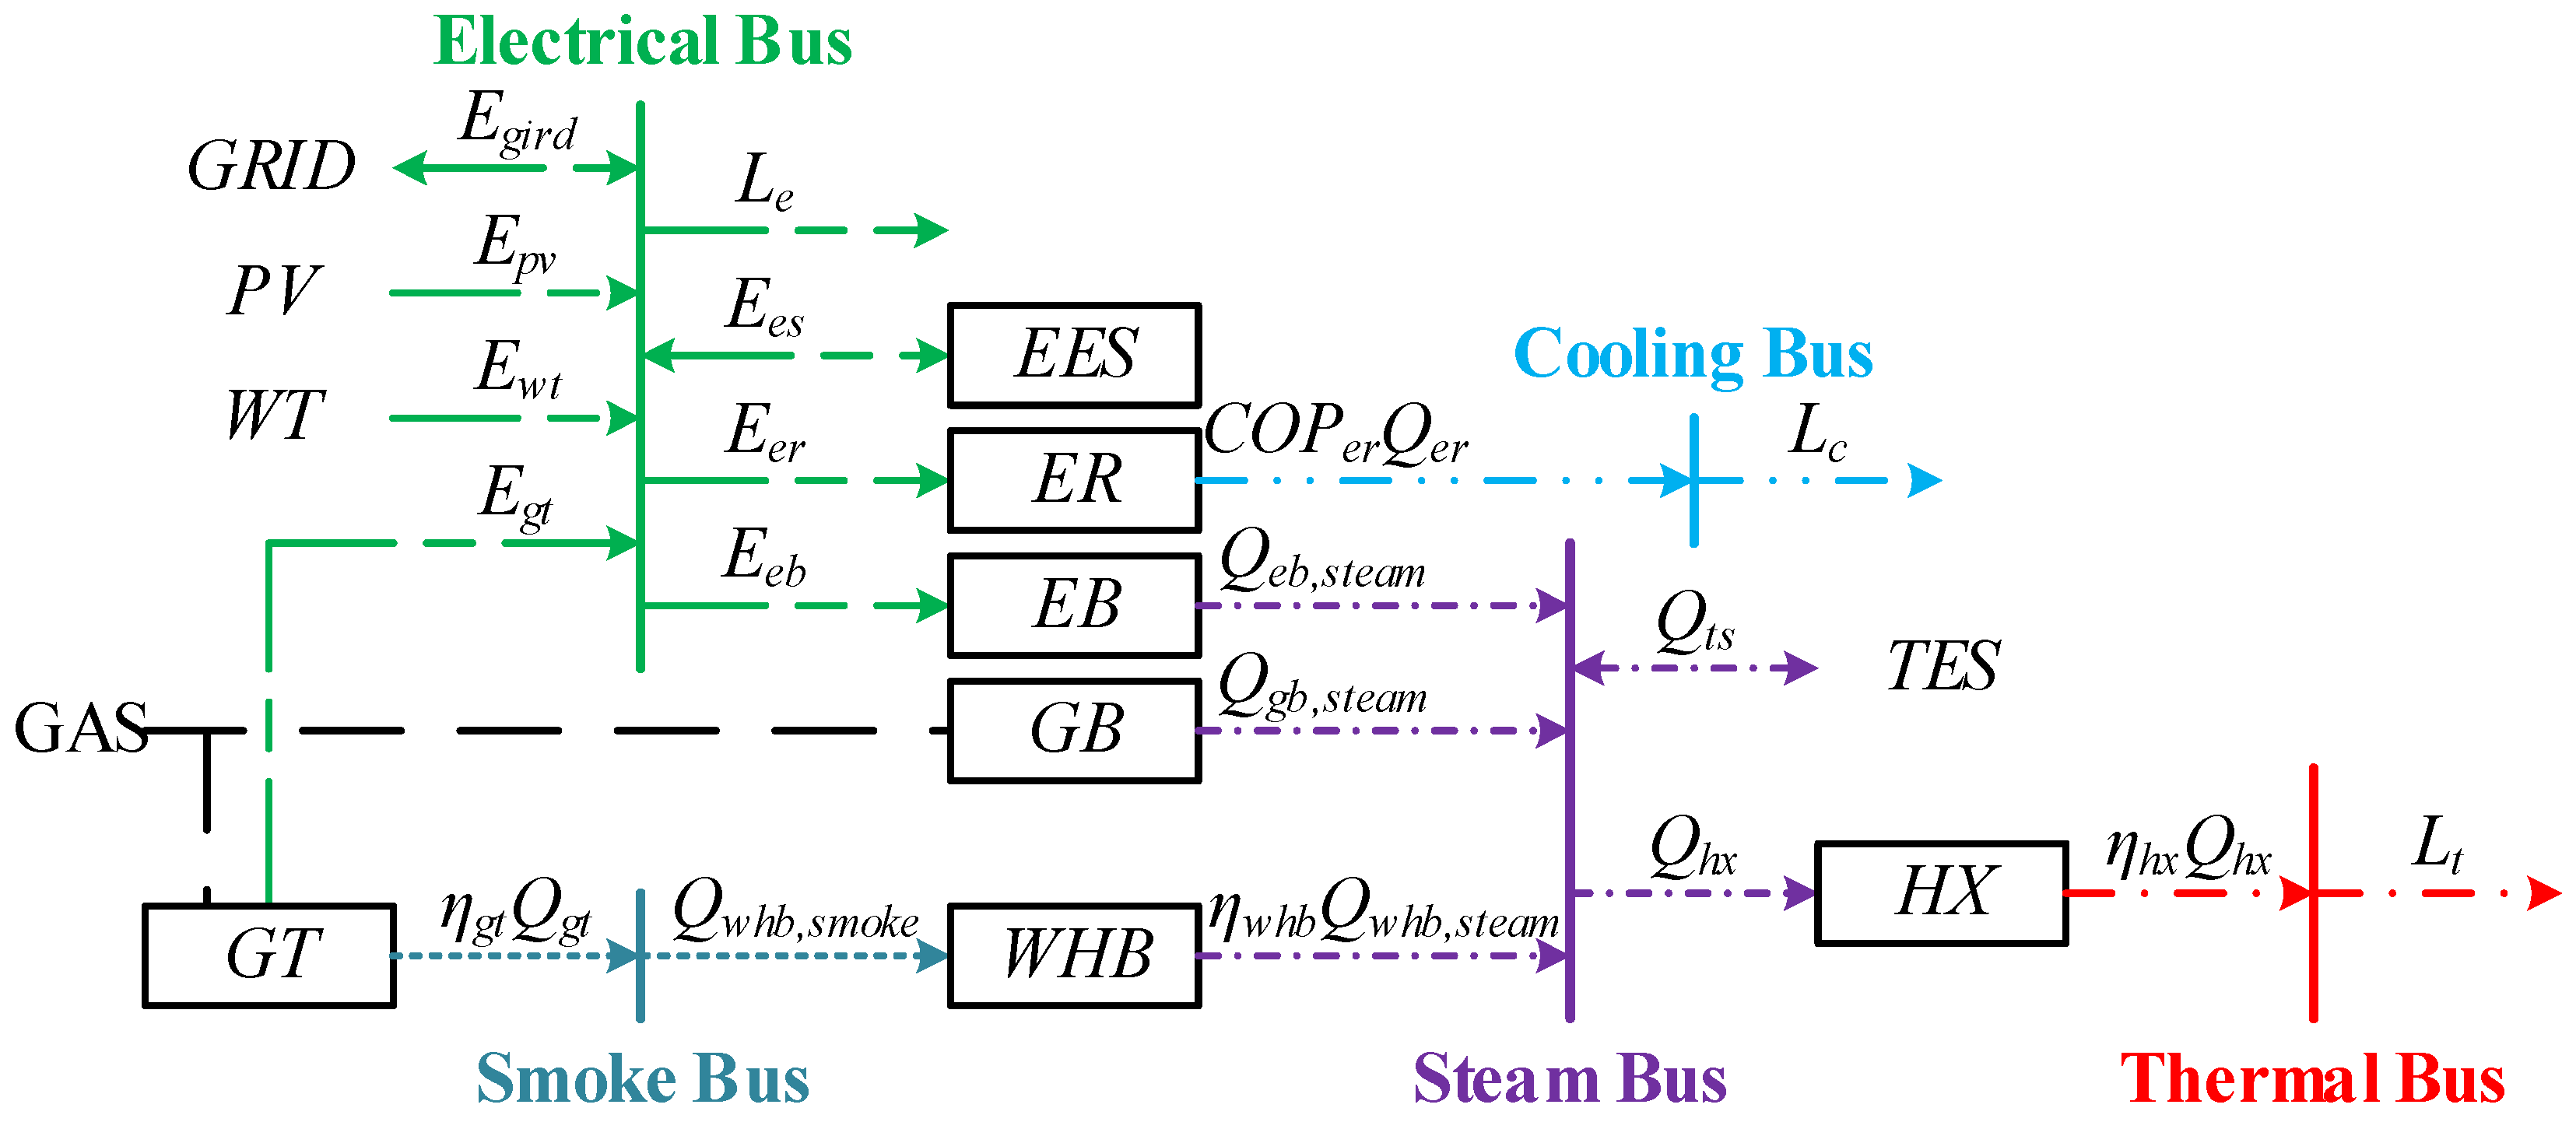
In order to accurately describe the composition of the RIES and the energy flow between devices, the expression of Wang et al. [16] is used for reference. Classifying the buses according to the different types of energy transfer media, buses included in this paper are electrical buses, air buses, smoke buses, hot water buses and steam buses respectively. The bus structure of a gas driving CCHP is shown in Figure 2.
2.2. The Role of the RIES Energy Storage Equipment in the Regulation Market
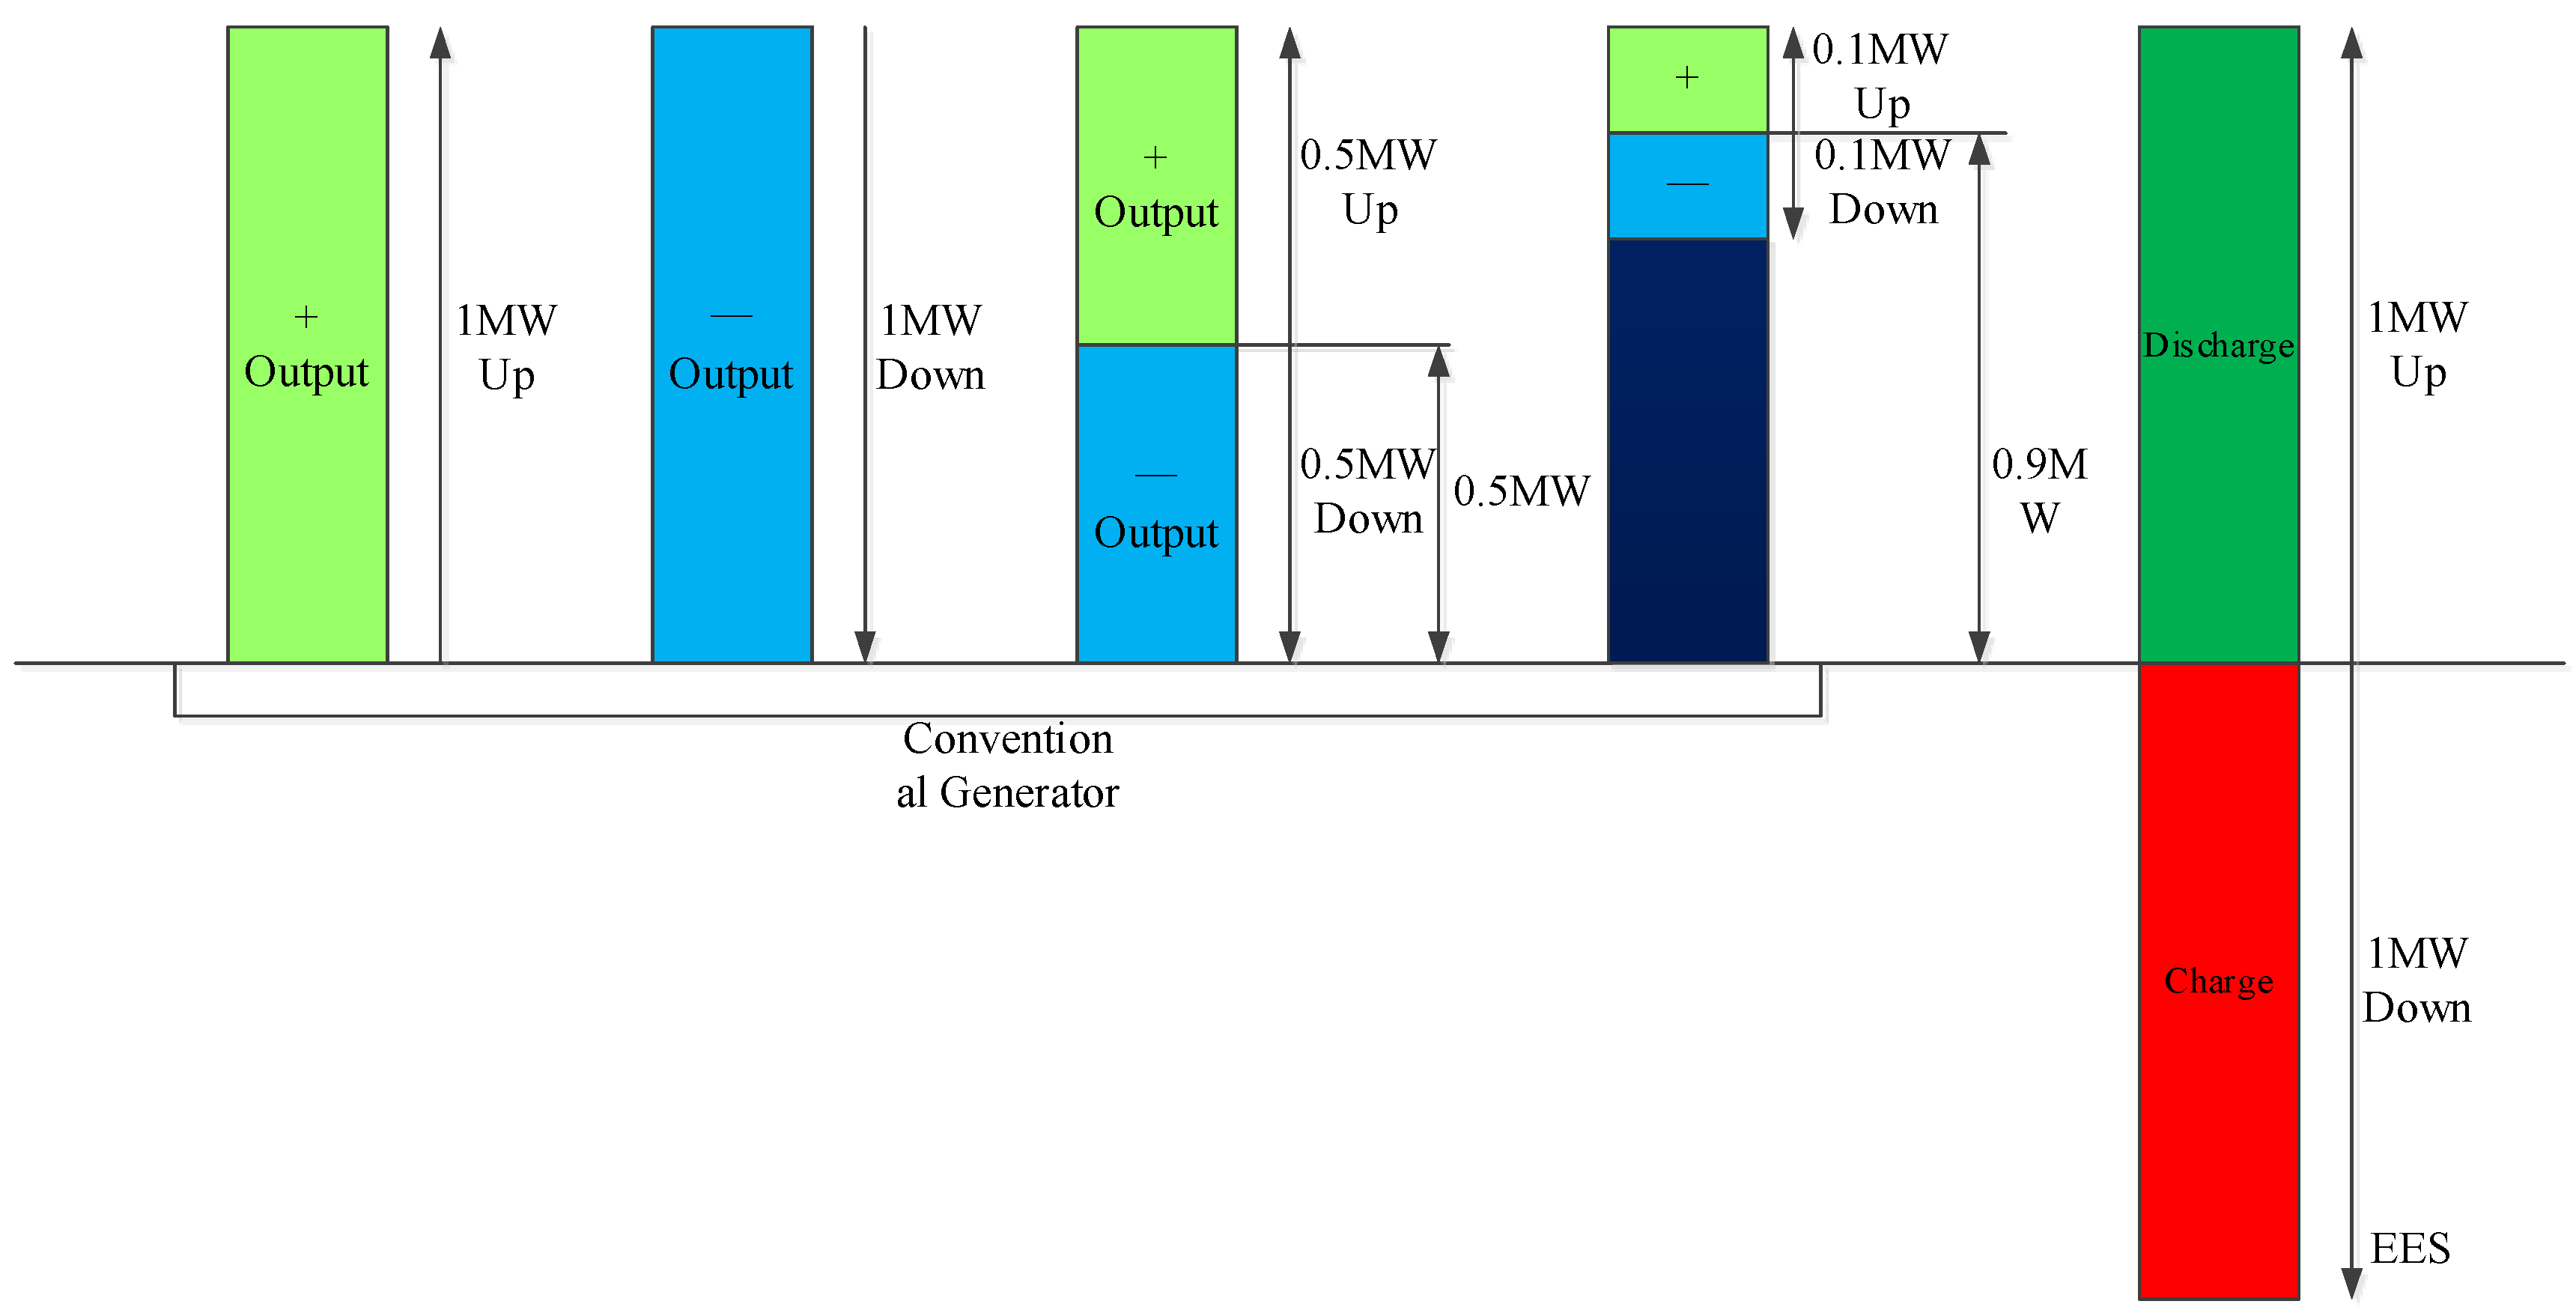
The frequency of the system can be adjusted by controlling the charge and discharge process ESS of RIES [21]. Different from conventional thermal power plants, ESS can be economically operated in the non-full load mode and provide the adjusting ability twice of its capacity. This feature is ideal for providing the power system regulation service. The comparison of regulation ability between EES and the traditional unit is shown in Figure 3. Compared with traditional generators, there are some significant advantages of employing energy storage equipment to provide regulation services. First is the fast response and high ramp rate. It also has a high adjustment accuracy. It can be flexibly switched between the output state and the fully discharging state (or the charging state) with a high accuracy of actions. Hence some malfunctions can be avoided such as adjusting to the opposite direction when the thermal power unit respond to the automatic generation control (AGC) signal [22].
3. The Regulation Service Based on Pay-for-Performance
Regulation service is a reliability product in the ancillary services market that gives market-based compensation to resources. Regulation service can adjust output or consumption in response to an automatic generation control (AGC) signal. Its main goal is to help to maintain interconnection frequency, as well as to help track moment-to-moment fluctuations in customer loads, and to correct the unintended fluctuations in generation and manage differences between actual and scheduled power flow between control areas. The regulation market based on pay-for-performance provides a market for regulation resources. All kinds of regulation resources participants into this market for the purchase and sale of the regulation service to make revenue based on their regulation performance.
Besides, comparing with the old way of compensation (the regulation service based on pay-for-capacity), the regulation service based on pay-for-performance means that the regulation service is compensated depending on the regulation capacity and performance both. So, the Benefits Factor , the Regulation Mileage Rate , and the Historical Performance Score are introduced to adjust the quotation. When there are multiple regulation resources, the market uses the regulation Benefits Factor and the Historical Performance Score to adjust the quoted price of the regulation resource, so that the regulation resource with the best performance is more likely to be selected. The framework of regulation service process based on pay-for-performance is illustrated in Figure 4. The regulation market clearing engine optimizes resource energy schedules and the regulation market clearing prices for operation hour while respecting appropriate data from the regulation service participant and the PJM market.
3.1. Regulation Signal Type
In the regulation market based on pay-for-performance, there are two different types of ACG control signal, RegA and RegD. RegA is for the traditional regulation resources with the slow regulation rate. It uses traditional power generation to carry out regulation service. Its physical characteristics limit the ramp rate. RegD is for the regulation resources with faster regulation rate, which uses the real-time dynamic signal to carry out regulation service and no ramp rate limitation exists. Hydro power can fulfill the characteristics of both signal types at the same time.
The compensation for regulation resources participate in the ancillary service market is composed of two parts. The first part depends on the regulation capacity and the second part depends on the regulation performance which is determined by regulation mileage, quality and clearing price. Mileage is the summation of movement that a resource is following requested by the regulation control signal. It is the absolute sum of movement of the regulation signal in a given time period, which can be expressed as:
where and represent regulation mileage of different regulation resources. and are the power differences of the regulation resource in the adjacent time interval. Resources following the dynamic signal (RegD) can change more dramatically than those on traditional signal (RegA). The mileage ratio is defined as (2). It is the measurement of the relative work (movement) of RegD resources relative to RegA (unit-less). The mileage shows ratio the regulation capability of different regulation resources:
3.2. Benefits Factor
The benefits factor shows the mutual substitution rate between two regulation resources (RegD & RegA), so that they can be quantified. The transforms a fast moving resource’s MWs into traditional MWs or Effective MWs. The offer price of RegD resources can be adjusted based on . The employment of can be used to sort the regulation resources. Based on the ranking results, the resource with good performance and low cost is preferred. In default situation, the Benefits Factor for all RegA resources is 1. can be calculated as follows [23]:
3.2.1. Calculation of the Regulation Capacity Adjusted Based on the Historical Performance Score
The performance score is calculated from three components: the accuracy score, , the delay score, and the precision score [15]. Accuracy denotes the correlation or degree of relationship between control signal and system response. Delay score, , denotes the time delay between control signal and point of highest correlation. Precision score, , denotes the instantaneous error between the control signal and the regulation. At this time, all three components above are weighted equally. Here, a, b, and c are the weight of each factors; in this paper, .
3.2.2. Calculation of Initial Adjusted Total Offer
3.2.3. Ranking Resources
Put resources in ascending rank order based on Initial Adjusted Total Offer. RegD resources with equal to zero.
3.2.4. Calculation of Benefits Factor
The benefits factor is a piecewise function. When the benefits factor of the RegD regulation resource is higher, the offer becomes cheaper and the more efficient resources that can participate in the regulation service:
Here, is the proportion of RegD regulation resource in all regulation resources. is the market regulation demand.
3.2.5. Calculation of Effective Regulation Capacity
Here, is the effective regulation capacity. In accordance with the ranking, regulation resources are called until the cumulative effective regulation service capacity meet the market regulation demand.
3.3. The Lost Opportunity Cost
In general, Lost Opportunity Cost is the difference in net compensation from the energy market between what a resource receives when providing regulation service and what it would have received for providing energy only. The purpose is to quantify the foregone revenue or increased costs incurred by a resource when it is dispatched uneconomically to provide regulation service.
consists of three parts, which can be expressed as [25]:
is the pre-regulation cost, which refers to the increased cost that occurs due to change the output of the regulation resources from the optimal economic operating point to meet the system demand, before the regulation resource participate in regulation. is the cost during the regulation. Because of the output of the regulation resource will change to non-economic operation model during it participation of the regulation. is the post-regulation cost, which is the increased that occurs to change the output of the regulation resources from the regulation operating point to optimal economic operating point:
Here is the day-ahead location marginal price (LMP). is the generating cost before the regulation resource participates into regulation. When RIES is in optimal economic operating state, the exchange power between RIES and the power grid is . is the exchange power between RIES and the power grid when the regulation resource receives the AGC signal. is the time required for the regulation resources to adjust from the economic operation model to the regulation model.
Assuming the ramp rate of the regulation resources is , can be expressed as:
Since the ramp rate of electrical ESS tends to be infinite, , , so the pre-regulation cost and post-regulation cost can be ignored.
4. Solution of Optimal Scheduling of RIES with ESS for Regulation Service
4.1. Objective Function
The problem of maximizing revenue from a RIES is formulated as a MILP optimization problem [17]. The RIES model presented above is combined with a cost function in order to maximize the revenue from the energy arbitrage and the regulation market. The objective function when the RIES participates into arbitrage and regulation is given by:
where is the system overall operating cost. , is the electricity and natural gas purchase price, respectively. is the electrical ESS operating cost. is the thermal ESS operating cost. is the revenue from the regulation market:
where is the number of time periods for the dispatch cycle. is the time period length of each dispatch period, h; is the power exchange between RIES and the power grid at time t = 1,2,…,H. is the locational marginal price of the electricity market, $/MW·h. When the value of is positive. It indicates that RIES buys electricity from power grid. When it is negative, then RIES should sells electricity to obtain profit. Thus we have:
where , represents electricity purchasing price and selling price of RIES system, respectively. Their value is related to the day-ahead price:
where the symbol is the unit heat value price of the natural gas, $/MBTu. and represent generated power of th cogeneration gas turbines and heating power of th gas boiler, MW. is the conversion coefficient that convert megawatt hours to British thermal units, the value is 3.4121, from 1 MWh = 3.4121 MBTu. is the heat efficiency of the gas boiler. is the electrical efficiency of the gas turbines.
It is assumed that the storage device does not reduce its efficiency during operation in the whole operation cycle, the cost of a single complete charge and discharge cycle is calculated by the following equation. The procurement cost is . is the number of reuse times:
The operation cost of one dispatch cycle is:
where , kW·h is the capacity. is charge and discharge power of the ESS.
The major part of the heat storage operation cost is the electricity charge for heat water pump, which can be expressed as:
Here, the term represents the operating cost of thermal ESS, is the electricity price of this period in $/MW·h. is the charge and discharge thermal energy of the thermal ESS.
In the regulation market based on pay for performance, revenue is settled according to the actual contribution of each participant. In the bidding session, each service resource provider reports the callable capacity, response speed, callable time, bid price and other information. The regulation market selects preferred ancillary service provider according to market rules. Based on the settlement rules and data of the regulation market based on pay for performance, the revenue objective function of RIES participating in the regulation service is:
In arbitrary period t, the revenue of RIES participating into regulation mainly from two aspects, regulation capacity benefits which provide regulation spare capacity and the regulation performance benefits , which is shown as in Equations (20)–(22).
Here is the regulation spare capacity provided by RIES in MW. is the regulation market capacity clearing price (RMCCP) of the regulation market. is the power exchange of RIES participating in the regulation service. When the electrical ESS in RIES is used as regulation service, there are two operating modes, which are charging and discharging. Therefore, we should take the absolute value of . Symbol is the mileage rate of the regulation resource. is the regulation market performance clearing price (RMCCP) of regulation market.
4.2. Constraints
The objective function Equation (13) is subjected to a set of system constraints. All the constraints are summarized as follows:
4.2.1. RIES Bus Balance Equation
- Electrical bus balance constraint
- Smoke bus balance constraint
- Steam bus balance constraint
- Hot water bus balance constraint
- Air bus balance constraint
In Equations (23)–(27), is the power exchange of RIES and power grid. , , , , are the generate power of GT, output of PV, output of WT, discharge power of EES, electrical load respectively. The symbols , , , , are the consumed power of ER, consumed power of EB, charge power of EES, capacity of regulation, thermal power production efficiency of GT, respectively. , , , , , represent the output of WHB, thermal power production efficiency of WHB, thermal production power of GB, thermal power of thermal ESS, heat exchanger thermal output, heat discharge power of thermal ESS respectively. , are the heat exchanger efficiency, thermal load. represents the refrigeration efficiency of ER, which is the ratio of refrigerating capacity and input electricity power. is the refrigeration power, is the cooling load.
4.2.2. Constraints of the Units Output Upper and Lower Limit
Here , , , , , represent the electric power, lower and upper electric power limit, thermal power, lower and upper thermal power limit of the device i respectively.
4.2.3. Constraints of the Energy Storage System
1. Electricity EES constraints
The and are the state of charge (SOC) at instant and for the electrical ESS, respectively. and are the lower and the upper limits of the electrical ESS SOC. , , denote the self-discharge rate, charging efficiency, discharging efficiency, respectively. , , are the capacity of the electrical ESS, the power effectively delivered to the grid by the electrical ESS, the power effectively drawn from the grid by the electrical ESS, respectively. and are the charge-discharge state variables of the electrical ESS (0–1 variables).
2. Charge-discharge power constraint of electrical ESS
Here the terms , , , represent the minimum and maximum charge-discharge power of the electricity ESS, respectively.
3. Thermal ESS constraints
where and are the storage state at instant and for the thermal ESS, respectively. The terms , are the capacity lower and the upper limits of the thermal ESS, respectively. , , represent the thermal dissipation rate, charging and discharging efficiency respectively., respectively. and are the thermal charging and discharging power of thermal ESS. , are the variables of the thermal ESS charge-discharge state (0–1 variables).
4. Charge-discharge power constraint of thermal ESS
Here, , are the minimum thermal charging and discharging power respectively. , represent the maximum thermal charge and discharge power of the thermal ESS respectively.
4.2.4. Constraints of the Gas Turbine Output Upper and Lower Limit
Here, and are the upper limit and lower limit of gas turbine output, respectively.
4.2.5. Constraint of the Gas Turbine Ramp Rate
Here, the term represents the output difference of the gas turbine between time t and t + 1.
4.2.6. Reserve Constraint
Considering the possibility that the RIES is likely to be disconnected from the primary power gird at any time, to ensure uninterrupted operation of important loads, the maximum output of the RIES in period k should be equal to or higher than the needs of the important load. The requirement of important load can be described as:
Simultaneously, to ensure that the important load can run continuously for a period of time ts, the maximum energy provided by RIES in the period ts should be greater than the energy demand of the important load in this period, which can be written as:
4.3. Solution
The standard solution model of a mixed integer linear programming problem can be written as:
Here, the variables to be optimized include output, conversion equipment input, ESS input and output, electricity purchase and sell. The constraint equation is an energy balance equation of the bus and the ESS. The inequality constraints are the operation constraints of each unit. For the model above, this paper transforms it into a mixed integer linear programming problem (MILP), which is solved by MATLAB by using YALMIP + CPLEX.
5. Experimental Verification of Proposed Method
5.1. Basic Data
A framework is outlined in this paper for calculating the maximum revenue from a RIES that participates in a day-ahead market, i.e., energy arbitrage, and a regulation market based on pay-for-performance.
An actual operating RIES that is located in Guizhou Province, China, was selected as a simulation case study in this paper. The system includes PV, wind power, gas boiler, electrical/thermal ESS and three gas turbines. Among the three gas turbines, two of them (1#, 2#) are located at the high-speed rail station. The minimum down/up time of these two turbines is 2 h/1 h. One of the turbines is located at a hospital (3#), and its minimum down/up time is 3 h/2 h. The length of dispatching time period is 24 h. the length of dispatching time is 1 h. The capacity of each device is shown in Table 1.
In this simulation, we take a Siemens SGT-100 industrial gas turbine as an example. The power generation of this gas turbine is 5.05 MW. Its electrical efficiency is 30.2% and heat rate is 11,292 Btu/kWh, which means that the fuel cost coefficient is 11.292 MBTu/MWh [26]. As for gas purchase price, we use the average price of gas purchase price in the first two quarters of 2017 which is released by the US Energy Information Administration. The purchase price of natural gas for power generation is 3.738 $/MBTu [27].
The capacity, initial energy, the ESS upper and lower limits of the ESS are presented in Table 2. The procurement cost of electrical ESS is 3.03 × 10 6 $ and the number of charge-discharge cycle is 6000 times.
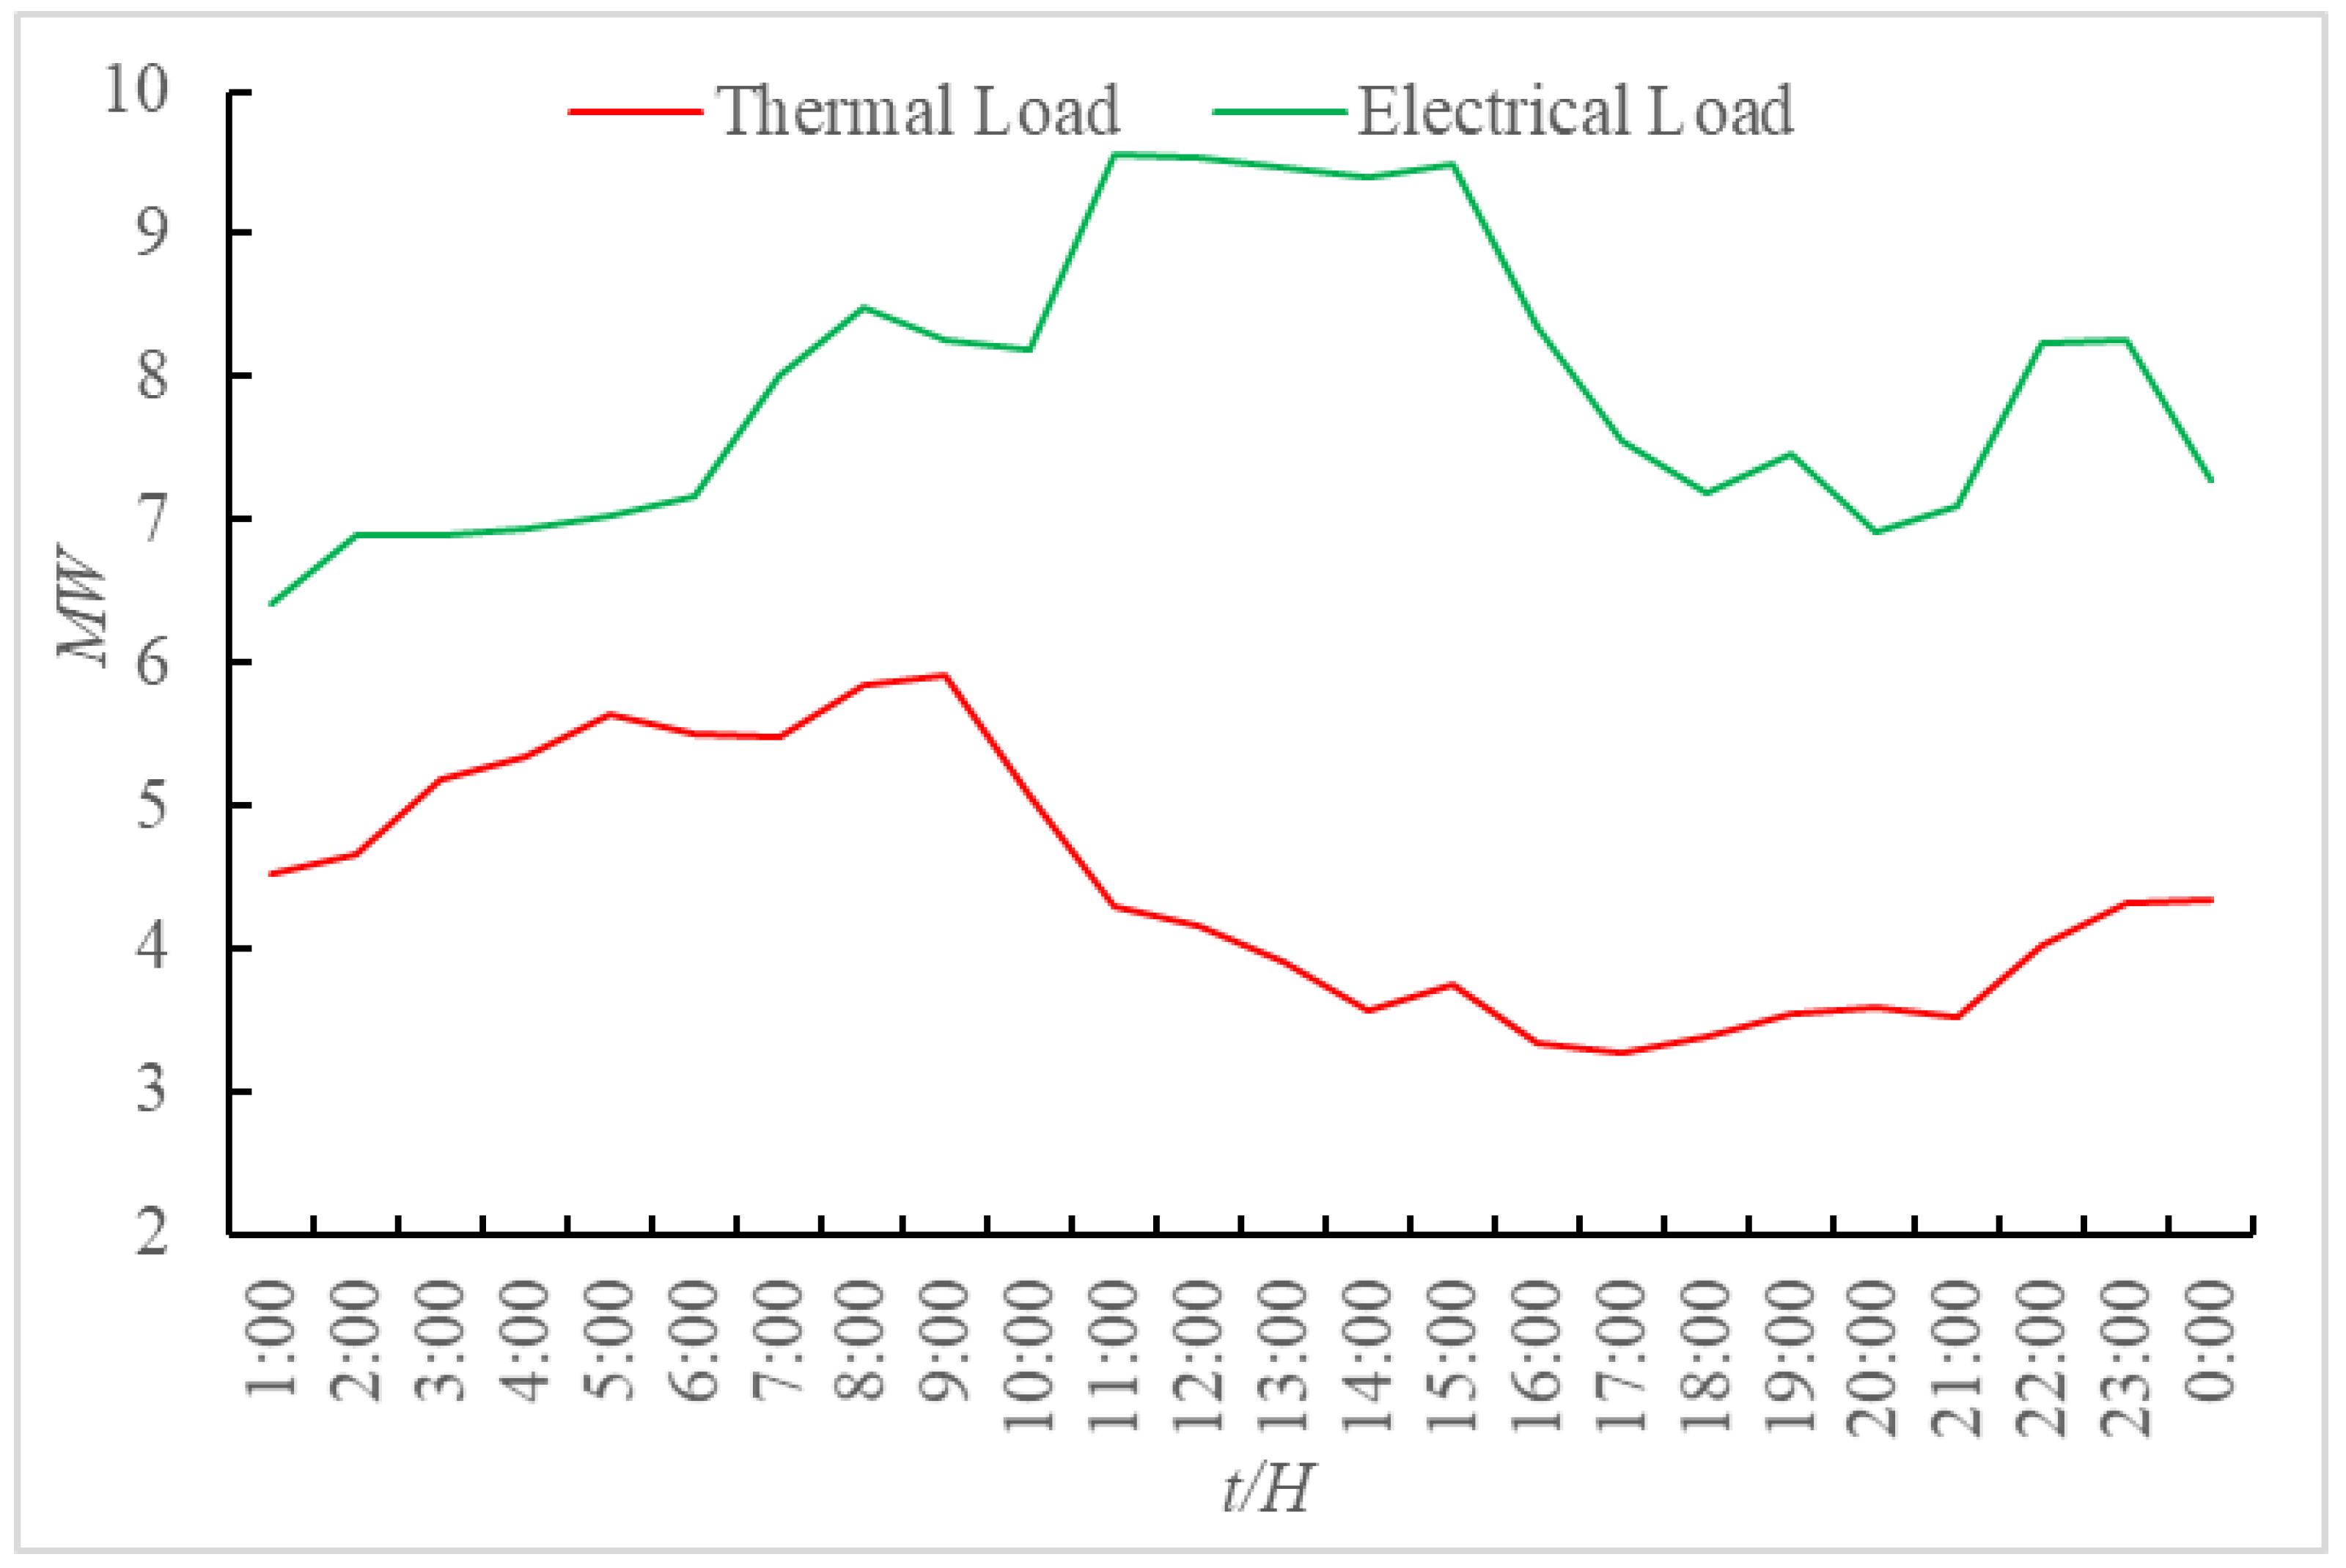
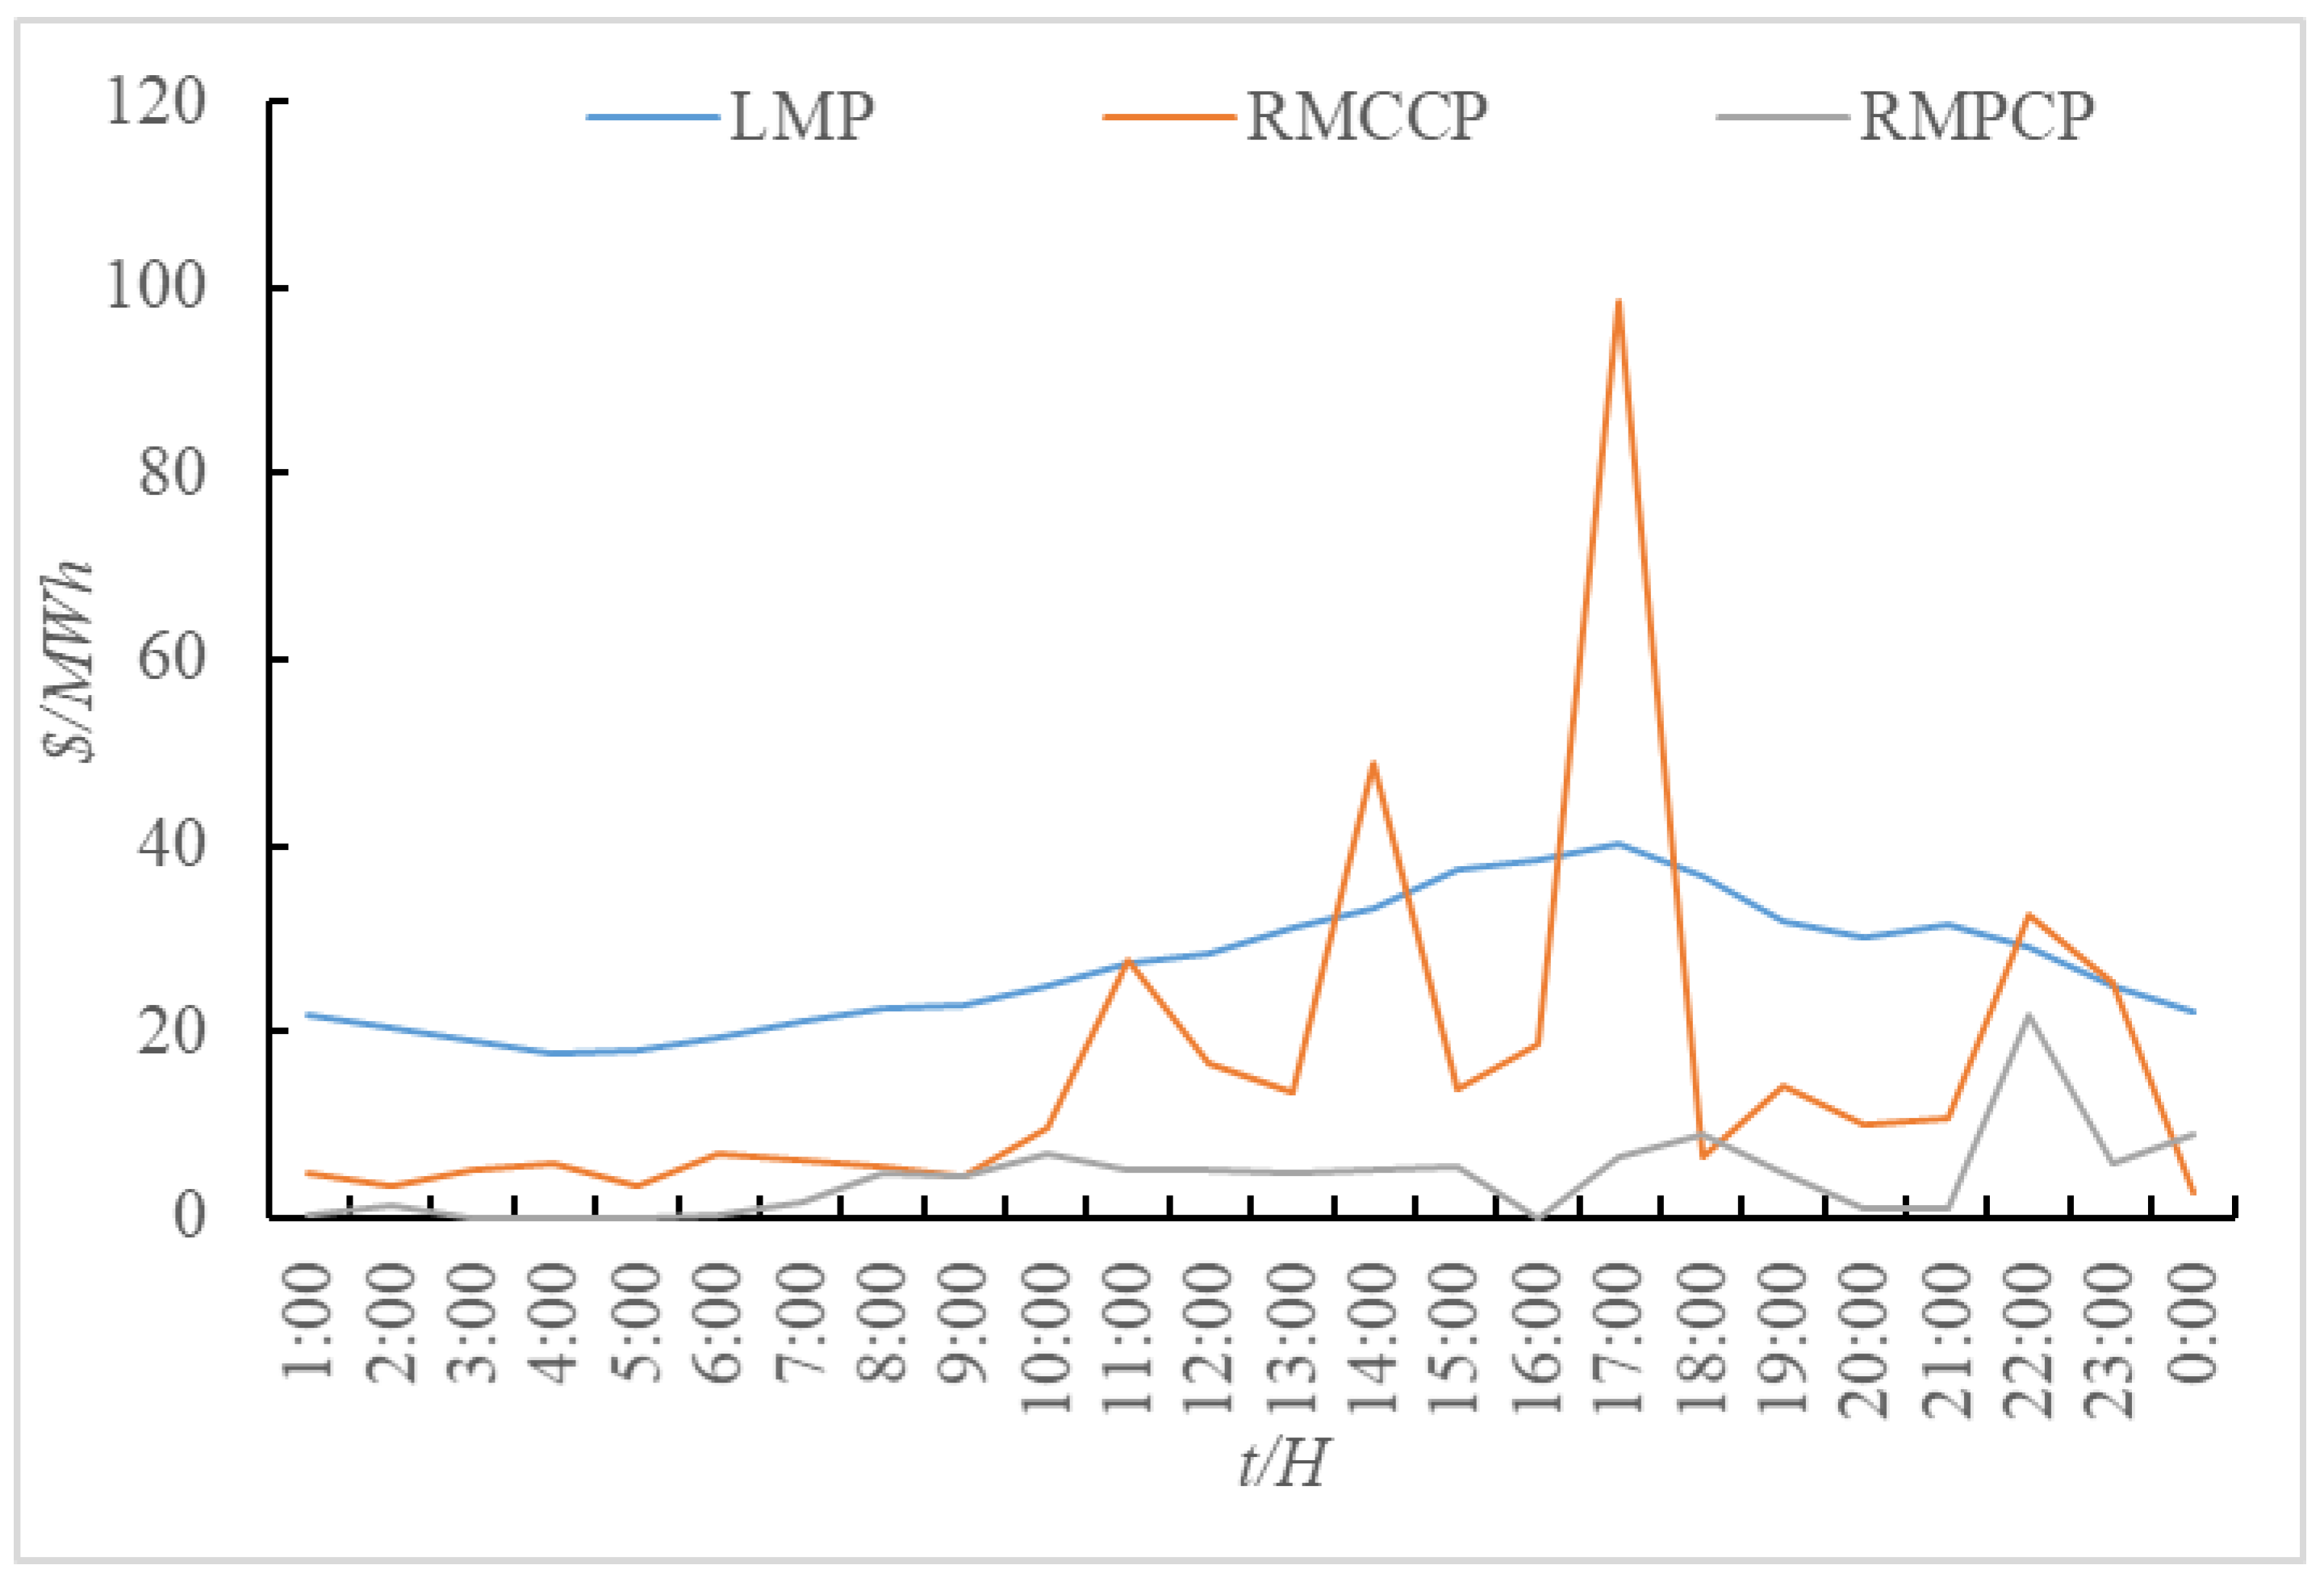
The relevant parameters of the main device are shown in Table 3 [28,29,30,31,32]. Due to the self-discharge rate of lithium battery storage is only about 3% per month [31], 0% can be taken as the self-discharge rate. Renewable energy output curve, RIES electrical/thermal load forecast curve are shown in Figure 5 and Figure 6. Electricity and regulation market price is from the US PJM power market. The price curve of 17 August 2017 is shown in Figure 7. The dispatching time length is 1 h, and the specific values are shown in Table A1 of Appendix A [33]. The historical performance score of different types of regulation resources published by PJM is shown in Table 4.
The sensitive load in RIES is 5 MW, the important load should operate uninterruptedly for at least one hour after the system disconnects from the primary power grid.
5.2. Examples Analysis
and can be obtained after taking related parameters of different types of regulation resources into Equations (1)–(12). Then we can rank the results of the and according to the calculations. In this paper, the regulation resource is electrical ESS and gas turbine. The specific parameters are shown in Table 5. In order to reflect the and of different regulation resources, hydropower and the Demand Side Resource (DSR) datas are added for comparison into Table 5.
In order to show the cost difference between electrical ESS of RIES and other types of regulation resources that have participated into regulation service, three operating modes are selected as examples in this paper.
- Mode 1: RIES is in economic operation mode and does not participate in regulation service.
- Mode 2: Gas turbines and electrical ESS in RIES participate in regulation services.
- Mode 3: Only the electrical ESS in RIES participates in regulation services.
Operating Cost of RIES under there three modes are shown in Table 6.
The output of each unit from the RIES under Mode 1 is shown in Figure 8. RIES utilizes the electrical ESS to decouple “electric power defined by its quantity of thermal produced” coupling relationship. The power output limit of the gas turbine is removed.
The objective function with lowest electricity generation cost is connected to the objective function with lowest heat generation cost. Obtain the optimal dispatching strategy of each unit under the premise of satisfying the operating constraints, while with the minimum cost of electricity/heat generation. In Mode 1, RIES achieves the electric-thermal joint dispatch, but does not participate into the regulation market.
In Mode 2, when electrical ESS of RIES and gas turbines are used as regulation resources, their ramp rate of them are infinite, which means that t = 0, . And the non-economic dispatching cost in regulation service . However, due to the gas turbine acts as a regulation unit with the down/up time constraints, it needs to ensure a certain period of operating time. Besides, the fuel cost is too high, so the overall operating costs increased.
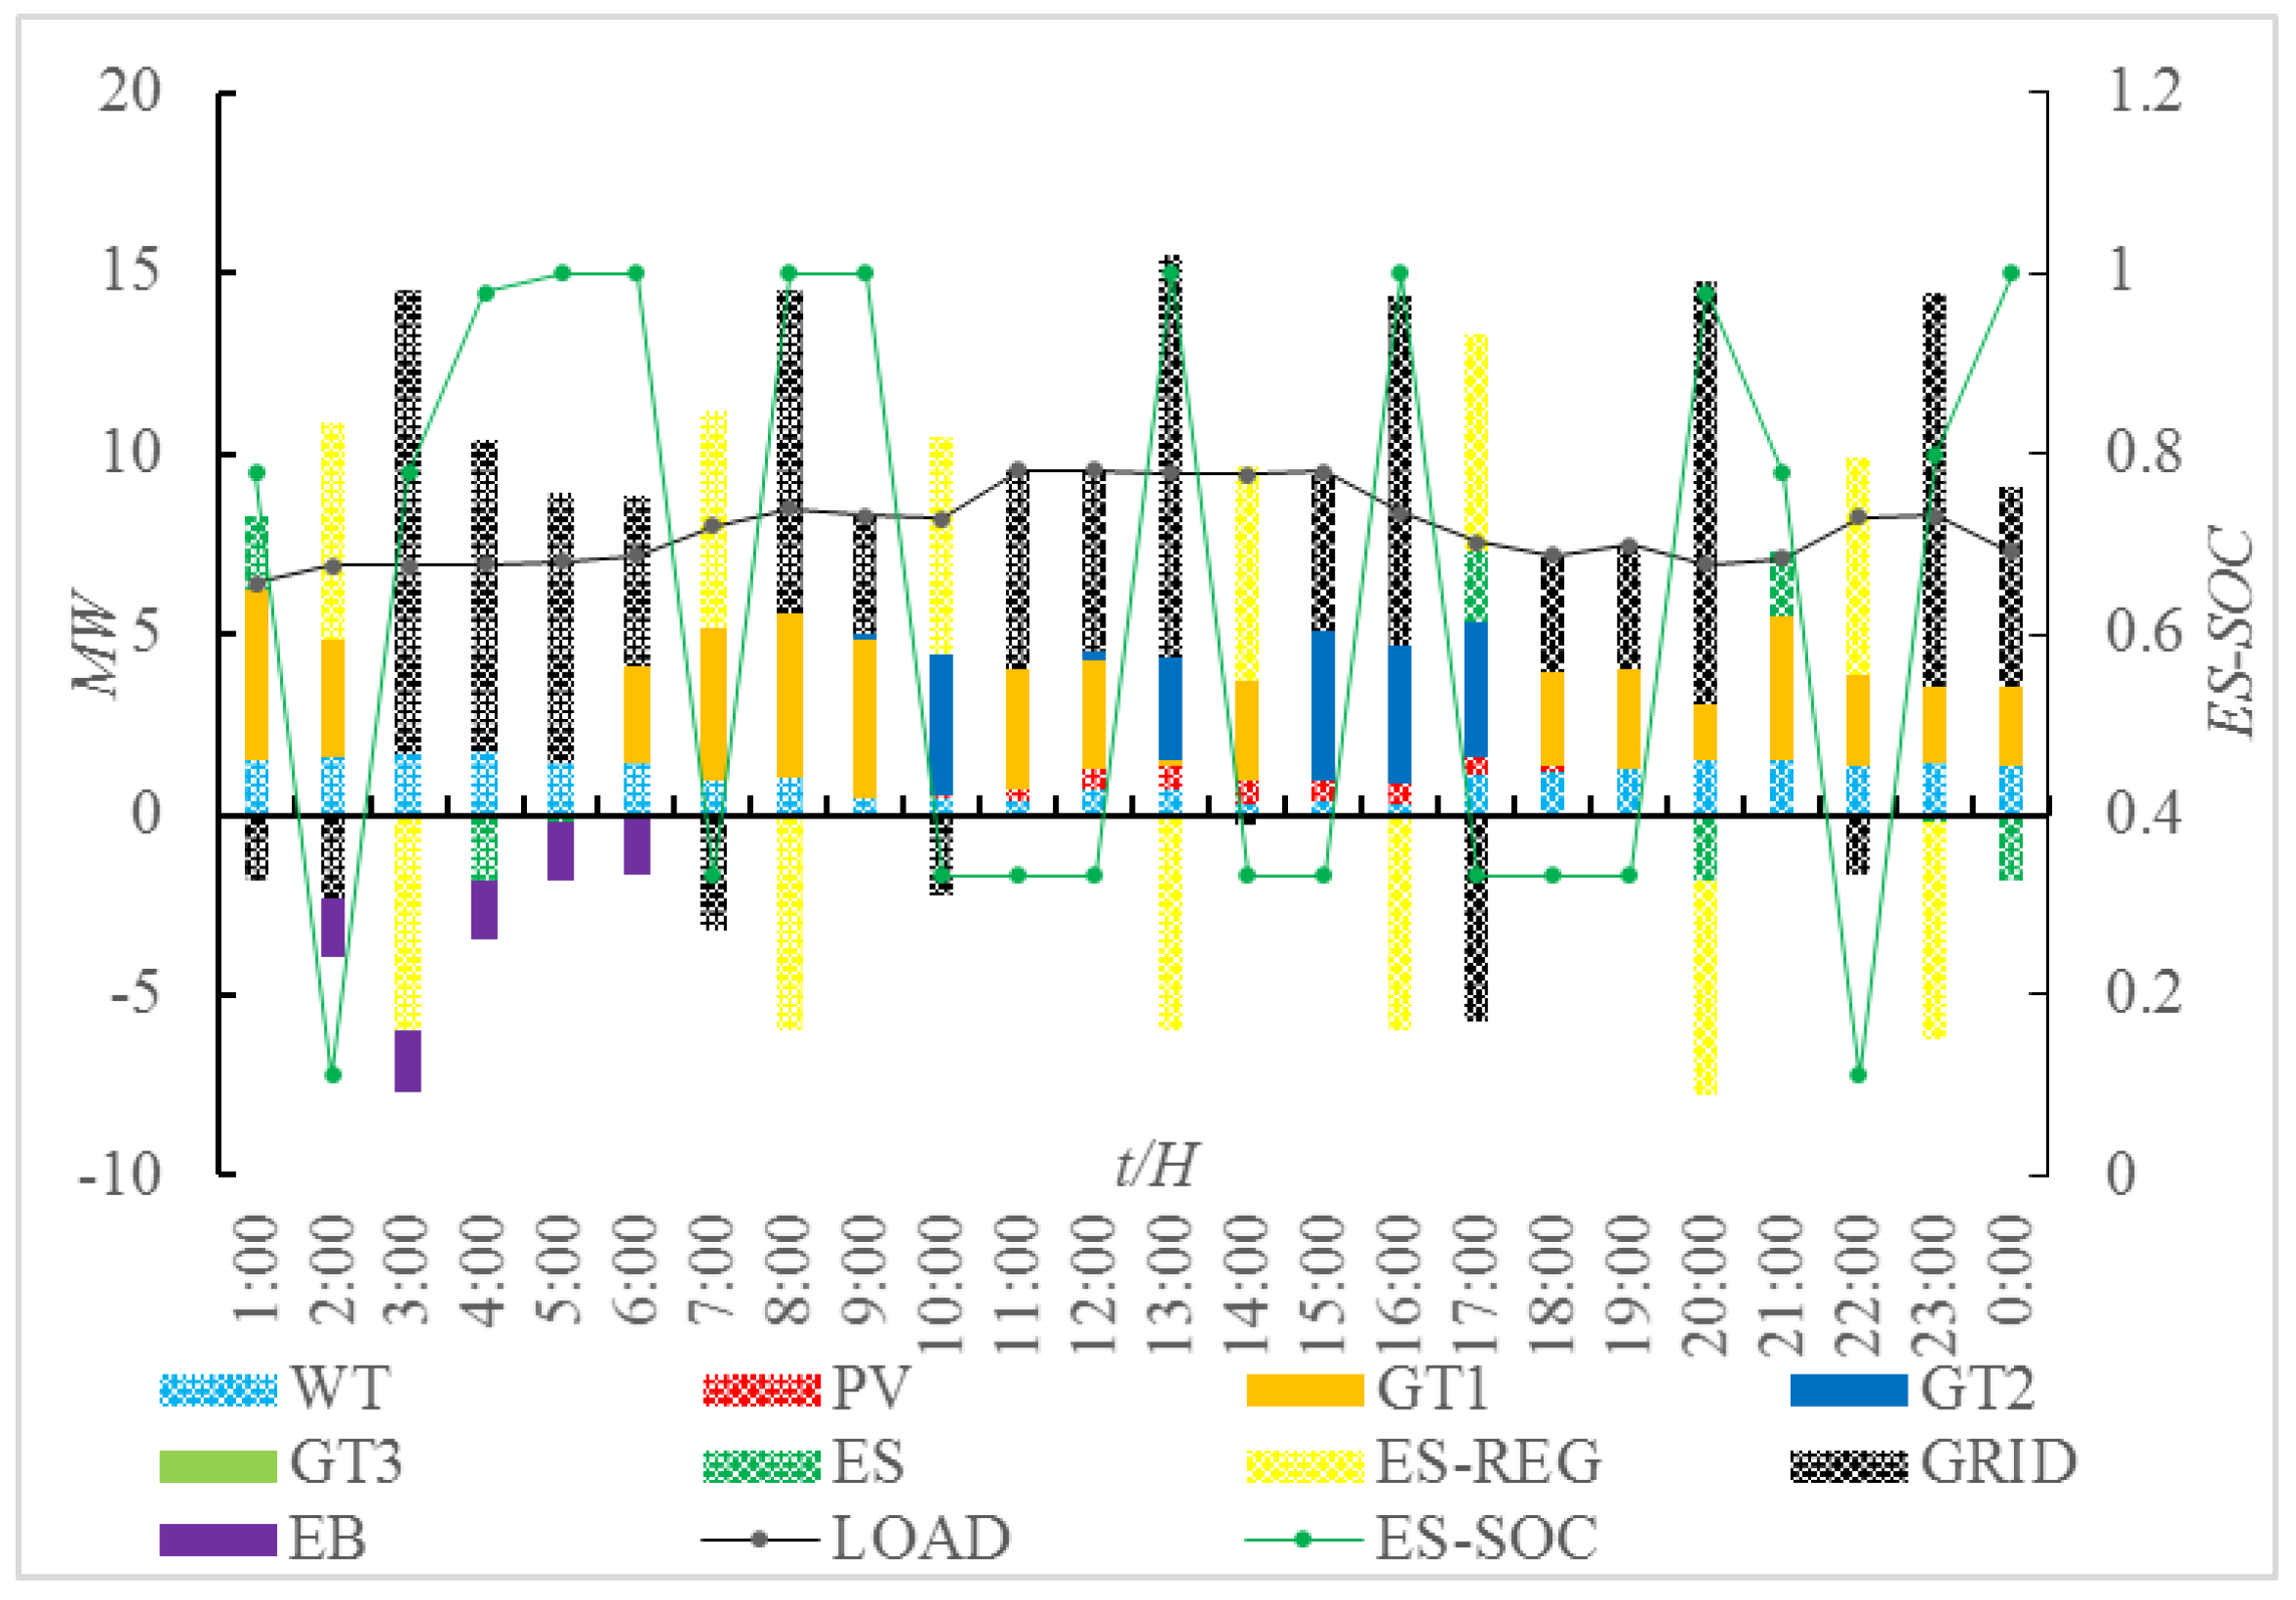
In Mode 3, only the electrical ESS in RIES participates in regulation services. System operating cost can be significantly reduced. By rational use of the compensation mechanism of electrical ESS to participate in regulation service, and deeply engaged in regulation on the basis of promoting the renewable energy consumption, the fact that electrical ESS participates into regulation services can bring additional revenue can be fully reflected. Simulation result of Mode 3 is shown as Figure 9.
Combined with the price curve to analyze, the operating characteristics of the electric storage does not participate in regulation service can be discussed as follows: Figure 8a shows the electrical load balance condition and the ES-SOC curve in the economic model. At 1: 00, when the day-ahead LMP is high, RIES releases energy to the power grid to arbitrage and reduce the operating cost. At 1: 00–10: 00, the LMP and load are in the trough period. The renewable energy output gradually increased, the electric load is supplied by the power grid and the gas turbine, and the electric ESS is charged. At 11: 00–17: 00, the load gradually increased and the day-ahead LMP is relatively stable. RIES gains more power from the grid. At 17:00–18:00, the day-ahead LMP reaches the peak. Electrical ESS starts to release energy to reduce system operating cost. At 20:00–21:00, the procedure is the same as 17:00–18:00.
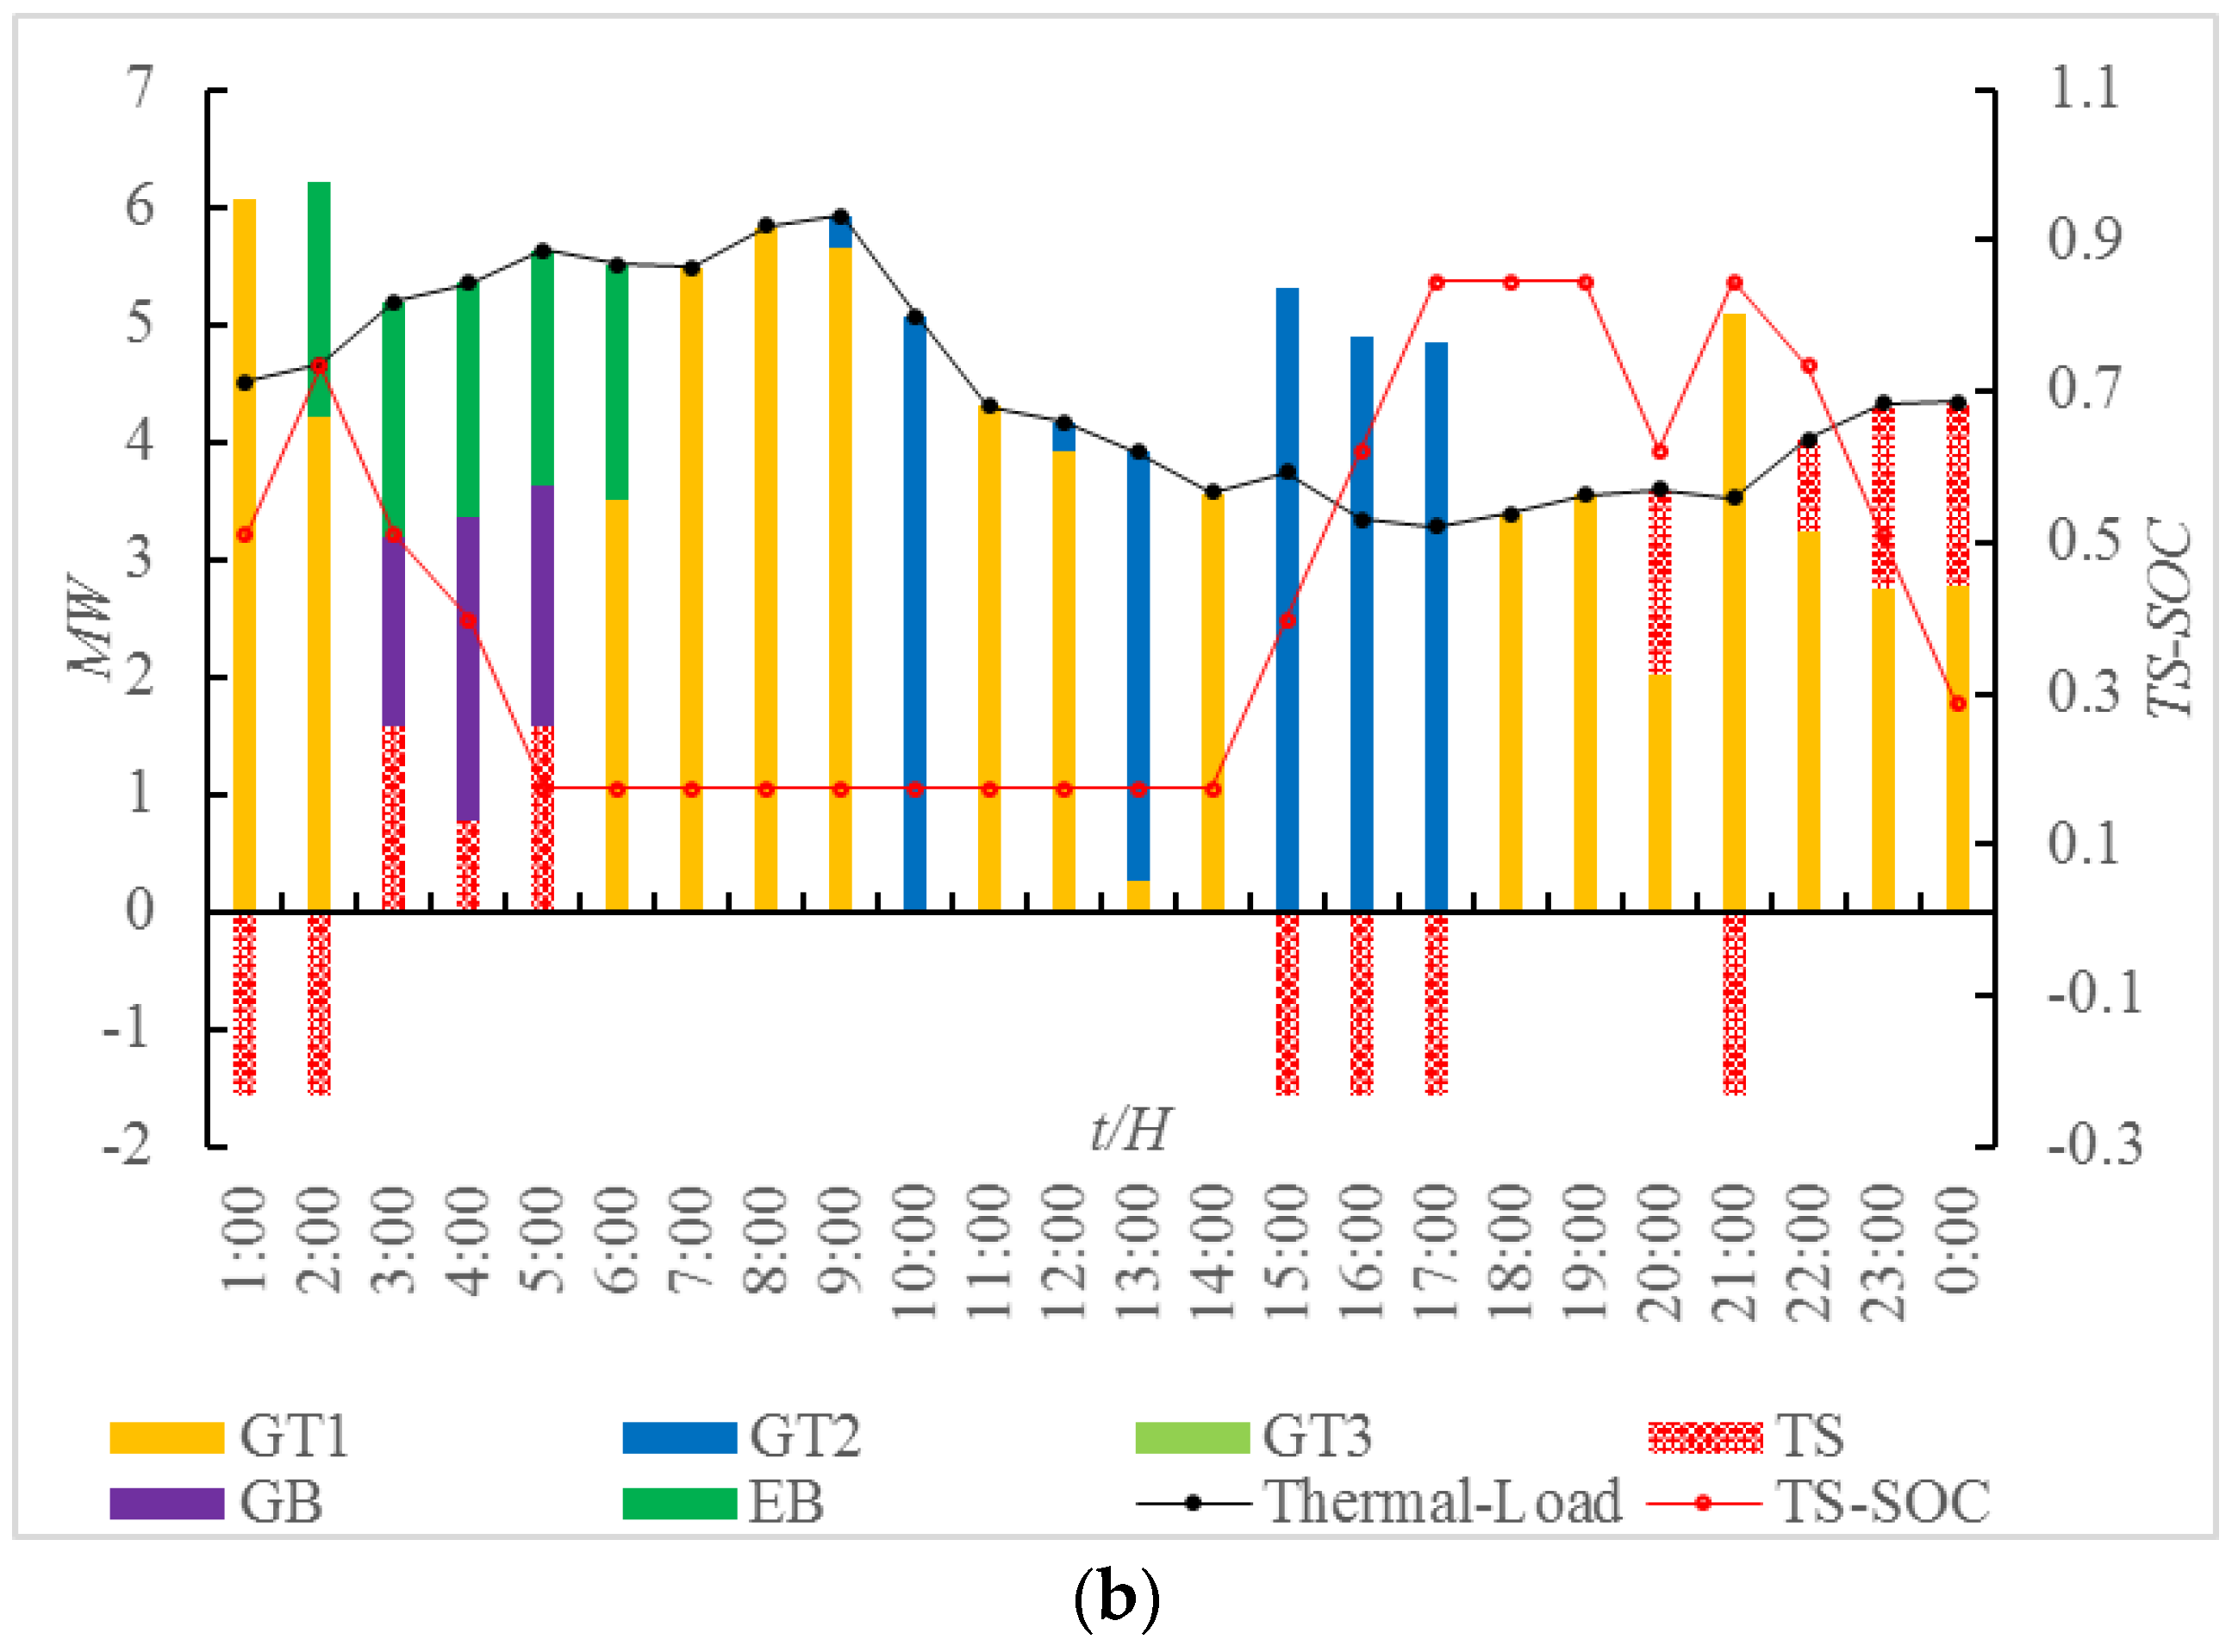
Figure 8a shows the thermal load balance condition and the TS-SOC curve in the economic model. Due to the presence of the thermal ESS and electric boiler, thermal load is not completely provided by GTs. The flexibility of system operation has been improved.
Figure 9 shows the electrical load balance condition and ES-SOC curve in the regulation model. The operating characteristics of electrical ESS which participates in the regulation service are summarized as follows: the regulation capacity clearing price and the regulation performance clearing price is the highest at 2:00, 11:00, 14:00, 17:00, 22:00. The electrical ESS should be charged before these windows. With the rising of the regulation capacity clearing price and the regulation performance clearing price, the electrical ESS begins to release energy and makes RIES profit from the regulation market.
6. Conclusions
To increase the proportion of renewable energy in the energy system is not only the future direction but also an important strategy for the development of the global energy industry. However, the great amount of the renewable energy integration into the power system will cause non-negligible frequency offsets. In this paper, an optimization model for RIES to participate in the regulation market based on pay-for-performance is proposed and three operating modes are selected as the example. To achieve the maximum profit by making a balance between the power trading revenue and regulation market revenue, this paper uses the actual operation model and the data of the PJM regulation market to guide the optimal allocation of regulation resource in the regional integrated energy system. The simulation results in MATLAB are presented s to verify the performance of the optimal scheduling. The optimization model of RIES with electrical ESS based on pay-for-performance as proposed in this paper shows promising prospects for future development.
Acknowledgments
The authors are grateful for the projects (51777142 and 51477121), supported by the National Natural Science Foundation of China, and the project (2015BAA01B01), supported by the National Science and Technology Support Program of China.
Author Contributions
Hengrui Ma and Bo Wang designed the main port of the study, including RIES modeling, economic model and solution of RIES participate in the regulation market, simulation and experiment. Wenzhong Gao and Dichen Liu were responsible for guidance, a number of key suggestions, and analysis of optimization results. Yong Sun and Baoju Li were also responsible for some constructive suggestions.
Conflicts of Interest
The authors declare no conflict of interest.
Appendix A

Table A1.
PJM market price day ahead.
| Time | LMP | RMCCP | RMPCP |
|---|---|---|---|
| 1:00 | 21.63 | 4.88 | 0.1 |
| 2:00 | 20.29 | 3.53 | 1.35 |
| 3:00 | 18.91 | 5.23 | 0.06 |
| 4:00 | 17.58 | 5.84 | 0.04 |
| 5:00 | 17.89 | 3.25 | 0.05 |
| 6:00 | 19.49 | 6.86 | 0.11 |
| 7:00 | 21.11 | 6.27 | 1.61 |
| 8:00 | 22.51 | 5.35 | 4.71 |
| 9:00 | 22.73 | 4.29 | 4.51 |
| 10:00 | 24.88 | 9.6 | 6.76 |
| 11:00 | 27.52 | 27.83 | 5.18 |
| 12:00 | 28.4 | 16.65 | 5.08 |
| 13:00 | 31.07 | 13.45 | 4.78 |
| 14:00 | 33.29 | 49.06 | 5.23 |
| 15:00 | 37.47 | 13.64 | 5.46 |
| 16:00 | 38.35 | 18.81 | 0 |
| 17:00 | 40.31 | 98.42 | 6.42 |
| 18:00 | 36.82 | 6.36 | 8.94 |
| 19:00 | 31.82 | 14.04 | 4.69 |
| 20:00 | 30.21 | 10 | 0.98 |
| 21:00 | 31.67 | 10.7 | 0.8 |
| 22:00 | 29.03 | 32.4 | 21.79 |
| 23:00 | 24.78 | 25.39 | 5.96 |
| 0:00 | 22.06 | 2.85 | 9.04 |
References
- Singer, S.; Denruyter, J.P.; Yener, D. The Energy Report: 100% Renewable Energy by 2050, towards 100% Renewable Energy; Springer: Cham, Switzerland, 2017; pp. 379–383. [Google Scholar]
- Chen, H.; Hankendi, C.; Caramanis, M.C.; Coskun, A.K. Dynamic server power capping for enabling data center participation in power markets. In Proceedings of the 2013 IEEE/ACM International Conference on Computer-Aided Design, San Jose, CA, USA, 18–21 November 2013; pp. 122–129. [Google Scholar]
- Li, Z.; Ye, L.; Zhao, Y.; Song, X.; Teng, J.; Jin, J. Short-term wind power prediction based on extreme learning machine with error correction. Prot. Control Mod. Power Syst. 2016, 1, 1–8. [Google Scholar] [CrossRef]
- Xiu, C.; Han, H.; Xueping, W.; Chuangxin, G.; Yinan, J.; Dilin, M. Software defined grid: Concept, architecture and samples. Autom. Electr. Power Syst. 2016, 40, 1–9. [Google Scholar]
- Xiangke, L. Limiting the “three north” wind power future development will turn to the central and southern. China Strateg. Emerg. Ind. 2017, 3, 36–37. [Google Scholar]
- Xin, M.; Dongxia, Z.; Xuankun, S. Matrix representation of global power energy internet topology. Autom. Electr. Power Syst. 2016, 40, 8–16. [Google Scholar]
- Ming, Z.; Yongqi, Y.; Dunnan, L.; Bo, Z.; Shao-Jie, O.; Hai-Ying, L.; Xu, H. Generationgrid-load-storage coordinative optimal operation mode of energy internet and key technologies. Power Syst. Technol. 2016, 40, 114–124. [Google Scholar]
- Rifkin, J. The Third Industrial Revolution: How Lateral Power Is Transforming Energy, the Economy, and the World; Macmillan: Basingstoke, UK, 2011; Volume 2, pp. 67–68. [Google Scholar]
- Xiao, L.; Changsheng, H.; Changjin, L.; Dehong, X. Modelling and controlling of SCES based wind farm power regulation system. Autom. Electr. Power Syst. 2009, 33, 86–90. [Google Scholar]
- Yoshimoto, K.; Nanahara, T.; Koshimizu, G. Analysis of data obtained in demonstration test about battery energy storage system to mitigate output fluctuation of wind farm. In Proceedings of the 2009 CIGRE/IEEE PES Joint Symposium Integration of Wide-Scale Renewable Resources into the Power Delivery System, Calgary, AB, Canada, 29–31 July 2009; p. 1. [Google Scholar]
- Ding, M.; Xu, N.; Bi, R. Modeling of BESS for smoothing renewable energy output fluctuations. Autom. Electr. Power Syst. 2011, 35, 66–72. [Google Scholar]
- Eyer, J.; Corey, G. Energy storage for the electricity grid: Benefits and market potential assessment guide. Sandia Natl. Lab. 2010, 20, 5. [Google Scholar]
- Rittershausen, J.; McDonagh, M. Moving Energy Storage from Concept to Reality: Southern California Edison’s Approach to Evaluating Energy Storage. A White Paper by Southern California Edison. 2011. Available online: https://www.edison.com/content/dam/eix/documents/innovation/smart-grids/Energy-Storage-Concept-to-Reality-Edison.pdf (accessed on 1 July 2018).
- Graves, F.; Jenkin, T.; Murphy, D. Opportunities for electricity storage in deregulating markets. Electr. J. 1999, 12, 46–56. [Google Scholar] [CrossRef]
- Byrne, R.H.; Silva-Monroy, C.A. Estimating the Maximum Potential Revenue for Grid Connected Electricity Storage: Arbitrage and Regulation; Sandia National Laboratories: Livermore, CA, USA, 2012.
- Byrne, R.H.; Silva-Monroy, C.A. Potential revenue from electrical energy storage in the Electricity Reliability Council of Texas (ERCOT). In Proceedings of the PES General Meeting|Conference & Exposition, National Harbor, MD, USA, 27–31 July 2014; pp. 1–5. [Google Scholar]
- Geidl, M. Integrated Modeling and Optimization of Multi-Carrier Energy Systems. Ph.D. Thesis, ETH Zürich, Zürich, Switzerland, 2007. [Google Scholar]
- Geidl, M.; Andersson, G. Optimal power flow of multiple energy carriers. IEEE Trans. Power Syst. 2007, 22, 145–155. [Google Scholar] [CrossRef]
- Kienzle, F.; Ahcin, P.; Andersson, G. Valuing investments in multi-energy conversion, storage, and demand-side management systems under uncertainty. IEEE Trans. Sustain. Energy 2011, 2, 194–202. [Google Scholar] [CrossRef]
- Hongbin, S.; Zhaoguang, P.; Qinglai, G. Energy management for multi-energy flow: Challenges and prospects. Autom. Electr. Power Syst. 2016, 40, 1–8. [Google Scholar]
- Chengshan, W.; Bowen, H.; Li, G.; Deju, Z.; Wenjian, L. A general modeling method for optimal dispatch of combined cooling, heating and power microgrid. Proc. CSEE 2013, 33, 26–33. [Google Scholar]
- Chen, D.; Zhang, L.; Wang, S.; Mou, L. Development of energy storage in frequency regulation market of United States and its enlightenment. Autom. Electr. Power Syst. 2013, 37, 9–13. [Google Scholar]
- Regulation Market Concepts- Benefits Factor Calculation. Available online: http://www.pjm.com/-/media/markets-ops/ancillary/regulation-market-concepts-benefits-factor-calculation.ashx?la=en (accessed on 1 July 2018).
- Performance, Mileage and the Mileage Ratio. Available online: http://www.pjm.com/~/media/committees-groups/task-forces/rmistf/20151111/20151111-item-05-performance-based-regulation-concepts.ashx (accessed on 1 July 2018).
- Regulation Uplift and Lost Opportunity Cost. Available online: http://www.pjm.com/-/media/markets-ops/ancillary/regulation-uplift-and-lost-opportunity-cost.ashx?la=en (accessed on 1 July 2018).
- Industrial Gas Turbines CN 2013. Available online: http://w3.siemens.com.cn/energy/cn/zh/FpowerGeneration/gasturbines/Documents/Industrial_Gas_Turbines_CN_2013.pdf (accessed on 1 July 2018).
- Natural Gas Prices. Available online: https://www.eia.gov/dnav/ng/ng_pri_sum_dcu_nus_m.htm (accessed on 1 July 2018).
- Zhending, Z.; Xiangrong, Y.E.; Zhiqiang, Z. Sensitivity Analysis on Thermal Efficiency of CHP Gas Waster Heat Boiler; Guangdong Electric Power: Guangzhou, China, 2011; pp. 11–13. [Google Scholar]
- Jintuo, L.; Yang, L.; Zenghong, X. Application of wind curtailment in power plant heat recovery system. J. Shenyang Inst. Eng. Nat. Sci. 2016, 12, 28–31. [Google Scholar]
- Zhaokui, Q.; Weiqi, L.; Weihua, X.; Jianping, F. The thermodynamic analysis of the natural gas cooling and heating power system for the micro gas turbine. Nat. Gas Ind. 2008, 28, 129–131. [Google Scholar]
- Li, F.; Xie, K.; Zhang, X.; Zhao, B.; Chen, J. Optimization of coordinated control parameters for hybrid energy storage. Autom. Electr. Power Syst. 2014, 38, 1–5. [Google Scholar]
- Wang, J.; Cheng, Z.; Shen, C. Analysis on Energy Saving Effect of Gas-Fired Boiler Replacement of Coal-Fired Boiler; Ningbo Jie Neng: Ningbo, Zhejiang, 2015; pp. 29–31. [Google Scholar]
- Dataminer. Ancillary Services. Available online: https://dataminer.pjm.com/dataminerui/pages/public/aso.jsf (accessed on 1 July 2018).
Figure 1.
Energy hub structure diagram of the RIES.
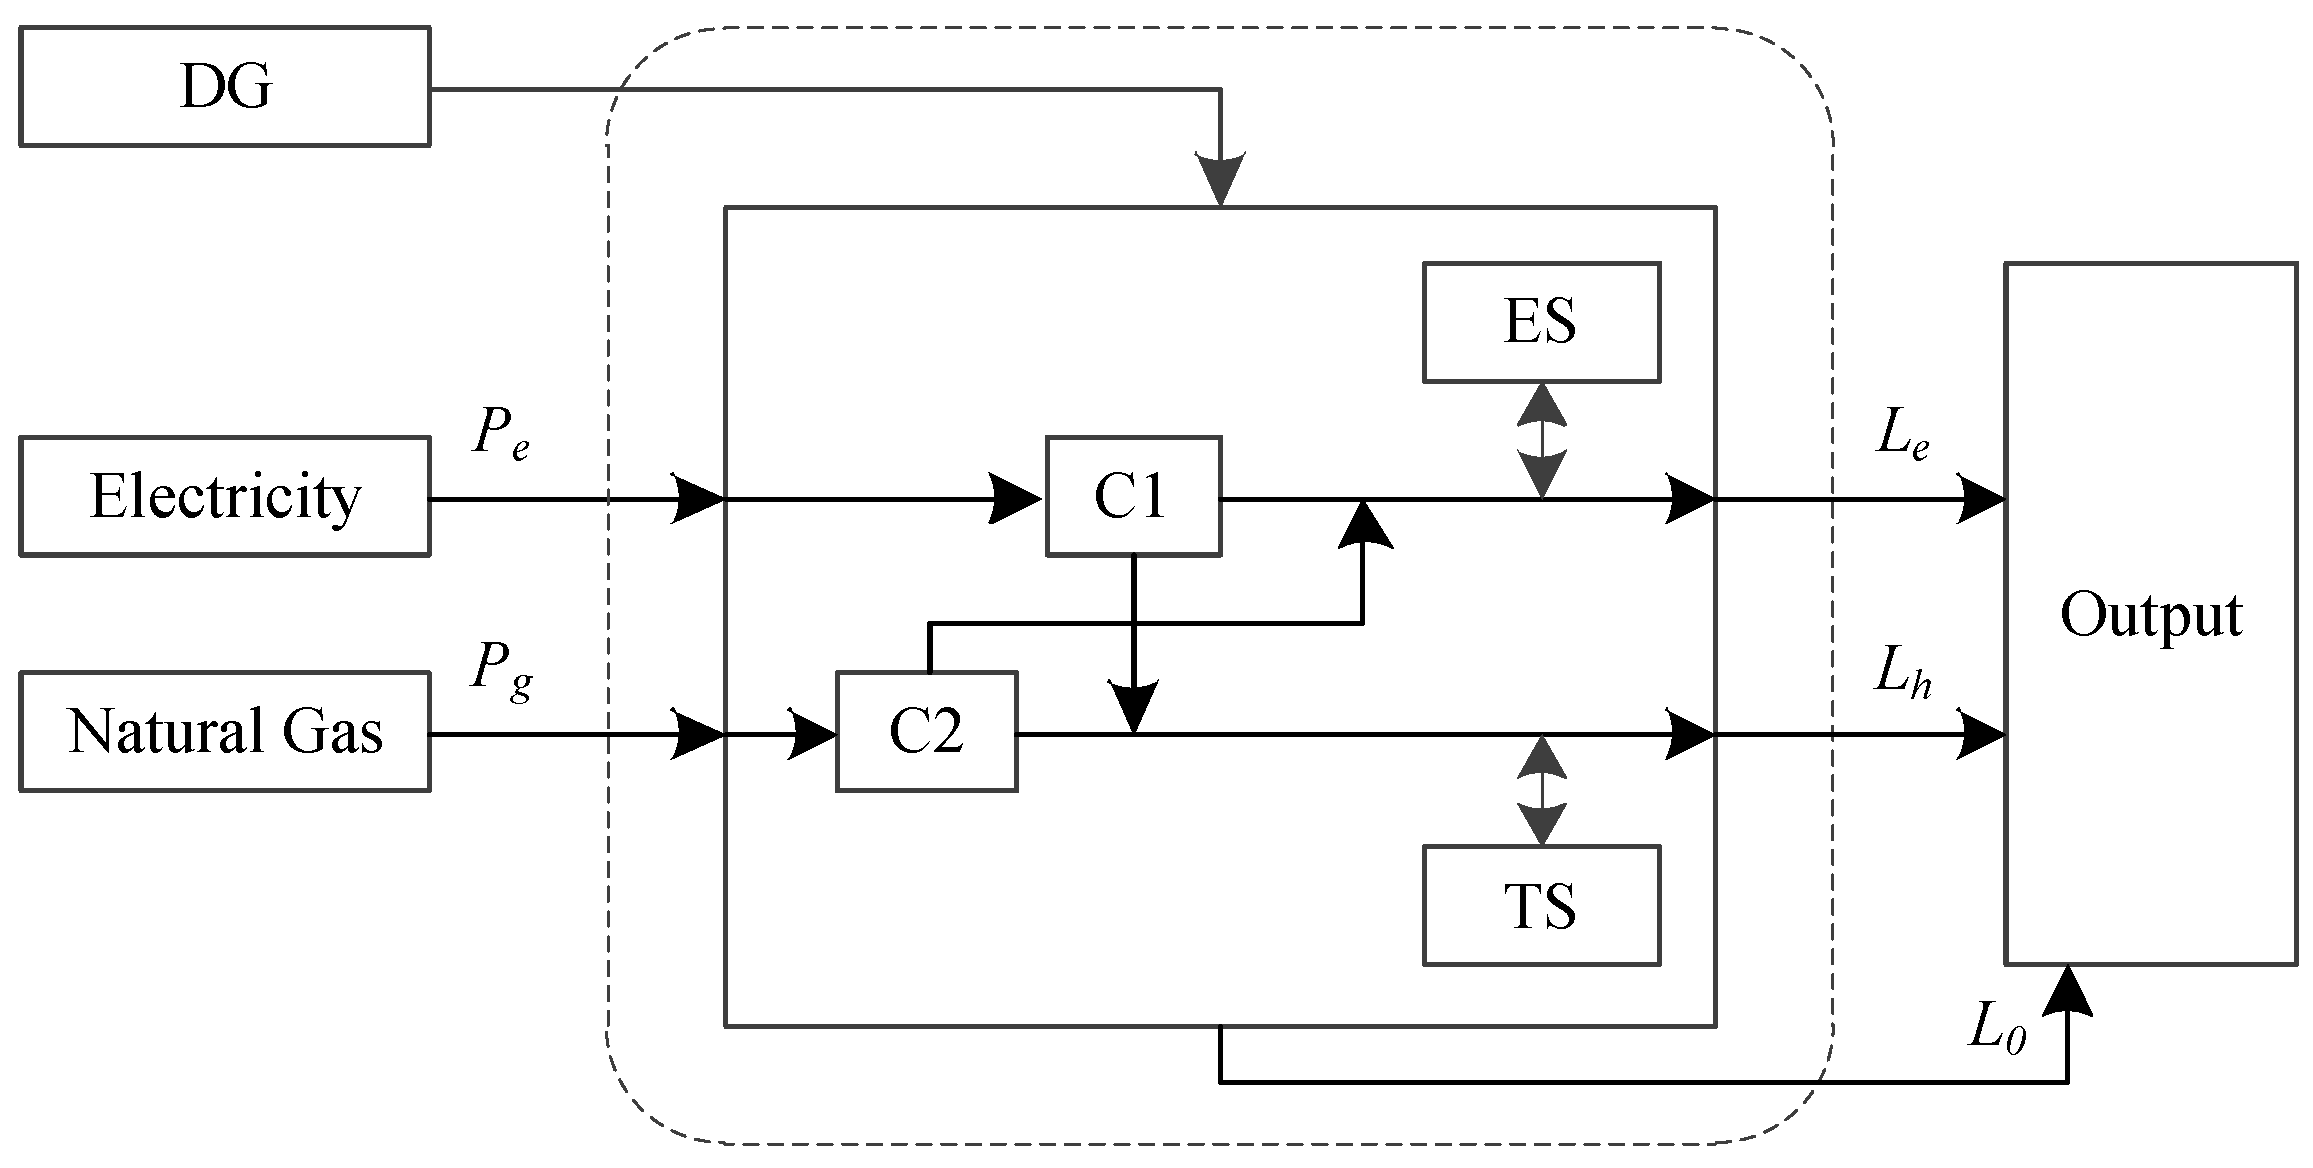
Figure 2.
Bus-based structure diagram of the gas CCHP system.

Figure 3.
Comparison of regulation ability between EES and the traditional unit.

Figure 4.
The regulation service process base pay-for-performance framework.
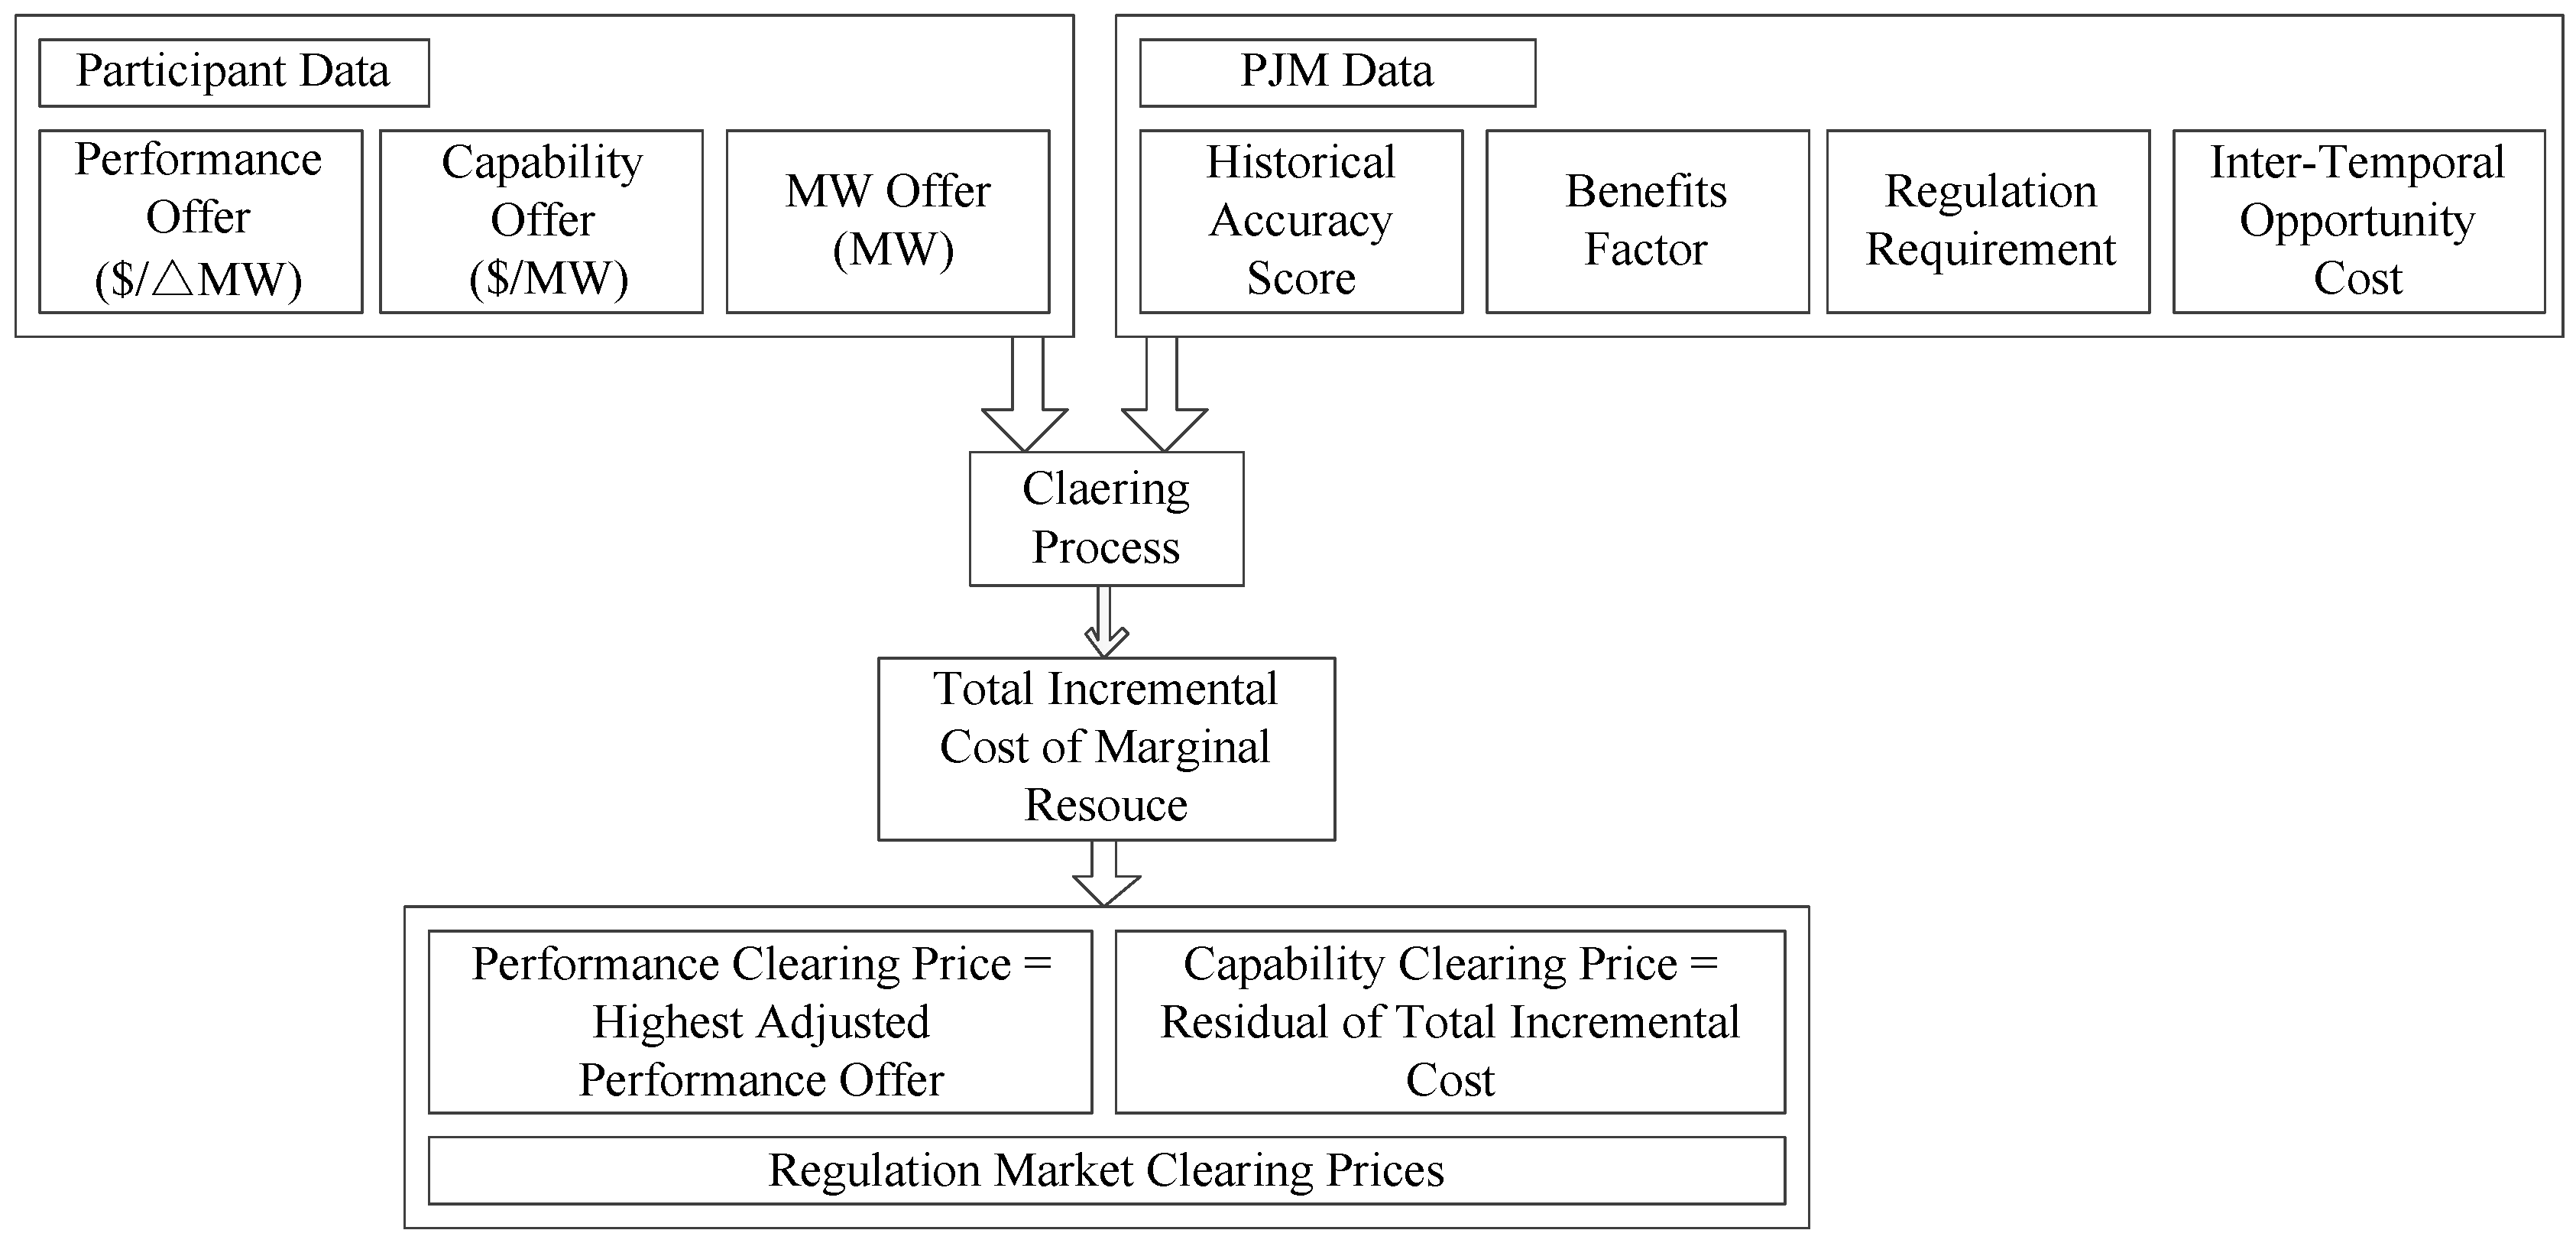
Figure 5.
Renewable energy forecast.
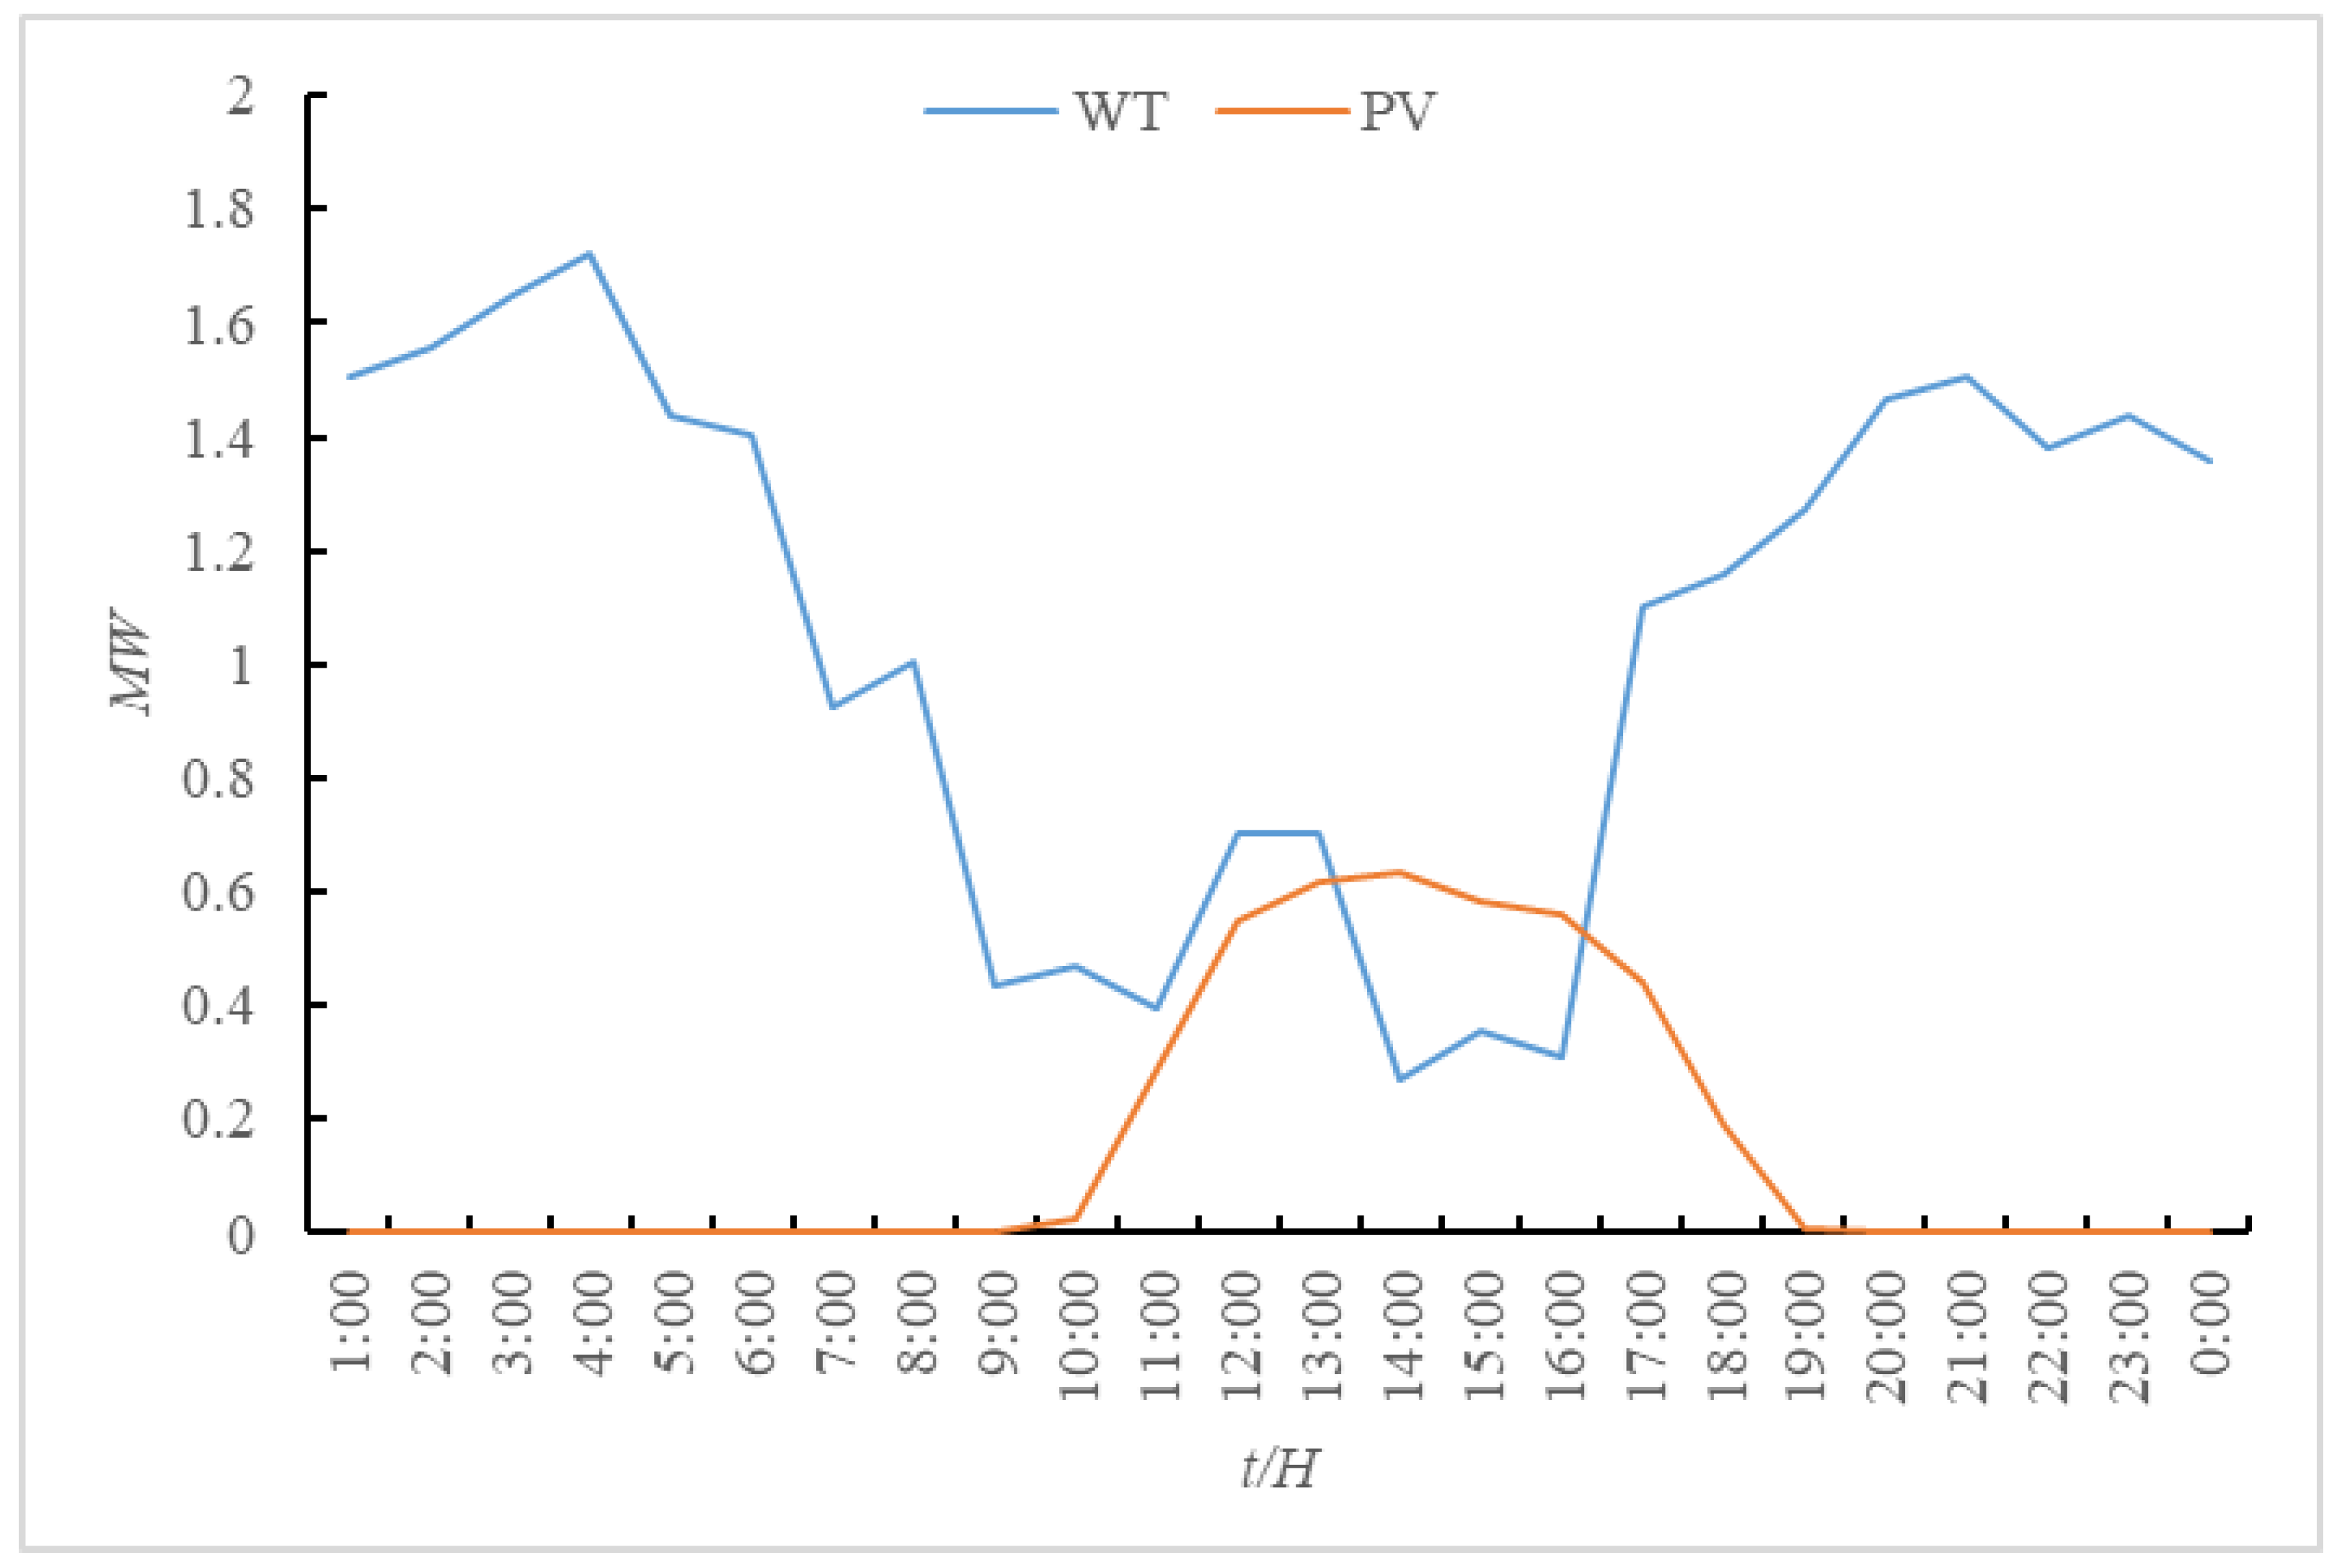
Figure 6.
RIES load forecasting curve.

Figure 7.
PJM market price day ahead.

Figure 8.
The Load balance condition and the SOC curve in the economic model (a) Description of the electrical load balance condition and the ES-SOC curve; (b) Description of the thermal load balance condition and the TS-SOC curve.
Figure 8.
The Load balance condition and the SOC curve in the economic model (a) Description of the electrical load balance condition and the ES-SOC curve; (b) Description of the thermal load balance condition and the TS-SOC curve.
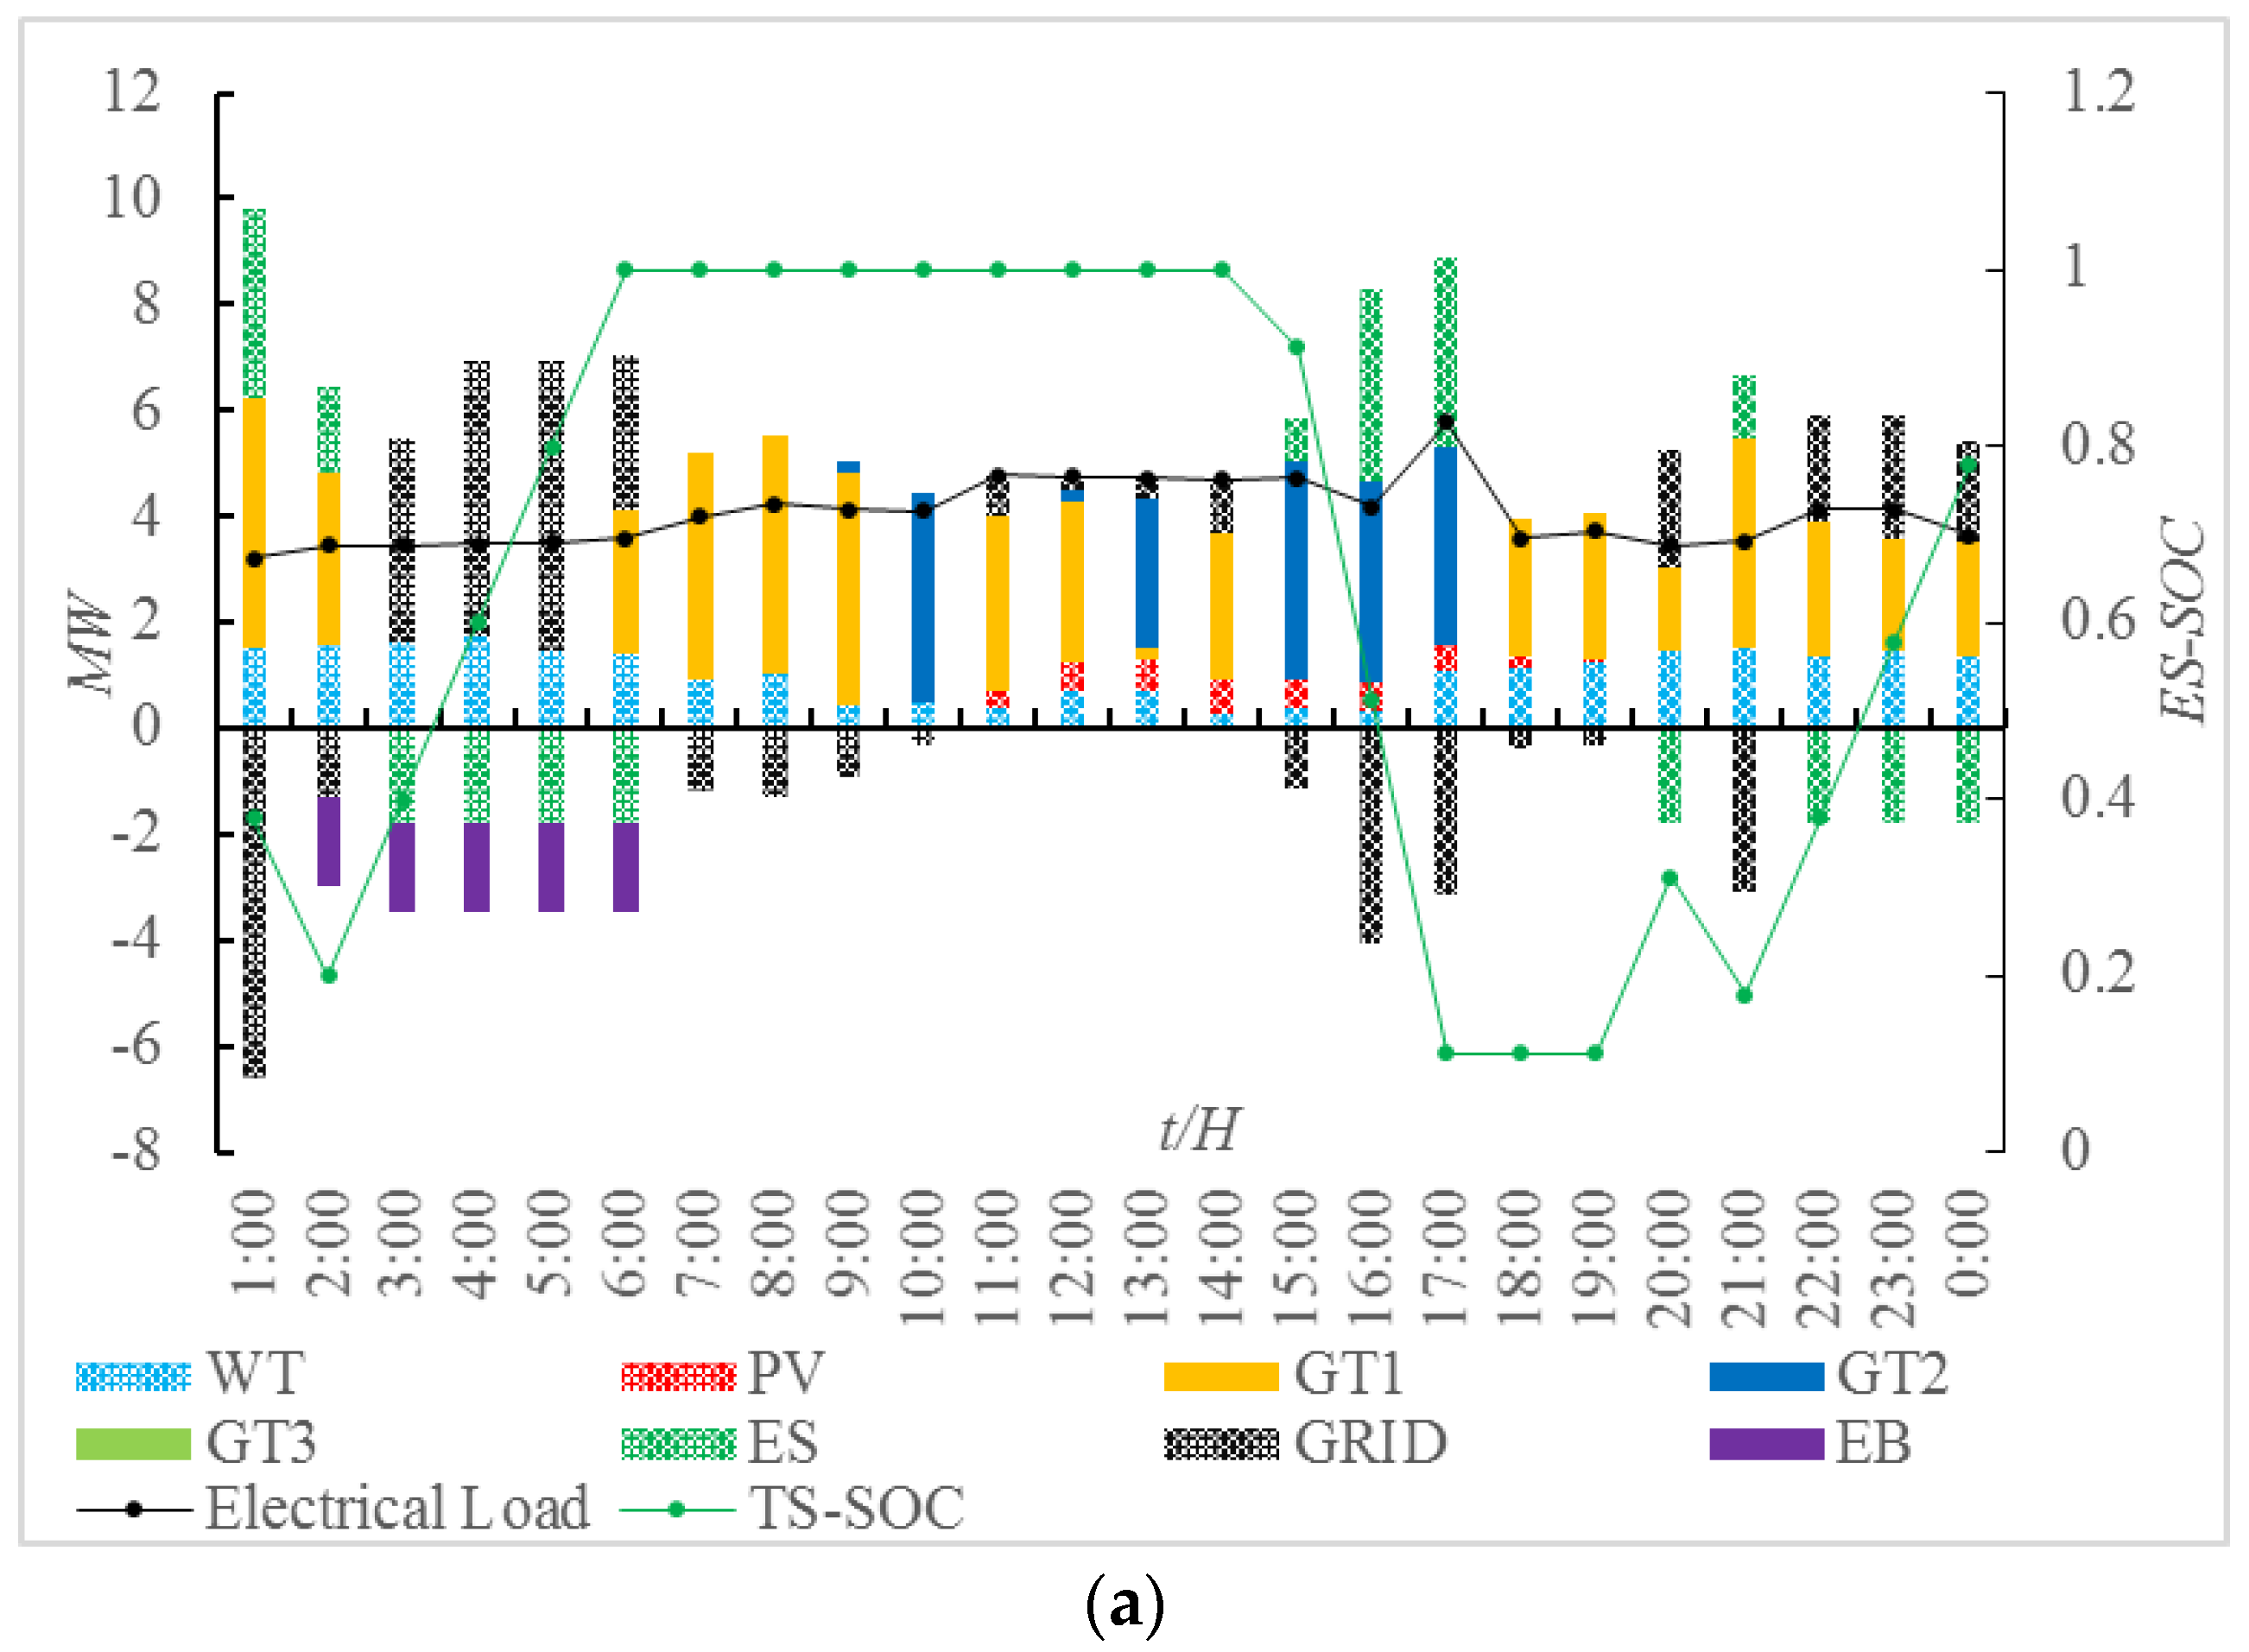

Figure 9.
The electrical load balance condition and the ES-SOC change curve in the regulation model.
Figure 9.
The electrical load balance condition and the ES-SOC change curve in the regulation model.

Table 1.
Capacity of the devices.
| Types | Symbol | Capacity/(MW) | ||
|---|---|---|---|---|
| Source devices | 1 | |||
| 2 | ||||
| 5.05 | 5.05 | 5.05 | ||
| 4 | 4 | 4 | ||
| ESS | 3 | 3 | 3 | |
| 2 | 2 | 3 | ||
| Conversion devices | 5 | 5 | 8 | |
| 1 | 1 | |||
| 2 | 2 | 3 | ||
Table 2.
The coefficients of ESS.
| /MWh | /MWh | /MWh | /MWh | /MWh | n/MWh |
|---|---|---|---|---|---|
| 7 | 1 | 9 | 2 | 7 | 1 |
Table 3.
Main device parameters.
| Variable | Symbol | Unit | Value |
|---|---|---|---|
| Gas turbine electrical efficiency | - | 0.302 | |
| Gas turbine thermal efficiency | - | 0.389 | |
| Heat exchanger efficiency | - | 0.9 | |
| Waste heat recovery boiler efficiency | - | 0.85 | |
| Gas boiler efficiency | - | 0.9 | |
| Thermal ESS maximum charge power | MW | 2000 | |
| Thermal ESS maximum discharge power | MW | 2000 | |
| Thermal ESS charge/discharge efficiency | - | 0.87 | |
| Thermal ESS dissipation rate | - | 0.06 | |
| Electrical ESS maximum charge power | SOC | 0.4 | |
| Electrical ESS maximum discharge power | SOC | 0.2 | |
| Electrical ESS charge/discharge efficiency | - | 0.95 | |
| Electrical ESS dissipation rate | - | 0.04 | |
| Electrical boiler efficiency | - | 0.97 |
Table 4.
The historical performance score of different types of regulation resources.
| Type | RegA | RegD |
|---|---|---|
| Electrical ESS | - | 94.0 |
| Hydro | 79.6 | 90.0 |
| Gas turbine | 73.6 | - |
| DSR | 78.8 | 84.2 |
Table 5.
Different types of regulation resources’ parameters.
| Regulation Resources | ES | Hydro | DSR | GT |
|---|---|---|---|---|
| Signal Type | Reg D | Reg D | Reg D | Reg A |
| 15.61 | 15.61 | 15.61 | 1 | |
| 2 | 2 | 2 | 2 | |
| 0.940 | 0.900 | 0.842 | 0.736 | |
| (MW) | 1.880 | 1.800 | 1.684 | 2.944 |
| ($/MW) | 1 | 1 | 0 | 1.5 |
| ($/MW) | 1.06 | 1.11 | 0 | 2.04 |
| 2.89 | 2.87 | 2.86 | 1 | |
| (MW) | 5.4 | 5.2 | 4.8 | 2.9 |
Table 6.
Generation Costs of RIES under Three Models.
| Operating Costs | Model 1 | Model 2 | Model 3 |
|---|---|---|---|
| Fuel costs | 2946.8 | 3393.2 | 2946.8 |
| Electricity purchase cost | 63.87 | 293.47 | 293.47 |
| Electrical ESS operating costs | 39.6 | 69.5 | 69.5 |
| Gas boiler operating costs | 111.90 | 111.91 | 111.91 |
| Regulation revenue | - | −1828.8 | −1238.1 |
| Total system operating costs | 3122.6 | 2039.28 | 1804.94 |
© 2018 by the authors. Licensee MDPI, Basel, Switzerland. This article is an open access article distributed under the terms and conditions of the Creative Commons Attribution (CC BY) license (http://creativecommons.org/licenses/by/4.0/).
Share and Cite
MDPI and ACS Style
Ma, H.; Wang, B.; Gao, W.; Liu, D.; Sun, Y.; Liu, Z. Optimal Scheduling of an Regional Integrated Energy System with Energy Storage Systems for Service Regulation. Energies 2018, 11, 195. https://doi.org/10.3390/en11010195
AMA Style
Ma H, Wang B, Gao W, Liu D, Sun Y, Liu Z. Optimal Scheduling of an Regional Integrated Energy System with Energy Storage Systems for Service Regulation. Energies. 2018; 11(1):195. https://doi.org/10.3390/en11010195
Chicago/Turabian StyleMa, Hengrui, Bo Wang, Wenzhong Gao, Dichen Liu, Yong Sun, and Zhijun Liu. 2018. "Optimal Scheduling of an Regional Integrated Energy System with Energy Storage Systems for Service Regulation" Energies 11, no. 1: 195. https://doi.org/10.3390/en11010195
Note that from the first issue of 2016, this journal uses article numbers instead of page numbers. See further details here.