Coordinated Engine-Start Control of Single-Motor P2 Hybrid Electric Vehicles with Respect to Different Driving Situations


1
School of Transportation Science and Engineering, Beihang University, 37 Xueyuan Road, Haidian District, Beijing 100191, China
2
Beijing Key Laboratory for High-efficient Power Transmission and System Control of New Energy Resource Vehicle, Beihang University, 37 Xueyuan Road, Haidian District, Beijing 100191, China
3
Dynavolt Tech. and Beihang University Joint Lab for New Energy Resource Vehicle Transmission Technology, Beihang University, 37 Xueyuan Road, Haidian District, Beijing 100191, China
4
Institute of Industrial and Automotive Drivetrains, Ruhr-University Bochum, 44801 Bochum, Germany
5
Beijing Institute of Space Launch Technology, 1 South Dahongmen Road, Fengtai District, Beijing 100076, China
*
Author to whom correspondence should be addressed.
Energies 2018, 11(1), 207; https://doi.org/10.3390/en11010207
Submission received: 27 October 2017
/
Revised: 8 January 2018
/
Accepted: 9 January 2018
/
Published: 15 January 2018
(This article belongs to the Special Issue Methods to Improve Energy Use in Road Vehicles)
Abstract
:To cut down the costs caused by the additional starter, single-motor P2 hybrid electric vehicles (HEVs) make use of the driving motor to propel the vehicle as well as start the engine, and accordingly the engine-start control becomes more difficult. To satisfy the passengers’ demands, this paper developed different coordinated engine-start control strategies with respect to different situations. First, a detailed model for the single-motor P2 HEVs system was built and related parameters were presented. Then, the coordinated engine-start control architecture for the internal combustion engine (ICE), engine disconnect clutch (EDC), electric motor (EM) and 8-speed automatic transmission (AT) was analyzed. Considering with the different driving situations, soft start strategy and dynamical start strategy are individually proposed. Through the simulation, the above control strategies were validated in accordance with their control objectives. Last, to optimize the trade-off between driving performance and riding comfort, some key parameters were further discussed. This work not only decreases the difficulty of engine-start control in the single-motor P2 HEVs but also is helpful to improve the quality of engine-start.
1. Introduction
The market demand of vehicle is still increasing rapidly, most of which are equipped with conventional powertrain system. Their huge consumption of fossil fuels has resulted in many worldwide problems such as energy crisis, global warming and emission pollution, which propels governments to implement more restrictive regulations of fuel consumption and emission [1]. For the reason thatthe process of using electricity emits no exhaust fumes and the electricity can be converted from other clean energy such as solar energy, wind energy and hydroenergy [2,3], the electric vehicles’ (EVs) development gets forceful policy supports from governments.
However, battery electric vehicles (BEVs) are less attractive to customers owing to the enormous size and high costs of batteries [4]. In addition, fuel-cell electric vehicles (FEVs) are difficult to promote for its high costs and technical bottlenecks such as the production, supply and storage of hydrogen [5]. The oil-powered hybrid electric vehicles (HEVs) technology is thus a better option that can meet the requirements of environmental policies as well as absorb the impact of batteries’ drawbacks with low market risk [6].
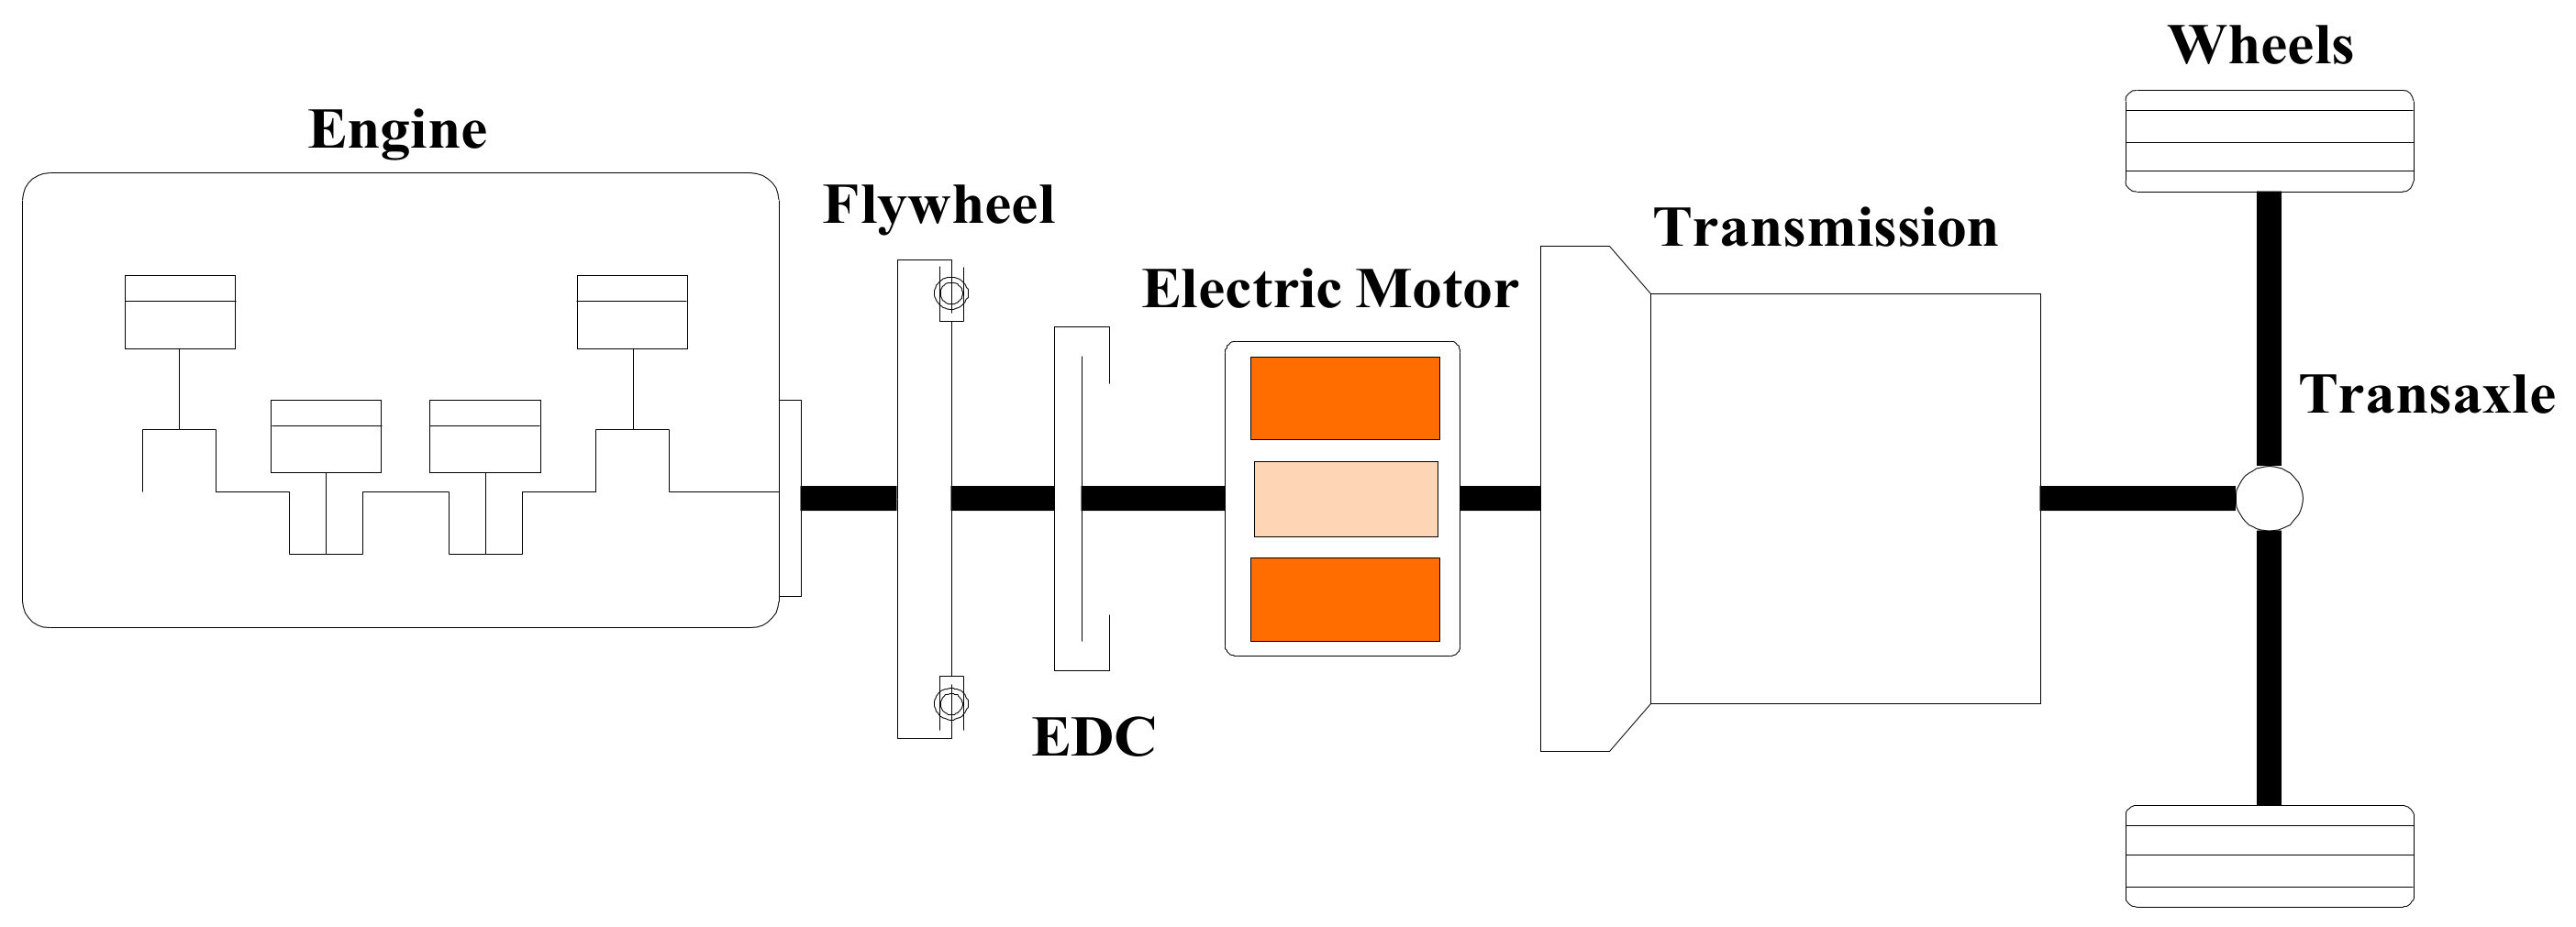
Considering the different position of the electric motor (EM), P2 (Position 2) hybrid transmission is most commonly used since it can utilize gearbox structure and components already available and industrialized [7,8,9]. As shown in Figure 1, P2 configuration means that the EM is located at the input side of the gearbox. In addition, it is also characterized by the engine disconnect clutch (EDC) which is located between the internal combustion engine (ICE) and the EM. Actually, P2 hybrid transmission is a parallel hybrid transmission. By means of the EDC, ICE can be coupled or decoupled to realize different driving modes such as: purely electric driving, purely ICE driving, hybrid boosting and so on. Therefore, ICE needs to be started or shut down frequently when the vehicle is running, which affects both driving performance and riding comfort. The transition control of engine-start hence plays a vital role in HEVs. Like conventional powertrain system, some HEVs use an additional starter which can be individually controlled to start the engine. Canova et al. [10] adopted a 10.6 kW belted starter/alternator (BSA) to start the diesel engine of a series/parallel HEV, and designed closed-loop control for engine start-stop. Wang et al. [11] developed HEVs start and acceleration strategies based on the integrated starter/generator (ISG), and came up with the concept of ISG “fast” and “slow” torque to overcome the conventional engine transient fuel. Sim et al. [12] adopted the ISG to drag the ICE until idling speed, and then generated ICE compensation torque to accelerate the ICE for shortening the engagement of EDC. Chen and Hwang [13] made use of both generator and motor of a two-mode hybrid (TMH) transmission as engine starter, and investigated a pulse cancellation (PC) algorithm to cancel undesired vibration and smooth engine speed ripples during automatic start-stop transitions.
However, additional starter increases the costs of HEVs. Therefore, some works try to make use of the driving motor to start the engine. It was verified by Song et al. [14] that the motor control without an ISG provided performance similar to the ISG control during the EV-HEV mode change transition. A study by Berkel et al. [15] contributed with a new controller to achieve a fast and smooth engagement of transmission clutch (Ct) when solely the flywheel system was used to launch or brake the vehicle, while lacking the control of engine and motor in such a CVT P2 HEVs system. Lu et al. [16] only took the degree of jerk to evaluate the engine starting process of a mild P2 HEVs system, and the simulation results showed that it could obviously reduce vehicle’s jerk with coordinated control of motor and clutch. In order to optimize the trade-off between the engine-start time and torque responsiveness, Kum et al. [17] designed a new feedback controller based on both analytical approach via “Divide and Conquer” and numerical approach via dynamic programming (DP). Under the light electrical launch and cruise engine-start conditions, He et al. [18] developed the coordinated control of the EDC, engine and motor to achieve good driving performance and few torsional vibrations in a single-motor strong parallel hybrid. Another research by Smith et al. [19] not only simulated a theoretical algorithm which divided ideal EDC control process into four stages, but also conducted a HIL bench test to modified the initial control algorithm with a simpler and more robust constant clutch control method. In addition to traditional open-loop control, the closed-loop control is commonly appended in the engine-start transition to narrow the control error.
Above researches concentrated on the improvement of engine-start process. However, they lacked comparable analysis of different situations for engine-start. Because sometimes a compromise between driving performance and riding comfort has to be made to satisfy the different requirements of passengers in different driving conditions. In this paper, the authors use start time and vehicle acceleration vibrations respectively to evaluate the driving performance and riding comfort. In the engine-start without engine torque request, the soft start control strategy is designed to realize a comfortable process with few vibrations, and accordingly the start time can be longer. Contrastively, in the engine-start with engine torque request, the dynamical start strategy is designed to achieve a fast and powerful process, and some vibrations can be accepted. A detailed simulation model with different driving conditions is established to verify the developed control strategies. In addition, optimizations of some main control parameters are performed for different control objectives.
The outline of this paper is as follows. In Section 2, the developed simulation model for a single-motor P2 HEVs system is analyzed in detail. In Section 3, the authors classify different engine-start situations and their corresponding control objectives, and related control strategies are accordingly proposed. In Section 4, comparative engine-start simulations in different driving conditions are conducted and results are discussed. Additionally, some control parameters are optimized to realize better control results. Finally, conclusions and outlook are presented in Section 5.
2. Theoretical Analysis of Single-Motor P2 HEVs Model
The target vehicle is based on a single-motor P2 hybrid transmission which is evolved from the Shengrui 8-speed AT. The single-motor P2 HEVs model mainly consists of an ICE, a dual mass flywheel (DMF), an EDC, an alternating current (AC) motor, an 8-speed AT without torque converter (TC), a transaxle and wheels.
2.1. Overview of the Model
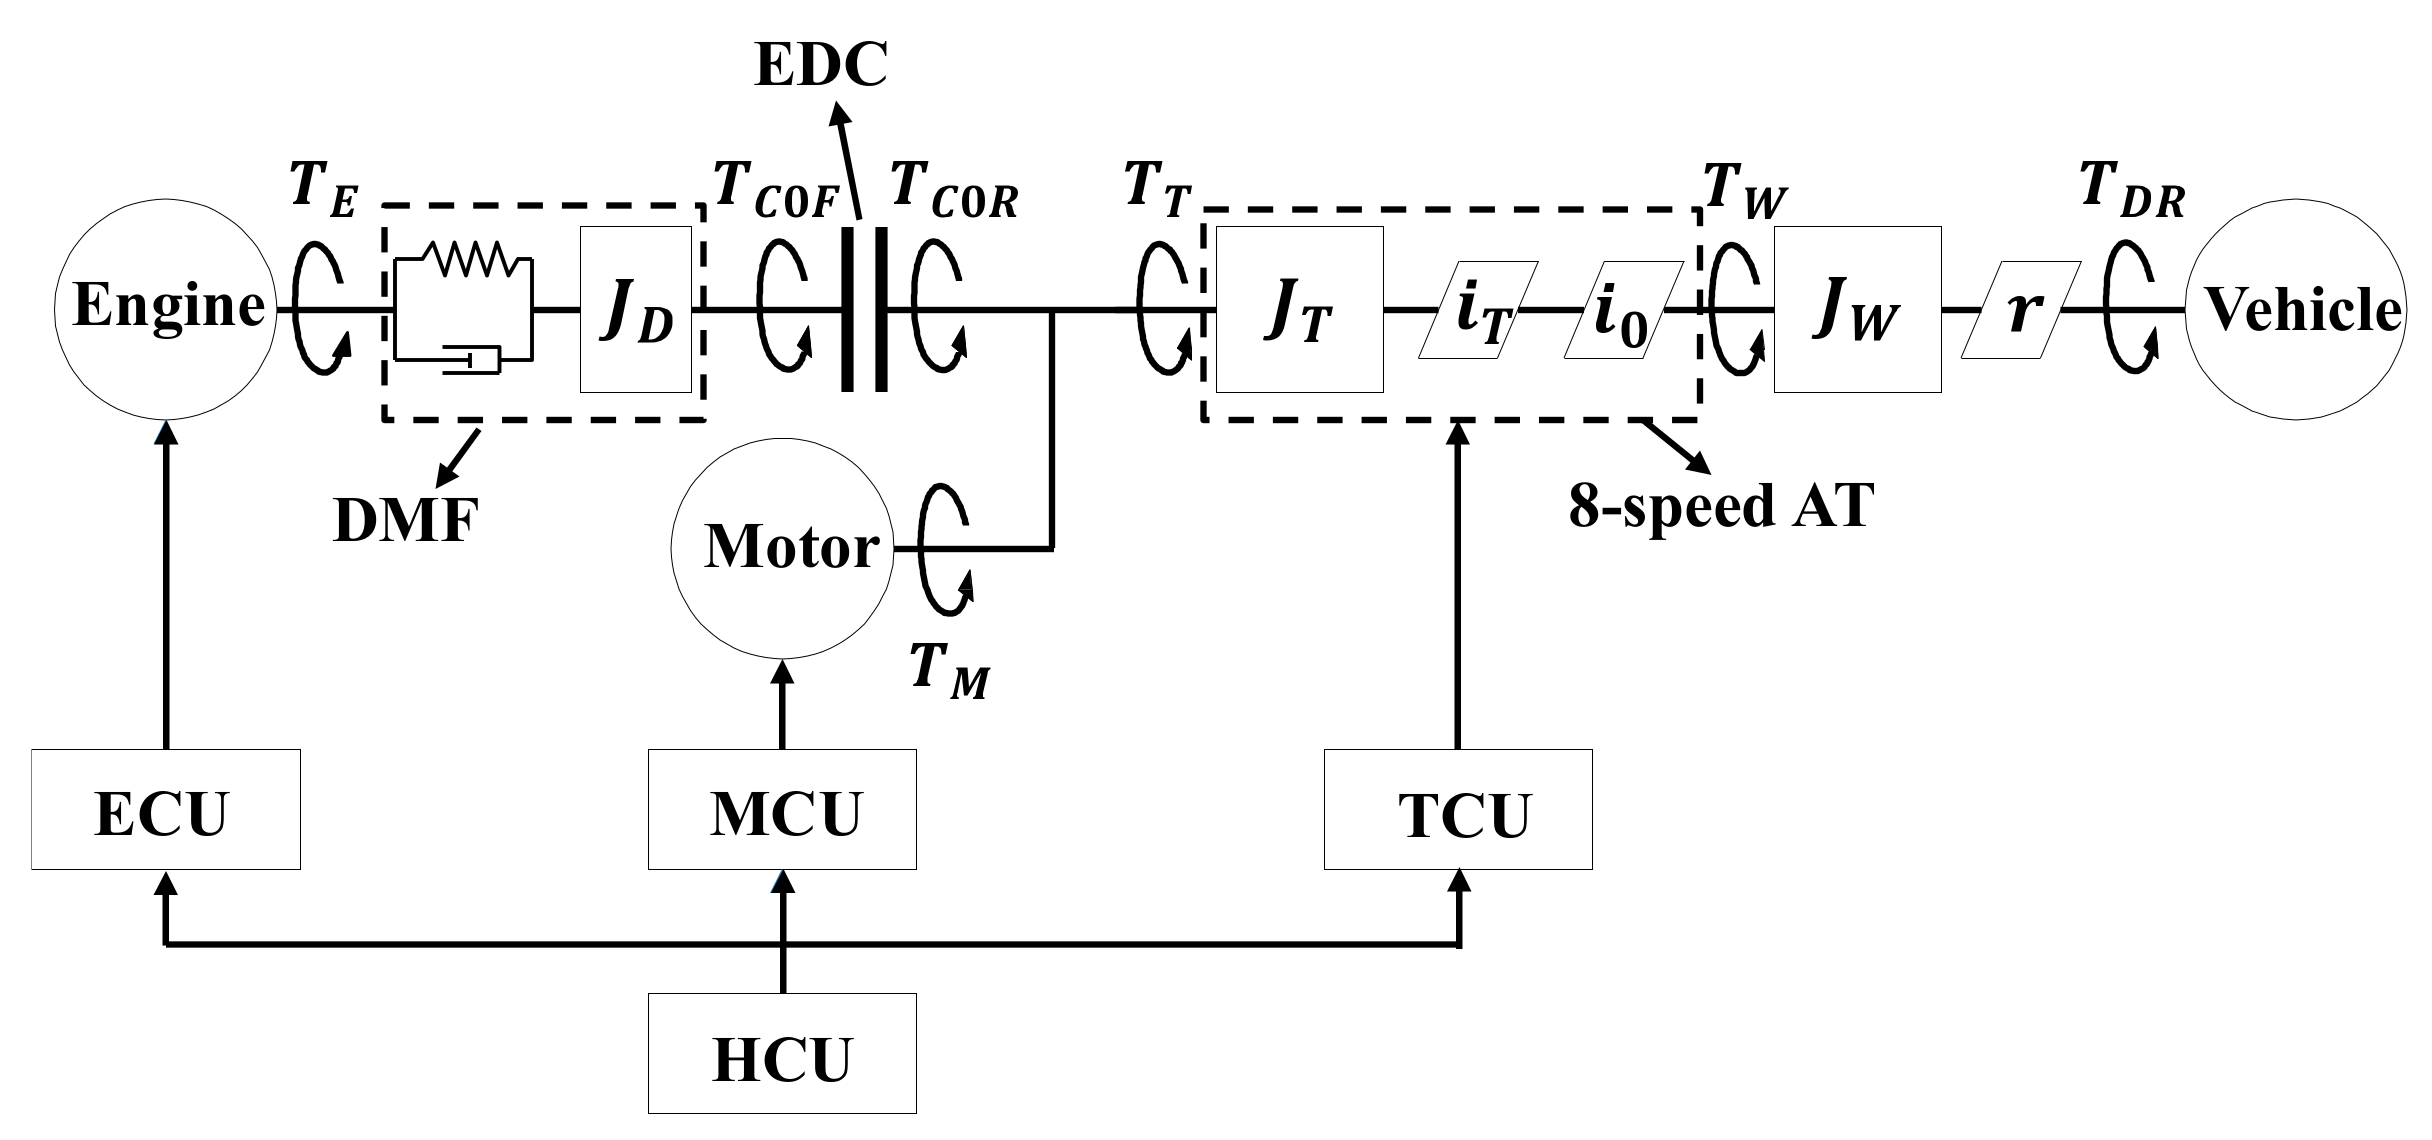
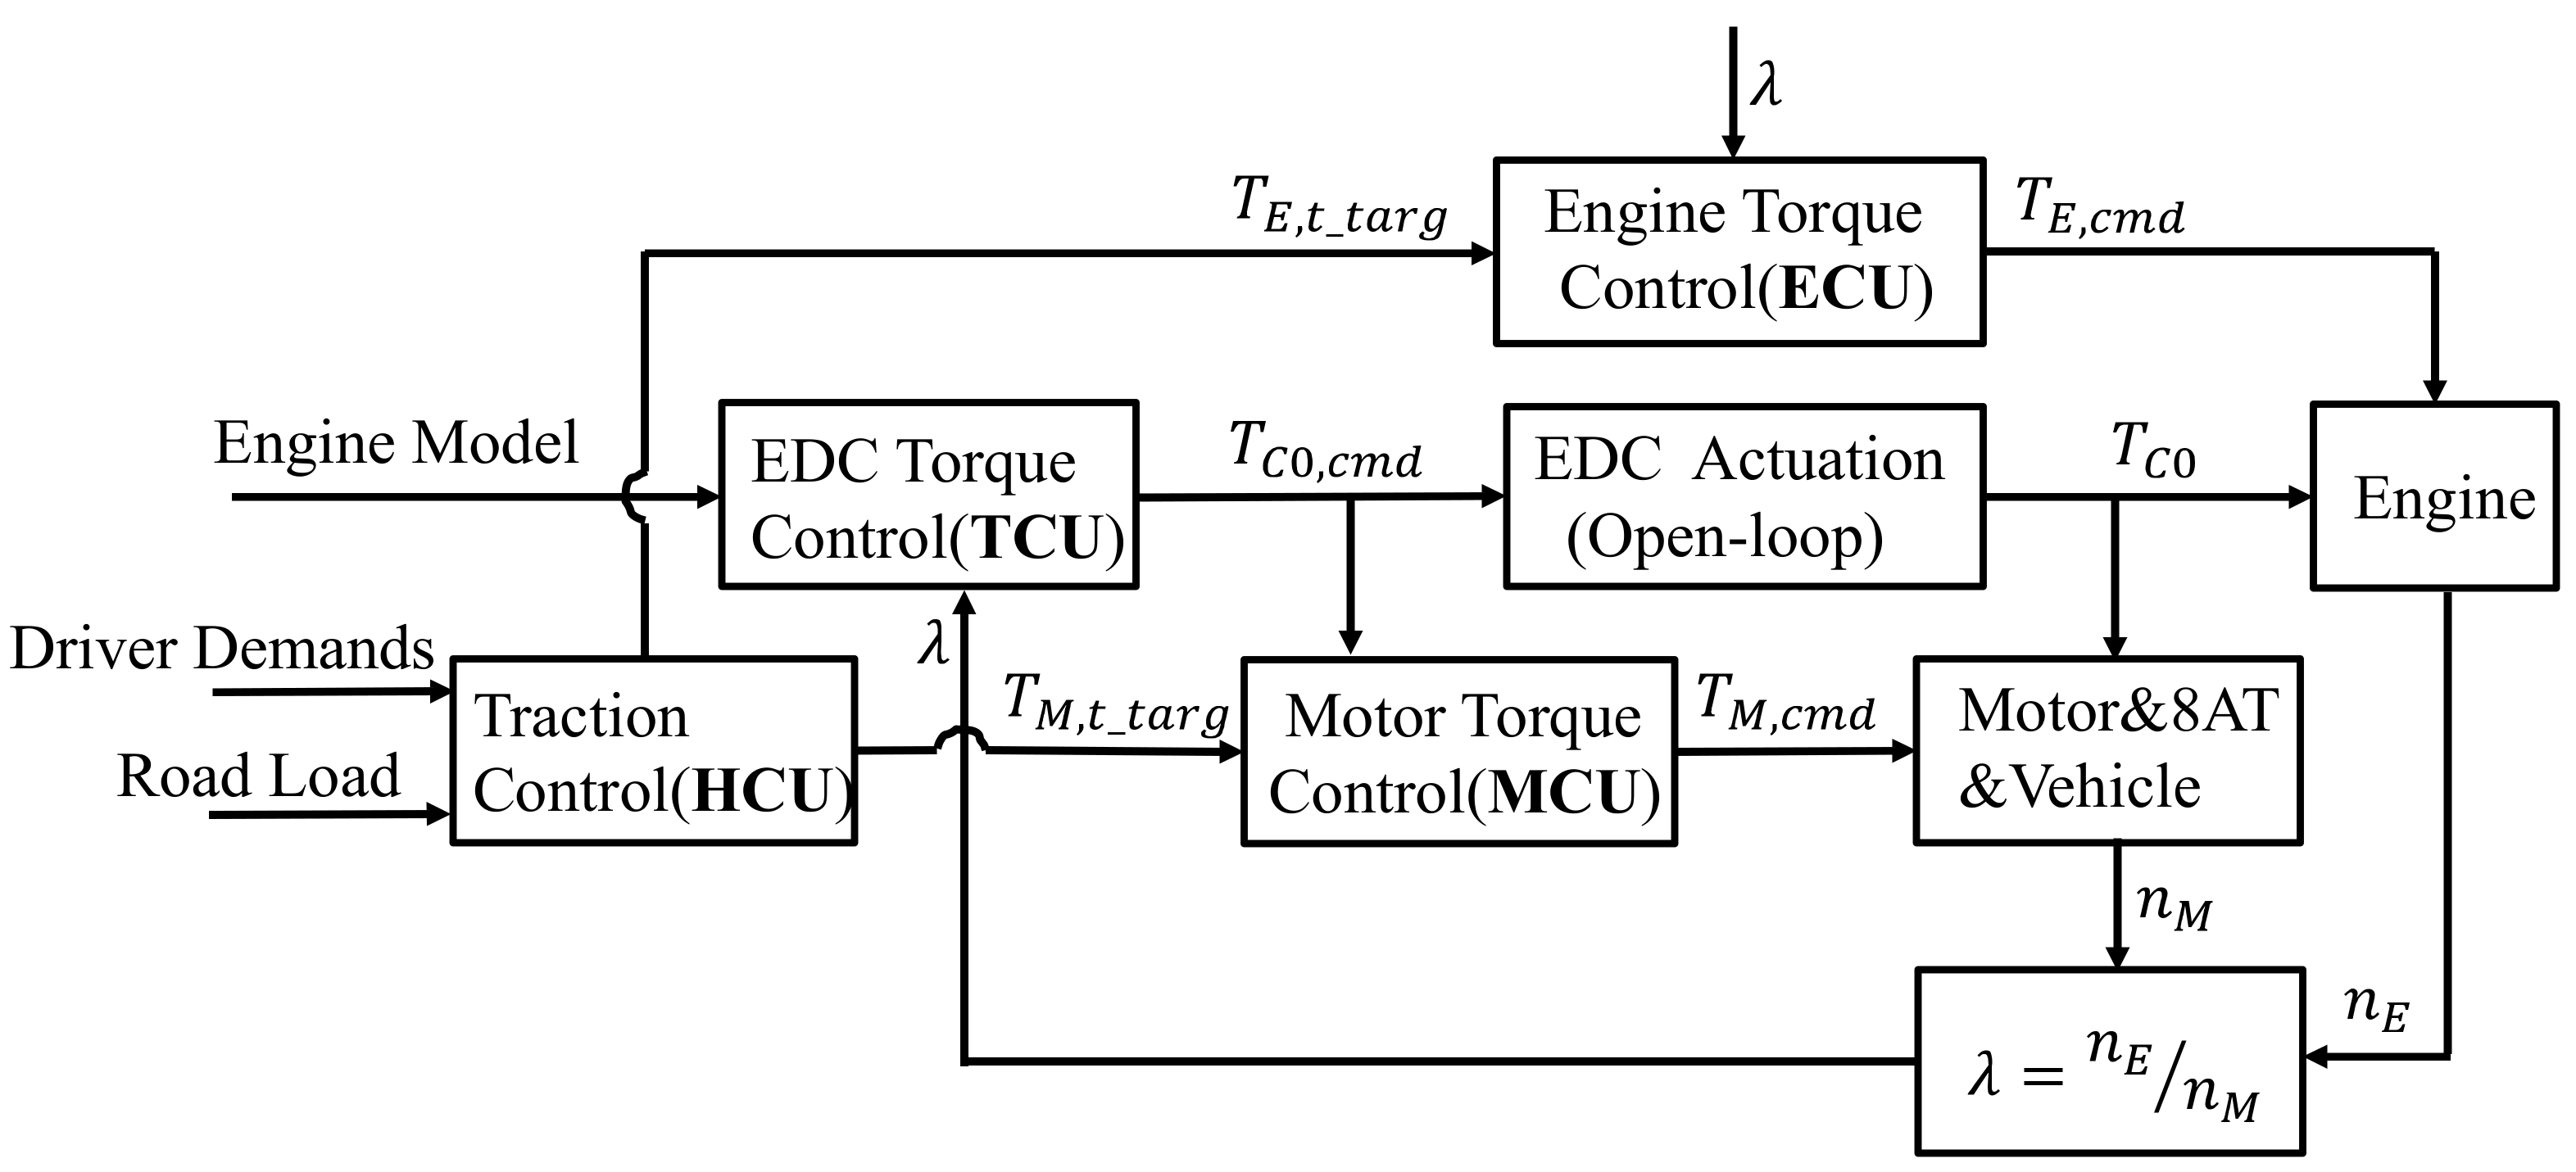
Figure 2 illustrates the simplified block diagram of the single-motor P2 HEVs model. In this diagram, the engine is controlled by engine control unit (ECU), and motor is controlled by motor control unit (MCU). The actuation of 8-speed AT and EDC are both controlled by transmission control unit (TCU). In addition, ECU, MCU and TCU are concurrently commanded by hybrid control unit (HCU) which takes action being decided by operating conditions and related control strategies. With the integrated control of engine, motor, EDC and 8-speed AT, different driving modes are timely switched, which gives rise to the frequent engine-stop/start.
As seen in Figure 2, the dextral direction is defined as the uniform positive direction of torque and rotation for mathematic formulation. In the process of engine-start, the motor not only drive the rear powertrain including 8-speed AT, transaxle and wheels to overcome the driving resistance, but also give the power to start the engine through closing the EDC. And DMF is designed to shrink the torsional vibration of engine. Detailed and precise physical models are essential to develop in order to detect the theoretical dominated factors and improve the authenticity of simulations, and those models are built in MATLAB/Simulink.
2.2. ICE
In this research, three major factors of engine torque are considered: the cylinder pressure torque , the viscous friction torque and the equivalent inertia torque , whose correlations can be expressed as:
where is the output torque of engine.
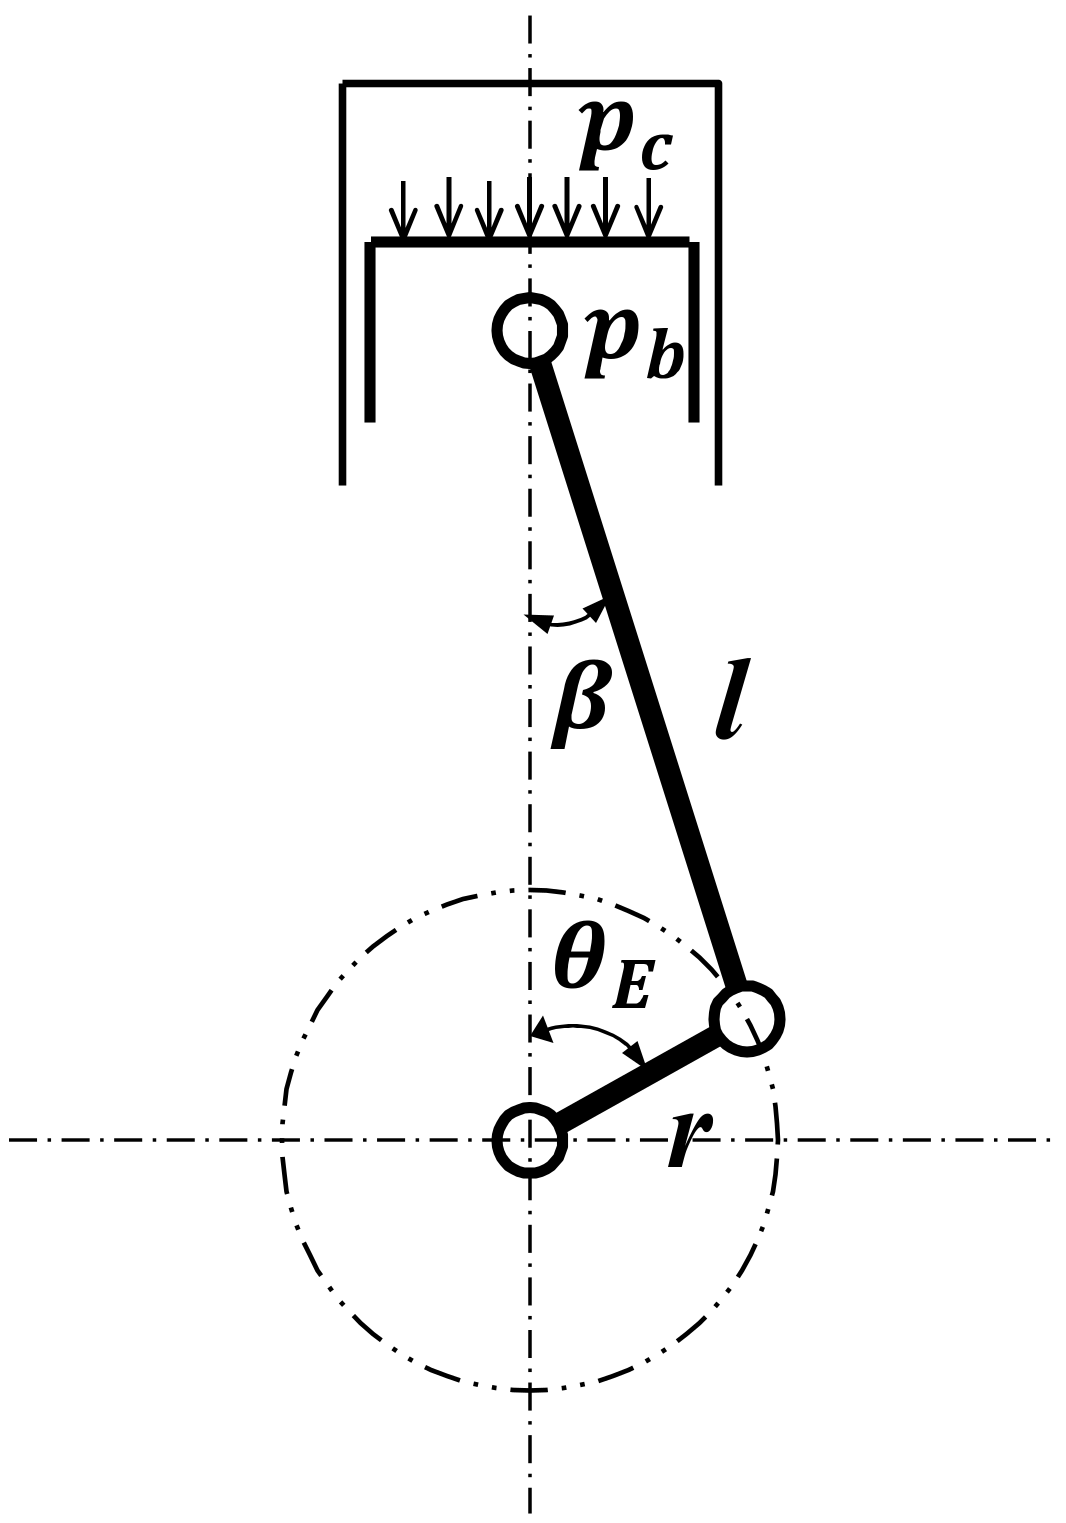
A single-cylinder engine model is first introduced as seen in Figure 3 for calculating each torque component, and following formulas are all based on it.
In addition, for the convenience of calculation, the angle variable is defined as:
where is the acute angle between connecting rod and the axis of cylinder, r is the half distance of the piston stroke, l is the length of connecting rod, is the crank angle and clockwise is formulated as the positive rotational direction.
2.2.1. The Cylinder Pressure Torque
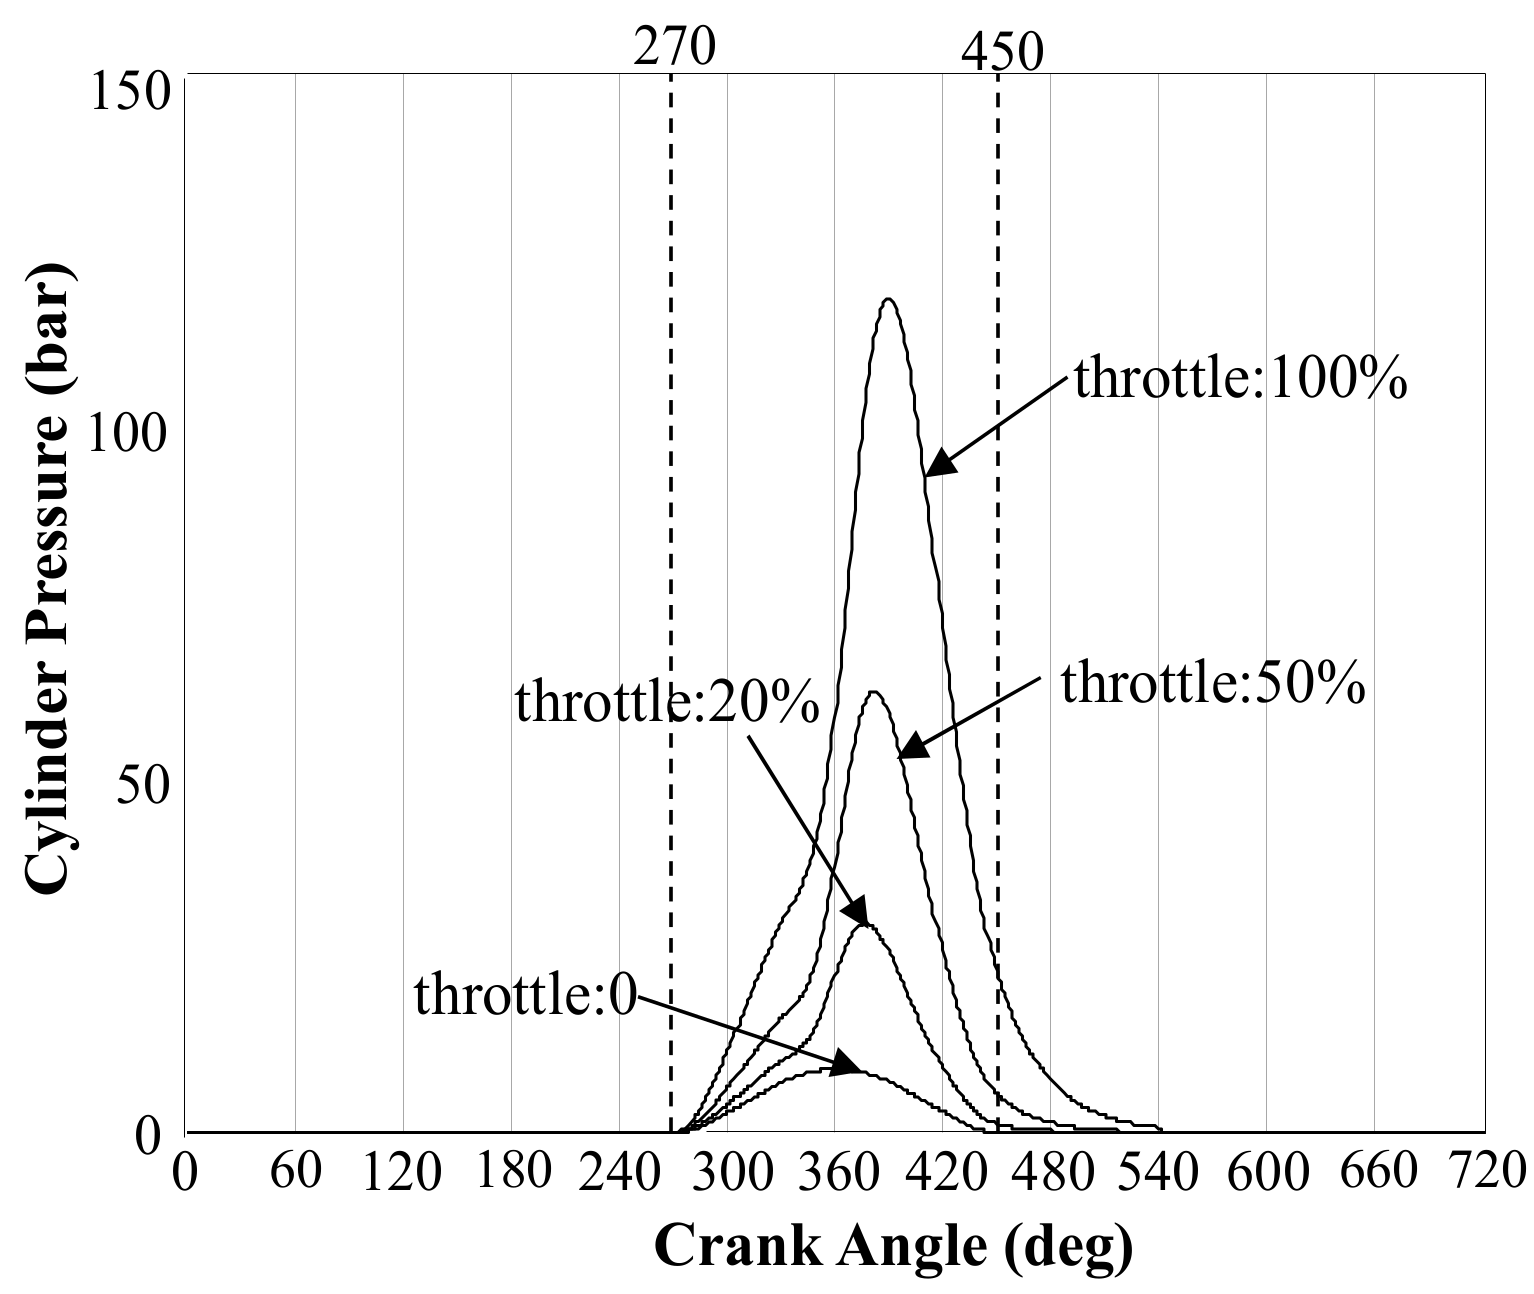
The cylinder pressure is always obtained through the measurement of indicator diagram illustrated as Figure 4. Different throttle percentage conditions were recorded in look-up table for the reference of simulation. It is obvious that the cylinder pressure varies dramatically in different stroke, which generates the pressure torque as:
where is the diameter of piston and the back pressure of piston.
2.2.2. The Viscous Friction Torque
Because of the joint function of pressure force and reaction force of connecting rod, there is an acting force between piston and cylinder wall, which leads up to the friction between them. To simplify the calculation, the authors assume that the viscous friction coefficient keeps constant. The viscous friction torque is determined by:
2.2.3. The Inertia Torque
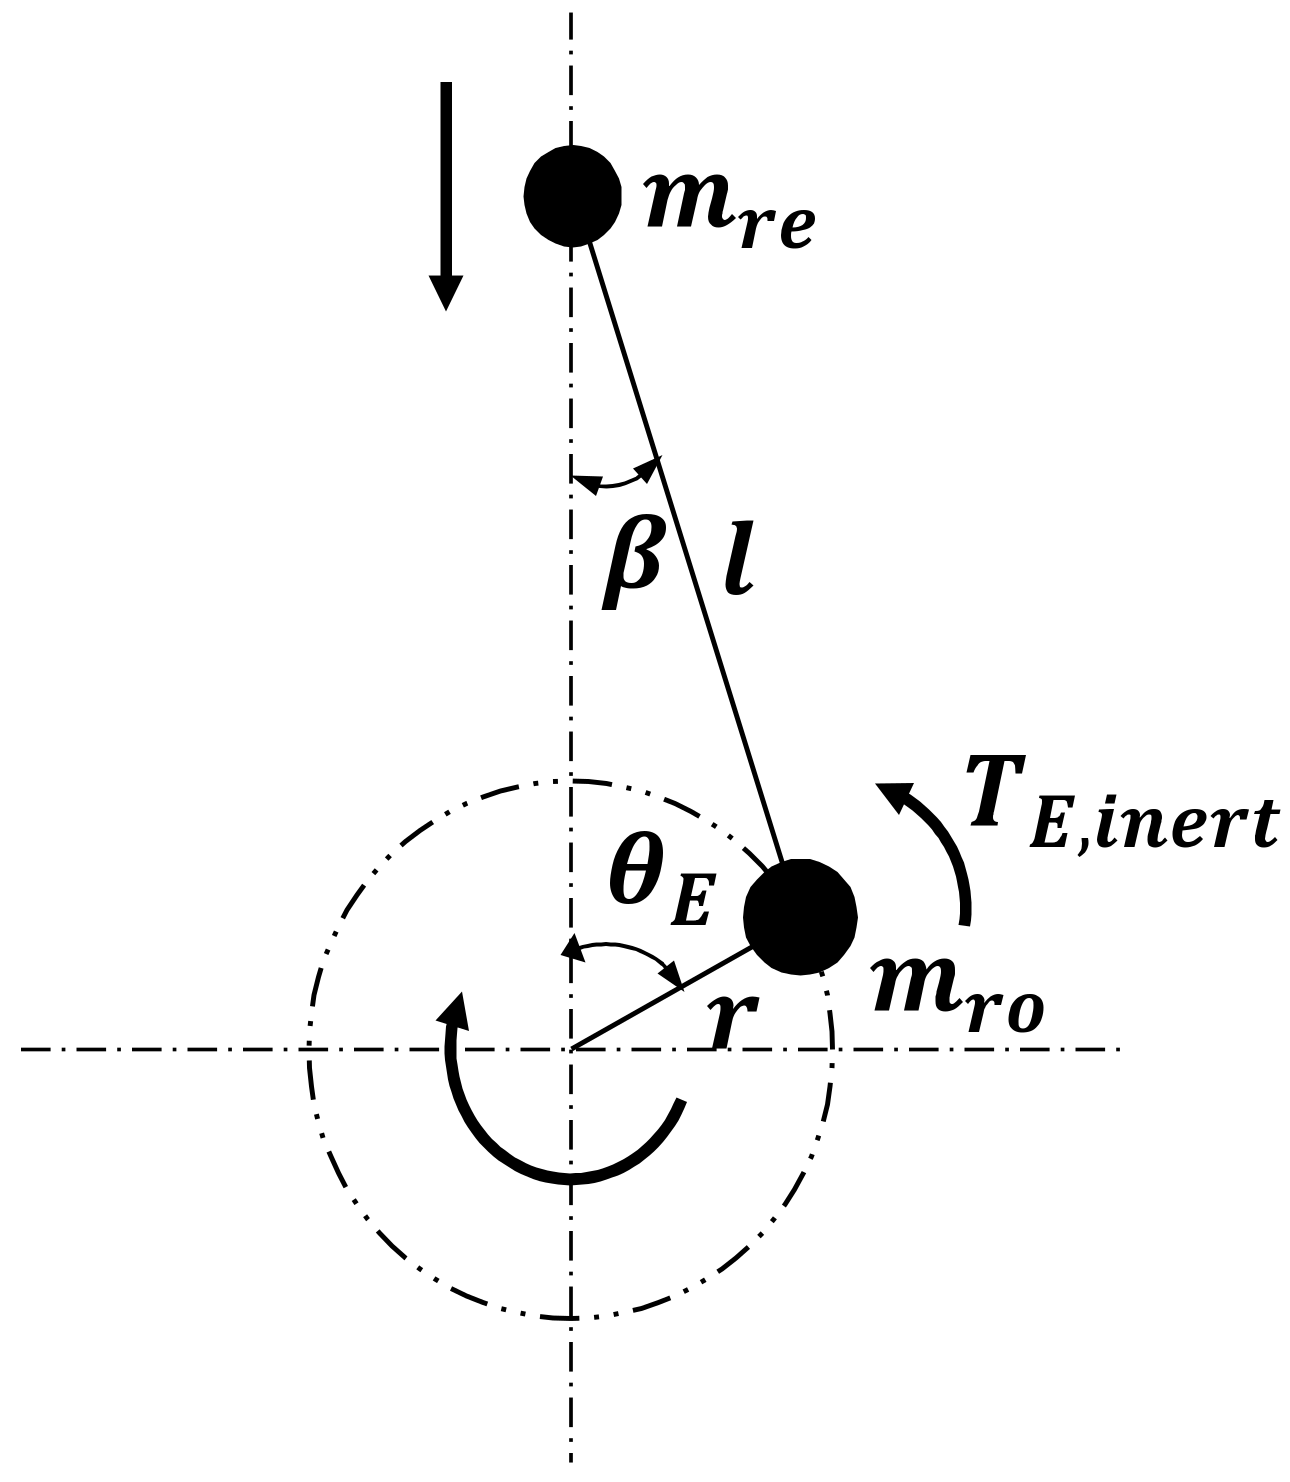
Given that the motion of crank and connecting-rod is intricately planar, the inertial torque indeed consists of reciprocating inertial torque and rotating inertial torque as:
As seen in Figure 5, the mass of piston, crank and connecting-rod can be equivalent into the reciprocating mass and rotating mass . The motion of reciprocating mass generates reciprocating inertial torque resulting from:
The rotation of rotating mass generates rotating inertial torque as:
2.2.4. Total Engine Torque of the 4-Cylinder Engine
Through the above mentioned analysis, a single-cylinder engine torque is easily obtained. Nevertheless, the total output torque of a 4-cylinder engine should be combined of every single-cylinder engine torque where there is a phase difference of 180° between two adjacent cylinders as:
where , , and are respectively the engine torque of first, second, third and last cylinder. Consequently, the overlay of every cylinder results in the torque vibration in the cycle of engine ignition angle.
2.3. DMF
The DMF is primarily designed as a device for not only dampening the engine torque oscillations but also keeping the response speed of engine output. As seen in Figure 6, the DMF inertia is split up into two parts: the primary mass is still attached to the crankshaft while the secondary mass is fixed to the front part of the EDC. Because the mechanism of DMF is complex and nonlinear to depict, a simplified and linear model is built as [20]:
where is the primary mass inertia, is the second mass inertia, is the rotational stiffness of the ideal linear arc-spring, is the rotational damping coefficient between primary mass and second mass, is the rotation angle of second mass, is the displacement angle of the DMF and is the output torque of the DMF and also the clutch torque acting on the front of EDC. Actually and are varied in different conditions of engine speed and torque owing to the non-linear factors. However, it is rational to set them constant in a small operating range such as the progress of engine-start.
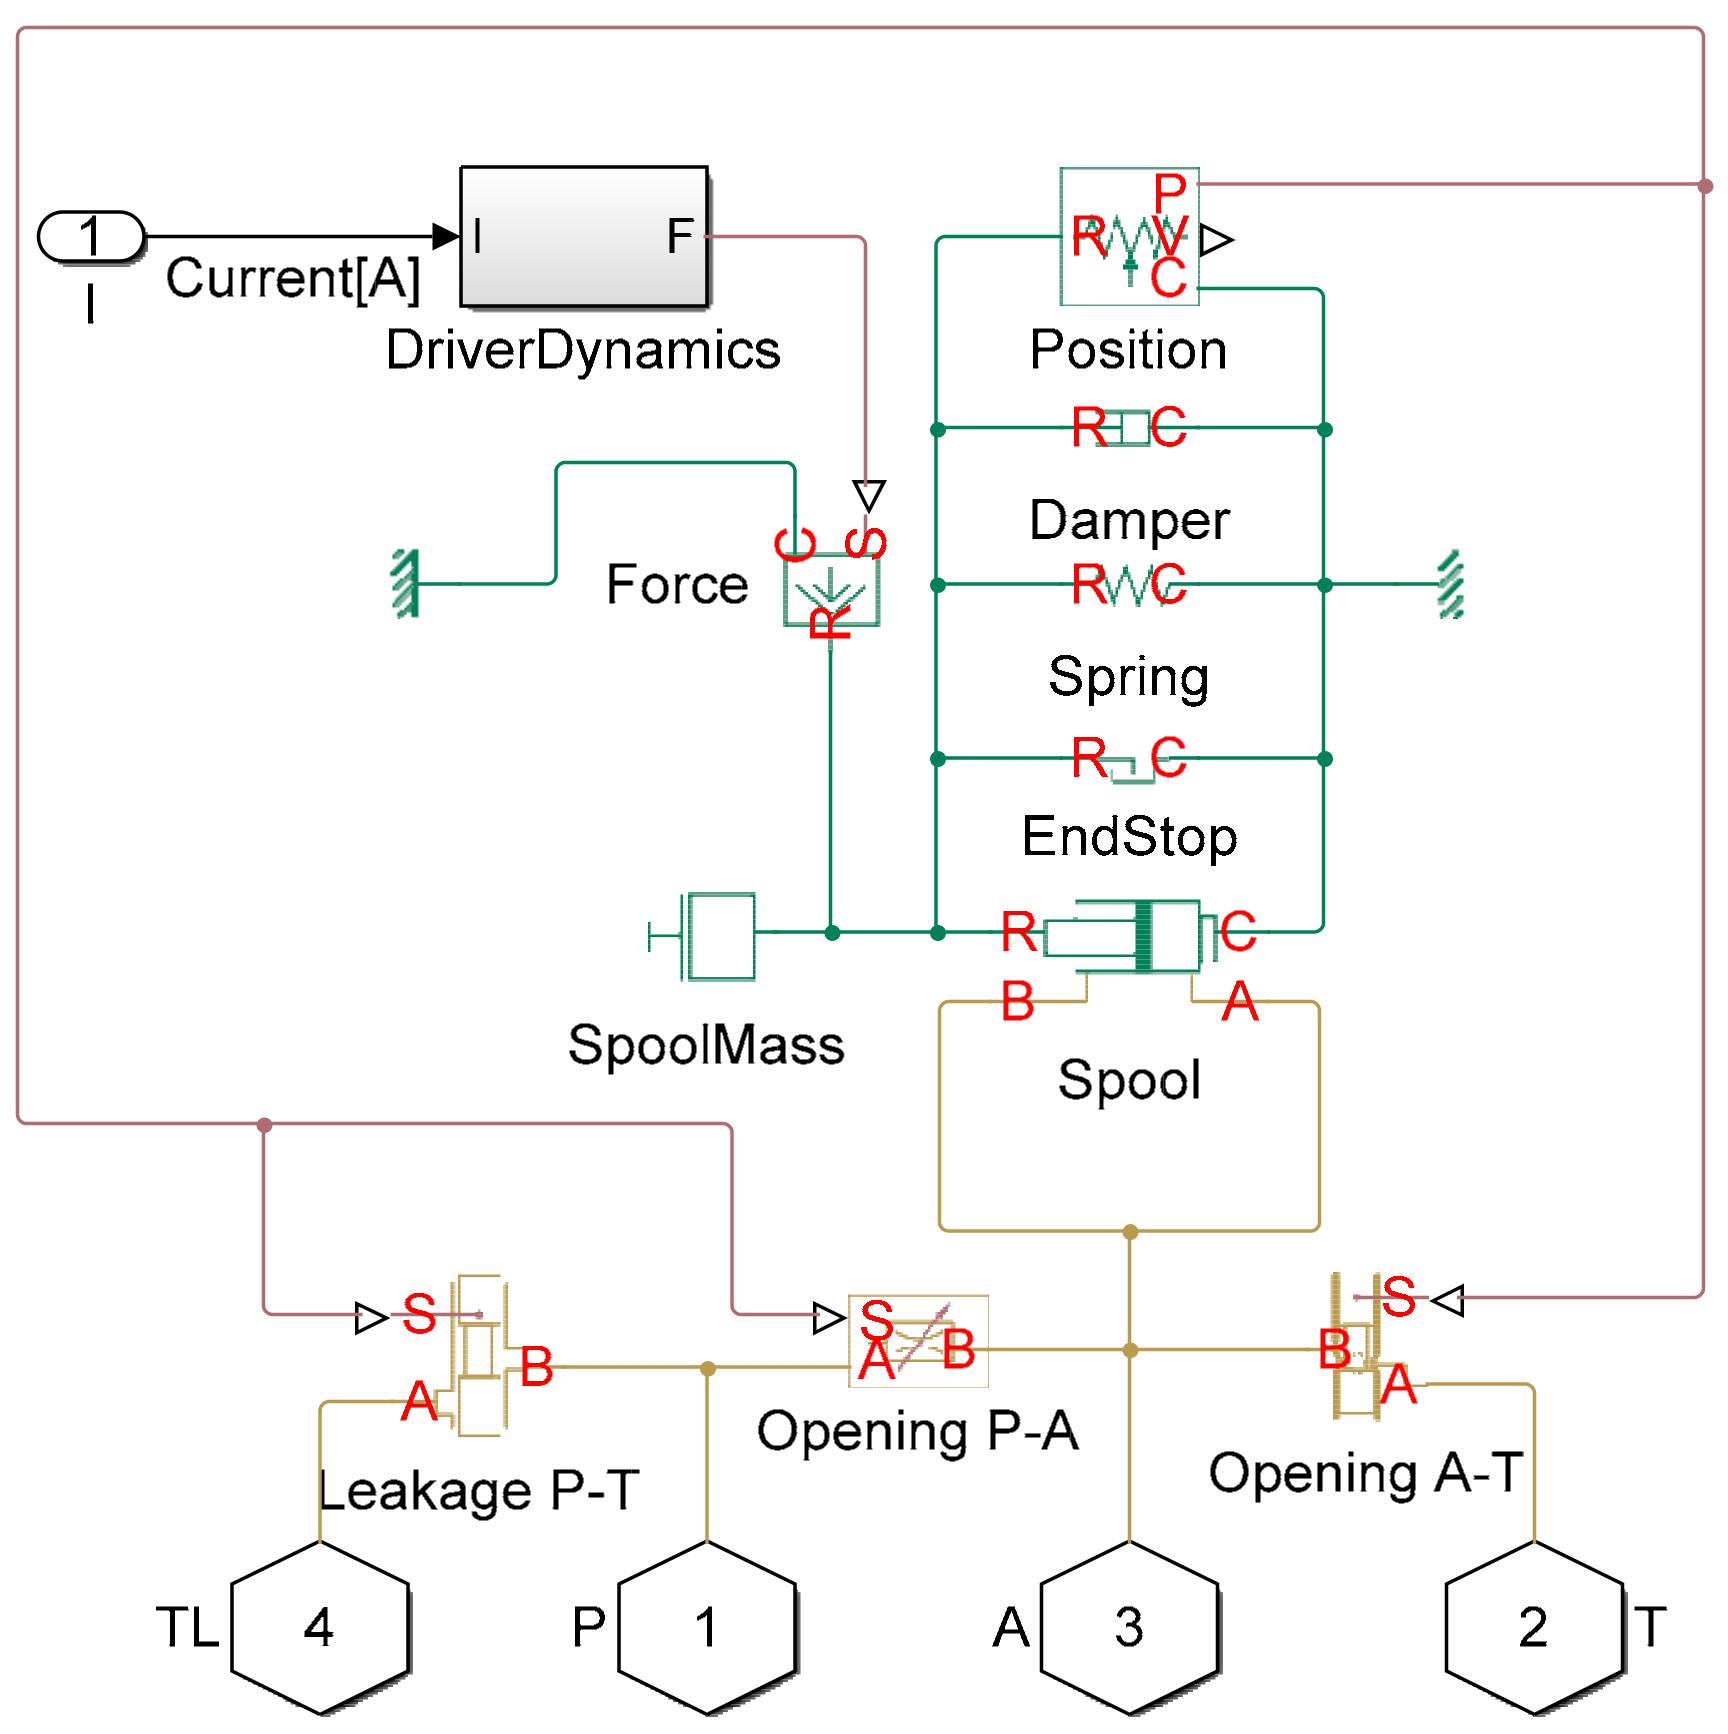
2.4. EDC and Its Actuation
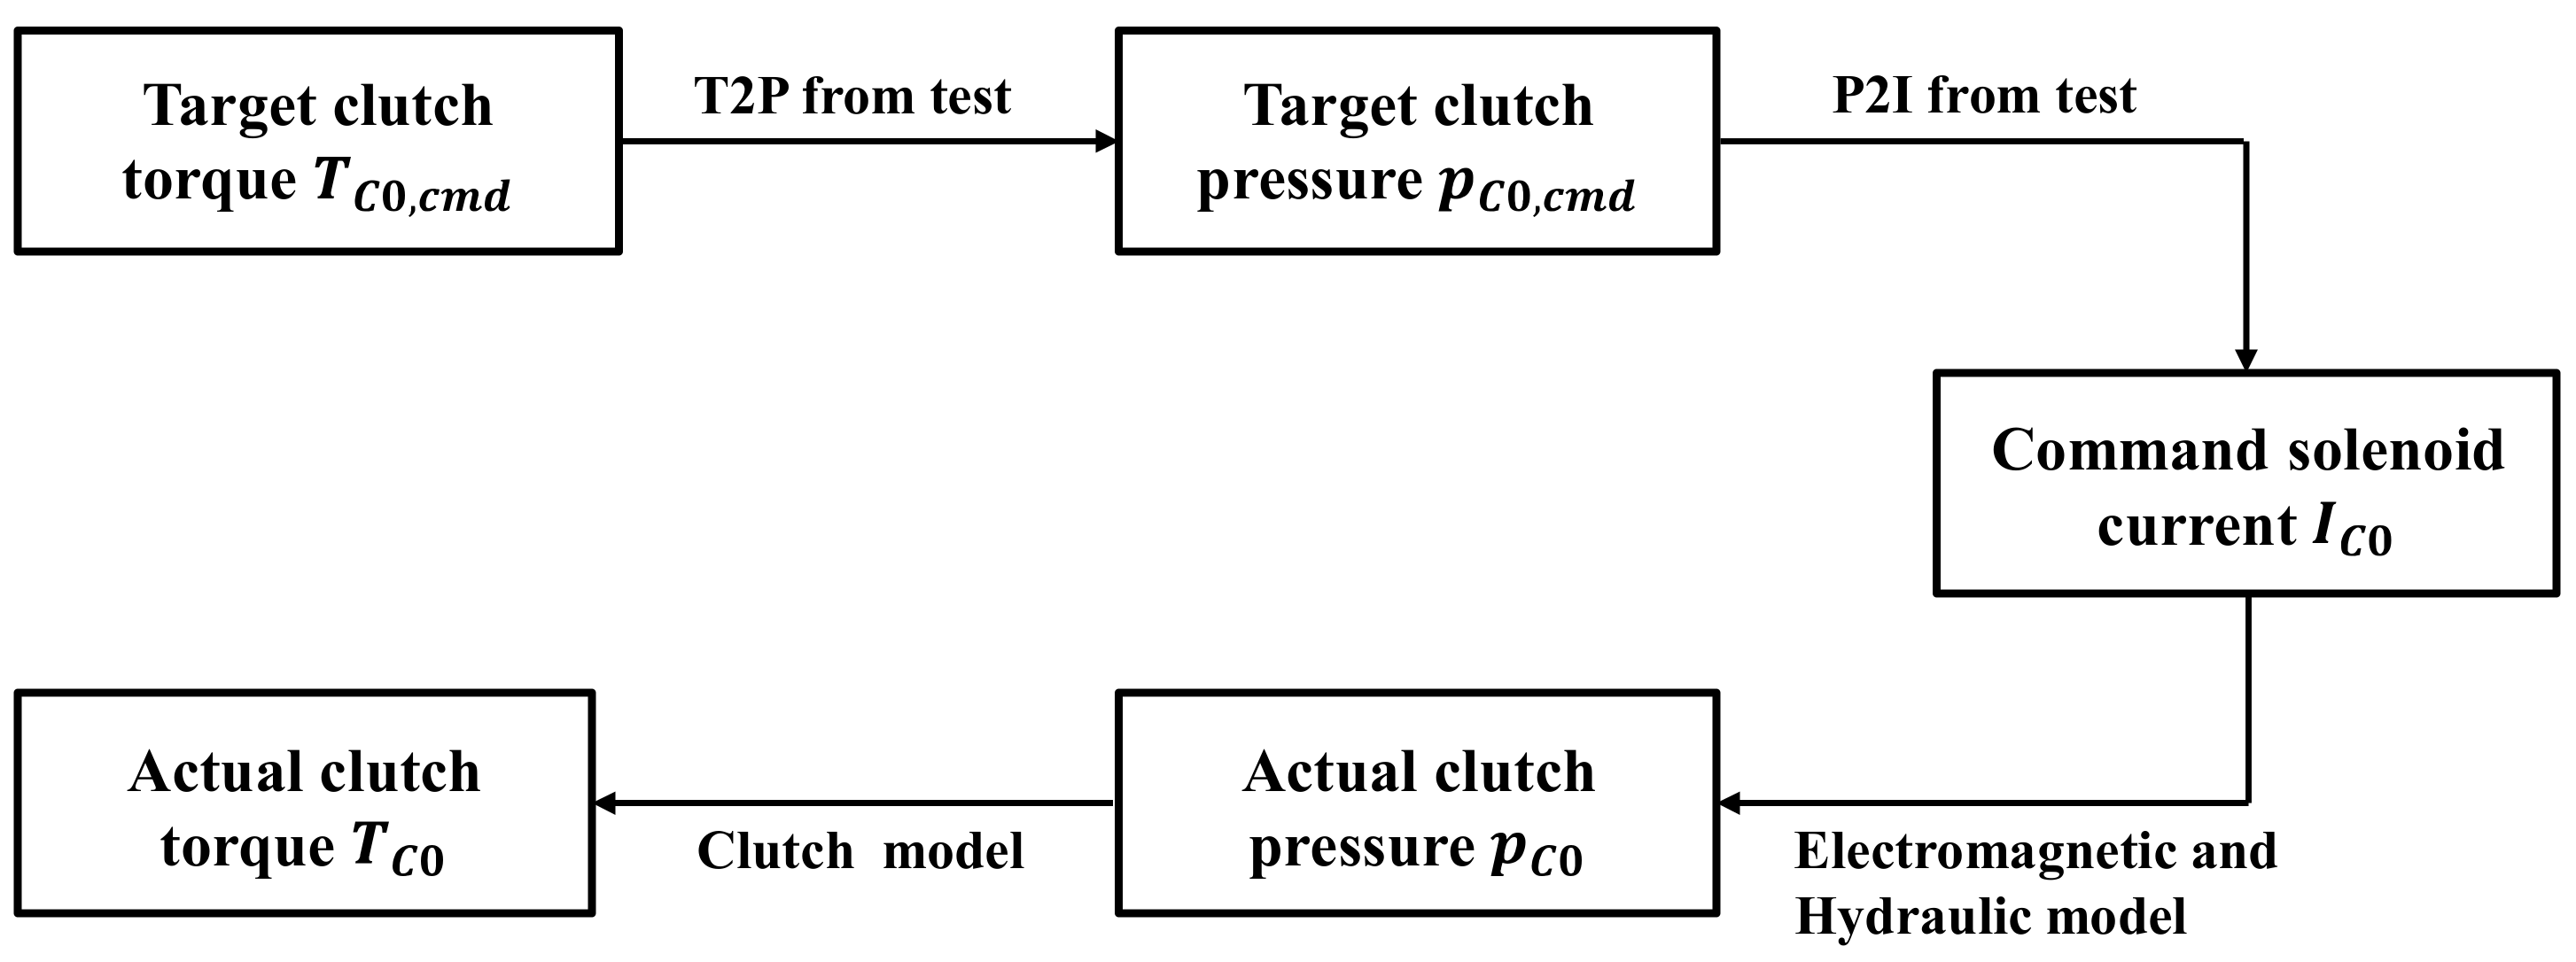
In the simulation, the EDC control process can be summarized as in Figure 7. And the dynamic modeling of such a process consists of two parts: hydraulic pressure control modeling and EDC dynamics modeling. The modeling of hydraulic pressure control describes the dynamic process from target clutch torque to actual clutch pressure . In this model, the hydraulic pressure in the clutch is controlled by a direct acting proportional pressure control valve, and the valve is modeled with three variable size orifices, a double acting piston and a spring. The variable size orifices and the front surfaces of the spool are tuned for the valve to match the current to pressure characteristics by valve manufacturer Hilite (Marktheidenfeld, Garmany). Additionally, the dynamic behavior of the coil and armature is modelled as a first order transfer function, and the valve is fed by an ideal line pressure source. The detailed modeling of the valve is achieved by using the MATLAB 2015b/Simulink Simscape as seen in Figure 8. In addition, the torque to pressure characteristics (T2P) and pressure to current characteristics (P2I) are acquired from the test data and stored in the look-up table.
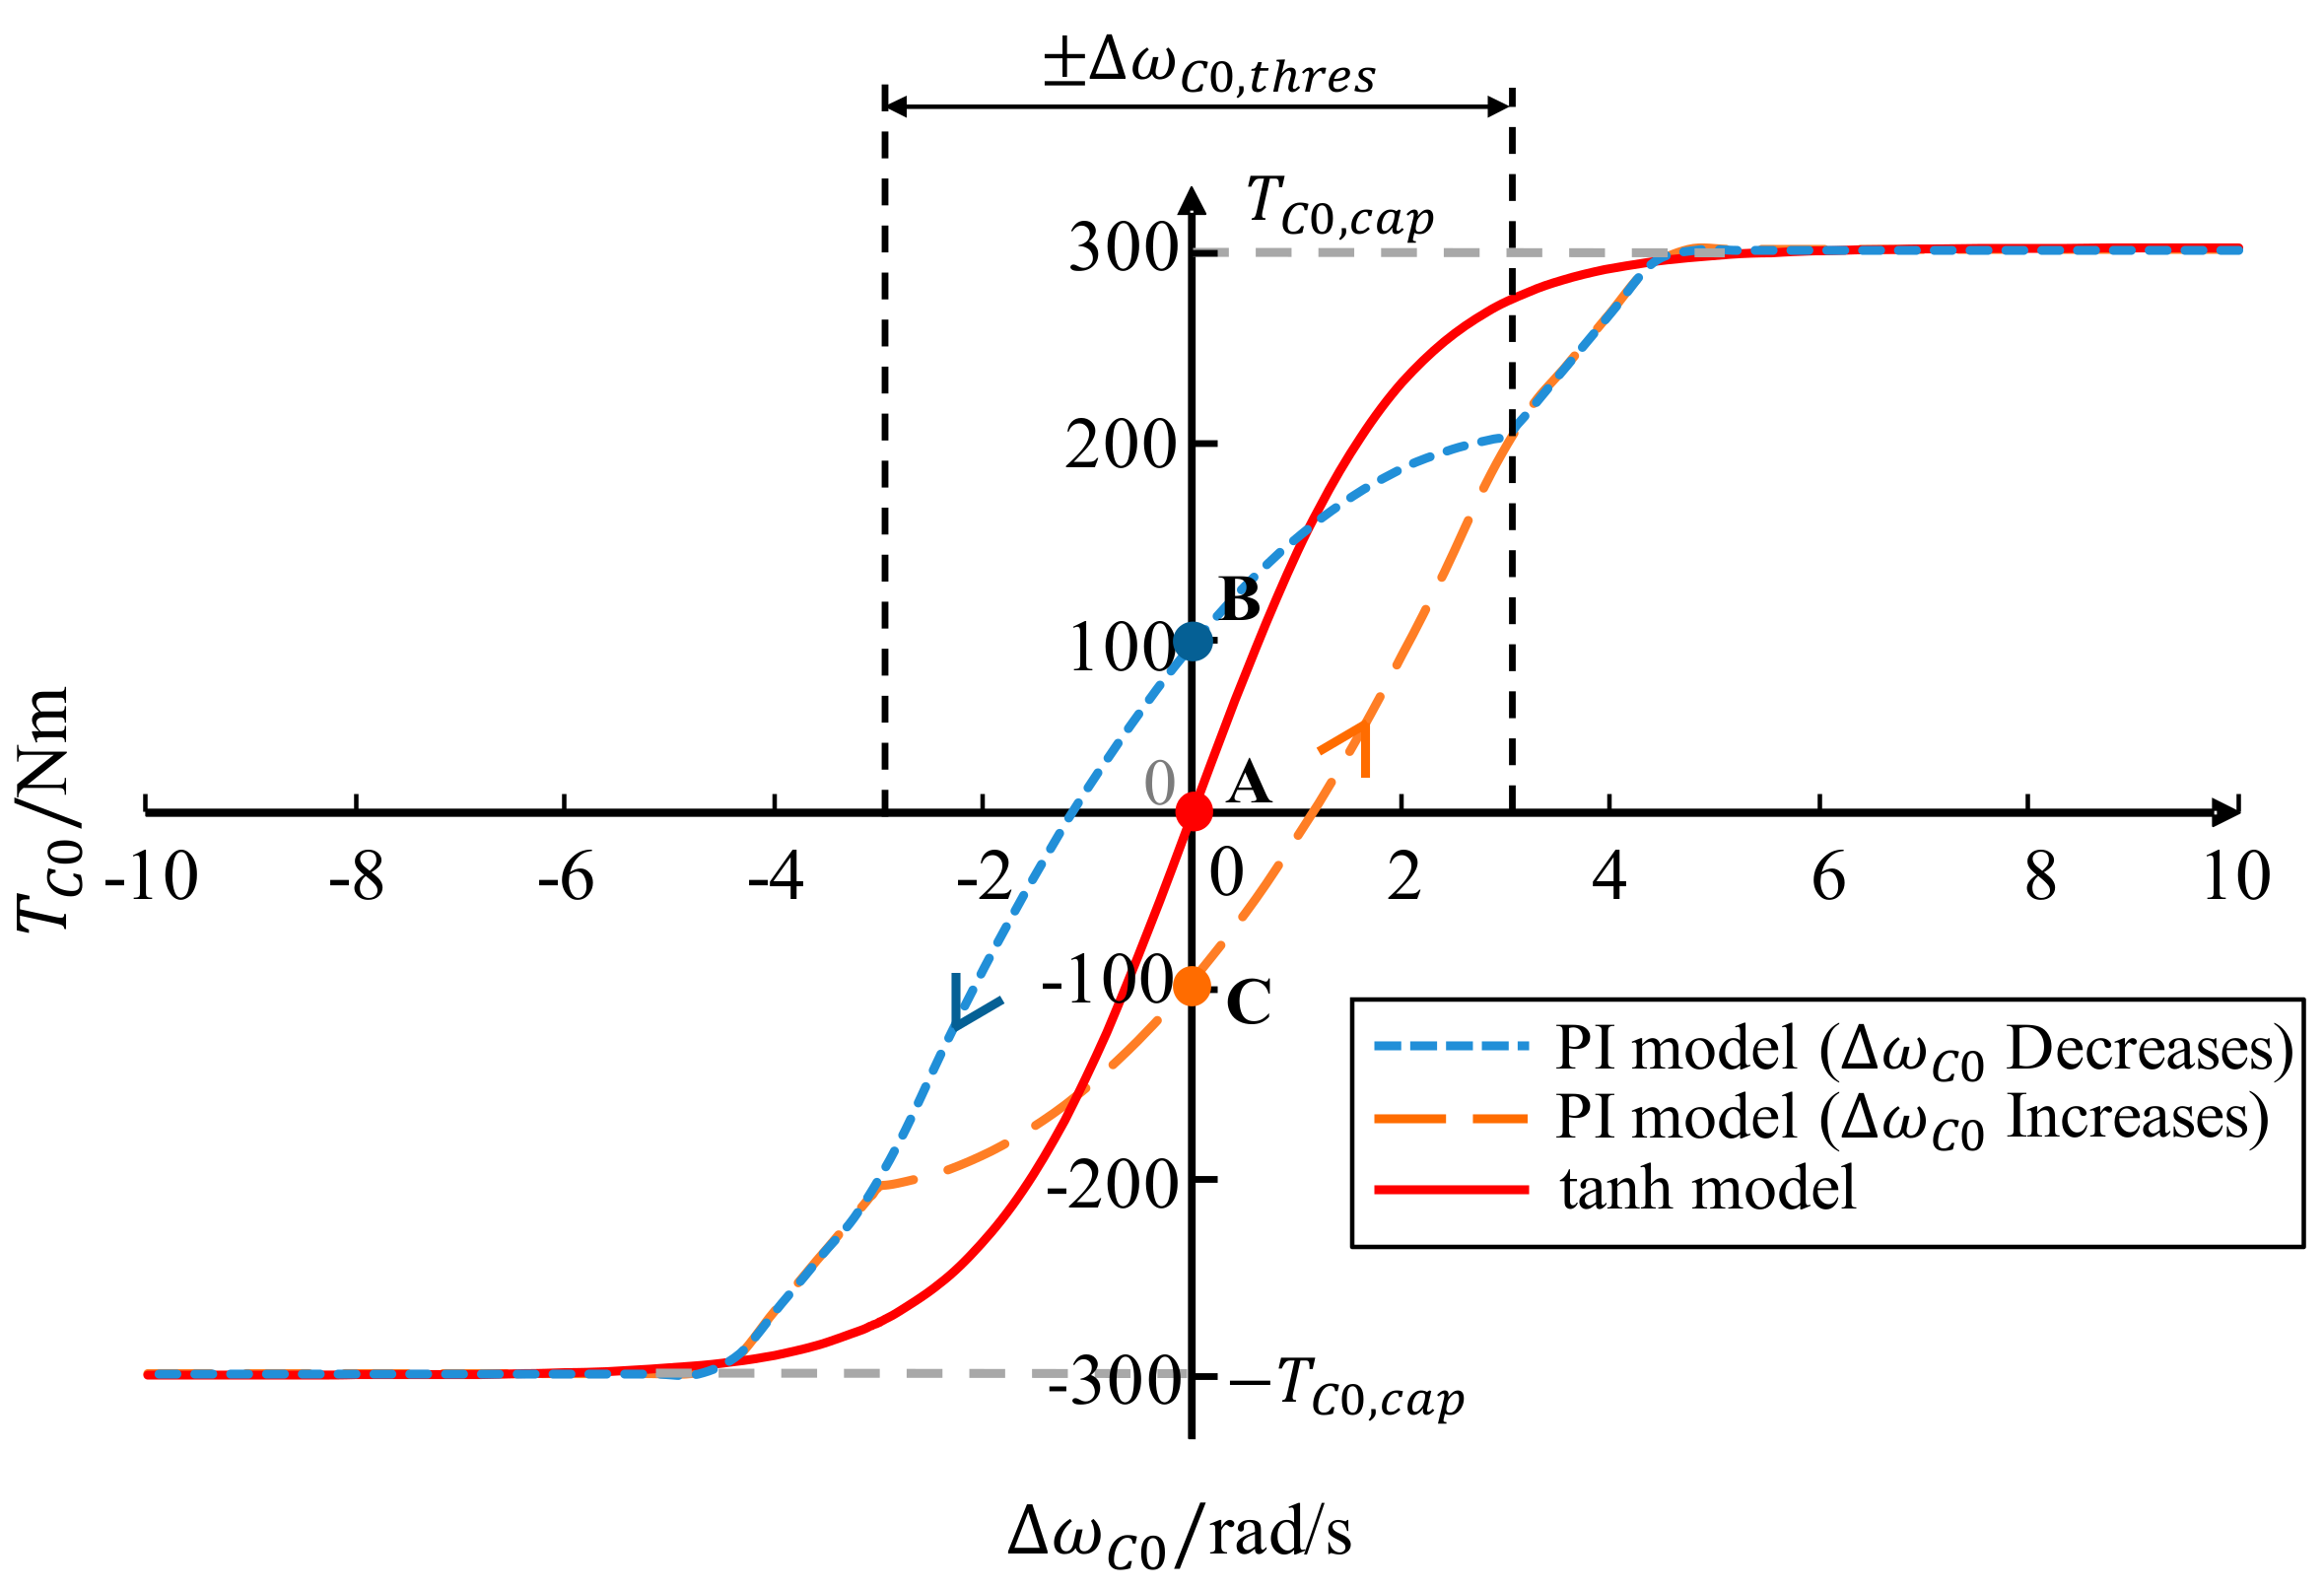
The right modeling method of clutch dynamics plays a vital role in the simulation because stick-slip friction is difficult to simulate and the accurate calculation of actual clutch torque determines the control algorithm. A hyperbolic tangent function (tanh) clutch model is introduced in Reference [21], and it was pointed out that not only the clutch slip speed has to be non-zero, but also the simulation will be slow and even unstable when reducing slip speed by using a small scaling factor. Thus, a namely PI (Proportional and Integral) model was proposed to calculate clutch torque for simplicity and stability of the simulations.
In the [22], the principle of the PI model is presented as:
where is the clutch torque calculated from the PI arithmetic, is the proportional gain, is the integral gain, is the slip speed threshold and is the difference between the rear speed and the front speed .
Actually, the control of EDC is realized by the control of clutch pressure which determines the torque capacity as:
where is the torque capacity meaning that the maximum torque the clutch can transfer in the clutch pressure , is the stick friction coefficient, is the number of friction surface, is the effective torque radius of the clutch plate, is the area of the clutch piston and is the clutch return spring force. In the simulation, the clutch torque is determined by:
As seen in Figure 9, contrast to the tanh model, the PI model can successfully avoid sudden change of clutch torque when goes through zero. To realize better simulation results, it is noted that and should be adjusted to suit the clutch. Commonly, a small is first determined. Secondly, has to be adjusted to realize slow and steady torque change when . On the basis of above works, should be finely adjusted to achieve not only fast torque change when , but also appropriate torque value when . Usually, it is necessary to reiterate the adjustment between and to achieve a satisfying result.
Accordingly, the front clutch torque and the rear clutch torque respectively is:
2.5. AC Motor
The AC motor is integrated to be mounted in the 8-speed AT as seen in Figure 10, and mainly consists of stator and rotor. The stator is fixed to the housing of 8-speed, and the rotor is supported on the housing by bearing and connected to both the rear part of EDC and the input shaft of 8-speed. In this paper, the motor torque command is directly controlled by MCU. Considering that the response of AC motor torque is fast and precise, the actual motor torque can be calculated by:
where is the maximum motor torque in the motor speed , and the dynamics of rotor is decided by:
where is the inertia of motor rotor and is the input torque of the 8-speed AT.
2.6. 8-Speed AT and Remaining Drivetrain
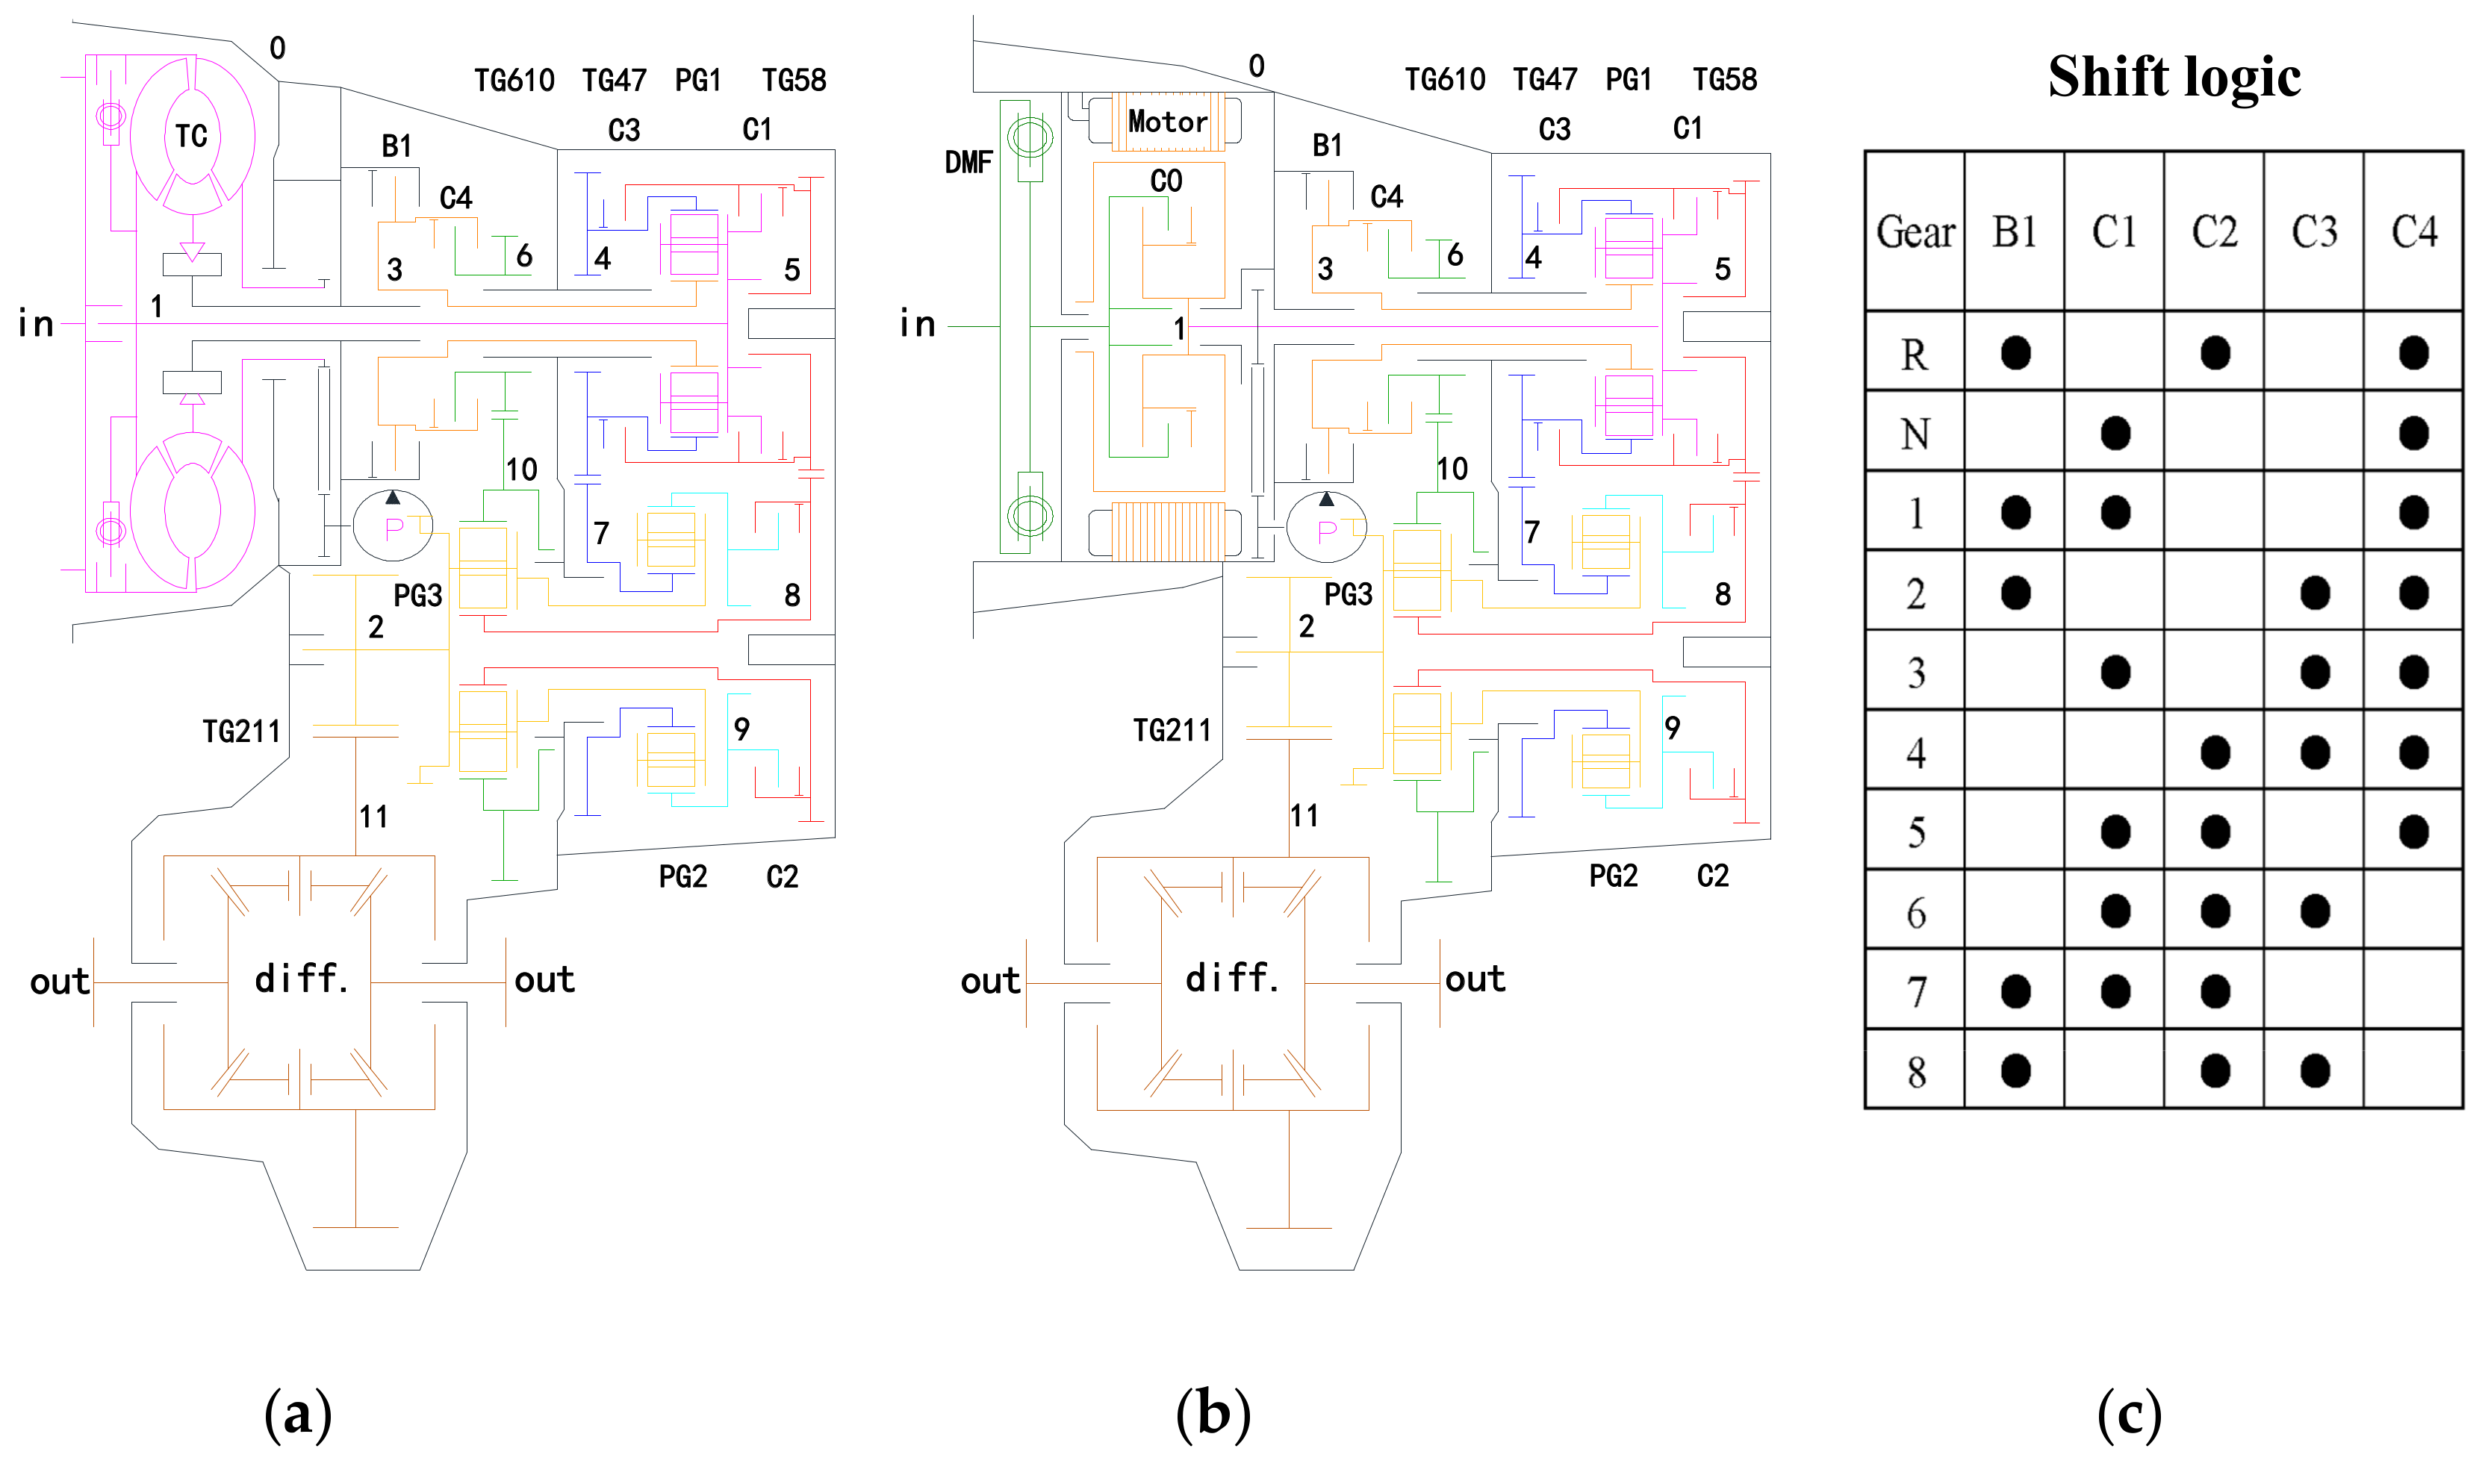
As mentioned before, the single-motor P2 HEVs transmission is designed based on the original 8 AT from Shengrui Transmission Corporation Ltd. The P2 HEVs 8 AT abolished the torque converter (TC) and made use of its room to mount dual mass flywheel (DMF) and EDC, which is cost-effective and compact. As seen in Figure 10, it has four transfer gear sets “TG610, TG47, TG58, TG211”, three planetary gear sets “PG1, PG2, PG3”, and five shifting elements “B1, C1, C2, C3, C4”. The shift happens by the means of changing the state of shifting elements according to the shift logic.
During the engine-start, the authors set the gear of 8 AT fixed and no shift behaviors will happen. Correspondingly, shifting elements will stay closed according to the shift logic, and the speed ratio of transmission keeps constant. Thus, the modeling of 8-speed AT only allows for the kinetics and kinematics of gears and shafts, which regards the working shifting elements as engaged.
The kinetics and kinematics modeling of 8 AT can be achieved by using Newton equation, which is minutely analyzed by our prior effort in [23], and is arranged into a matrix as:
where the matrix M is a symmetric matrix with information of all inertias and speed constraints, the column vector Ω is the state variable vector consisting of the acceleration variables of all free bodies and internal force, the column vector T consists of all clutch torques and external torques and matrix B describes which torque is exerted on which inertia in what direction. In conclusion, the input torque and the output torque of 8 AT are expressed in the column vector T, and the input angular acceleration and the output angular acceleration of 8 AT are expressed in the column vector Ω. Here,
where is the constant total speed ratio of 8 AT during engine-start. It is noted that the detailed information of model matrix is omitted here on account of the complexity of 8 AT, and the matrix is solved by the MATLAB function in the simulation.
The remaining drivetrain dynamics mainly takes the rotation of the transaxle and wheels into account and is determined by:
where is the equivalent rotational inertia of transaxle and two wheels and is the traction torque on the wheels.
2.7. Driving Resistances
The traction torque acting on the wheels are functioned to overcome the driving resistances as:
where is the dynamic wheel radius of the driving wheels and the driving resistances can be expressed by:
where , , and are respectively the acceleration resistance, the gradient resistance, the wheel rolling resistance and the air resistance, is the total vehicle mass, is the slope angle, is the rolling resistance coefficient, is the dimensionless drag coefficient, is the maximum vehicle cross-section, is the air density, is the air speed and here is set as zero.
On this research, the tire dynamics is neglected and slip ratio is prescribed zero. Therefore, the vehicle speed is directly formulated as:
In summary, the main parameters of the P2 hybrid system model are set as shown in Table 1, and the follow control strategies are developed based on these data.
3. Coordinated Engine-Start Control Strategies
During the engine-start transition, the coordinated control consists of traction control, EDC torque control, motor torque control and engine torque control, which are individually commanded by HCU, TCU, MCU and ECU. The control architecture can be summarized as Figure 11.
In the traction control, based on the driver’s demands and sensor information of road load, corresponding strategies are functional to calculate the transmission input torque target , and allocate it into engine propelling torque target and motor propelling torque target . In the view of allocation strategy of transmission input torque target , engine-start situations can be generally summarized into two groups: engine-start without engine torque request (soft start) and engine-start with engine torque request (dynamical start). The following engine-start control objectives and strategies are designed on the basis of such two groups.
During both engine-start situations, the EDC should transmit the torque command to start the engine accurately as well as cancelling engine torque vibration. Generally, for the purpose of smoothing the engagement of EDC, the closed-loop clutch pressure control will adopt the slip control method based on the speed difference [24,25,26]. In order to shrink the control sensitiveness of unsteadiness of state variable, here the authors define the state variable speed ratio as:
where is the engine speed, and is the motor speed. The EDC pressure command is calculated from the T2P characteristics as:
where is the T2P characteristics function in the form of lookup table, which is acquired from the end of line (EOL) test.
Meanwhile, the motor should not only provide with stable motor propelling torque target to avoid power jerk, but also the compensation torque to satisfy the EDC torque demand as:
where the time delay function delay aims at gaping the timing clearance because the dynamic of motor is faster than the actuation of EDC, and is the maximum motor torque in and is looked up in the motor mapping characteristics. Furthermore, the engine torque control should first satisfy the demand of engine propelling torque target , and also assist to adjust the engine speed based on the state variable .
3.1. Engine-Start without Engine Torque Request (Soft Start)
When the state of charge (SOC) reaches its lower limit or the driver turns on the engine proactively for the preparation of acceleration or climbing during cruising, an engine restart is needed and engine propelling torque target and . During the transition, vibrations are not to be expected and comfort takes the chief control objective, and the start time could be longer.
Therefore, the soft start strategy is designed for such an operating condition, and the coordinated control strategy can be concluded as control sequence in Figure 12. The process is broken down into four stages: preparation stage (I), engine cranking stage (II), engine synchronization stage (III) and lock-up stage (IV). During the whole process, the 8 AT input torque should be kept stable to guarantee both driving performance and riding comfort.
I. Preparation stage
When the engine-start transition is triggered, the state goes to the preparation stage. The main objective of this stage is to fulfill the fill phase of EDC stably and accurately as:
where is the open-loop function of square fill [27], is the fast fill time, is the fast fill pressure and is the kiss-point pressure of EDC which can be acquired from tests. In the fill phase control, the matching of and holds critical because both under-fill and over-fill will result in torque jerk in the stage II, which deteriorates comfort intensively.
II. Engine cranking stage
Once the fill phase finished, the engine cranking stage is triggered to spin up engine speed from zero to ignition speed for the preparation of firing. In soft start, the ignition speed is usually same as the idle speed . The engine is cranked by the EDC torque , which is traditionally commanded by the feed-forward control calculated based on the estimation of engine drag torque. To achieve a smooth engagement of EDC and realize a stable engine cranking, a feed-back EDC slip control substitutes as:
where the slip control function is designed as:
such a function ensures a seamless closing of the EDC and allows the engine speed to increase over the 8 AT input speed without the sticking of the friction surfaces.
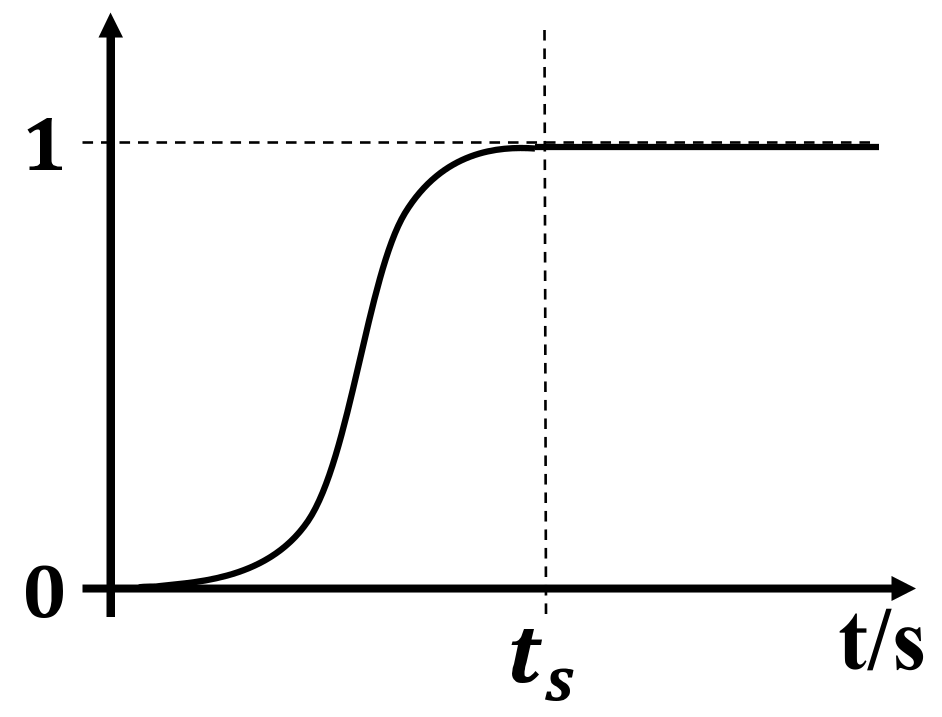
Additionally, the feed-forward engine cranking torque command varies in the law of:
where is the max cranking torque and is the function of simulation time t since this function was triggered as seen in Figure 13. The function rises up from 0 to 1 in the half of a sine cycle and then keeps 1 constant. It is necessary to calibrate the max cranking torque appropriately to trade off the cranking time and comfort.
III. Engine synchronization stage
Once engine speed reaches to the ignition speed , the ECU is triggered to start the ignition by setting an engine start torque . In this stage, the main control purpose is to speed up the engine to be synchronized with the motor quickly and steadily, which is prepared for the lock-up of EDC. To avoid the long time slipping of EDC, the torque capacity of EDC should decline fleetly without jerk as:
where is the EDC torque capacity command in the initiate of synchronization stage. When the EDC torque capacity command decreases under a threshold , the engine speed should be controlled by the engine torque to overcome the engine inertial torque . The engine torque command is determined by the discrete-time PI feed-back control as:
where is the proportional gain, is the integral gain, is the speed ratio difference of EDC at step k and is the sample time at step k. As soon as increases over the threshold , the engine synchronization stage finished, and lock-up stage is triggered.
IV. Lock-up stage
Now that the torque capacity of EDC has decreased to zero for fear of long slipping, in this stage, rebuilding the torque capacity of EDC to realize EDC lock-up dominates the main task. To smooth the engagement of EDC, the pressure is commanded directly by:
where is the change rate of at step k and is the constant change acceleration of .The is designed to realize a gentle engagement of EDC. When the increases to the line pressure , the whole engine-start transition comes to the end and EDC is then kept lock-up in the pressure .
3.2. Engine-Start with Engine Torque Request (Dynamical Start)
When the motor torque cannot satisfy the driver’s demand such as climbing or accelerating, such a transition is triggered to achieve a parallel drive. The traction control is responsible for allocating the transmission input torque target into engine propelling torque target and motor propelling torque target properly. In this transition, the driver is extremely sensitive to driving performance and riding comfort demand attenuates. Therefore, the engine-start needs to be fast so that powertrain can response immediately, and there should be bits of vibrations so that engine-start can be noticeable. The dynamical start strategy is designed for such an operating condition and is developed based on the soft start strategy, and also can be summarized into four stages but with some different strategy details.
To build immediate power response, every stage had better be as short as possible. First, in the preparation stage, the fast fill time could be smaller and the fast fill pressure could be higher to achieve a shorter fill phase. Secondly, the ignition speed has to be smaller so as to shorten the cranking stage. Thirdly, the synchronization stage can be divided into two phase. When is positive, the engine is sped up by both engine torque and EDC torque. The torque capacity of EDC is commanded as same as in soft start strategy to avoid long slipping, and the engine torque is commanded by:
where is the maximum engine torque in , which is looked up in the engine mapping characteristics.
Once the engine speed has increased over the motor speed , which means that turns to negative, the torque capacity of EDC should be rebuilt to synchronize the engine in the law of:
Such a function first makes sure that the increases from zero to target value steadily to avoid shocks. Furthermore, the target value in the max function varies related to , which not only restrains the maximum (1.8) and minimum (0.2) target value but also adapt the target value to real-time demands from engine. And the engine torque command should increase in the law of:
where is the initial engine torque command in this phase, and the function helps to increase steadily from to the target value in square brackets. And the min function works as so that the engine can ensure sufficient torque output under the demand of the transmission input torque so as to satisfy the driver’s demands. Moreover, considering that the reaction torque from EDC cannot be fully compensated by the motor torque and such a reaction torque can be used to accelerate the vehicle, the motor torque command cannot be satisfied with (28) and should be regulated as:
Finally, when reaches to the threshold , the lock-up stage is triggered with bigger to achieve fast engagement of EDC. In the following period, the motor torque command is calculated by:
where the contents in the brackets means the compensated torque of motor.
4. Simulation Results and Discussion
4.1. Simulations of Engine-Start
4.1.1. Common Coasting Driving Condition
To compare the control effect between such two kinds of engine-start transitions closely, a common coasting driving condition is first to be simulated comparatively as seen in Table 2.
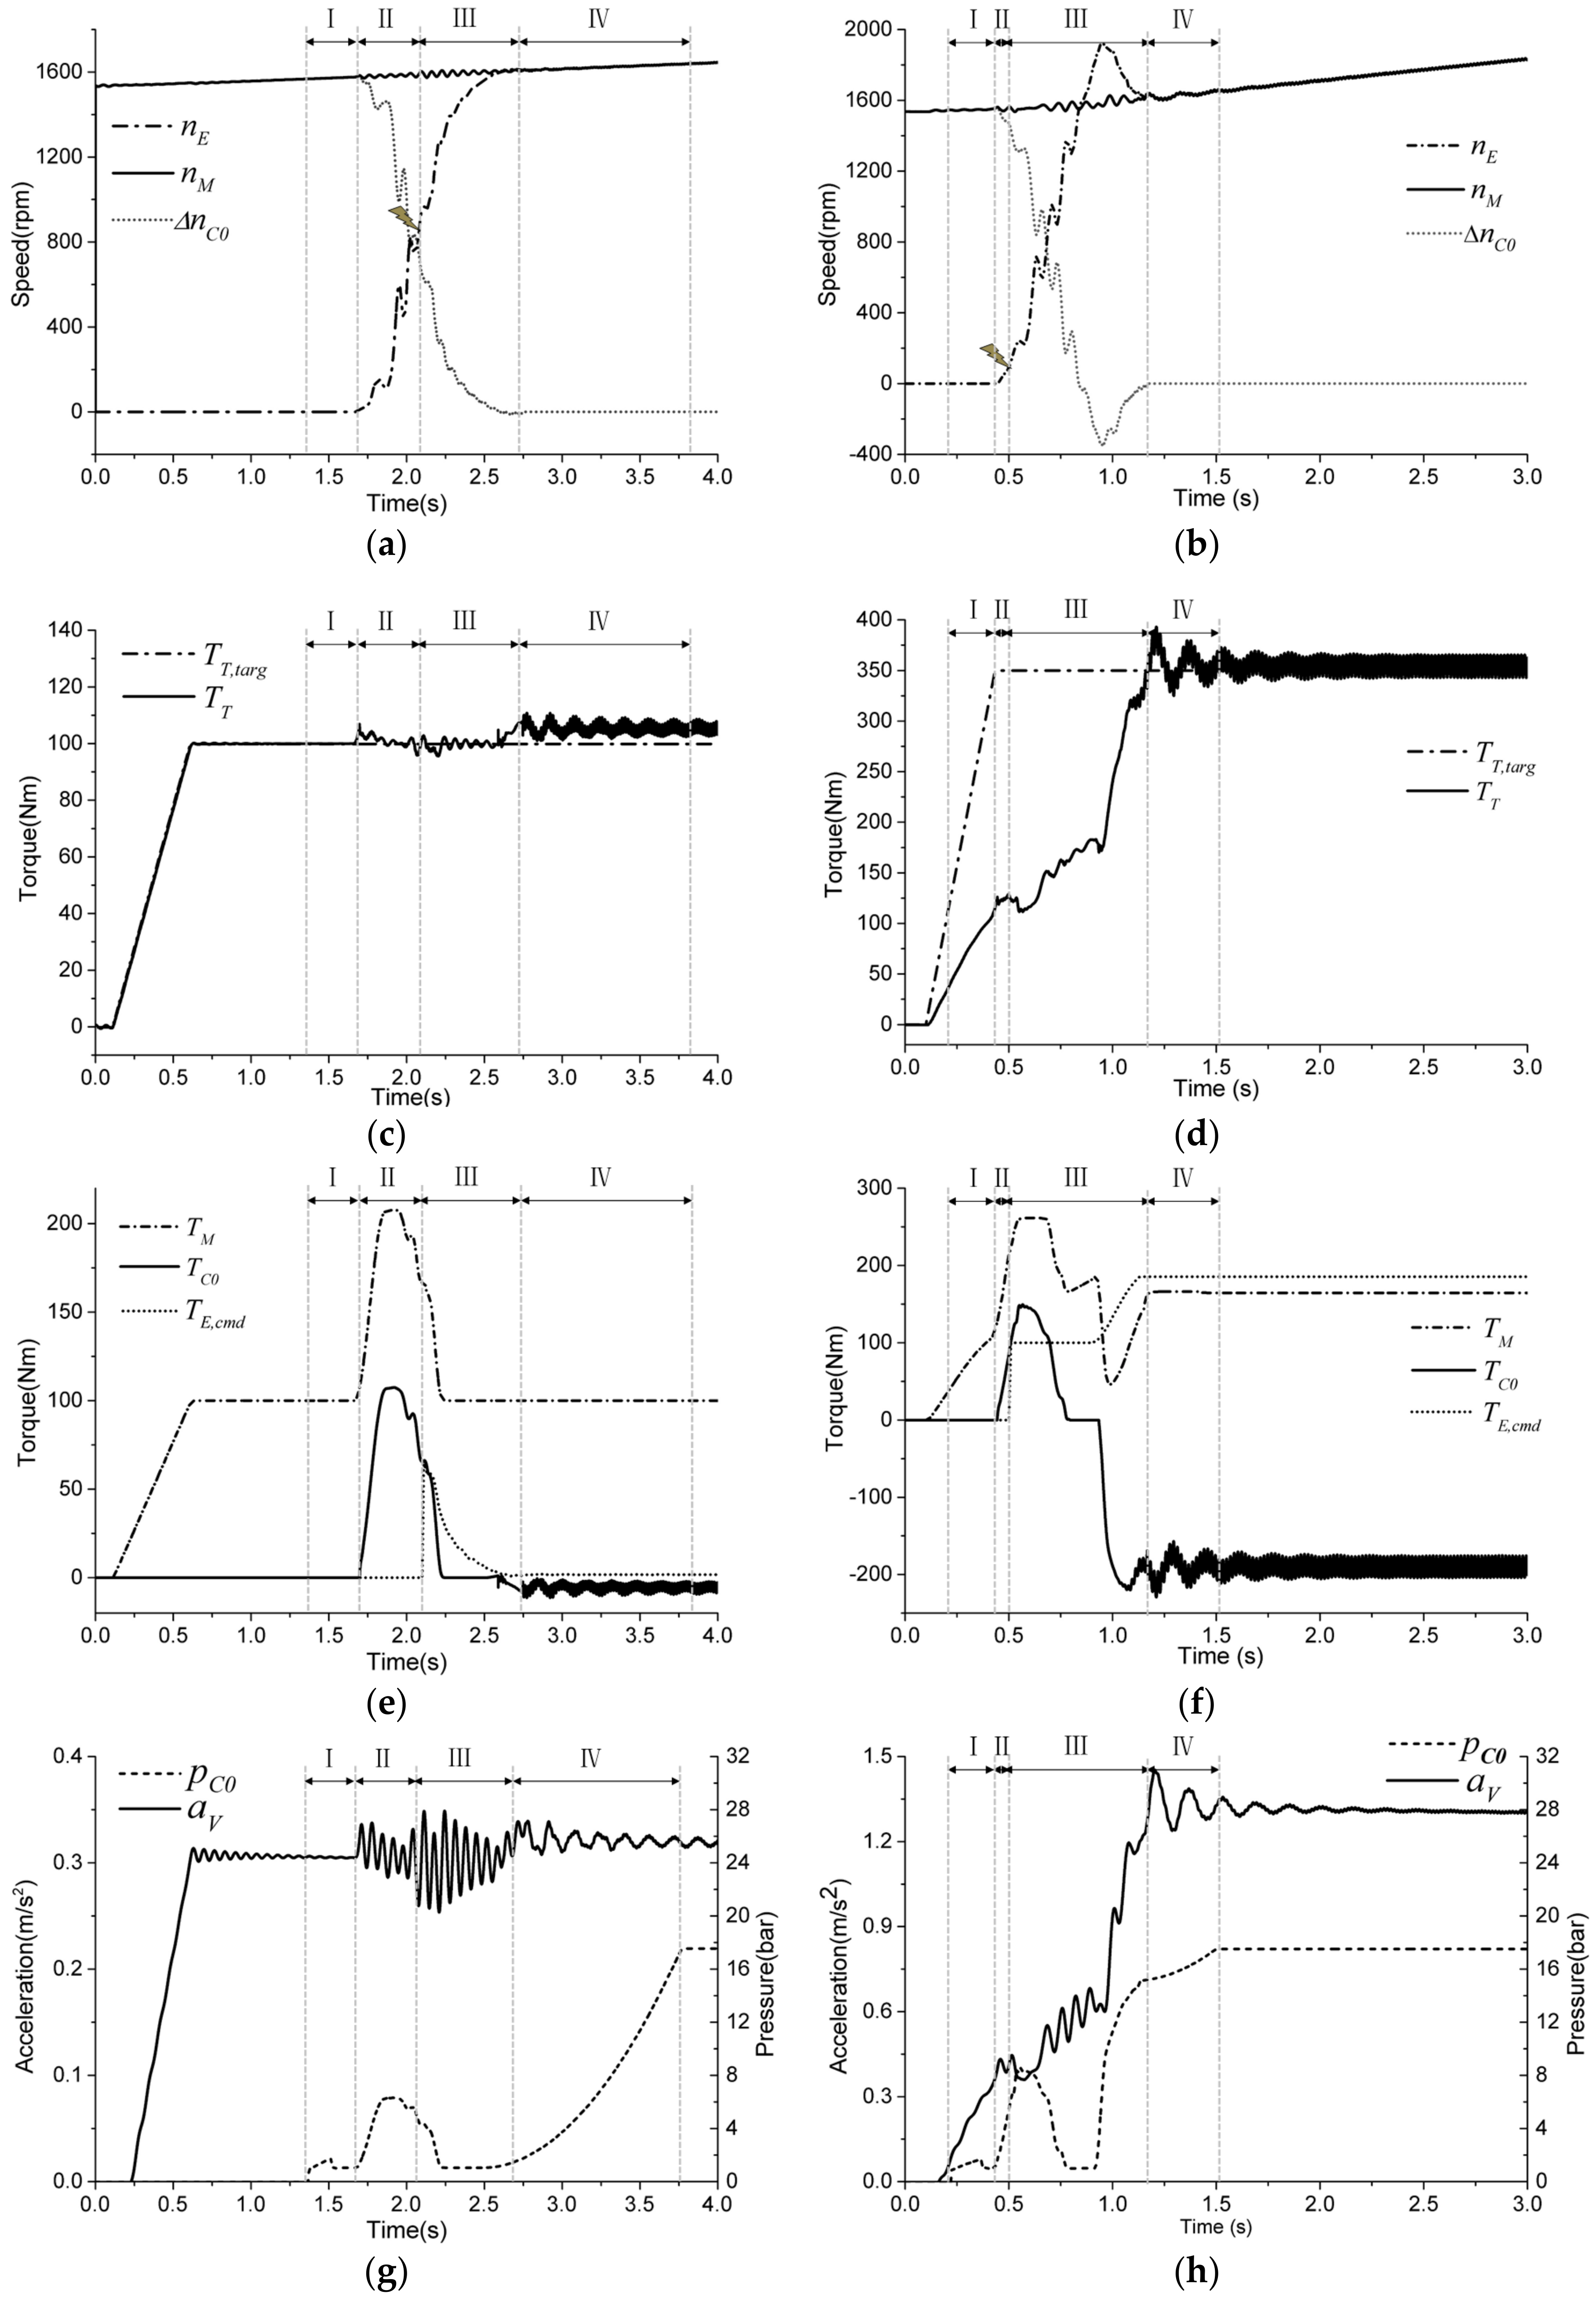
Such two transitions are both triggered when the vehicle is coasting at 60 km/h and in 6th gear, and the comparative simulation results are presented in the Figure 14. In the soft start, the transmission input torque target is only 100 Nm, which can be totally provided by the motor torque , and the transmission input torque can response well. However, in the dynamical start, the transmission input torque target reaches to 350 Nm that should be realized by both motor torque and engine torque , and the transmission input torque responses lingeringly. Obviously, the engine cranking stage in dynamical start is much shorter than in soft start so as to emit engine torque rapidly, which not only contributes to the response of the transmission input torque but also expedites the synchronization stage. In the synchronization stage, the engine torque in dynamical start is much higher than in soft start, so the engine speed in dynamical start runs more sharply than in soft start. Especially in the tail synchronization stage of dynamical start, the engine speed exceeds the motor speed , and EDC torque turns to negative to slow down the engine speed as well as compensate for the transmission input torque . Consequently, the total time of dynamical start is only 1.31 s, which is much shorter than the soft start’ 2.48 s. In addition, the maximum vehicle acceleration fluctuation of soft start is only 0.09 m/s2, which is much smaller than the dynamical start of 0.22 m/s2.
Above simulation results in the common coasting driving condition have not only presented the control process in detail, but also validated the soft start and dynamical start strategies to some extent. However, more driving conditions need to be discussed because engine-start should be prepared for most driving situations especially the extreme conditions.
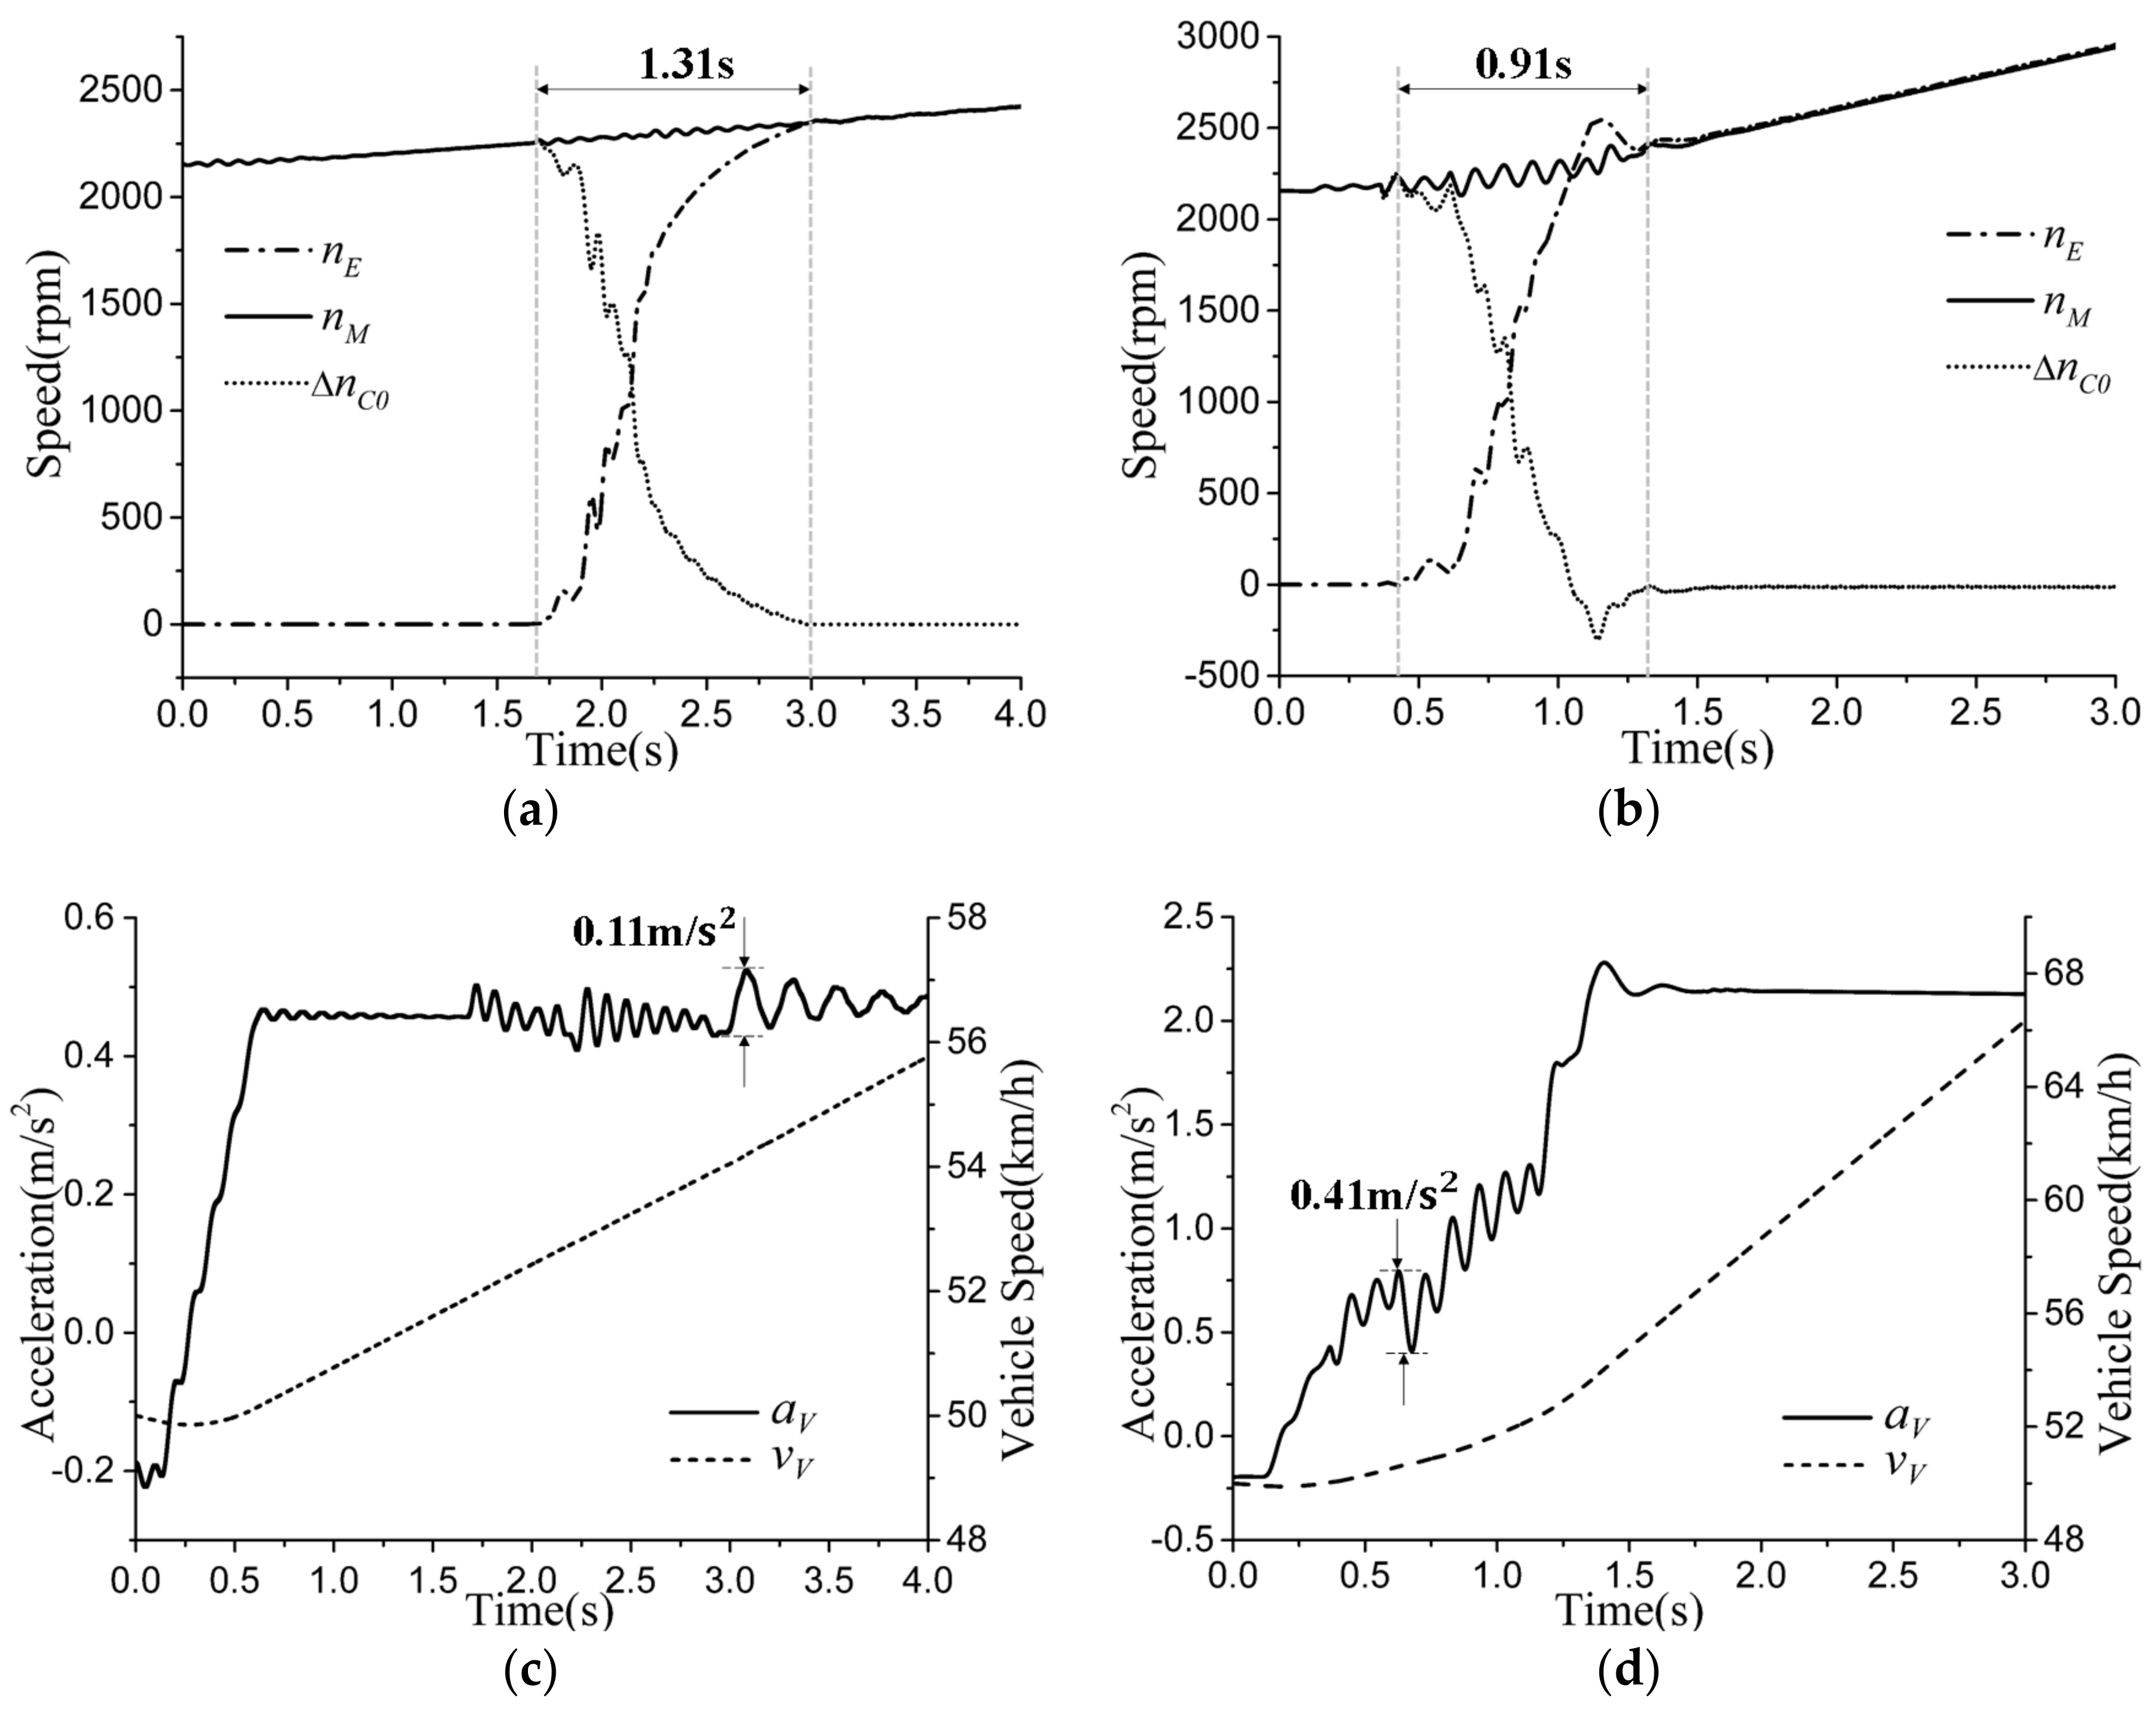
4.1.2. Low-Speed Driving Condition
Overtaking or climbing always happens in the low and medium vehicle speed, and downshift will always take place to get more torque reserve. On account that EM can exert fast and maximum torque in low speed, Hybrid vehicles regularly move off electrically, and accordingly dynamical engine-start will soon be triggered if strong overtaking or climbing is expected. Therefore, the driving performance determines the control effect of dynamical start in such a driving condition. And as comparison, soft start will be also discussed in the same driving condition.
In the simulation of low-speed condition, the vehicle speed is initially set to 50 km/h and the 8 AT is kept in 3rd gear. For the dynamical start, the transmission input torque target is 380 Nm, and is only 80 Nm for the soft start. Other parameter sets are similar to the common coasting driving condition, and some simulation results are presented in Figure 15.
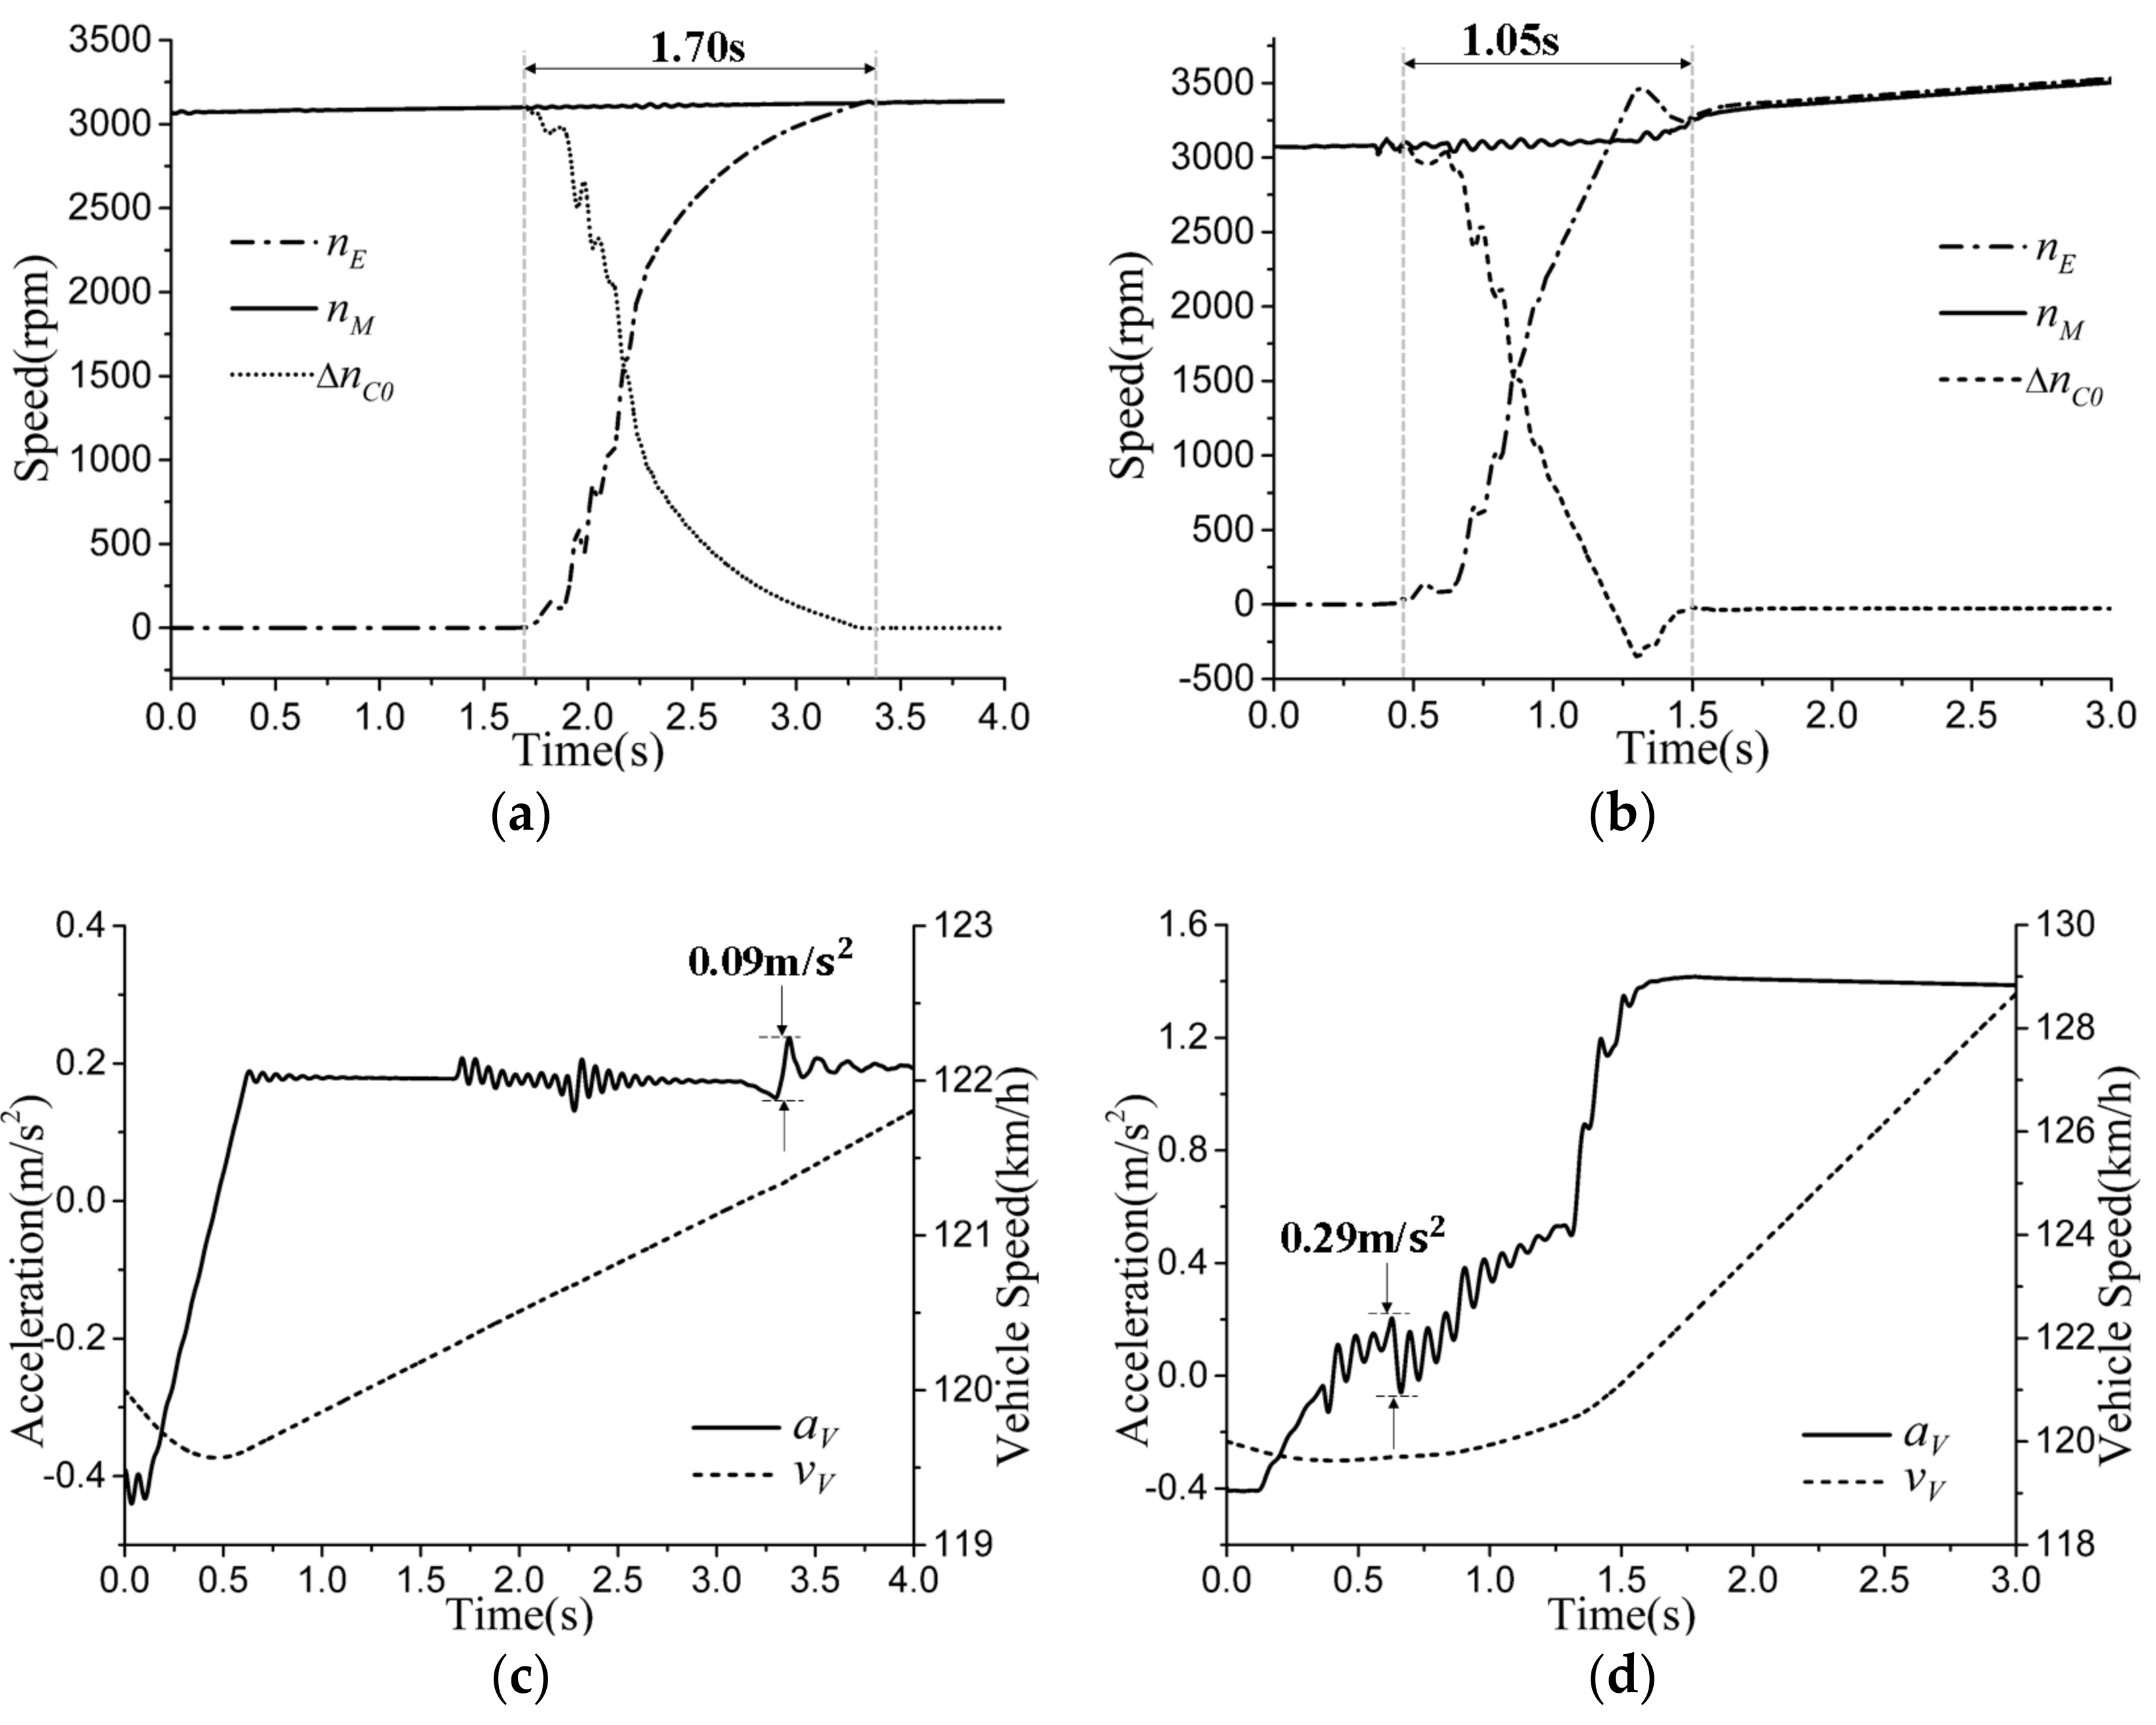
4.1.3. High-Speed Driving Condition
In the high-speed electric driving condition, the electricity consumption goes quickly because of high driving resistances. To keep the SOC steady, soft engine-start will be frequently triggered, and batteries can be recharged by engine. Passengers are always particularly sensitive to the riding comfort when the vehicle speed is very high. Therefore, the riding comfort determines the control effect of soft start in such a driving condition. And as comparison, dynamical start will be also discussed in the same driving condition.
In the simulation of high-speed condition, the vehicle speed is initially set to 120 km/h. And the 8 AT is kept in 6th gear so that higher engine speed condition can be simulated. For the soft start, the transmission input torque target is only 150 Nm, and is 450 Nm for the dynamical start. Other parameter sets are similar to the common coasting driving condition, and some simulation results are presented in Figure 16.
4.1.4. Discussion
To evaluate the control strategies between soft start and dynamical start, simulation results of above three driving conditions need to be discussed comparatively. Customarily, start time and vehicle acceleration vibrations are used respectively to evaluate the driving performance and riding comfort. In order to quantify the compromise between driving performance and riding comfort, this article use the engine speed change time which consists of engine cranking stage (II) and synchronization stage (III) to represent the start time, and use the maximum fluctuation to represent the vehicle acceleration vibrations.
Combined with Figure 14, Figure 15 and Figure 16, the simulation results of start time and maximum fluctuation are summarized as seen in Table 3. First, it is obvious that start time will get longer if engine-start occurs in higher motor speed, which results in slower torque response. Secondly, the improvements of riding comfort from dynamical start to soft start are respectively: 59% (common coasting), 73% (low speed) and 69% (high speed). And the improvements of driving performance from soft start to dynamical start are respectively: 36% (common coasting), 31% (low speed) and 38% (high speed). It is clear that the compromise between driving performance and riding comfort, to a large extent, is made so as to satisfy the driver’s demands. Last, in the soft start, all the maximum fluctuations are less than 0.315 m/s2 (not uncomfortable). And in the dynamical start, all the start time is less than 1.1 s (fast), which means that the torque output can response the driver’s demands well. In addition, all the maximum fluctuations of dynamical start reach over 0.21 m/s2 and under 0.5 m/s2 (passengers can feel obviously and with a little uncomfortable feelings). It is validated that the soft start strategy can realize a comfortable engine-start with few vibrations but longer start time, and the dynamical start strategy can achieve a fast and powerful engine-start but with noticeable vibrations.
After the analysis of simulation results, it is verified that both the soft start strategy and dynamical start strategy can work well in different driving conditions. However, above simulation results are not optimal because main parameter sets are the same. There is some room for optimization between driving performance and riding comfort through the adjustment of some main control parameters.
4.2. Variation of Main Parameters
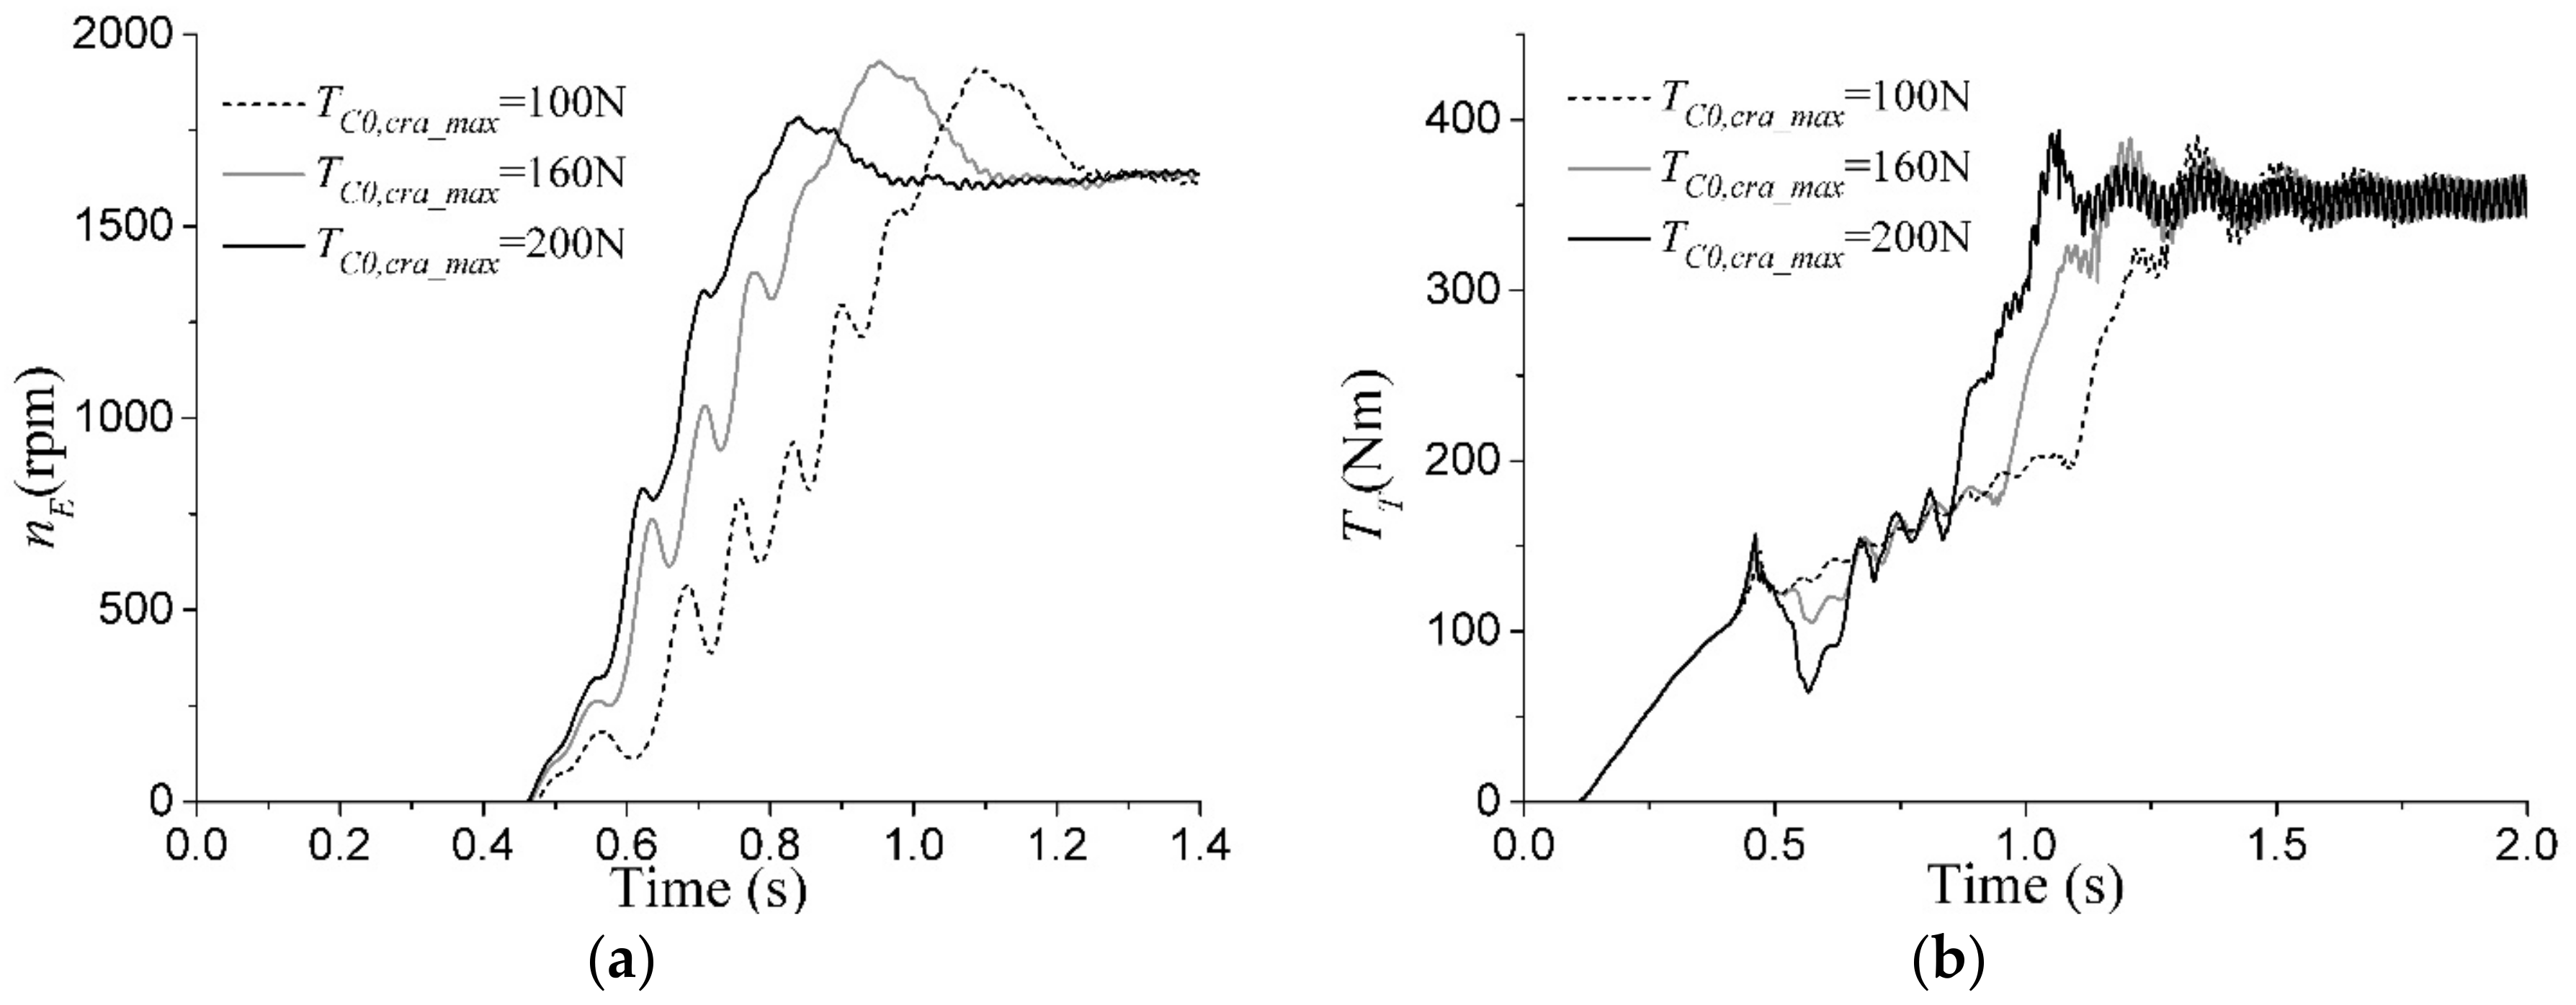
4.2.1. The Maximum Cranking Torque
One of the main control parameters affecting driving performance and riding comfort is the maximum cranking torque . This torque has to be high enough to crank the engine to ignition speed and is limited by the amount of reaction torque that the motor can exert for a short time. As seen in Figure 17, it is conspicuous to shorten the start time by increasing the max cranking torque . However, the more cranking torque requires more motor torque, which will lead up to more intense oscillations of transmission input torque and deteriorate the riding comfort. Such an important parameter should be decided in the road calibration experiment.
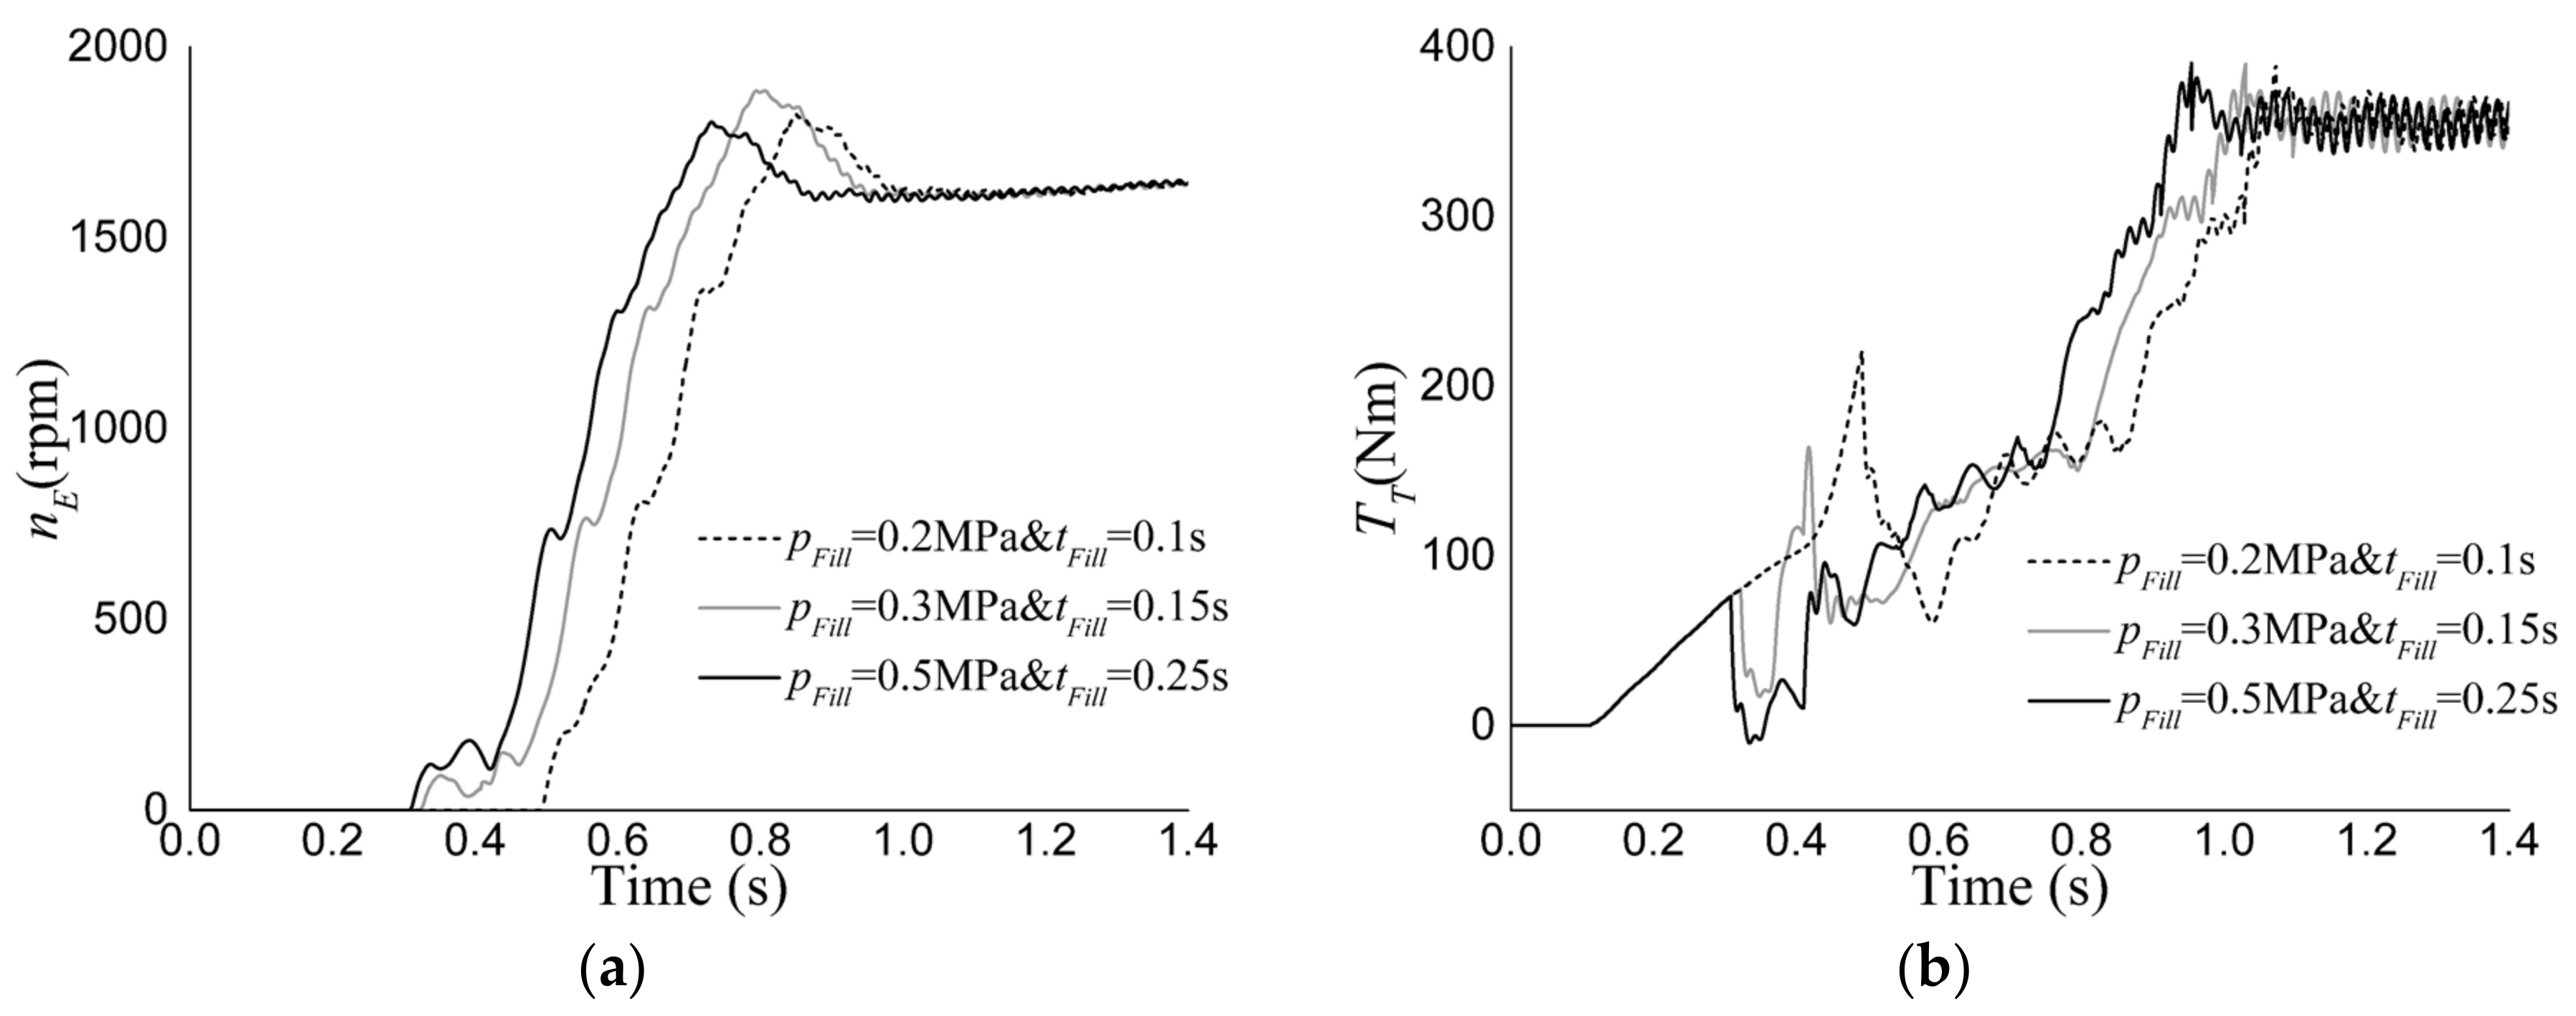
4.2.2. The Fast Fill Pressure and the Fast Fill Time
Because the engine is directly forced by the EDC, the hydraulic control of EDC affects the process of engine-start greatly. The fill phase of EDC in preparation stage determines the accuracy and promptness of EDC torque capacity in engine cranking stage. As seen in Figure 18, if under-fill happened ( = 2 bar & = 0.1 s), the EDC torque capacity cannot be built accurately and lays behind the control of motor torque, which will lead up to the flare of transmission input torque . On the other hand, if over-fill happened ( = 5 bar & = 0.25 s), the EDC torque capacity will be built ahead to crank the engine, which will lead up to the drop of transmission input torque . Both the fast fill pressure and the fast fill time should be matched properly to avoid under-fill and over-fill.
5. Conclusions and Expectations
In this paper, a P2 HEVs system based on an 8-speed AT has been introduced to realize better fuel economy and lower tailpipe emissions. To cut down the costs caused by additional starter, such a system makes use of one electric motor to propel the vehicle as well as start the engine. Contrast to the P2 HEVs with BSA or ISG, using driving motor to start the engine is faced with more challenges since the combined control of EDC, engine and motor is difficult. In addition, passengers are sharply sensitive to the driving performance and riding comfort during engine-start. Therefore, coordinated engine-start control strategies are designed to remedy for the shortage of the single-motor P2 HEVs.
The soft start control strategy is designed for the engine-start without engine torque request and the dynamical start control strategy is designed for the engine-start with engine torque request. Both methods can be divided into four stages: preparation stage (I), engine cranking stage (II), engine synchronization stage (III) and lock-up stage (IV). To evaluate the comparative control effect between soft start strategy and dynamical start strategy quantitatively, the start time and maximum vehicle acceleration fluctuation are used respectively to evaluate the riding comfort and driving performance. In the simulation results of three driving conditions, the improvements of riding comfort from dynamical start to soft start are respectively: 59% (common coasting), 73% (low speed) and 69% (high speed). And the improvements of driving performance from soft start to dynamical start are respectively: 36% (common coasting), 31% (low speed) and 38% (high speed). In addition, the maximum vehicle acceleration fluctuations of all soft start results are less than 0.315 m/s2 (not uncomfortable), and the start time of all dynamical start results is less than 1.1 s (fast). In conclusion, it is validated that the soft start strategy can realize a comfortable engine-start with few vibrations but longer start time, and the dynamical start strategy can achieve a fast and powerful engine-start but with noticeable vibrations.
Furthermore, to optimize the trade-off between driving performance and riding comfort, there are some key parameters need to be calibrated properly. For example, we can increase the maximum cranking torque to shorten the start time but the riding comfort will be sacrificed. In addition, to achieve a better comfort result, the fast fill pressure and the fast fill time should be matched properly to avoid under-fill and over-fill.
In a word, this research not only validated the coordinated engine-start control strategies of single-motor P2 HEVs, but also made clear of some key parameter sets to achieve better control results.
However, there are some further studies need to be conducted in future works. First, to realize better riding comfort, the engine-start process can be combined with the control of 8-speed AT such as using the slipping of clutches to absorb the torque vibration. Secondly, the state of charge (SOC) should be taken into account for that the motor torque response is related to the SOC, which affects the motor dynamic behavior. Finally, vehicle hardware tests should be performed to validate the effectiveness of control strategies.
Acknowledgments
This work is financially supported by the National Natural Science Foundation of China (Grant Number: 51405010), National Aerospace Science Foundation of China (Grant Number: 2015ZA51003) and Beijing Key Laboratory for High-efficient Power Transmission and System Control of New Energy Resource Vehicle.
Author Contributions
Xiangyang Xu led the research scheme; Xiaoxiao Wu investigated related researches; Xiaoxiao Wu and Mick Jordan analyzed and built the model; Xiaoxiao Wu, Mick Jordan and Peng Dong designed and conducted the coordinated engine-start control strategies; Xiaoxiao Wu and Yang Liu analyzed the simulation results; Xiaoxiao Wu wrote and revised the paper.
Conflicts of Interest
The authors declare no conflict of interest. The founding sponsors had no role in the design of the study; in the collection, analyses, or interpretation of data; in the writing of the manuscript, and in the decision to publish the results.
References
- Atabani, A.E.; Badruddin, I.A.; Mekhilef, S.; Silitonga, A.S. A review on global fuel economy standards, labels and technologies in the transportation sector. Renew. Sustain. Energy Rev. 2011, 15, 4586–4610. [Google Scholar] [CrossRef]
- Van Mierlo, J.; Maggetto, G.; Lataire, P. Which energy source for road transport in the future? A comparison of battery, hybrid and fuel cell vehicles. Energy Convers. Manag. 2006, 47, 2748–2760. [Google Scholar] [CrossRef]
- Liu, Y.; Wang, J.; Gong, L. Emissions of Chinese New Energy Vehicle and the Development Recommendations. Procedia Eng. 2016, 137, 109–113. [Google Scholar] [CrossRef]
- Høyer, K.G. The history of alternative fuels in transportation: The case of electric and hybrid cars. Util. Policy 2008, 16, 63–71. [Google Scholar] [CrossRef]
- Offer, G.J.; Howey, D.; Contestabile, M.; Clague, R.; Brandon, N.P. Comparative analysis of battery electric, hydrogen fuel cell and hybrid vehicles in a future sustainable road transport system. Energy Policy 2010, 38, 24–29. [Google Scholar] [CrossRef] [Green Version]
- Sabri, M.F.M.; Danapalasingam, K.A.; Rahmat, M.F. A review on hybrid electric vehicles architecture and energy management strategies. Renew. Sustain. Energy Rev. 2016, 53, 1433–1442. [Google Scholar] [CrossRef]
- Kebriaei, M.; Niasar, A.H.; Asaei, B. Hybrid electric vehicles: An overview. In Proceedings of the 2015 International Conference on Connected Vehicles and Expo (ICCVE), Shenzhen, China, 19–23 October 2015; pp. 299–305. [Google Scholar]
- Ehsani, M.; Gao, Y.; Miller, J.M. Hybrid Electric Vehicles: Architecture and Motor Drives. Proc. IEEE 2007, 95, 719–728. [Google Scholar] [CrossRef]
- Yang, Y.; Hu, X.; Pei, H.; Peng, Z. Comparison of power-split and parallel hybrid powertrain architectures with a single electric machine: Dynamic programming approach. Appl. Energy 2016, 168, 683–690. [Google Scholar] [CrossRef]
- Canova, M.; Guezennec, Y.; Yurkovich, S. On the Control of Engine Start/Stop Dynamics in a Hybrid Electric Vehicle. J. Dyn. Syst. Meas. Control 2009, 131, 061005. [Google Scholar] [CrossRef]
- Wang, C.L.; Yin, C.L.; Gang, L.; Lei, W. Start and Acceleration Strategies of an ISG Parallel Hybrid Electric Vehicle. Trans. Csice 2012, 30, 79–85. [Google Scholar]
- Sim, K.; Oh, S.M.; Kang, K.Y.; Hwang, S.H. A Control Strategy for Mode Transition with Gear Shifting in a Plug-In Hybrid Electric Vehicle. Energies 2017, 10, 15. [Google Scholar]
- Chen, J.-S.; Hwang, H.-Y. Engine automatic start–stop dynamic analysis and vibration reduction for a two-mode hybrid vehicle. Proc. Inst. Mech. Eng. Part D J. Autom. Eng. 2013, 227, 1303–1312. [Google Scholar] [CrossRef]
- Berkel, K.V.; Veldpaus, F.; Hofman, T.; Vroemen, B.; Steinbuch, M. Fast and Smooth Clutch Engagement Control for a Mechanical Hybrid Powertrain. IEEE Trans. Control Syst. Technol. 2014, 22, 1241–1254. [Google Scholar] [CrossRef]
- Lu, Z.; Cheng, X.; Feng, W. Coordinated control study in engine starting process of hybrid vehicle. In Proceedings of the 2010 IEEE International Conference on Information and Automation, Harbin, China, 20–23 June 2010; pp. 2111–2116. [Google Scholar]
- Kum, D.; Peng, H.; Bucknor, N.K. Control of Engine-Starts for Optimal Drivability of Parallel Hybrid Electric Vehicles. J.Dyn. Syst. Meas. Control 2013, 135, 021020. [Google Scholar] [CrossRef]
- Song, M.; Oh, J.; Choi, S.; Kim, Y.; Kim, H. Motor Control of a Parallel Hybrid Electric Vehicle during Mode Change without an Integrated Starter Generator. J. Electr. Eng. Technol. 2013, 8, 930–937. [Google Scholar] [CrossRef]
- He, Y.; Bucknor, N.K.; Smith, A.L.; Yang, H. Modeling and Drivability Assessment of a Single-Motor Strong Hybrid at Engine Start. In Proceedings of the SAE 2010 International Powertrains, Fuels & Lubricants Meeting, San Diego, CA, USA, 25–27 October 2010. [Google Scholar]
- Smith, A.; Bucknor, N.; Yang, H.; He, Y. Controls Development for Clutch-Assisted Engine Starts in a Parallel Hybrid Electric Vehicle. In Proceedings of the SAE 2011 World Congress & Exhibition, Detroit, MI, USA, 12–14 April 2011. [Google Scholar]
- Walter, A.; Brummund, S.; Merz, B.; Kiencke, U.; Jones, S.; Winkler, T. Estimation of the Instantaneous Engine Torque for Vehicles with Dual Mass Flywheel (DMF). IFAC Proc. Vol. 2007, 40, 167–174. [Google Scholar] [CrossRef]
- Bai, S.; Maguire, J.M.; Peng, H. Dynamic Analysis and Control System Design of Automatic Transmissions. In Proceedings of the SAE 2013 World Congress & Exhibition, Detroit, MI, USA, 16–18 April 2013; pp. 45–46. [Google Scholar]
- Chen, Z.; Liu, Y.; Fu, Y.; Xu, X. Motor-torque-limited power-on upshift control in electric vehicles with automatic transmissions. Proc. Inst. Mech. Eng. Part D J. Autom. Eng. 2015, 230, 18–36. [Google Scholar] [CrossRef]
- Shi, G.; Dong, P.; Sun, H.Q.; Liu, Y.; Cheng, Y.J.; Xu, X.Y. Adaptive control of the shifting process in automatic transmissions. Int. J. Automot. Technol. 2017, 18, 179–194. [Google Scholar] [CrossRef]
- Kim, S.; Park, J.; Hong, J.; Lee, M.; Sim, H. Transient Control Strategy of Hybrid Electric Vehicle during Mode Change. In Proceedings of the SAE 2009 World Congress& Exhibition, Detroit, MI, USA, 20–23 April 2009. [Google Scholar]
- Trieu Minh, V. Clutch control and vibration reduction for a hybrid electric vehicle. Proc. Inst. Mech. Eng. Part I J. Autom. Eng. 2012, 226, 867–874. [Google Scholar] [CrossRef]
- Minh, V.T.; Pumwa, J. Fuzzy logic and slip controller of clutch and vibration for hybrid vehicle. Int. J. Control Autom. Syst. 2013, 11, 526–532. [Google Scholar] [CrossRef]
- Guo, W.; Liu, Y.; Zhang, J.; Xu, X. Dynamic Analysis and Control of the Clutch Filling Process in Clutch-to-Clutch Transmissions. Math. Probl. Eng. 2014, 2014, 1–14. [Google Scholar] [CrossRef]
Figure 1.
Schematic of P2 HEVs system.

Figure 2.
Simplified block diagram of the single-motor P2 HEVs model.

Figure 3.
Schematic of single-cylinder mechanics.

Figure 4.
Indicator diagram in different throttle position at 1000 rpm.

Figure 5.
The equivalent mass of crank-connecting rod.

Figure 6.
Simplified sketch of the DMF with compressed springs.

Figure 7.
Flow chart of EDC control process in simulation.

Figure 8.
Modeling of direct acting proportional pressure control valve using MATLAB 2015b/Simulink Simcape.
Figure 8.
Modeling of direct acting proportional pressure control valve using MATLAB 2015b/Simulink Simcape.

Figure 9.
Comparison between PI model and tanh model.

Figure 10.
Schematic diagram of P2 HEVs transmission based on 8-speed AT: (a) Original 8-speed AT; (b) P2 HEVs 8-speed AT; (c) Shift logic of 8-speed AT.
Figure 10.
Schematic diagram of P2 HEVs transmission based on 8-speed AT: (a) Original 8-speed AT; (b) P2 HEVs 8-speed AT; (c) Shift logic of 8-speed AT.

Figure 11.
Coordinated control architecture of engine-start.

Figure 12.
Engine-start control strategy without torque request (soft start): (a) control process of soft start; (b) flow chart of soft start.
Figure 12.
Engine-start control strategy without torque request (soft start): (a) control process of soft start; (b) flow chart of soft start.

Figure 13.
The regulation of function

Figure 14.
Comparative simulation results of two transitions in the common coasting driving condition: soft start: (a,c,e,g); dynamical start: (b,d,f,h).
Figure 14.
Comparative simulation results of two transitions in the common coasting driving condition: soft start: (a,c,e,g); dynamical start: (b,d,f,h).

Figure 15.
Comparative simulation results of two transitions in the low-speed driving condition: soft start: (a,c); dynamical start: (b,d).
Figure 15.
Comparative simulation results of two transitions in the low-speed driving condition: soft start: (a,c); dynamical start: (b,d).

Figure 16.
Comparative simulation results of two transitions in the high-speed driving condition: soft start: (a,c); dynamical start: (b,d).
Figure 16.
Comparative simulation results of two transitions in the high-speed driving condition: soft start: (a,c); dynamical start: (b,d).

Figure 17.
The effect of maximum cranking torque on engine speed (a) and transmission input torque (b).
Figure 17.
The effect of maximum cranking torque on engine speed (a) and transmission input torque (b).

Figure 18.
The effect of EDC fill phase on engine speed (a) and transmission input torque (b).


Table 1.
Main parameters of the P2 hybrid system model.
| Component | Note/Parameter | Value | Unit |
|---|---|---|---|
| Internal combustion engine (ICE) | Gasoline | 4 | cylinder |
| Displacement | 2 | L | |
| Maximum power | 140 | kW | |
| Maximum torque | 250 | Nm | |
| Maximum speed | 5500 | rpm | |
| Dual mass flywheel (DMF) | 0.15 | ||
| 0.1 | |||
| 40 | |||
| 0.01 | |||
| Engine disconnect clutch (EDC) | Wet | - | - |
| Maximum torque capacity | 300 | Nm | |
| 0.0712 | m | ||
| 4 | - | ||
| 0.00519 | |||
| 0.1 | - | ||
| Alternating current (AC) motor | Maximum torque | 270 | Nm |
| Maximum speed | 8000 | rpm | |
| 0.015 | |||
| 8-speed automatic transmission (AT) | Number of gears | 8 | gears |
| Vehicle | 1950 | kg | |
| 0.015 | - | ||
| 2.437 | |||
| 0.33 | - | ||
| 0.37 | m |
Table 2.
Comparative parameters set of simulations.
| Parameters | Engine-Start without Engine Torque Request (Soft Start) | Engine-Start with Engine Torque Request (Dynamical Start) |
|---|---|---|
| Vehicle speed (km/h) | 60 | 60 |
| The gear of 8 AT | 6th | 6th |
| 3.04 | 3.04 | |
| (Nm) | 100 | 350 |
| (Nm) | 100 | 100 |
| (Nm) | 110 | 160 |
| (s) | 0.15 | 0.12 |
| (MPa) | 0.282 | 0.302 |
| (MPa) | 1.8 | 1.8 |
| (rpm) | 800 | 100 |
| (Nm) | 150 | - |
| (Nm) | 10 | - |
| (MPa/s2) | 2 | 3 |
Table 3.
Summary of simulation results and evaluation classification.
| Driving Condition | Soft Start | Dynamical Start | ||
|---|---|---|---|---|
| Start Time (s) | Maximum aV Fluctuation (m/s2) | Start Time (s) | Maximum aV Fluctuation (m/s2) | |
| Common coasting | 1.05 | 0.09 | 0.67 | 0.22 |
| Low speed | 1.31 | 0.11 | 0.91 | 0.41 |
| High speed | 1.70 | 0.09 | 1.05 | 0.29 |
| Classification of Evaluation (Subjective Experience) | ||||
| Rating | Start Time (s) | Maximum aV Fluctuation (m/s2) | ||
| 1 | <0.5 | Very fast | <0.315 | Not uncomfortable |
| 2 | 0.5~1.2 | Fast | 0.315~0.5 | A little uncomfortable |
| 3 | >1.2 | Slow | >0.5 | Uncomfortable |
© 2018 by the authors. Licensee MDPI, Basel, Switzerland. This article is an open access article distributed under the terms and conditions of the Creative Commons Attribution (CC BY) license (http://creativecommons.org/licenses/by/4.0/).
Share and Cite
MDPI and ACS Style
Xu, X.; Wu, X.; Jordan, M.; Dong, P.; Liu, Y. Coordinated Engine-Start Control of Single-Motor P2 Hybrid Electric Vehicles with Respect to Different Driving Situations. Energies 2018, 11, 207. https://doi.org/10.3390/en11010207
AMA Style
Xu X, Wu X, Jordan M, Dong P, Liu Y. Coordinated Engine-Start Control of Single-Motor P2 Hybrid Electric Vehicles with Respect to Different Driving Situations. Energies. 2018; 11(1):207. https://doi.org/10.3390/en11010207
Chicago/Turabian StyleXu, Xiangyang, Xiaoxiao Wu, Mick Jordan, Peng Dong, and Yang Liu. 2018. "Coordinated Engine-Start Control of Single-Motor P2 Hybrid Electric Vehicles with Respect to Different Driving Situations" Energies 11, no. 1: 207. https://doi.org/10.3390/en11010207
Note that from the first issue of 2016, this journal uses article numbers instead of page numbers. See further details here.