Robust Power Supply Restoration for Self-Healing Active Distribution Networks Considering the Availability of Distributed Generation


1
College of Electrical Engineering, Zhejiang University, Hangzhou 310027, China
2
State Key Laboratory of Alternate Electrical Power System with Renewable Energy Sources (North China Electric Power University), Baoding 071003, China
*
Author to whom correspondence should be addressed.
Energies 2018, 11(1), 210; https://doi.org/10.3390/en11010210
Submission received: 5 December 2017
/
Revised: 20 December 2017
/
Accepted: 15 January 2018
/
Published: 15 January 2018
(This article belongs to the Section F: Electrical Engineering)
Abstract
:The increasing penetration of distributed generations (DGs) with intermittent and stochastic characteristics into current power distribution networks can lead to increased fault levels and degradation in network protection. As one of the key requirements of active network management (ANM), efficient power supply restoration solution to guarantee network self-healing capability with full consideration of DG uncertainties is demanded. This paper presents a joint power supply restoration through combining the DG local restoration and switcher operation-based restoration to enhance the self-healing capability in active distribution networks considering the availability of distributed generation. The restoration algorithmic solution is designed to be able to carry out power restoration in parallel upon multiple simultaneous faults to maximize the load restoration while additionally minimizing power loss, topology variation and power flow changes due to switcher operations. The performance of the proposed solution is validated based on a 53-bus distribution network with wind power generators through extensive simulation experiments for a range of fault cases and DG scenarios generated based on Heuristic Moment Matching (HMM) method to fully consider the DG randomness. The numerical result in comparison with the existing solutions demonstrates the effectiveness of the proposed power supply restoration solution.
1. Introduction
Currently, the increasing penetration of small-scale renewable distributed generators (DGs), e.g., micro wind turbines, photovoltaic panels, has reshaped the medium/low voltage (MV/LV) electric distribution network from a passive system to an active network which allows coexistence of bidirectional power flows. These renewable sources exhibit intermittent and stochastic characteristics, and hence the massive DG integration across a large geographical span can bring direct operation and control challenges, e.g., voltage raise effect, increased fault level, protection degradation, and altered transient stability in [1]. In addition, many distribution network operators (DNOs) are currently being faced with the limitation of dealing with enormous amount of operational data and control functionalities in centralized control systems. In [2], such complexity can degrade the timely network management under anomalous or emergent conditions as approximately 75–90% faults in distribution system are temporary events. To this end, efficient supply restoration solution upon faults in guaranteeing network self-healing capability is demanded for active network management (ANM).
The power supply restoration aims to restore as much supply to demand (critical loads with higher priority) as possible and as fast as possible upon the power supply interruptions in [3]. In Ref. [4,5,6], the majority of research effort focused on addressing the power supply restoration upon faults in passive power distribution networks without DG availability. In recent years, DG plays a growing role in the issue of continuity of electricity supply in [7,8]. Meanwhile, a set of studies for power restoration considering the presence of DGs was exploited. In [9], the power supply restoration using a multi-agent was studied based on optimal network topology reconfiguration considering the DGs as back-up power supplies. However, the operation of DGs simply depends on capability of backup feeders to supply de-energized loads. The study in [10] reveals that the capability of DGs for supply restoration service was investigated and an adapted branch-and-bound algorithm was proposed to maximize the restored loads based on DGs availability. However, service areas of DGs are also decided before the restoration model according to DGs capacity, which may not be the optimal restoration scheme. A multi-agent system approach for decentralized power supply restoration was presented where the loads are resupplied by uninterruptable DGs independently in [11]. In [12], a novel load restoration optimization model is proposed to coordinate topology reconfiguration and microgrid formation while satisfying a variety of operational constraints. The aforementioned restoration solutions considering DG availability has not made full use of DGs in restoration process and explicit address the challenge of DG uncertainties on restoration performance.
The power restoration methods based on topology reconfiguration were extensively investigated in [13,14,15]. In [13], a comprehensive mathematical model to address the restoration problem in balanced radial distribution systems was presented, which formulated various optimization objectives into one objective function, including minimization of switcher operations, maximization of demand satisfaction, and prioritization in critical loads and automatic switcher operations. In [14], a graph-theoretic power restoration solution that maximizes the restored load and minimizes the switching operations was presented. However, these solutions are designed and validated for single fault scenarios, and the parallel restoration mechanism to restore power loads upon multiple faults has not been studied. In literature [15], an informed A* search-based algorithm was proposed through topology reconfiguration of radial distribution networks upon faults in partial network, including both single and multiple fault cases. The power restoration solutions based on topology reconfiguration were also studied in the context of microgrids (e.g., in [16,17]). The solution presented addressed the power restoration in microgrids with renewable DGs following to an unscheduled disconnection from the main grid in [16]. It aims to determine the maximum of the expected restorative loads by choosing the best arrangement of the power network configurations immediately from the beginning of the breakdown all the way to the end of the island mode. In [17], the solution proposed addressed the black-start restoration process in microgrids after a blackout. However, it should be noted that frequent topology reconfiguration can lead to frequent changes in power flow, which may degrade the system stability. Furthermore, malfunction in switcher operations increase the risk of cascading failure during topology reconfiguration.
In addition, most of the existing power supply restoration solutions were designed to maximize the load restoration as well as minimize the switcher operations subject to a set of operational constraints, e.g., voltage limit, line current limit and maintenance of radial topology. In [18], a modified Viterbi algorithm was presented to identify the optimal restoration solution while minimizing the number of switching operations. In [19], the multi-agent-based solution was implemented at two levels: zone and feeder, considering the priority of critical loads and minimization of switching operations and power loss. In [20], a non-dominated sorting genetic algorithm-II (NSGA-II)-based power supply solution was presented considering the priority of number of manually controlled and remotely controlled switcher operations, and power loss minimization. In [21], a service restoration model of power distribution systems incorporating load curtailment of in-service customers via direct load control considering maximization of load restoration and minimization of the number of switcher operations and total load curtailment. In fact, the existing solutions have not explicitly considered the minimization of adverse impact imposed by the power restoration actions carried out in the failed section on the failure-free sections in the distribution network, e.g., unexpected power flow changes. Our previous work (Ref. [22]) has considered the impacts on power flow changes during the power restoration process and presented a solution combining DG-based and topology reconfiguration-based restoration with preliminarily results.
To the author’s best knowledge, the existing power supply restoration solutions have not been able to fully exploit the potential benefit of DGs in supporting restoration process under DG generation uncertainties and carry out fault restoration in parallel in multiple fault scenarios. To this end, this work presents a parallel joint power supply restoration through combining the DG local restoration and switcher operation-based restoration to enhance the self-healing capability in active distribution networks considering stochastic distributed generation. The key technical contributions made in this paper can be summarized as follows: (1) the restoration algorithmic solution carry out power restoration jointly based on DG local restoration and switcher operation-based restoration (topology reconfiguration) which is able to restore power supply in parallel upon multiple simultaneous faults; and (2) The minimization of adverse impact of power restoration on failure-free section of distribution network is explicitly included in the optimization utility function in power restoration process; Finally, the robustness of the proposed solution is validated through extensive simulation experiments for a range of fault scenarios and DG scenarios. The DG scenarios are generated based on HMM method to fully consider the randomness of the DG uncertainties.
The reminder of the paper is organized as follows. Section 2 formulates the power supply restoration problem and presents the proposed algorithmic solution; Section 3 discusses the heuristic moment matching-based scenario generation technique; the performance is assessed through simulations for a range of fault scenarios in Section 4; finally, the conclusive remarks are given in Section 5.
2. Power Supply Restoration Problem Formulation and Proposed Solution
2.1. Parallel Power Supply Restoration
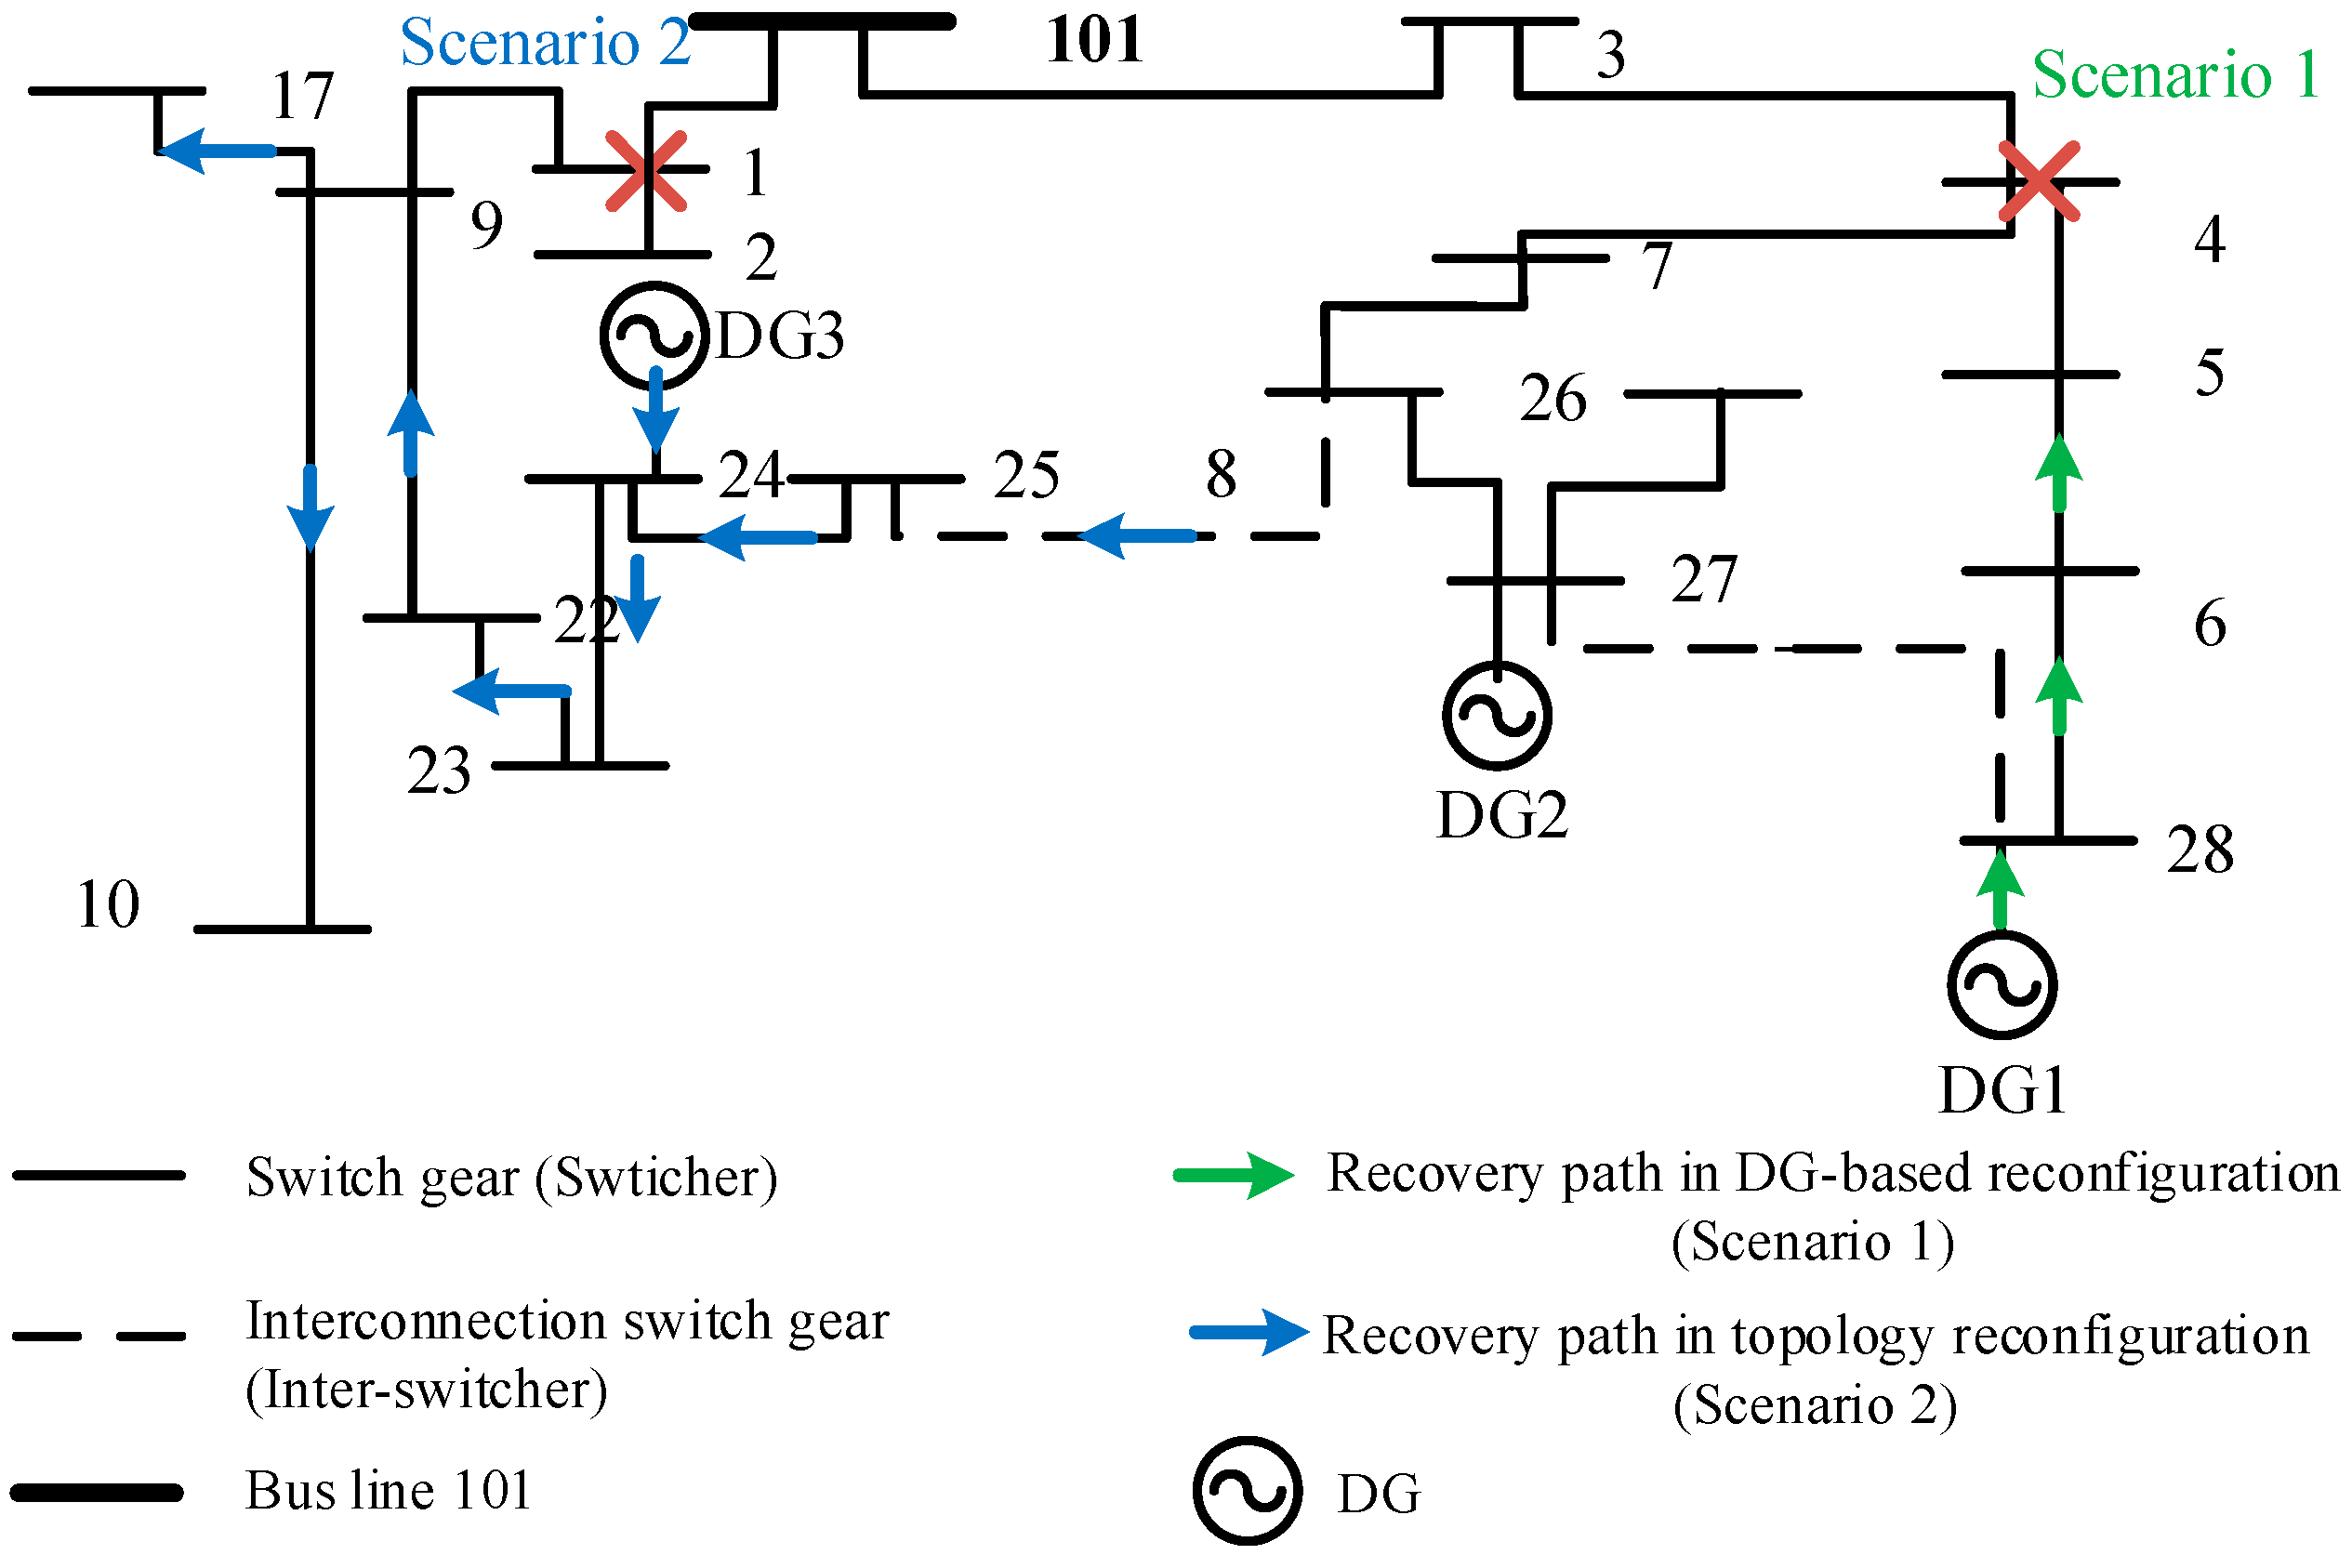
In this work, the key idea behind the proposed parallel power supply restoration can be summarized as follows: considering the penetration of DGs, the proposed power supply restoration solution integrates the DG-based local restoration and topology reconfiguration (through a set of inter-switcher operations)-based restoration into the restoration process to jointly restore the loads in multiple failed sections, if any, in a parallel fashion. In individual failed sections of power distribution network, the optimal load supply restoration solution can be identified based on either one or both two scenarios upon faults, as illustrated in Figure 1 and discussed as follows:
Scenario 1 (DG-based local restoration): due to the fact that the majority of distribution system faults are temporary, the DGs can participate in the network management for load restoration to supply the loads locally in an island fashion. Such an approach considers the DGs not only as an additional source under normal conditions, but also as an active and flexible support in case of anomalous or major failure conditions (i.e., blackout). As shown in Figure 1, upon the fault occurs at bus No. 4, DG1 is identified to supply power to bus No. 5 and 6 simultaneously if the generation is sufficient. This effectively avoids the changes on network topology due to inter-switcher operations, and hence minimal power flow changes on failure-free sections.
Scenario 2 (Topology reconfiguration-based restoration): topology reconfiguration entails changing the states of network switchers to redistribute loads among distribution feeders for power supply restoration or other purposes, e.g., power loss minimization or alleviation of overloads or voltages violation. A switching operation consists of closing the switcher in an opened branch and opening the switcher in a closed one, keeping the network configuration radial. Figure 1 shows that most of the downstream buses of fault bus (No. 1) are resupplied through closing operation on inter-switcher between bus No. 8 and 25, and hence can be resupplied by substation 101, which is connected to the main power grid. This effectively can provide power supply to loads once the DG capacity is insufficient.
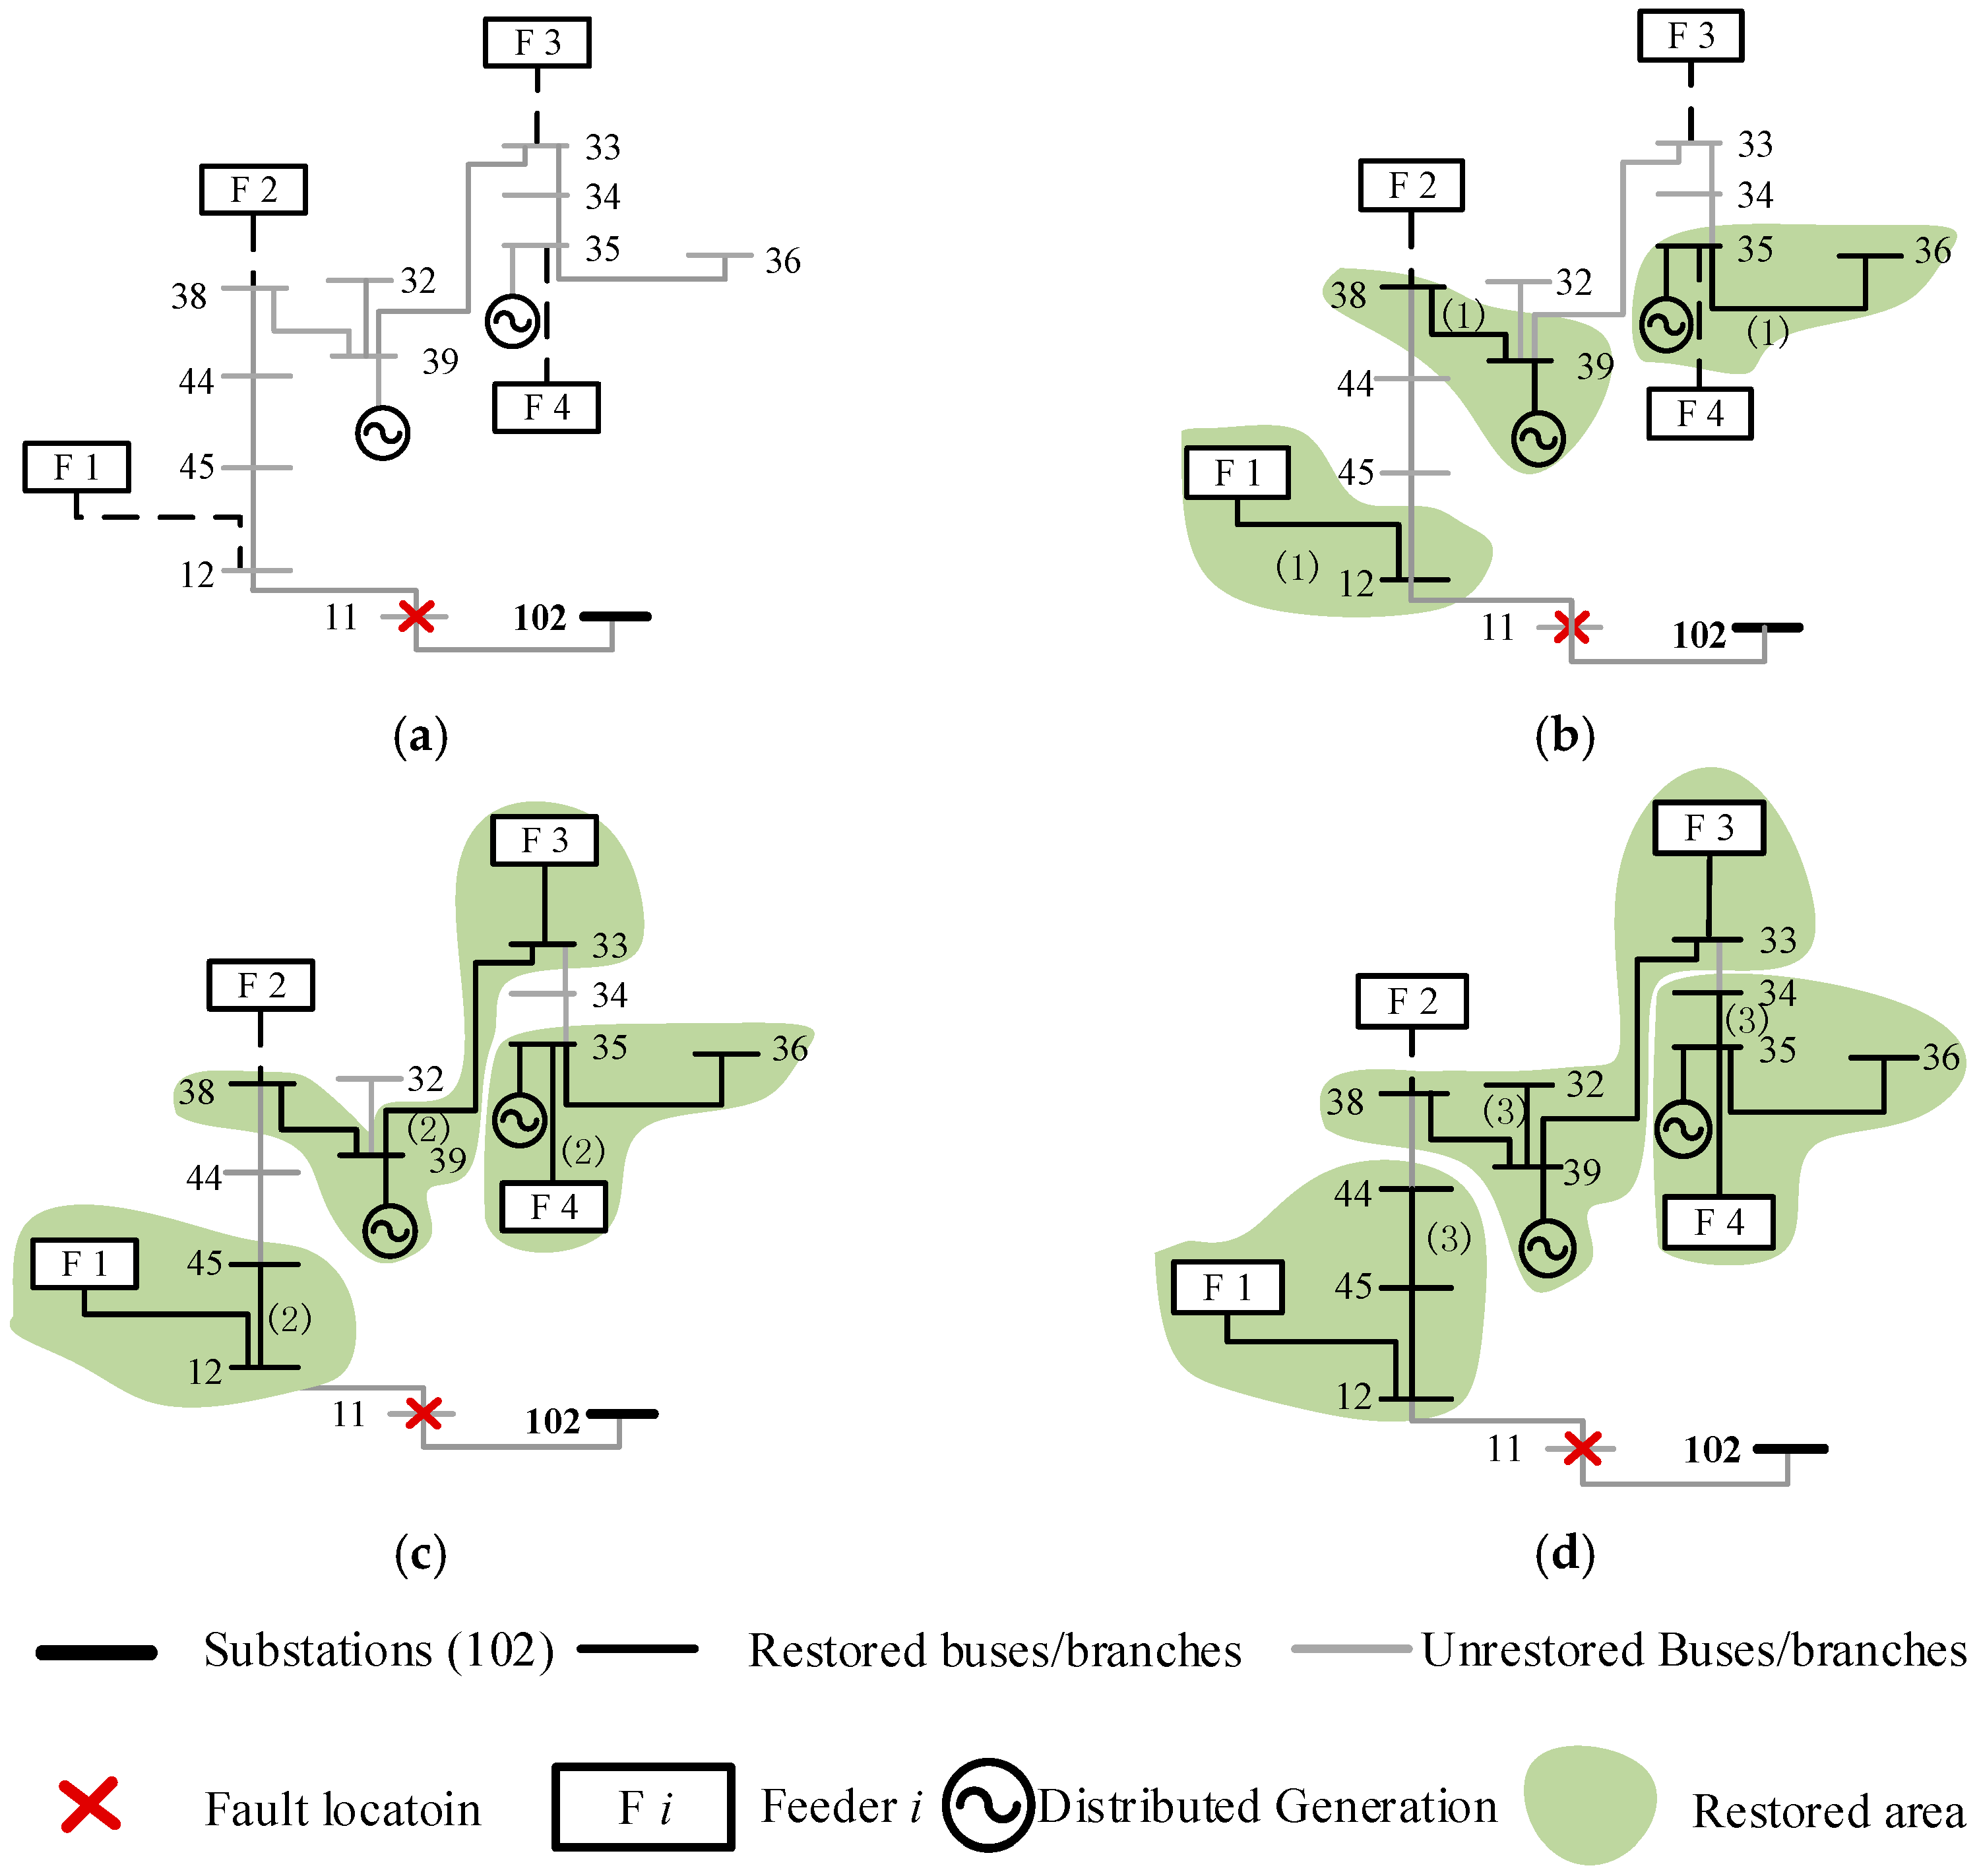
Figure 2 illustrates the parallel restoration process of the proposed solution assuming fault occurs at bus No. 11 in a portion of distribution network. Once bus No. 11 is failed, the switchers at downstream buses are open to prevent the loads from being supplied by DGs in islanding fashion without control, as shown in Figure 2a. In this case, the load restoration is implemented as follows: the available DGs are firstly identified to restore the loads locally in conjunction with a set of switcher operations (38–39, 35–36) and load in bus No. 12 is resupplied by Feeder 1 through F1–12 as presented in Figure 2b; in the case of insufficient DG generation, additional switcher operations are carried out to supply more loads, including 2 inter-switchers (F3–33, F4–35) and 7 switchers (12–45, 45–44, 39–32, 39–33, 34–35, 35–36, 38–39), in parallel for power restoration, as show in Figure 2c,d.
2.2. Supply Restoration Problem Formulation and Implementation
In this work, the power supply restoration in distributed network with DGs system can be formulated as a multi-objective integer programming problem considering a number of performance objectives that also meet a set of operational constraints.
For the sake of fast restoration, the restoration model presented in Equations (1–12) is implemented in a sequential process, i.e., for a failed section, only one switcher operation is allowed at each iteration to restore loads in each iteration, until the completion of restoration process. Such restoration process can be carried out in parallel in multiple failed sections in the distribution network. The power restoration at nth iteration can be expressed as follows:
Subject to:
Here, with operation type of candidate switchers as independent variables, utility function in (1) simultaneously considers three operational objectives: the time cost of switcher operations, the capability of load restoration and the adverse impact (undesired power flow changes) on failure-free section in distribution network due to switcher operations. A nonlinear piecewise penalty function is adopted to these performance metrics, as given in (13) and (14). For each performance metric, given its base value rk, slowly increases along the increase of metric value x (e.g., ), and the slope of increases dramatically for heavy penalty (e.g., ). Here, since the most important goal of power restoration is maximizing load restoration, the capability of load restoration is considered most important among the operational objectives, followed by time cost of switcher operations and penalty of adverse impacts sequentially. The priorities of operational objectives can be differentiated with appropriate rk.
The time cost of switcher operation, impact on failure-free section, and the capability of load restoration are discussed in details as follows: with opened switchers downstream of fault location in [23], the restoration process in active distribution networks can be regarded as a sequential switcher-closing process, where three types of switcher operations with different costs are considered as defined in (2): bus switcher operation cost, α1 = 1; inter-switcher operation within the scope of same substation, α2 = 2; and inter-switcher operation across multiple substations, α3 = 4; the load restoration ability of system are expressed in (3), and the restoration capability of ith candidate switcher is expressed as , where . Here, is the identified shortest supply path from ith candidate switcher to jth unsupplied load using Dijkstra algorithm (the branch weight is set to be line impedance) and is the number of open switchers along the path; and the adverse impact on power flow (i.e., branch current and bus voltage) due to topology reconfiguration is considered and quantified based on (4).
In addition, the proposed solution formulates the load restoration problem considering a set of network operational constraints which need to be met throughout the restoration process: in (5) and (6), active power and reactive power balance equations were presented respectively; safety constraints (7) and (8) represent the operation limits of voltages and currents, respectively; the constraints given in (9) and (10) confirm only one switcher can be operated at each iteration. The network topology is guaranteed to be loop-free throughout the supply restoration with constraint (11). Constraint (12) ensures each bus can only be supplied by one substation, that is, any two substations are not connectable. Constraints (11) and (12) jointly guarantee the radiation of distribution system during the restoration process. If constraints (5)–(12) are met after closing the optimal switcher in nth optimization, then optimization process are carried out. Otherwise, the constraints with closing second optimal switcher would be checked until an eligible switcher was found.
Based on the aforementioned problem formulation, the proposed power supply restoration solution can be implemented and the flowchart is presented in Figure 3.
In addition, the failure of electricity equipment caused by the customer failure will have an impact on the accuracy of the power forecast. Therefore, this article also presents statistics for the number of times electrical equipment fails during the evaluation period to measure the scale of electricity predictability.
3. DG Uncertainty Characterization Based on HMM Method
The distribution network with penetration of wind turbines (WTs) was considered in this paper. The stochastic power generation of WTs needs to be fully considered in the validation of the proposed parallel supply restoration approach. The HMM method is adopted in [24,25] to generate sufficient number of scenarios to capture such uncertainties, which consists of two transformation processes: matrix transformation and cubic transformation, discussed as follows.
1. Matrix transformation: it aims to obtain an n-dimensional matrix with a given correlation matrix R = LLT, where is a lower-triangle matrix. An n-dimensional random matrix subjected to normal distribution was generated first, which includes independent column vector . Then can be calculated as (15)
2. Cubic transformation: a univariate normal random column vector with given four moments can be transformed from a column vector subjected to normal distribution through cubic transformation. Four moments (expectation, standard deviation, skewness and kurtosis) are considered and the transformation can be formulated as (16)
where, , , and are the coefficients of transformation, which can be obtained by solving a set of nonlinear equations given in (17)
where is the given kth moment of ith column vector, known as target moment. is kth moment of column vector .
Step 1. Initialization: calculate the moments and correlation matrix R of historical wind power generation statistics as target moments and target correlation matrix, and normalize the target moments based on (18)
where, and are the kth normalized moment and target moments of ith column vector, respectively.
Step 2. Randomly generate scenarios: given the number of wind turbine and the expected number of scenarios Nh, randomly generate matrix , subjected to .
Step 3. Matrix transformation: matrix is transformed into to satisfy the correlation of historical statistics through the matrix transformation based on (1).
Step 4. Cubic transformation: calculate the coefficients , , and in (16) by solving (17), and then matrix is transformed into to satisfy the moments of historical statistics through the cubic transformation based on (2).
Step 5. Justification: calculate the moment error () and correlation error () based on (19) and (20), respectively. The calculated errors are used to justify the eligibility of generated scenarios through comparison with the predefined thresholds (, ).
where, is kth moment of ith column vector generated by HMM method. is the correlation matrix of matrix generated by HMM method. is the target correlation matrix.
Step 6. Inversion: invert the normalized scenarios to satisfy the target moments using (21).
4. Simulation Experiment and Numerical Result
4.1. Simulation Settings
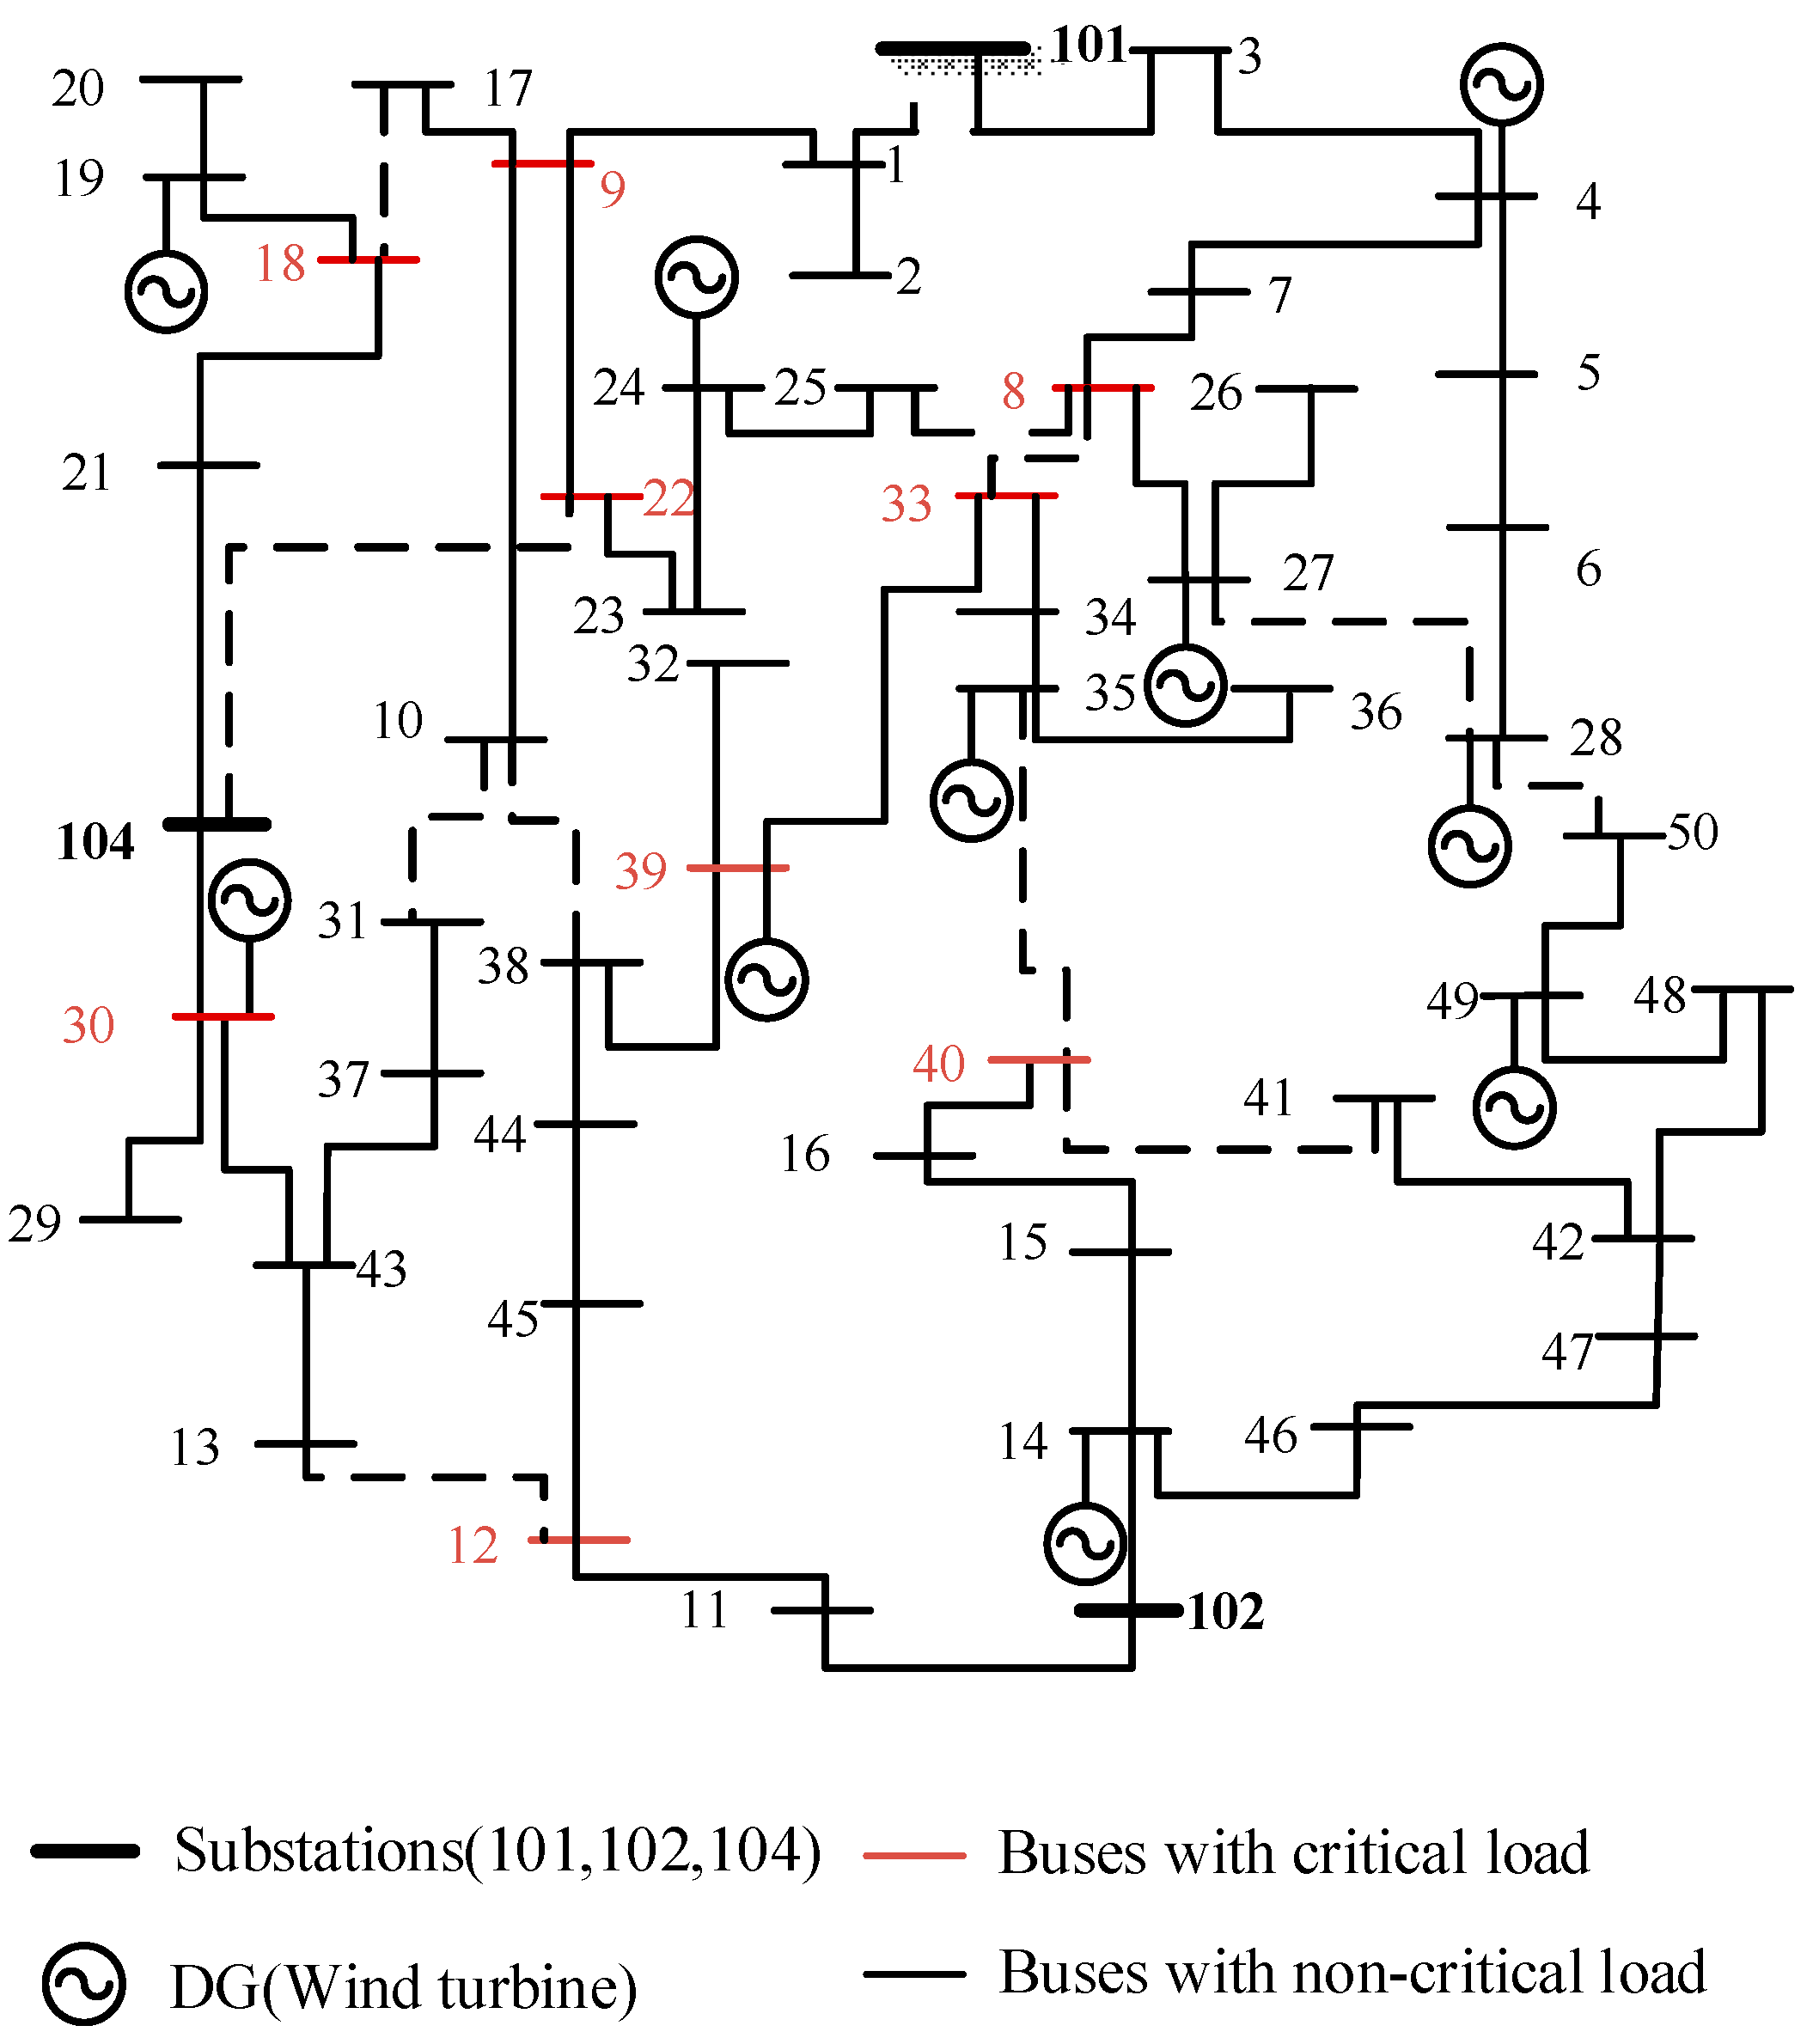
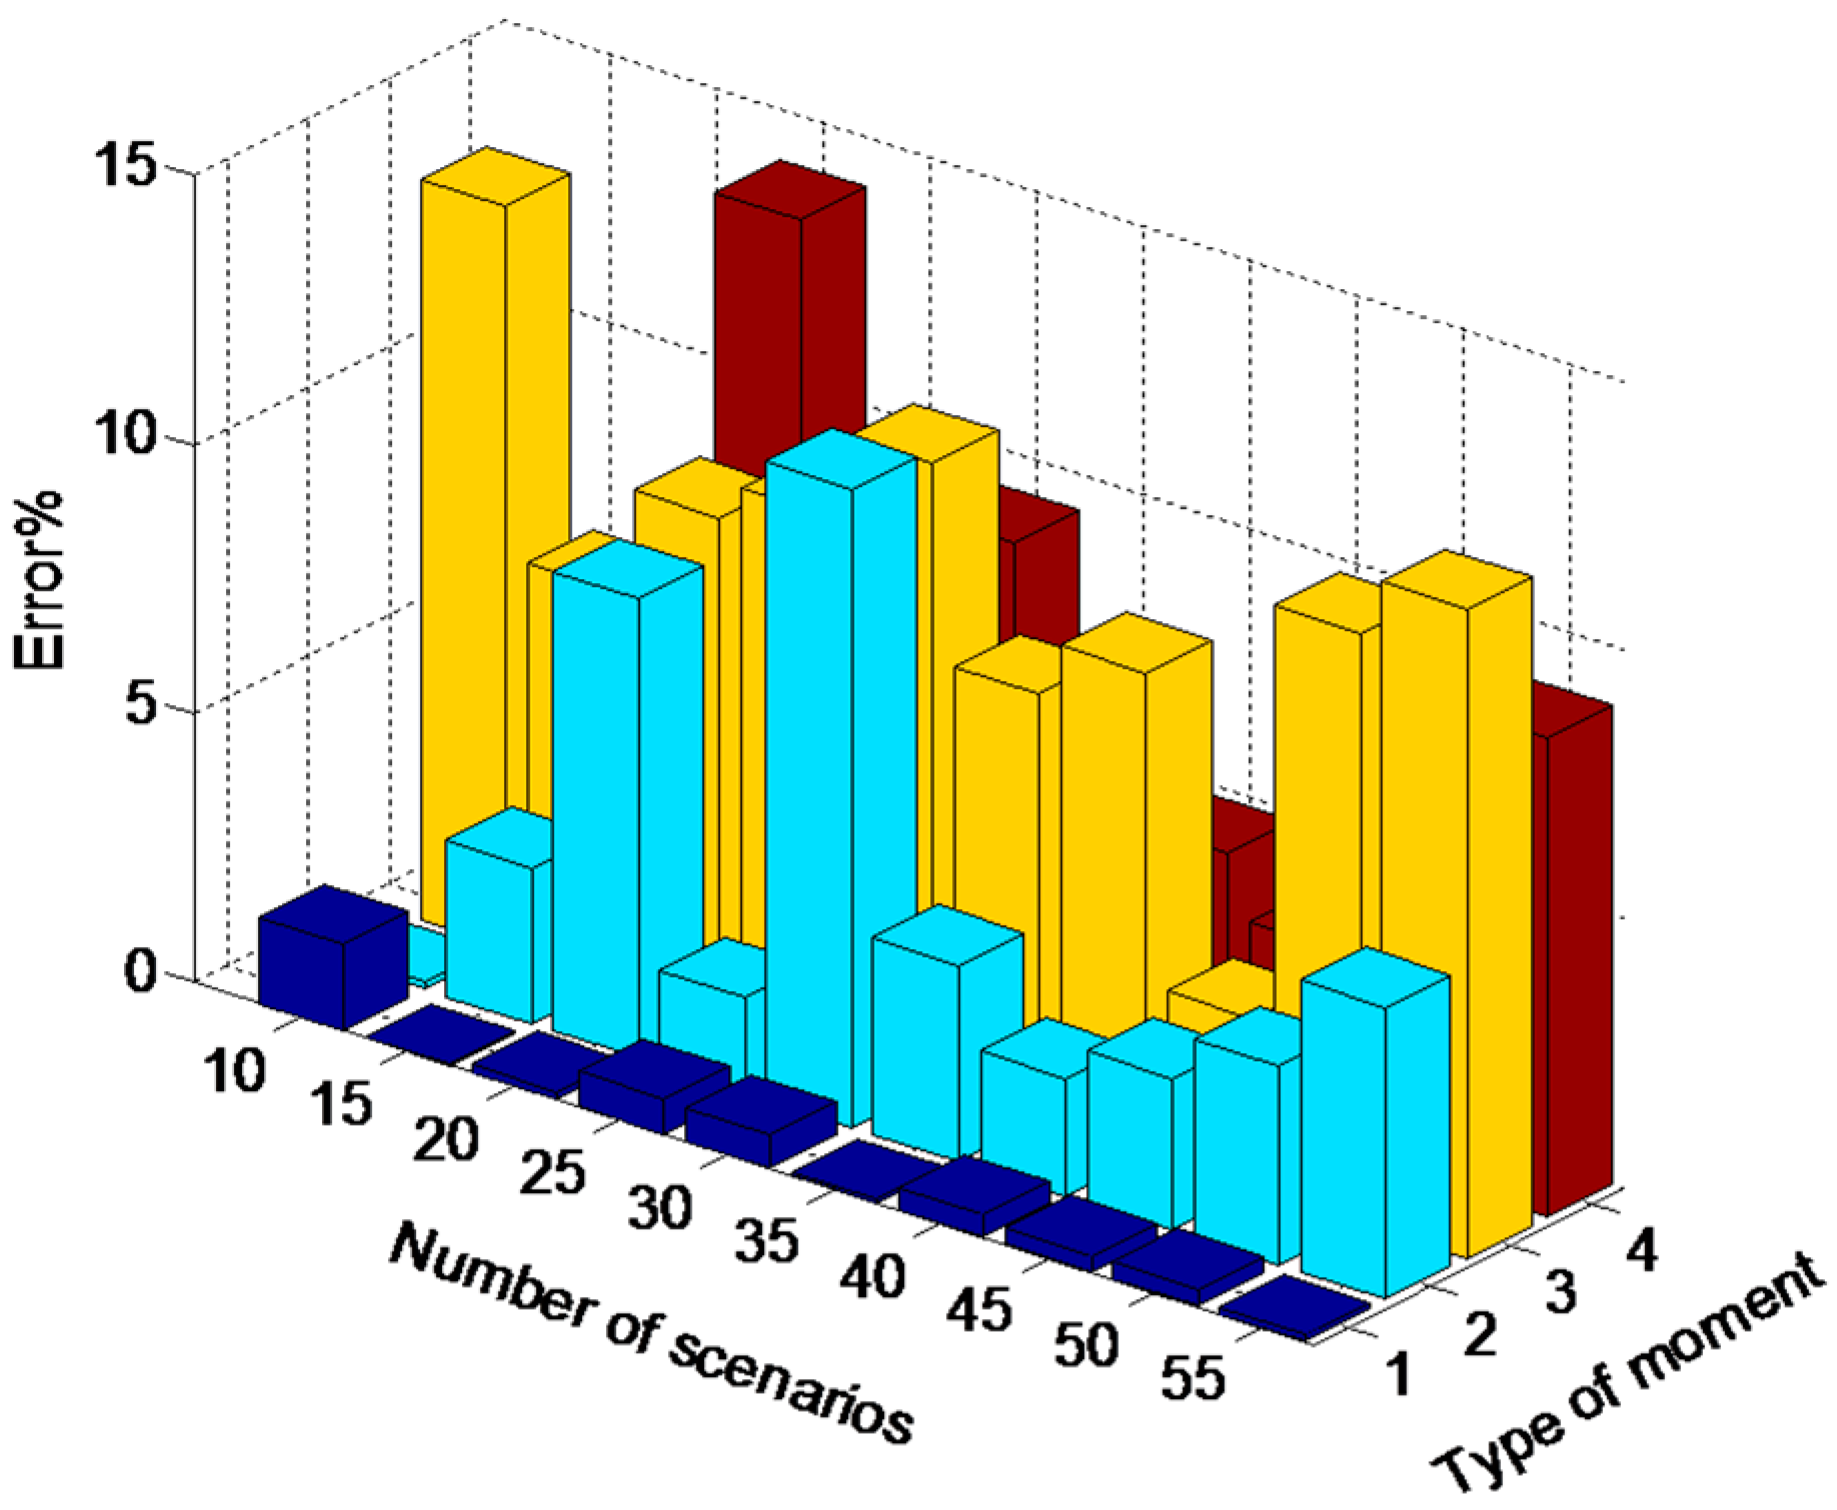
The performance assessment is carried out based on a 53-bus distribution network with the topology and parameters (branch and node) adopted from literature [13], as illustrated in Figure 4. The detailed node and branch data are given in Table A1 and Table A2 in Appendix A, respectively. The simulated network consists of three substations (101, 102, 104) with the substation voltage of 1.00 p.u., and the nominal node voltage is 13.8 kV. The active demand and reactive power demand are 45.67 MW and 22.12 MVAr, respectively. The buses connected with critical loads are highlighted and in total 10 distributed generators (i.e., WTs) with the power generation ranging from 0 to 5 MW by scaling down the realistic wind generation statistics [26]. Firstly, the error of moment are set to and the error of correlation is not required that only one series of scenarios are generated to represent the WTs outputs in network. Then, 10, 15, 20, 25, 30, 35, 40, 45, 50 and 55 scenarios are generated using the HMM method (in Section 3), respectively. Figure 5 shows the performance of the HMM method by comparing the moments of generated scenarios with the original data (all errors are within 15%).
Based on the generated WT scenarios, the proposed power supply restoration algorithmic solution is implemented in MATLAB (ver. 8.3) and solved using CPLEX (ver. 12.5) on an i7-6500U CPU and a 4.00 GB RAM PC. The performance is evaluated in comparison with existing solutions for three different temporary fault conditions: single bus fault, multi-bus simultaneous faults with different fault levels; and multi-bus simultaneous faults considering WT generation uncertainties.
4.2. Experiment 1: Single-Bus Fault Condition
The proposed supply restoration solution is firstly assessed under the condition of single fault considering the scenarios with DGs (i.e., WTs) and without DGs (w/o DGs), respectively. The generation uncertainties of individual WTs (with the capacity of 2.01 MW) are captured by the HMM method and the generation profile is assumed to be unchanged during temporary fault restoration. For single fault analysis, failures at three selected buses (bus No. 3, 11 and 14) which may bring about most adverse impacts on network operation are studied, respectively. Table 1 presents the identified corrective actions of switchers in proposed power supply restoration process under these three single-fault cases by using the solution from [13] as a comparison benchmark. It shows that the proposed solution outperforms the existing solution with less total number of switcher operations under the condition of w/o DGs as the minimization of power flow changes on failure-free sections is included in the proposed solution. In addition, Table 1 shows that the restoration solution considering WTs can further reduce the number of switcher operations for supply restoration, as the unsupplied loads can be fully or partially restored immediately by local WTs.
Table 2 further analyses the load restoration percentage and the computation time of restoration decision-making against the solution from literature [13]. It shows that our solution outperforms for supply restoration of bus No. 3 and 14 for both cases (i.e., with and w/o DGs). For the fault at bus No. 11, all loads in fault section can be restored with the proposed solution or existing solution. In addition, the computation time of identifying an optimal restoration solution are significantly reduced (e.g., 11.4 s and11.2 s in the case of failure at bus No. 3 w/o and with WTs respectively) compared with the solution from literature [13] (i.e., 38.6 s) with simplified iterative optimization in proposed supply restoration solution. The numerical results obtained from the single fault scenarios clearly confirm the benefit of the proposed solution.
4.3. Experiment 2: Multi-Bus Fault Condition
Now the performances of proposed supply restoration solution are further examed considering simultaneous faults at multiple buses for different fault levels, 20% (low), 40% (medium) and 60% (high) in terms of number of affected buses (in total 50 buses), respectively. The benefit of the proposed solution is quantified through comparing two restoration strategies in the presence of WTs: topology reconfiguration only (case I) and the proposed solution (case II). Here, with the same WT generation profiles adopted in Section 4.1, the performance results in terms of power loss and network power flow variations (the maximum voltage drop and current raise) as well as the unsuccessful load restoration at different fault levels are given in Table 3. Here, the maximum voltage drop and the maximum current rise are calculated based on (22) and (23), respectively.
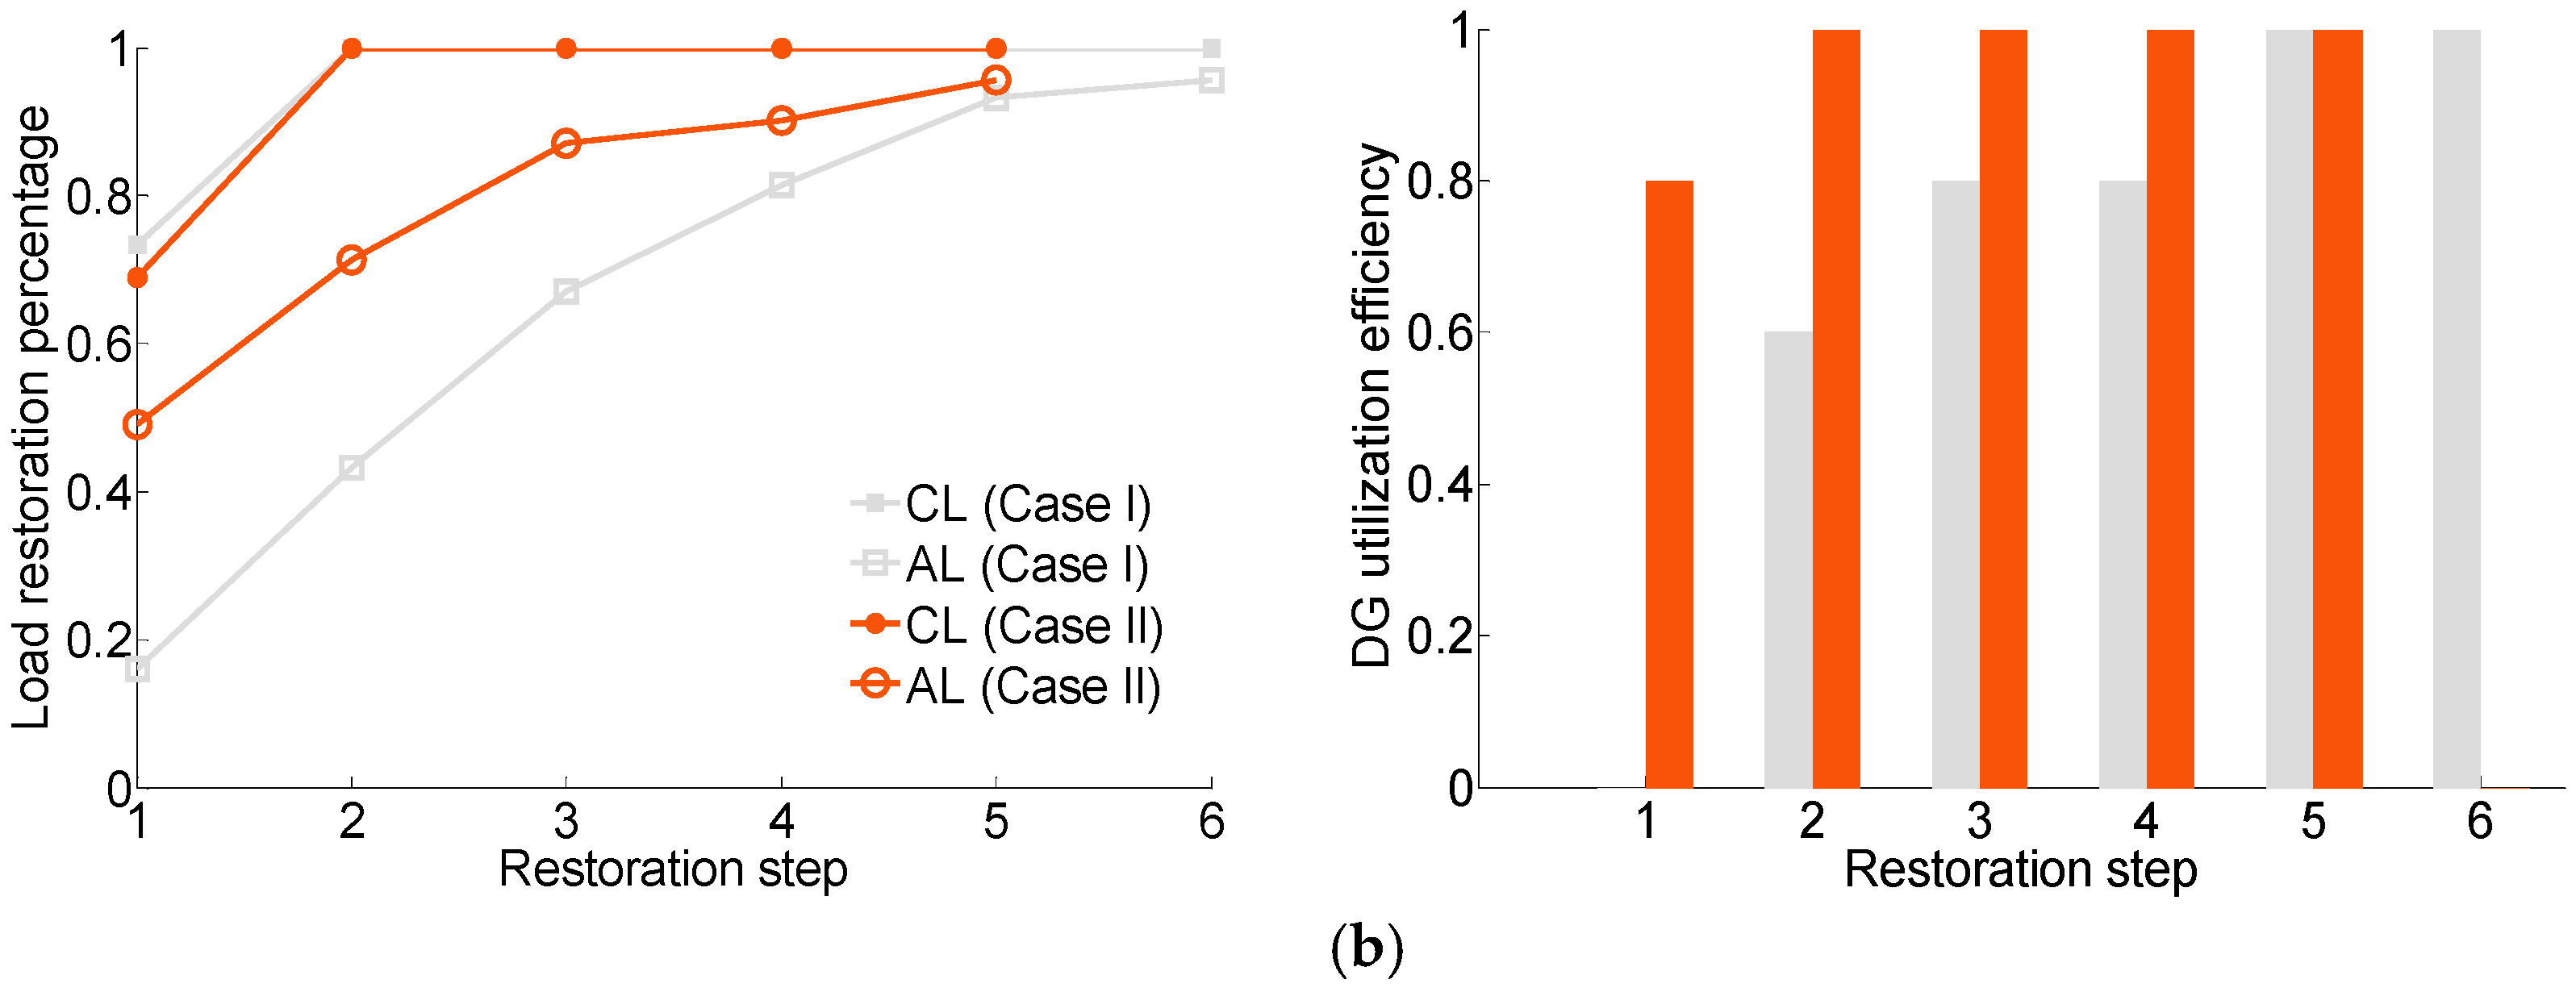
Table 3 shows that, under low fault levels (i.e., 20%), the proposed solution (case II) performs similarly in load restoration, with improved performance in the maximum voltage drop rate and maximum current raise. Owing to small scale of faults and sufficient WT outputs, the power loss in the proposed solution is higher than that in topology restoration. Under medium fault level (i.e., 40%), the result of the proposed solution is close to topology reconfiguration, with slightly less power loss and current raise. Under condition of high fault level (i.e., 60%), the results of load restoration are same in both two cases, with less power loss and current raise and slightly higher voltage drop. In general, DG-based restoration is similar to topology restoration with consideration of power loss, voltage drop and current raise. In details, Figure 6 presents the load restoration (both all loads and critical loads) and WT power utilization for two restoration strategies at individual restoration steps (i.e., switcher operations) under different fault levels (20% and 60%). It shows that both strategies provide similar performance in critical load restoration for all simulated fault levels (100% restoration within 2 steps) due to higher restoration priority and the proposed solution (case IІ) always outperforms in terms of restoration of all loads both in two fault levels. It can also been seen that all WTs in failed section can be immediately utilized for load restoration in the proposed solution, and hence the utilization efficiency of the WTs is improved with a faster and better restoration process, as confirmed by the result of restored loads at individual restoration steps.
4.4. Experiment 4: Multi-Bus Fault Condition with DG Uncertainties
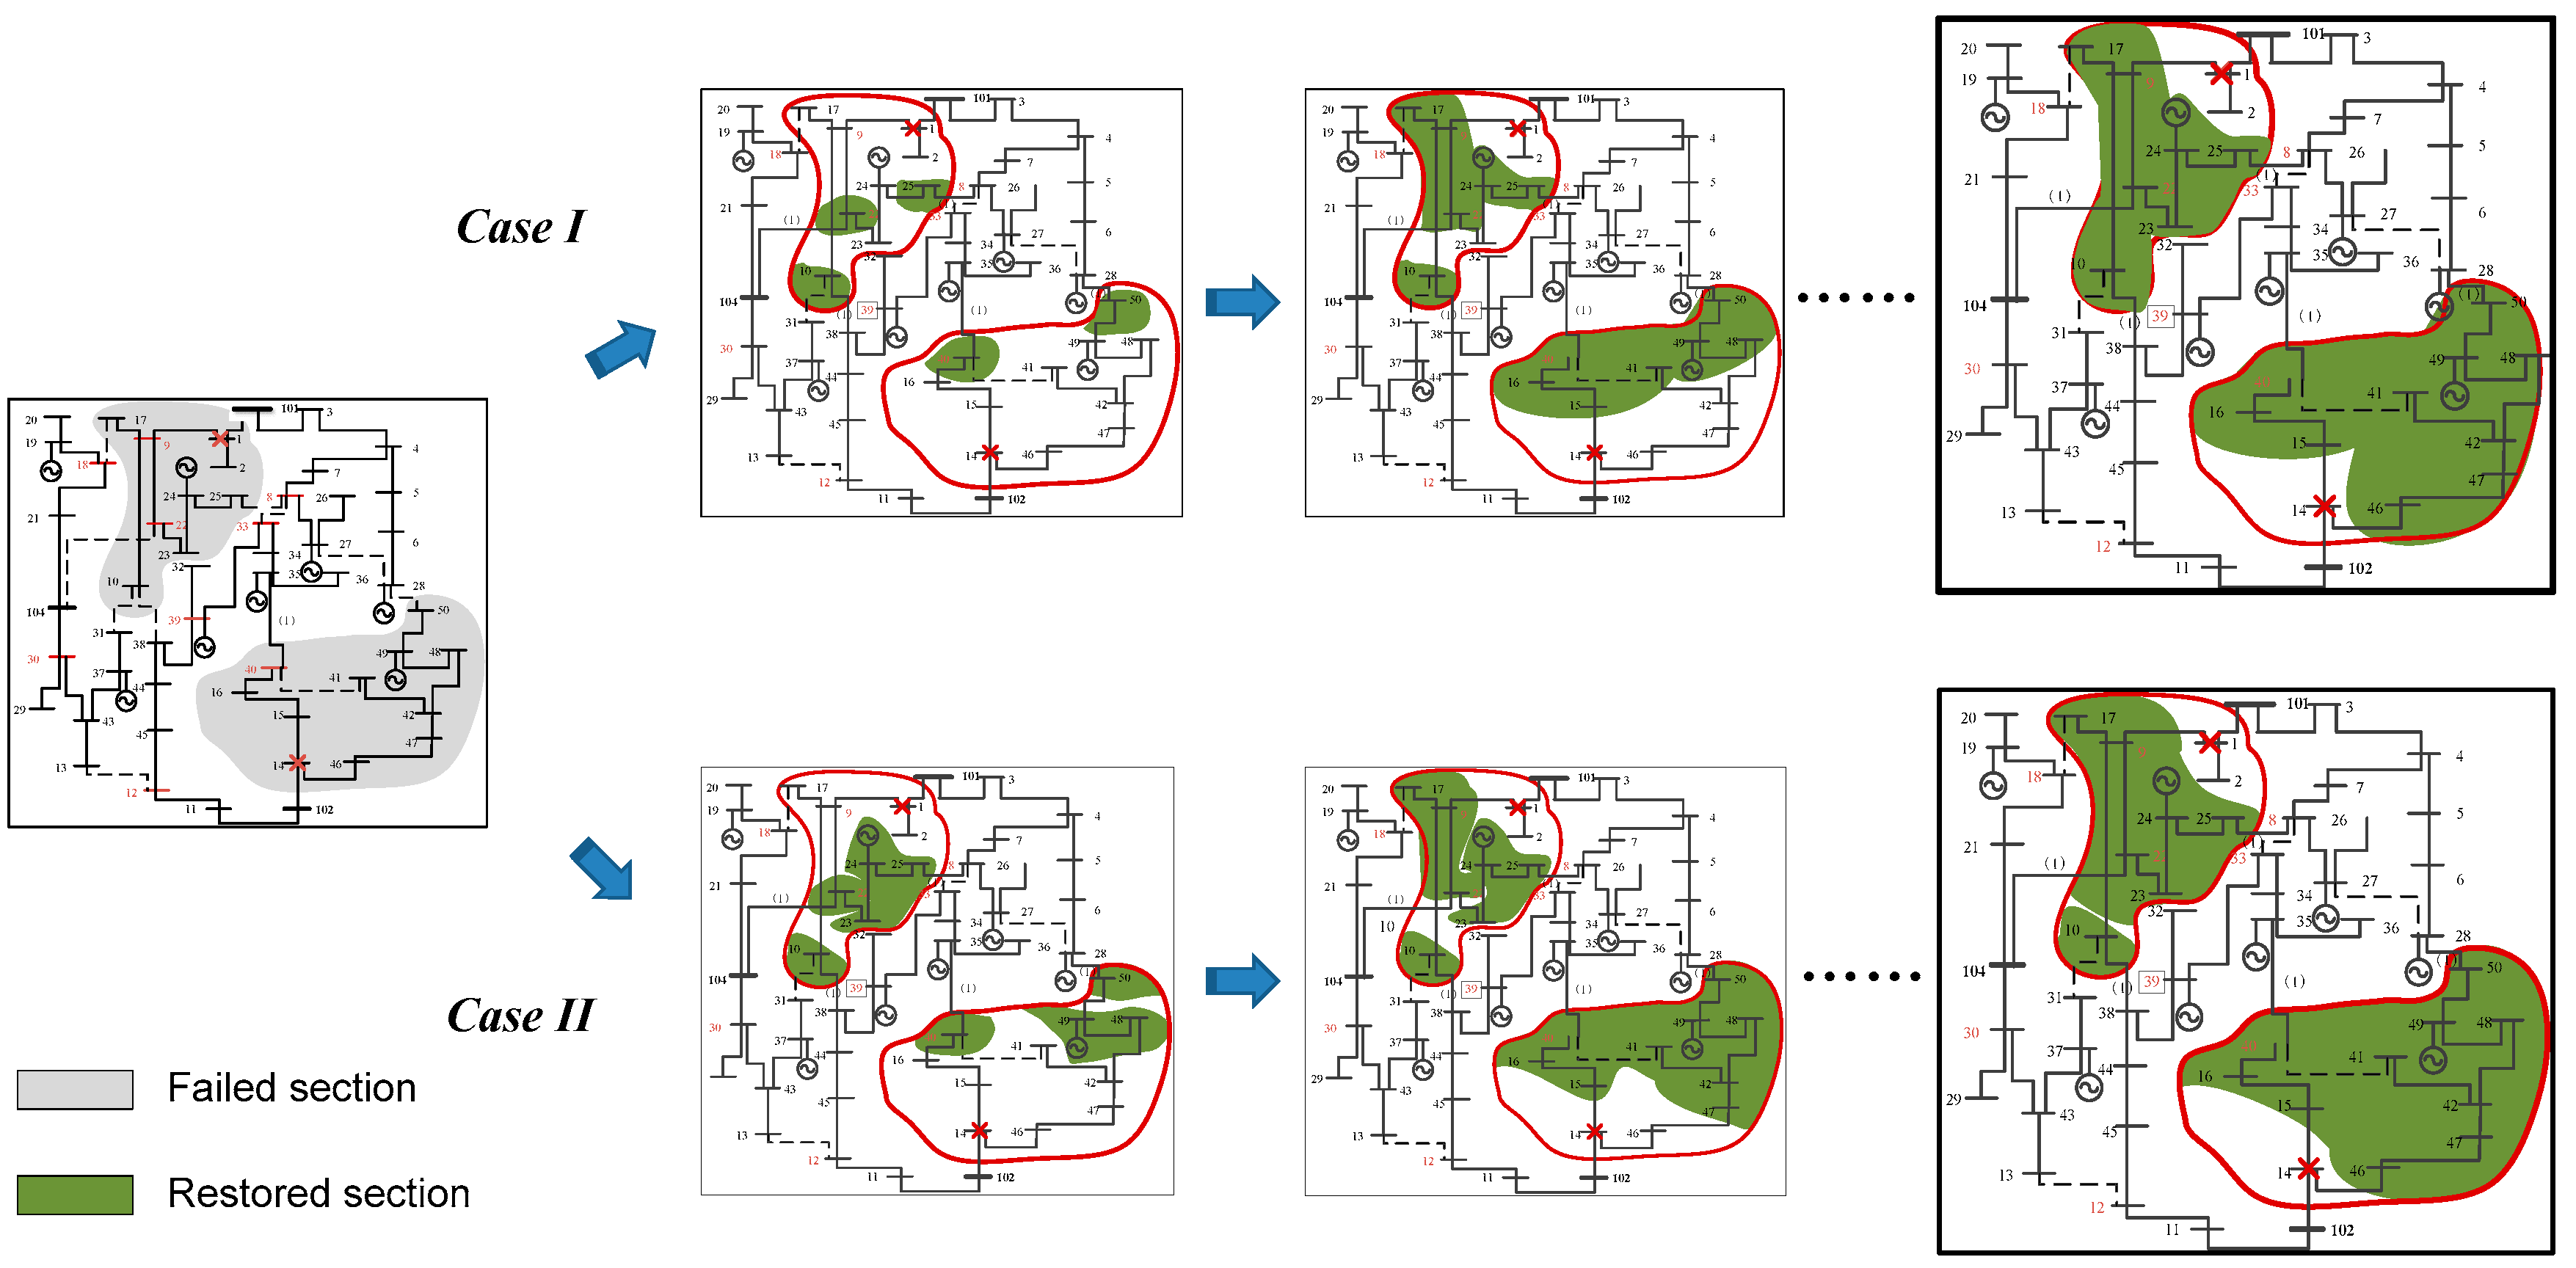
Finally, the robustness of the proposed power supply restoration solution is further validated in multi-bus fault scenarios considering the WT generation uncertainties. To this end, sufficient number of WT generation scenarios need to be generated to capture all the randomness of WT generation for performance evaluation. Table 4 presents the errors in terms of expectation, standard deviation, skewness, kurtosis and diversity of restoration paths for different number of generated scenarios (from 10 to 75) based on the HMM method. It shows that the errors of all four indicators are sufficiently small (less than 10%) to satisfied the requirements of HMM method. Morover 20 generated scenarios can well capture the WT stochastic characteristics and the impact on the diversity of restoration paths. Here, the performance of two load restoration strategies, i.e., topology configuration-based restoration (case I) and proposed solution (case II), are further investigated under 20 generated scenarios of WT generation and 20 multiple bus faults scenarios. Figure 7 illustrates the restoration process of two restoration strategies in the case of simultaneous faults occurred at bus No. 1 and 14 (the failed and restored section in the distribution network are highlighted respectively).
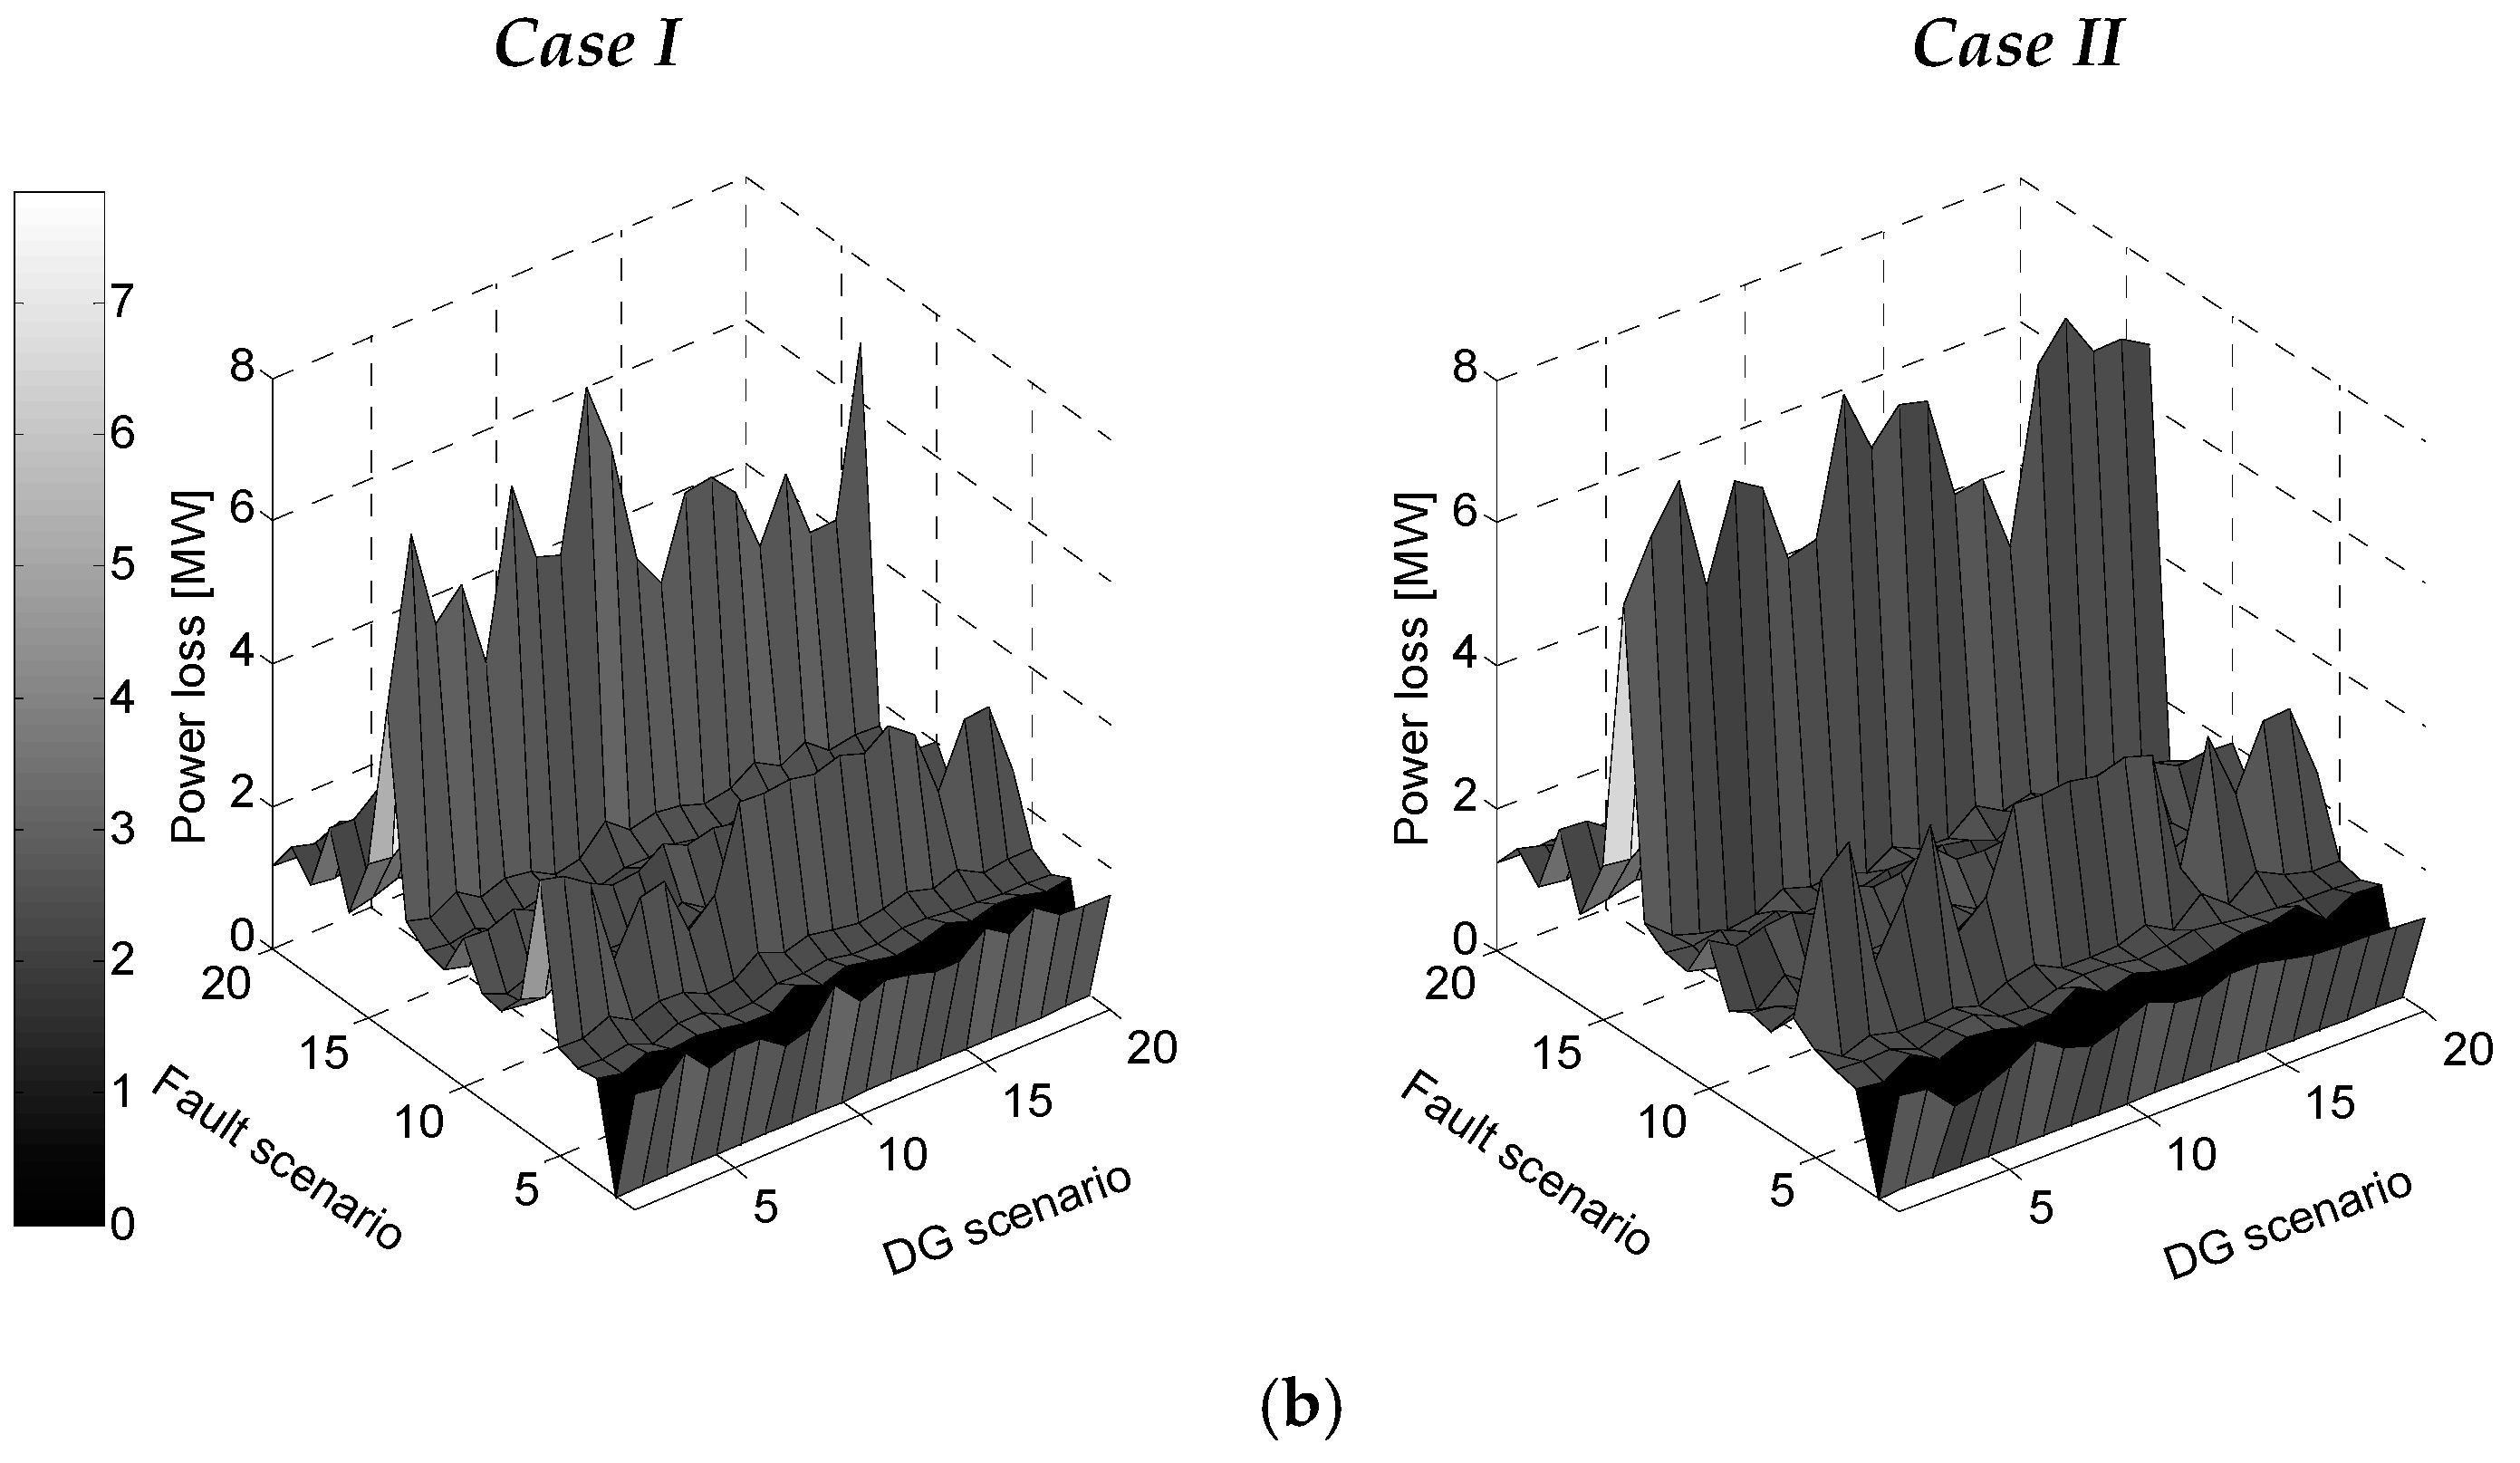
A set of numerical results are obtained for our proposed solution (case II) from extensive simulation experiments carried out for individual fault and WT generation scenarios in comparison with the topology reconfiguration-based solution (i.e., case I), as presented in Figure 8 and Figure 9 and Table 5, respectively. In Figure 8a, the proposed solution demonstrates similar number of restoration steps but more restored loads during restoration in comparison with topology reconfiguration-based solution, as confirmed by the statistics in Table 5. It also shows that the proposed solution significantly outperforms in terms of network power loss as shown in Figure 8b and both in mean and 95% confidence intervals in the simulated scenarios.
In addition, the impact on network power flow imposed by power restoration is examined in terms of the maximum voltage drop and the maximum current rise and presented in Figure 9a,b, respectively. It can be seen that the proposed solution results in similar voltage drop but significantly less current rise on the failure-free section during restoration due to local restoration by WTs. Overall, the obtained numerical result for multiple fault scenarios with WT uncertainties clearly demonstrate the proposed solution can provide robust performance in power restoration with additional benefit of maximum utilization of WTs and minimal effect on network operation.
5. Conclusions and Future Work
This paper presents an algorithmic solution for power supply restoration for active distribution networks through combining the DG local restoration and topology reconfiguration-based restoration with full consideration of availability and stochastic characteristics of distributed generation. The proposed solution carries out power restoration in parallel upon multiple simultaneous faults to maximize the load restoration as well as while minimizing power loss, topology variation and power flow changes. The performance of the proposed solution is assessed based on a 53-bus distribution network with WTs through extensive simulation experiments for a range of fault and DG scenarios and the result confirms the effectiveness of the proposed solution.
Based on the insights obtained from this work, two research directions are considered to be worth further exploitation. The proposed parallel fault restoration of distribution networks need to be further studied and validated considering the availability of mixture of different renewable DGs (e.g., solar PVs, WTs) as well as onsite diesel generators; also, one of the insights of this study is that the DG installation with appropriate capacity and loacation can further improve the performance of the proposed restoration solution. Thus, the optimal planning of distribution networks or network expansion, e.g., placement and capacity of DGs as well as feeder line reinforcement, considering the network self-healing capability needs to be investigated.
Acknowledgments
This work is supported in part by the National Key Research and Development Program of China (Basic Research Class 2017YFB0903000), the Natural Science Foundation of China (No. 51777183), the Natural Science Foundation of Zhejiang Province (No. LZ15E070001), and the Natural Science Foundation of Jiangsu Province (No. BK20161142).
Author Contributions
Qiang Yang and Le Jiang conceived and designed the experiments; Le Jiang performed the experiments; Qiang Yang and Le Jiang analyzed the data; Ali Ehsan, Yajing Gao and Shixiao Guo contributed reagents/materials/analysis tools; Qiang Yang and Le Jiang wrote the paper.
Conflicts of Interest
The authors declare no conflict of interest.
Abbreviations and Nomenclature
The following abbreviations and nomenclature are used in this manuscript:
| Object function of restoration model | |
| Vector of operation type of candidate switchers at nth optimization, | |
| Normalized kth sub-function of at nth optimization, , | |
| kth sub-function of at nth optimization, , | |
| Operation type of ith candidate switcher at nth optimization; if , ith candidate switcher is closed; else ith candidate switcher remains opened | |
| Number of candidate switchers at nth optimization | |
| Time costs of mth types of switchers, | |
| Number of the off-line nodes caused by the faults | |
| Priority of jth off-line load; if jth off-line load is critical load ; else, | |
| Value of jth off-line load | |
| Loads recover condition of jth off-line load when operating ith candidate switchers | |
| Number of switchers | |
| Whether the power flow of pth on-line branch was influenced by the operation of ith off-line switcher at nth optimization. If it is influenced, then ; else | |
| Whether the bus voltage of qth on-line bus was influenced by the operation of ith off-line switcher at nth optimization. If it is influenced, then ; else | |
| Current value of pth on-line branch at nth optimization | |
| Current limit of pth branch | |
| Voltage value of qth on-line bus at nth optimization | |
| Lower voltage limit of buses | |
| Upper voltage limit of buses | |
| Number of buses except for substations | |
| Conductance of branch between bus and | |
| Susceptance of branch between bus and | |
| Phase angle difference of branch between bus and at nth optimization | |
| Active power at bus | |
| Active power of DG at bus | |
| Reactive power at bus | |
| Reactive power of DG at bus | |
| Current of branch between bus and bus | |
| Capacity of branch between bus and bus | |
| Whether bus and are adjacent and connectable. If yes, then , else | |
| Number of substations | |
| Number of paths between bus and bus | |
| DGs | distributed generations |
| MV/LV | the medium/low voltage |
| DNOs | distribution network operators |
| ANM | active network management |
| HMM | Heuristic Moment Matching |
| WTs | wind turbines (WTs) |
Appendix A

Table A1.
Node Data.
| Node | Active Power (kW) | Reactive Power (kVar) | Node | Active Power (kW) | Reactive Power (kVar) |
|---|---|---|---|---|---|
| 101 | 0.00 | 0.00 | 25 | 623.70 | 302.07 |
| 102 | 0.00 | 0.00 | 26 | 831.60 | 402.78 |
| 104 | 0.00 | 0.00 | 27 | 1039.50 | 503.42 |
| 1 | 2910.60 | 1409.64 | 28 | 485.10 | 234.93 |
| 2 | 1039.50 | 503.43 | 29 | 970.20 | 469.85 |
| 3 | 485.10 | 234.93 | 30 | 1801.80 | 872.64 |
| 4 | 762.30 | 369.22 | 31 | 485.10 | 234.93 |
| 5 | 1801.80 | 872.64 | 32 | 1178.10 | 570.57 |
| 6 | 485.10 | 234.93 | 33 | 2009.70 | 973.36 |
| 7 | 693.00 | 335.64 | 34 | 831.60 | 402.79 |
| 8 | 1316.70 | 637.71 | 35 | 623.70 | 302.07 |
| 9 | 831.60 | 402.79 | 36 | 207.90 | 100.72 |
| 10 | 2009.70 | 973.36 | 37 | 1455.30 | 704.86 |
| 11 | 207.90 | 100.72 | 38 | 762.30 | 369.21 |
| 12 | 1247.40 | 604.14 | 38 | 693.00 | 335.64 |
| 13 | 762.30 | 369.22 | 40 | 970.20 | 469.85 |
| 14 | 693.00 | 335.64 | 41 | 623.70 | 302.07 |
| 15 | 970.20 | 469.85 | 42 | 831.60 | 402.79 |
| 16 | 1316.70 | 637.71 | 43 | 900.90 | 436.36 |
| 17 | 485.10 | 234.93 | 44 | 970.20 | 469.85 |
| 18 | 831.60 | 402.7 | 45 | 554.40 | 268.50 |
| 19 | 970.20 | 469.85 | 46 | 1247.40 | 604.14 |
| 20 | 554.40 | 268.50 | 47 | 693.00 | 335.64 |
| 21 | 1247.40 | 604.14 | 48 | 554.40 | 268.50 |
| 22 | 762.30 | 369.22 | 49 | 346.50 | 167.78 |
| 23 | 693.00 | 335.64 | 50 | 554.40 | 268.50 |
| 24 | 346.50 | 167.78 | - | - | - |
Table A2.
Branch Data.
| Start Node | End Node | Resistance (Ω) | Reactance (Ω) | Current Limit (A) | Start Node | End Node | Resistance (Ω) | Reactance (Ω) | Current Limit (A) |
|---|---|---|---|---|---|---|---|---|---|
| 101 | 1 | 0.0543 | 0.0670 | 600 | 45 | 44 | 0.0421 | 0.0524 | 600 |
| 1 | 2 | 0.1472 | 0.1499 | 250 | 44 | 38 | 0.0603 | 0.0749 | 600 |
| 1 | 9 | 0.0663 | 0.0824 | 600 | 38 | 39 | 0.0809 | 0.0824 | 500 |
| 9 | 22 | 0.2208 | 0.2248 | 250 | 39 | 32 | 0.2968 | 0.2046 | 150 |
| 22 | 23 | 0.2507 | 0.1729 | 150 | 39 | 33 | 0.1326 | 0.1350 | 250 |
| 23 | 24 | 0.2054 | 0.1416 | 150 | 33 | 34 | 0.1367 | 0.0942 | 150 |
| 24 | 25 | 0.1594 | 0.1099 | 150 | 34 | 35 | 0.1594 | 0.1099 | 150 |
| 9 | 17 | 0.1256 | 0.1060 | 400 | 35 | 36 | 0.1594 | 0.1099 | 150 |
| 9 | 10 | 0.3388 | 0.3449 | 250 | 102 | 14 | 0.0725 | 0.0901 | 600 |
| 101 | 3 | 0.0421 | 0.0524 | 600 | 14 | 15 | 0.1796 | 0.1802 | 250 |
| 3 | 4 | 0.0603 | 0.0749 | 600 | 15 | 16 | 0.1326 | 0.1350 | 250 |
| 4 | 7 | 0.0483 | 0.0600 | 600 | 16 | 40 | 0.1828 | 0.1260 | 150 |
| 7 | 8 | 0.0603 | 0.0749 | 600 | 14 | 46 | 0.1002 | 0.0846 | 400 |
| 8 | 27 | 0.1796 | 0.1802 | 250 | 46 | 47 | 0.1472 | 0.1499 | 250 |
| 27 | 26 | 0.2507 | 0.1729 | 150 | 47 | 42 | 0.0911 | 0.0769 | 400 |
| 4 | 5 | 0.1472 | 0.1499 | 250 | 42 | 41 | 0.2741 | 0.1890 | 150 |
| 5 | 6 | 0.1179 | 0.1201 | 250 | 42 | 48 | 0.1828 | 0.1260 | 150 |
| 6 | 28 | 0.3655 | 0.2520 | 150 | 48 | 49 | 0.2741 | 0.1890 | 150 |
| 104 | 21 | 0.0730 | 0.0617 | 400 | 49 | 50 | 0.1594 | 0.1099 | 150 |
| 21 | 18 | 0.1472 | 0.1499 | 250 | 18 | 17 | 0.2968 | 0.2046 | 150 |
| 18 | 19 | 0.1828 | 0.1260 | 150 | 104 | 22 | 0.1769 | 0.1802 | 250 |
| 19 | 20 | 0.2281 | 0.1572 | 150 | 10 | 31 | 0.2281 | 0.1572 | 150 |
| 104 | 30 | 0.0543 | 0.0675 | 600 | 10 | 38 | 0.1828 | 0.126 | 150 |
| 30 | 29 | 0.2281 | 0.1572 | 150 | 13 | 12 | 0.3194 | 0.2202 | 150 |
| 30 | 43 | 0.1916 | 0.1950 | 250 | 35 | 40 | 0.1301 | 0.0897 | 150 |
| 43 | 37 | 0.1828 | 0.1260 | 150 | 8 | 25 | 0.2054 | 0.1416 | 150 |
| 37 | 31 | 0.1367 | 0.0942 | 600 | 8 | 33 | 0.2208 | 0.2248 | 250 |
| 43 | 13 | 0.1095 | 0.0925 | 400 | 28 | 27 | 0.2281 | 0.1572 | 150 |
| 102 | 11 | 0.0543 | 0.0675 | 600 | 28 | 50 | 0.1126 | 0.0776 | 280 |
| 11 | 12 | 0.0603 | 0.0749 | 600 | 40 | 41 | 0.2741 | 0.1890 | 150 |
| 12 | 45 | 0.0483 | 0.0600 | 600 | - | - | - | - | - |
References
- Lopes, J.A.P.; Hatziargyriou, N.; Mutale, J.; Djapic, P.; Jenkins, N. Integrating distributed generation into electric power systems: A review of drivers, challenges and opportunities. Electr. Power Syst. Res. 2007, 77, 1189–1203. [Google Scholar] [CrossRef]
- Angelo, C.; Selejan, P. Technologies of the self healing grid. In Proceedings of the 22nd International Conference on Electricity Distribution IET, Stockholm, Sweden, 10–13 June 2013; pp. 1–4. [Google Scholar]
- Ćurčić, S.; Özveren, C.S.; Crowe, L.; Lo, P.K.L. Electric power distribution network restoration: A survey of papers and a review of the restoration problem. Electr. Power Syst. Res. 1995, 35, 73–86. [Google Scholar] [CrossRef]
- Miu, K.N.; Chiang, H.D.; Yuan, B.; Darling, G. Fast service restoration for large-scale distribution systems with priority customers and constraints. IEEE Trans. Power Syst. 1998, 13, 789–795. [Google Scholar] [CrossRef]
- Miu, K.N.; Chiang, H.D.; Mcnulty, R.J. Multi-tier service restoration through network reconfiguration and capacitor control for large-scale radial distribution networks. IEEE Trans. Power Syst. 2000, 15, 1001–1007. [Google Scholar]
- Chen, C.S.; Lin, C.H.; Tsai, H.Y. A rule-based expert system with colored petri net models for distribution system service restoration. IEEE Power Eng. Rev. 2002, 22, 59. [Google Scholar] [CrossRef]
- Coelho, V.N.; Cohen, M.W.; Coelho, I.M.; Liu, N.; Guimarães, F.G. Multi-agent systems applied for energy systems integration: State-of-the-art applications and trends in microgrids. Appl. Energy 2017, 187, 820–832. [Google Scholar] [CrossRef]
- Abdullah, M.A.; Agalgaonkar, A.P.; Muttaqi, K.M. Assessment of energy supply and continuity of service in distribution network with renewable distributed generation. Appl. Energy 2014, 113, 1015–1026. [Google Scholar] [CrossRef]
- Elmitwally, A.; Elsaid, M.; Elgamal, M.; Chen, Z. A fuzzy-multiagent service restoration scheme for distribution system with distributed generation. IEEE Trans. Sustain. Energy 2015, 6, 810–821. [Google Scholar] [CrossRef]
- Pham, T.T.H.; Besanger, Y.; Hadjsaid, N. New challenges in power system restoration with large scale of dispersed generation insertion. IEEE Trans. Power Syst. 2009, 24, 398–406. [Google Scholar] [CrossRef]
- Sharma, A.; Srinivasan, D.; Trivedi, A. A decentralized multiagent system approach for service restoration using dg islanding. IEEE Trans. Smart Grid 2017, 6, 2784–2793. [Google Scholar] [CrossRef]
- Ding, T.; Chen, C.; Lin, Y.; Bie, Z. Resilient microgrid formation strategy for load restoration considering master-slave distributed generators and topology reconfiguration. Appl. Energy 2017, 199, 205–216. [Google Scholar] [CrossRef]
- Romero, R.; Franco, J.F.; Leão, F.B.; Rider, M.J.; Souza, E.S.D. A new mathematical model for the restoration problem in balanced radial distribution systems. IEEE Trans. Power Syst. 2015, 31, 1259–1268. [Google Scholar] [CrossRef]
- Li, J.; Ma, X.Y.; Liu, C.C.; Schneider, K.P. Distribution system restoration with microgrids using spanning tree search. IEEE Trans. Power Syst. 2014, 29, 3021–3029. [Google Scholar] [CrossRef]
- Botea, A.; Rintanen, J.; Banerjee, D. Optimal reconfiguration for supply restoration with informed A* search. IEEE Trans. Smart Grid 2012, 3, 583–593. [Google Scholar] [CrossRef]
- Zhao, B.; Dong, X.; Bornemann, J. Service restoration for a renewable-powered microgrid in unscheduled island mode. IEEE Trans. Smart Grid 2015, 6, 1128–1136. [Google Scholar] [CrossRef]
- Moreira, C.L.; Resende, F.O.; Lopes, J.A.P. Using low voltage microgrids for service restoration. IEEE Trans. Power Syst. 2007, 22, 395–403. [Google Scholar] [CrossRef]
- Chen, Y.; Illindala, M.S.; Khalsa, A.S. Modified viterbi algorithm-based distribution system restoration strategy for grid resiliency. IEEE Trans. Power Deliv. 2017, 32, 310–319. [Google Scholar]
- Zidan, A.; El-Saadany, E.F. A cooperative multiagent framework for self-healing mechanisms in distribution systems. IEEE Trans. Smart Grid 2012, 3, 1525–1539. [Google Scholar] [CrossRef]
- Kumar, Y.; Das, B.; Sharma, J. Multiobjective, multiconstraint service restoration of electric power distribution system with priority customers. IEEE Trans. Power Deliv. 2008, 23, 261–270. [Google Scholar] [CrossRef]
- Kleinberg, M.R.; Miu, K.; Chiang, H.D. Improving service restoration of power distribution systems through load curtailment of in-service customers. IEEE Trans. Power Syst. 2011, 26, 1110–1117. [Google Scholar] [CrossRef]
- Jiang, L.; Yang, Q. Intelligent power supply restoration in power distribution networks with distributed generation. In Proceedings of the IEEE International Conference on Electricity Distribution, Xi’an, China, 10–13 August 2016; pp. 1–6. [Google Scholar]
- Limpananwadi, W.; Thongkwan, B. Intentional island of distribution network. In Proceedings of the 19th International Conference on Electricity Distribution, Vienna, Austria, 21–24 May 2007; pp. 1–5. [Google Scholar]
- Li, J.; Ye, L.; Zeng, Y.; Wei, H. A scenario-based robust transmission network expansion planning method for consideration of wind power uncertainties. CSEE J. Power Energy Syst. 2016, 2, 11–18. [Google Scholar] [CrossRef]
- Høyland, K.; Kaut, M.; Wallace, S.W. A heuristic for moment-matching scenario generation. Comput. Optim. Appl. 2003, 24, 169–185. [Google Scholar] [CrossRef]
- Belgian Electricity Transmission Operator Elias. Available online: http://www.elia.be/en/about-elia (accessed on 10 December 2016).
Figure 1.
The illustration of supply restoration upon faults for two scenarios.

Figure 2.
The illustration of parallel power supply restoration. (a) System topology before restoration (b) 1st step of load restoration; (c) 2nd step of load restoration; and (d) 3rd step of load restoration.
Figure 2.
The illustration of parallel power supply restoration. (a) System topology before restoration (b) 1st step of load restoration; (c) 2nd step of load restoration; and (d) 3rd step of load restoration.

Figure 3.
Flowchart of the proposed power supply restoration process.

Figure 4.
Topology and parameters of 53-bus power distribution network.

Figure 5.
Moments errors of generated scenarios. Type of moment: (1) Expectation; (2) Standard deviation; (3) Skewness; (4) Kurtosis.
Figure 5.
Moments errors of generated scenarios. Type of moment: (1) Expectation; (2) Standard deviation; (3) Skewness; (4) Kurtosis.

Figure 6.
Load restoration percentage (critical (CL) loads and all loads (AL)) and WT utilization efficiency. (a) Fault level 20%; and (b) Fault level 60%.
Figure 6.
Load restoration percentage (critical (CL) loads and all loads (AL)) and WT utilization efficiency. (a) Fault level 20%; and (b) Fault level 60%.


Figure 7.
Illustration of load restoration process for case I and case II (our solution).

Figure 8.
Performance of load restoration for case I and case II (our solution) (a) switcher operation times; and (b) power loss.
Figure 8.
Performance of load restoration for case I and case II (our solution) (a) switcher operation times; and (b) power loss.


Figure 9.
Impact of load restoration for case I and case II (our solution) (a) Maximum voltage drop; and (b) Maximum current raise.
Figure 9.
Impact of load restoration for case I and case II (our solution) (a) Maximum voltage drop; and (b) Maximum current raise.

Table 1.
Supply restoration paths and switcher operations.
| Fault Bus No. | Action | Switcher Operation of Solution from [13] | Switcher Operation of Our Solution | ||||
|---|---|---|---|---|---|---|---|
| Switcher Operation (w/o DG) | Times | Switcher Operation (w/o DG) | Times | Switcher Operation (with DG) | Times | ||
| 3 | Open | 4–5, 28–6, 27–8, 26–27, 34–33 | 5 | 8–27, 5–6 | 2 | 6–5, 8–27 | 2 |
| Close | 28–27, 8–33, 35–40, 28–50 | 4 | 8–25, 28–50, 27–28 | 3 | 28–50, 8–25 | 2 | |
| 11 | Open | 12–45, 39–38, 34–33 | 3 | 38–44, 34–35 | 2 | 45–44, 33–39 | 2 |
| Close | 10–38, 13–12, 33–8, 40–35 | 4 | 8–33, 35–40, 12–13 | 3 | 8–33, 12–13, 10–38 | 3 | |
| 14 | Open | 35–36, 16–40, 42–41, 47–42 | 4 | 40–16, 16–15, 46–47 | 3 | - | 0 |
| Close | 40–41, 35–40, 28–50 | 3 | 28–50 | 1 | 28–50, 40–41 | 2 | |
Table 2.
Percentage of load restoration and computation time.
| Fault Bus No. | Percentage of Load Restoration | Computation Time | ||||
|---|---|---|---|---|---|---|
| Solution from [13] | Our Solution | Solution from [13] | Our Solution | |||
| w/o DG | with DG | w/o DG | with DG | |||
| 3 | 93.17% | 100% | 100% | 38.6 s | 11.4 s | 11.2 s |
| 11 | 100% | 100% | 100% | 8.1 s | 9.6 s | 6.8 s |
| 14 | 89.83% | 90.13% | 100% | 27.8 s | 5.8 s | 10.3 s |
Table 3.
Performance of restoration under faults at multiple buses.
| Fault Level (Affected Buses) | Fault Location | Power Loss (MW) | Maximum Voltage Drop | Maximum Current Raise | Un-Restored Bus No. | ||||
|---|---|---|---|---|---|---|---|---|---|
| Case І | Case ІI | Case I | Case IІ | Case І | Case II | Case І | Case II | ||
| 20% (10 buses) | 7, 39 | 0.1450 | 0.3061 | 2.42% | 0.00% | 3.20% | 0.00% | 32 | 32 |
| 40% (20 buses) | 1, 14 | 0.3866 | 0.3257 | 2.03% | 2.56% | 3.71% | 3.70% | 2 | 2 |
| 60% (30 buses) | 3, 14, 21, 30 | 2.665 | 0.733 | 0.02% | 0.85% | 7.97% | 6.69% | 29 | 29 |
Table 4.
Impact of the generated WT generation profiles on load restoration.
| Number of Scenarios | Expectation | Standard Deviation | Skewness | Kurtosis | Diversity of Restoration Paths |
|---|---|---|---|---|---|
| 10 | 1.60% | 0.14% | 8.01% | 4.97% | 4 |
| 15 | 0.02% | 2.90% | 2.91% | 4.88% | 5 |
| 20 | 0.16% | 5.07% | 6.19% | 3.94% | 6 |
| 25 | 0.65% | 1.77% | 9.96% | 4.84% | 6 |
| 30 | 0.63% | 0.28% | 5.38% | 3.46% | 6 |
| 50 | 0.32% | 3.69% | 2.25% | 6.39% | 6 |
| 60 | 0.51% | 6.33% | 5.52% | 4.70% | 6 |
| 75 | 1.60% | 0.14% | 8.02% | 4.97% | 6 |
Table 5.
Performance under multi-bus fault scenario with WT uncertainties (mean and 95% confidence intervals).
Table 5.
Performance under multi-bus fault scenario with WT uncertainties (mean and 95% confidence intervals).
| Performance Metrics | Mean Value | 95% Confidence Intervals | ||
|---|---|---|---|---|
| Case I | Case II | Case I | Case II | |
| Restored loads (MW) | 4.8805 | 5.0468 | [4.5537, 5.2072] | [4.7024, 5.3911] |
| Restoration steps | 2.6725 | 2.7375 | [2.5199, 2.8251] | [2.5878, 2.8872] |
| Power loss (MW) | 1.8072 | 1.7553 | [1.7005, 1.9139] | [1.6294, 1.8813] |
| Maximum current raise rate | 2.07% | 1.87% | [1.86%, 2.21%] | [1.68%, 2.06%] |
| Maximum voltage drop rate | 1.05 % | 1.10% | [0.91%, 1.19%] | [0.95%, 1.25%] |
© 2018 by the authors. Licensee MDPI, Basel, Switzerland. This article is an open access article distributed under the terms and conditions of the Creative Commons Attribution (CC BY) license (http://creativecommons.org/licenses/by/4.0/).
Share and Cite
MDPI and ACS Style
Yang, Q.; Jiang, L.; Ehsan, A.; Gao, Y.; Guo, S. Robust Power Supply Restoration for Self-Healing Active Distribution Networks Considering the Availability of Distributed Generation. Energies 2018, 11, 210. https://doi.org/10.3390/en11010210
AMA Style
Yang Q, Jiang L, Ehsan A, Gao Y, Guo S. Robust Power Supply Restoration for Self-Healing Active Distribution Networks Considering the Availability of Distributed Generation. Energies. 2018; 11(1):210. https://doi.org/10.3390/en11010210
Chicago/Turabian StyleYang, Qiang, Le Jiang, Ali Ehsan, Yajing Gao, and Shixiao Guo. 2018. "Robust Power Supply Restoration for Self-Healing Active Distribution Networks Considering the Availability of Distributed Generation" Energies 11, no. 1: 210. https://doi.org/10.3390/en11010210
Note that from the first issue of 2016, this journal uses article numbers instead of page numbers. See further details here.