Operational Performance Characterization of a Heat Pump System Utilizing Recycled Water as Heat Sink and Heat Source in a Cool and Dry Climate

1
Oak Ridge National Laboratory, Oak Ridge, TN 37831, USA
2
Frontier Energy, Inc., Cazenovia, NY 13035, USA
*
Author to whom correspondence should be addressed.
Energies 2018, 11(1), 211; https://doi.org/10.3390/en11010211
Submission received: 1 December 2017
/
Revised: 5 January 2018
/
Accepted: 9 January 2018
/
Published: 16 January 2018
Abstract
:The wastewater leaving from homes and businesses contains abundant low-grade energy, which can be utilized through heat pump technology to heat and cool buildings. Although the energy in the wastewater has been successfully utilized to condition buildings in other countries, it is barely utilized in the United States, until recently. In 2013, the Denver Museum of Nature & Science at Denver, the United States implemented a unique heat pump system that utilizes recycled wastewater from a municipal water system to cool and heat its 13,000 m2 new addition. This recycled water heat pump (RWHP) system uses seven 105 kW (cooling capacity) modular water-to-water heat pumps (WWHPs). Each WWHP uses R-410A refrigerant, has two compressors, and can independently provide either 52 °C hot water (HW) or 7 °C chilled water (CHW) to the building. This paper presents performance characterization results of this RWHP system based on the measured data from December 2014 through August 2015. The annual energy consumption of the RWHP system was also calculated and compared with that of a baseline Heating, Ventilation, and Air Conditioning (HVAC) system which meets the minimum energy efficiencies that are allowed by American Society of Heating, Refrigerating and Air-Conditioning Engineers (ASHRAE) 90.1-2013. The performance analysis results indicate that recycled water temperatures were favorable for effective operation of heat pumps. As a result, on an annual basis, the RWHP system avoided 50% of source energy consumption (resulting from reduction in natural gas consumption although electricity consumption was increased slightly), reduced CO2 emissions by 41%, and saved 34% in energy costs as compared with the baseline system.
1. Introduction
About 60% of the domestic water is heated for showers, water heaters, dishwashers, and cloth washers [1]. The wastewater leaving homes and offices contains abundant low-grade thermal energy, which is usually lost into the sewer system. This energy can be recovered with several approaches, including:
- Use a heat exchanger to recover heat from the warm wastewater exiting a building to pre-heat the incoming cold water [2], or ventilation air.
- Use a water source heat pump to recover heat from the treated wastewater and provide space heating (and/or to dump the heat removed from a building to the wastewater during space cooling operation). This approach is relatively simpler to implement, but it is limited to locations with easy access to treated waste water (e.g., at the outskirts of a city and usually away from the population centers) [3,4,5,6,7,8]
- Use a water source heat pump to recover heat from a network of untreated raw sewage water. This approach often can be implemented at or near the thermal load, but unfortunately, since the raw sewage water contains a large amount of impurity and suspended particles that tend to foul the heat exchanger surfaces and reduce its performance over time, special equipment, and operations are needed to reduce fouling, such as periodic cleaning of heat exchangers, enlarged heat exchanger surfaces, and the use of specially-designed filters to remove particles larger than a certain size [9].
Wastewater has been gradually adopted in many countries for heat pump operation because of its advantages, including huge quantities, continuous availability, and favorable temperatures (generally not lower than 10 °C in winter, but not higher than 30 °C in summer [8]). According to a recent study [10], 3% of the heating and cooling demands of all buildings in Switzerland could be met with wastewater heat pump technology.
The favorable temperatures of the wastewater can result in a coefficient of performance (COP) of the heat pump up to 7 [10]. An extensive review of existing wastewater source heat pump (WWSHP) systems in several countries indicated that the COP values of the WWSHP are in the range of 1.77−10.63 for heating and 2.23−5.35 for cooling, depending on the wastewater temperature (ranging from 8 to 65 °C) [11]. Zhou and Li [8] reviewed several sewage water heat pump (SWHP) systems in China and reported that the SWHP system’s initial cost was about 6% lower than typical chiller/boiler systems, while the annual operating cost savings could be up to 67%. However, most of the performance analysis in the previous literature was based on either simulation results or limited performance data measured in a short period (e.g., a few days). To evaluate the real performance of WWSHP systems and identify needed improvements in applying and operating these systems, in-depth case studies with long term measured data are highly desirable.
Wastewater was barely utilized for heat pump operation in the United States until recently. In 2013, the Denver Museum of Nature & Science (DMNS) at Denver of the United States implemented a unique heat pump system that harvest energy from recycled wastewater (RW) from a municipal water system to heat its 13,000 m2 new addition. The same heat pump system also cools the building in summer by dumping heat removed from the building to the wastewater. This recycled water heat pump (RWHP) system uses seven 105 kW (cooling capacity) modular water-to-water heat pumps (WWHPs). Each WWHP uses R-410A refrigerant, has two compressors, and can independently provide either 52 °C hot water (HW) or 7 °C chilled water (CHW) to the building. This project is believed to be the first of its kind in the United States. The RWHP system has the potential to be applied in other urban areas, given that there are existing RW distribution systems in many cities. For example, the existing RW system in Denver is over 112 km long and is still expanding, and currently 171 water districts in 11 states in the United States have existing RW systems [12]. Currently, the RW is mainly used for landscape irrigation and pond water-level management.
This paper introduces the RWHP system implemented at DMNS, presents measured performance data, and discusses the energy savings and other benefits that are achieved by the RWHP system. A cost analysis is also performed to evaluate the simple payback of the RWHP system. The performance analysis is based on measured data (with 15-min interval) from December 2014 through August 2015, along with other related information, including utility bills, engineering designs, maintenance records, and construction costs. More detailed information of this study is given by Im and Liu [12].
2. RWHP System at the Denver Museum of Nature & Science (DMNS)
The 13,000 m2 new addition of DMNS has five stories (including two stories underground). It consists of exhibition halls, classrooms, studios, research facilities, and collection storage. The building has earned Leadership in Energy and Environmental Design (LEED) Platinum certification, which is the highest level of Leadership in Energy & Environmental Design, from the US Green Building Council. This new addition has critical requirements for indoor climate control. For example, the relative humidity and the indoor temperature at its 6500 m2 collection storage area need to be precisely maintained at 50 ± 3% and at 21.1 ± 1.1 °C year-round.
The RWHP system uses a ClimaCool UCH series WWHP, which consists of seven 105 kW (cooling capacity) modules. The total installed capacity of the WWHP is 735 kW. Each module of the WWHP uses R-410A refrigerant and has two compressors and can independently provide either 52 °C hot water or 7 °C chilled water to the building. A master controller modulates the number and operation mode of each module to satisfy the varying heating and cooling demands of the building simultaneously. The cooling COP of the WWHP ranges within 5.9–6.2 with 24 °C water entering condenser and 7 °C water leaving evaporator. In addition, a 19.05 kW Heat Harvester WWHP, which extracts heat from the RW, and two Next Generation Energy solar thermal collection arrays are used to produce domestic hot water (DHW) for the building.
The RWHP system has five water loops: the RW loop, source water loop, CHW loop, HW loop, and precooling loop (Figure 1). Each loop has its own circulation pump with variable frequency drive (VFD) and associated controls. The source water loop is the heat sink and the heat source of the WWHP. It is coupled with the RW loop and the precooling loop. The RW loop exchanges heat with the source water loop through a plate frame heat exchanger. The precooling loop provides cold water to five air-handling units (AHUs) in the building for precooling the air delivered to the building and it also serves as the heat source for the WWHP unit dedicated for DHW. Heat rejected from the precooling loop goes to the source water loop and becomes a heat source for the modular WWHPs (for producing CHW and HW). The CHW and HW loops deliver CHW and HW, respectively, to the five AHUs and the reheat coils at each terminal unit of the variable air volume (VAV) systems that conditions the building. The design maximum air flow of each AHU is about 850 m3/min., and with 10% outdoor air (OA). Each AHU has multiple sections to preheat, precool, cool, or heat the air. Because the building requires precise humidity control, many terminal units of the VAV systems have ultrasonic humidifiers, which are fed with a deionized water system.
Since the recycled water is not always available because of routine maintenance or other reasons (e.g., the RW supply was shut off for three weeks in 2014), two steam heat exchangers (HXs) were installed at the HW loop to provide auxiliary heating. Each of them uses 34.5 kPa steam and has about 494.7 kW capacity. Steam is produced by a newly installed natural gas fired boiler, which has a thermal efficiency of 75%. In addition, a cooling tower and another steam HX are installed at the source water loop to serve as a backup heat sink and source when RW is not available or insufficient to keep the source water temperature within a desired range. The cooling tower has about 923 kW cooling capacity. The cooling tower is modulated to maintain leaving water from the cooling tower at 10 °C, or a temperature that the ambient air would allow. The source loop steam HX uses 34.5 kPa steam and has a 756.4 kW capacity. In heating operation, the source loop steam HX is activated when the source water temperature after exchanging heat with the precooling loop (TSL3 in Figure 1) is lower than 10 °C and it is deactivated when TSL3 is higher than 12.8 °C. Table 1 is a list of the measured data points as indicated in Figure 1.
A new pipeline for the RW was constructed between the existing city RW pipeline and the target building. Two 20 cm Polyvinyl Chloride (PVC) pipes (one for supply and the other for return) were installed side by side in a 48-inch-wide trench. The supply line was insulated with 5 cm of foam insulation to reduce heat transfer between the supply and return lines. Trench depth varied from 1.8 m to 4.6 m through the 1006 meter-long pipeline (in each direction). Remote water sampling stations were required on the lines between the conduit and building entry points. Isolation valves and a meter were installed at the conduit connection. Other isolation valves were installed at points before the lines enter the building. RW is pumped through a plate frame HX (referred as “RW HX” hereinafter; as shown in Figure 1) by two 11.2-kW redundant variable-speed pumps (referred as the “RW pump” hereinafter) to exchange heat with the source water.
The control sequence for the RW pump is different in heating and cooling seasons. During cooling season, the RW pump is turned on when the leaving water temperature from the RW HX (TSL1 in Figure 1) is above 13 °C and the leaving water temperature from the modular WWHP (TSL5 in Figure 1) is at least 1 °C higher than the RW supply temperature (TRWS in Figure 1). During heating season, the RW pump is turned on when TSL1 is below 13 °C and the TSL5 is at least 1 °C lower than TRWS. When it is turned on, the speed of the RW pump is modulated to maintain the temperature differential of the RW at 5.5 °C across the RW HX.
3. Performance Characterization
3.1. Recycled Water Temperature
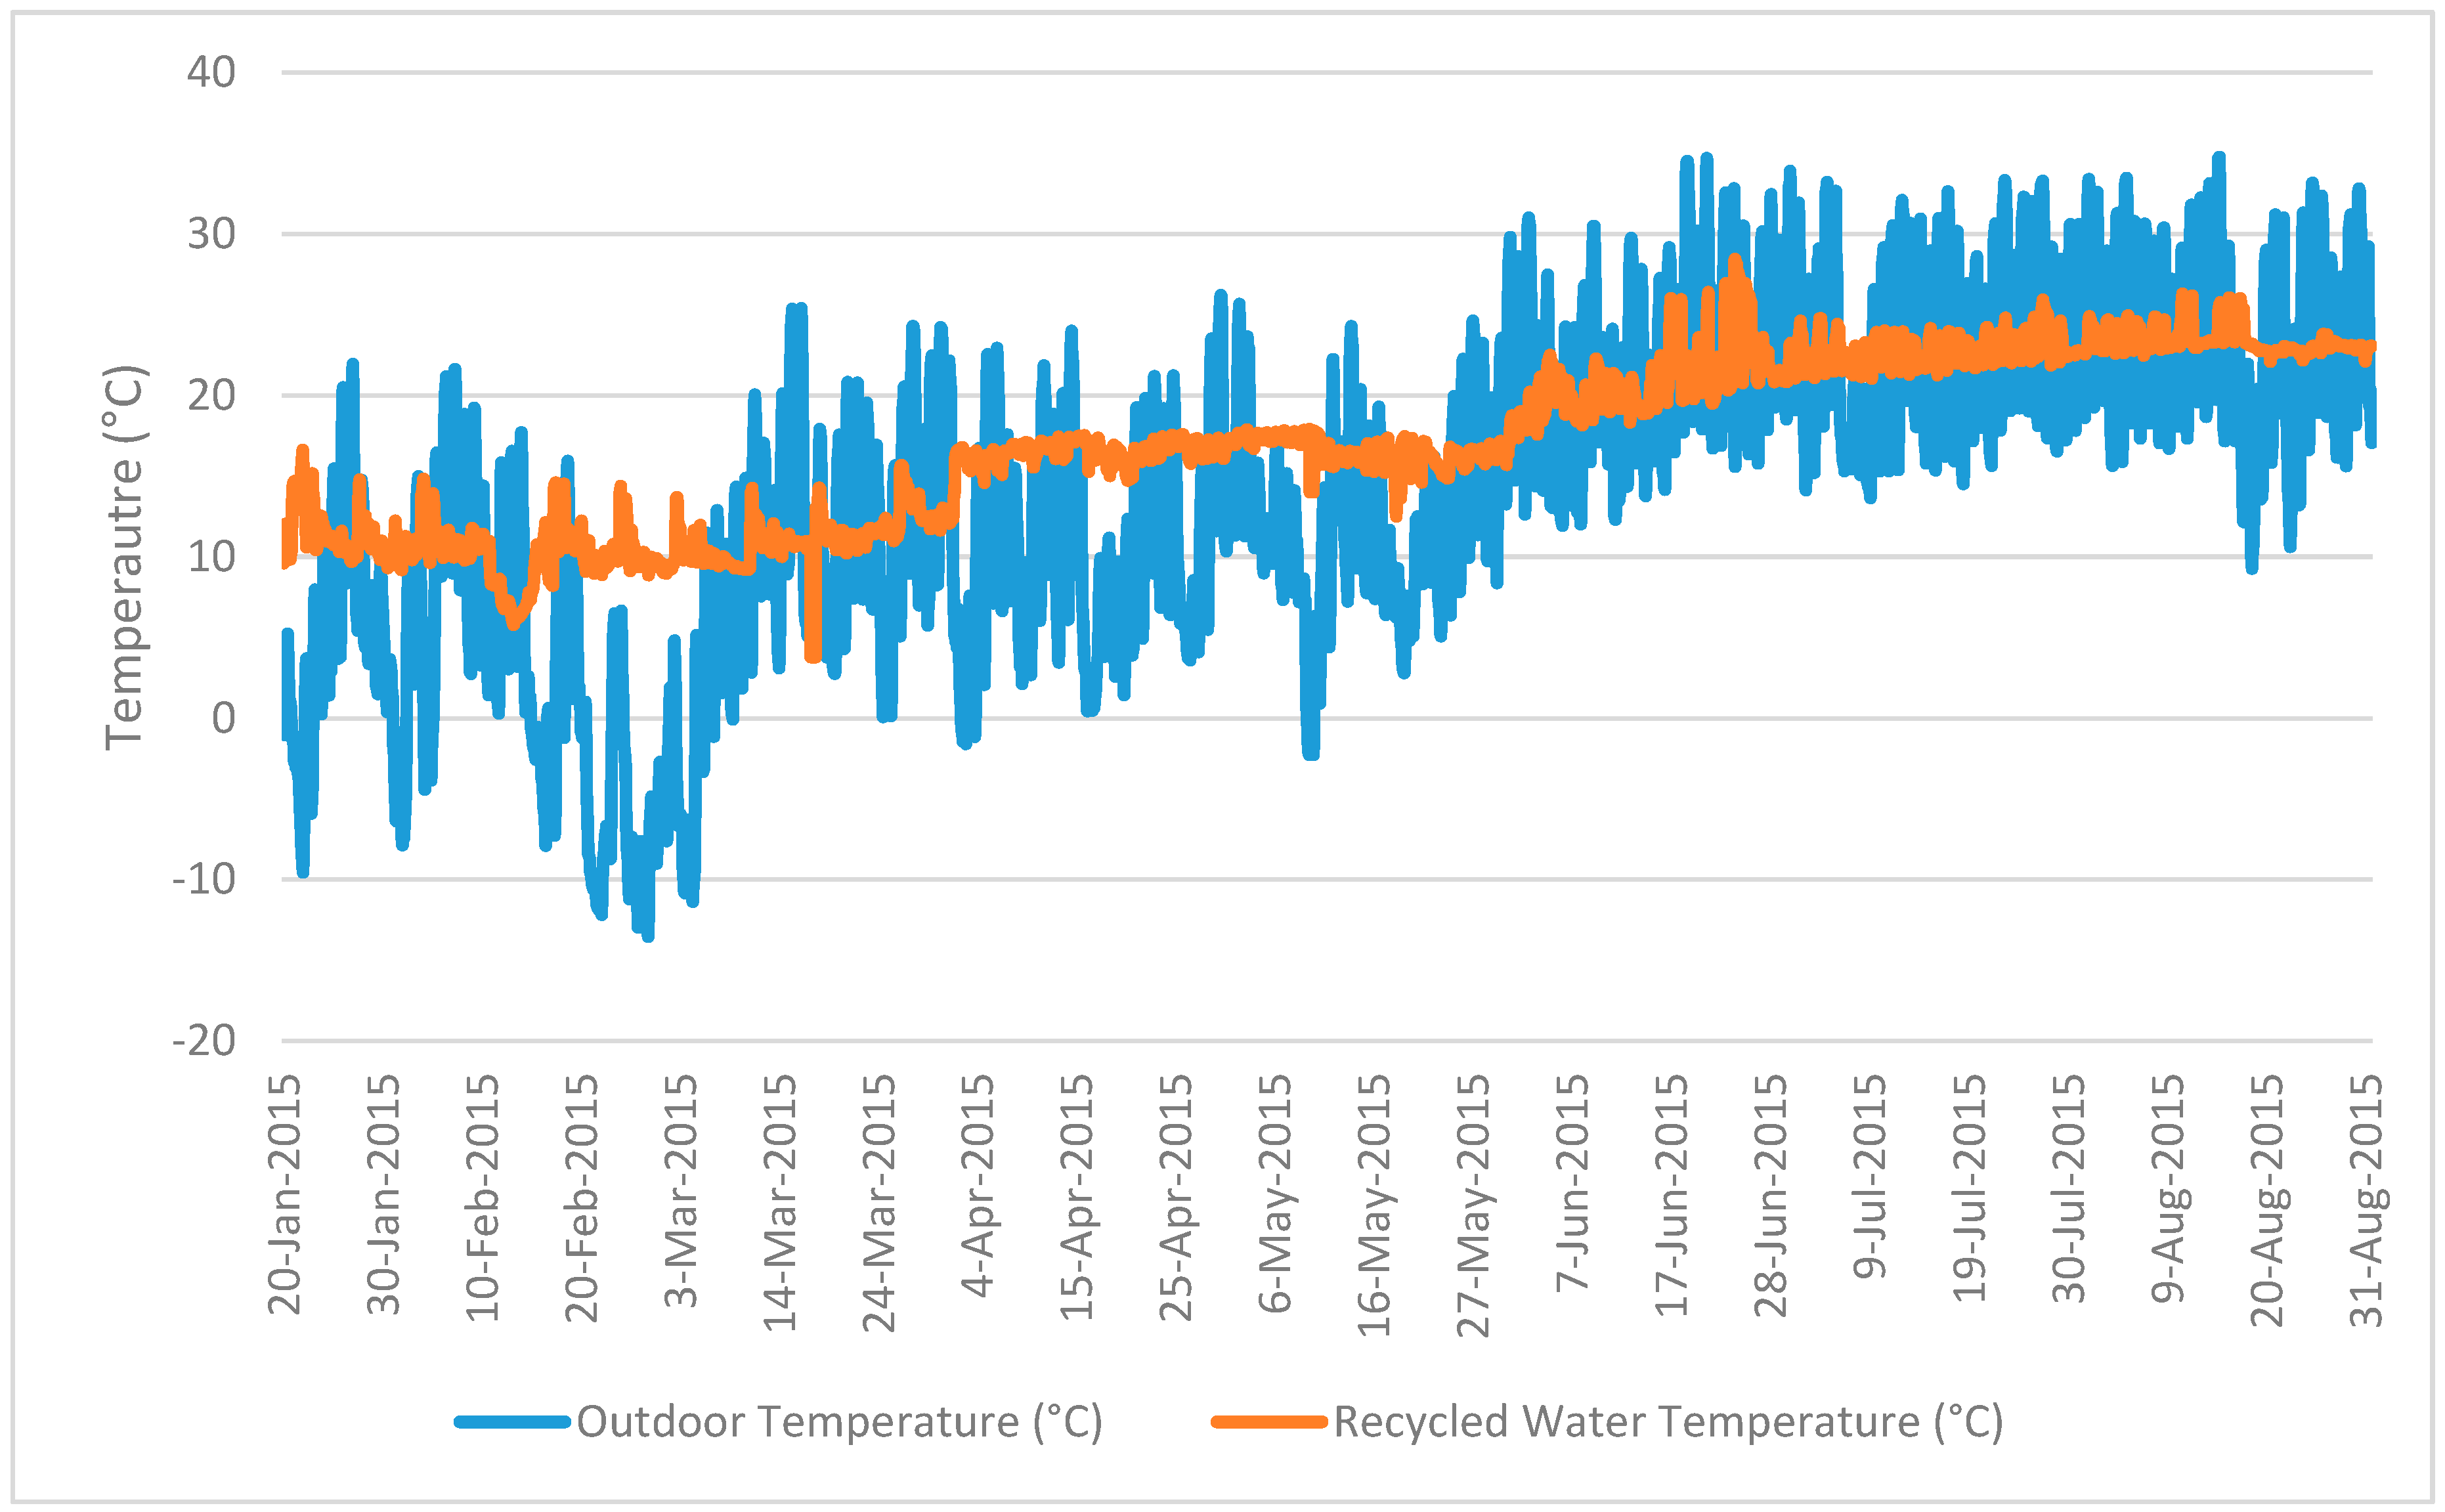
Hourly RW temperatures during the period from January through August 2015 are plotted in Figure 2 along with the hourly outdoor air (OA) temperatures (OATs). As shown in this figure, the RW temperature was relatively stable throughout the monitored period, whereas the OAT fluctuated to a much larger degree during the same period.
Although the monthly average RW and OA dry bulb temperatures during the cooling season (June through August) were close to each other, the OAT fluctuated in a much larger range during each month. The maximum OA dry bulb temperature (indicated as “OAT”) was 34.7 °C during the eight-month period, whereas the maximum RW temperature was 28.4 °C during the same period. On the other hand, the monthly average OA wet bulb temperature at Denver is always below 15.6 °C during the same period, which indicates that a wet cooling tower would be very effective to cool the source water in this climate. The minimum RW temperature (3.8 °C) was much higher than the minimum OAT (−13.6 °C). A closer look at the OA and RW temperatures from July 15 through 17 reveals that, whereas the RW supply temperature (indicated as “TRWS”) was higher than the OAT in the nighttime, it was lower than the OAT in the daytime when cooling demands were high (see the upper chart in Figure 3). Since a lower heat sink temperature will lead to higher cooling efficiency in a heat pump, using RW as a heat sink during the daytime can result in lower cooling energy consumption than using OA. Furthermore, as shown in the lower chart of Figure 3, TRWS was higher than OAT all the time during typical days in winter (20–22 January), which indicates that RW is a better heat source than OA.
3.2. Heat Flow Analysis
Heat flows from the various heat sinks and sources in the source water loop were analyzed to quantify their contributions. The heat flow of each component in the source water loop was calculated based on the measured flow rate and temperature differential across a component. Figure 4 shows the monthly heat flows, which are grouped into two categories: heat extracted from the various heat sources (with positive values) and heat rejected to various heat sinks (with negative values). As can be seen in this figure, the heat flows demonstrated two different patterns. During heating season (i.e., December 2014 through May 2015), most heat (~70%) was extracted from the precooling loop, and the rest was extracted from the RW and the steam HX. To control relative humidity in this building at around 50% year-round, the return air in the AHUs is cooled to 12.8 °C first and then it is reheated to the design supply air temperature (around 35 °C). Therefore, there is significant cooling load even in winter. The heat removed from the return air (i.e., the cooling load) by the precooling loop is added to the source water loop. As a result, 70% of the heat added to the source water loop is provided by the precooling loop. On the other hand, while most of the heat that was added to the source water loop was used by the WWHPs to generate HW, a fair amount of heat was rejected to the cooling tower and the RW. The purpose of this heat rejection was to make the source water cool enough to precool the air in the AHUs.
In contrast, during cooling season (June through August 2015), roughly an equal amount of heat was rejected by the WWHPs (i.e., the condensing heat from the cooling operation of the WWHPs) and the precooling loop. Only a small amount of heat was extracted from the RW. Most of the heat (~60–70%) added to the source water was rejected to the ambient air by the wet cooling tower and about 20–30% of the heat was rejected to the RW. The rest was used by the WWHPs when they ran in heating mode.
3.3. Temperature Control in the Hot Water Loop
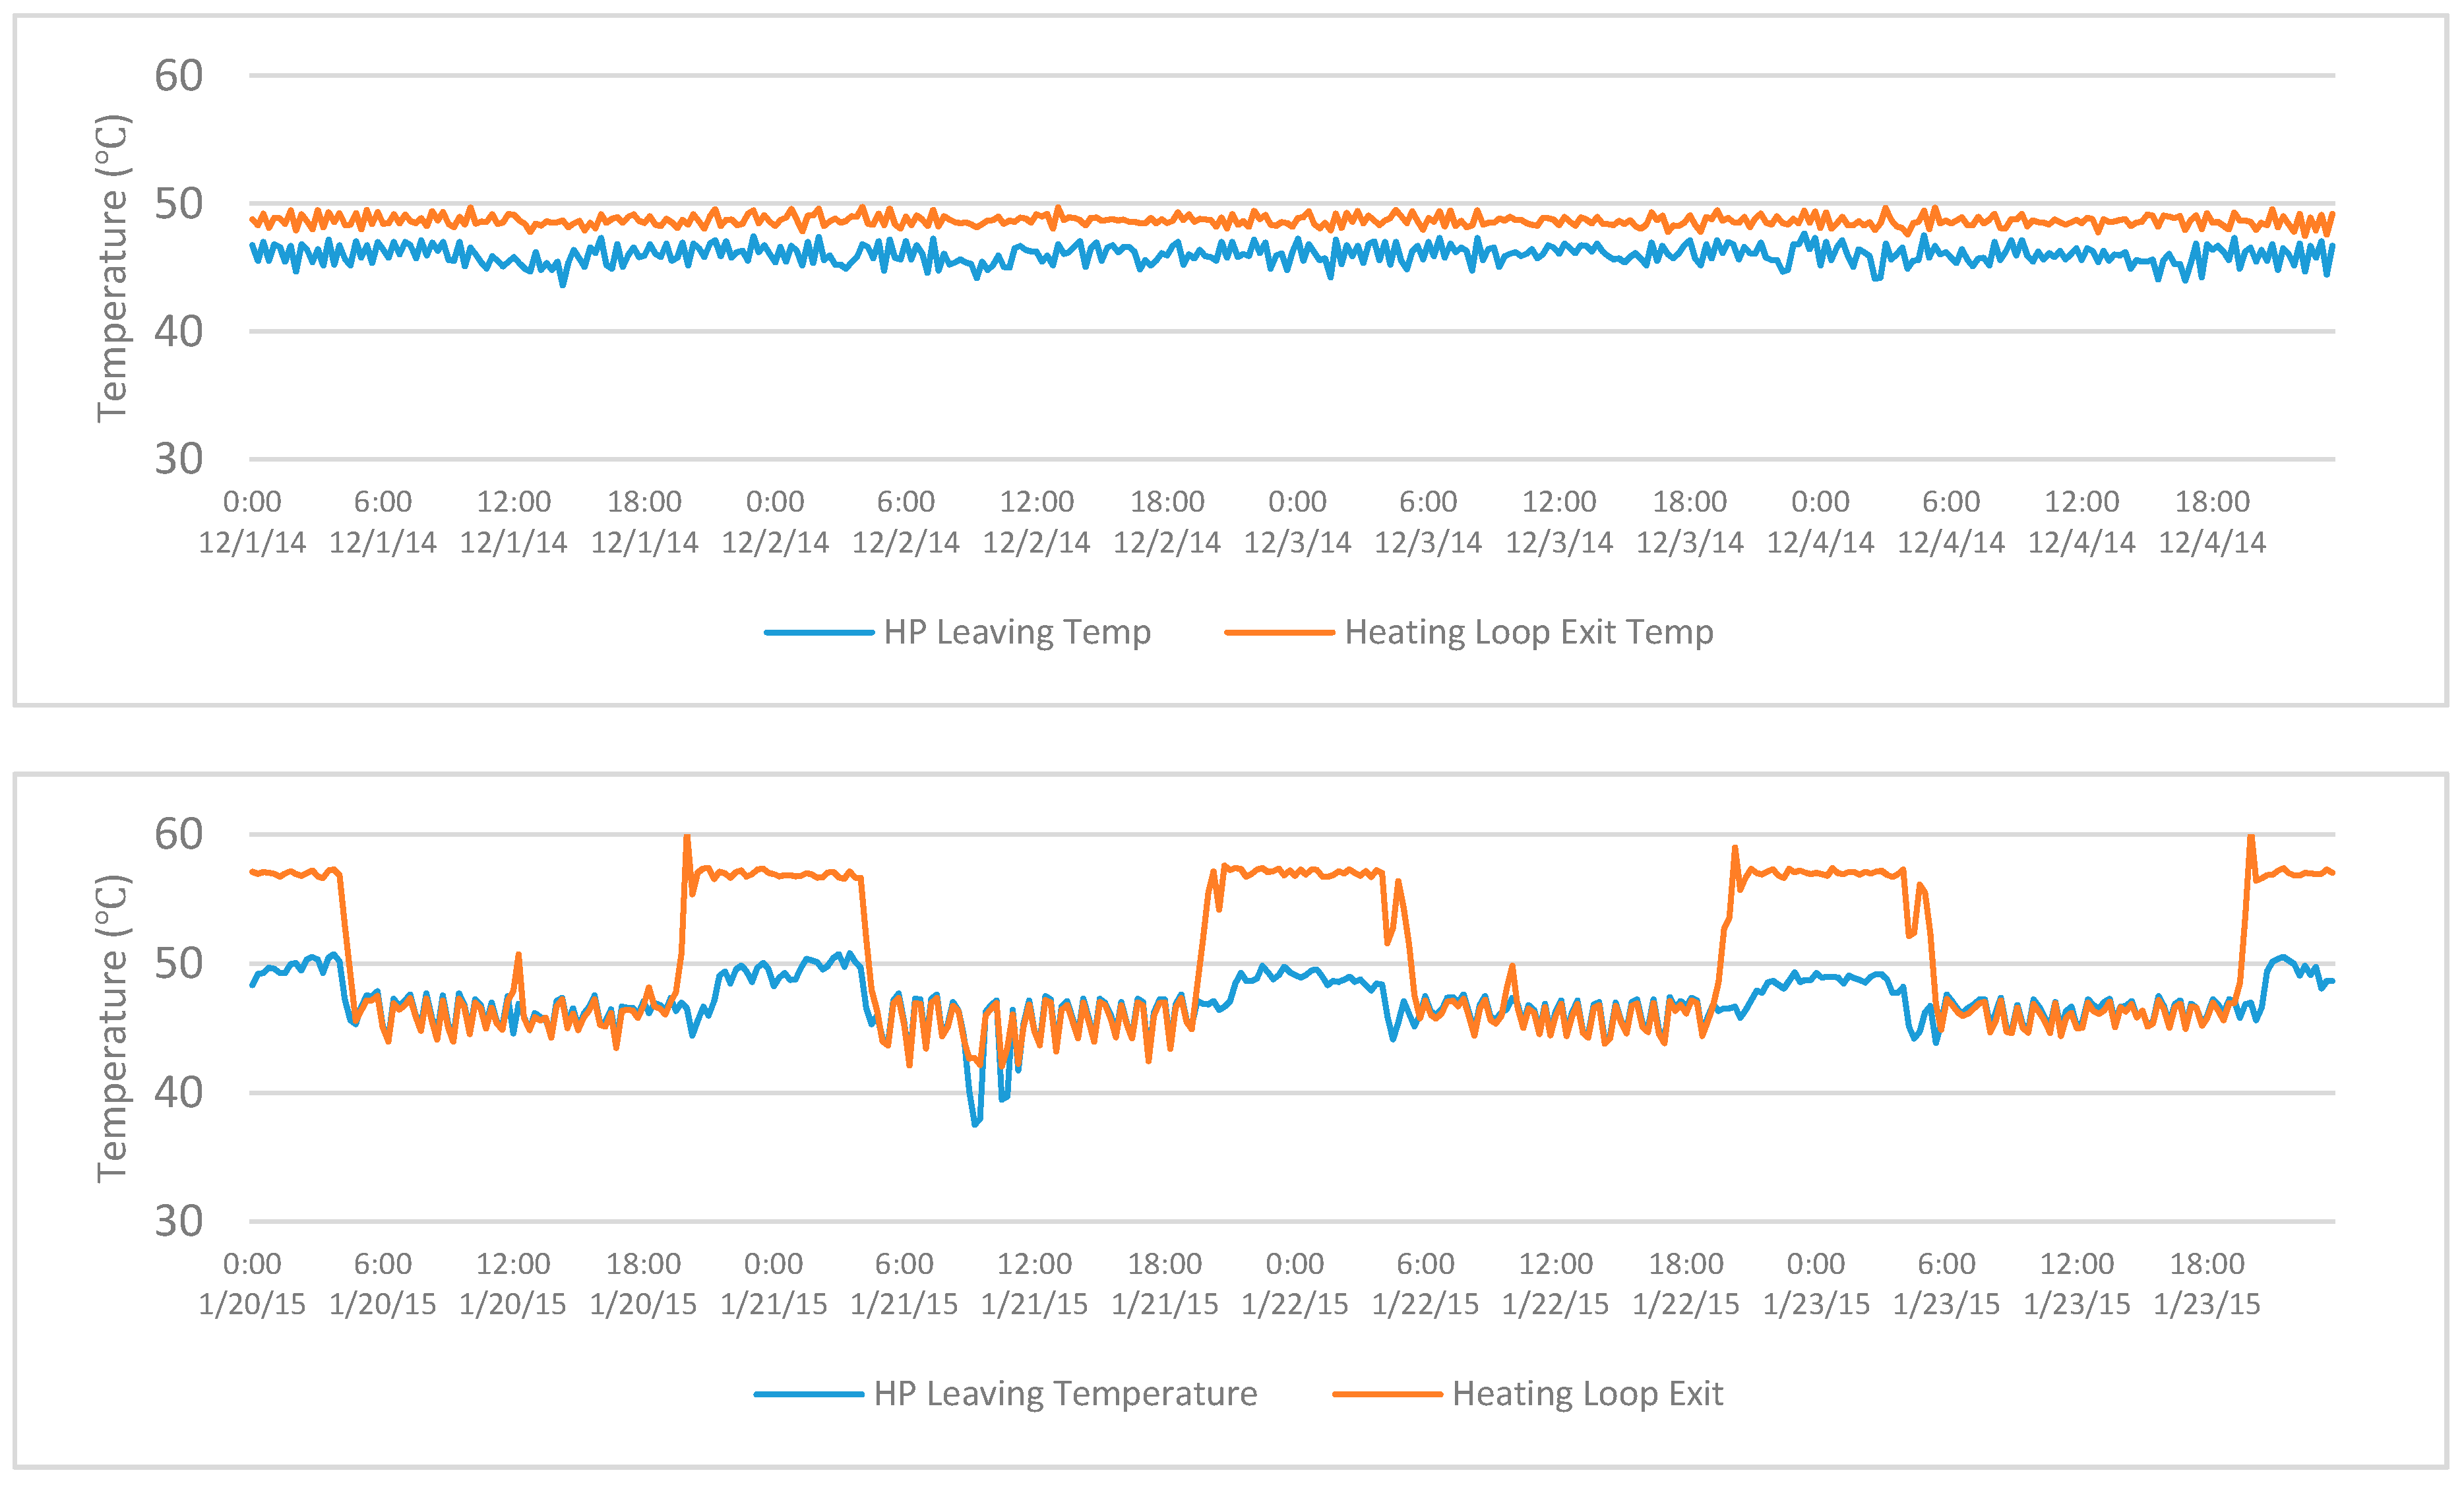
The control strategy for the steam HX in the hot water loop and the load-side leaving water temperature (LWT) of the WWHP was changed on 15 January 2015. Figure 5 shows the load-side LWT of the WWHP and the hot water loop supply temperature in typical days before and after changing the control strategy. As shown in Figure 5, before the control was changed, the WWHP constantly provided hot water at about 46 °C, and the steam HXs at the downstream of the WWHP further raised the HW supply temperature to about 49 °C. Since January 2015, the setpoint of the load-side LWT was raised to 52 °C to maintain the temperature of some vestibule zones and the HW supply temperature was reset based on the AHU heating valve position. The HW supply temperature could be reset to as higher as ~57–60 °C. Such a high supply temperature resulted in a return temperature that is higher than the allowed entering water temperature to the WWHP, which triggered the high-pressure protection and shut off the WWHP.
Figure 6 shows nearly constant heat output from the steam HXs when the OA temperature was below 10 °C before the control was changed. In contrast, after the control change, the heat output from the steam HXs increased when OA became cooler (i.e., heating demand became higher).
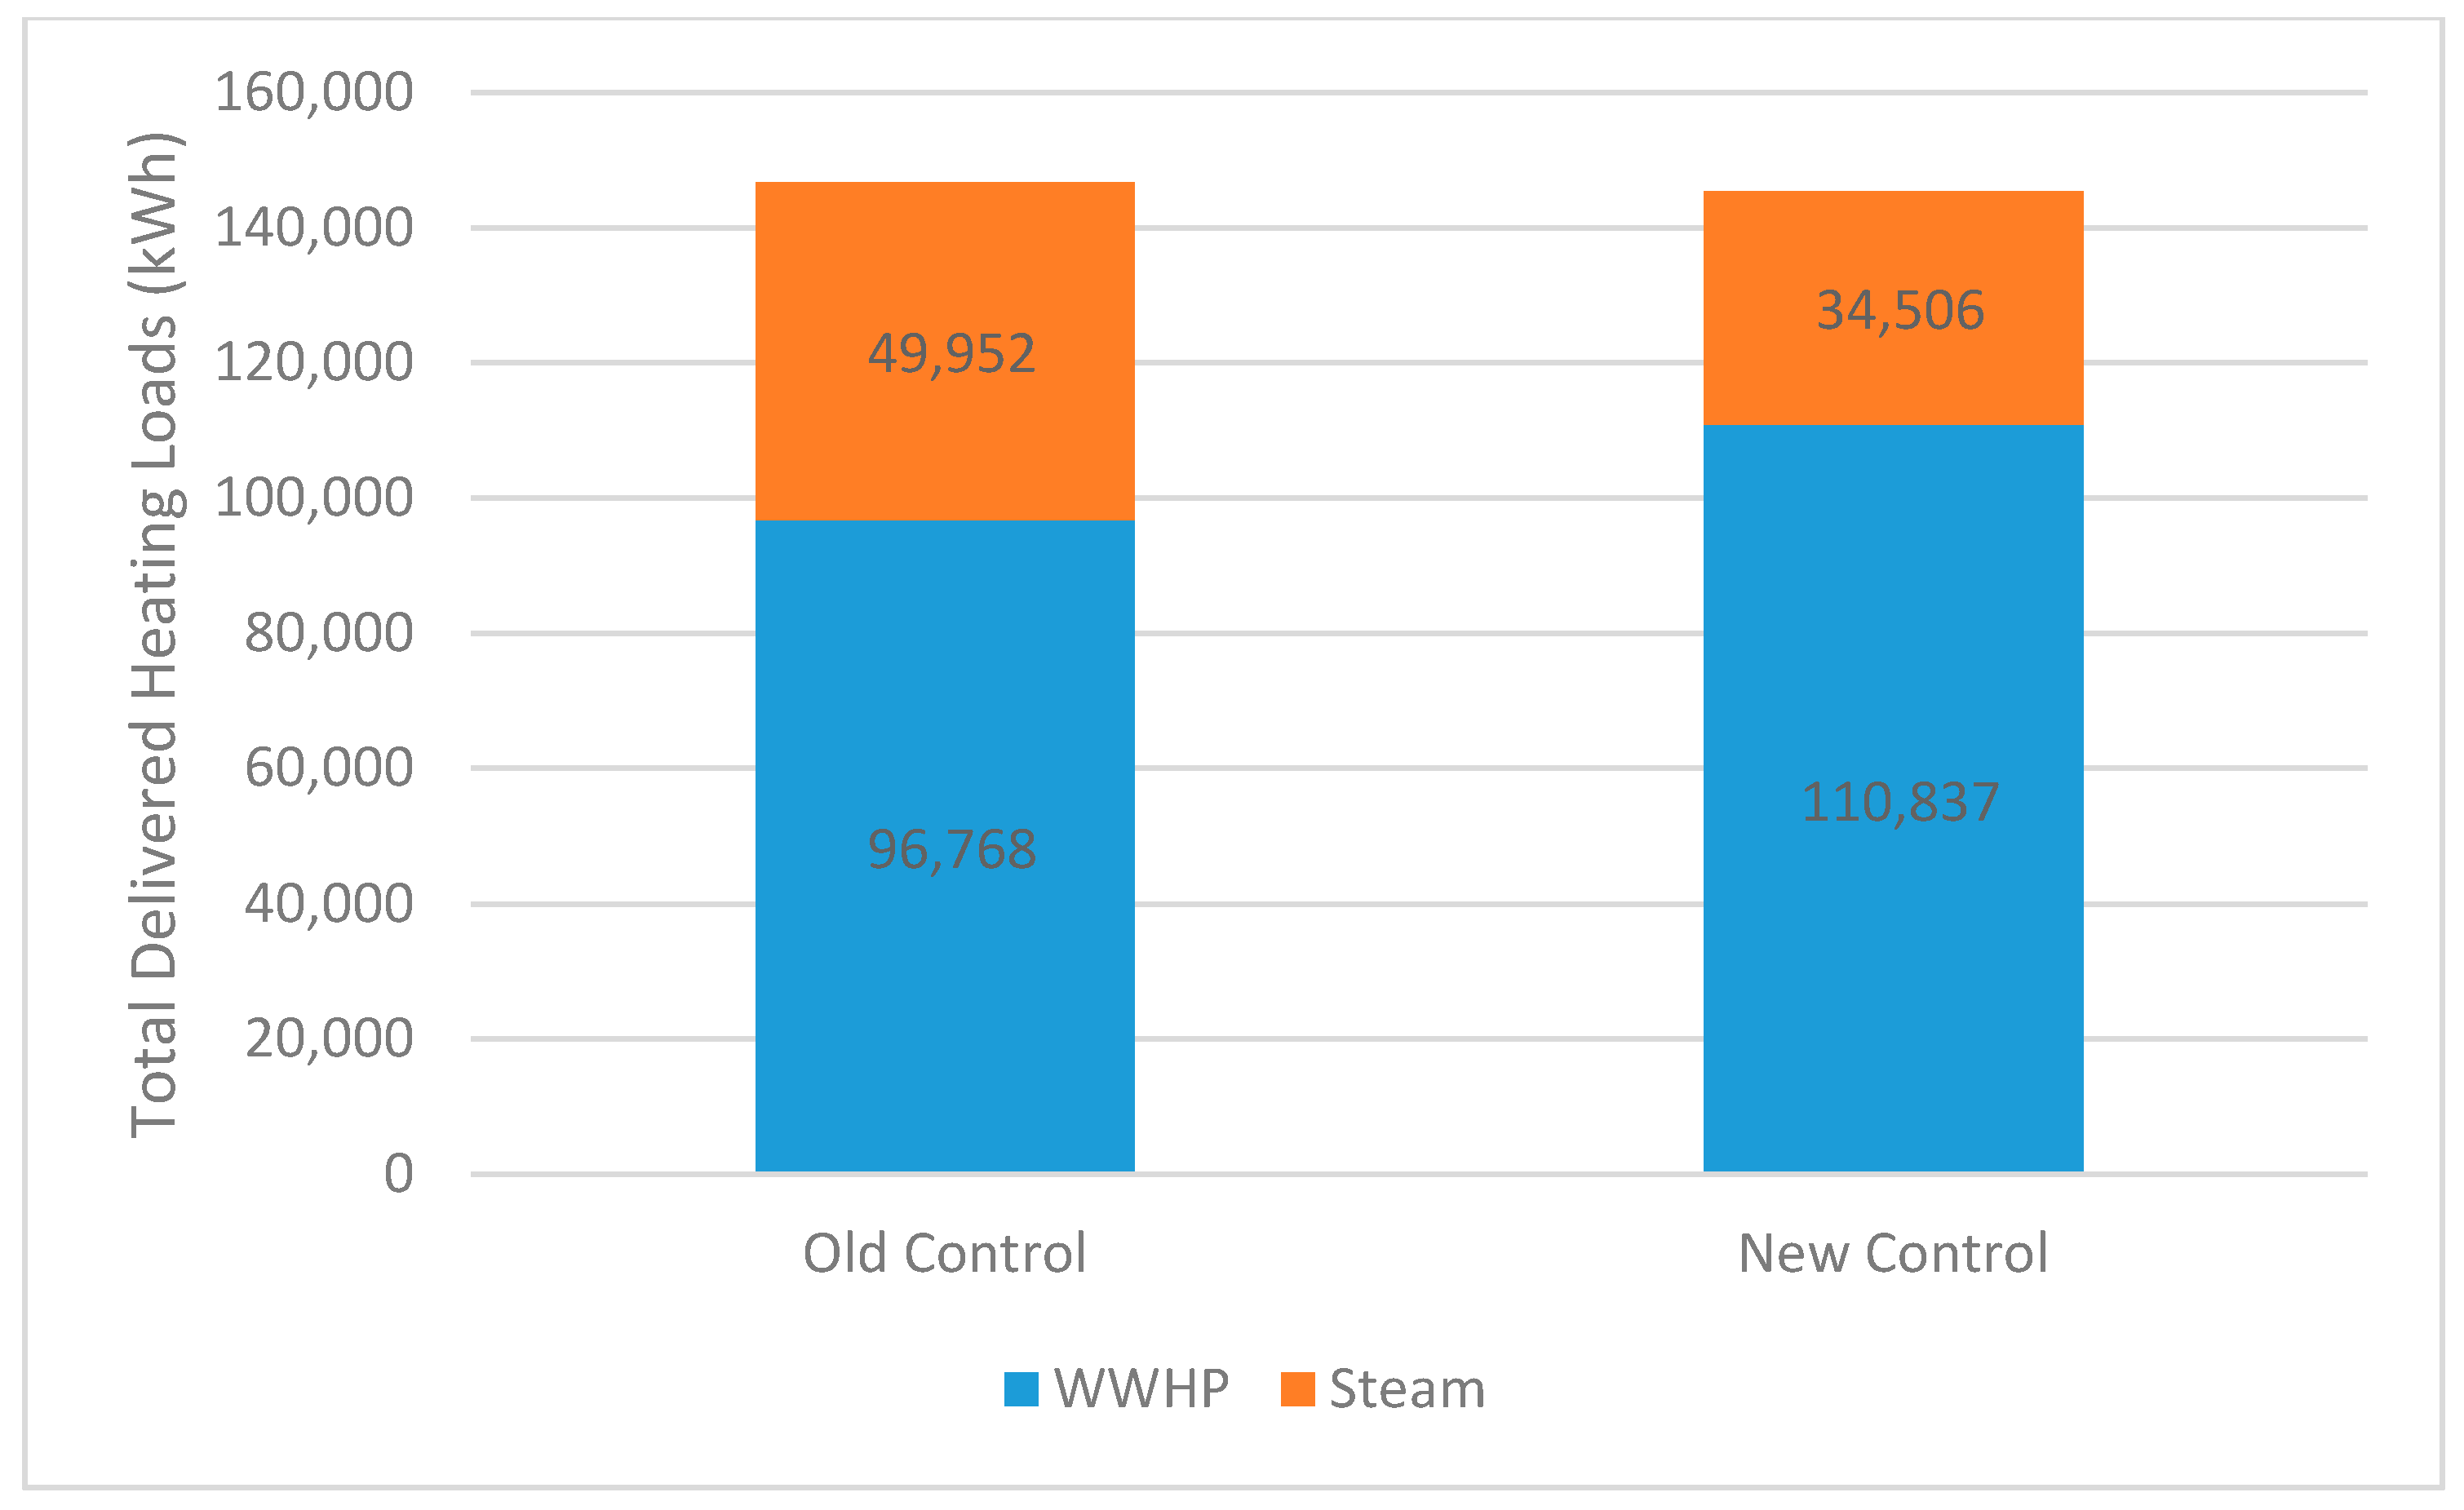
The impacts of the two different control strategies were analyzed in terms of source energy consumptions and operating costs. Based on the measured data before the control change, the daily heating outputs of the WWHP and the steam HXs were plotted in Figure 7. A set of correlations between the heating outputs and the OA temperature were derived with a curve-fit regression. These correlations were then used to estimate the heating outputs of the WWHP and the steam HXs from 20 January through 28 February should the original control were still in place. Figure 8 compares the outputs of the WWHP and the steam HXs resulting from the two different controls. As shown in Figure 8, the total heating outputs resulting from the two controls are close to each other, but the contributions between the WWHP and steam HXs are different. With the new control strategy, the contribution of WWHP increases from 66% to 76% of the total heating output, and the contribution of the steam HXs decreases accordingly.
The estimated outputs from WWHP and steam HXs are used to calculate the associated source energy consumptions and the energy costs. Table 2 presents the total electricity and natural gas use resulting from the two different controls during 20 January through 28 February. It shows that the new control saves about 5% in energy cost and 10% in source energy consumption. The relatively lower cost savings is due to inexpensive natural gas price ($4.84/GJ) in 2014–15 paid by the museum.
If the HW supply temperature setpoint used in the new control were lower, the contribution of the WWHP would have been larger, and so does the energy cost saving. Further investigation of potential adjustment to the HW temperature reset control is recommended.
3.4. System COP Analysis
The modular WWHP provided simultaneous heating and cooling, but only the total power consumption of the WWHP was measured. Therefore, the effective Coefficient of Performance (COP), which is a performance metric for evaluating the energy efficiency of combined heating and cooling operation, was calculated with Equations (1) and (2) for the WWHP and the entire RWHP system, respectively, based on the cumulative heating and cooling outputs of the WWHP (excluding the outputs of the two steam HXs in the HW loop), and the associated power consumptions during the 8 months period encompassed in this study. To account for the supplemental heat added to the source water loop by the steam HX, the same amount of heat was subtracted from the effective heating provided by the RWHP system, as expressed in Equation (2).
where
WWHPCOP = (QCL + QHL)/WHP1–7
- WWHPCOP = Effective COP of the WWHP unit (Unit COP)
- QHL = Heating output from the modular WWHP (kWh)
- QCL = Cooling output from the modular WWHP (kWh)
- WHP1–7 = Power consumption of the modular WWHP (kWh)
RWHPCOP = (QCL + QHL − QSP1)/(WHP1–7 + WRWP + WCT + WSLP)
- RWHPCOP = Effective COP of the RWHP system (System COP)
- QSP1 = Supplemental heat added to the source water loop by the steam HX (kWh)
- WRWP = Power consumption of recycled water loop pumps (kWh)
- WCT = Power consumption of cooling tower (kWh)
- WSLP = Power consumption of source loop pumps (kWh)
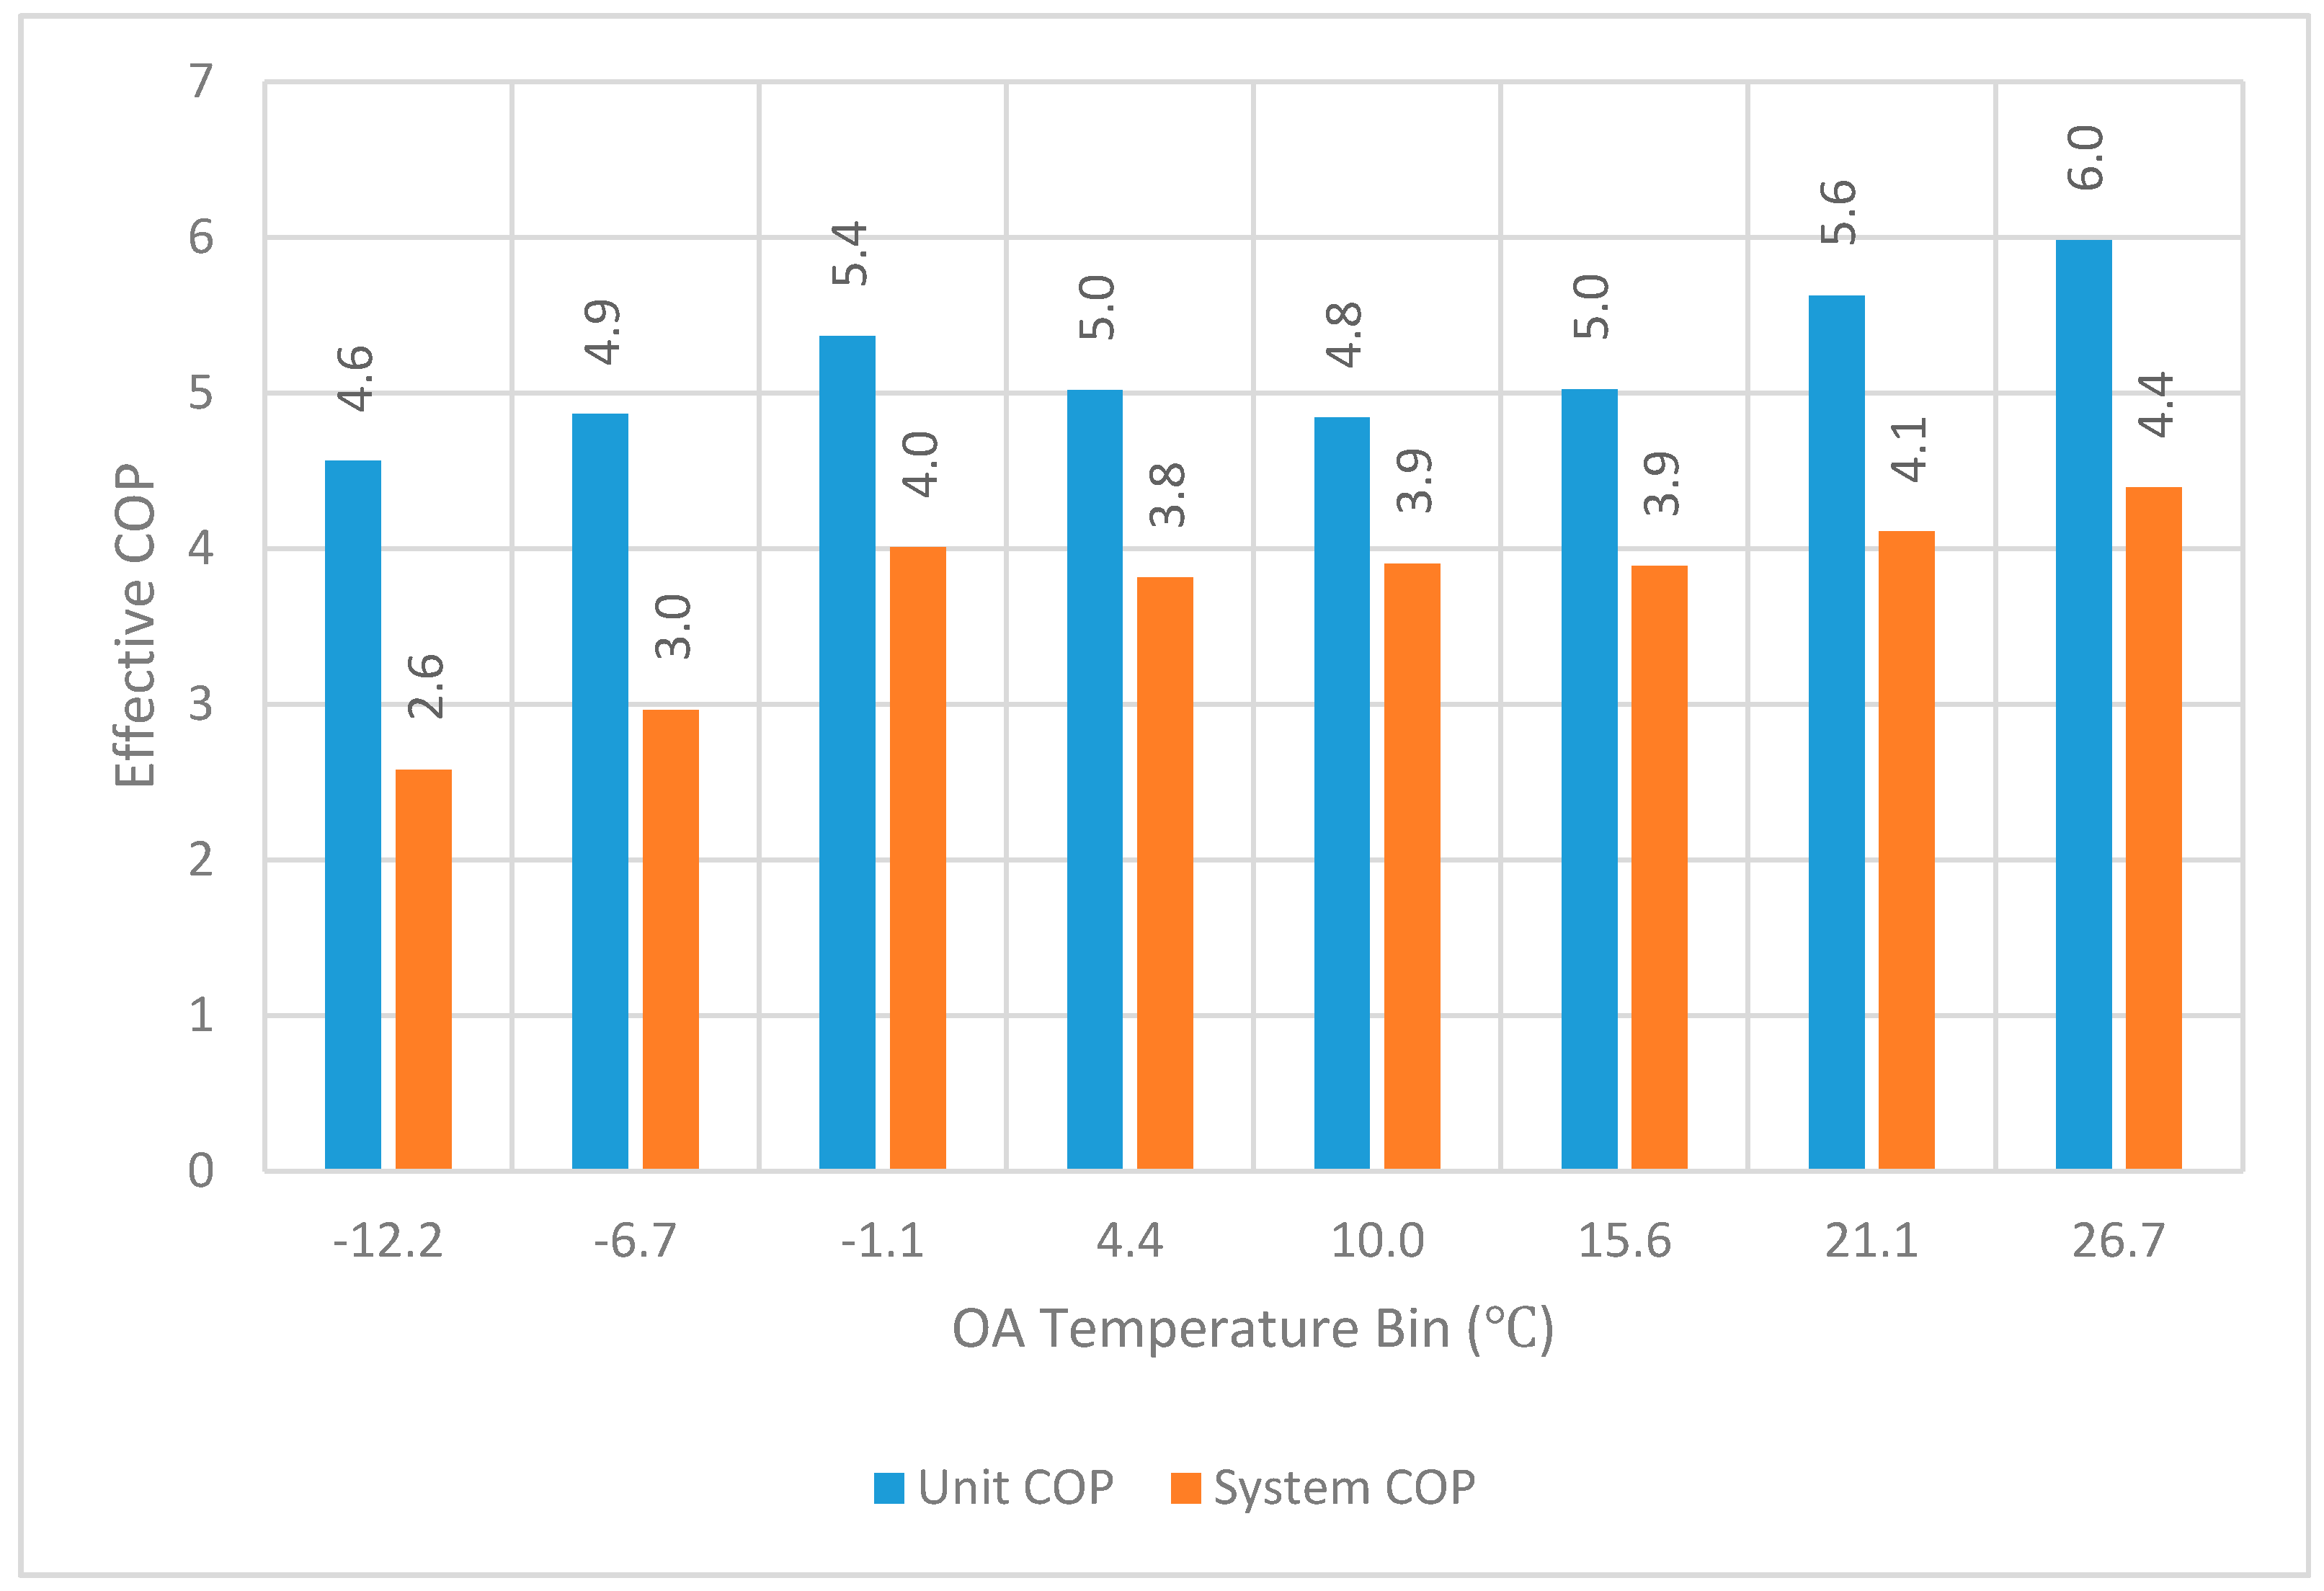
The effective COPs of the WWHP unit and the RWHP system are calculated based on measured data (with 15-min interval) from December 2014 through August 2015. They were grouped based on their coincidental OAT value. The effective COPs that are shown in Figure 9 are the average value of the COPs within each 5.5 °C bin of the OAT (e.g., from −12.2 °C to −6.7 °C) as indicated by values of the horizontal axis in Figure 9. It shows, in general, the effective COP increases with the increase in OAT. The effective COP of the WWHPs was about 5.6–6.0 when the OAT is higher than 21 °C (i.e., when most modules of the WWHP ran in cooling mode). This is consistent with the manufacturer’s catalog data, which indicates that the cooling COP of the WWHP ranges within 5.9–6.2 under similar operating conditions (i.e., 24 °C water entering condenser and 7 °C water leaving evaporator). The effective COP of the entire RWHP system—which accounts for the supplemental heat input from the steam HX in the source loop, as well as the power consumptions of the cooling tower, the RW pump, and the source loop pumps—rose from 2.6 to 4.4 with the increase in OAT, which is coincidental with the increased simultaneous heating and cooling operation of the WWHP. As introduced earlier in Section 3.2, to control humidity in the building, the return air is cooled down below its dew point, and then reheated to the design supply air temperature. When OAT is very low, the cooling demand is minimal and most modules of the WWHP run in heating mode and the steam HX in the source water loop provides supplemental heating to maintain the source water temperature not below 10 °C. However, when OAT increases, the simultaneous cooling (for dehumidification) and heating (for reheat) demands increase so that some of the modules run in cooling mode, while some other modules run in heating mode. Since all of the modules exchange heat with the source water loop, the heat extraction and addition to the source water loop is offset and the source water temperature is maintained within the desired range without running the steam HX in the source water loop. Therefore, the system COP is increased.
3.5. Energy and Cost Savings Potential
To estimate the energy saving potential of the RWHP system, the energy consumption of a conventional VAV system using a water-cooled chiller and a natural gas boiler was calculated as a baseline for providing the same heating and cooling outputs as the RWHP system. The energy efficiency of the chiller and the boiler used in the baseline were the minimum values allowed by ASHRAE 90.1-2013 [13]. The following are the major assumptions for calculating the baseline energy consumption and energy savings:
- It is assumed that there is no difference in the power consumption of the source loop pumps, CHW loop pumps, and HW loop pumps between the baseline and the RWHP systems.
- The water-cooled chiller has a nominal cooling COP of 5.54. A generic performance curve for water-cooled chillers was adopted from the DOE-2 program [14], and used to calculate the chiller power consumption for providing the same hourly cooling output as the RWHP system (including outputs from both the precooling and CHW loops).
- The natural gas fired boiler has a thermal efficiency of 80% and provides the same hourly heating outputs as both the WWHPs and the steam HXs in the HW loop.
- The cooling tower power consumption of the baseline system is calculated based on the average heat rejection efficiency of a typical cooling tower, which depends on the average wet-bulb temperature in each month.
- Average utility rates obtained from 2014 and 2015 utility bills were used for energy cost calculations. The average electricity rate is $0.076/kWh and the natural gas rate is $4.84/GJ.
The source energy consumption and carbon emissions of the two systems were calculated based on the measured consumption of electricity and natural gas by the RWHP system and the simulation-predicted electricity and natural gas consumption of the baseline system. The site-source energy conversion factors and the emission factors of electricity and natural gas suggested by Deru and Tocellini [15] were used in the calculations. Table 2 shows the annual performance comparison between the baseline and the RWHP systems. The analysis shows that the total annual energy cost savings would be $16,295 (34% savings), and CO2 emission reductions that were associated with the energy savings would be approximately 41%.
For the eight months encompassed in this study, the RWHP system saved 2376 GJ of source energy (a 47% savings) and $11,386 in energy costs (a 37% reduction) when compared with the baseline system. When considering the costs associated with using RW ($0.0206 per 1000 L of RW passing though the heat exchanger) and additional cooling tower make-up water for the baseline system, which are about $807 and $500, respectively, the operating cost savings of the RWHP system is $10,157 (33% savings).
Because the available measured data cover only eight months, the energy use of the two systems during the rest of a 1-year period (September through December 2014) was estimated to assess the annual energy savings potential of the RWHP system. The results are listed in Table 3. The estimation procedure included two steps:
- Derive correlations between the monthly energy use of each major component of the two systems and the monthly average OAT based on available data from January through August in 2015
- Estimate the energy use of the two systems with the derived correlations and the historical OAT data from September through December 2014.
Table 4 compares the itemized costs of both the RWHP system and the baseline HVAC system. The normalized cost of the RWHP system (including the AHUs and the ductwork system inside the building) is $7203/kW of the installed cooling capacity, or $420/m2 of building floor space. With the achieved annual energy cost savings, the simple payback for this system is about 58 years. This long payback period is due to the high cost ($1.1 million) of constructing the 1006 m long two-way pipeline to access the RW, which contributes most to the cost premium between the RWHP system and the baseline system. If the length of the pipeline were 305 m, the cost premium would have been reduced significantly from $946,316 to $179,649 and thus the simple payback would have been shortened to 11 years.
4. Conclusions and Discussion
This paper presents performance characterization results of a RWHP system, which uses the recycled water from a municipal water system as a heat sink and heat source for heat pumps. The annual energy consumption of the RWHP system was compared with that of a baseline system—a conventional variable-air-volume system using a water-cooled chiller and a natural gas fired boiler, both of which meet the minimum energy efficiencies allowed by ASHRAE 90.1-2013. The energy performance and cost effectives of the RWHP system, as well as the lessons learned from this study, are provided below.
4.1. Energy Performance and Cost-Effectiveness
- The measured RW temperatures from the demonstration site during the encompassed period show that RW was more favorable than OA for effective operation of the WWHPs. The maximum OAT was about 35 °C during the cooling season, whereas the maximum RW temperature was about 28.4 °C. The lowest RW temperature was about 3.8 °C during the heating season, whereas the lowest OAT was below −12 °C.
- Effective COPs of the WWHPs and of the entire RWHP system, which account for the simultaneous cooling and heating, were calculated based on the measured data. The effective COP of the WWHPs ranged from 4.6 to 6.0, whereas the effective COPs of the RWHP system ranged from 2.6 to 4.4 during the eight-month investigative period of this study. The system COP increased with the increase in OAT, which is in part a result of the increased simultaneous heating and cooling demands for precisely control the humidity and temperature in the building.
- The demonstrated RWHP system saved 4298 GJ of source energy (a 50.0% savings) and $16,295 in energy costs (a 33.8% savings) annually, when compared with a conventional VAV system using a water-cooled chiller and a natural gas–fired boiler, both of which meet the minimum energy efficiencies allowed by ASHRAE 90.1-2013. The energy savings also resulted in 204,980 kg reduction (a 41% reduction) in CO2 emissions.
- The simple payback period of this system is about 58 years. However, if the length of the pipeline for accessing the RW were shortened from 1006 m to 305 m, the cost premium between the RWHP system and the baseline system would have been reduced significantly and thus the simple payback would have been only 11 years.
4.2. Lessons Learned
- The contribution of RW in the studied RWHP system is less than expected. The run-around heat recovery through the precooling loop was very effective and significantly reduced the demand for external heat sources (e.g., the RW and the steam HX). The wet cooling tower rejected more heat than the RW because of the relatively dry air in the Denver area.
- The supplemental heating of the studied RWHP system was oversized. Measured data indicated that the contributions of the steam HXs were very small, and it is likely that the RWHP system could work well without the boiler and the steam HXs, or with just a smaller water heater as a backup. Such a configuration would reduce the complexity and the associated cost of the RWHP system.
- The cost effectiveness of the RWHP system depends on the construction cost of the pipeline for accessing the RW. The RWHP system would have been economically more competitive if the RW were closer to the building.
Acknowledgments
The authors thank the Emerging Technologies Program of the Buildings Technology Office at the U.S. Department of Energy for supporting this research project.
Author Contributions
Hugh Henderson collected performance data from Denver Museum of Nature & Science and did a preliminary analysis; Piljae Im and Xiaobing Liu conducted an in-depth analysis for the recycled water heat pump system based on the collected data and other additional information provided by Denver Museum of Nature & Science.
Conflicts of Interest
The authors declare no conflicts of interest.
Disclaimer
This manuscript has been coauthored by UT-Battelle, LLC under Contract No. DE-AC05-00OR22725 with the U.S. Department of Energy. The United States Government retains and the publisher, by accepting the article for publication, acknowledges that the United States Government retains a non-exclusive, paid-up, irrevocable, world-wide license to publish or reproduce the published form of this manuscript, or allow others to do so, for United States Government purposes. The Department of Energy will provide public access to these results of federally sponsored research in accordance with the DOE Public Access Plan (http://energy.gov/downloads/doe-public-access-plan).
Acronyms
| AHU | air handler unit |
| COP | Coefficient of Performance |
| DHW | domestic hot water |
| DMNS | Denver Museum of Nature & Science |
| GSHP | ground-source heat pump |
| HVAC | heating, ventilation, and air-conditioning |
| HW | hot water |
| HX | heat exchanger |
| LWT | leaving water temperature |
| OA | outdoor air |
| OAT | outdoor air temperature |
| RW | recycled water |
| RWHP | recycled water heat pump |
| TRWS | recycled water supply temperature |
| TSL | source loop temperature |
| VAV | variable air volume |
| VFD | variable frequency drive (VFD) |
| WB | wet bulb |
| WWHP | water-to-water heat pump |
References
- Cipolla, S.; Maglionico, M. Heat recovery from urban wastewater: Analysis of the variability of flow rate and temperature in the sewer of Bologna, Italy. In ATI2013—68th Conference of the Italian Thermal Machines Engineering Association; Elsevier: Amsterdam, The Netherlands, 2014. [Google Scholar]
- DOE (Department of Energy). Heat Recovery from Wastewater Using Gravity-Film Heat Exchanger; Technology Focus, DOE/EE-0247; DOE: Washington, DC, USA, 2001.
- Finns Homes. Finns Use Waste Water to Heat Homes. 2007. Available online: http://www.reuk.co.uk/Finns-Use-Waste-Water-to-Heat-Homes.htm (accessed on 15 January 2018).
- Heat from Sewage to Energize Paris. 2011. Available online: http://www.triplepundit.com/2011/04/heat-sewage-paris-energy/ (accessed on 15 January 2018).
- Lindstorm, H.O. Experiences with a 3.3 MW heat pump using sewage water as heat source. Heat Recover. Syst. 1985, 5, 33–38. [Google Scholar] [CrossRef]
- Energy from Sewage Water—District Heating and District Cooling in Sandvika, with 2 Unitop® 28C Heat Pump Units. 1989. Available online: http://www.friotherm.com/webautor-data/41/katri_vala_e012_uk.pdf (accessed on 15 January 2018).
- Turku Energia. The Wastewater Utilization in Kakola Heat Pump Plant in Finland. 2009. Available online: http://heikaikkitoimii.fi/en/solutions/renewable_energy/services/greenenergycases/tse_turun_seudun_energiantuotanto_oy_kakola_s_heat_pump_station.8.html (accessed on 15 January 2018).
- Zhou, W.; Li, J. Sewage heat source heat pump system’s application examples and prospect analysis in China. In Proceedings of the International Refrigeration and Air-Conditioning Conference, Purdue, West Lafayette, IN, USA, 12–15 July 2004; Paper No. R016. p. 8. [Google Scholar]
- Nova Thermal Energy Brings Geothermal Heat to the Philly Water Department. Available online: http://www.flyingkitemedia.com/innovationnews/novathermaltowaterco1116.aspx (accessed on 15 January 2018).
- Schmid, F. Sewage Water: Interesting Heat Source for Heat Pumps and Chillers; Swiss Energy Agency for Infrastructure Plants: Zurich, Switzerland, 2008; p. 12. [Google Scholar]
- Hepbasli, A.; Biyik, E.; Ekren, O.; Gunerhan, H.; Araz, M. A key review of wastewater source heat pump (WWSHP) systems. Energy Convers. Manag. 2014, 88, 700–722. [Google Scholar] [CrossRef]
- Im, P.; Liu, X. Case Study for the ARRA-Funded GSHP Demonstration at Denver Museum of Natural and Science; ORNL/TM-2015/473; Oak Ridge National Laboratory: Oak Ridge, TN, USA, 2015. [Google Scholar]
- ASHRAE. Energy Standard for Buildings except Low-Rise Residential Buildings; ANSI/ASHRAE/IES Standard 90.1-2013; American Society of Heating, Refrigerating and Air-Conditioning Engineers: Atlanta, GA, USA, 2013. [Google Scholar]
- Lawrence Berkeley National Laboratory (LBNL); James J. Hirsch & Associates (JJH). DOE-2.2 Documentation Volume 3: Topics. 2006. Available online: http://doe2.com/download/DOE-22/DOE22Vol3-Topics.pdf (accessed on 15 January 2018).
- Deru, M.; Tocellini, P. Source Energy and Emission Factors for Energy Use in Buildings; Technical Report, NREL/TP-550-38617; National Renewable Energy Laboratory: Golden, CO, USA, 2007. [Google Scholar]
- RSMeans. Cost Data Online. 2014. Available online: http://www.rsmeans.com/RSMeans_Online.aspx (accessed on 15 January 2018).
Figure 1.
A schematic of the recycled water heat pump system with measured data points. VFD: variable speed drive.
Figure 1.
A schematic of the recycled water heat pump system with measured data points. VFD: variable speed drive.
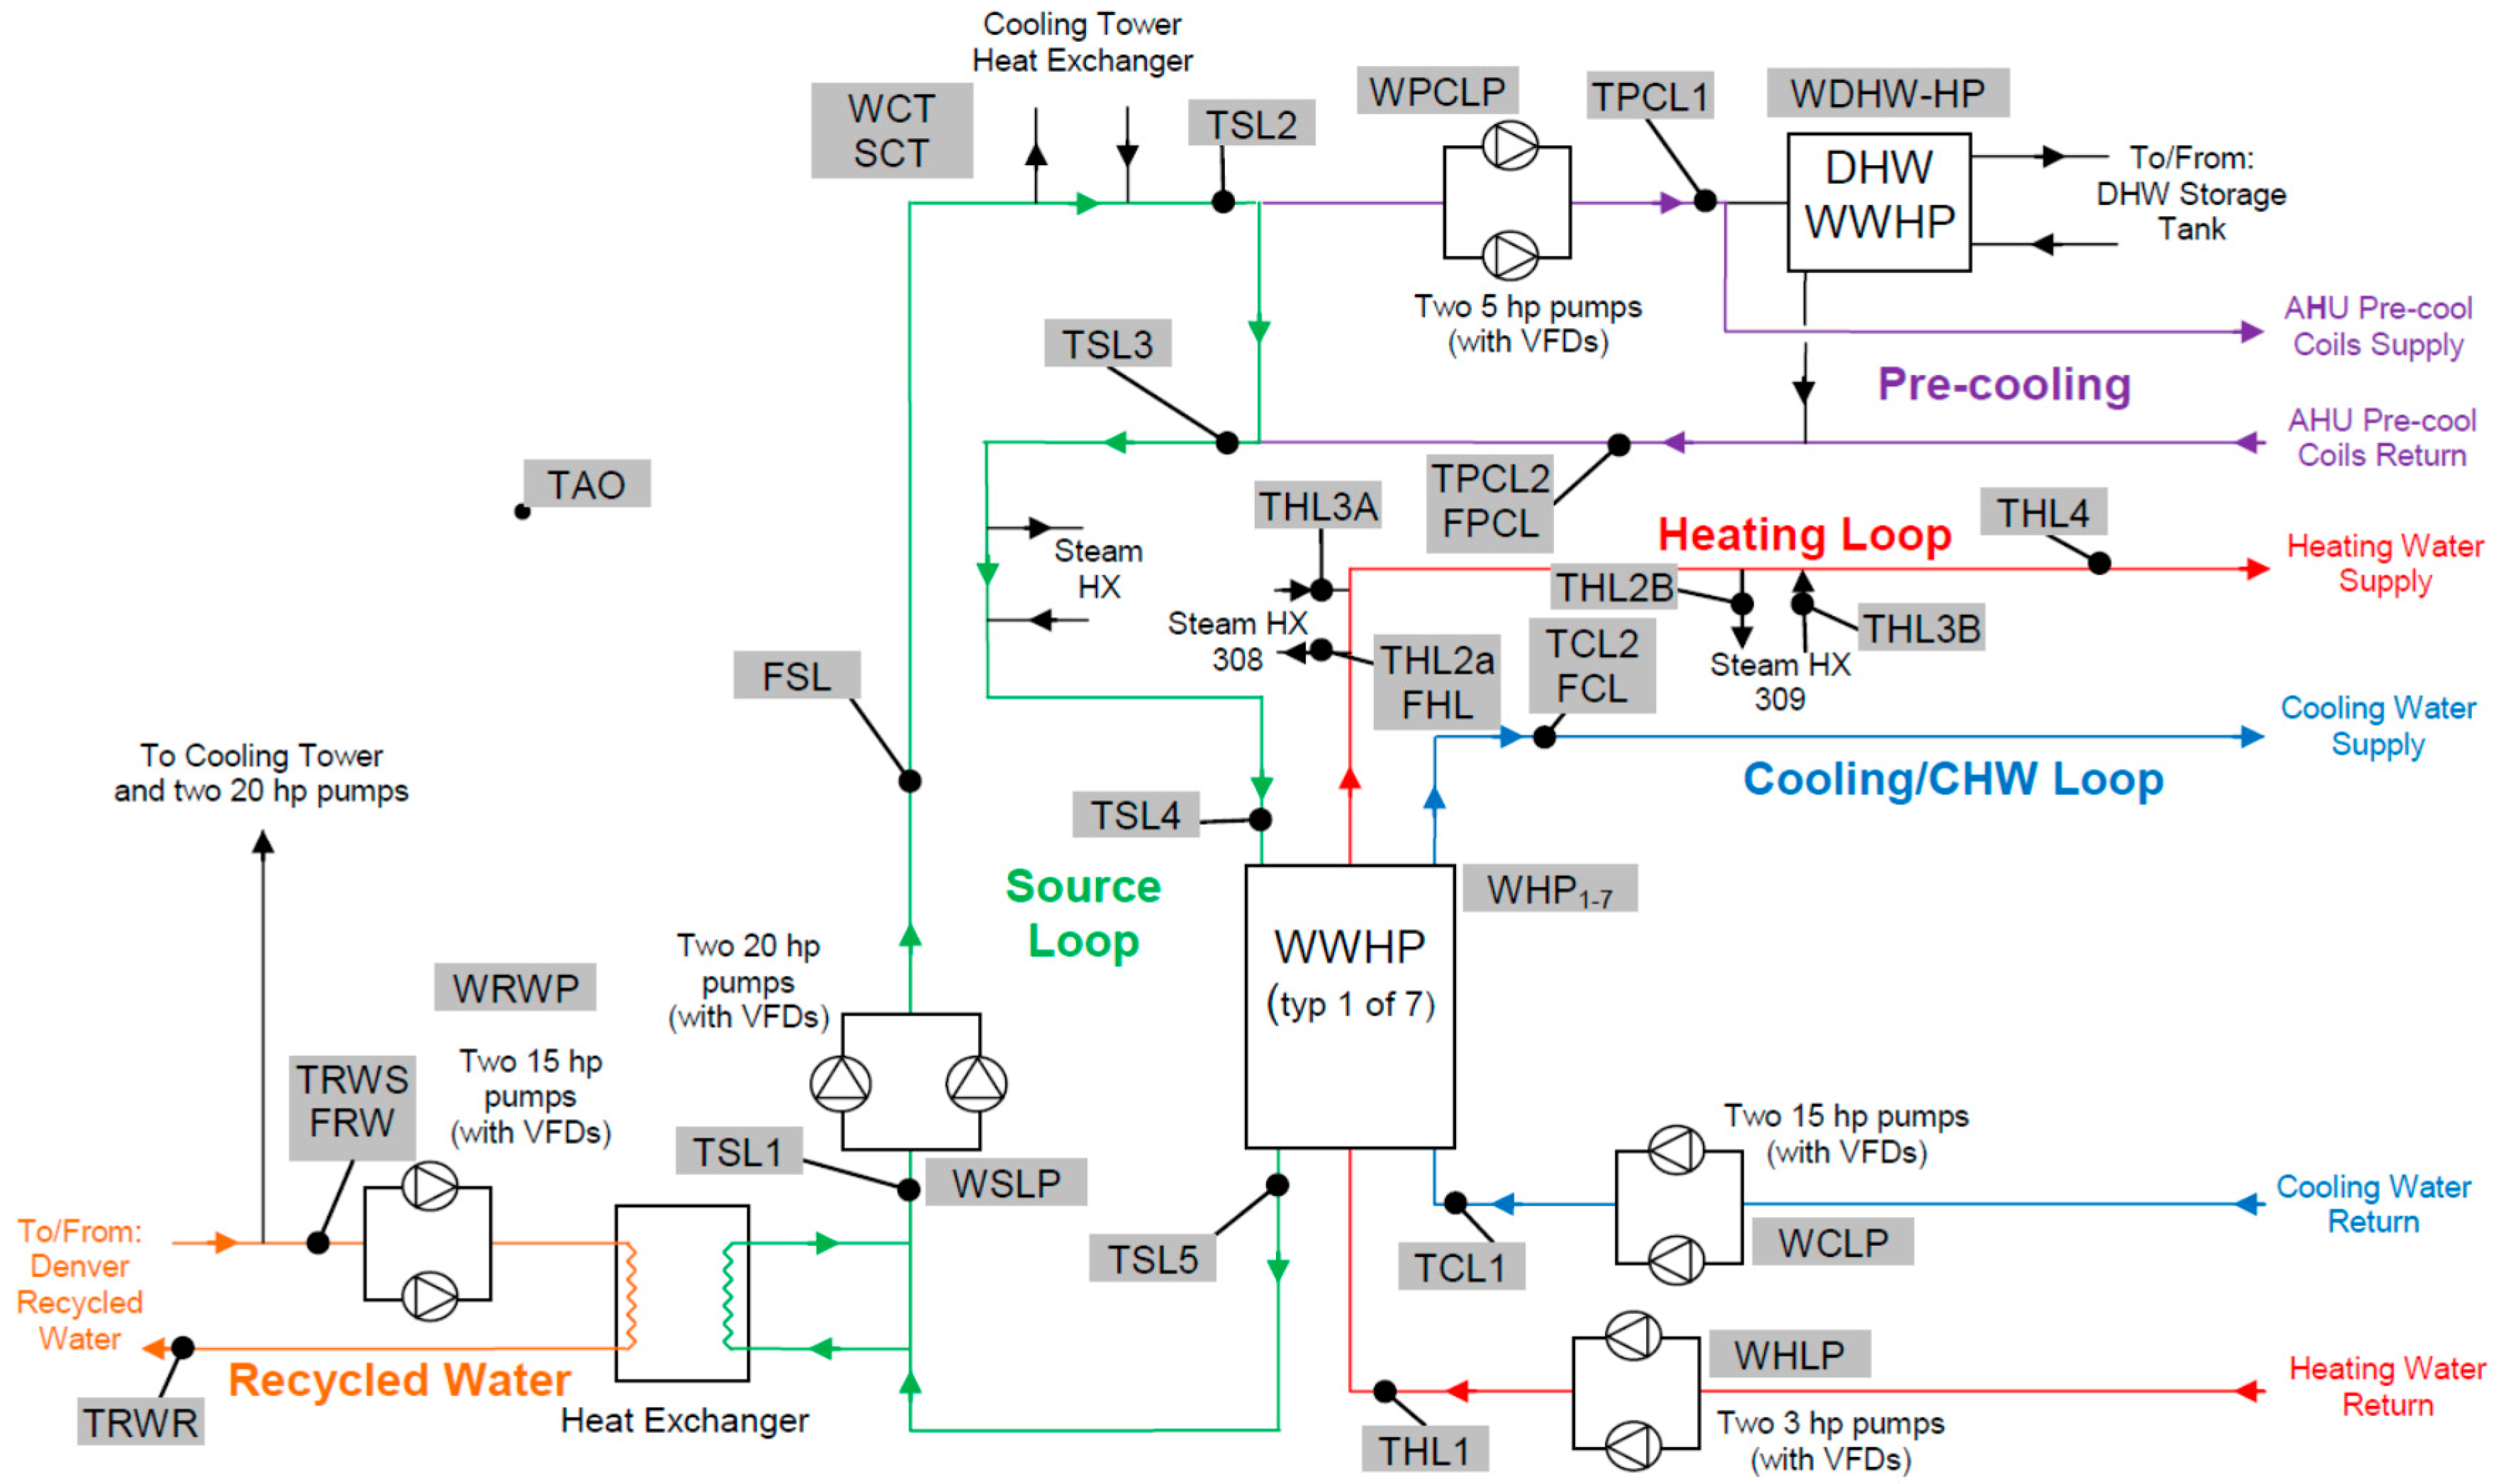
Figure 2.
Hourly outdoor air (OA) temperature vs. recycled wastewater (RW) temperature.

Figure 3.
Outdoor air (OA) dry bulb temperature, recycled water (RW) temperature, and water-to-water heat pump (WWHP) loads during typical days in the cooling season (top) and heating season (bottom).
Figure 3.
Outdoor air (OA) dry bulb temperature, recycled water (RW) temperature, and water-to-water heat pump (WWHP) loads during typical days in the cooling season (top) and heating season (bottom).
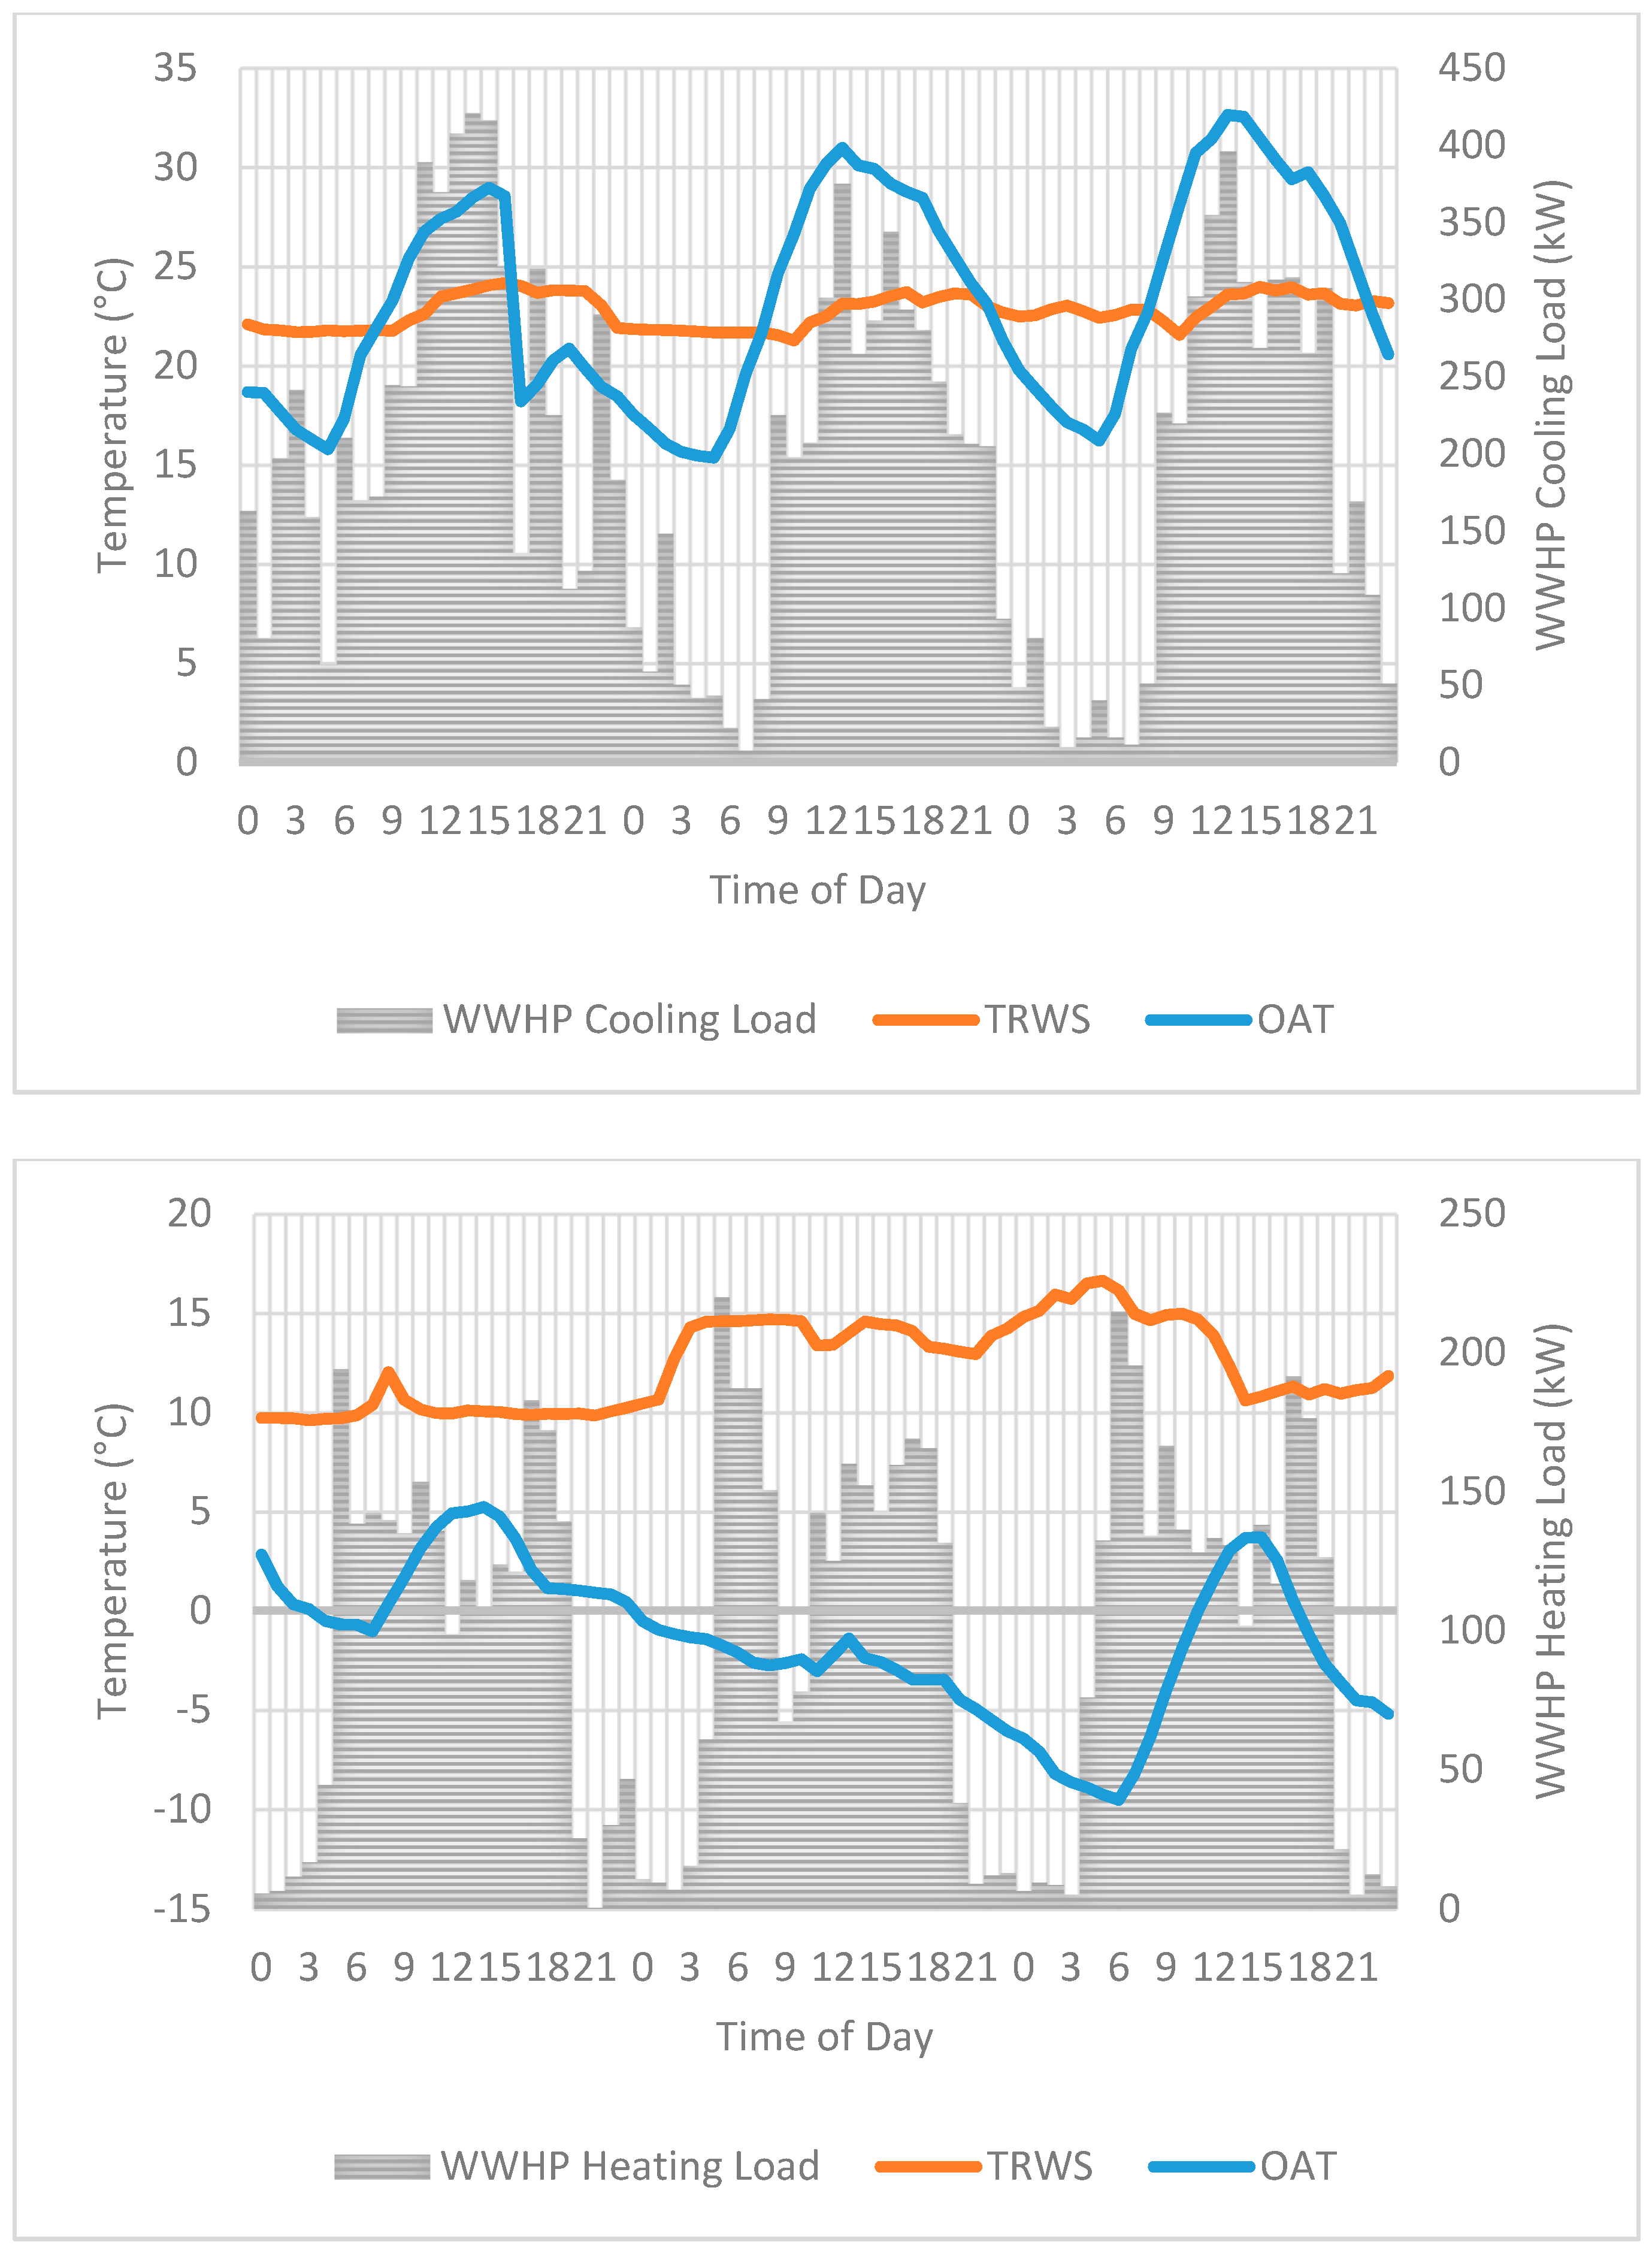
Figure 4.
Monthly heat flows in the source water loop.
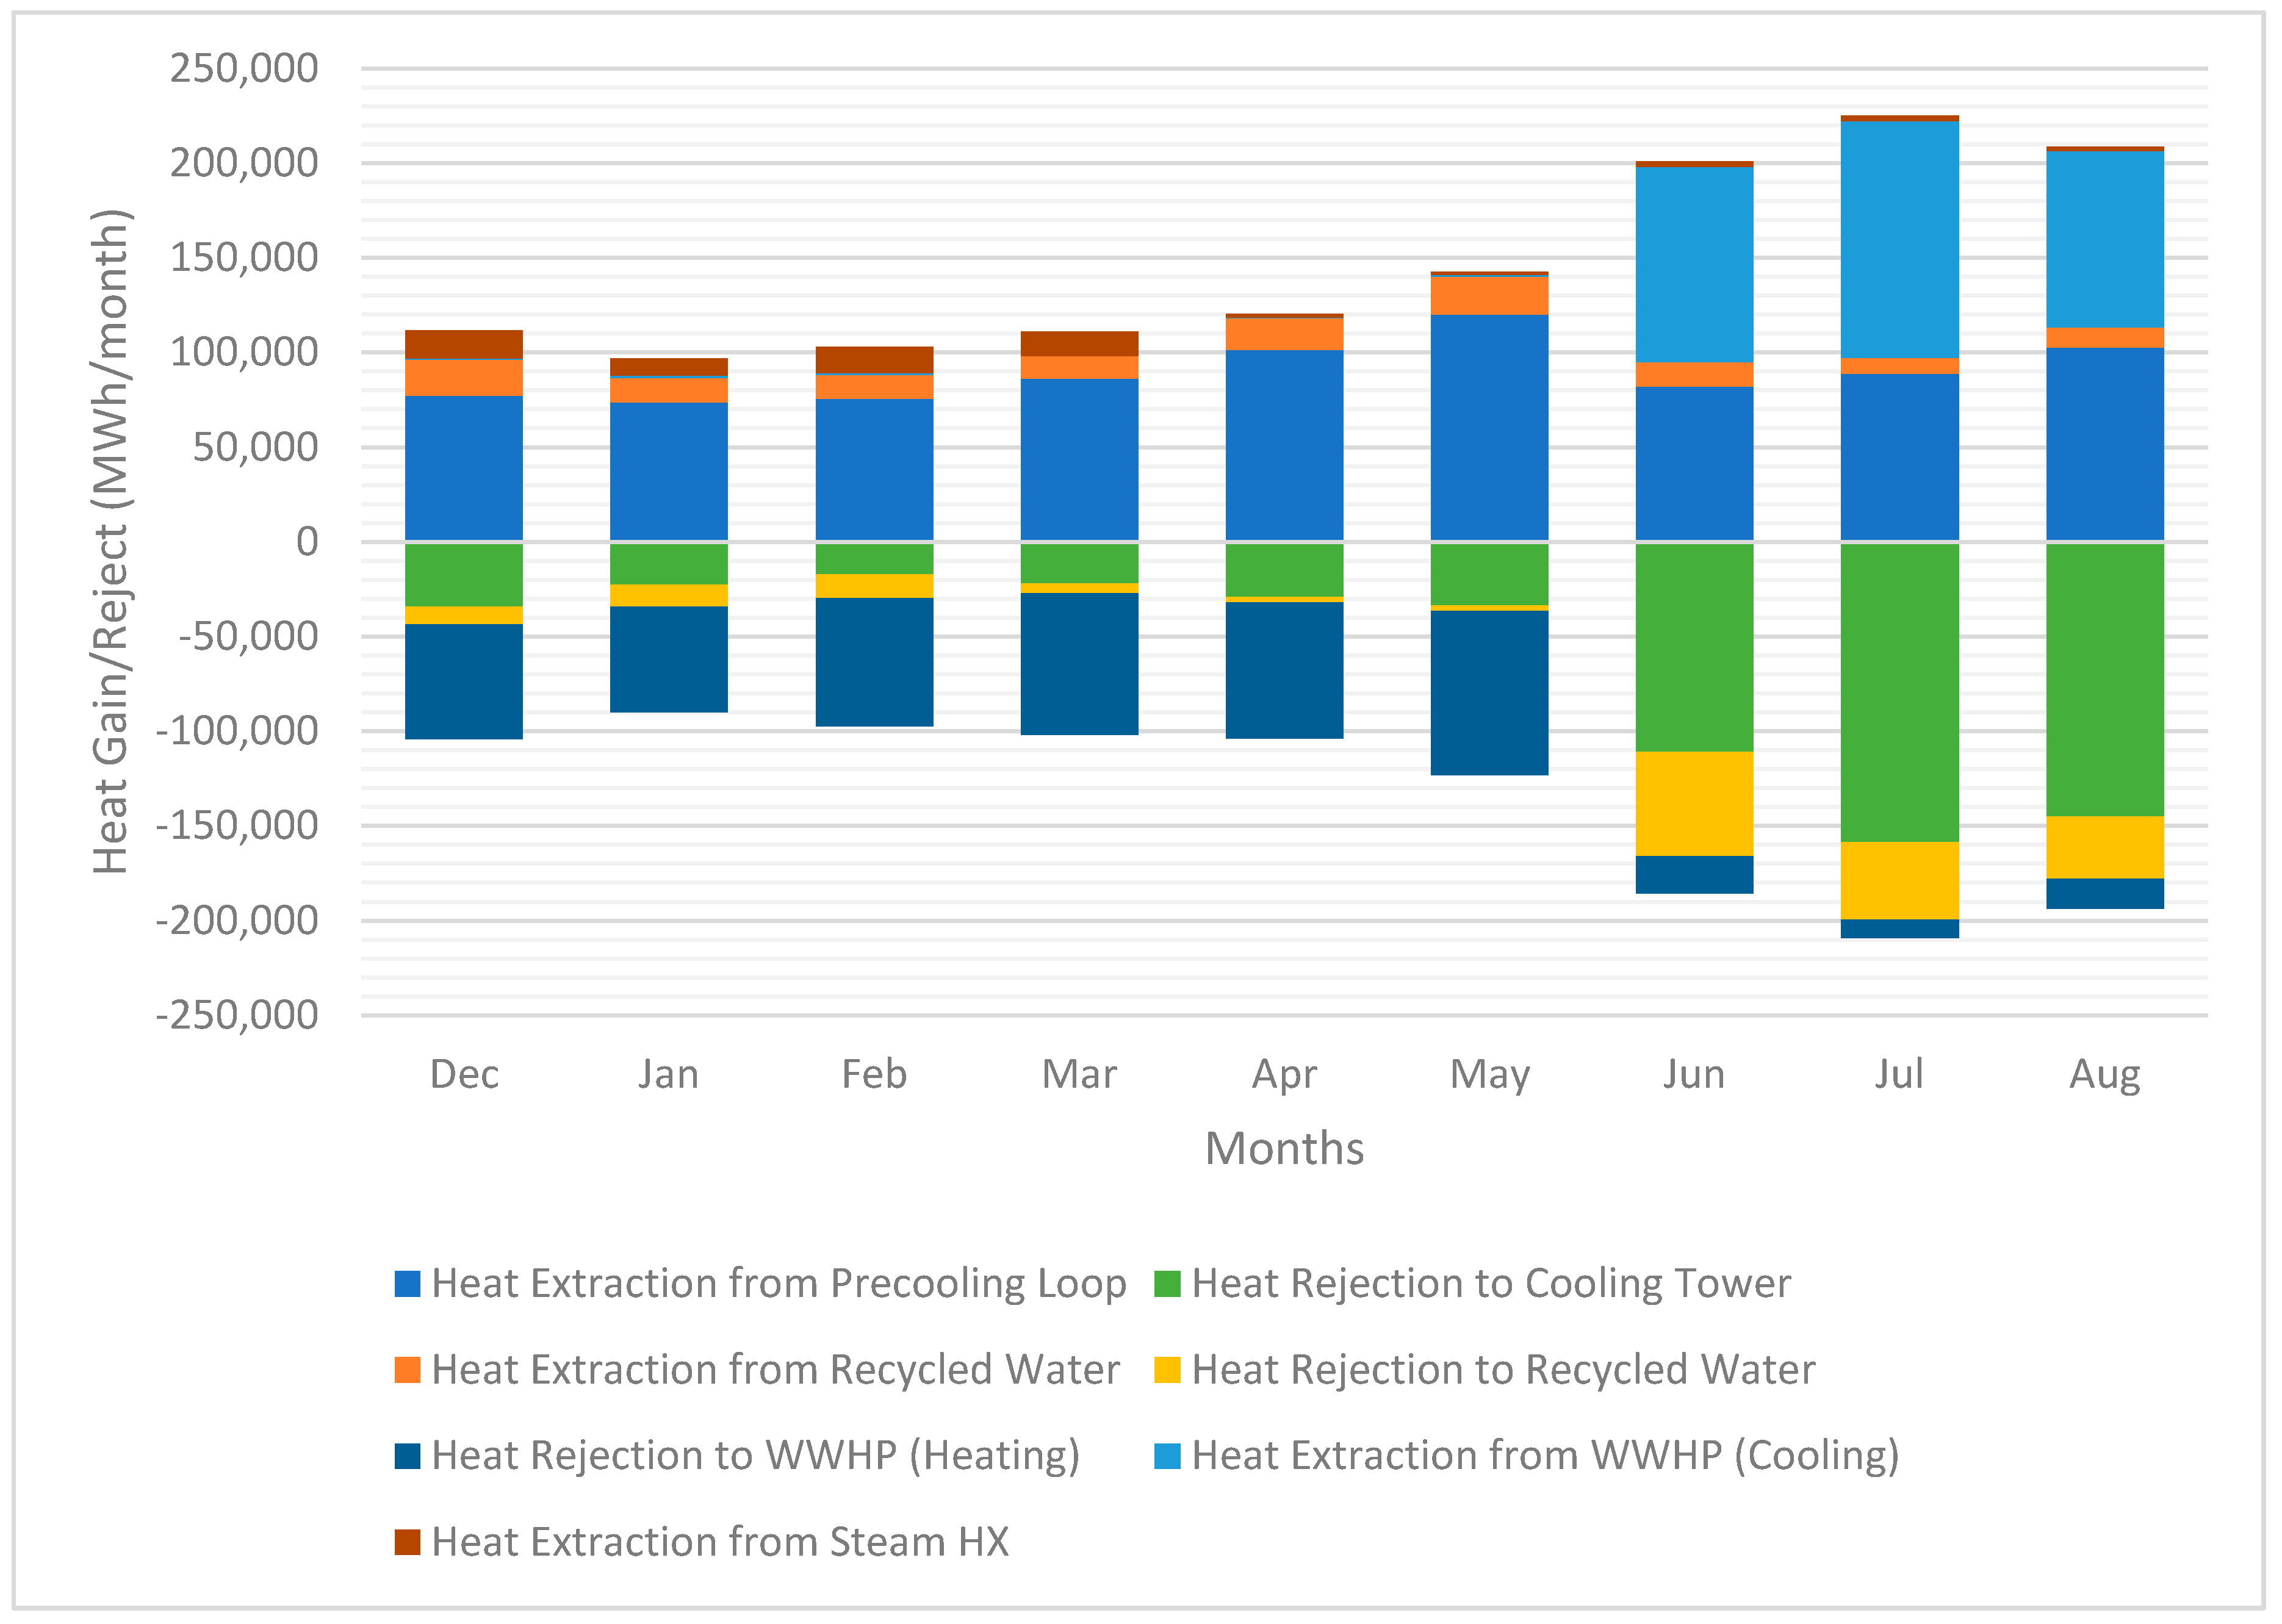
Figure 5.
Hot water loop supply temperature before (top) and after (bottom) the control change.

Figure 6.
Daily heating outputs before (left) and after (right) the control change.
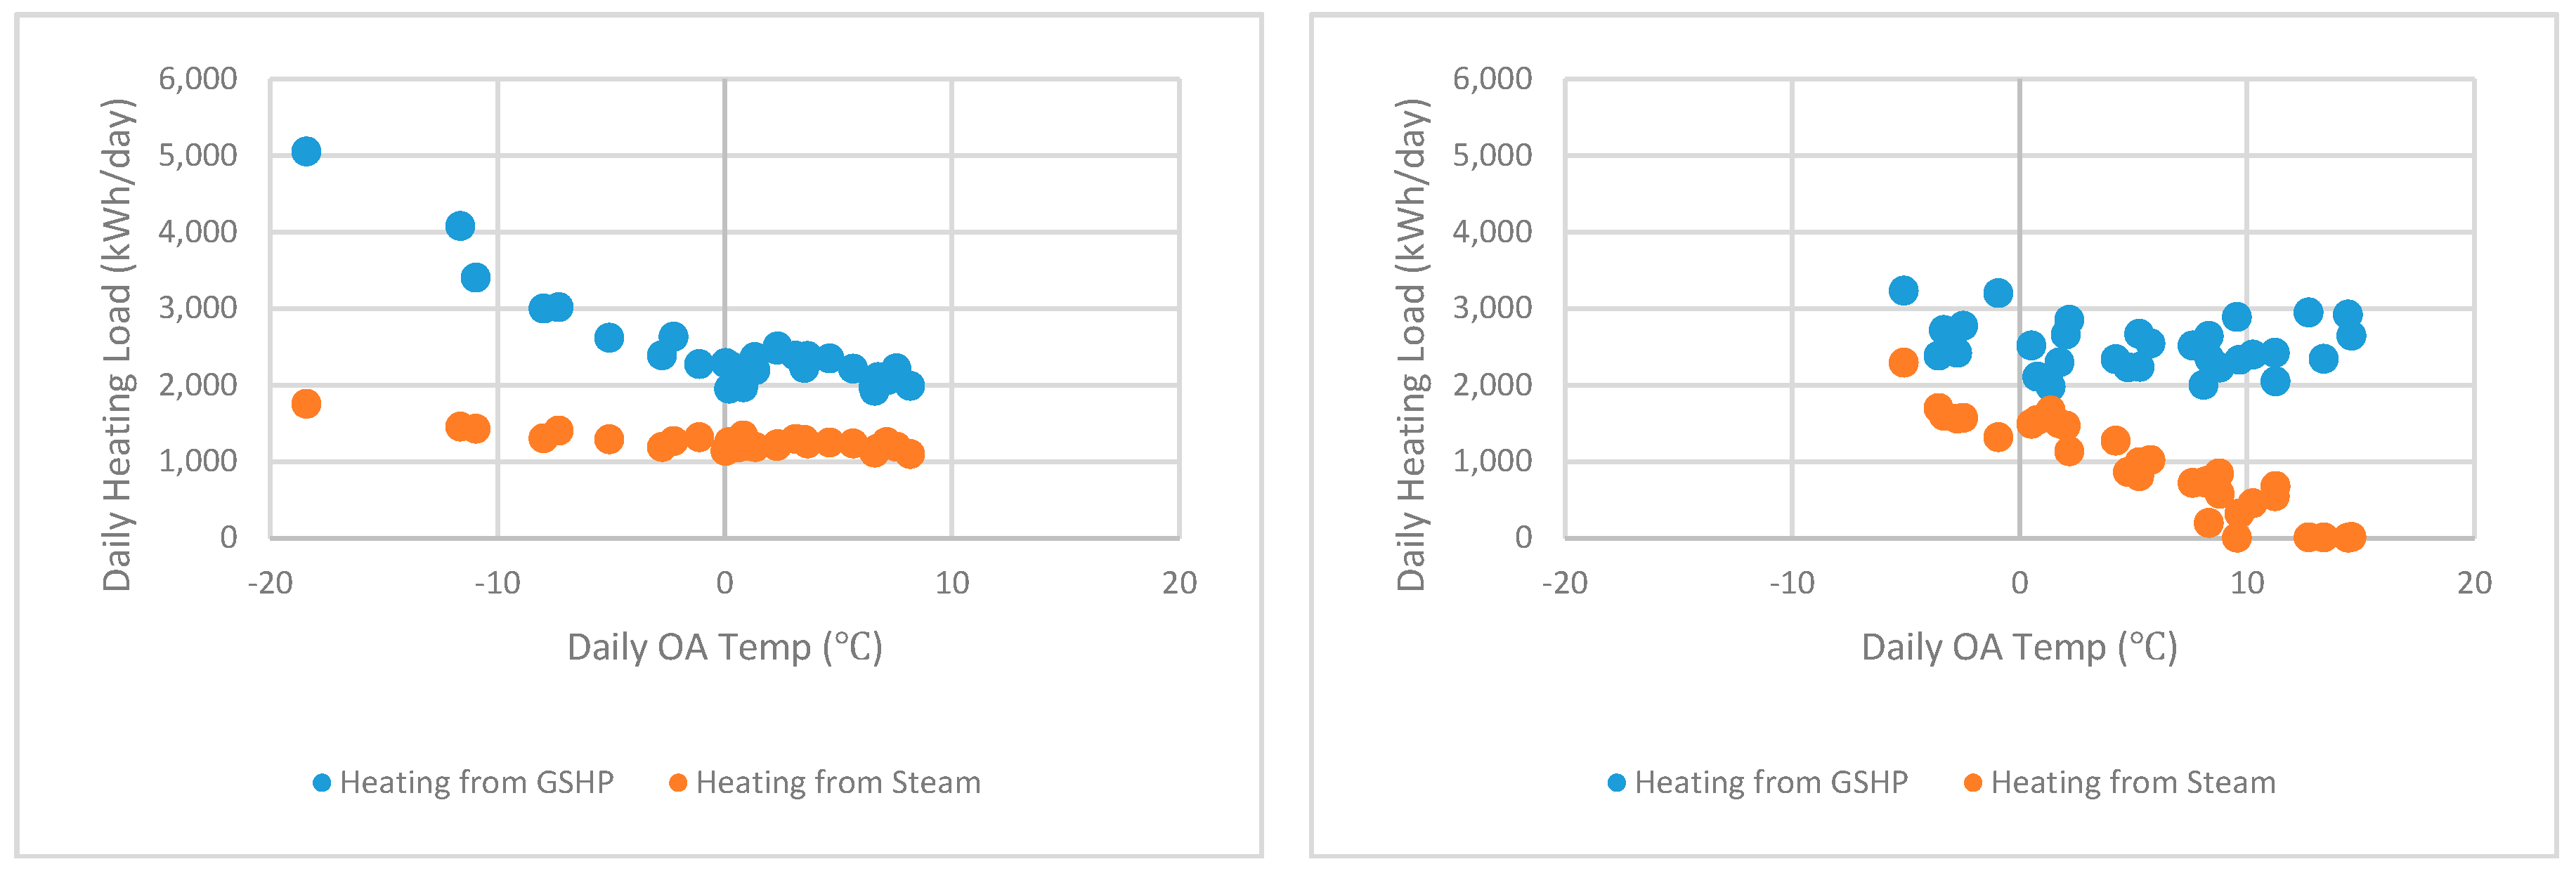
Figure 7.
Daily heating outputs before the control change and regression curve-fit correlations.
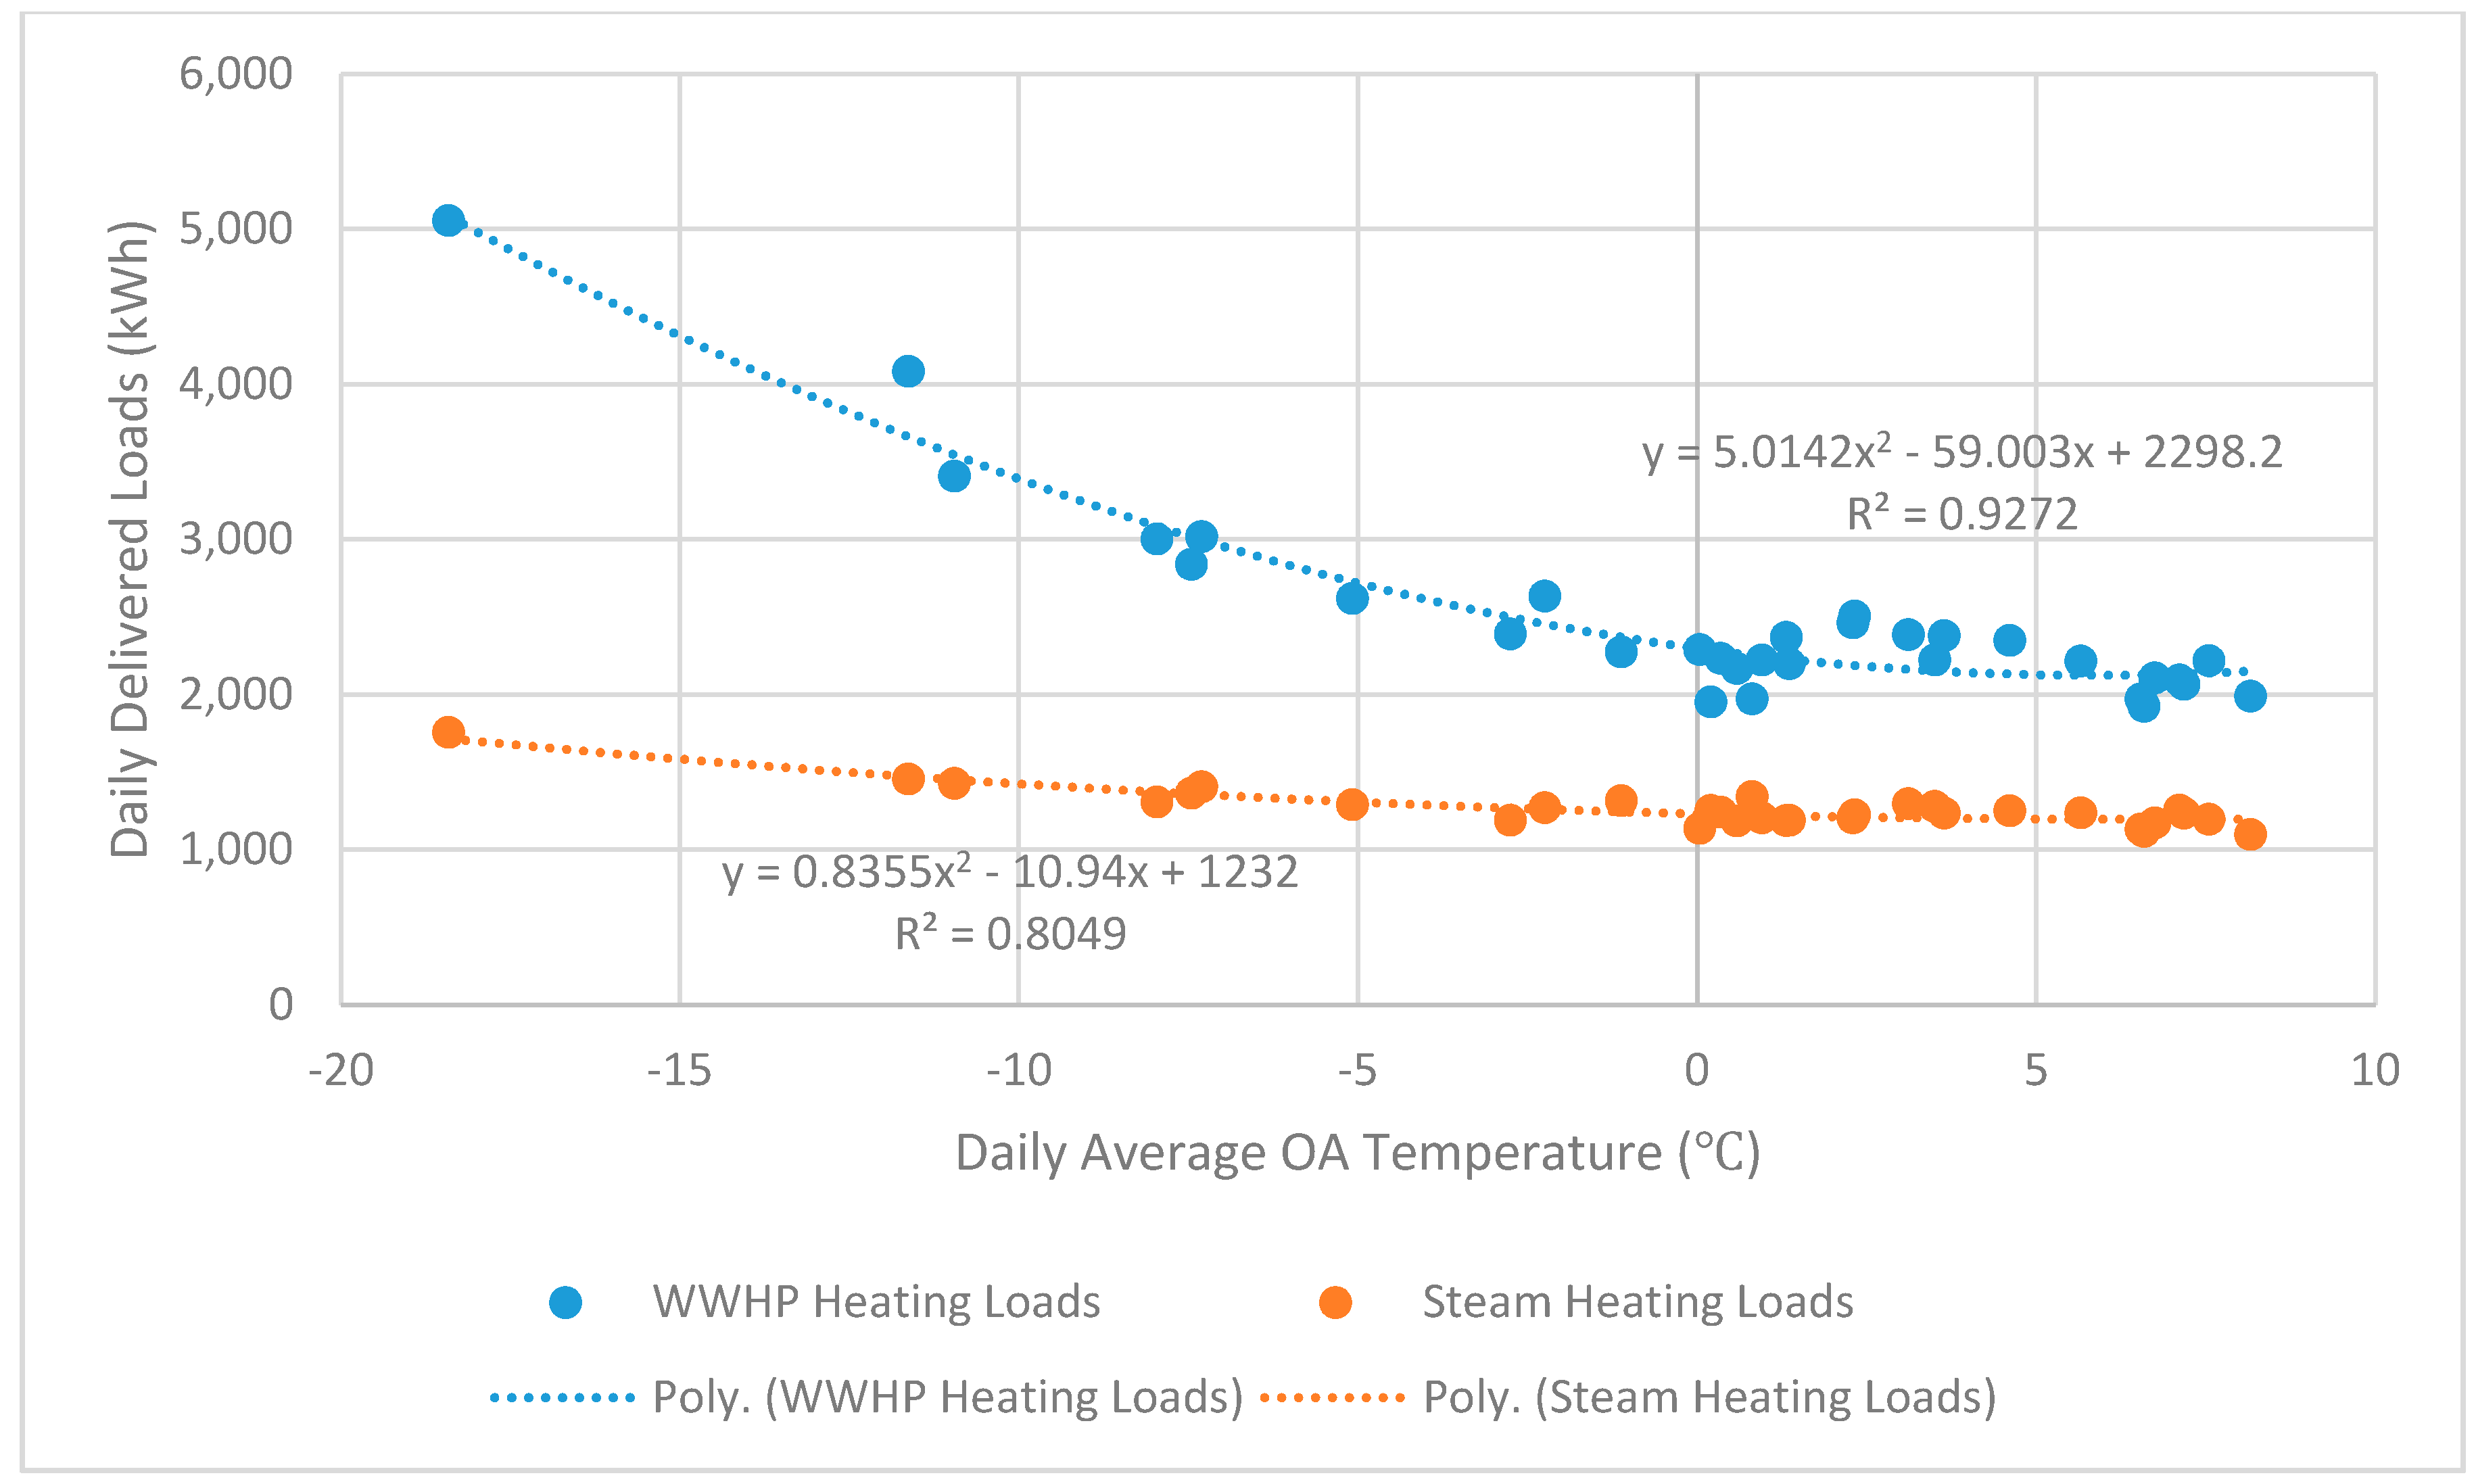
Figure 8.
Energy use during 20 January through 28 February resulting from the two different controls.
Figure 8.
Energy use during 20 January through 28 February resulting from the two different controls.

Figure 9.
Effective coefficient of performances (COPs) of the water-to-water heat pumps (WWHPs) and the recycled water heat pump (RWHP) system versus outdoor air temperatures.
Figure 9.
Effective coefficient of performances (COPs) of the water-to-water heat pumps (WWHPs) and the recycled water heat pump (RWHP) system versus outdoor air temperatures.

Table 1.
Measured data points of the recycled water heat pump system.
| Label | Description | Label | Description |
|---|---|---|---|
| TRWS | Recycled Water Supply Temperature | THL3b | HW Loop Temp after Steam HX 309 |
| TRWR | Recycled Water Return Temperature | FHL | HW Loop Flow |
| FRW | Recycled Water Flow | WHLP | HW Loop Pump Power |
| WRWP | Recycle Water Pumps Power | TCL1 | CHW Loop Temperature to WWHPs |
| TSL1 | Source Loop after RW HX Temperature | TCL2 | CHW Loop Temperature from WWHPs |
| TSL2 | Source Loop after Cooling Tower Temperature | FCL | CHW Loop Flow |
| TSL3 | Source Loop after Pre-cool Loop Temperature | WCLP | CHW Loop Pump Power |
| TSL4 | Source Loop after Steam HX Temperature | WDHW-HP | DHW WWHP Power |
| TSL5 | Source Loop after WWHP Temperature | TPCL1 | Pre-Cooling Loop Temperature prior to DHW WWHP |
| FSL | Source Loop Flow | TPCL2 | Pre-Cooling Loop Temperature after DHW WWHP |
| WSLP | Source Loop Pump Power | FPCL | Flow pre-Cooling Loop |
| WHP1-7 | Heat Pump Power (WWHPs 1 through 7) | WPCLP | Pre-Cooling Loop Pump Power |
| THL1 | HW Loop Temperature to WWHPs | WCT | Cooling Tower Power |
| THL2a | HW Loop Temp before Steam HX 308 | SCT | Cooling Tower On/Off Status |
| THL2b | HW Loop Temp before Steam HX 309 | TDHWHPS | DHW Heat Pump Supply Temp |
| THL3a | HW Loop Temp after Steam HX 308 | TAO | Ambient Temperature |
Table 2.
Source energy and energy cost savings resulting from the new control.
| Electricity (kWh) | Natural Gas (GJ) | Source Energy (GJ) | Electricity Cost ($) | Natural Gas Cost ($) | Total Cost ($) | |
|---|---|---|---|---|---|---|
| New Control | 21,734 | 166 | 421 | 1652 | 758 | 2410 |
| Old Control | 18,975 | 240 | 468 | 1442 | 1097 | 2539 |
| Savings | 47 | 130 | ||||
| Savings (%) | 10% | 5% |
Table 3.
Comparison of annual performance between baseline and recycled water heat pump (RWHP) systems.
Table 3.
Comparison of annual performance between baseline and recycled water heat pump (RWHP) systems.
| Baseline System | RWHP System | |||
|---|---|---|---|---|
| Electricity | Natural Gas | Electricity | Natural Gas | |
| Annual HVAC related site energy | 331,509 kWh | 4979 GJ | 334,419 kWh | 1017 GJ |
| Annual HVAC related source energy (GJ) | 8600 | 4302 | ||
| Source energy savings (GJ) | – | 4298 | ||
| % of source energy savings | – | 50.0% | ||
| Energy cost by fuel type ($) | $25,195 | $22,953 | $25,416 | $4692 |
| Total energy cost ($) | $48,148 | $30,108 | ||
| Recycled water use ($) | – | $2398 | ||
| Additional make-up water ($) | $654 | |||
| Annual cost savings ($) | – | $16,295 | ||
| % of cost savings | – | 33.8% | ||
| CO2 emissions (kg) by fuel type | 244,653 | 260,354 | 246,801 | 53,225 |
| Total CO2 emissions (kg) | 505,007 | 300,026 | ||
| CO2 emission reductions (kg) | – | 204,980 | ||
| % of CO2 emission reductions | – | 40.6% | ||
Table 4.
Cost effectiveness of the recycled water heat pump system compared with the baseline system.
Table 4.
Cost effectiveness of the recycled water heat pump system compared with the baseline system.
| Cost Item | RWHP System | Baseline System |
|---|---|---|
| HVAC equipment (AHUs) | $1,075,000 | $1,075,000 |
| Hydronic piping (to AHUs) | $146,000 | $146,000 |
| Air distribution system (duct work, etc.) and controls | $439,060 | $439,060 |
| Temperature control system | $330,000 | $330,000 |
| RWHP equipment (heat pumps, heat exchangers, circulation pumps, control system) | $288,747 | |
| Pipeline installation (recycled water main to the museum) | $1,100,000 | |
| RWHP equipment Installation | $624,045 | |
| Baseline water cooled chiller system (two 1050 kW chillers)1 | $360,000 | |
| Steam boiler plant (including construction of boiler room)2 | $1,370,000 | |
| Design, other professional cost, and indirect cost | $1,291,431 | $627,907 |
| Total | $5,294,283 | $4,347,967 |
| Cost premium | $946,316 | |
| Simple payback (years) | 58 | |
| Total (if the length of the recycled water pipeline branch is 305 m) | $4,527,616 | $4,347,967 |
| Cost premium | $179,649 | |
| Simple payback (years) | 11 |
Note: 1. Assuming two 1050 kW centrifugal chillers would be required (one for backup). The installed cost of the two chillers was from 2014 RSMeans mechanical system cost estimate [16]. 2. The boiler installation cost was the actual costs provided by DMNS for installing the boiler: $170 k for equipment, $240 k for installation. $960 k is attributed to the construction cost to house a boiler and condensate system.
© 2018 by the authors. Licensee MDPI, Basel, Switzerland. This article is an open access article distributed under the terms and conditions of the Creative Commons Attribution (CC BY) license (http://creativecommons.org/licenses/by/4.0/).
Share and Cite
MDPI and ACS Style
Im, P.; Liu, X.; Henderson, H. Operational Performance Characterization of a Heat Pump System Utilizing Recycled Water as Heat Sink and Heat Source in a Cool and Dry Climate. Energies 2018, 11, 211. https://doi.org/10.3390/en11010211
AMA Style
Im P, Liu X, Henderson H. Operational Performance Characterization of a Heat Pump System Utilizing Recycled Water as Heat Sink and Heat Source in a Cool and Dry Climate. Energies. 2018; 11(1):211. https://doi.org/10.3390/en11010211
Chicago/Turabian StyleIm, Piljae, Xiaobing Liu, and Hugh Henderson. 2018. "Operational Performance Characterization of a Heat Pump System Utilizing Recycled Water as Heat Sink and Heat Source in a Cool and Dry Climate" Energies 11, no. 1: 211. https://doi.org/10.3390/en11010211
Note that from the first issue of 2016, this journal uses article numbers instead of page numbers. See further details here.