Calibration of Mine Ventilation Network Models Using the Non-Linear Optimization Algorithm


1
Department of Mining Engineering and Metallurgical Engineering, Western Australian School of Mines, Curtin University, Kalgoorlie 6430, Australia
2
State Key Laboratory of Coal Resources and Safe Mining, China University of Mining and Technology, Xuzhou 221100, China
3
School of Resources and Safety Engineering, China University of Mining and Technology (Beijing), Beijing 100083, China
4
School of Mining Engineering, University of New South Wales, Sydney 2052, Australia
*
Author to whom correspondence should be addressed.
Energies 2018, 11(1), 31; https://doi.org/10.3390/en11010031
Submission received: 27 November 2017
/
Revised: 19 December 2017
/
Accepted: 21 December 2017
/
Published: 23 December 2017
Abstract
:Effective ventilation planning is vital to underground mining. To ensure stable operation of the ventilation system and to avoid airflow disorder, mine ventilation network (MVN) models have been widely used in simulating and optimizing the mine ventilation system. However, one of the challenges for MVN model simulation is that the simulated airflow distribution results do not match the measured data. To solve this problem, a simple and effective calibration method is proposed based on the non-linear optimization algorithm. The calibrated model not only makes simulated airflow distribution results in accordance with the on-site measured data, but also controls the errors of other parameters within a minimum range. The proposed method was then applied to calibrate an MVN model in a real case, which is built based on ventilation survey results and Ventsim software. Finally, airflow simulation experiments are carried out respectively using data before and after calibration, whose results were compared and analyzed. This showed that the simulated airflows in the calibrated model agreed much better to the ventilation survey data, which verifies the effectiveness of calibrating method.
1. Introduction
Mine ventilation plays a very important role in underground mining. It bear significant responsibility for supplying enough fresh air to designated areas, diluting methane, and maintaining appropriate climatic conditions and removing underground contaminants effectively [1,2,3,4,5]. Ventilation is often considered one of the biggest restraining factors in mine production [6].
To ensure the safe and stable operation of the ventilation system, mine ventilation network (MVN) models have been widely applied in simulating and optimizing ventilation systems. This is an effective tool for ventilation planning prior to mining, understanding the current ventilation condition, and predicting the condition for further ventilation development [7,8]. To avoid air disorder or air inversion, mine ventilation simulation needs to be done before reforming the ventilation systems. Through applying a number of changes (adding/removing branches and nodes, changing resistance of roadways, revising parameters of fans, etc.) to the original model, simulation experiments are conducted to obtain the air distribution situation after new development or ventilation upgrade. These numerical model experiments can provide quick feedback, diagnose existing or potential problems, and help the ventilation engineer to evaluate the proposed ventilation plan [9].
For building the MVN models, several commercial computer programs are available, such as Ventsim, VnetPC, and VentGraph. As these software have graphical representations of an MVN and are easy to operate, they have become widespread in mining [10]. Feng [8] used Ventsim to simulate the MVN for a mine that is more than 1 km deep with high ventilation pressure and a complex ventilation system. The model identified several areas that can reduce the resistance. A new model was built to simulate the ventilation condition after resistance reduction, and results showed that the airflow rate increased with reduced fan pressure and power cost. This helped the implementation of the proposed modification to the current ventilation setup. These software were also applied in ventilation and fire simulations for various underground constructions [11]. To evaluate underground storage facilities, alternative configurations of the underground space was simulated with VnetPC [12]. The study considered both ventilation system characteristics and economic factors. Based on the MVN model results, the most appropriate design, which is both secure and economically acceptable, was proposed.
To accurately simulate the airflow rate of roadways, good calibration of the ventilation network model is required [13,14]. In MVN modeling, one of the key parameters inputted to the model is the air way resistance, according to which airflow created by the fan is distributed. If resistances are supposed to be erroneous, it is impossible to accurately simulate the airflow performance in ventilation modeling software [15]. However, due to various sources of errors, it is challenging for the measured airway resistances to reflect true values. Some of the measurement errors include: instrumental and operational errors; partial airway measurement results that are applied to the entire airway or similar airways; and empirical resistance that is applied to airways that are difficult to access. Due to such reasons, once the measured resistance data is input into the MVN model, the simulated airflow distribution results usually do not match the measured data. However, it is believed that the airflow quantity measurement is more accurate than that of the resistance. This is because the resistance is calculated based on measured pressure drop and airflow quantity over a section of the airway, or computed based on empirical values. Conversely, the airflow is directly measured with minimum procedure and operational errors. Thus, for effective ventilation planning, it is vital to ensure that the simulated airflow distribution agrees with that of the actual measured airflow distribution.
The aim of this paper is to apply the non-linear optimization algorithm to calibrate the MVN model to match the actual measured airflow data. The proposed method can calibrate the MVN model to agree with the measured airflow data, and control the errors of all other parameters within minimum range. After calibration, the underground airflow simulation result will be in accordance with the on-site measured data. When the calibrated model is used for further ventilation development simulation, it can provide results nearest to the actual situation, and therefore improve the accuracy for underground mine ventilation planning. Beyond that, as the ventilation model was widely used in scientific research related to mine ventilation, mine fire, and mine dust simulations, the method proposed in this paper will be a very helpful tool for these models to achieve more accurate results.
2. Methods
Assuming there are b branches and j junctions in the ventilation network, the measured and simulated airflow quantities in the branches can be denoted as and , and the measured and simulated airway resistances for the branches can be denoted as and . The general processes for the proposed calibration method is demonstrated in the flow chart shown in Figure 1. The first step is to obtain the original airflow quantities and ventilation resistances through consulting the ventilation survey report. Then, based on Kirchhoff’s second law, the actual measured airflow quantities () and the airway resistances () are used in the calibrated MVN model to establish (b – j + 1) sets of independent equations. The constraint conditions used for are within the range of plus and minus 10% of the measured resistance values. The airway resistances () used in the calibrated MVN model can be obtained by solving the objective function, which minimizes the difference between and .
Ventilation survey is a systematic procedure of obtaining data of pressures and air quantities in roadways, and the distribution of airflow in ventilation systems. It is a common practice to conduct the ventilation survey periodically, and record and analyze the data in a ventilation survey report. Therefore, the most up-to-date data required for building an MVN model can be found in that report. As the objective for the calibration is to calibrate the MVN model so that it achieves the same airflow quantities as the actual measured data, the numerical expression is: .
In an MVN with b branches and j junctions, there are independent circuits [16]. The most common way to obtain the number of independent circuits in an MVN is through calculating the independent circuit matrix. The process is shown as below. Firstly, all of the the branches and nodes in the MVN are numbered. Secondly, a minimum spanning tree weighted by ventilation resistance is selected. Then, the fundamental incidence matrix B is obtained through combining the cotree’s branches with the tree’s branches, as shown in Equation (1).
where Bc and Bt represent the submatrix of the cotree’s branches and the submatrix of the tree’s branches, respectively.
Finally, the independent circuit matrix C can be calculated through Equation (2). [17,18].
where I is a unit matrix.
Using independent circuits, the same number of independent equations can be established based on Kirchhoff’s second law, as shown in Equation (3).
As we only have independent equations to solve b number of , there will be unlimited groups of solutions of . It is assumed that although the measured resistance data has errors, it should be reasonable and close to the true resistance. Therefore, the resistance values used in the model should be constrained within a small range of the measured values. The constraint conditions for are set according to Equation (4).
To calibrate the MVN model, the modified resistances are used. One of the assumptions is, although errors exist, the measured resistances should be close to the true values. Thus, the objective function used in the algorithm is to minimize the difference between and . There are many numerical ways to achieve this objective function, we have choosen to minimize the root mean square deviation (RMSD) between and , as shown in Equation (5).
If an optimal solution is found that satisfies Equations (3) and (4), the results can be used in the MVN model. This guarantees that the simulated airflow quantities will match the measured data, whereas the airway resistances used are within a reasonable range of the measured or assumed values. Sometimes, an optimal solution may not be found due to large ventilation survey error or inaccurately recorded data. Under such circumstances, the ventilation survey data need to be validated, or the constraint condition can be loosen until the optimal solution is found.
3. Numerical Model Validation
In this section, the calibration method proposed in this article is applied to an MVN model with site data. The ventilation resistance before and after calibration are used to build the MVN models using Ventsim, whose results are compared and analyzed.
3.1. Ventilation Survey
A ventilation survey was conducted in a coal mine in Shanxi province of China, whose designed annual mine capacity is 10 million tons. Inclined shaft development and mixed ventilation are adopted. Exhaust axial flow fans are installed in the shafts of the North first panel and North second panel. Air intake shafts include the main inclined shaft, auxiliary inclined shaft, North first air intake shaft, and North second intake shaft.
The traverse barometer survey method was used in the ventilation survey. Compared to the trailing hose survey method, this method has advantages of easy operation, fast measurement, and is more suitable for the measurement of the whole mine. The observed absolute pressures are measured at the starting and ending points, and the elevations and air densities are also measured to correct the observed pressures. Airflow rate is measured by the anemometer traverse method, moving the anemometer across the whole section in a continuous up and down traverse direction. The complete traverse took more than 60 s and the procedure was repeated until three readings agreed to within 5% [19]. The air velocity was calculated by dividing the anemometer reading by the corresponding time [19]. Measurement error may occur when the anemometer does not cover the whole section or the travel speed is not constant. The frictional pressure drop between node i and j was calculated indirectly considering static pressure difference, dynamic pressure difference, and gravity differential pressure, given as [14]:
where p is the static pressure, Z is the height, and v denotes the wind speed.
The ventilation resistances of roadways were calculated from Equation (7).
where RL (Ns2/m8) is the roadway’s ventilation resistance. hL (Pa) and QL (m3/s) represent the frictional pressure drop and average air rate of the roadway, respectively.
3.2. MVN Model Establishment
An MVN model was established according to the above ventilation survey. It was assumed that the airflow was incompressible and the natural ventilation pressure was neglected. Parameters such as section shape, size, and airway resistance were input in the roadways. Fans and ventilation structures including air door, windshield, and airtight partition were also set up according to the actual situation [20]. The established model is shown in Figure 2.
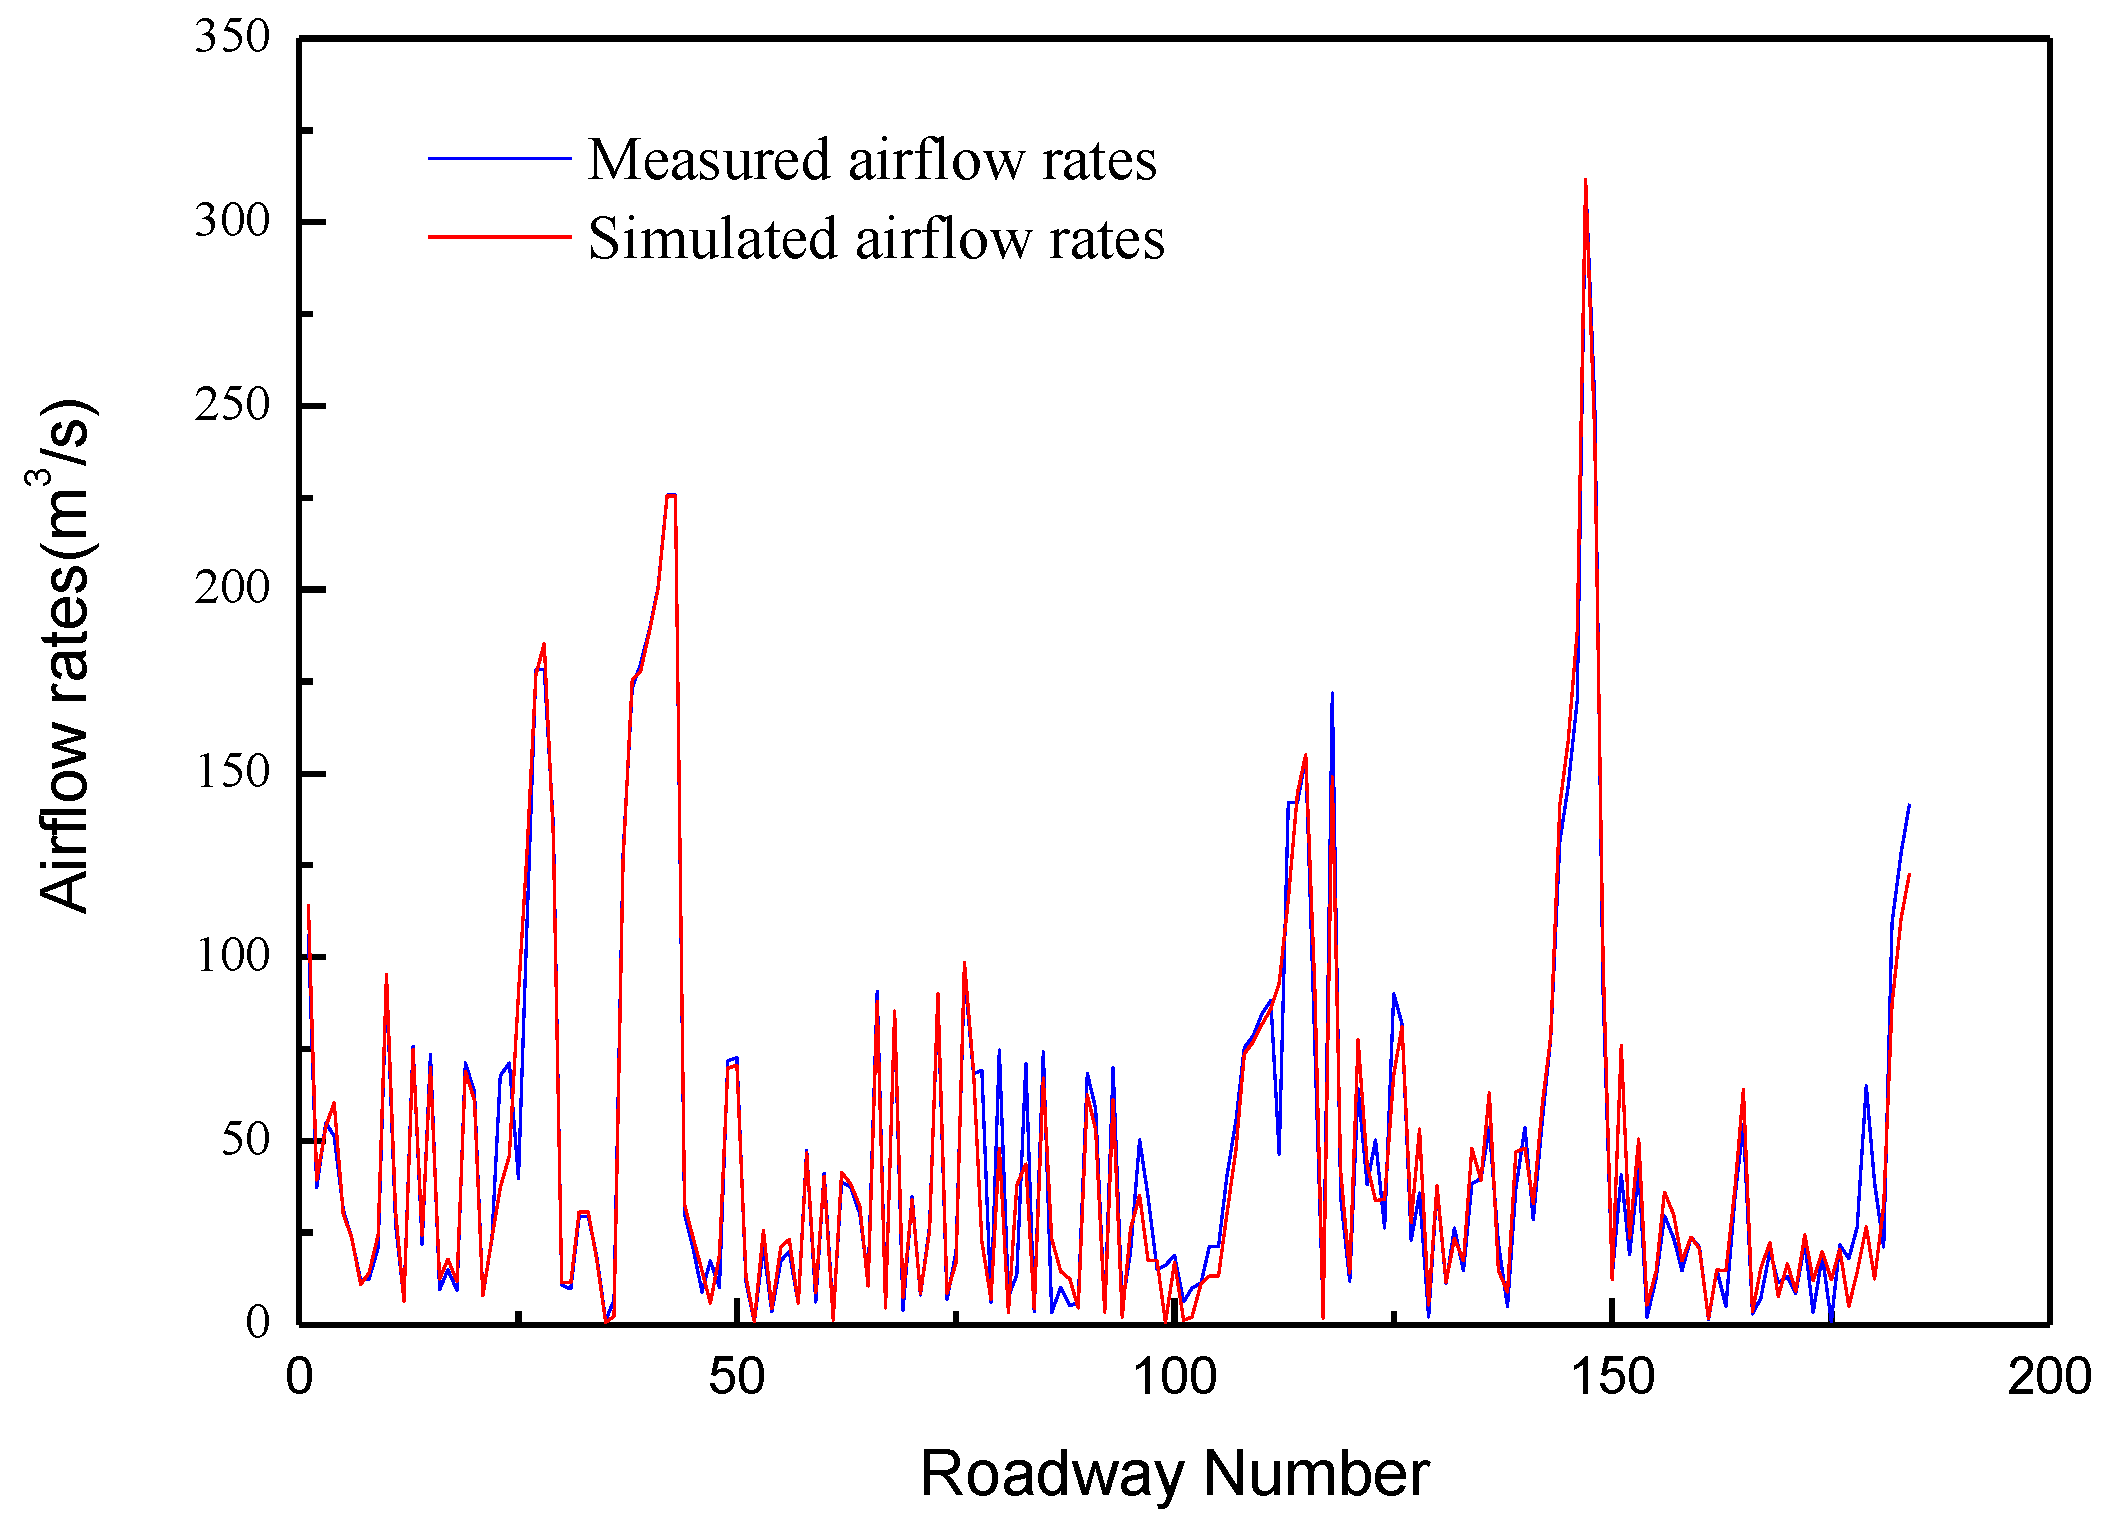
Finally, the airflow simulation was run and the simulated airflow rate was recorded in each roadway. For each airway, the comparison of the simulated airflow rate and the measured data is shown in Figure 3.
3.3. Model Calibration
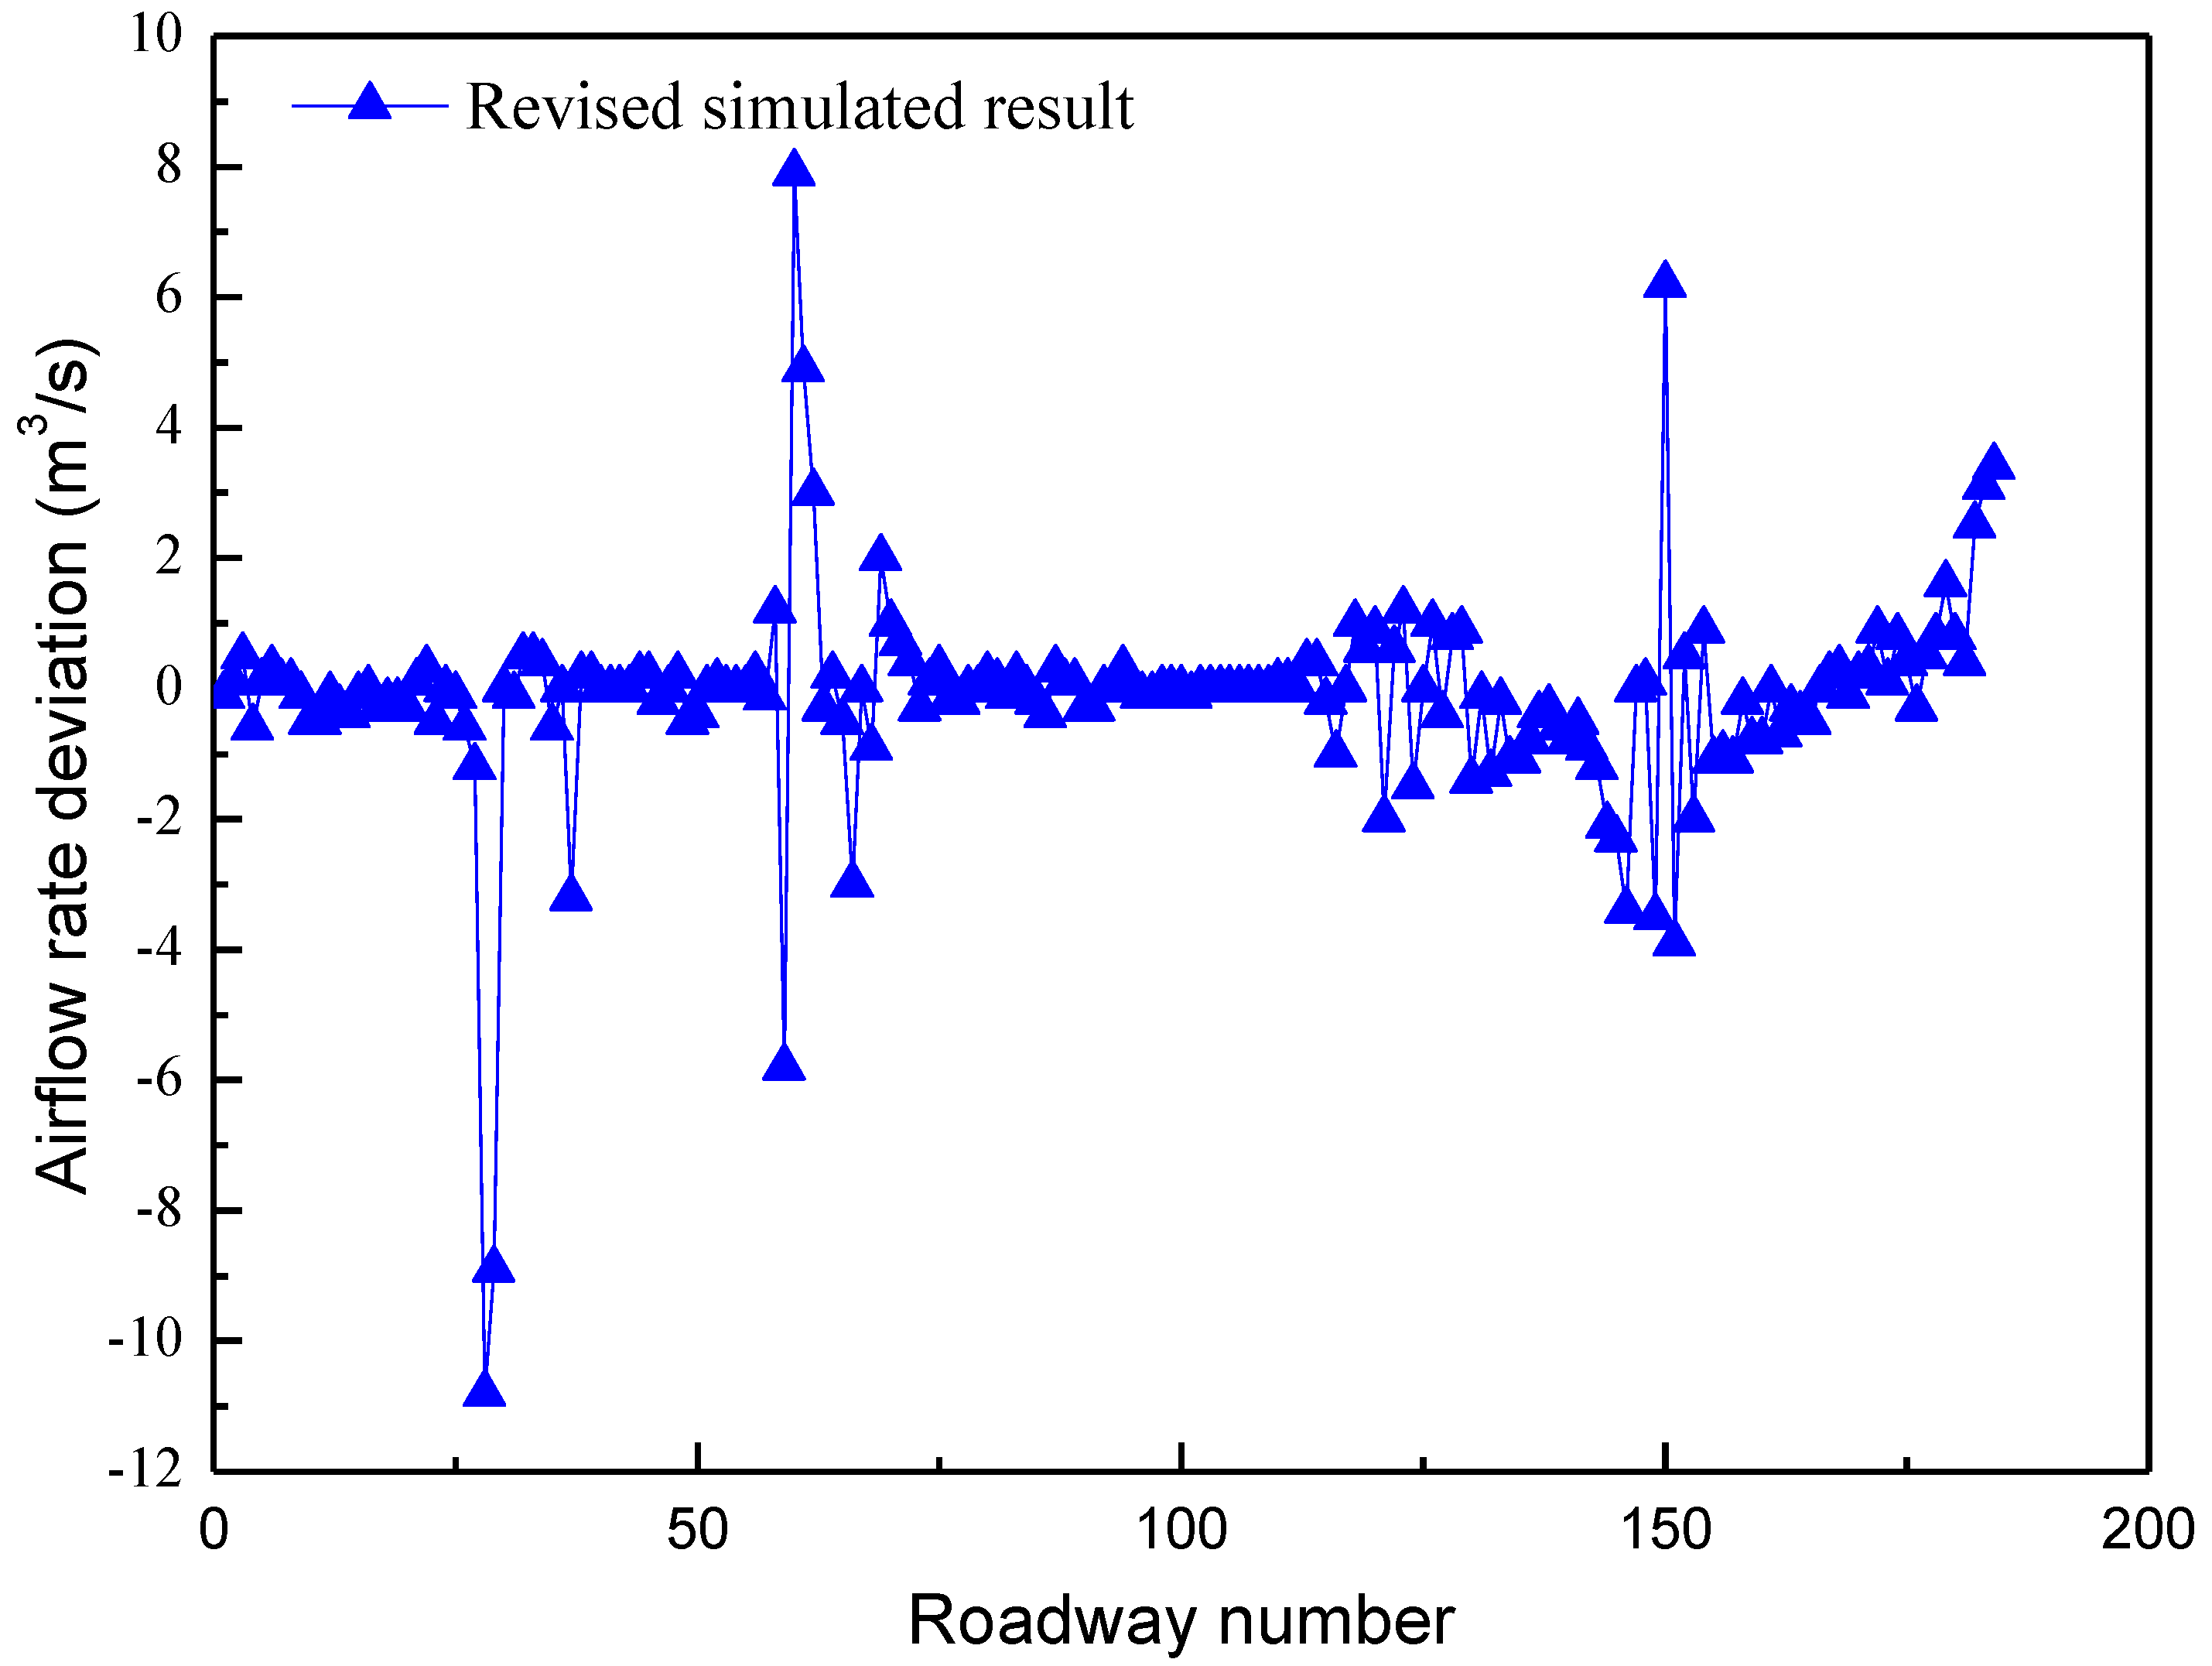
There are 154 junctions and 185 branches in the established MVN model. Therefore, there are 32 independent circuits and each circuit can establish an independent equation according to Kirchhoff’s second law. Thirty-two equations are established according to Equation (3) and the objective function is established with Equation (4). All of the roadways’ resistance are constrained between 90% and 110% of the measured one. With such conditions, the non-linear optimization problem was solved. However, no feasible solution was found. This means that, under the current constraint conditions, there is no set of resistance values that can be found to satisfy Kirchhoff’s second law. Thus, the constraint conditions were loosened to 85% and 115% of the measured resistance. The objective function was solved again and a set of optimal solutions was found after 498 iterations. The calculated set of resistance data was then input to the MVN model for calibration. The airflow simulation was run again, and the new airflow results were recorded. As the revised simulated airflow rate and the measured data are very close, the comparison diagrams are almost identical. The airflow rate deviation is displayed in Figure 4.
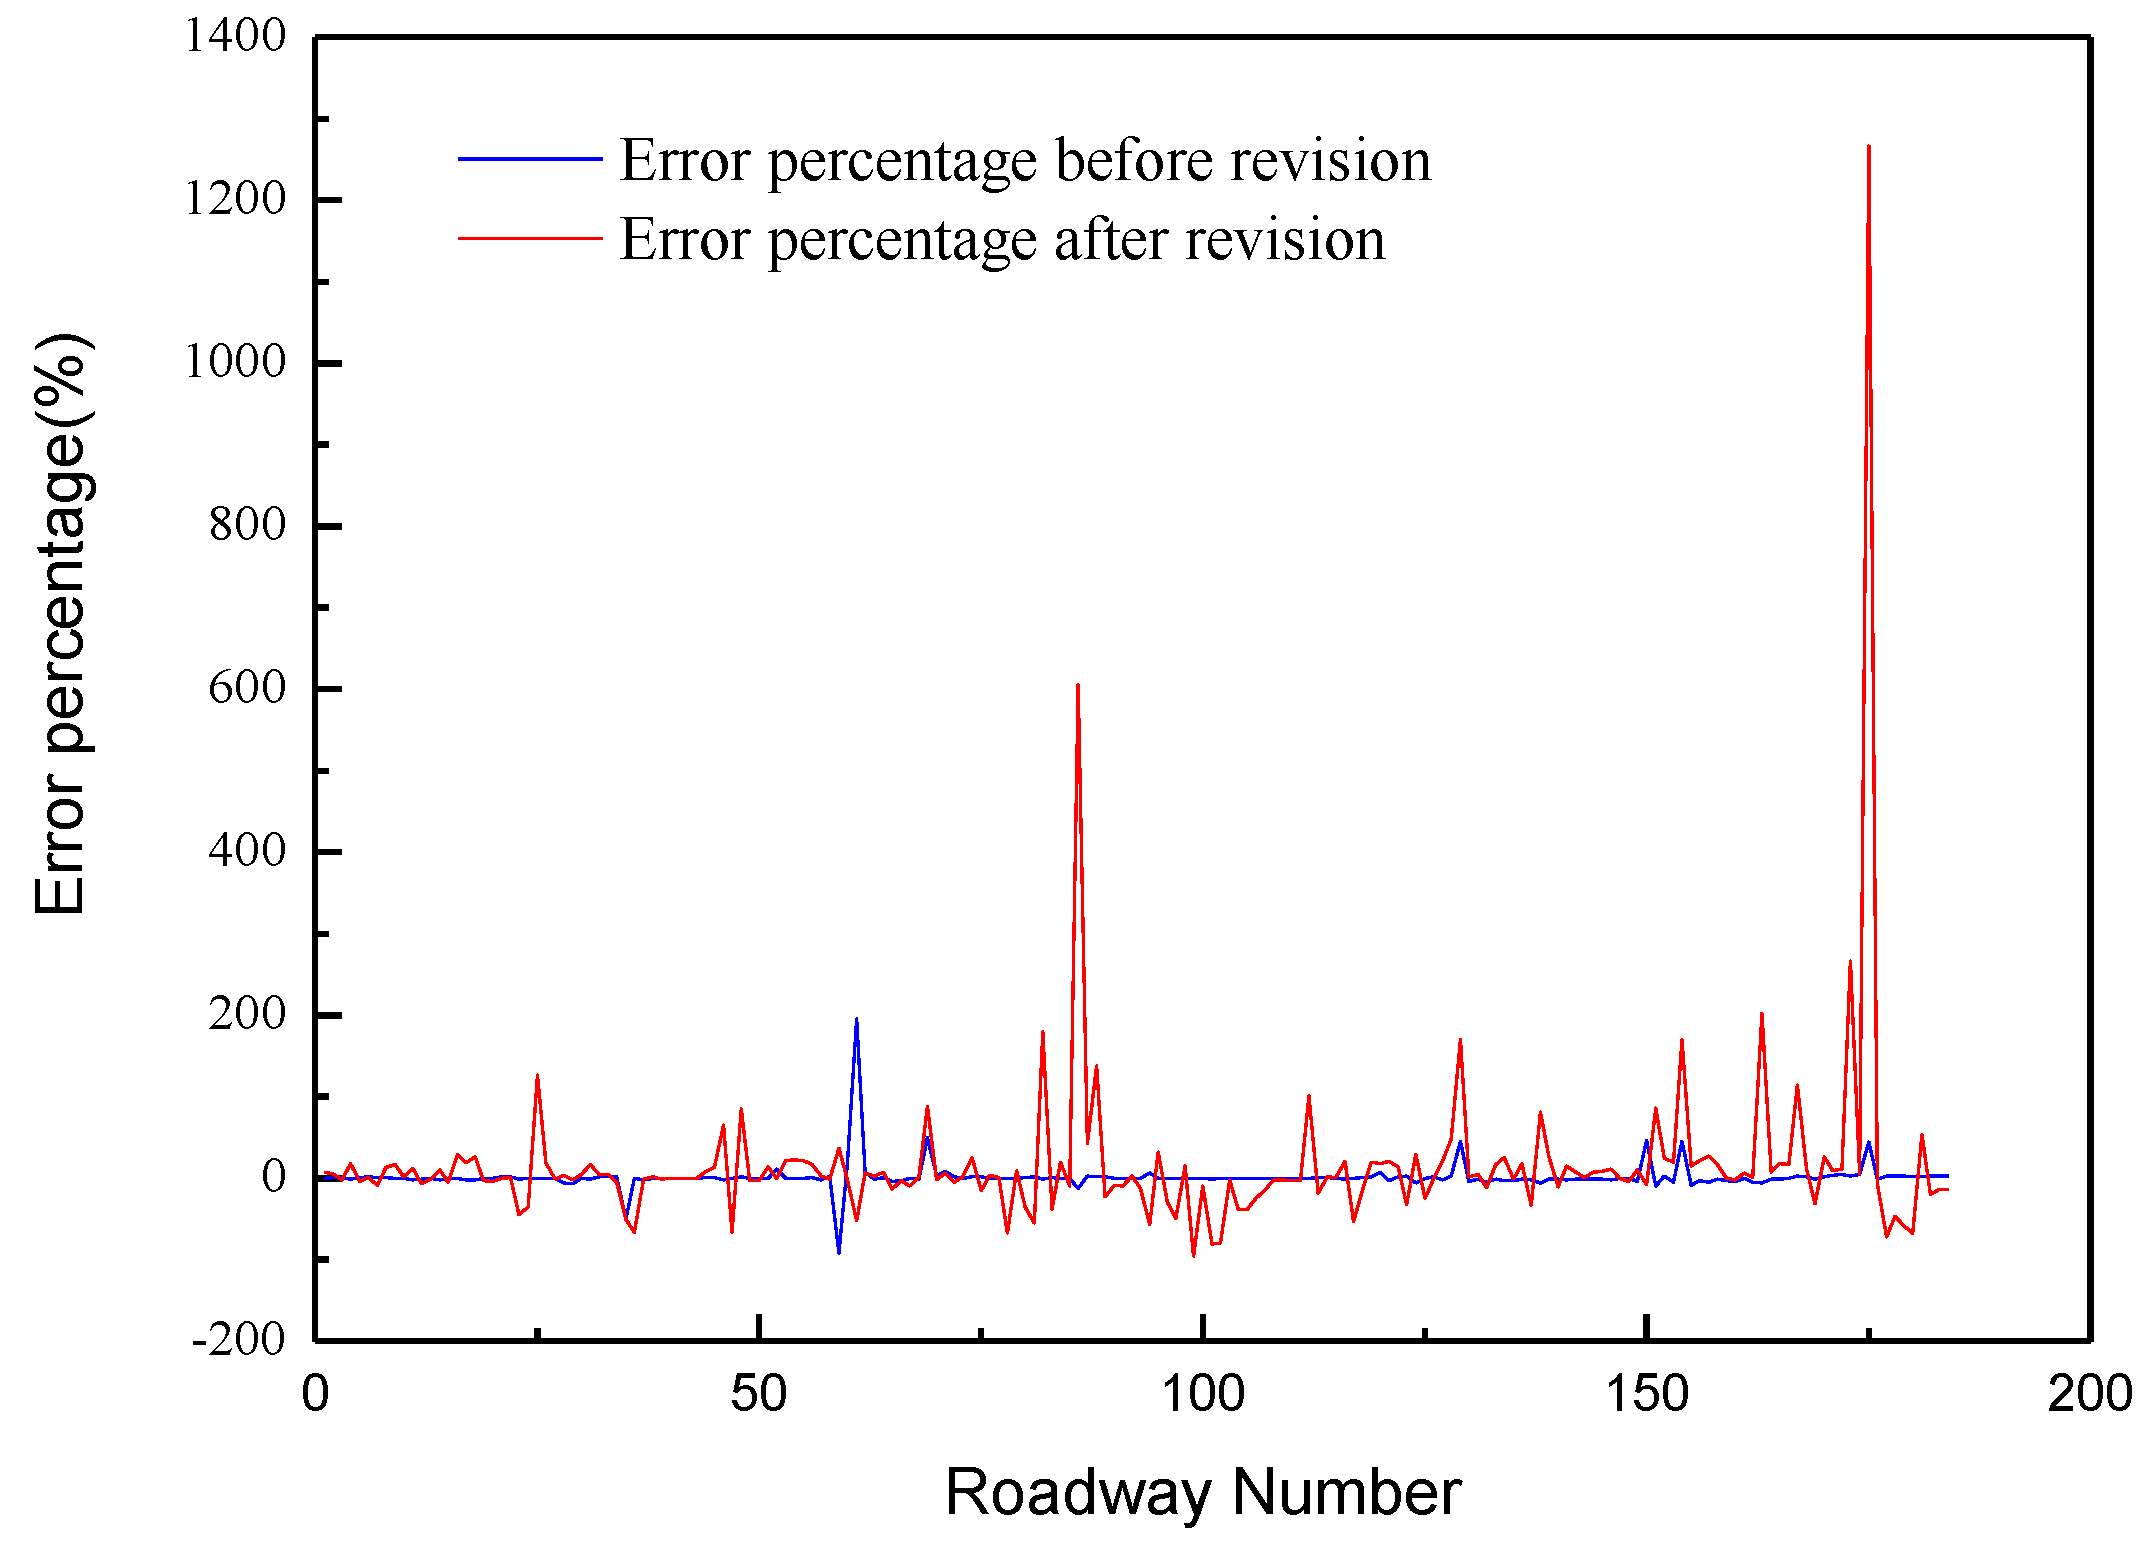
It is obvious that the simulated airflows in the calibrated model agree very well with the ventilation survey data. After the calibration, the overall error for the simulated airflow rate decreased from 17.26% to 1.42%. The simulated airflow rate errors of all of the roadways before and after the calibration are shown in Figure 5. It is evident that the calibrated airflow rates are much closer to the measured data than before the calibration. Most of the simulated airflow rates after calibration matched the measured data, proving this calibrating method is significantly effective. However, there are still some outliers with larger differences to the measured airflow. The airways with more than 10% differences compared to the measured data are listed in Table 1. One major reason for these larger differences is that the airflow rates in most of these airways are small, and a small difference in the model can cause large error when expressed in a percentage. For example, for roadway No. 52, only 0.1 m3/s deviation to the measure data resulted in 11% error. Larger differences also occurred more often in the shortcut airways. The measured resistances in such airways are susceptible to large errors; therefore, it is difficult for the calibration algorithm to find an optimal value nearby the measured values with large errors.
4. Discussion and Conclusions
In recent years, several optimization analyses for mine ventilation have been conducted with different algorithms [21,22,23]. However, none of them were applied to calibrate data for more accurate simulation. In this paper, a simple and effective way to calibrate a mine ventilation network model is proposed. The method uses a non-linear optimization algorithm to find resistance solutions nearby the measured data and achieves the simulated airflow rates that are very close to the measured ones. This method was then applied to a case study to calibrate roadways’ resistance. Finally, the results were discussed and the errors were analyzed. The results show that the simulated airflows in the calibrated model have much smaller errors, which proves the proposed calibrating method to be effective.
Such a calibrated MVN model ensures that the utilization and further modeling of such a network can provide accurate and instructional guidance for ventilation planning. Compared to existing methods, this method has the following advantages. First of all, this calibrating method is significantly effective with very high simulation precisions after calibration. Secondly, the proposed method is operational and cost-effective. Compared to the traditional calibration method of using repeated and time-consuming ventilation surveys, this mathematical calibration method can calibrate the ventilation network model quickly through solving a nonlinear optimization problem. Finally, the error of this method is controllable. A certain percent of error is allowed initially; if no optimal solutions can be found under such conditions, it means either incorrect data has been recorded or the ventilation survey accuracy needs to be improved.
Even though this calibrating method has many strengths, it still need to be improved in the following aspects. At first, as the same constraint conditions are applied to all of the roadways, some erroneous measured data may result in no solution for the objective function or the increase of the global error. It would be better if a further improved model could identify larger measured data. In addition, to achieve the minimum root mean square deviation (RMSD), some roadways’ error percentage may magnify. This can be improved by using the RMSD for relative resistance differences. Finally, it takes a great deal of time to write code for nonlinear optimization and input data. It would be more helpful if it were embedded in a commercial mine ventilation network simulation software, such as Ventsim or VNetPC. In conclusion, the calibration method proposed in this paper has great practical and scientific significance as it can calibrate ventilation models effectively to achieve much more accurate results.
Acknowledgments
This research project is supported by Independent Research Projects of State Key Laboratory of Coal Resources and Safe Mining, China University of Mining and Technology (SKLCRSM15KF01). The financial support from China Scholarship Council is acknowledged.
Author Contributions
Guang Xu and Jinxin Huang came up with the idea of data calibration. Jinxin Huang conducted simulation experiment. Guang Xu and Jinxin Huang wrote the paper. Baisheng Nie and Duncan Chalmers revised the paper. Zhuoming Yang collected on-site data.
Conflicts of Interest
The authors declare no conflict of interest.
References
- Cheng, J.; Yang, S. Data mining applications in evaluating mine ventilation system. Saf. Sci. 2012, 50, 918–922. [Google Scholar] [CrossRef]
- Parra, M.T.; Villafruela, J.M.; Castro, F.; Mendez, C. Numerical and experimental analysis of different ventilation systems in deep mines. Build. Environ. 2006, 41, 87–93. [Google Scholar] [CrossRef]
- Zhou, F.; Wei, L.; Chen, K.; Cheng, J. Analyses of cascading failure in mine ventilation system and its effects in a serious mine gas explosion disaster. J. Fail. Anal. Prev. 2013, 13, 538–544. [Google Scholar] [CrossRef]
- Brodny, J.; Tutak, M. Determination of the zone endangered by methane explosion in goaf with caving of longwalls ventilated on „Y” system. Manag. Syst. Prod. Eng. 2016, 4, 247–251. [Google Scholar]
- Kurnia, J.C.; Sasmito, A.P.; Mujumdar, A.S. CFD simulation of methane dispersion and innovative methane management in underground mining faces. Appl. Math. Model. 2014, 38, 3467–3484. [Google Scholar] [CrossRef]
- Cheng, J.; Yang, S.; Luo, Y. Mathematical models for optimizing and evaluating mine ventilation system. In Proceedings of the 13th United States/North American Mine Ventilation Symposium, Sudbury, ON, Canada, 13–16 June 2010; pp. 278–285. [Google Scholar]
- Widzyk-Capehart, E.; Watson, B. Agnew Gold Mine Expansion Mine Ventilation Evaluation Using Ventsim. In Proceedings of the 7th International Mine Ventilation Congress, Cracow, Poland, 17–22 June 2001; pp. 345–352. [Google Scholar]
- Feng, W.; Zhu, F.; Lv, H. The use of 3D simulation system in mine ventilation management. Procedia Eng. 2011, 26, 1370–1379. [Google Scholar]
- Şuvar, M.C.; Lupu, C.; Arad, V.; Cioclea, D.; Păsculescu, V.M.; Mija, N. Computerized simulation of mine ventilation networks for sustainable decision making process. Environ. Eng. Manag. J. 2014, 13, 1445–1451. [Google Scholar]
- Morar, M.S.; Radu, S.M.; Cioclea, D.; Gherghe, I. Use of IT equipment and specialized programs for solving ventilationnetworks. Calitatea 2017, 18, 121–126. [Google Scholar]
- Cheng, L.H.; Ueng, T.H.; Liu, C.W. Simulation of ventilation and fire in the underground facilities. Fire Saf. J. 2001, 36, 597–619. [Google Scholar] [CrossRef]
- Stefopoulos, E.K.; Damigos, D.G. Design of emergency ventilation system for an underground storage facility. Tunn. Undergr. Space Technol. 2007, 22, 209–302. [Google Scholar] [CrossRef]
- Kurnia, J.; Sasmito, A.; Mujumdar, A. Computational Study of Thermal Management in Underground Coal Mines: Effect of Operating Ventilation Parameters; National University of Singapore: Singapore, 2012. [Google Scholar]
- Dziurzyński, W.; Krach, A.; Pałka, T. A reliable method of completing and compensating the results of measurements of flow parameters in a network of headings/O pewnej metodzie uzupełniania I wyrównywania wyników pomiarów parametrów przepływu w sieci wyrobisk górniczych. Arch. Min. Sci. 2015, 60, 3–24. [Google Scholar] [CrossRef]
- Rowland, J.A. Ventilation Surveys and Modelling—Execution and Suggested Outputs. In Proceedings of the 11th Underground Coal Operator’s Conference, Wollongong, Australia, 10–11 February 2011; pp. 214–224. [Google Scholar]
- Wei, L.J.; Zhou, F.B.; Cheng, J.W.; Luo, X.R.; Li, X.L. Classification of structural complexity for mine ventilation networks. Complexity 2015, 21, 21–34. [Google Scholar] [CrossRef]
- Zhang, G. Ventilation Safety Science; China University of Mining & Technology Press: Xuzhou, China, 2011. [Google Scholar]
- Hu, Y.; Koroleva, O.I.; Krstić, M. Nonlinear control of mine ventilation networks. Syst. Control Lett. 2003, 49, 239–254. [Google Scholar] [CrossRef]
- McPherson, M.J. Subsurface Ventilation and Environmental Engineering; Springer Science & Business Media: New York, NY, USA, 2012. [Google Scholar]
- Wang, Y.J.; Mutmansky, J.M. Modeling mine ventilation networks using five basic network elements. Min. Eng. 1997, 49, 65–69. [Google Scholar]
- Sui, J.; Yang, L.; Zhu, Z.; Fang, H.; Hua, Z. Mine ventilation optimization analysis and airflow control based on harmony annealing search. JCP 2011, 6, 1270–1277. [Google Scholar] [CrossRef]
- Nyaaba, W.; Frimpong, S.; El-Nagdy, K.A. Optimisation of mine ventilation networks using the Lagrangian algorithm for equality constraints. Int. J. Min. Reclam. Environ. 2015, 29, 201–212. [Google Scholar] [CrossRef]
- Ghaffari, S.; Aghajani, G.; Noruzi, A.; Hedayati Mehr, H. Optimal economic load dispatch based on wind energy and risk constrains through an intelligent algorithm. Complexity 2016, 21, 494–506. [Google Scholar] [CrossRef]
Figure 1.
Flowchart of mine ventilation network (MVN) calibration.
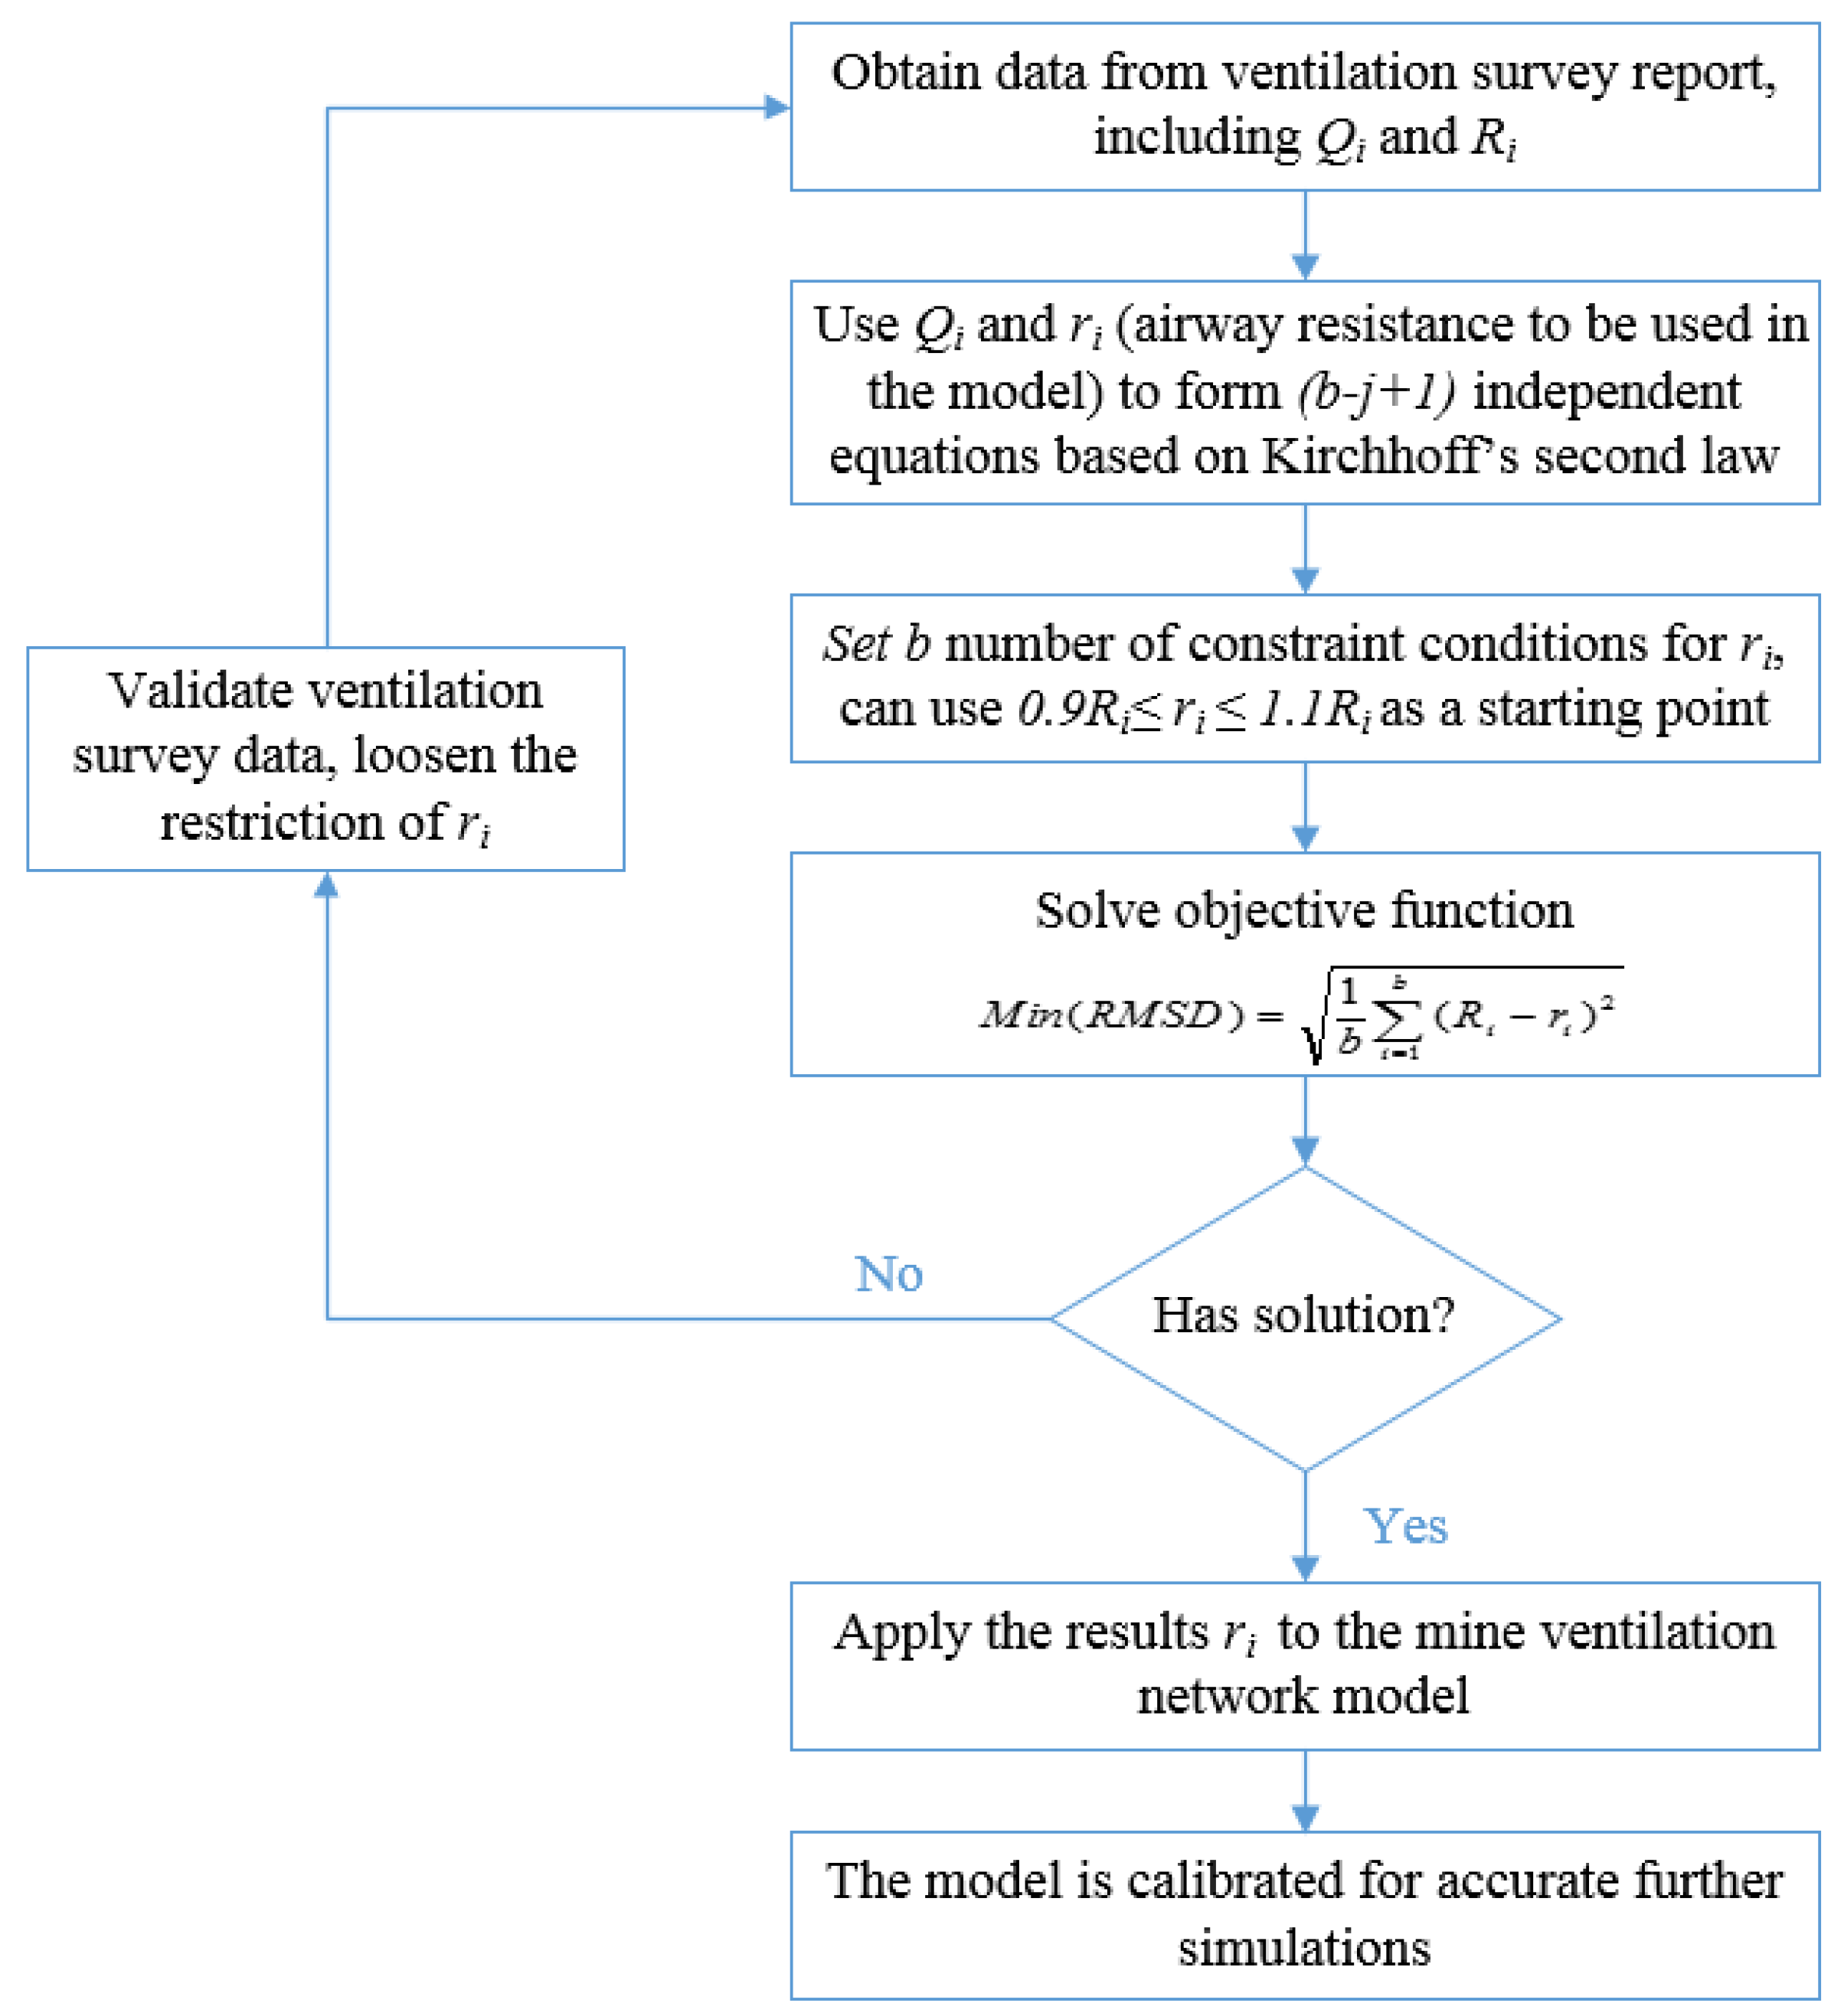
Figure 2.
Mine ventilation three-dimensional (3D) model.
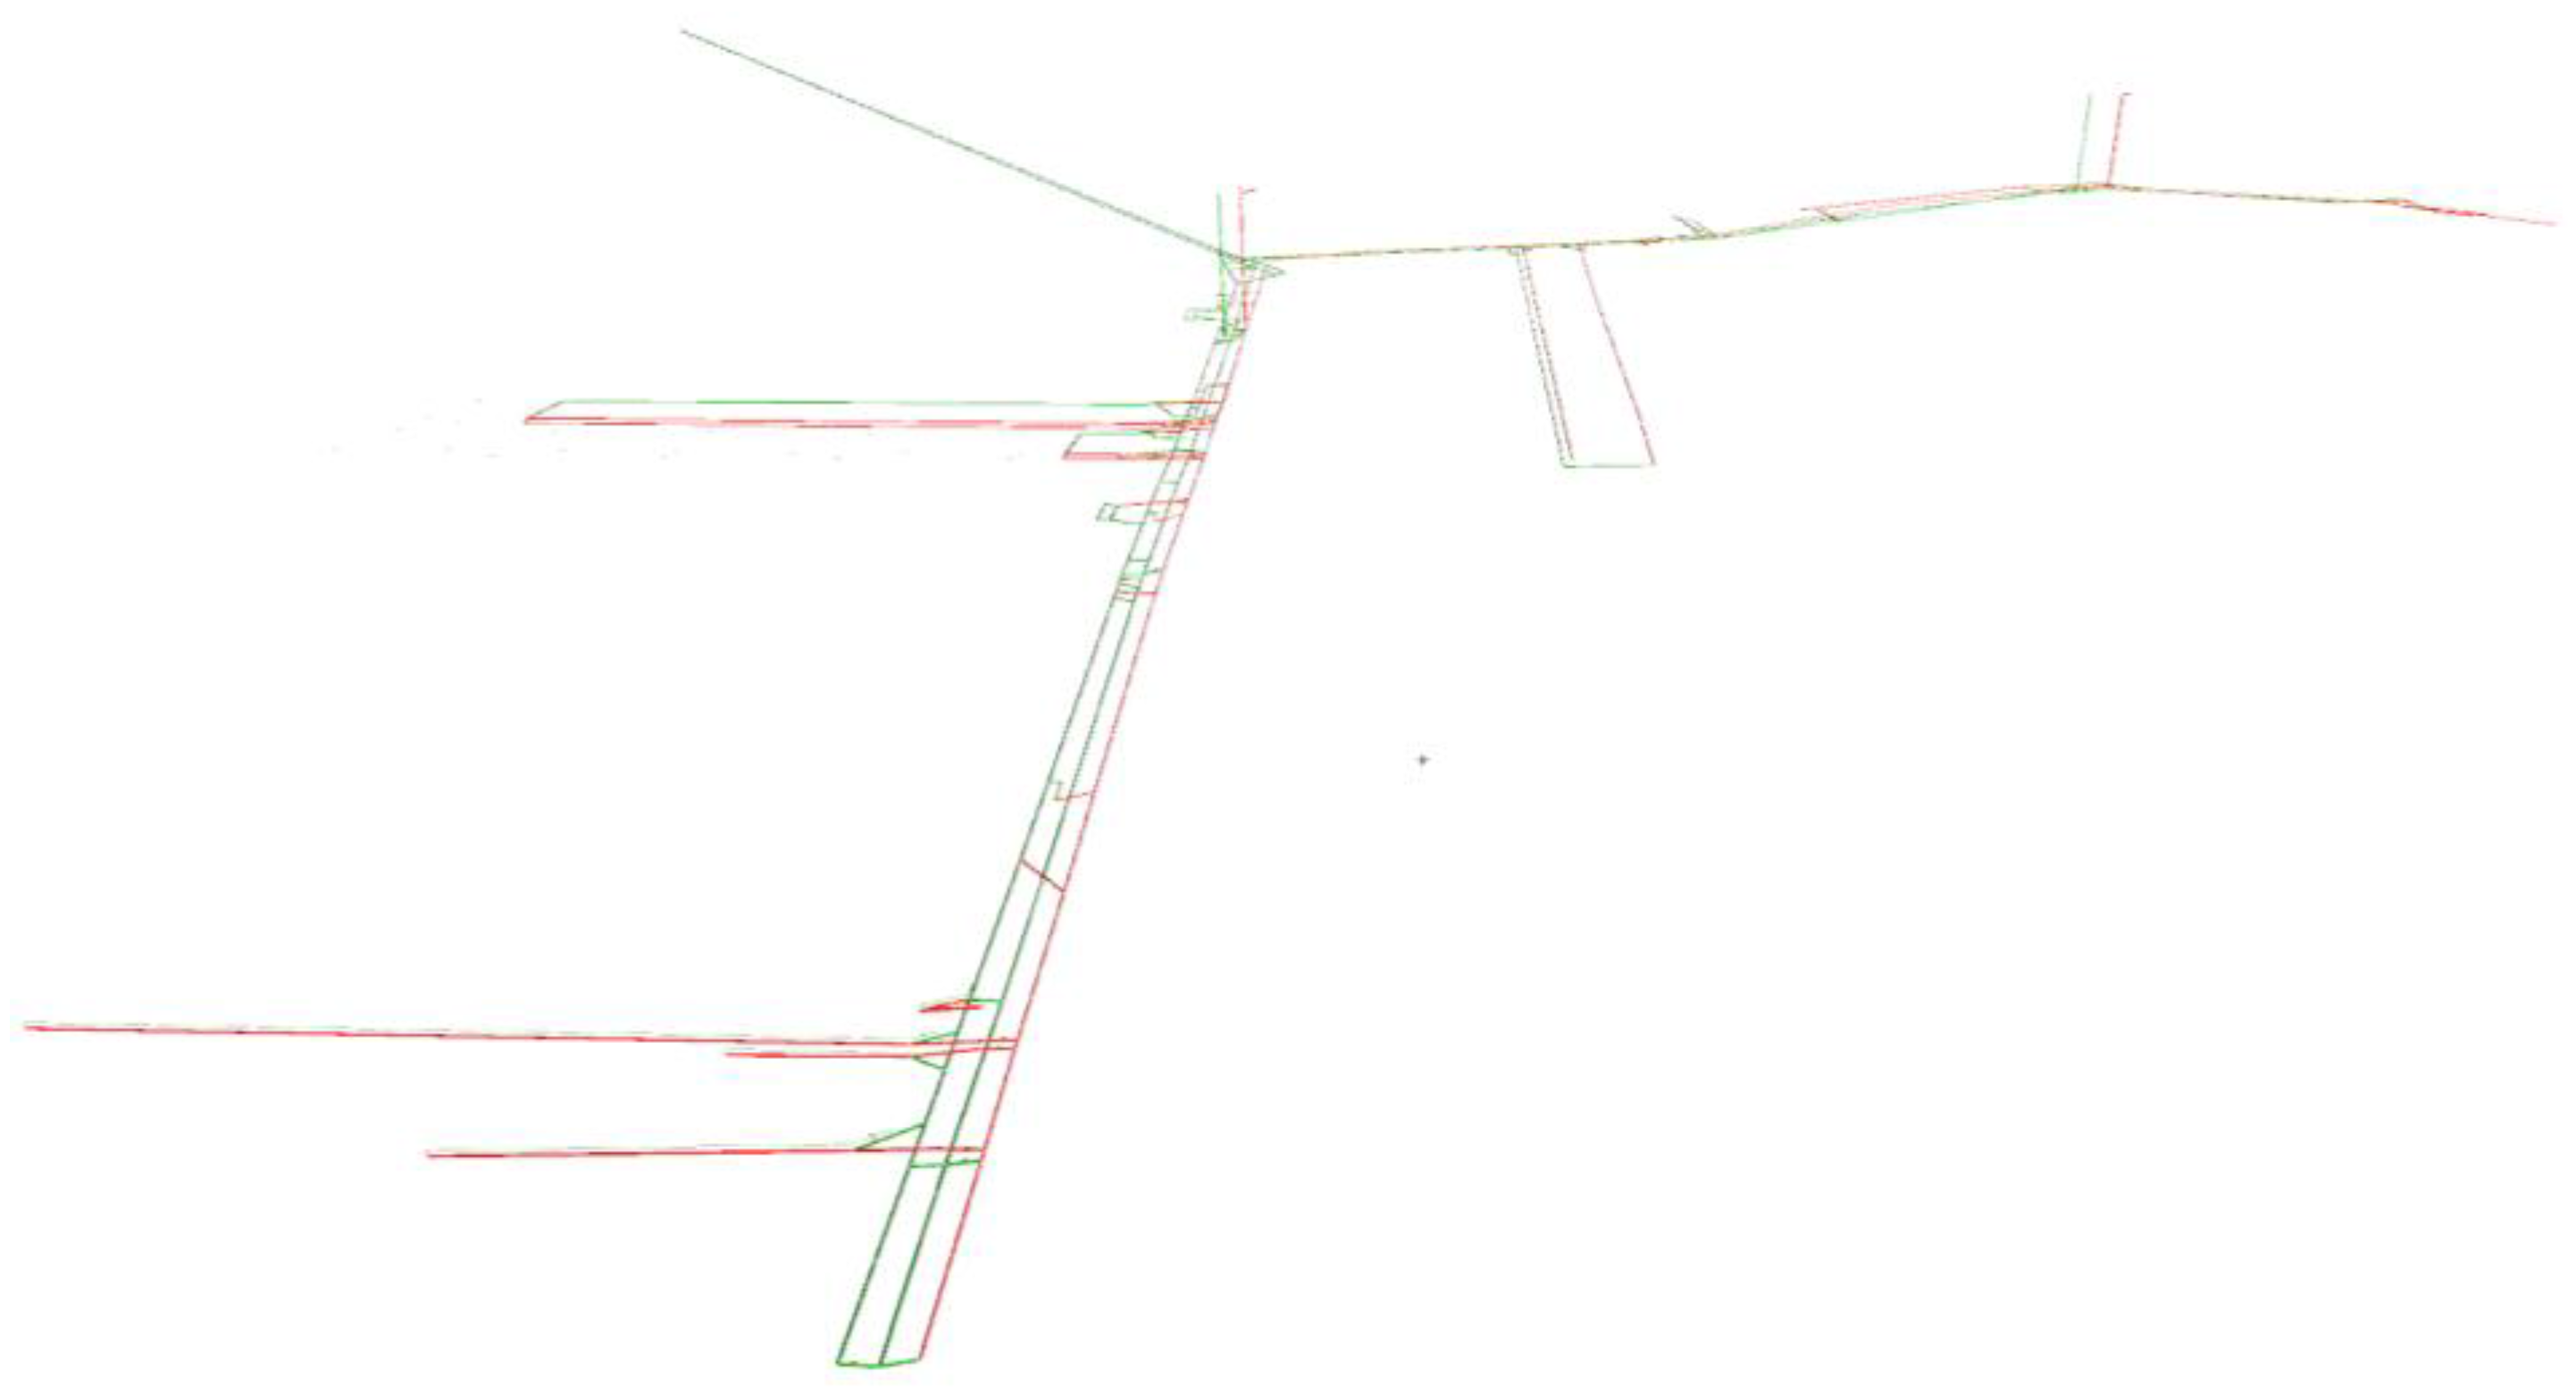
Figure 3.
Comparison of simulated airflow rate and measured data.

Figure 4.
Deviation of calibrated simulated airflow rates.

Figure 5.
Error percentage of simulated airflow rate before and after revision.


Table 1.
Roadways with more than 10% airflow rate error.
| Roadway Number | Measured Airflow Rate (m3/s) | Simulated Airflow Rate after Revision (m3/s) | Error Percentage |
|---|---|---|---|
| 35 | 1.2 | 0.6 | −50.00% |
| 52 | 0.9 | 1.0 | 11.11% |
| 59 | 6.3 | 0.5 | −92.06% |
| 61 | 2.5 | 7.4 | 196.00% |
| 69 | 4.0 | 6.0 | 50.00% |
| 86 | 3.3 | 2.9 | −12.12% |
| 129 | 2.0 | 2.9 | 45.00% |
| 150 | 13.3 | 19.5 | 46.62% |
| 154 | 2.0 | 2.9 | 45.00% |
| 175 | 0.9 | 1.3 | 44.44% |
© 2017 by the authors. Licensee MDPI, Basel, Switzerland. This article is an open access article distributed under the terms and conditions of the Creative Commons Attribution (CC BY) license (http://creativecommons.org/licenses/by/4.0/).
Share and Cite
MDPI and ACS Style
Xu, G.; Huang, J.; Nie, B.; Chalmers, D.; Yang, Z. Calibration of Mine Ventilation Network Models Using the Non-Linear Optimization Algorithm. Energies 2018, 11, 31. https://doi.org/10.3390/en11010031
AMA Style
Xu G, Huang J, Nie B, Chalmers D, Yang Z. Calibration of Mine Ventilation Network Models Using the Non-Linear Optimization Algorithm. Energies. 2018; 11(1):31. https://doi.org/10.3390/en11010031
Chicago/Turabian StyleXu, Guang, Jinxin Huang, Baisheng Nie, Duncan Chalmers, and Zhuoming Yang. 2018. "Calibration of Mine Ventilation Network Models Using the Non-Linear Optimization Algorithm" Energies 11, no. 1: 31. https://doi.org/10.3390/en11010031
Note that from the first issue of 2016, this journal uses article numbers instead of page numbers. See further details here.