Multi-Phase Modular Drive System: A Case Study in Electrical Aircraft Applications

1
Modeling, Information & Systems Lab (MIS), University of Picardie Jules Verne, 80025 Amiens, France
2
Graduate School of Electronic and Electrical Engineering, ESIEE Amiens, 80080 Amiens, France
*
Author to whom correspondence should be addressed.
Energies 2018, 11(1), 5; https://doi.org/10.3390/en11010005
Submission received: 27 October 2017
/
Revised: 8 December 2017
/
Accepted: 18 December 2017
/
Published: 21 December 2017
(This article belongs to the Special Issue Emerging Power Electronics Technologies for Power Systems and Machine Drives)
Abstract
:In this article, an advanced multiphase modular power drive prototype is developed for More Electric Aircraft (MEA). The proposed drive is designed to supply a multi-phase permanent magnet (PM) motor rating 120 kW with 24 slots and 11 pole pairs. The power converter of the drive system is based on Silicon Carbide Metal Oxide Semiconductor Field-Effect Transistor (SiC MOSFET) technology to operate at high voltage, high frequency and low reverse recovery current. Firstly, an experimental characterization test is performed for the selected SiC power module in harsh conditions to evaluate the switching energy losses. Secondly, a finite element thermal analysis based on Ansys-Icepak is accomplished to validate the selected cooling system for the power converter. Thirdly, a co-simulation model is developed using Matlab-Simulink and LTspice® to evaluate the SiC power module impact on the performance of a multiphase drive system at different operating conditions. The results obtained show that the dynamic performance and efficiency of the power drive are significantly improved, which makes the proposed system an excellent candidate for future aircraft applications.
1. Introduction
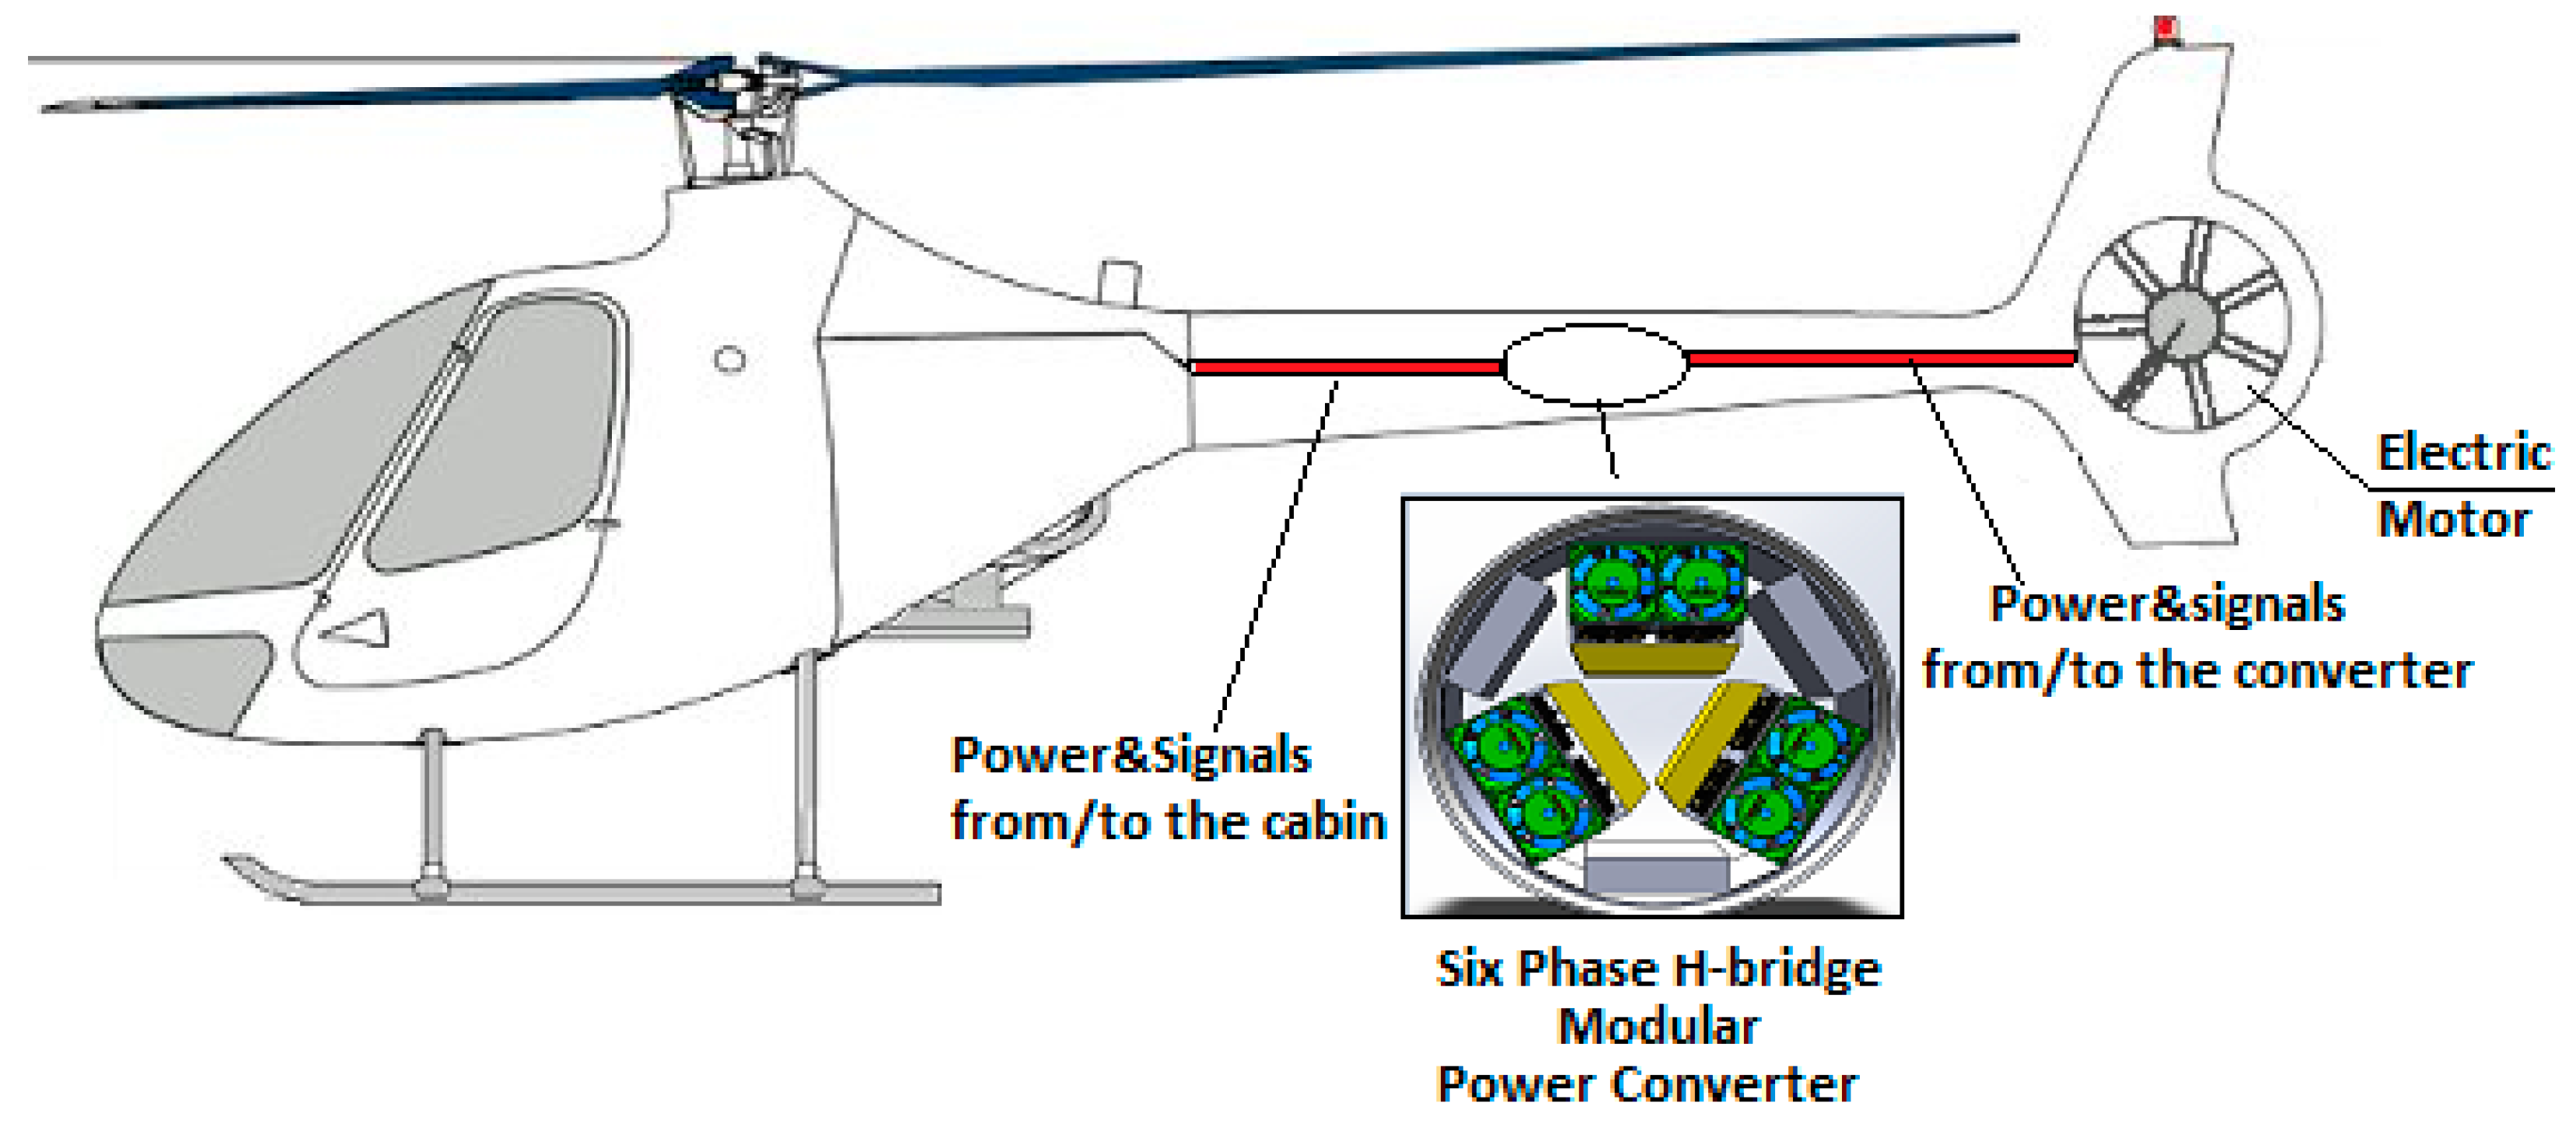
The need to increase electrical energy proportion in transportation applications has given birth to the concept of More Electric Aircraft (MEA). The aim is to reduce the ecological impact of the vehicle [1]. The helicopter of Figure 1 is the vehicle considered in this work. In order to replace the Fenestron® tail rotor by an electric machine [2], a power drive system is developed considering multiple constraints such as reliability, fault tolerance, efficiency and weight.
Conventional three-phase machines are very popular in electrical engineering but have a critical drawback: the loss of a single phase severely impacts the operation and performance of the machine. Therefore, these machines have limited fault-tolerant capabilities [3,4,5,6,7,8,9]. Permanent Magnet (PM) motors offer several possibilities from the control point of view. In fact, a number of studies [5,10,11,12,13] prove that they can be designed, optimized and controlled to achieve high power density, low noise, low cogging torque, high efficiency and adaptability for flux-weakening regions. Considering multi-phase PM machines, they have a variety of applications in many areas such as automobiles, robotics, renewable energies, and aerospace [14,15]. A six-phase PM motor is considered in this work.
A fault-tolerant power electronic architecture is necessary to drive the fault-tolerant machine which is considered. Assuming the availability of an appropriate DC source, topologies of fault-tolerant DC/AC converters supplying independent motor phases (H-bridge) exist in the literature. The configurations of the single-phase multi-level inverter (SPMLI) and the single-phase H-bridge inverter (SPHBI) as well as the zero-voltage-switching H-bridge inverter (ZVSHBI) [3,16,17,18] stand out because they only require one power supply compared to 5-level and 7-level inverters. Hence, they are appropriate to the application. Besides, the SPMLI configuration presents a very small total harmonic distortion (THD) and a simplified control strategy, compared to the ZVSHBI configuration.
The circuit configuration of the SPHBI is simple and reliable, and cost-effective implementation is possible. Moreover, this configuration allows the independent driving of motor phases, leading to flexible control. Each motor phase is therefore driven from a separate SPHBI which ensures complete electrical isolation between phases such that continued operation is possible even with a power device or winding fault.
The efficiency of this topology can be improved, granted the reduction of switching losses through the use of advanced semiconductor power switches such as Silicon Carbide Metal Oxide Semiconductor Field-Effect Transistor (SiC MOSFETs). Recently, SiC powered MOSFETs are being considered as serious candidates in designing power converters for different applications due to their superior material advantages, such as wider bandgap, high thermal conductivity and higher critical breakdown field strength [19,20]. They can provide lower power losses than Si devices and consequently increase the efficiency of power converters at switching frequencies higher than 12 kHz, [21]. Dissipating lower switching power losses favors the reduction of heat sink volume and weight. The characterization tests of such new power modules leads to better efficiency calculations and, subsequently, improve the heatsink design [22,23,24].
In this paper, an advanced power drive prototype based on SiC MOSFET technology is designed, modeled and experimentally tested for aerospace applications. A double pulse test is implemented to characterize and evaluate the switching energy losses of the utilized SiC MOSFETs. Then, a finite element (FE) thermal analysis based on Ansys-Icepak is carried out in order to design and validate the cooling system for the power converter. Finally, a co-simulation model is developed using Matlab-Simulink (MathWorks, Natick, MA, USA) (containing the model of the electrical machine and its control system) and LTspice® (Linear Technology Corporation, Milpitas, CA, USA) (containing the model of the SiC H-bridge converter) to evaluate the impact of the SiC module on the performance of a multi-phase drive system under different operating conditions. The results show that the thermal and dynamic performances of the power drive are significantly improved, making the proposed system an excellent candidate for aircraft applications. This paper is organized as follows: Section 2 presents the system description of the electrical aircraft; Section 3 covers the system modeling, which encompasses the converter, PM motor and control models; the results and discussions are presented in Section 4; finally, the major conclusions are highlighted in Section 5.
2. System Description
The system under consideration is depicted in Figure 1. The electric motor drives the tail rotor of a helicopter [13]. In order to ensure the maximum reliability, safe operation and fault tolerant capabilities of the motor-drive system for this application, the following design decisions have been taken:
- Six phase PM brushless motor with independent motor phases;
- Independent feeding power electronics for each motor phase;
- Independent current control algorithm for each motor phase.
The single phase model can be adopted to represent the full machine behavior by replicating the model for each phase and considering the appropriate phase delay. In this way, the model allows the computation of the dynamic performance of the motor including simplified modeling of the control system and the power converter. The topology of the multi-phase drive is described in the following sections.
2.1. Power Converter
The main objective of this paper is the design, modeling and testing of the power converter, along with its cooling system. The proposed power converter is implemented using six full-bridges with two SiC half-bridge power modules per phase and a 12.5 kHz switching frequency. SiC Power MOSFET is selected as an advanced technology, because of its advantages compared to Si. For instance, SiC allows higher switching frequencies, lower losses, and is suitable for high performance applications in many engineering fields. In this work, the dynamic behavior of one phase will be studied, considering that each phase has the same power rating. The SiC MOSFET and converter modeling will be discussed in Section 3.1.1.
2.2. Electric Motor
A 120 kW/3600 rpm motor is constructed based on six independent phases with embedded permanent magnets on the rotor. The motor, with 11 pole pairs, is characterized by a flux table obtained by finite element (FE) analysis to account for current and position variability. The modeling of this machine and its control system will be described briefly in Section 3.1.2 as the main aim of this paper is to cover in detail all issues related to the power converter and its cooling system. The electrical and thermal machine models, as well as the control algorithm, are introduced and discussed in detail in [13,14,15]. In [13], the transient analysis of the motor-drive system is introduced, including current and torque waveforms. The machine model and its performance in two operating modes, the healthy and faulty modes, have been investigated in [15] using a finite element model.
3. System Modeling
In this section the electrical co-simulation model for the power converter and electrical machine, as well as the converter thermal model, will be presented, discussed and analyzed.
3.1. Electrical Co-Simulation Model
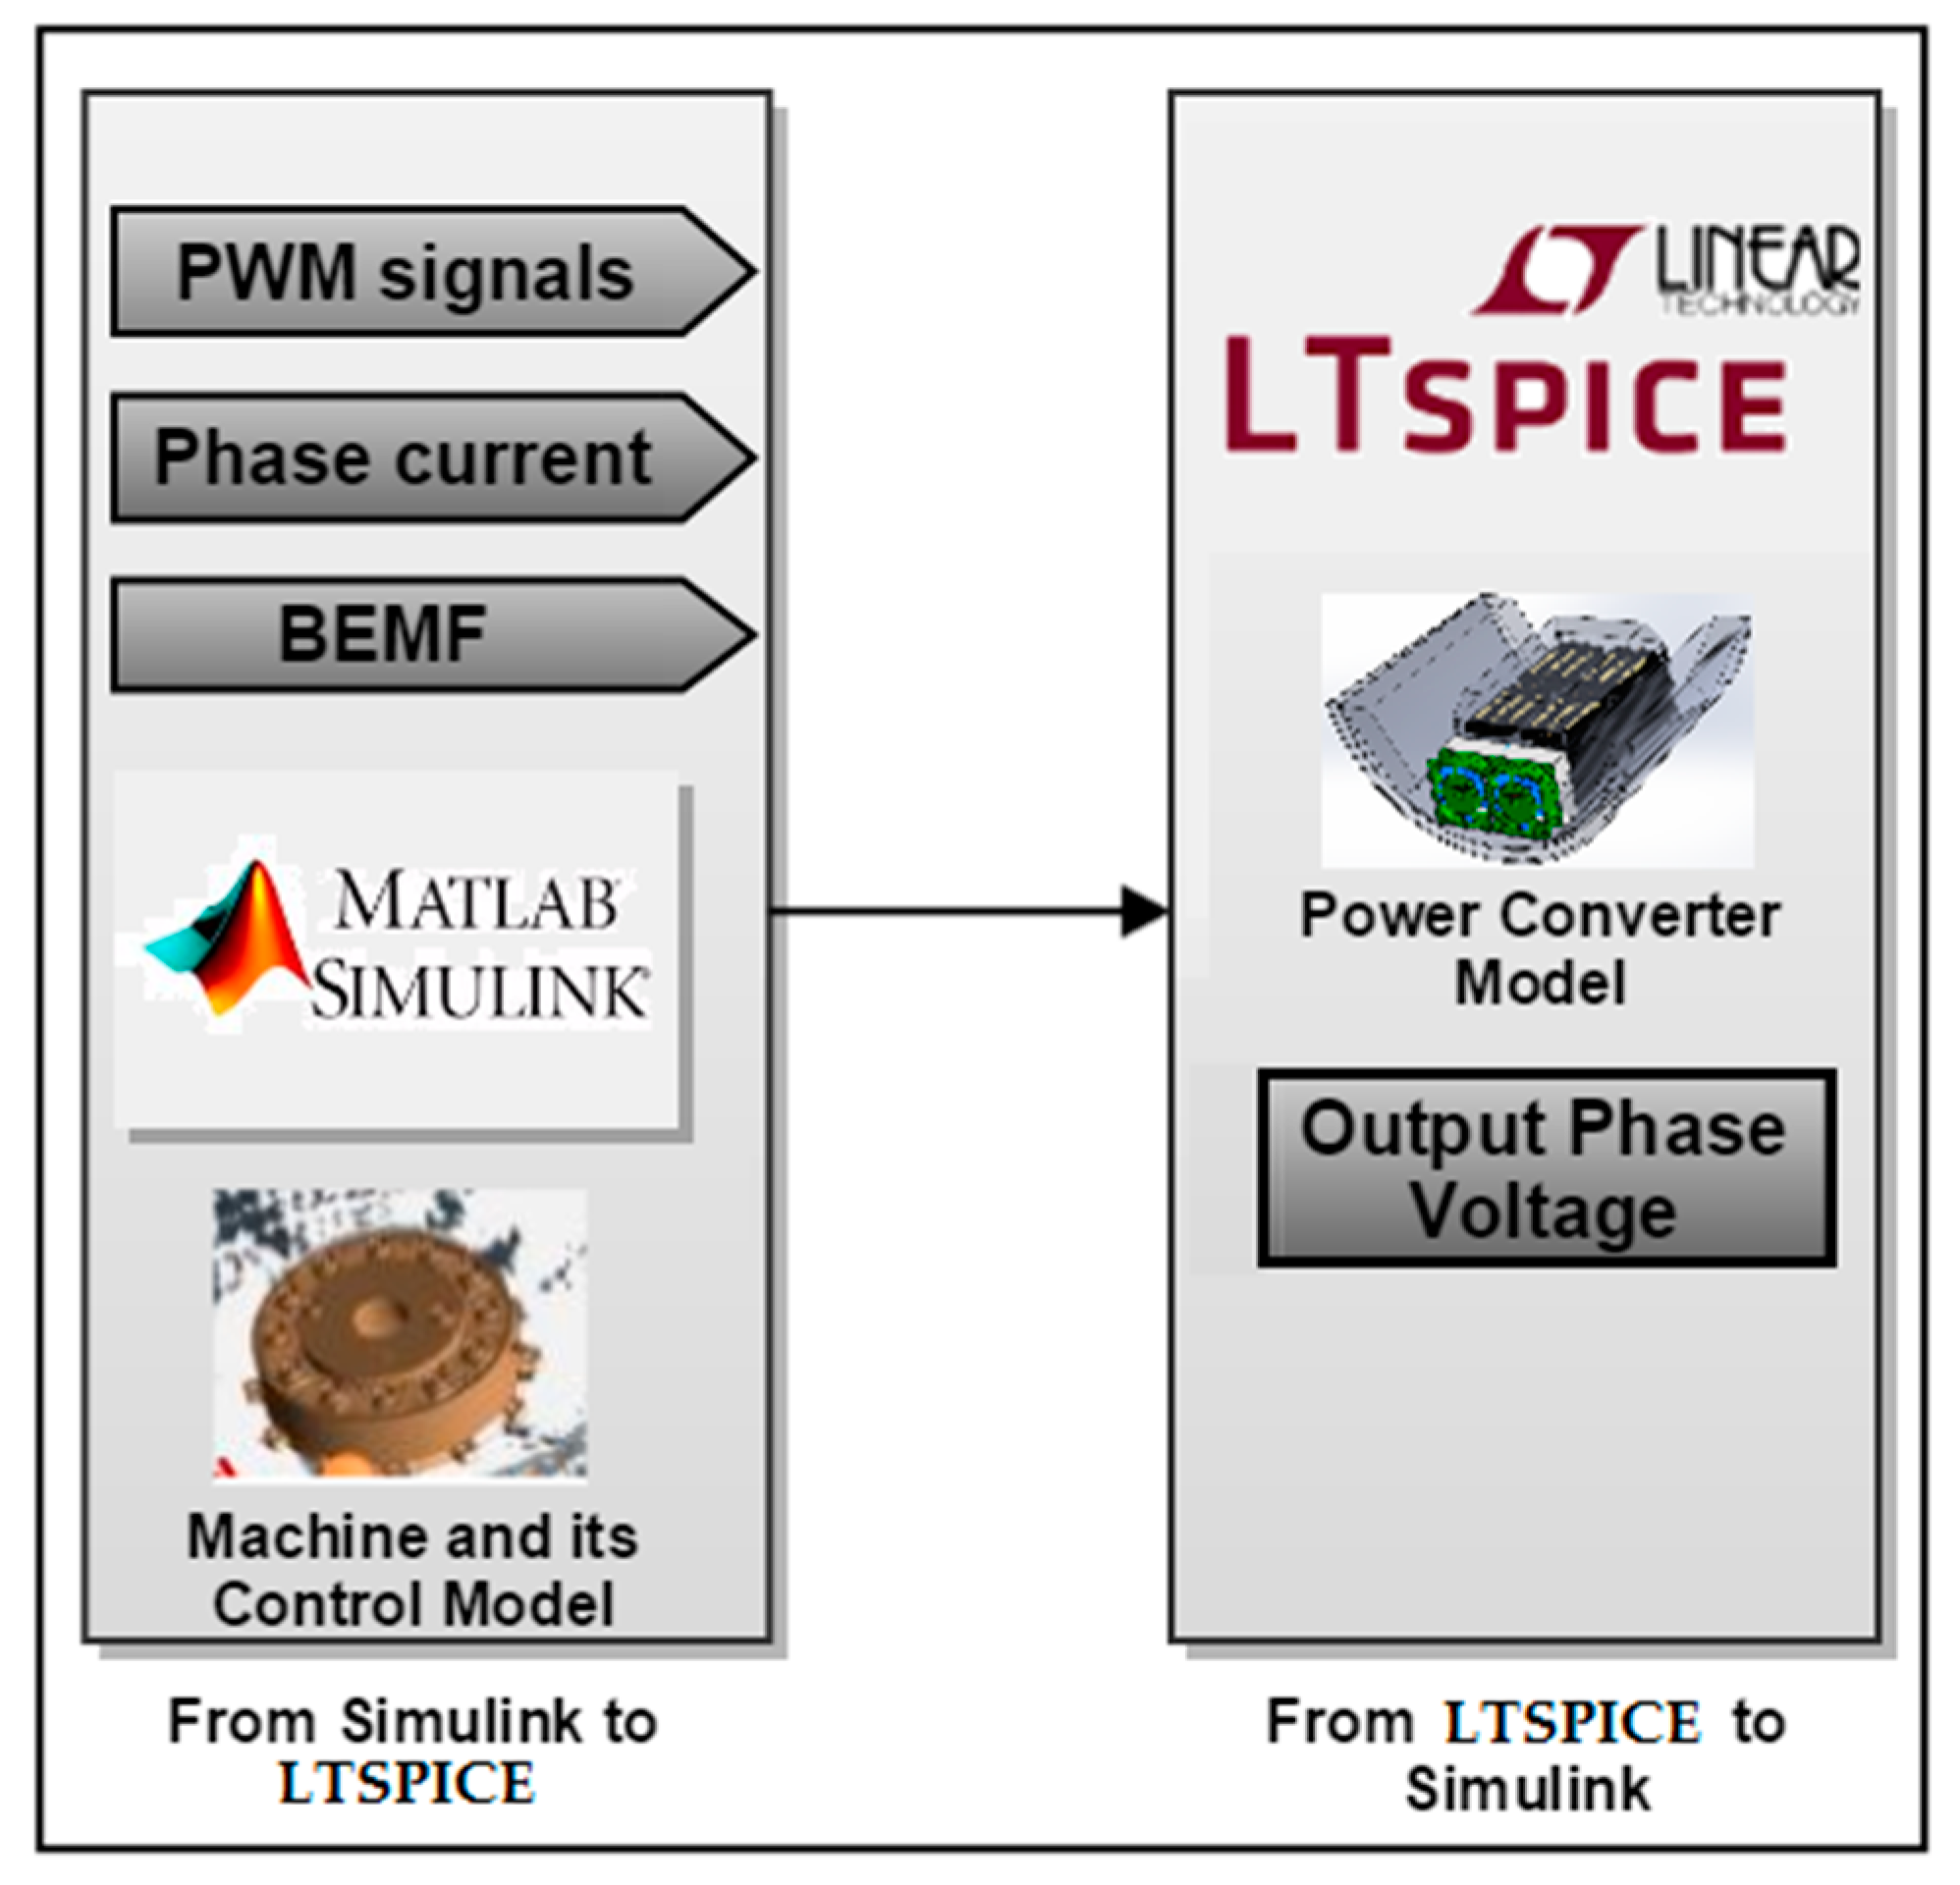
The Simulink/LTspice® co-simulation model shown in Figure 2 is used to evaluate the converter’s behavior: losses and efficiency. The motor and its control strategy are built in Simulink, and the converter is built in LTspice®. The converter model is built based on the power module CAS325M12HM2 manufactured by CREE® (Durham, NC, USA) [19]. Three variables Pulse Width Modulation (PWM) signals for each H-bridge, phase current and back electromagnetic force) are sent from Simulink to the converter in LTspice®. Then, LTspice® performs the losses and performance analysis. The next sections will explain the converter and the machine models in details.
3.1.1. Power Converter Electrical Model
The converter model is developed in LTspice®. For high performance drive systems, the switching device needs to be selected based on its performance given the targeted operating conditions. SiC MOSFET technology is chosen for its reduced power losses for switching frequencies higher than 12 kHz [20,21,22]. The CAS325M12HM2 [19] MOSFET from CREE is rated at 1.2 kV, 444 A, which is convenient for the application considered here.
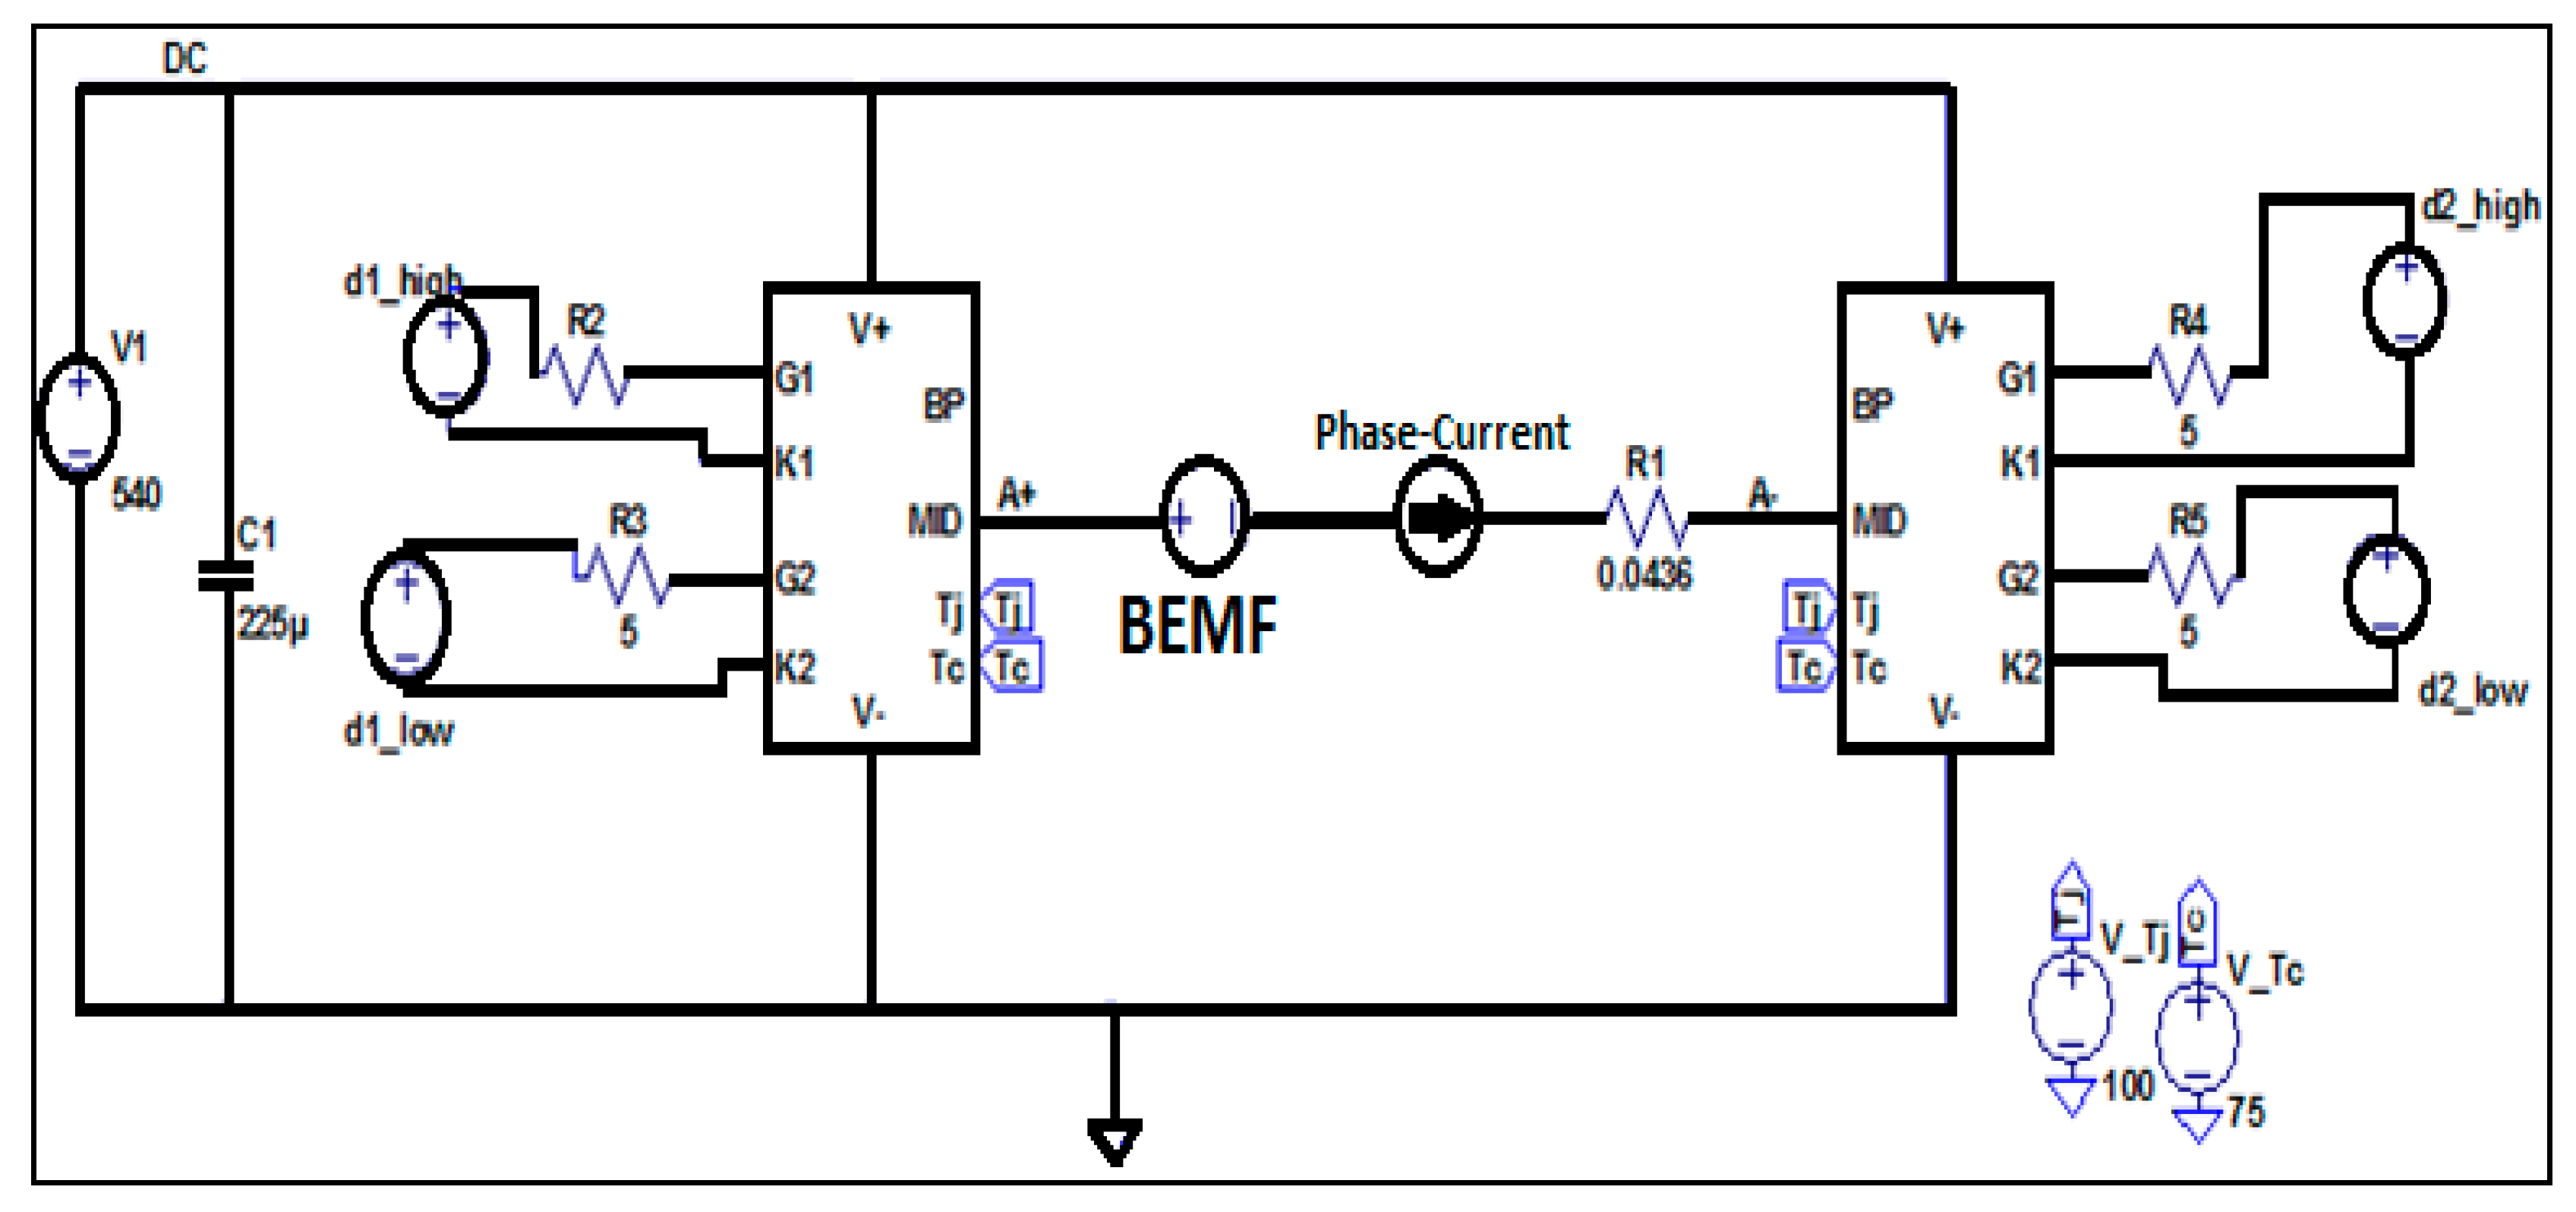
The schematic of the LTspice® power converter model is shown in Figure 3. The DC voltage is regulated at 540 V and the gate resistances at 5 Ω. The PWM control comes directly from the Matlab/LTspice® model via the co-simulation setup that was described above. Likewise, the output current and the back-electromotive force (BEMF) are imposed by Simulink.
3.1.2. Electrical Machine Model
As demonstrated in [12,13], a non-linear approach allows to accurately consider the behavior of fault-tolerant permanent-magnet (PM) machines. The Differential Voltage Drop Method (DVDM) is based on the independent phase model given by the voltage equation for the single independent phase:
with , , , and ψ: the voltage, the resistance, the current, the position and the flux, respectively. The second term of (1) can be decomposed into (2): a sum of differentials one in terms of the position for a constant current and another in terms of the current for a constant position.
Considering an independent phase and the permanent magnet, the flux can be expressed as the sum of magnetic flux and leakage inductance .
By combining (2) and (3), Equations (4) and (5) can be written:
with being the back-electromotive force (BEMF) factor and the static self-inductance. The relationship between the rotor’s position and the mechanical speed is given by (6):
Therefore, starting from (1), it is possible to write the voltage balance as follows:
Considering (7) and the overall voltage across the phase winding, the BEMF , and the differential voltage drop are then defined as (8) and (9).
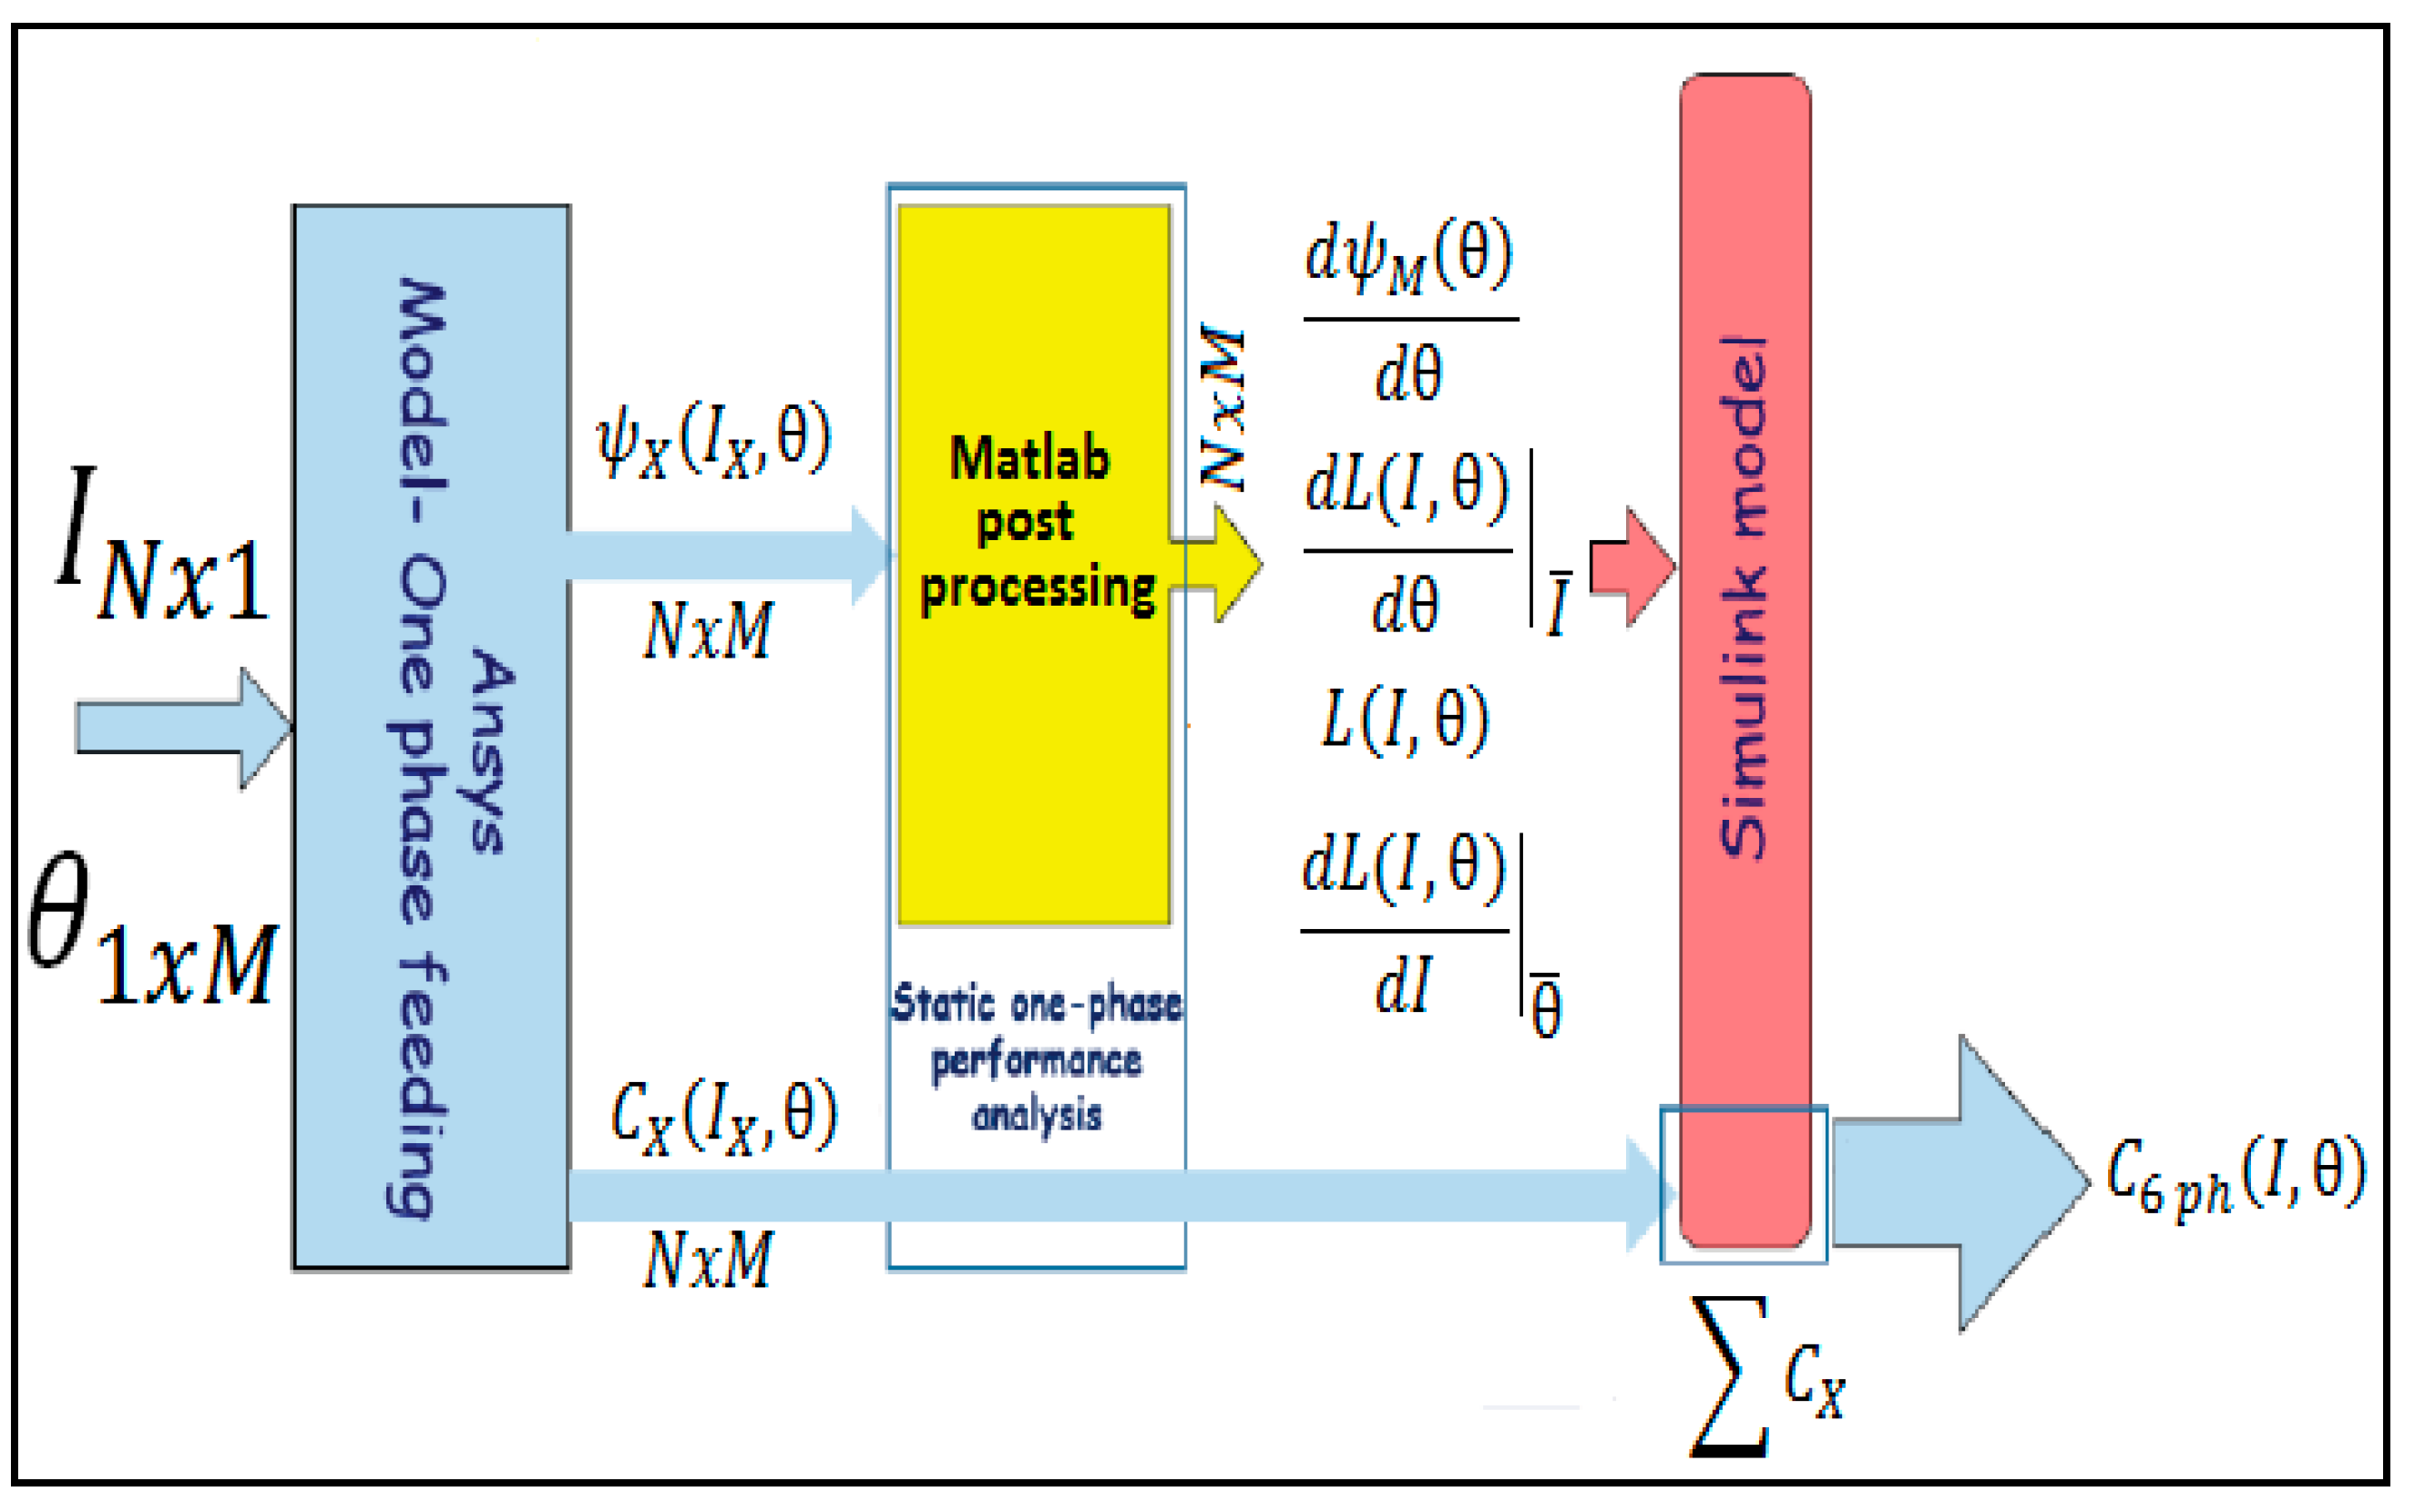
Thus, the six-phase PM motor is modeled in Matlab/Simulink and simulated in an off-line co-simulation with the Ansys Finite-Element (FE) model of the machine, as is shown in Figure 4:
- The flux and torque behaviors are extracted from the FE analysis, in the form of accurate lookup tables;
- The nonlinearity functions are computed in Matlab;
- The Simulink model applies the DVDM.
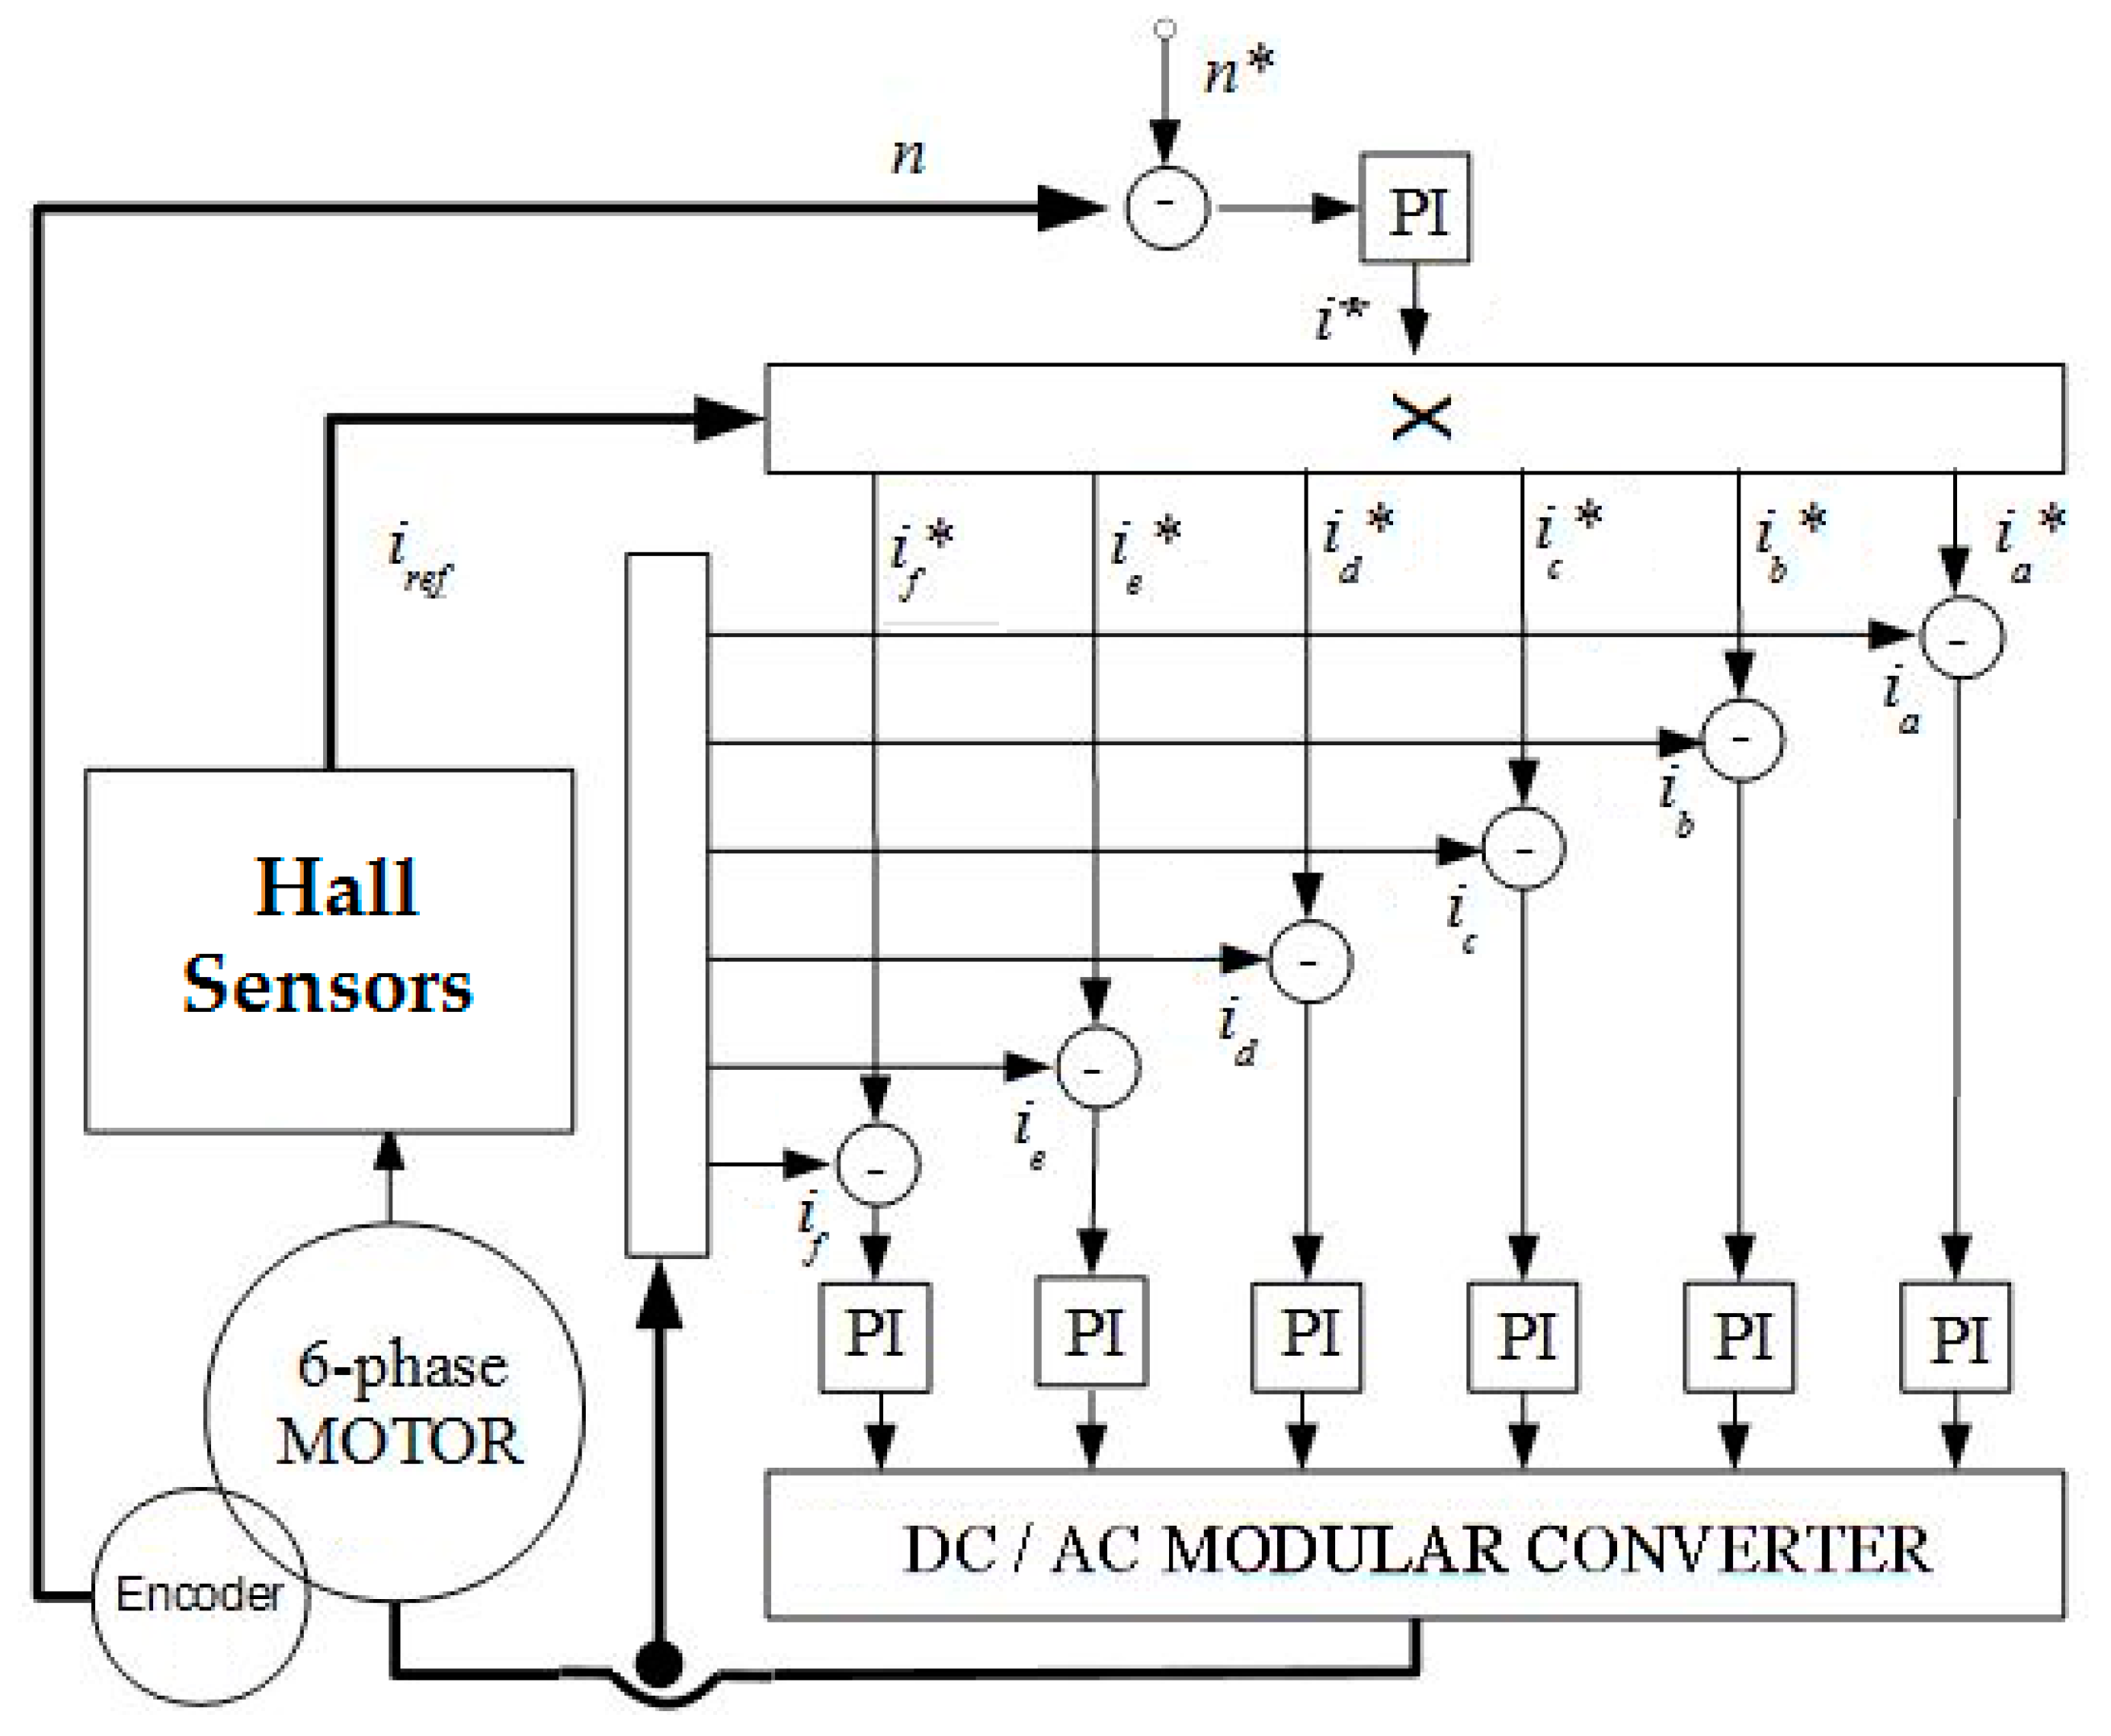
The motor drive is designed such that the phases are electrical, magnetical and thermal independent from one another. For this reason, in order to evaluate the performance of the drive during the steady state conditions, only one phase has to be simulated. The nonlinear dynamic modeling of each phase of the motor is taken into account by the DVDM and implemented in Matlab/Simulink as shown in Figure 5. In the control strategy, the rotor magnet position is measured by a position sensor and used to compute sinusoidal current references function of the position. These references, six in the case of the six phase motor, are modulated in amplitude by the speed control loop according to the torque requirements. A current control loop generates voltage references to obtain a phase current as close as possible to the related current reference. The proportional integrated (PI) regulator gives inputs to the full-bridge converter model, which then supplies each phase of the machine considering a given phase current and BEMF.
3.2. Power Electronic Thermal Model
This section presents the thermal modeling of the power electronic system in two main parts which are the SiC device and the power converter cooling system.
3.2.1. 3D Power Electronic Device Model
The SiC module [19] is modeled using a general network resistance model built using ANSYS Icepak (ANSYS, Canonsburg, PA, USA). It features the possibility to consider the physical characteristics of the module such as its thermal resistances (junction-to-case and junction-to-sides), mass, geometrical dimensions, specific heat, and power loss. The modeling method proposed in this paper (n-junction model) is advanced compared to the one available with the software program (single-to-triple junction model).
Single-to-Triple Junction Model
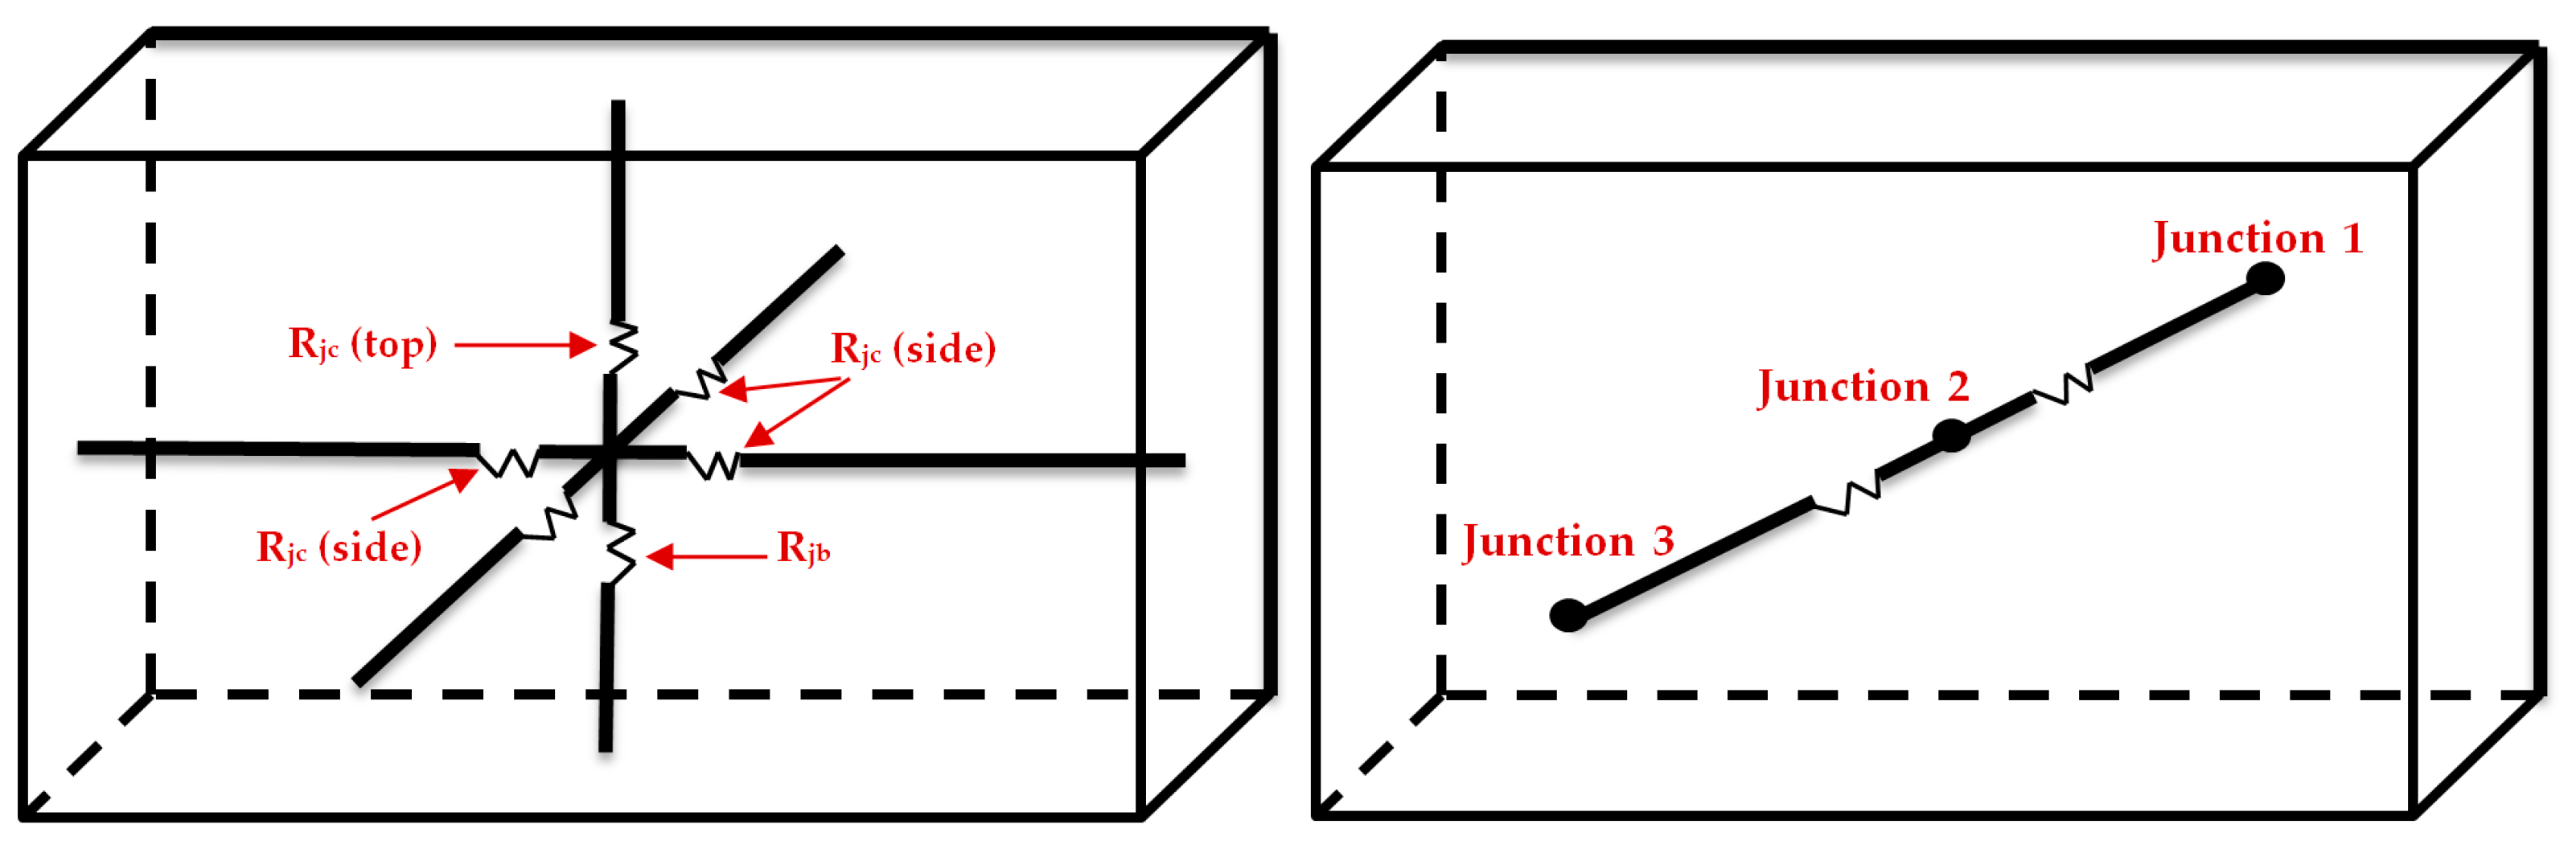
This model of the network resistance block available on ICEPAK is given in Figure 6. It represents a thermal resistance network connected to one or to three junctions (the chip of the module) maximum. In this case, the module is considered as having typically three chips, each one dissipating one third of the total power dissipation of the module. The question is how to consider a number of chips higher than three without knowing the internal geometrical details of the module.
N-Junction model
The proposed n-junction model is illustrated in Figure 7. It is a generalization of the triple-junction model with the following assumptions: (1) the external geometrical dimensions of the obtained model correspond to the external geometrical dimensions of the SiC module; (2) the heating generated by the chips is equally spread on the bottom surface of the module. The model is made of two blocks:
- The upper block is a solid and isothermal rectangular block of silicon carbide, representing the whole die layer of the module. Its height is set to 3% of the height of the considered SiC module;
- The lower block is a triple-junction model shown in Figure 6. In this case, it represents the different layers of substrate of copper or aluminum that may exist between the chips and the bottom surface of the module. Therefore, its height is 97% of the total height of the module.
The upper block carries the total power dissipation whereas the lower dissipates 0 W and is only there to transfer the losses to the bottom side through the thermal resistances by conduction.
3.2.2. 3-D Air-Cooled Converter Model
Forced convection has been preferred over natural convection for the volume constraints and power losses are severe. Because of the weight constraints, forced air cooling has been preferred over liquid cooling. Therefore, the cooling system is totally independent and no room for the liquid cooling management system is necessary.
The cooling system model depends on the configuration adopted for the whole power converter. The hexa-phase system is made of six H-bridges (Figure 8). Each one possesses two SiC CAS325M12HM2 modules. It is possible to consider from one to twelve modules on the same heat sink. But in order to have a modular yet compact arrangement, the configuration of Figure 8 is proposed: one heat sink per H-bridge and thus, three heat sinks for the whole system. Each heat sink is connected to two fans to force the air flow.
Thanks to the modularity of the system, only one heat sink is modelled on ICEPAK. The computed power losses in Section 4.1 allow obtaining the dissipation levels of the Cree® SiC CAS325M12HM2 module under required conditions:
- Steady-state power dissipation: 250 W per module;
- Transient power dissipation: 250 W for five minutes and 25 W for five minutes.
Given these data, one may compute the required steady-state heat sink thermal resistance by Equation (10), with Tjmax, the maximum achievable junction temperature (175 °C), Ta the ambient temperature (75 °C), Pm, the maximum expected power losses of the four modules (4 × 250 = 1 kW), Rjc, the junction-to-case switch thermal resistance (0.1/4 = 0.025 °C/W) and Rim, the resistance of the thermal interface material between the power module and the heat sink (0.11 × 10⁻³ °C/W).
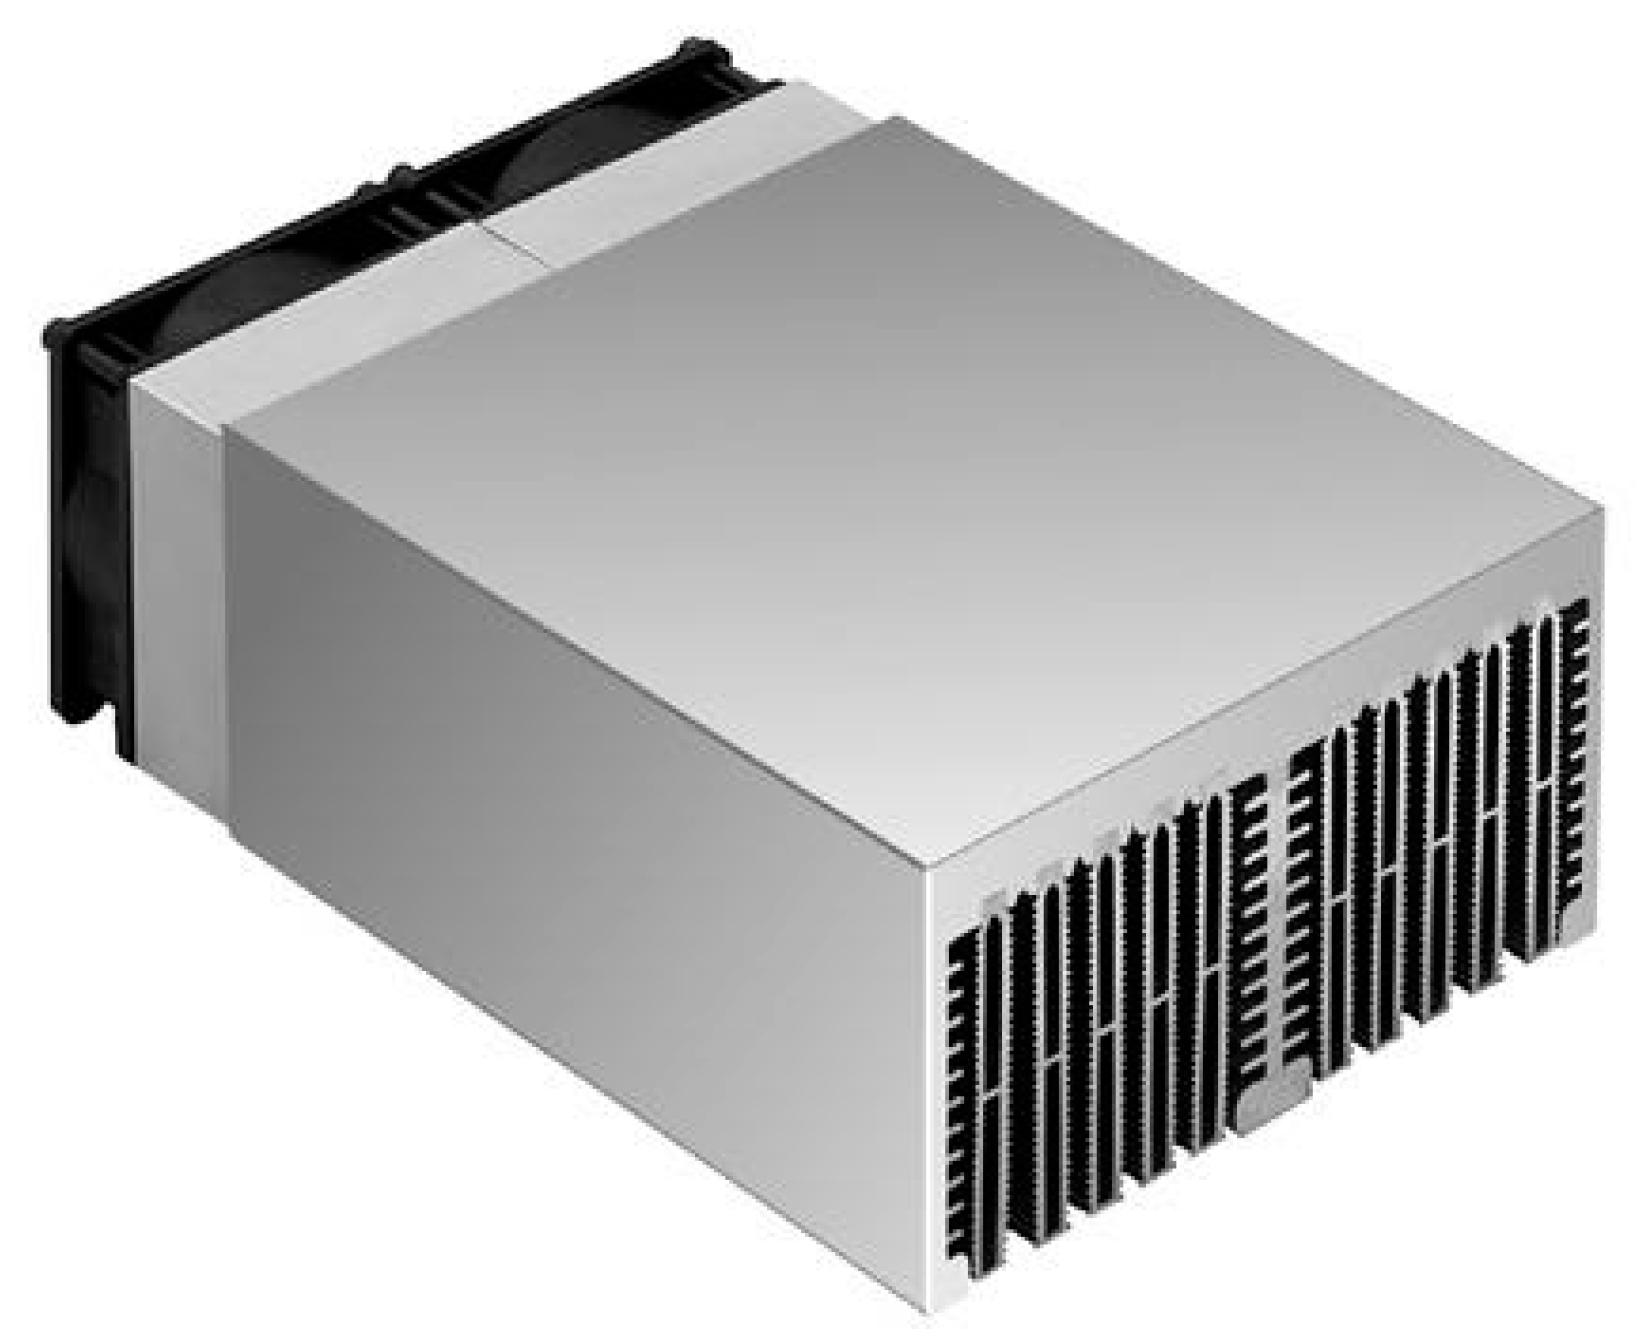
The value of 0.0749 °C/W is achieved and the Fischer Elektronik® cooling aggregate LAV10 is selected (Fischer Elektronik, Lüdenscheid, Germany). It features an aluminum cross-cut extrusion heat sink with 0.06 °C/W with its provided fan.
4. System Results
In this research work, the characterization of the CREE® SiC MOSFET power module and its thermal analysis are presented. Then, the efficiency and the performance of a high power multi-phase converter driving a 120 kW multi-phase PM motor are evaluated using the co-simulation shown in Figure 2.
4.1. SiC MOSFET Switching Characterization Results
This section presents the characterization of the CREE® SiC MOSFET power module in order to measure its switching energies losses during turn-on and turn-off using hard switching (no snubber circuits) to consider the worst case behavior of the module.
The layout of the setup encompasses an aluminum plate which has the ability to heat the SiC power module due to the hot oil flowing inside.
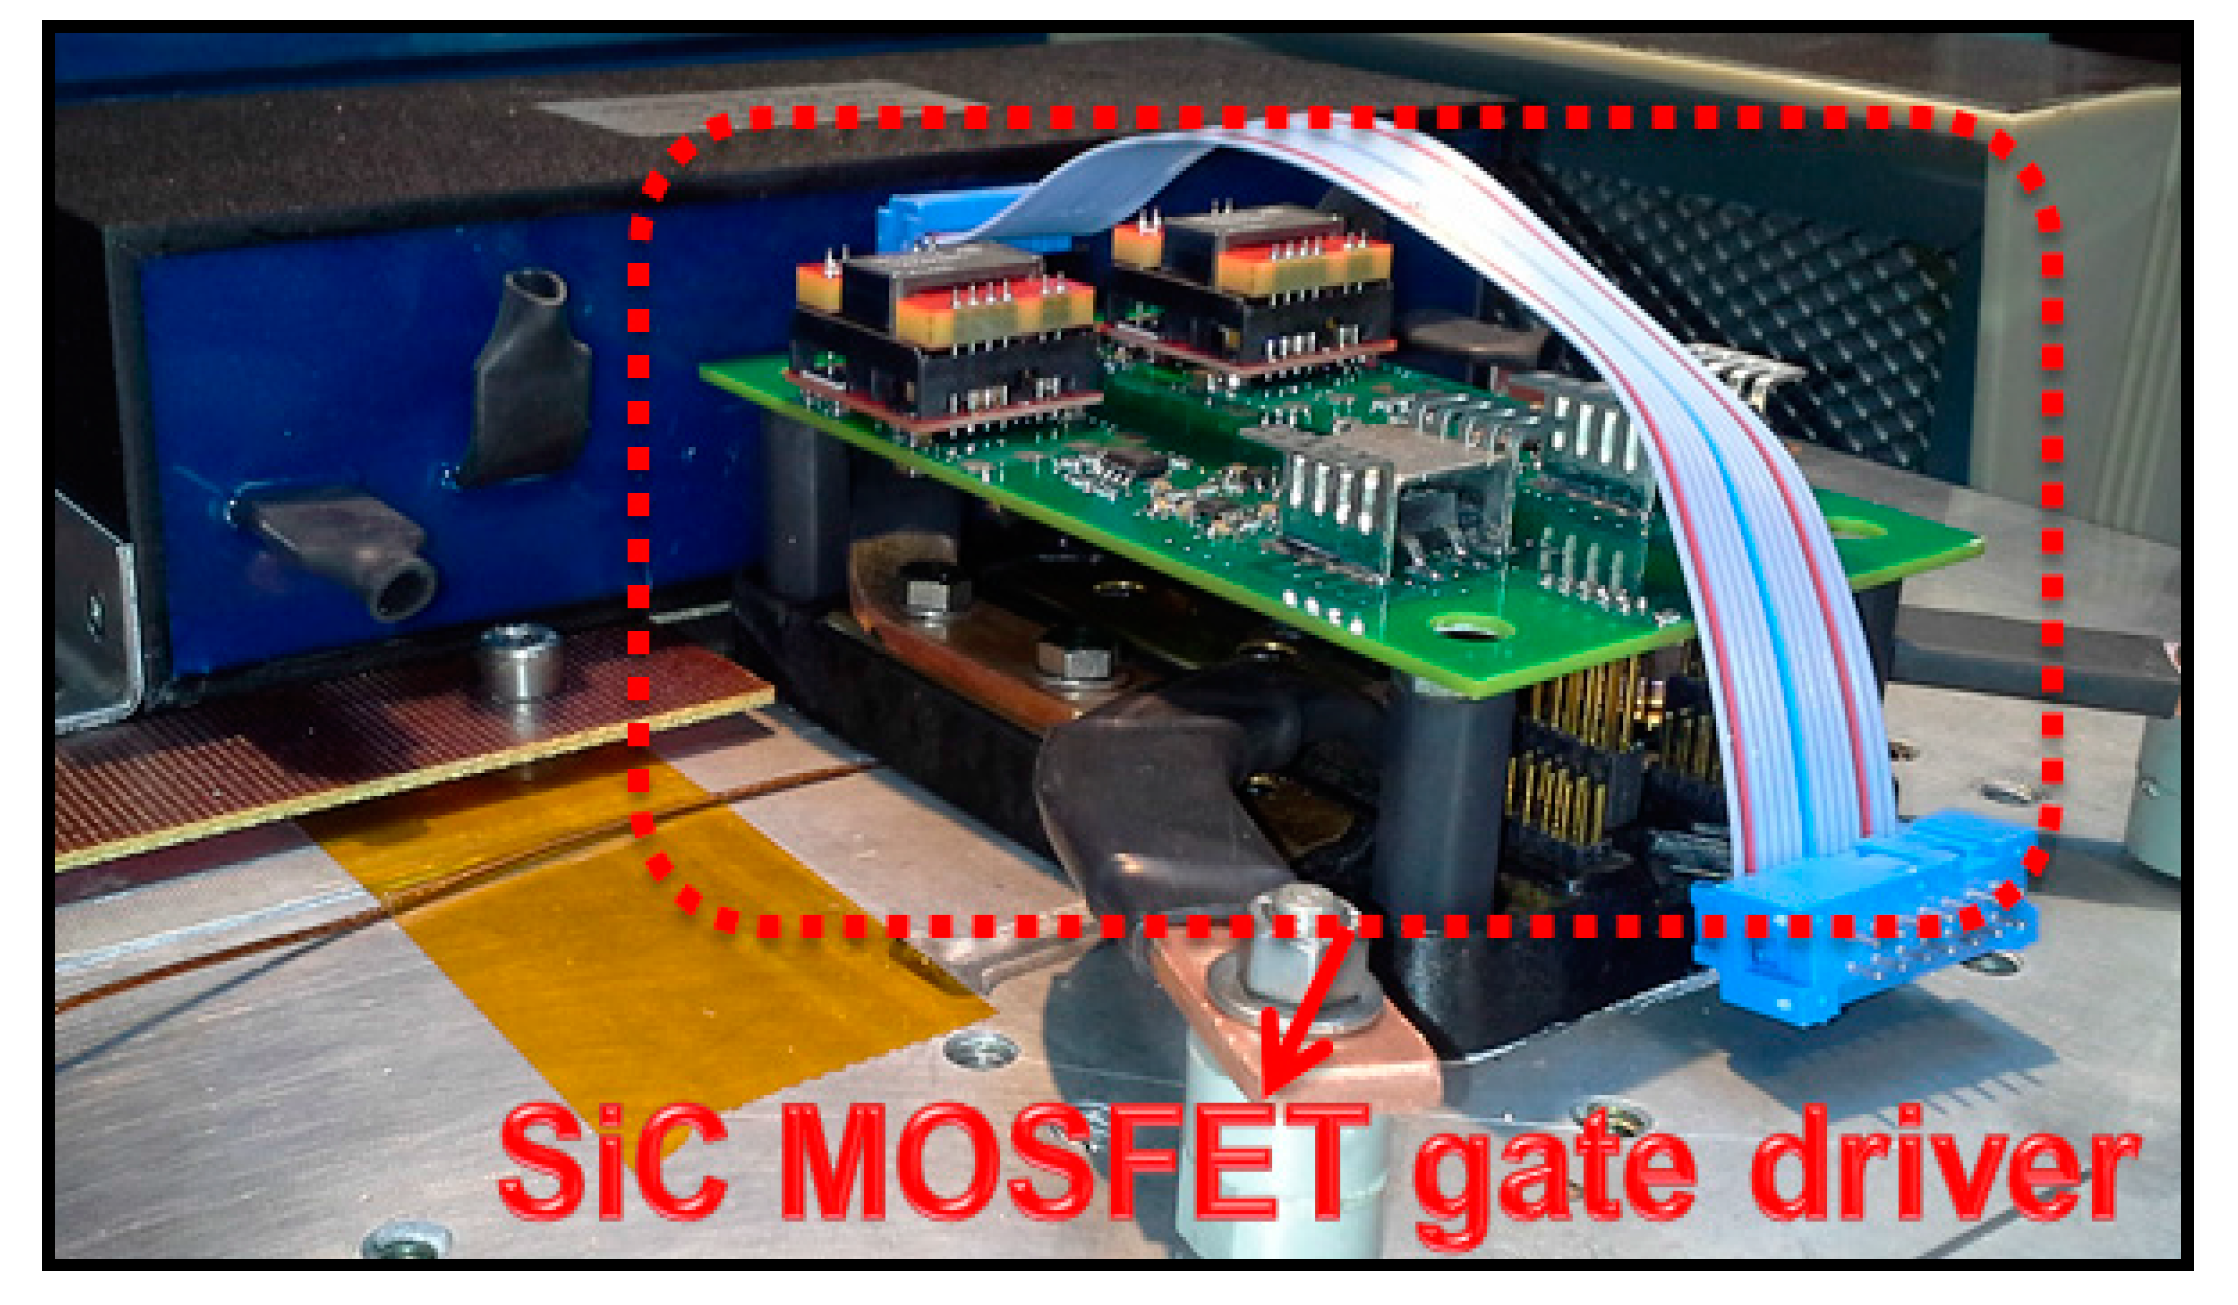
On the top of this plate, a 120 µF DC capacitor (Figure 9, black part on the left side of the image) is fixed through a wooden plate to avoid capacitor overheating. This capacitor is linked to the power module via copper bars. The power module and its gate driver, shown in Figure 10, are fixed on top of the hot plate using fixation screws and thermal grease. The proposed setup, shown in Figure 11, has a very compact size to limit additional parasitic inductances.
4.1.1. Results of Gate Driver Functionality Test
The gate driver functionality test is configured to test the lower switch of the power module by applying command (VGS2 = −5/+20 V) and keep the upper in off state by applying command (VGS1 = −5 V). A frequency generator is used to generate the command signal (VCMD) which is set to 0/+5 V at 20 kHz. VCMD is adjusted using differential gate driver to achieve −5/+20 V at VGS2. Figure 12 shows the gate driver output signals VGS1 and VGS2, resulting from a command signal VCMD.
4.1.2. Double-Pulse Test
The double-pulse test shown in Figure 13 is used to measure the switching energy losses of the SiC power module [23,24]. The power module is tested for temperatures varying from 25 to 150 °C at a 540 VDC—100 A. The maximum operating current (100 A) was chosen to ensure a safety margin at a temperature of 150 °C as the maximum current of the utilized module is 170 A for 175 °C.
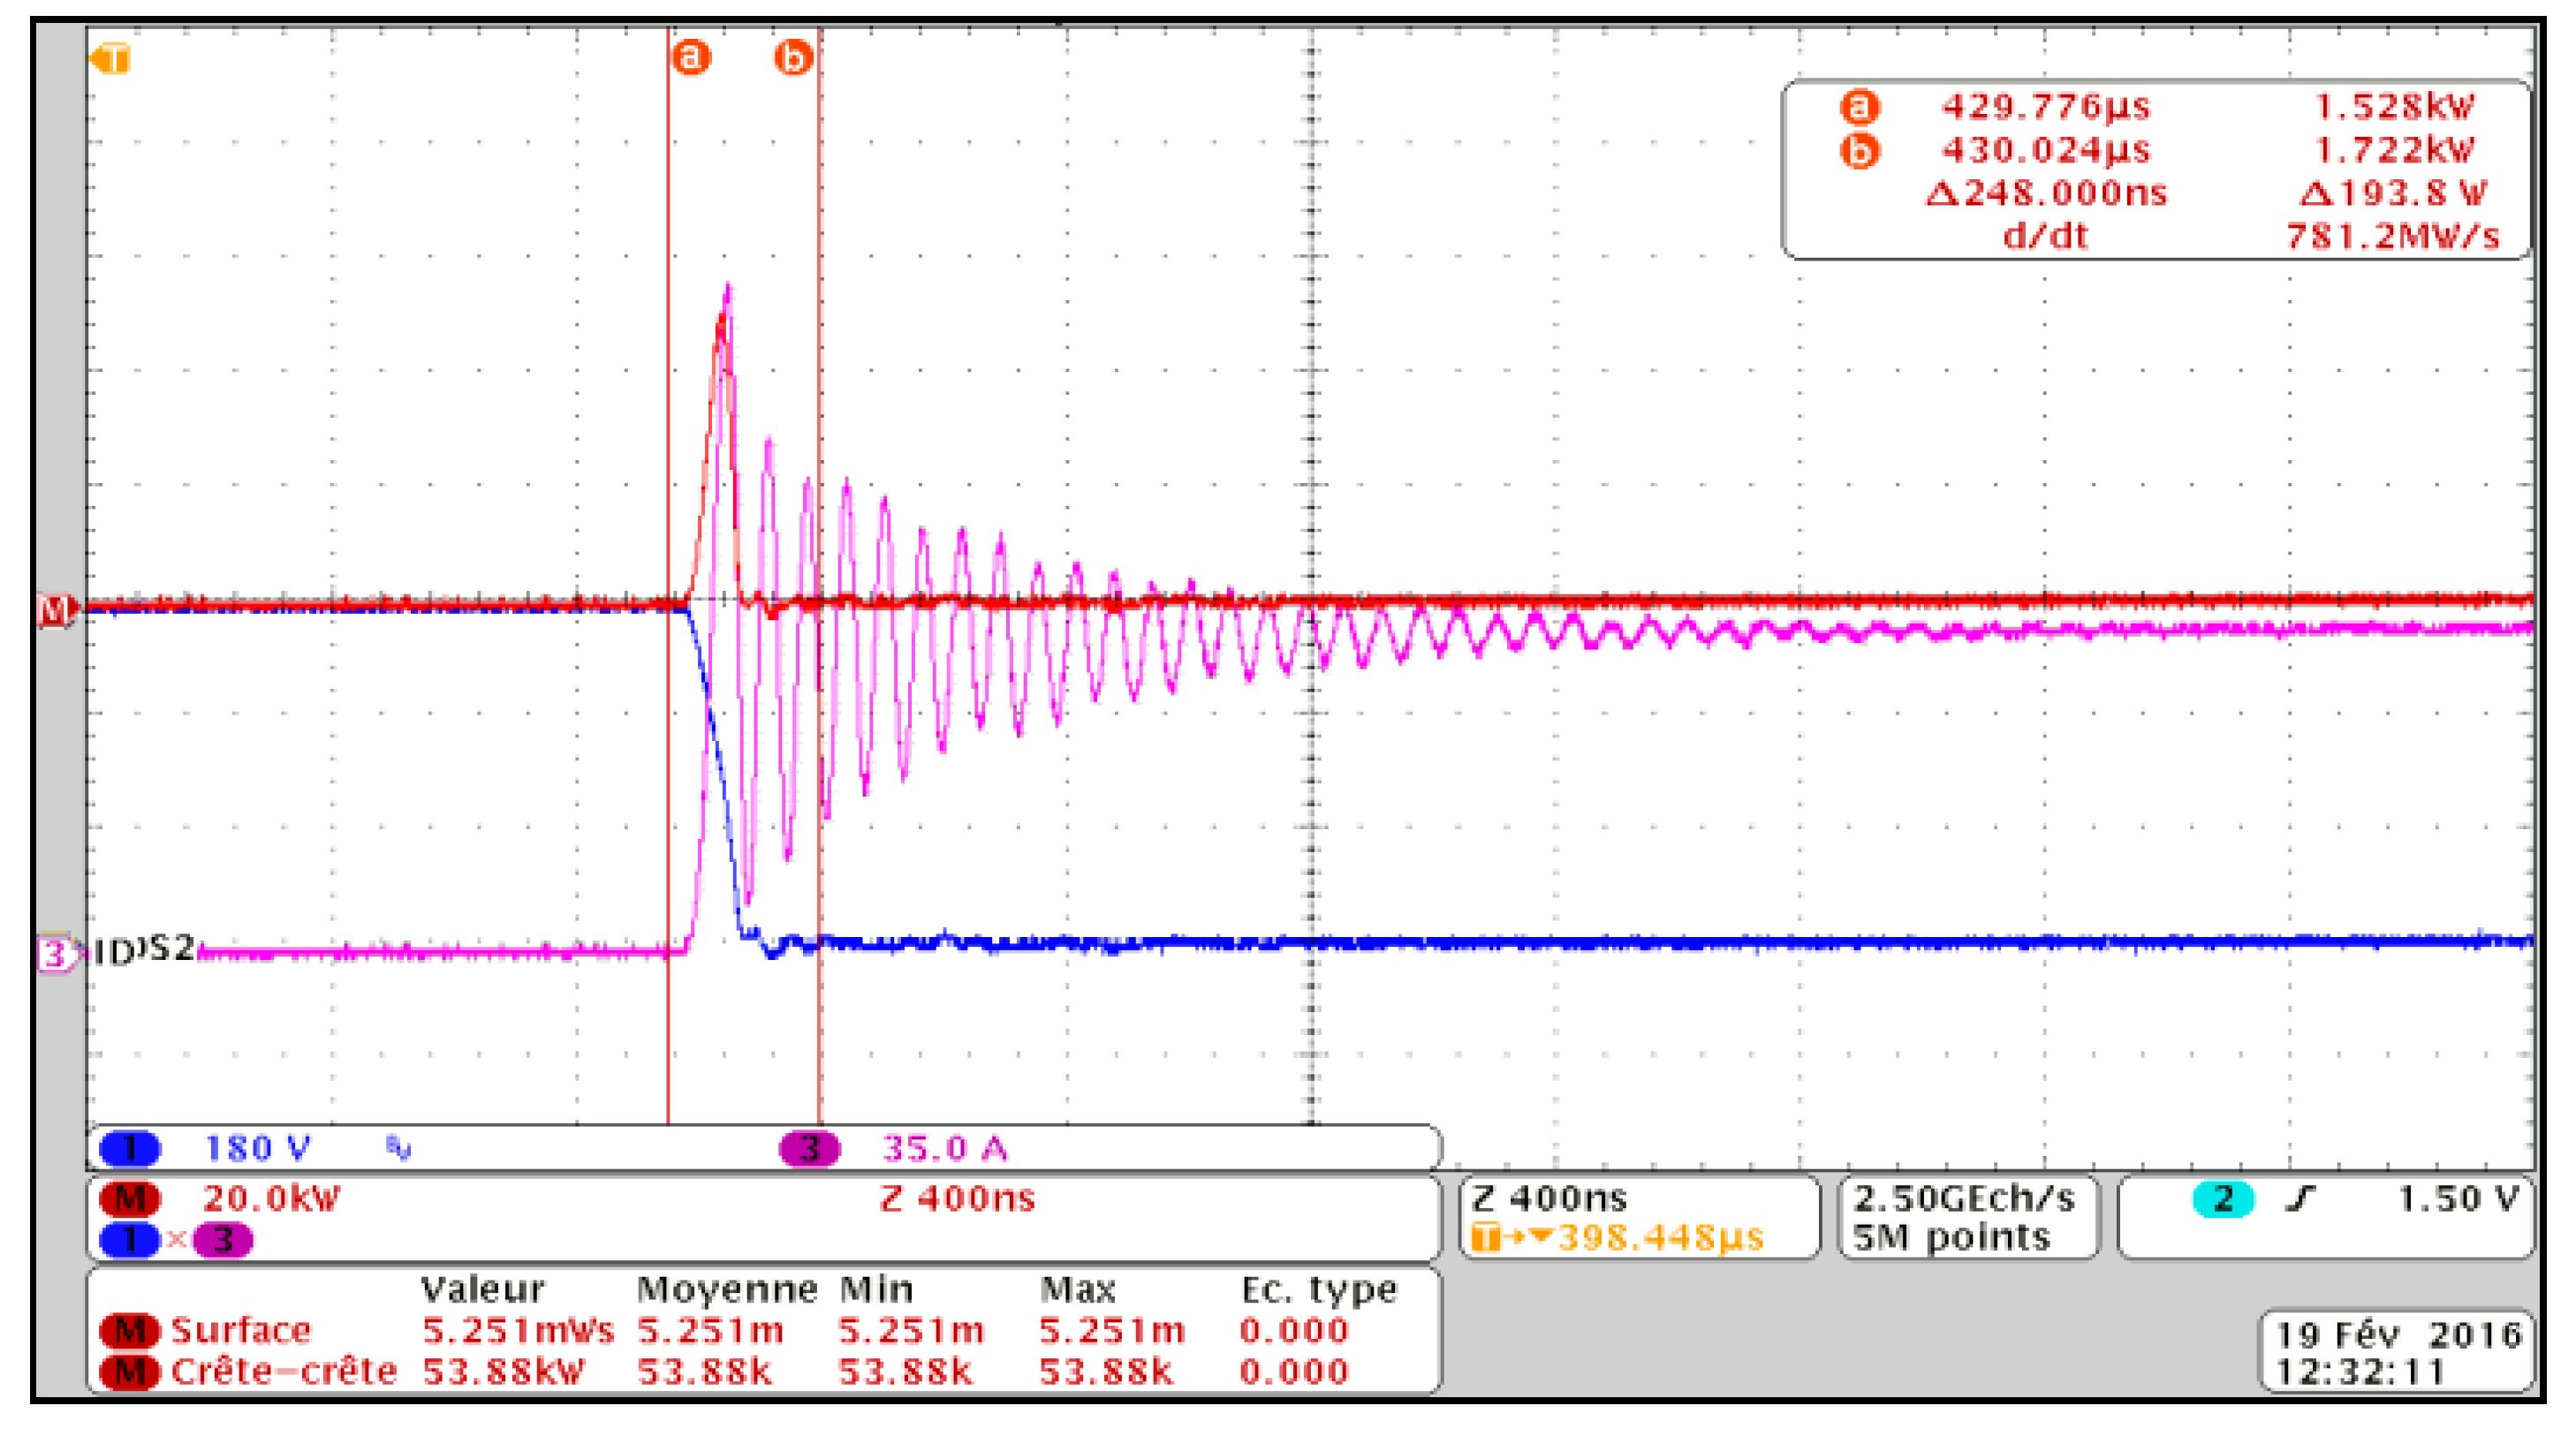
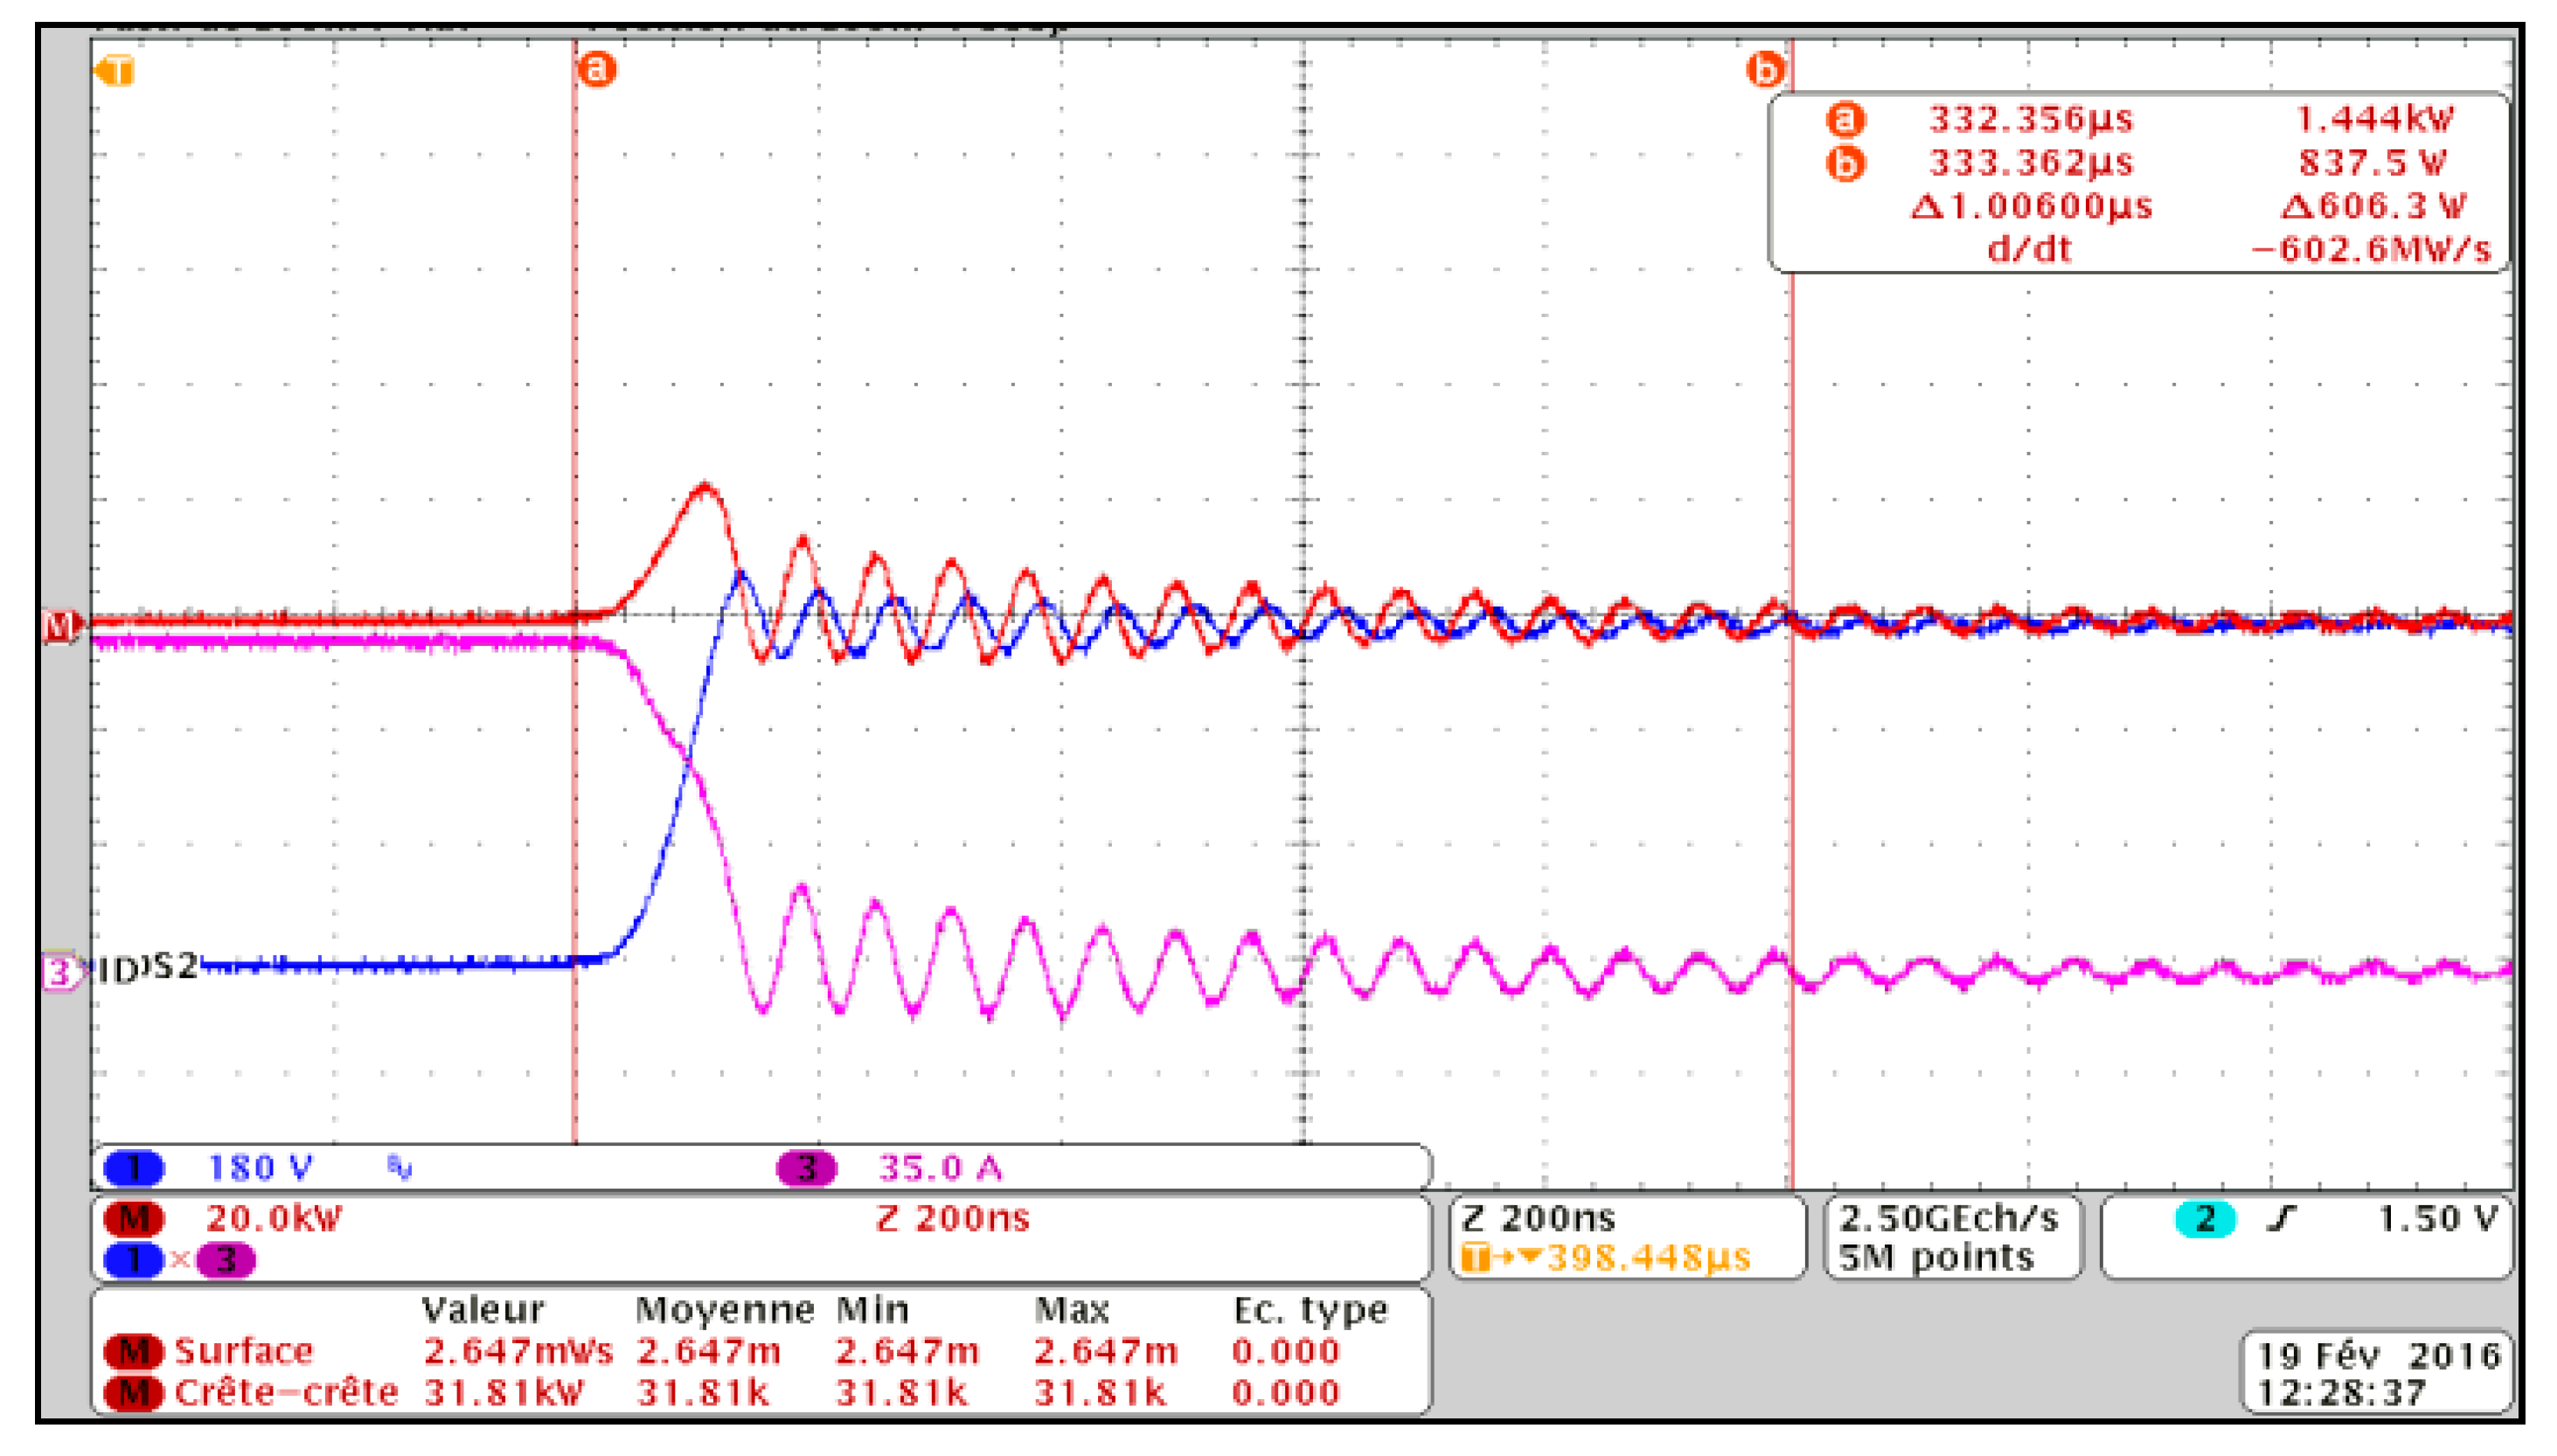
Figure 14 and Figure 15 show the turn-on and turn-off switching waveforms including drain current (ID) and drain-source voltage (VDS). The switching energies are obtained and mentioned in Table 1 from power waveforms using some features of the Tektronix® oscilloscope (Tektronix, Beaverton, OR, USA). It can be noticed from the results of tests 1 and 2 that an increase of the temperature from 25 °C to 100 °C at the same voltage and current conditions leads to an increase in the total switching losses of about 27%. In test 4, the behavior is slightly different because the thermal losses can reach an inflexion point at temperatures very close to the maximum admissible for the module. This is the reason behind the reduction in the total switching losses from 125 °C to 150 °C. It can be concluded that a change in temperature of 25 °C in this region does not severely increase the total switching losses.
4.2. Thermal Analysis Results
In this section, the finite element thermal analysis results are presented for the power converter using the Fischer LAV10 heatsink (Fischer Elektronik, Lüdenscheid, Germany), shown in Figure 16, both in steady-state and transient modes. The following assumptions are made:
- Altitude effect is negligible;
- Radiation effects are negligible;
- The fan has a specific curve imposed.
4.2.1. Steady-State Mode Simulation Results
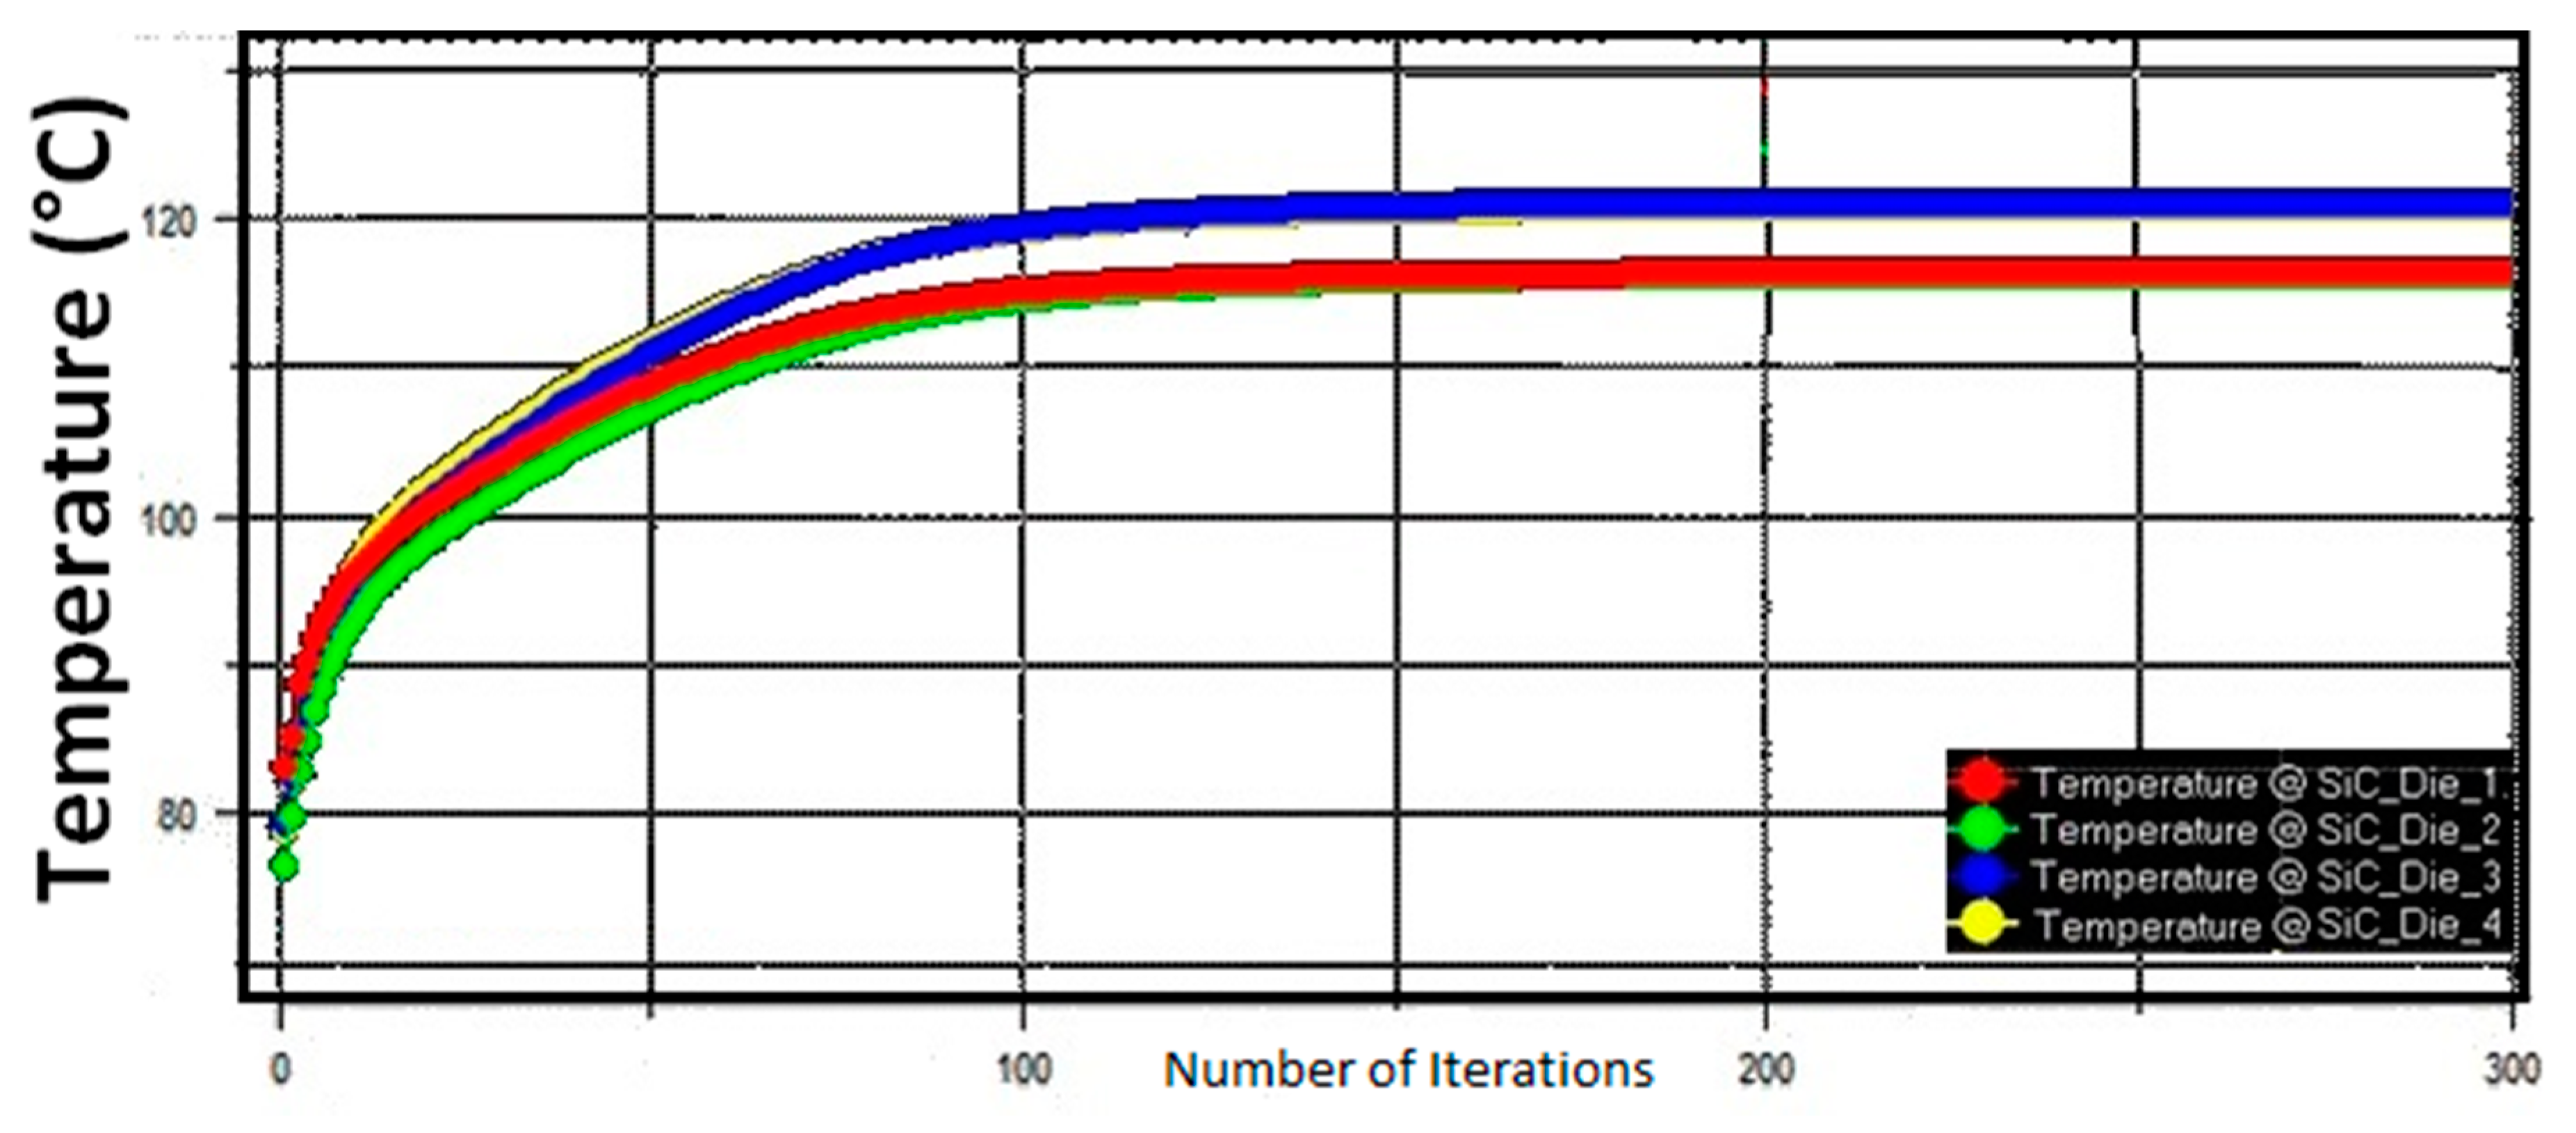
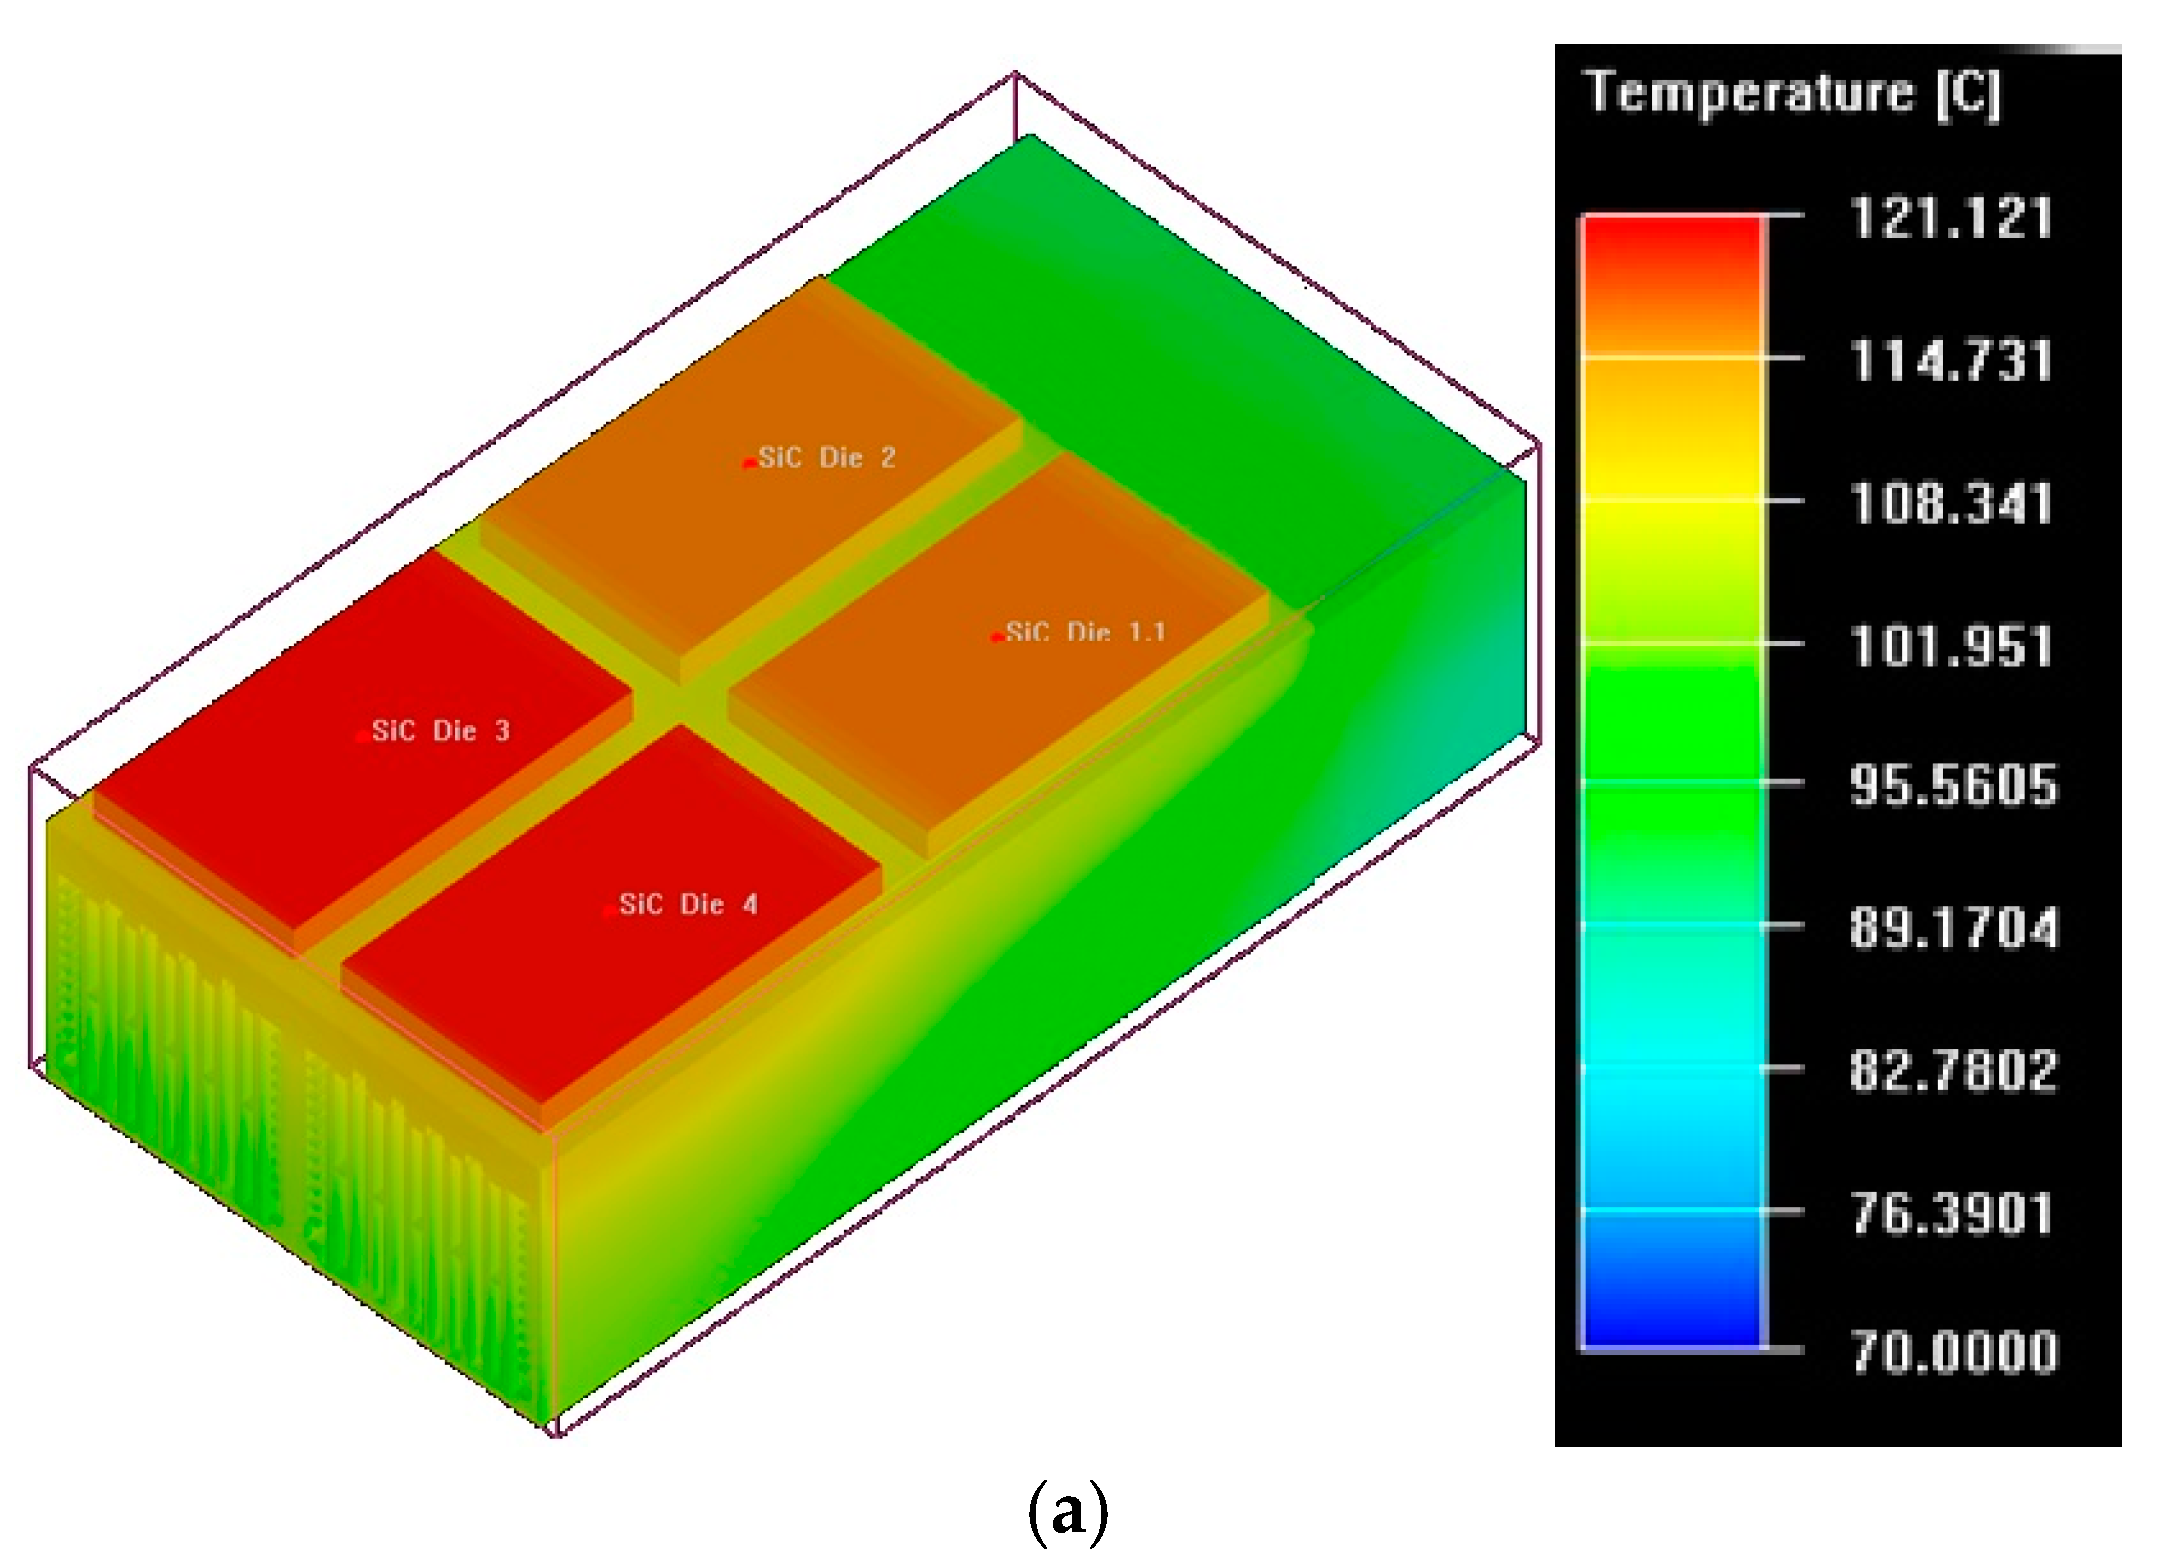
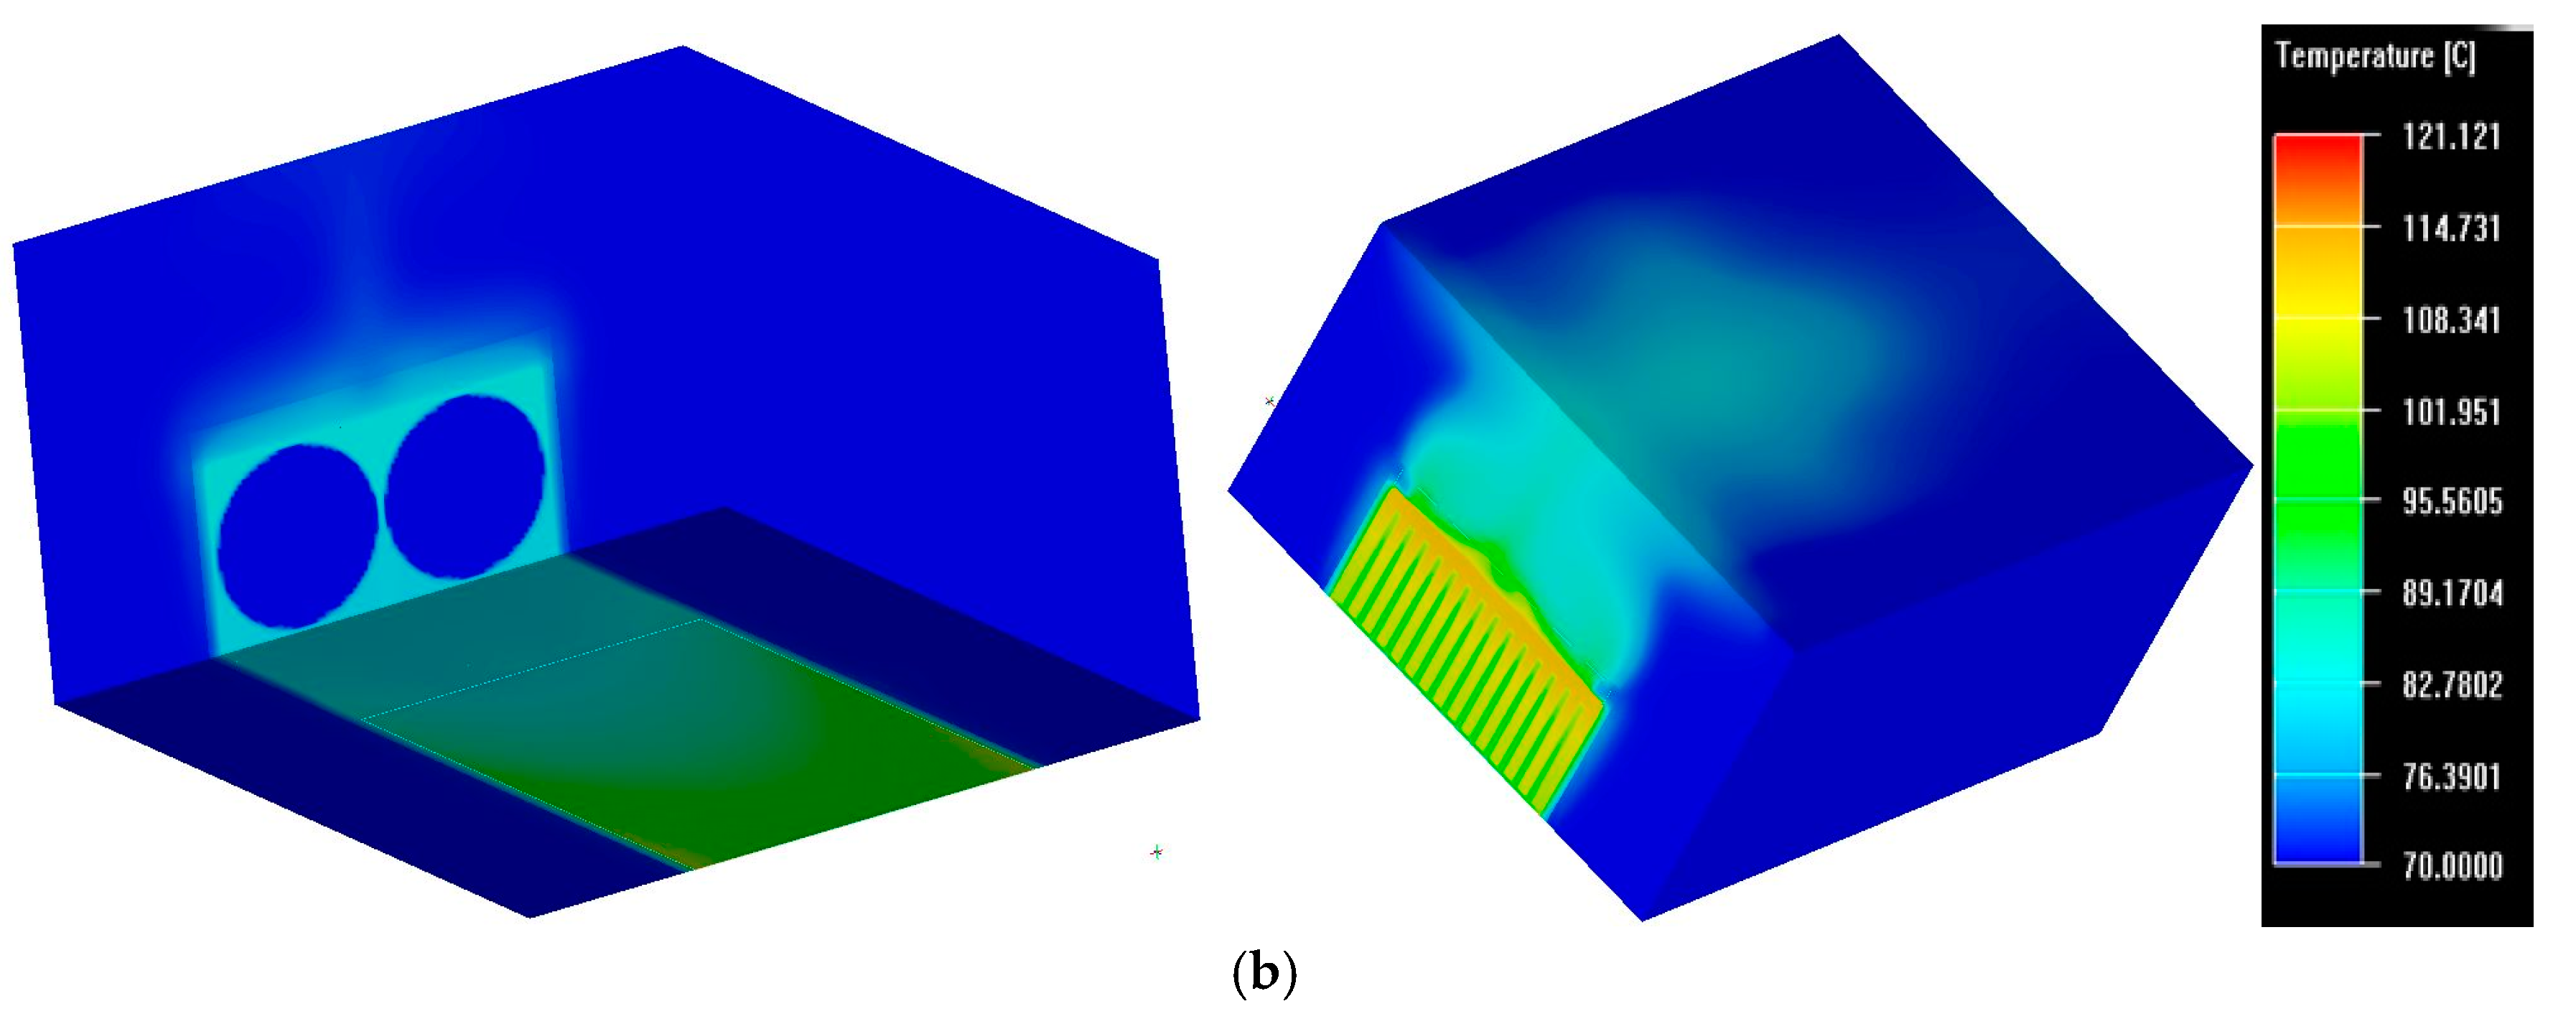
The model reaches convergence after 200 iterations, as shown in Figure 17, knowing that the ambient temperature is 70 °C and the power dissipation per module is 250 W. This power dissipation corresponds to the highest value achieved by equations developed in [24] with energy losses of Table 1. Simulation results show that the maximum temperature achieved is 122 °C. The temperature distribution around the simulated system is given in Figure 18a, b.
4.2.2. Transient Mode Simulation Results
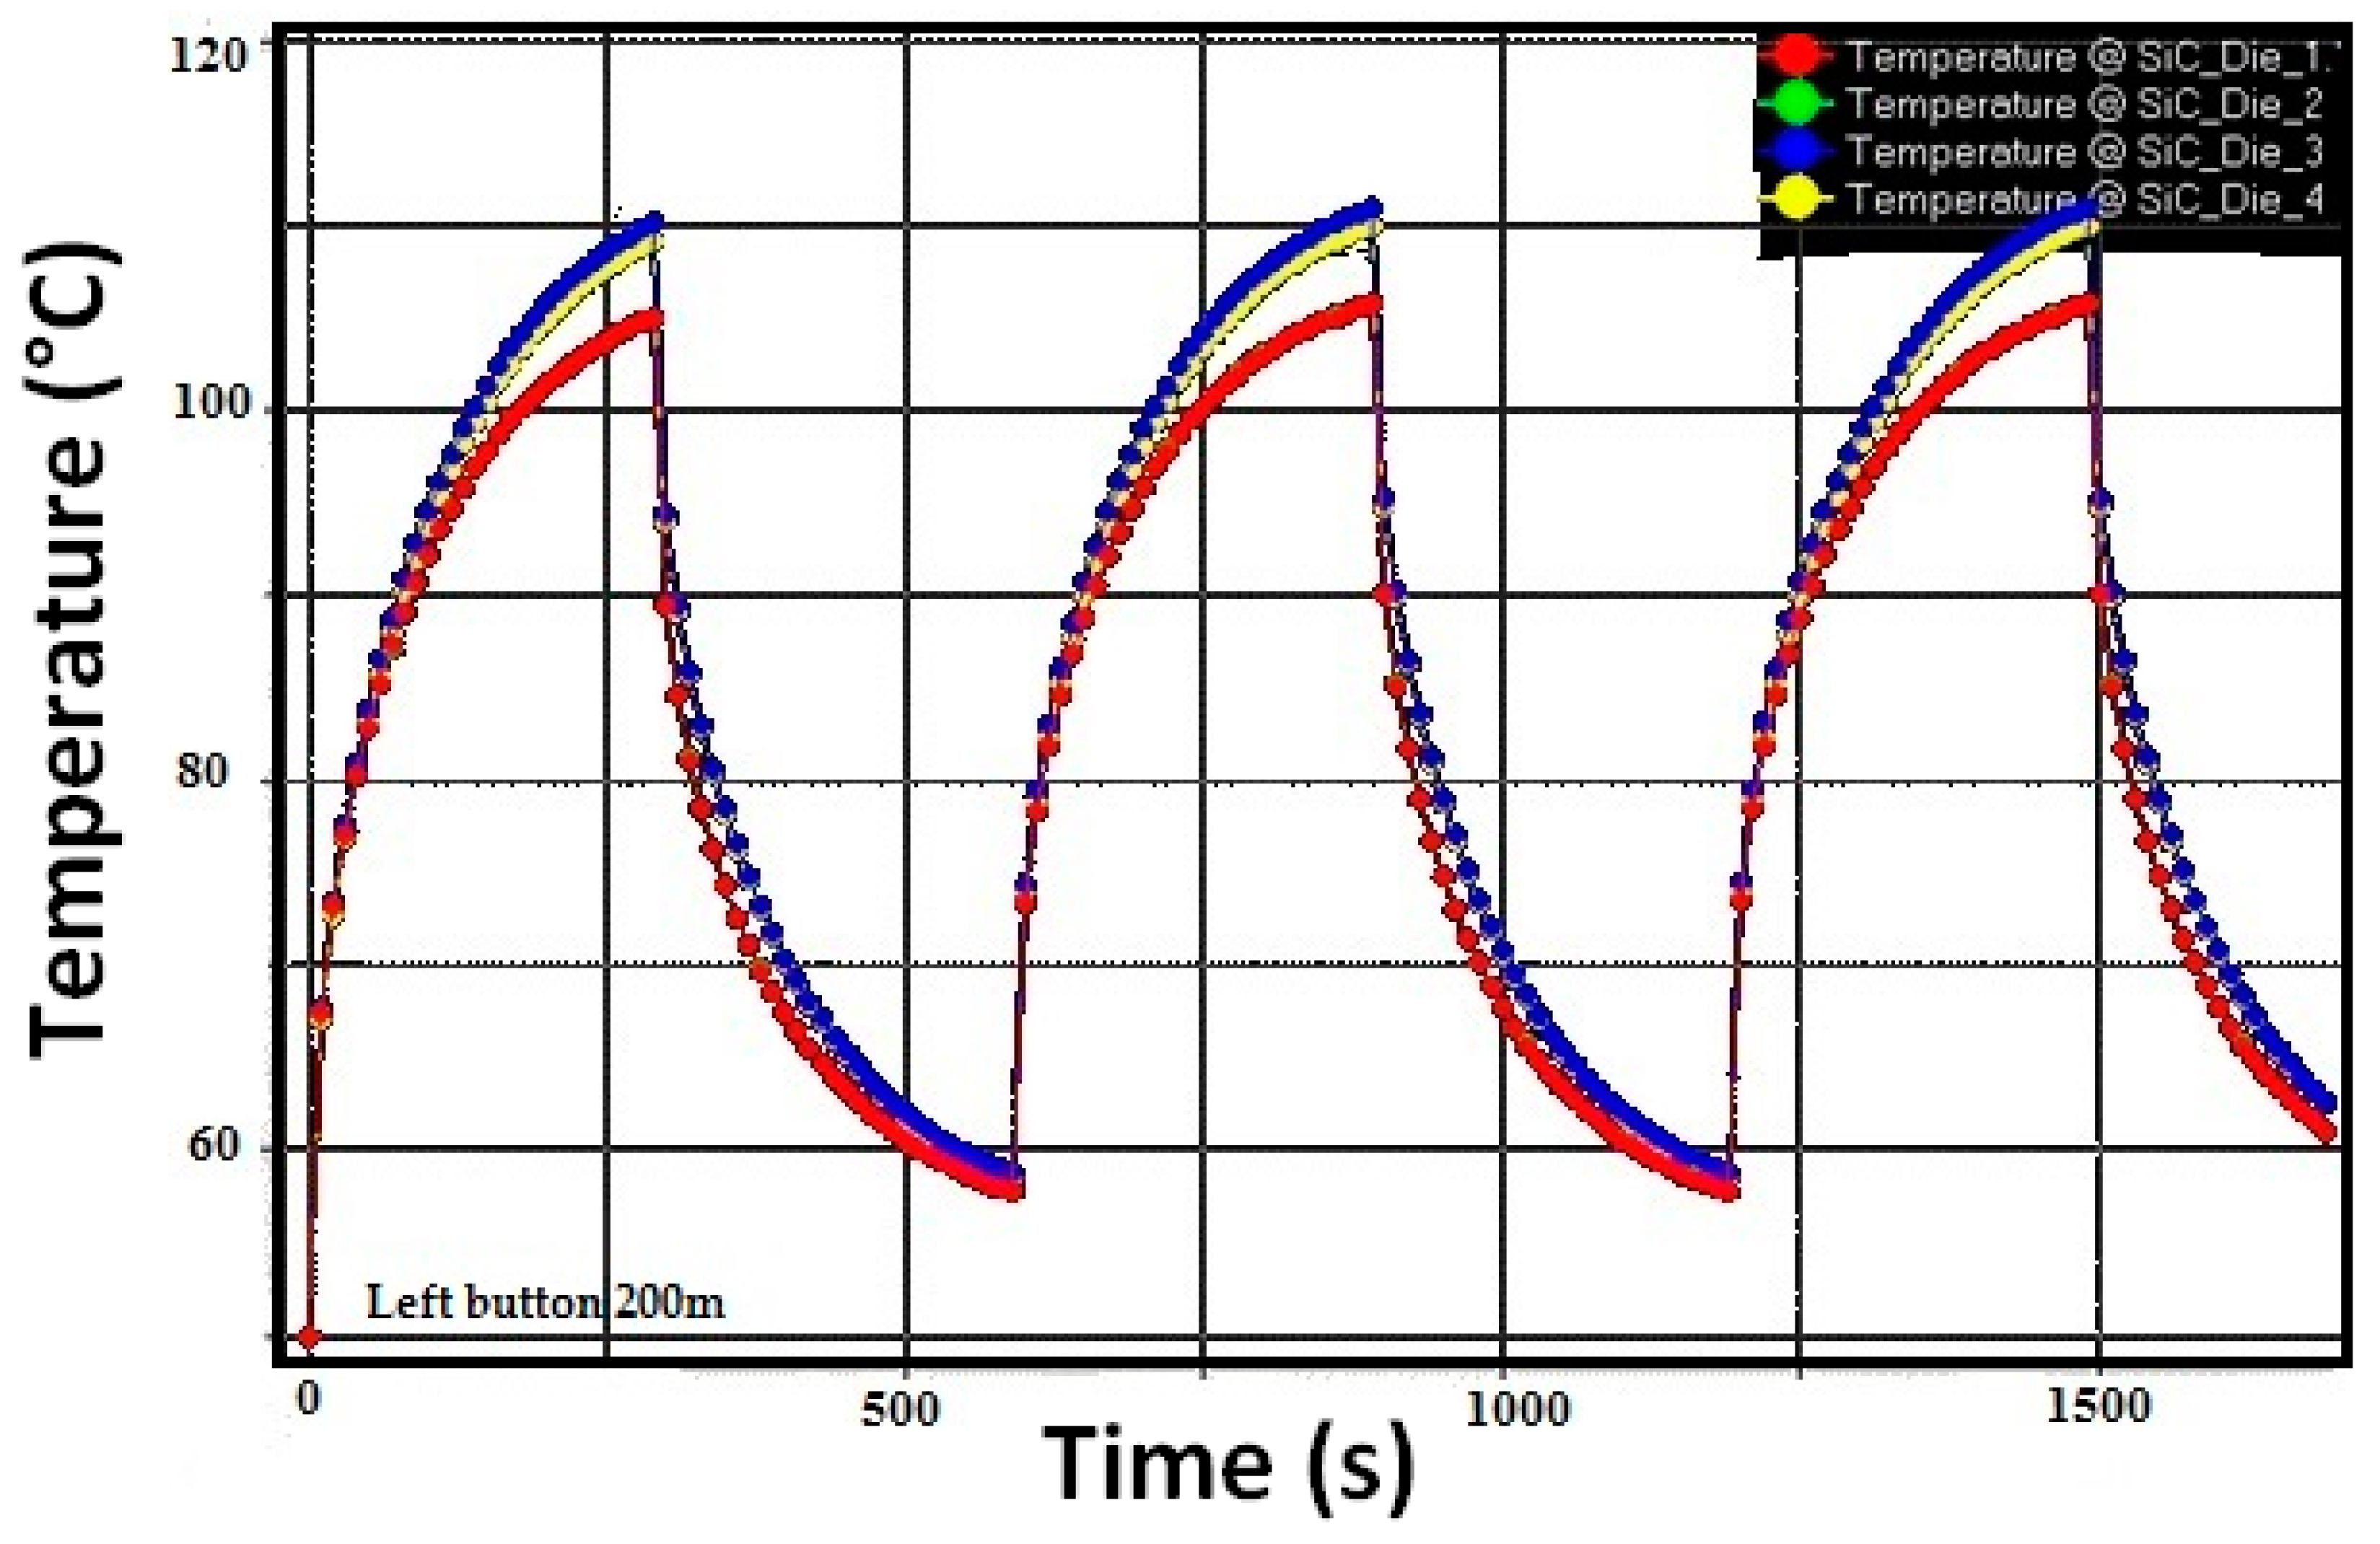
The transient mode is studied applying a periodic power profile of 250 W for five minutes and 25 W for the next five minutes. This power profile is stressful for the considered application. The transient time plot is given in Figure 19. The maximum achieved temperature is 115 °C, with 50 °C ambient temperature.
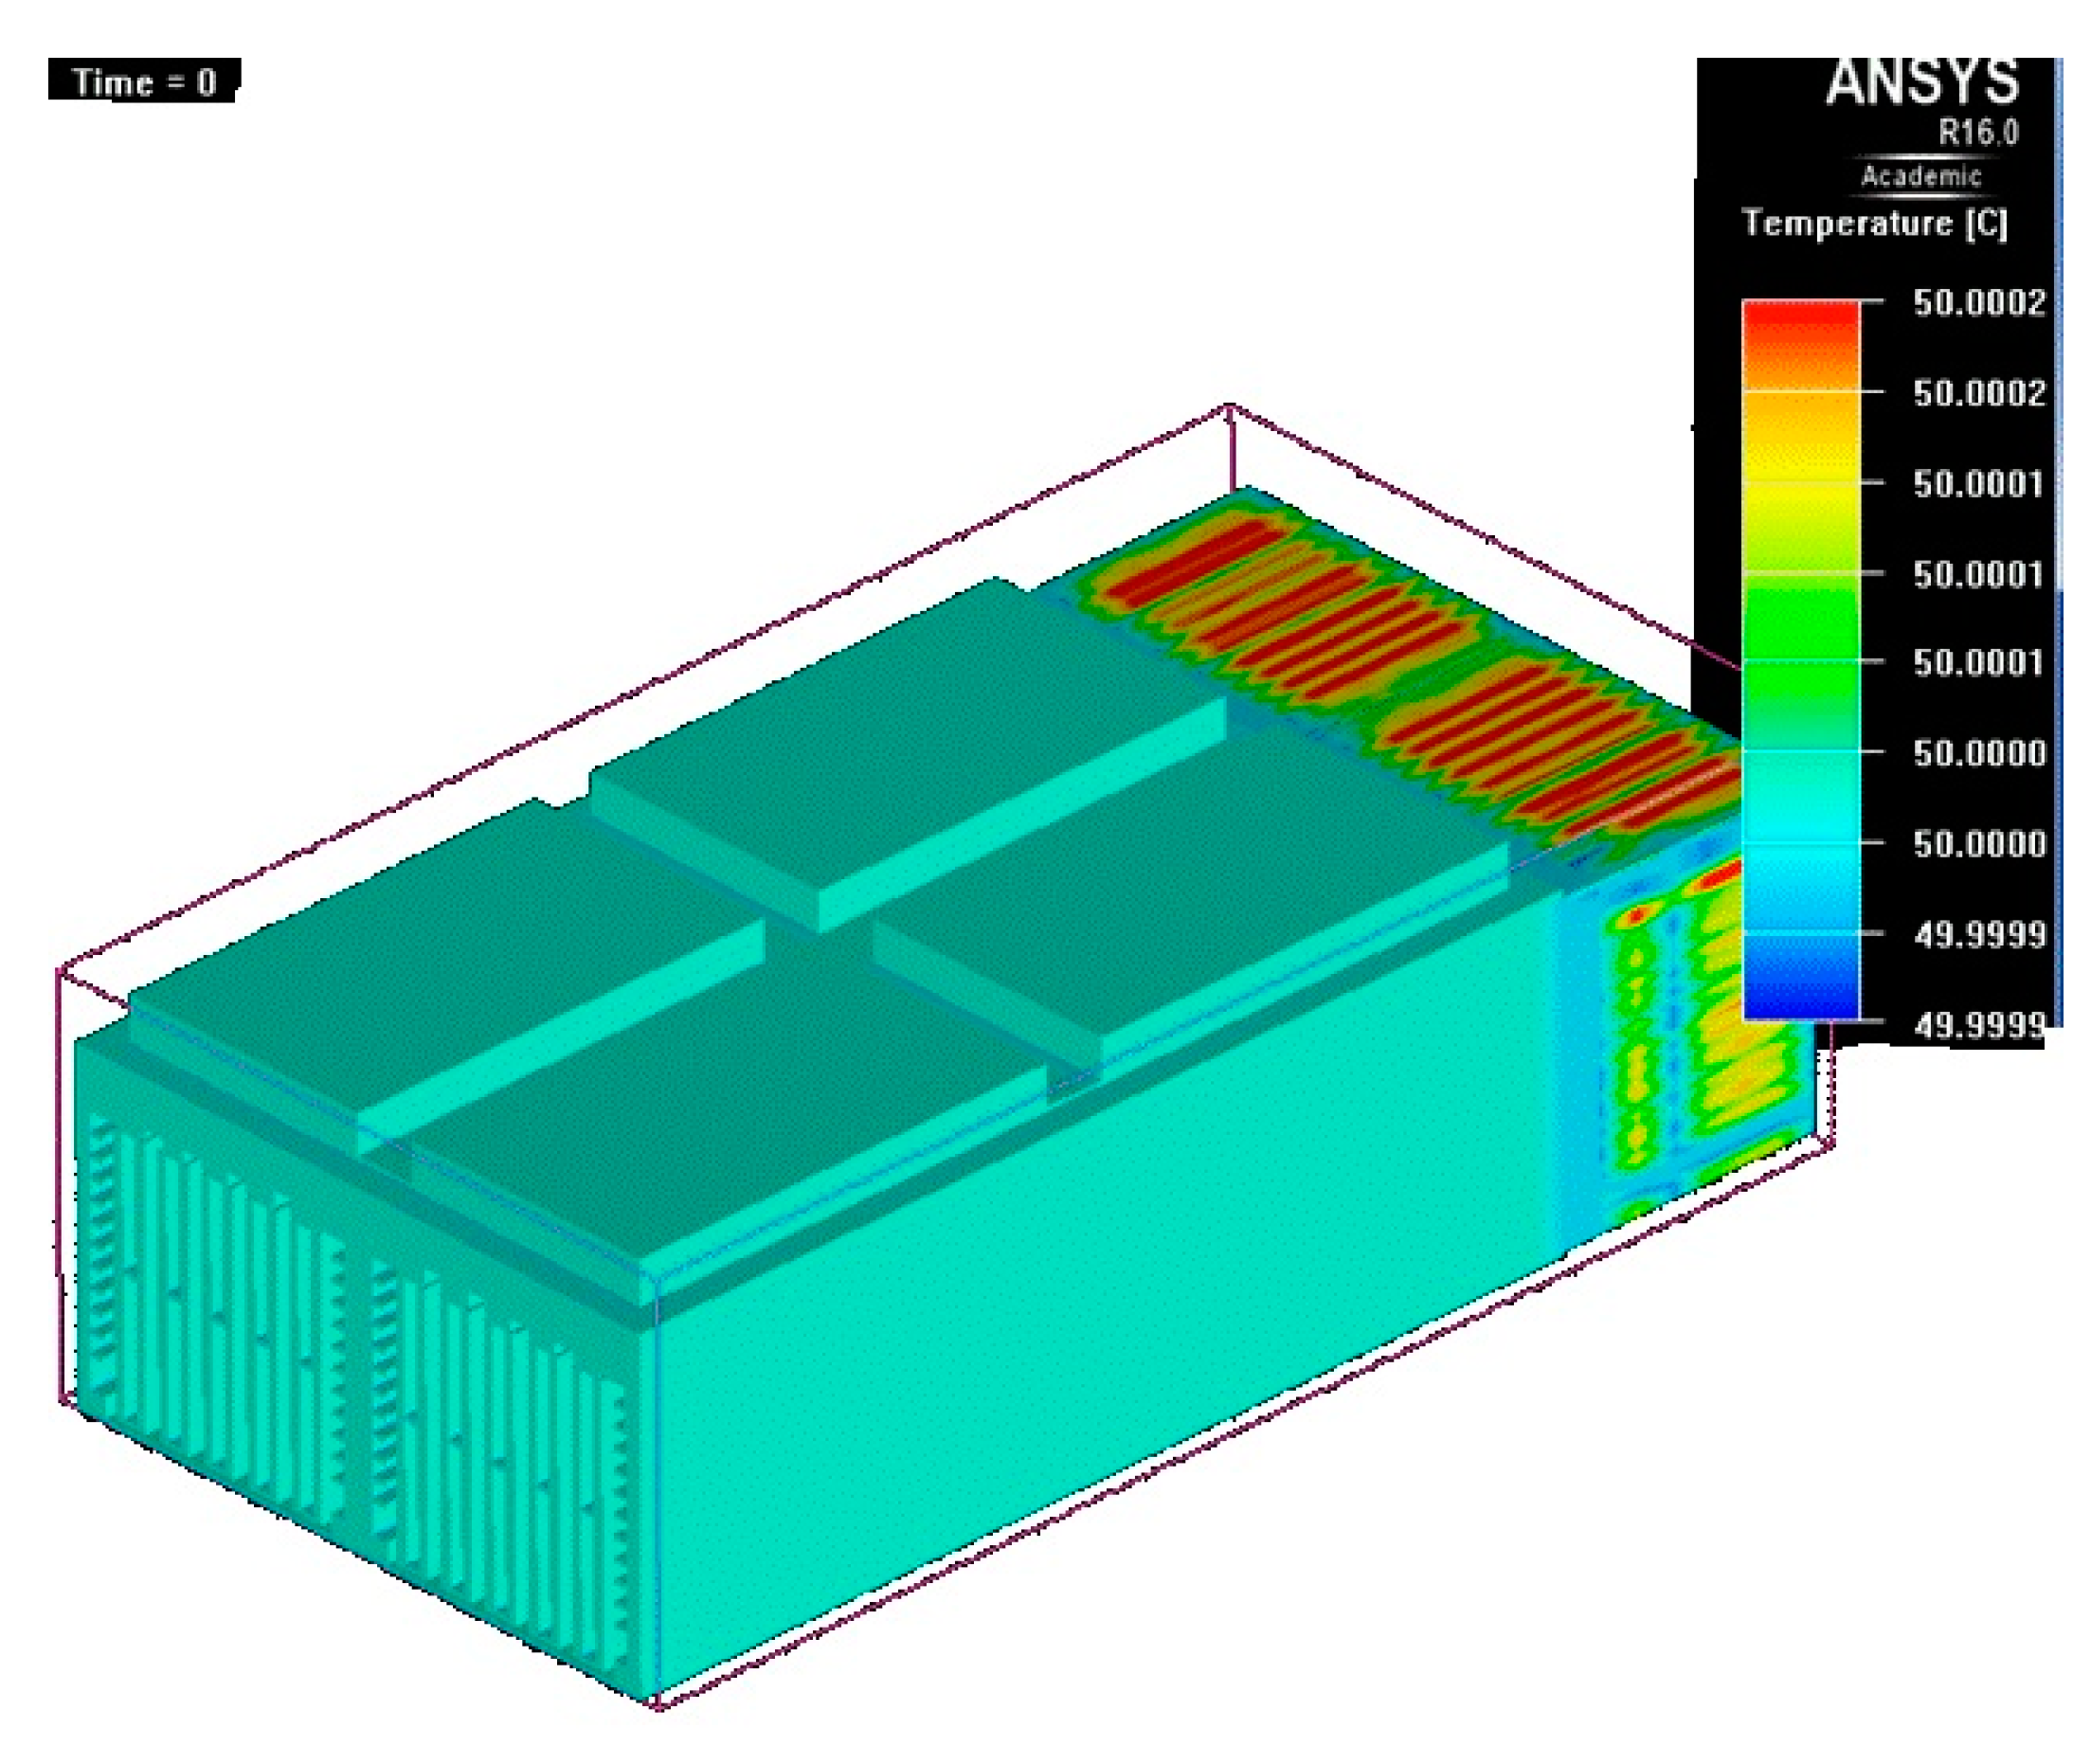
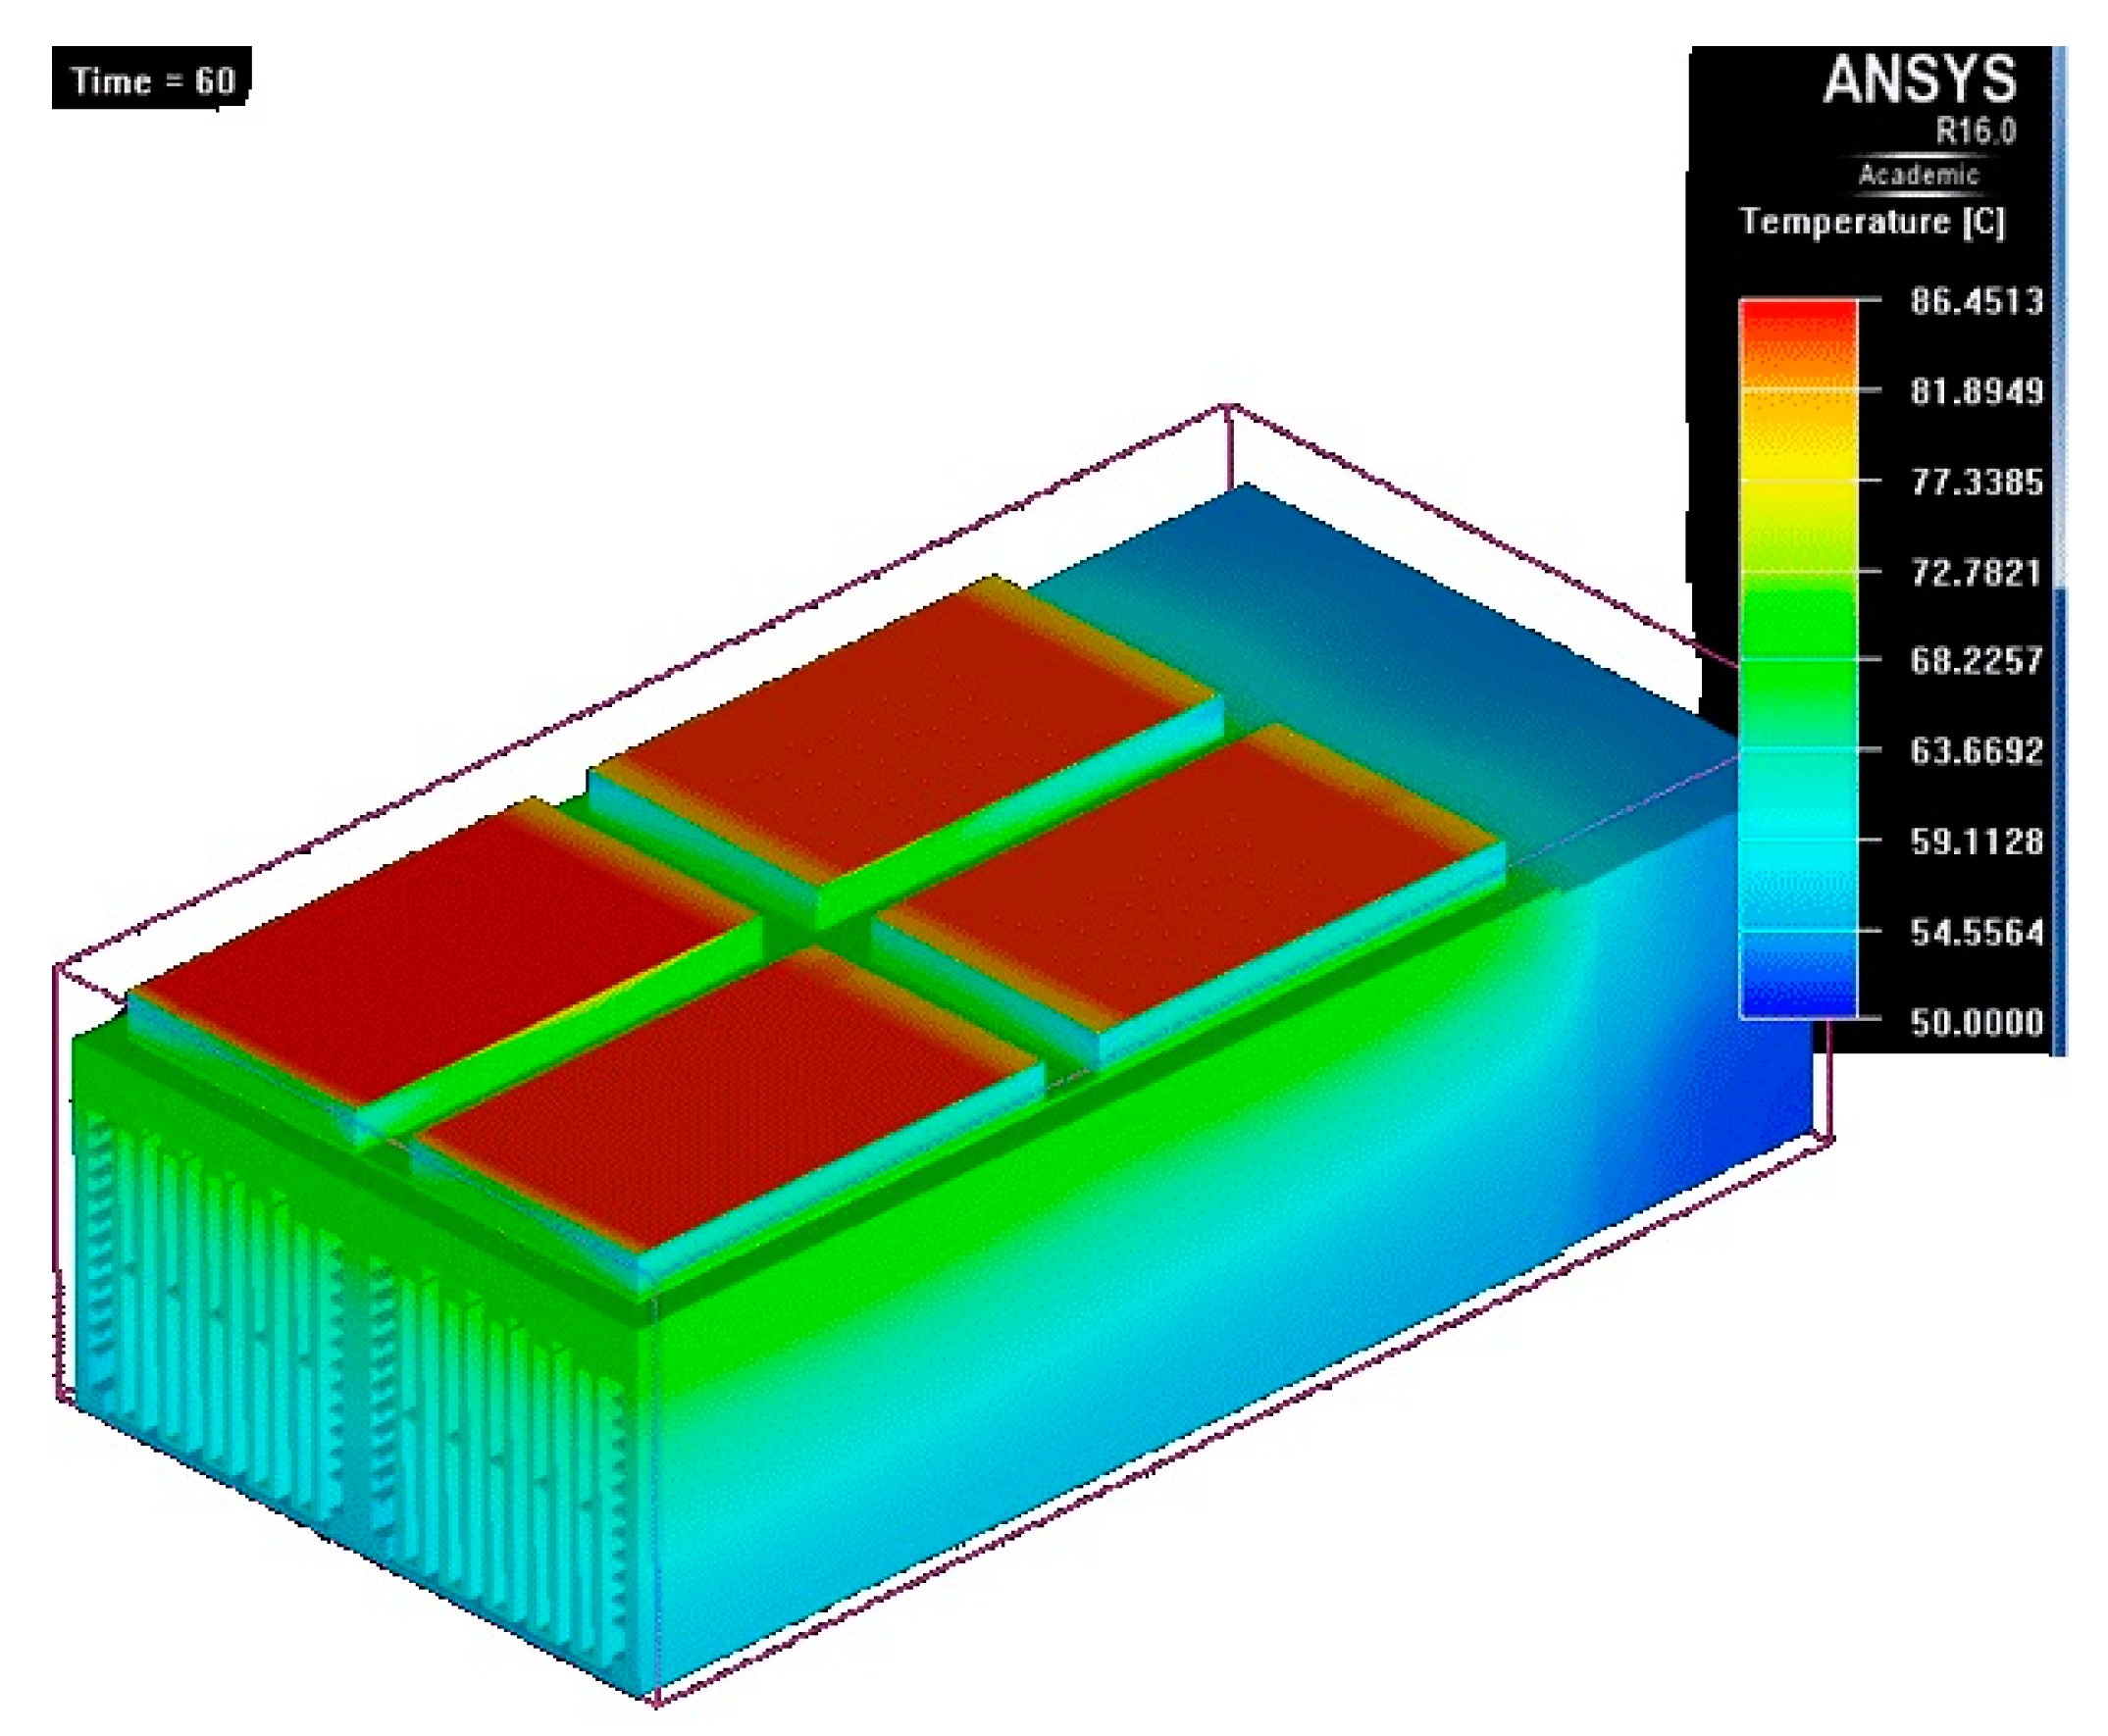
The maps (Figure 20, Figure 21, Figure 22, Figure 23 and Figure 24) of these transient temperatures are monitored at different moments:
- Initially, the temperature is 50 °C (Figure 20);
- After one minute (Figure 21), the maximal temperature has increased by 36 °C and is almost the same for all the four power module blocks (86 °C);
- After 2 min (Figure 22), the maximum temperature increases by 11 °C compared to the previous record. In other words, the effect of forced air convection by the fans becomes more important. Also, power modules which are further from fans have higher temperatures;
- 3 min (Figure 23) after the finite element transient simulation, the increase is limited to 7 °C compared to the value at 2 min;
- After 4 min (Figure 24), the temperature increases only by 4 °C compared to the previous record.
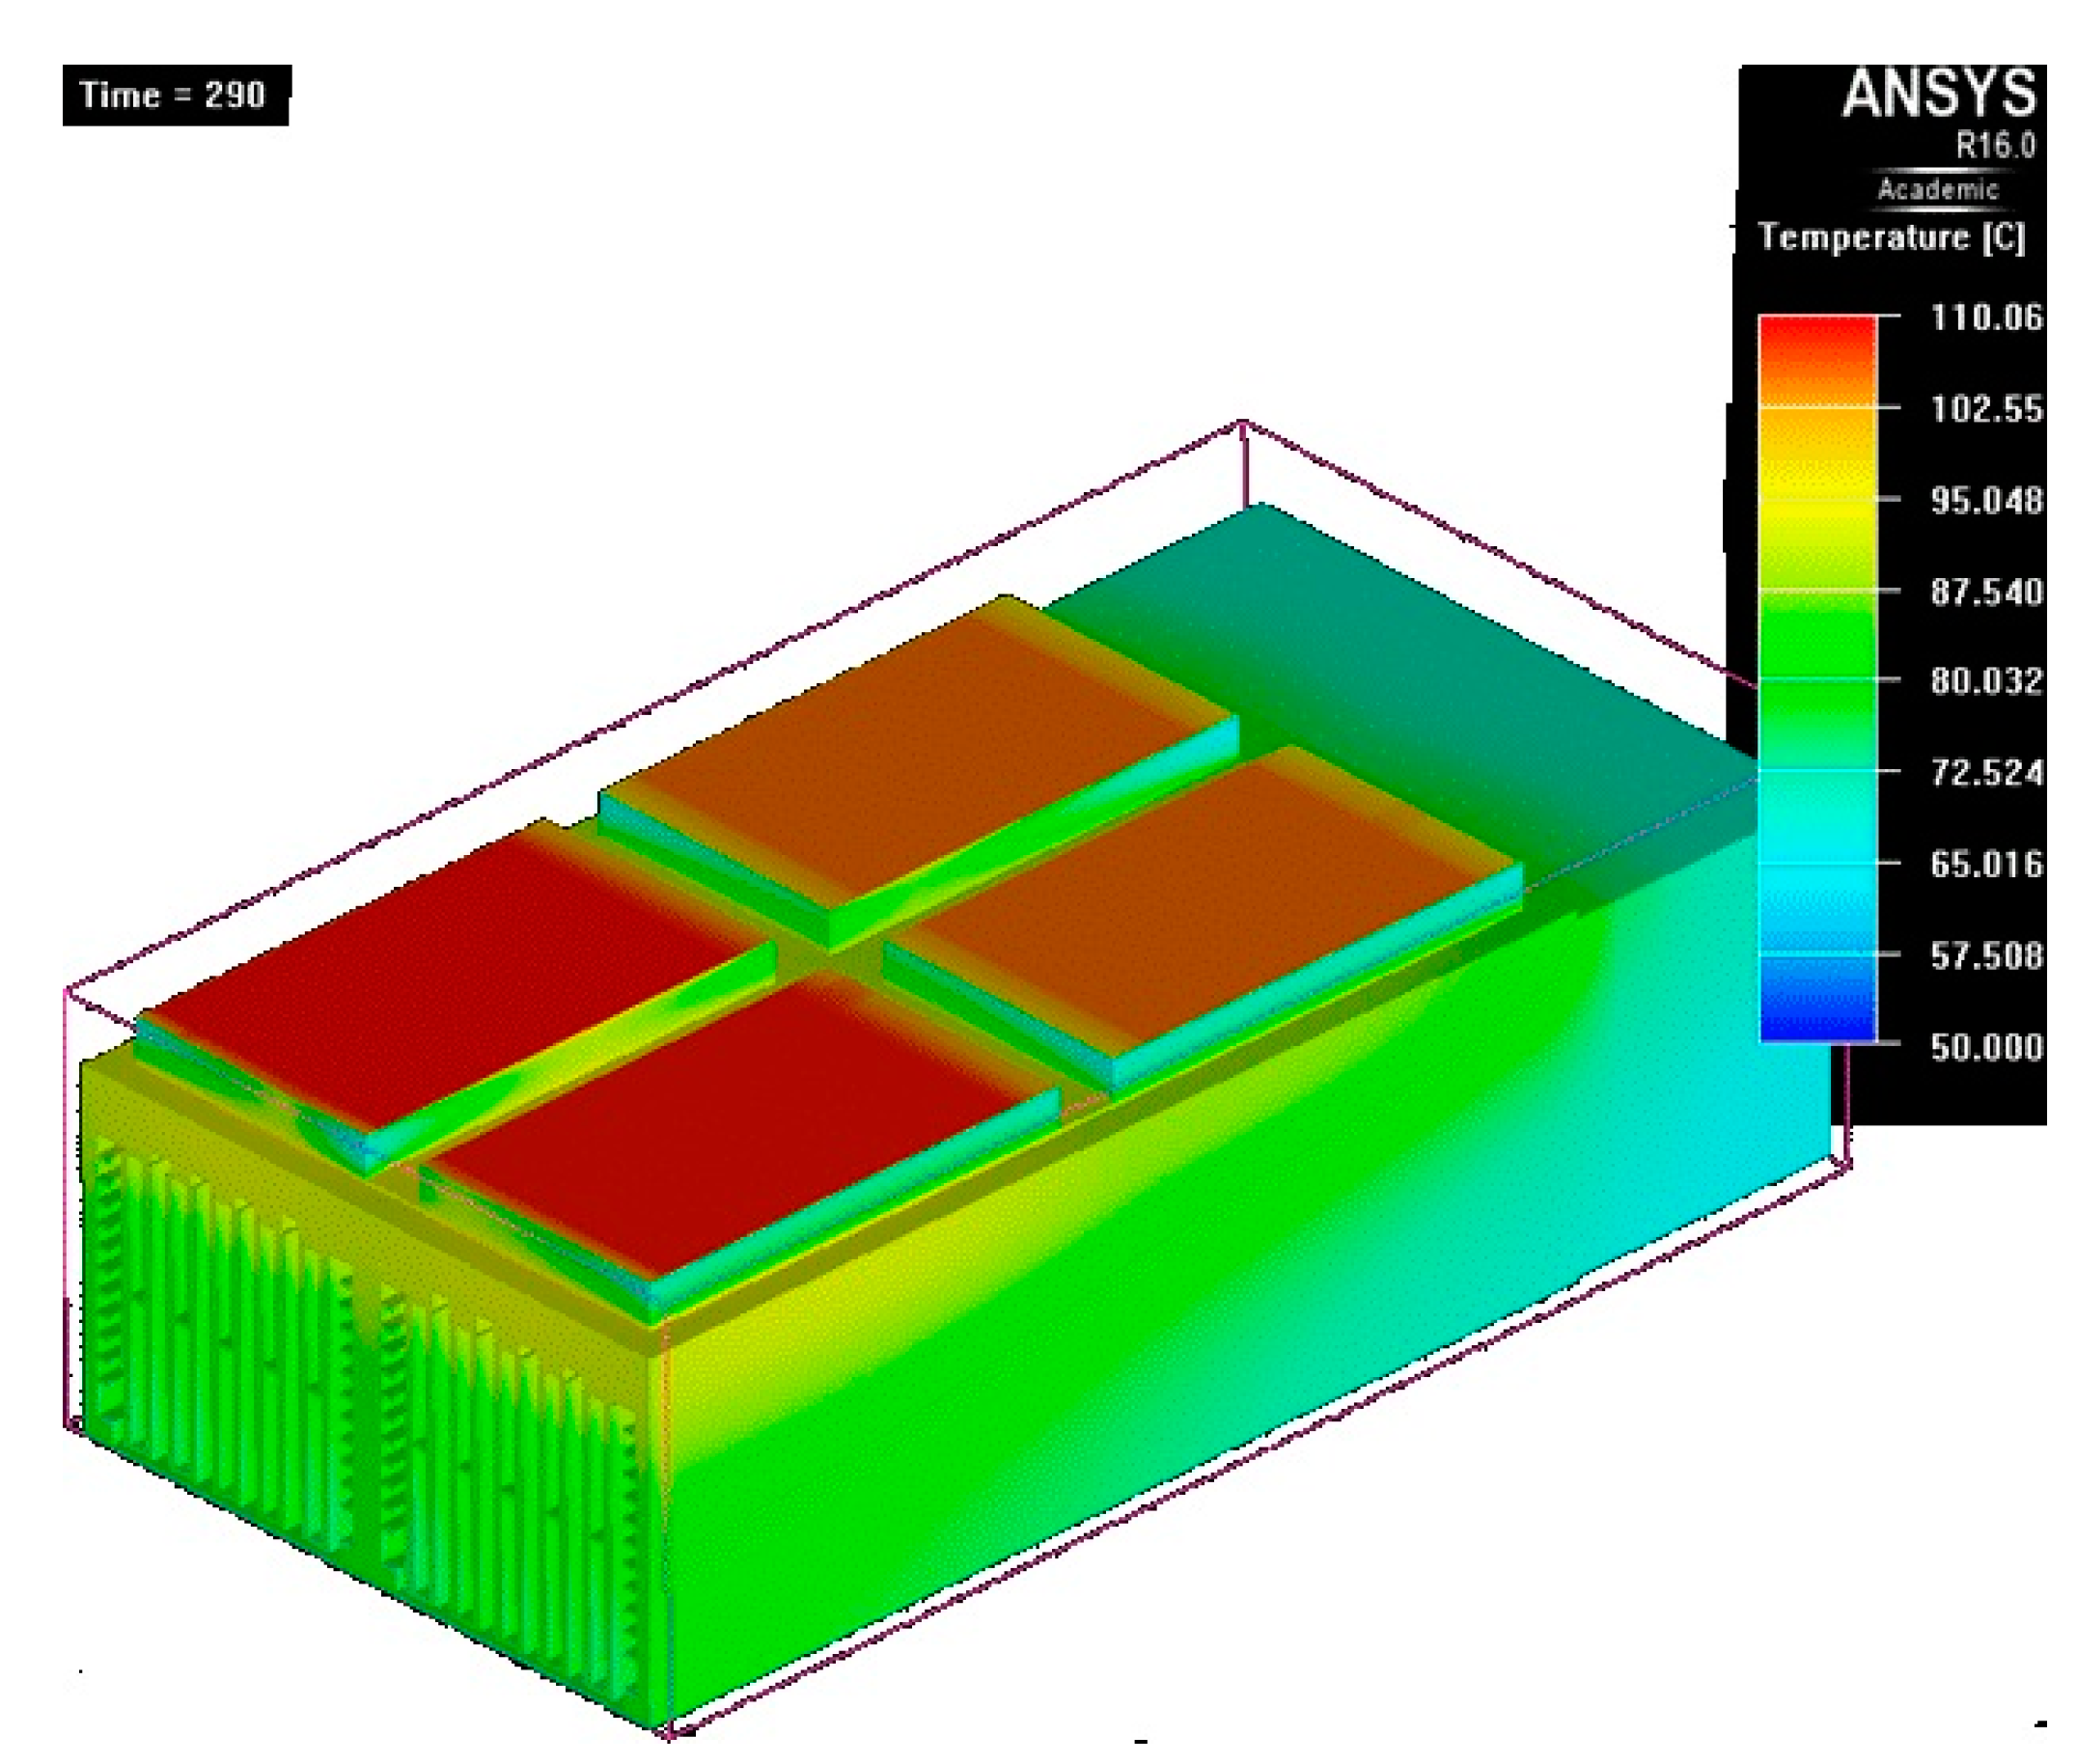
It is during the last 10 s of the half period imposed (5 min) that the temperature stops increasing and starts decreasing:
- At t = 290 s, the increase is observed at 2 °C (Figure 25);
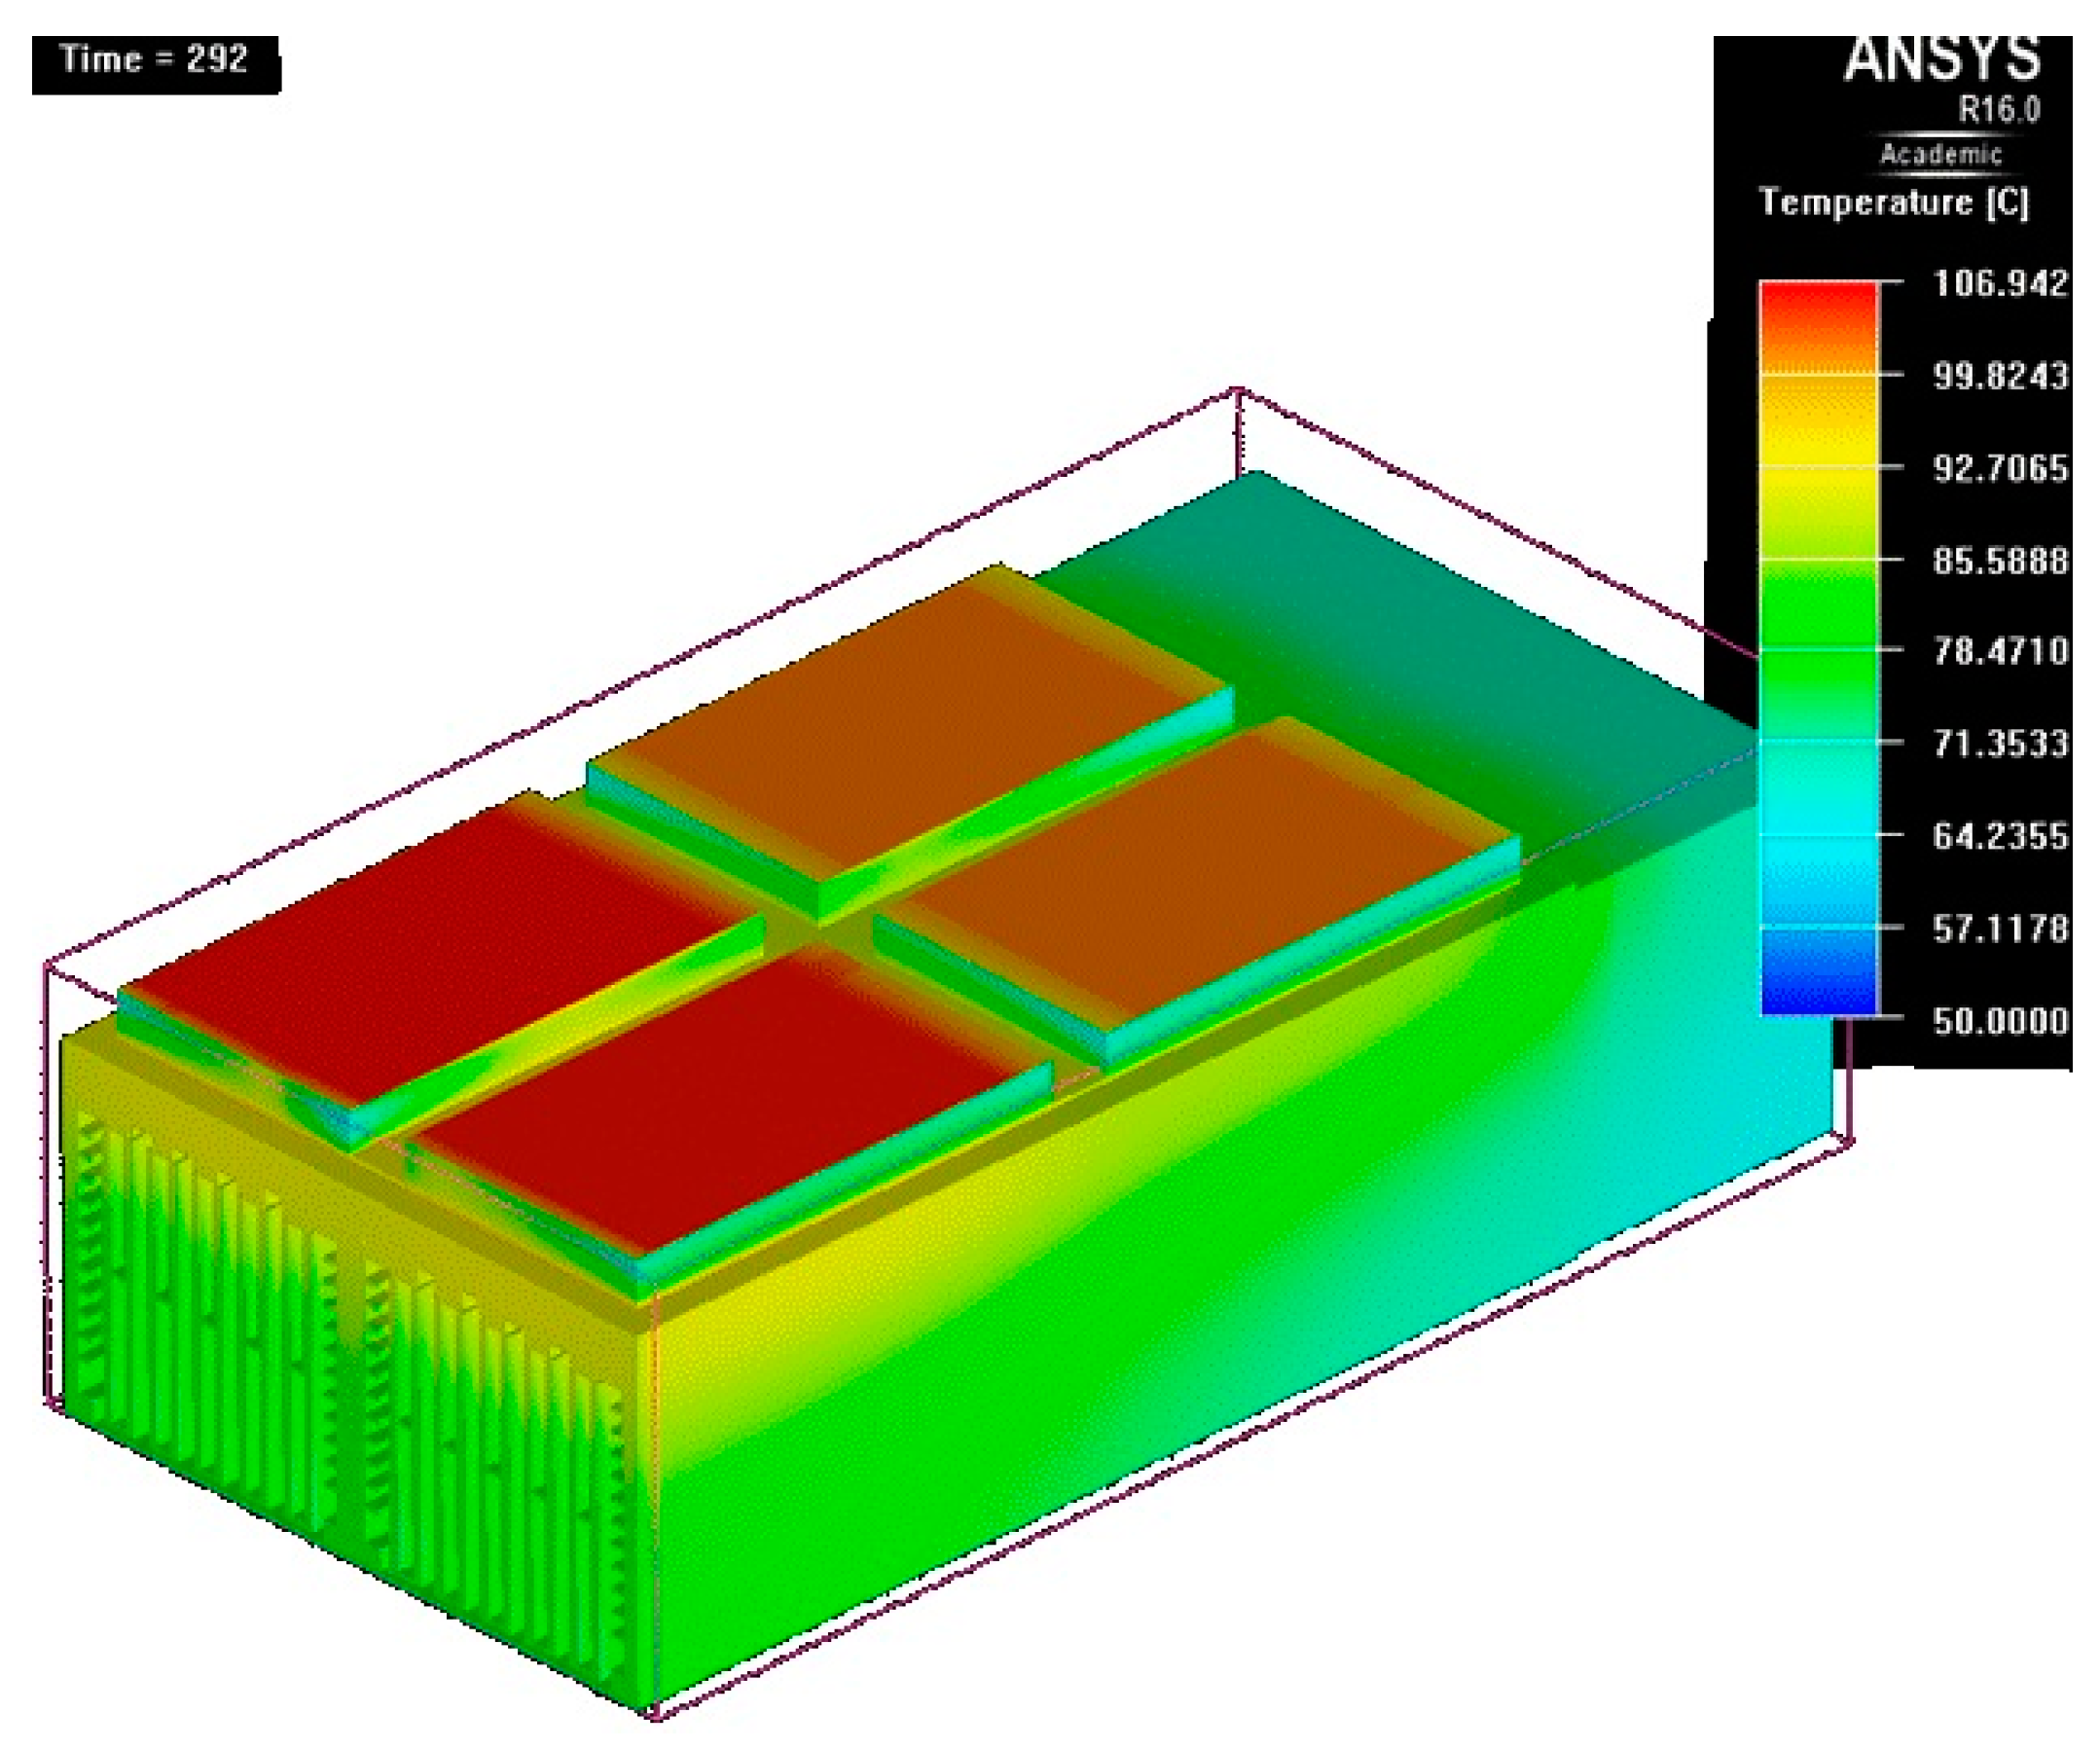
- At t = 292 s, a decrease is observed (Figure 26). The maximum temperature goes from 106 °C to 102 °C, corresponding to an important decrease of 4 °C in two seconds. From this time on, the air-cooled system has managed to reverse the trend;
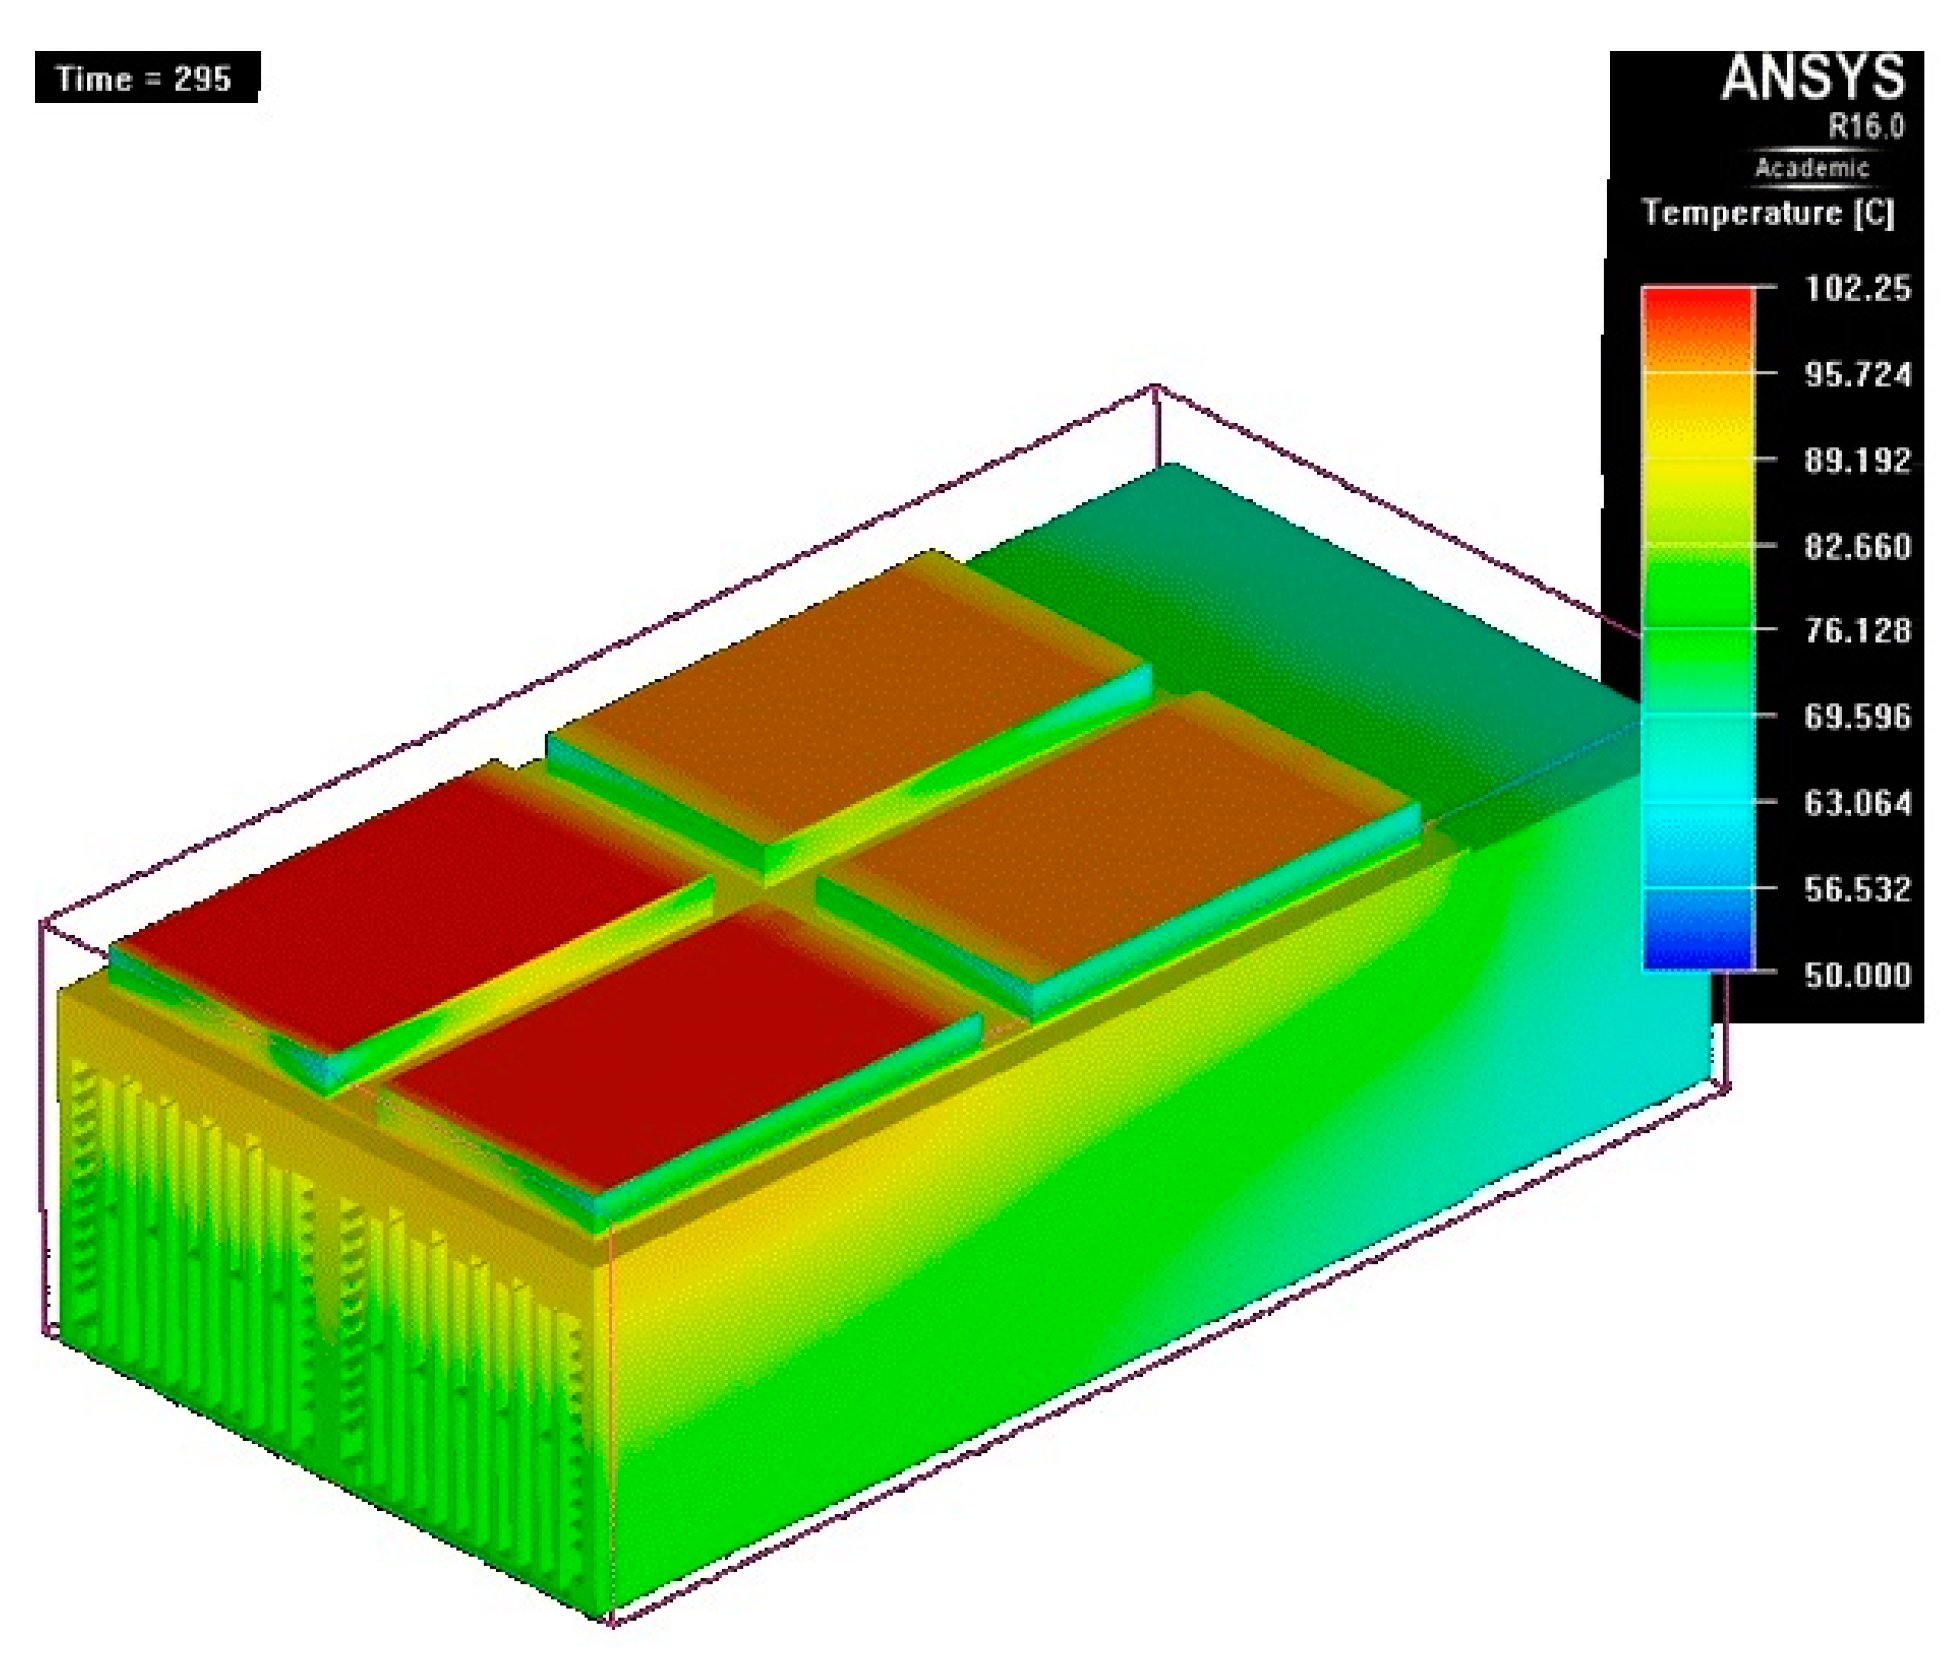
- At t = 295 s, a new decrease of 4 °C is observed (Figure 27);
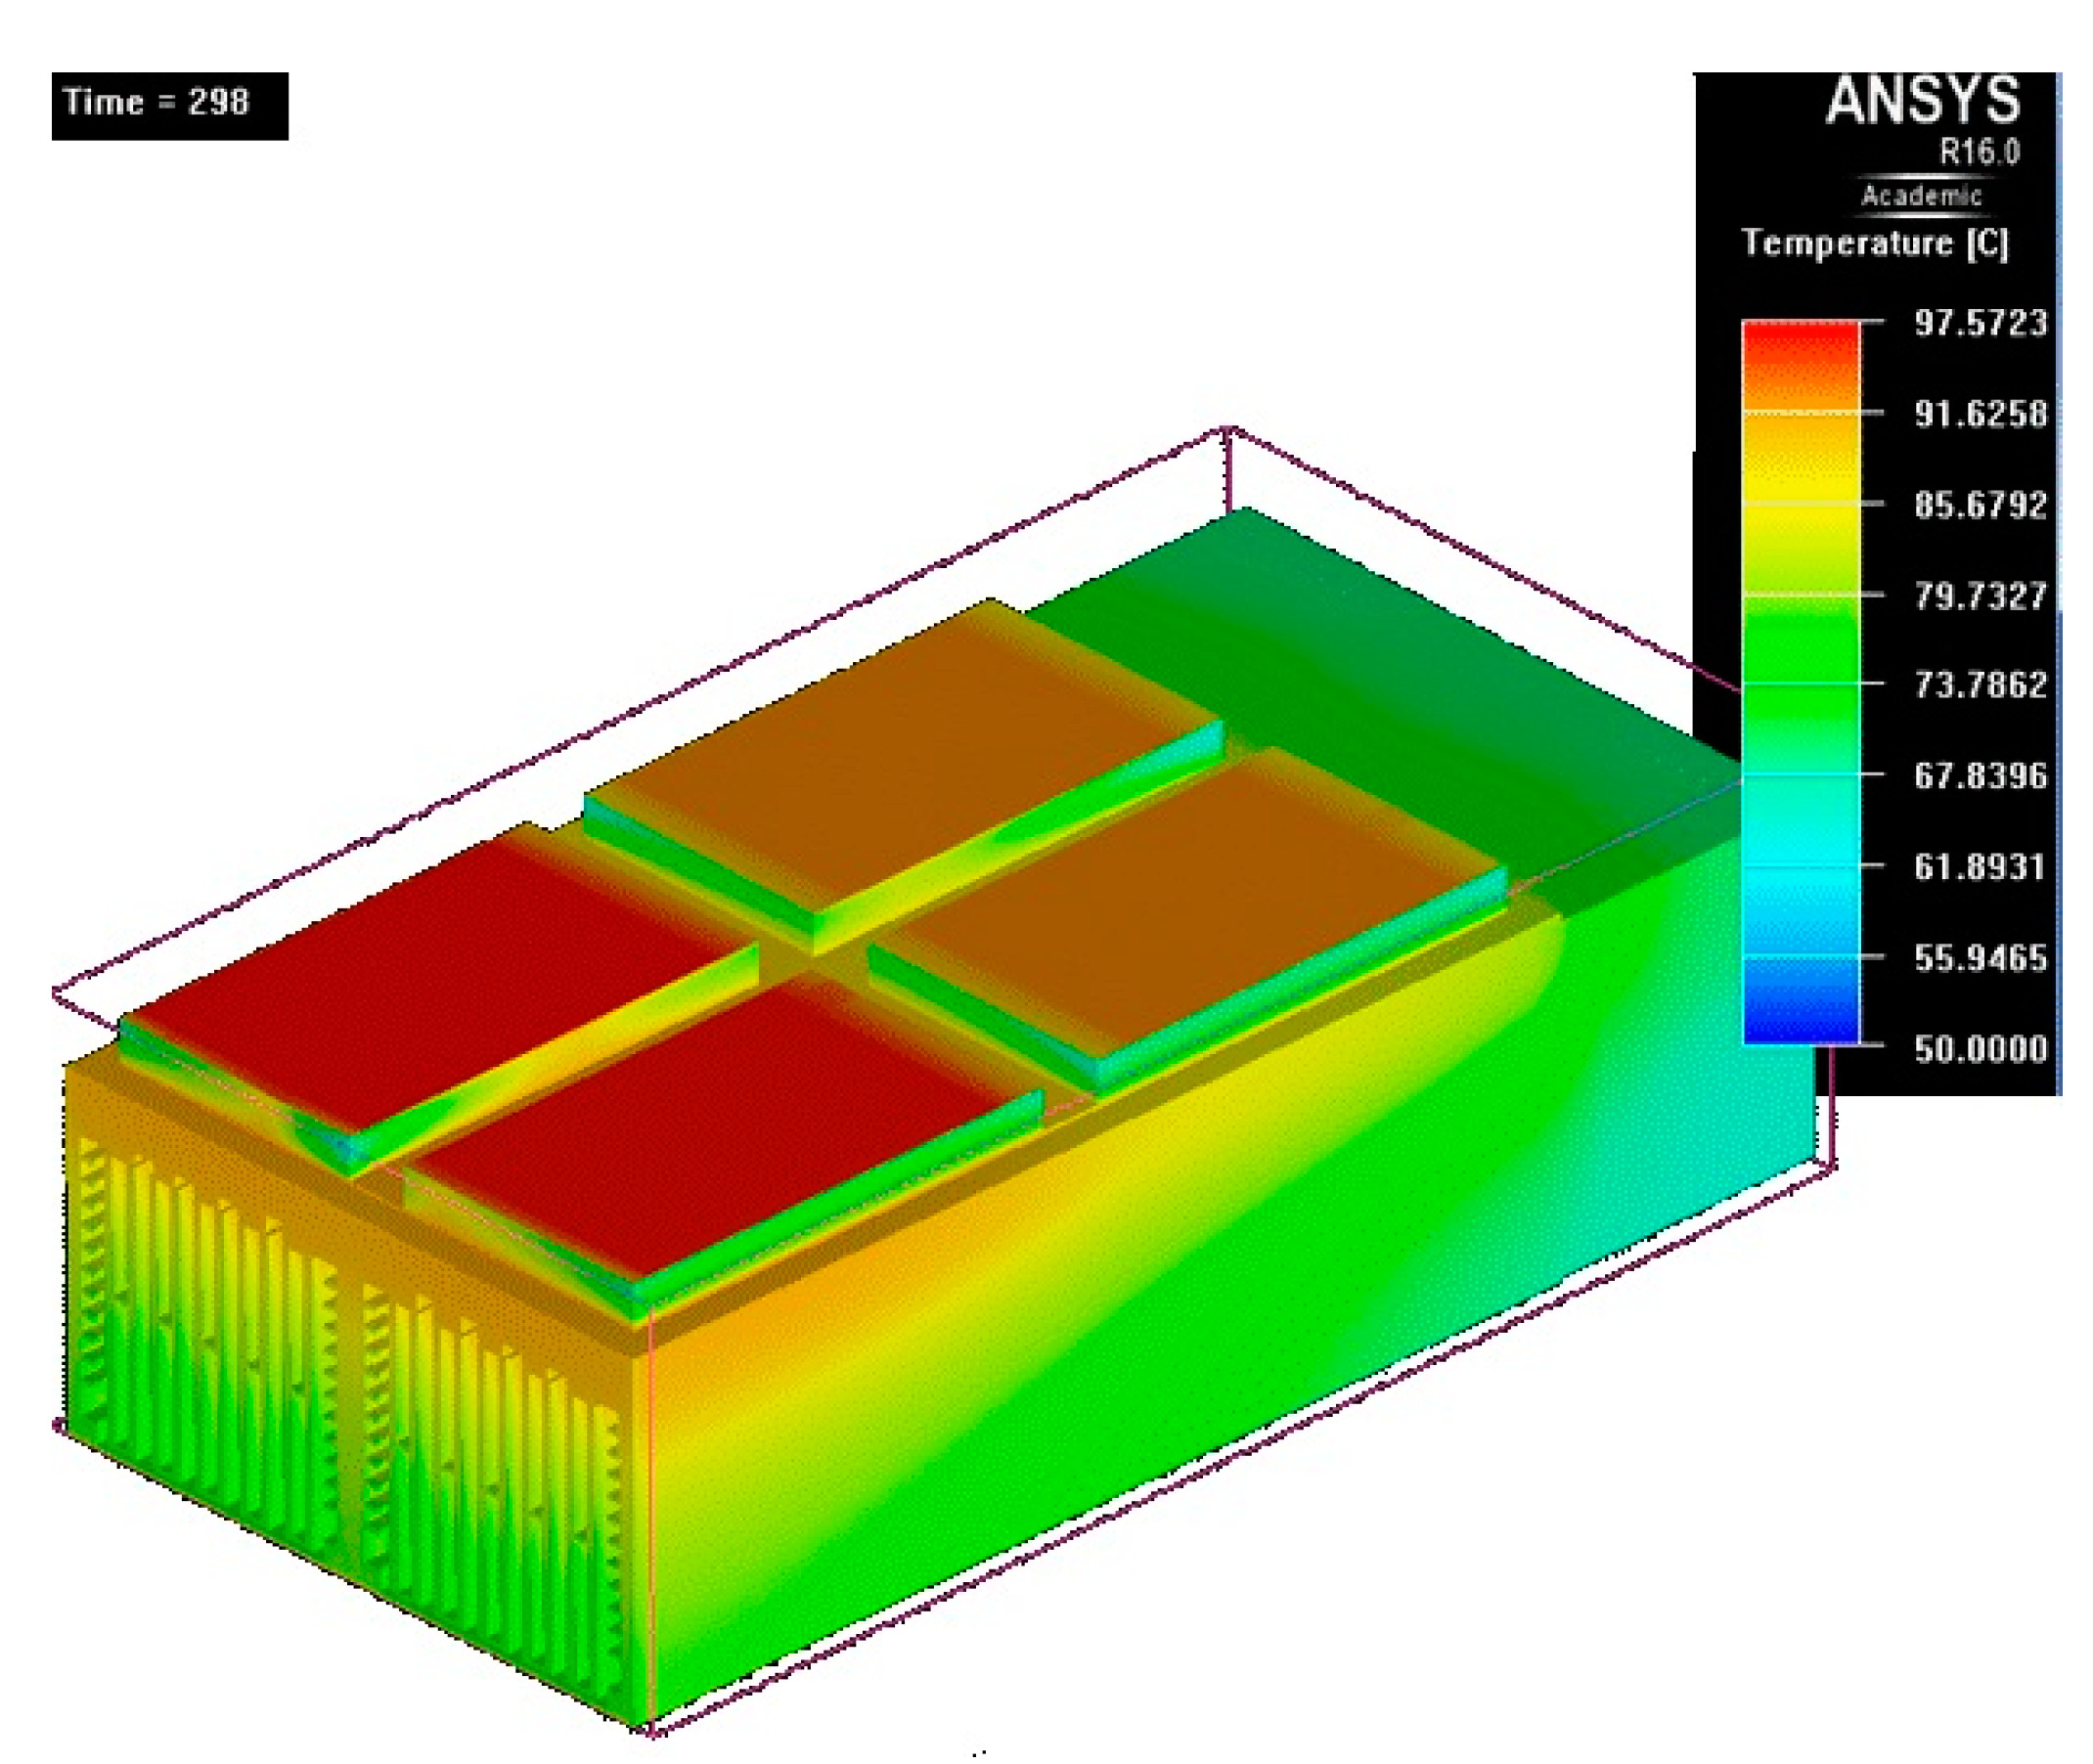
- At t = 298 s, the decrease is observed at 5 °C (Figure 28), preceding the second half period of 5 min.
The average temperature achieved in this case is about 87 °C.
4.3. Co-Simulation Results
The co-simulation is implemented using the model shown in Figure 2, taking into account the energy losses calculated in the characterization test and the thermal analysis. The simulation is performed at a nominal speed of 3600 rpm, converter switching frequency of 12.5 kHz and nominal (100 A peak per phase) and overload (140 A peak per phase) current conditions. The waveforms achieved are similar for both conditions. For this reason, results are shown for one condition.
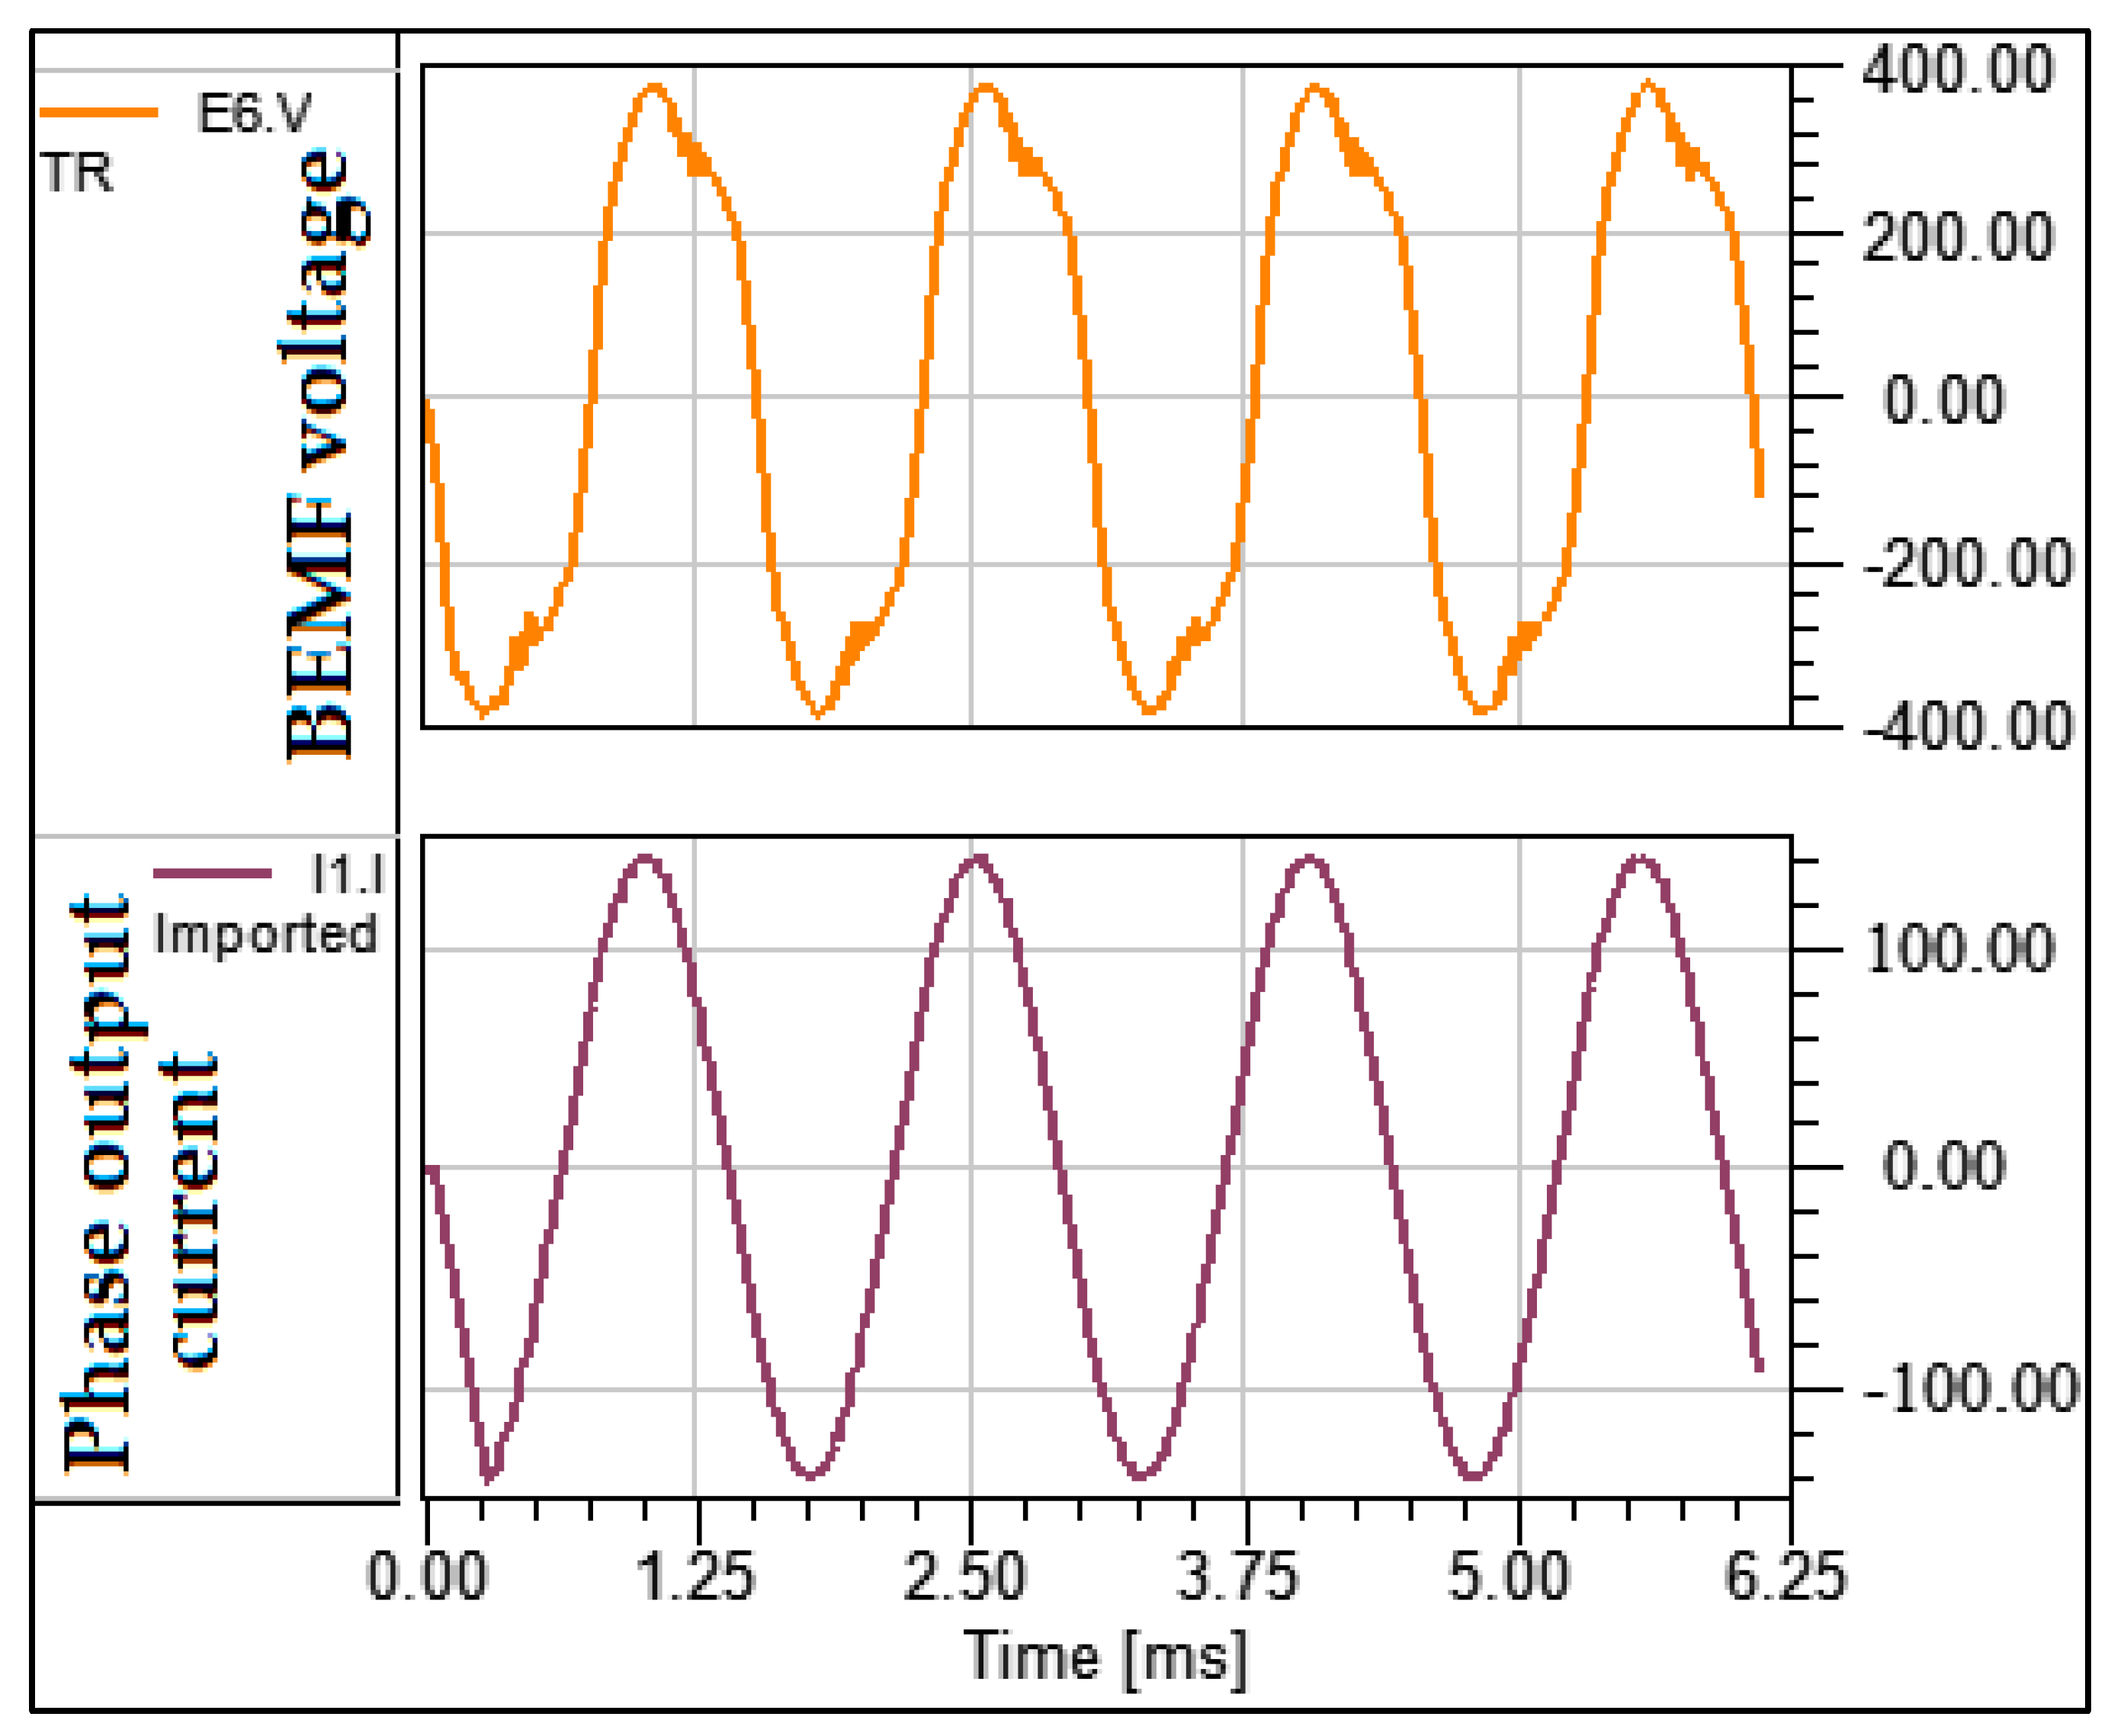
The different inputs of LTspice® during a simulation period are given in Figure 29 for the gate-to-source voltages of the four inverter switches, and Figure 30 for the BEMF and the output current. Note that the gate-to-source voltages (VGS) of Figure 31 are PWM commands of −5/+18 V. In fact, for some SiC devices, the higher the voltage level the better, depending on the driver used. As for the BEMF, it is a quasi-sinusoidal waveform of about 400 V peak, which is at the same frequency as the phase output current. The latter is at 660 Hz, knowing that the aerospace AC bus voltage frequency is between 400 and 800 Hz.
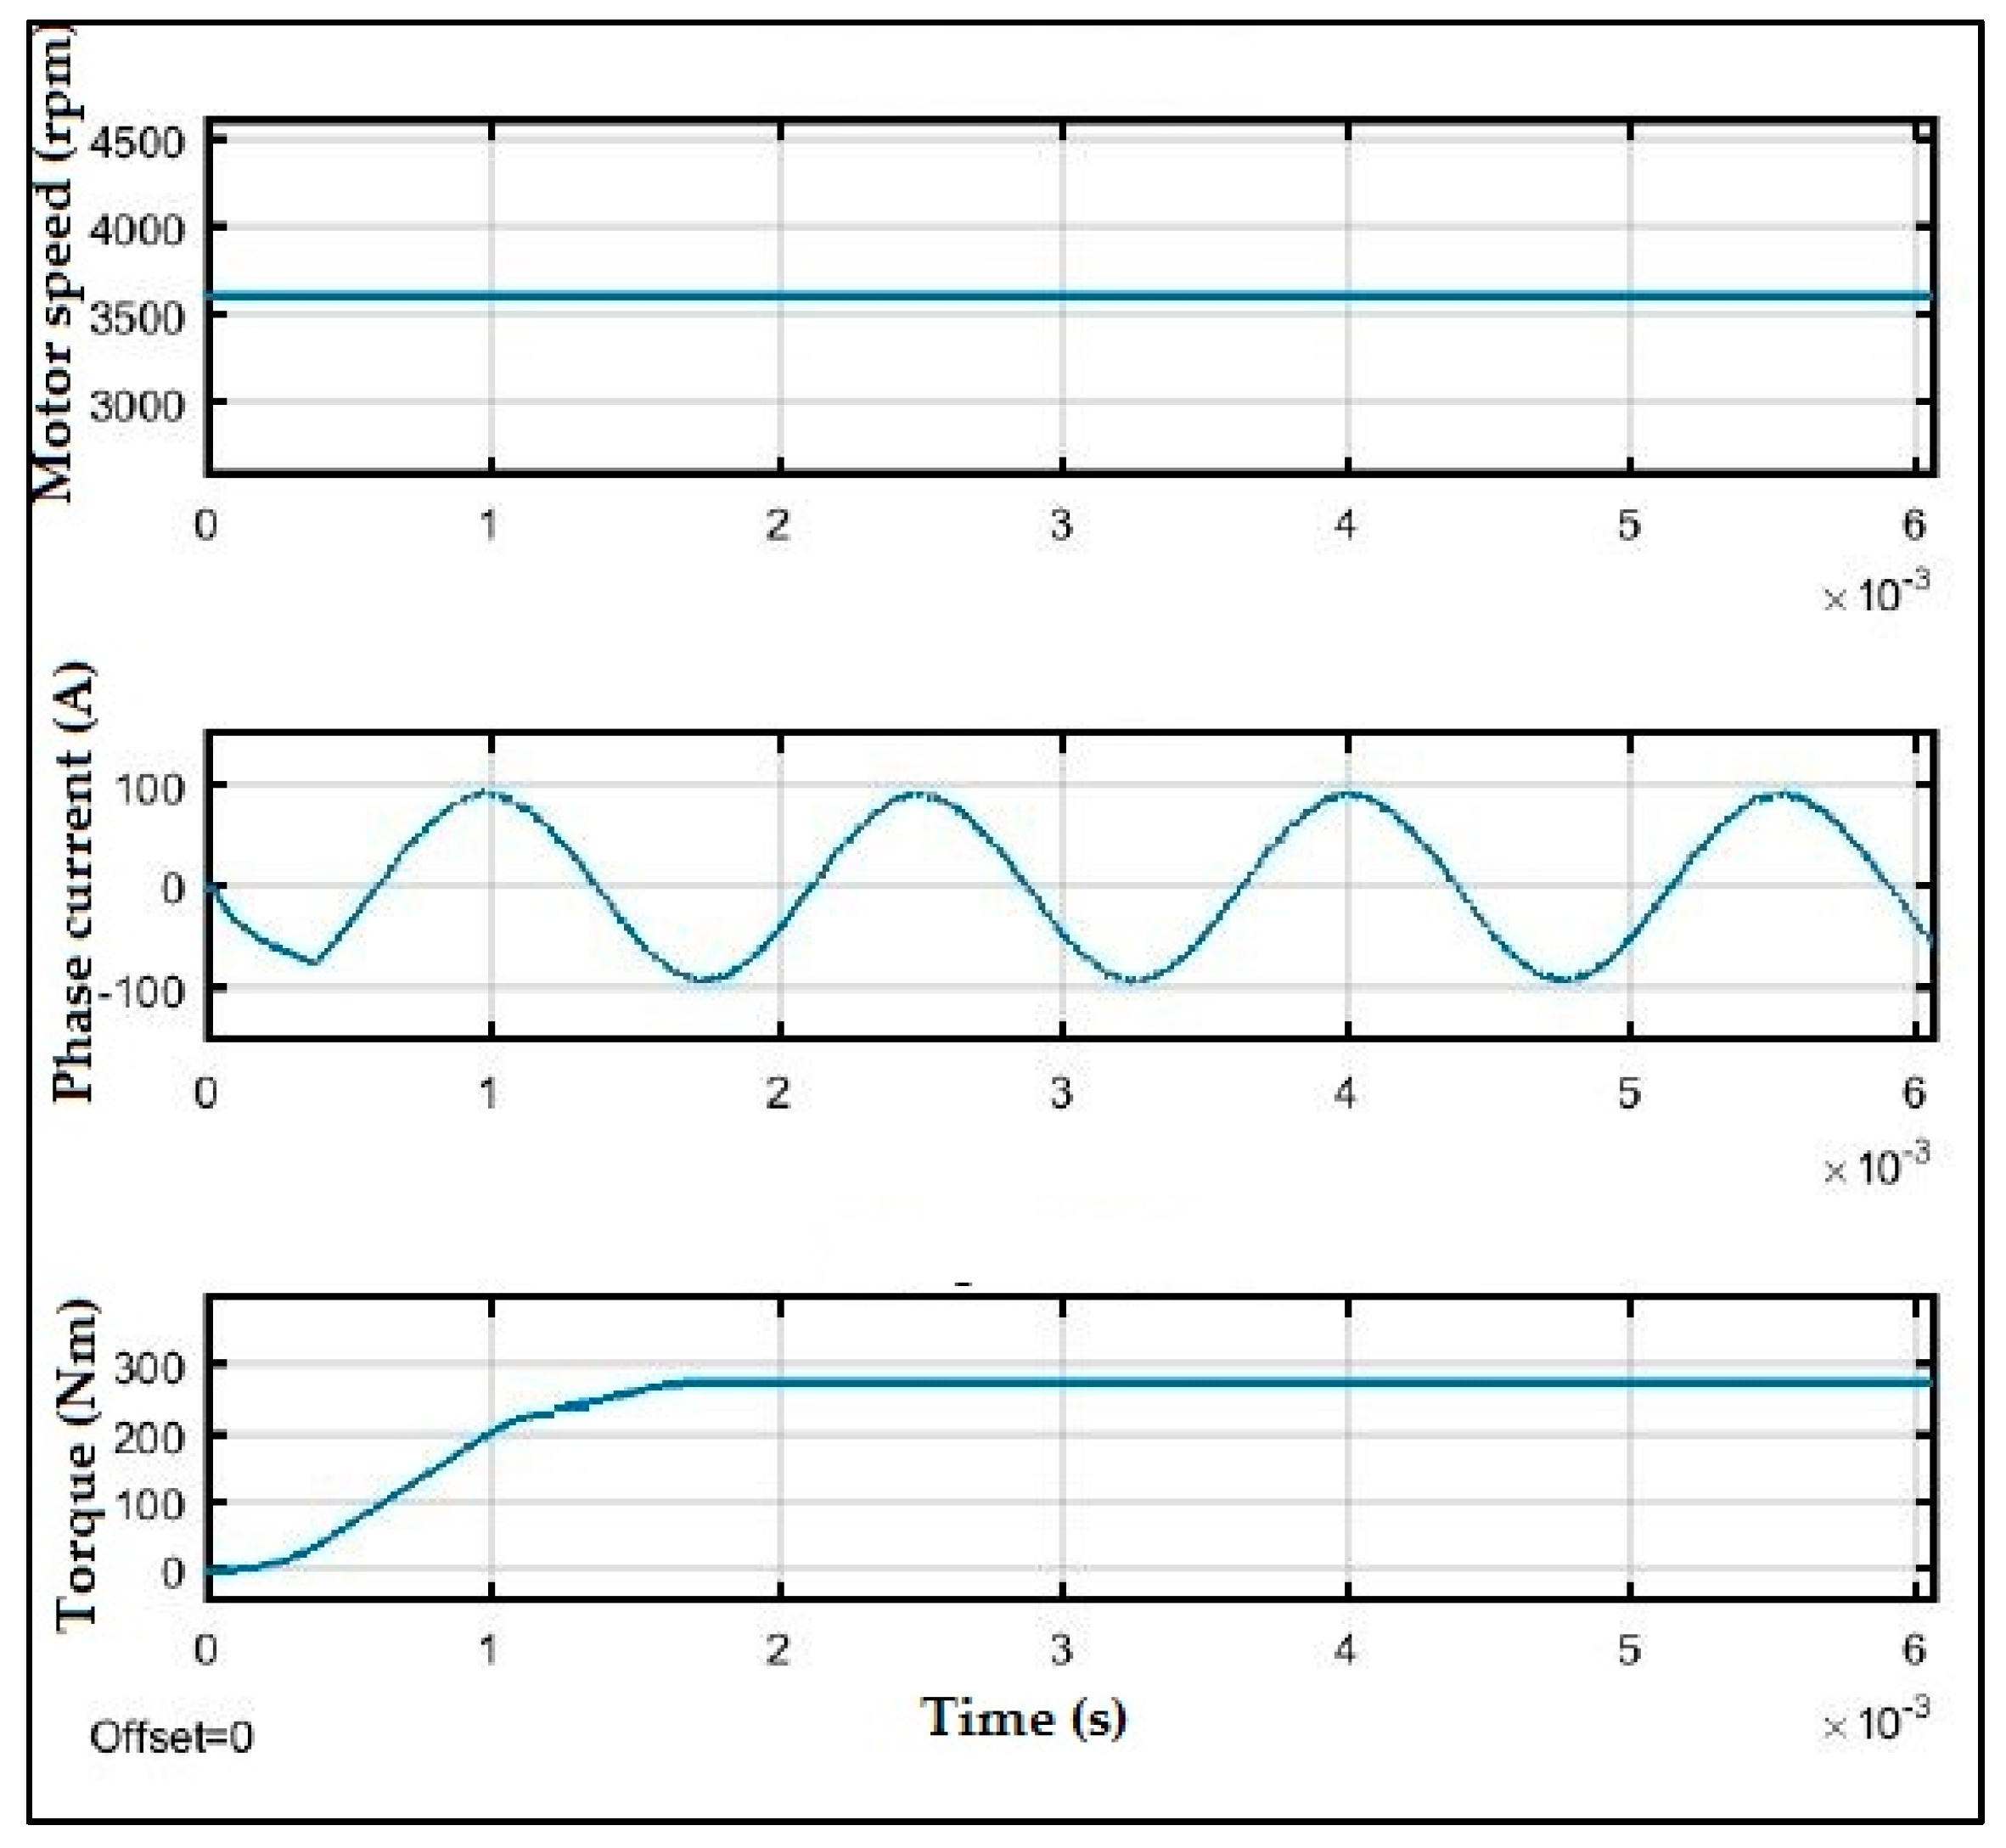
Given that the electric motor has been modeled in Simulink, its mechanical parameters, namely the speed and the torque, can be analyzed as shown in Figure 31. The speed is kept constant at 3600 rpm. The phase current is achieved for nominal conditions (100 A peak per phase) and the torque (T) is regulated at 300 Nm.
Considering these values, the mechanical output power can be computed by (11) and is around 120 kW.
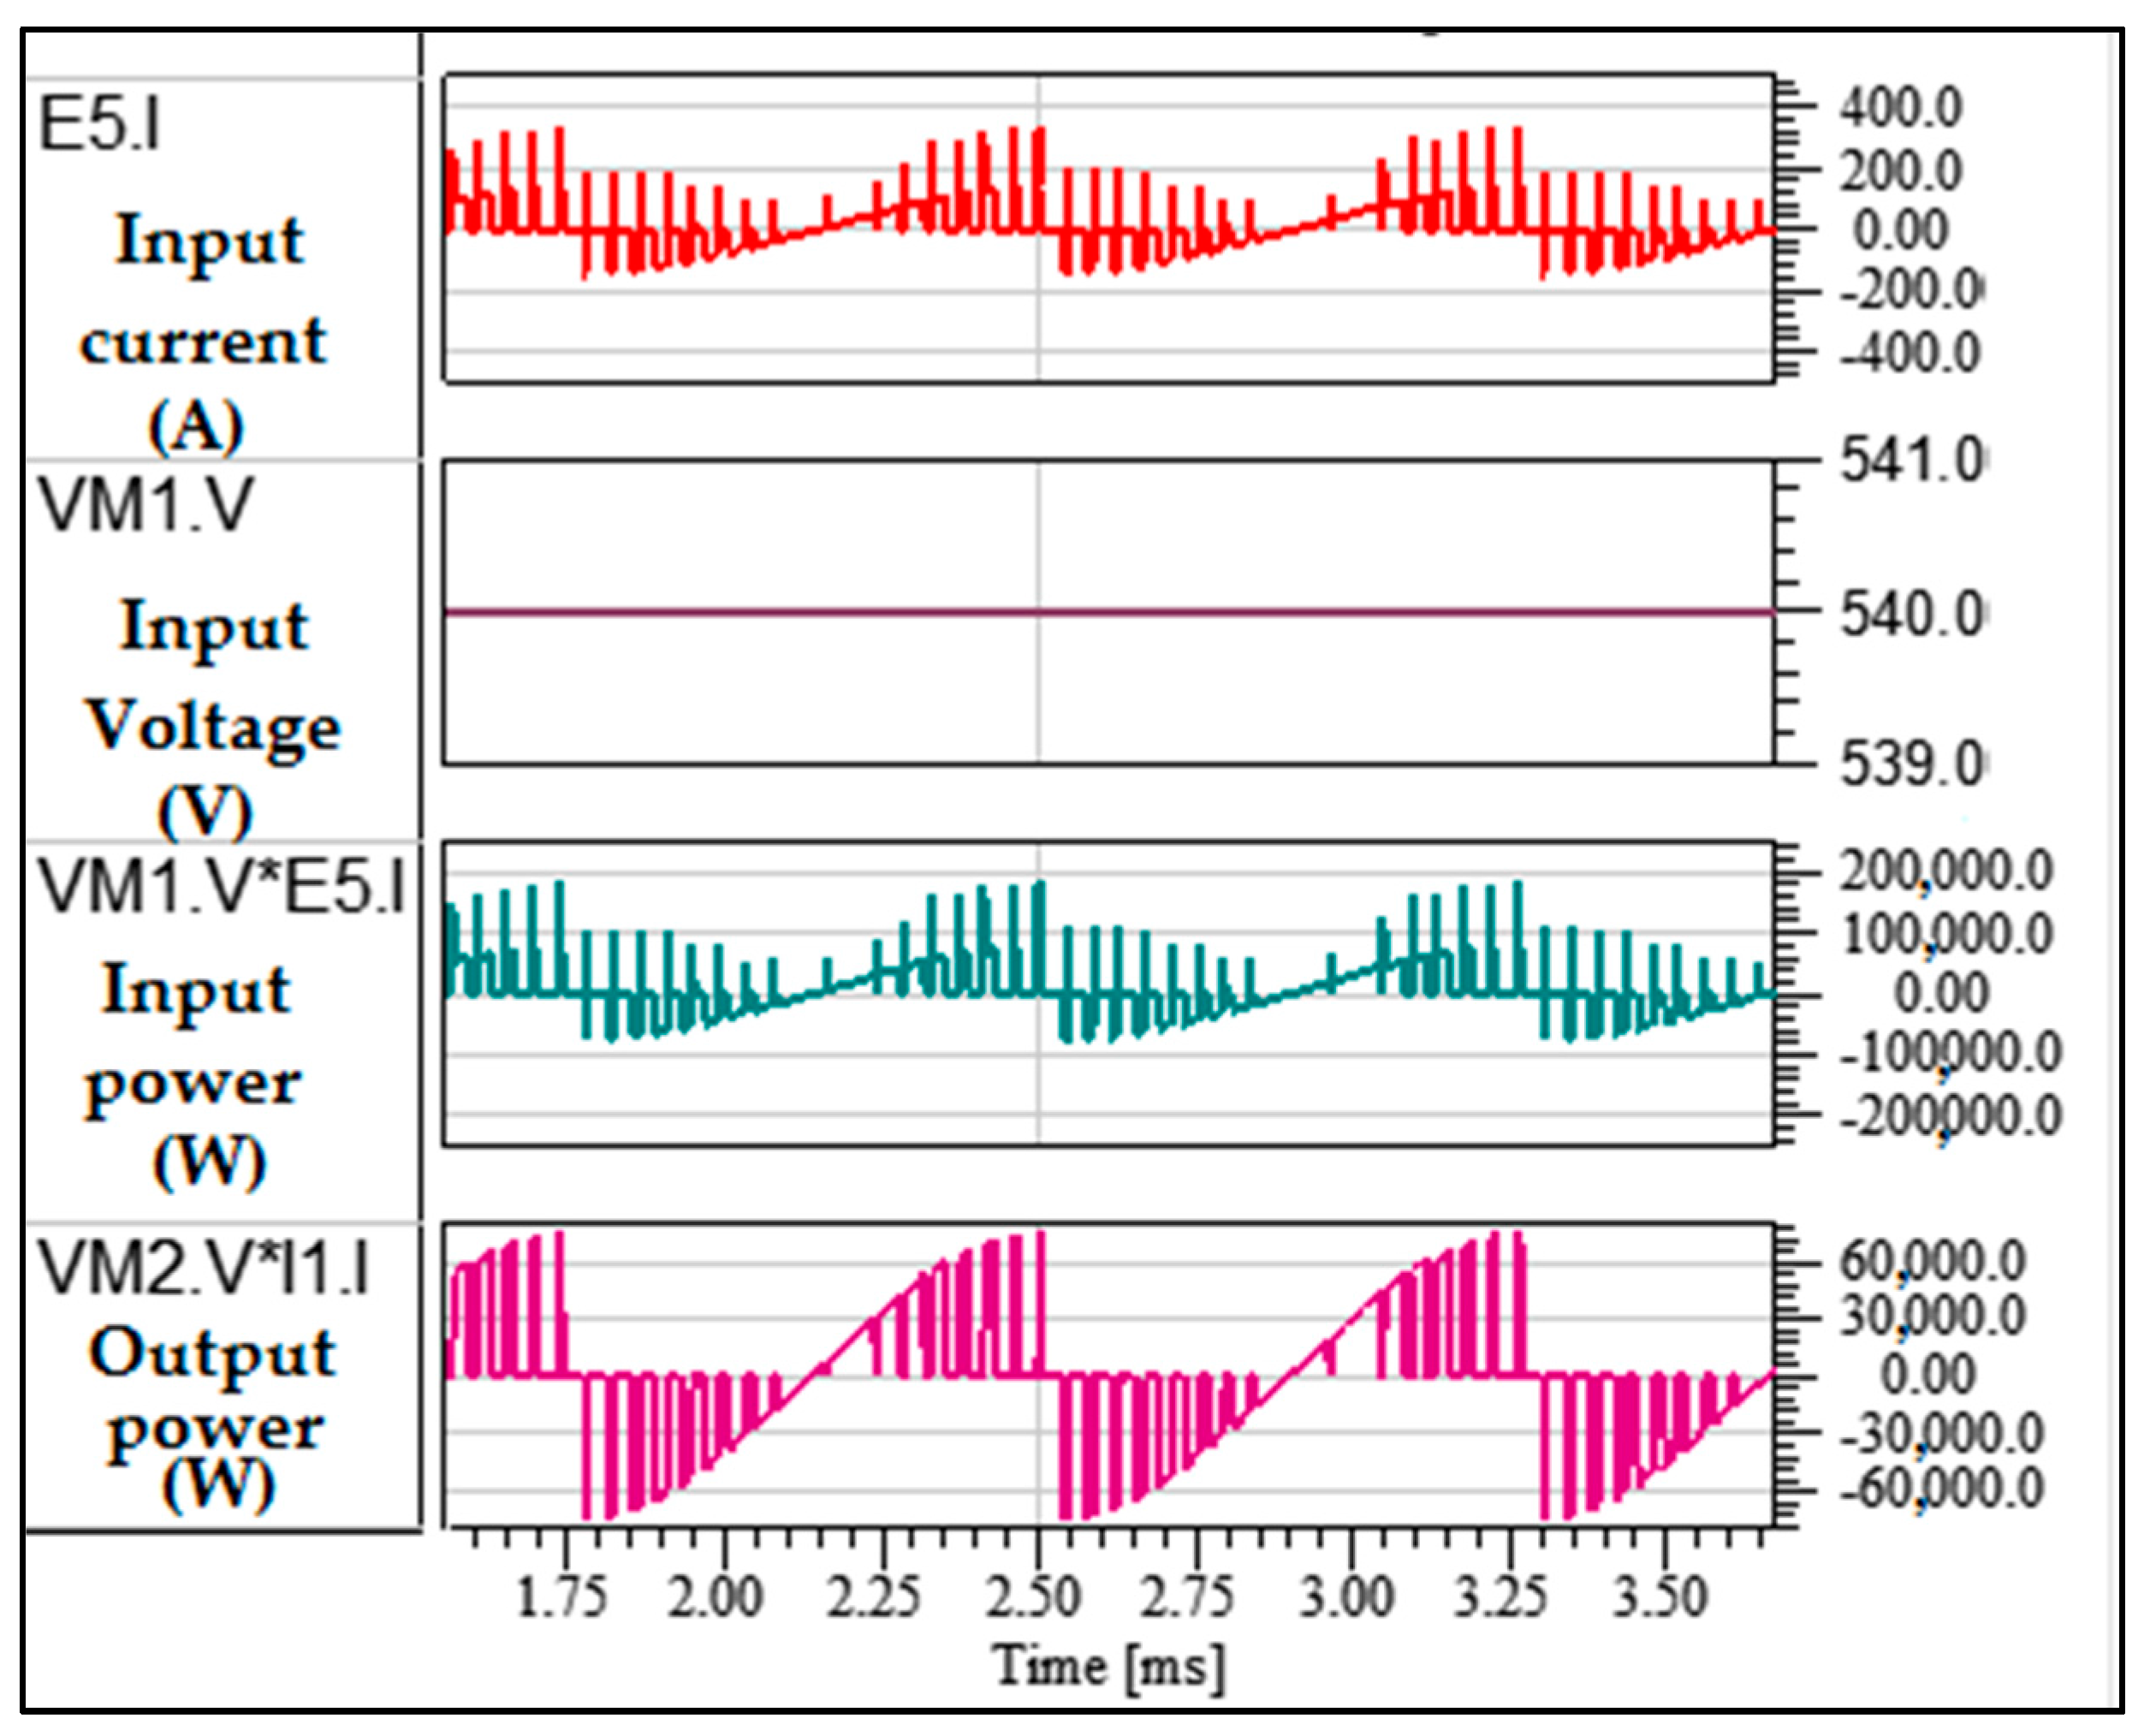
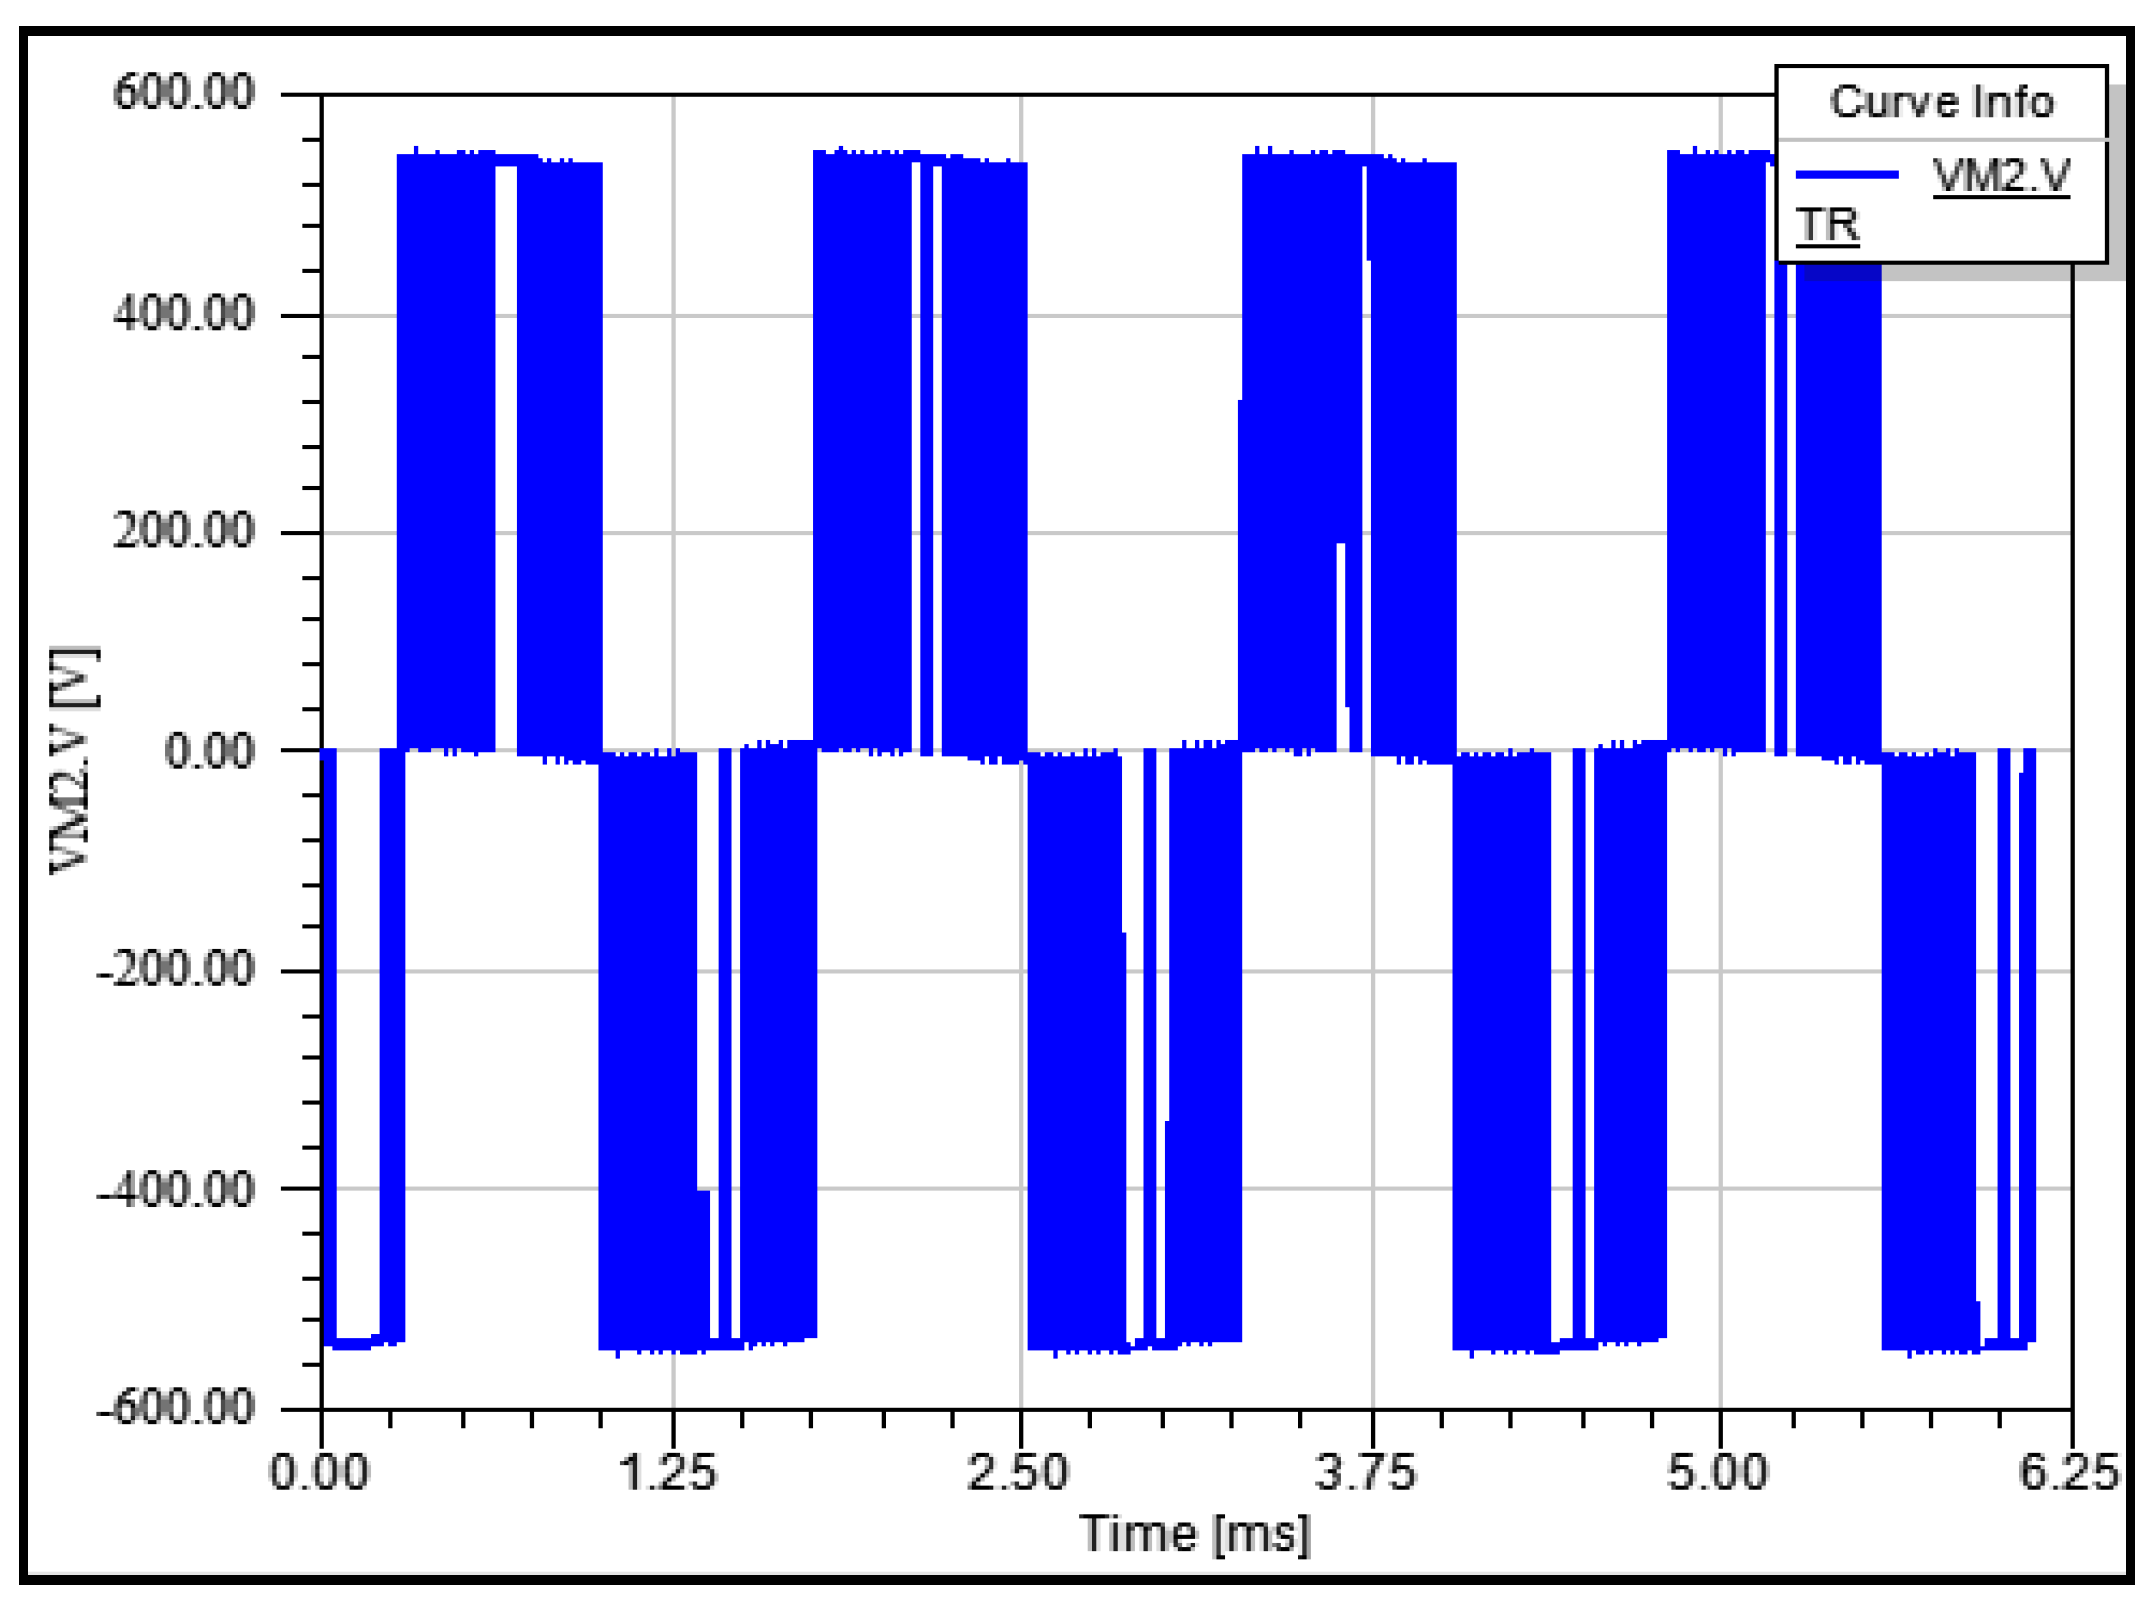
The input DC voltage being 540 V, the output voltage of the inverter shown in Figure 32 is +540/0/−540 V, which corresponds to the typical voltage level of an inverter controlled by a unipolar PWM modulation command. This waveform does not need to be sinusoidal because the motor is controlled in current. Figure 33 depicts the input current, the DC input voltage, the input power and the output power of the system. From this graph, the efficiency of the power converter achieved is 97% and 94%, respectively, for the normal and overload conditions. The decrease in efficiency is due to the increase of the losses for the overload condition.
5. Conclusions
The main objective of this paper is to deal with the design, modeling and testing of a high efficiency multi-phase power converter along with its cooling system for a helicopter. The studied 6-phase power modular DC/AC converter in an H-bridge topology has been implemented using advanced technology, SiC MOSFET. The switching energy losses of the power switch has been evaluated based on the double-pulse characterization test at 100 A, 540 VDC, VGS = −5/20 V with different operating temperatures. The turn-on and turn-off losses are recorded 5.3 mJ and 2.6 mJ at 100 °C and 5.8 mJ and 3.1 mJ at 150 °C, respectively. Then, a complete thermal analysis has been performed for the power converter during transient and steady state operation, to ensure that the cooling system is proper for this application. To evaluate the efficiency and the performance of the power converter, the Matlab-Simulink/LTspice® co-simulation model is used. The converter has been modeled in LTspice® whereas the motor and its controller have been modeled in Matlab/Simulink. The models presented allow the consideration of nonlinearities for both the electrical machine and the SiC switching devices of the inverter. These models aid in the evaluation of the interaction between the PM brushless motor and the power electronic converter in a realistic case study for aerospace applications. The efficiencies are evaluated at 97% for normal operating conditions (100 A, 12.5 kHz) and 94% for overload (140 A, 12.5 kHz) conditions. The results showed that the module is a valuable candidate for aircraft applications aiming for high efficiency at similar power and switching frequency levels.
Acknowledgments
This work has been done in the frame of the European project JTI Clean Sky Systems for Green Operations WP2.3.4.2 ETRD “Electrical Tail Rotor Drive” and has been associated with SoW S632_AH_Hybrid Propulsion_2015. The authors thank to CREE® for providing the LTspice model of the power module and advice for suitable use of the devices.
Author Contributions
Charles Onambele designed the power module and performed the experiments; Moataz Elsied performed the losses analysis; Augustin Mpanda Mabwe gave the main idea of multi physics design and analysis; Ahmed El Hajjaji and Augustin Mpanda Mabwe supervised all tasks. All authors contributed to the paper writing.
Conflicts of Interest
The authors declare no conflict of interest.
References
- Sarlioglu, B.; Morris, C.T. More Electric Aircraft: Review, Challenges, and Opportunities for Commercial Transport Aircraft. IEEE Trans. Transp. Electrif. 2015, 1, 54–64. [Google Scholar] [CrossRef]
- European Commission. CORDIS: Projects & Results Service: Periodic Report Summary 1-HYPERMAC (Hyper Performance Motor, Air-Cooled). Available online: http://cordis.europa.eu/project/rcn/191478_en.html (accessed on 31 August 2016).
- Fabri, G.; Loggia, E.D.; Tursini, M.; Villani, M. Fault-tolerant design of motor-drives for high reliability applications. In Proceedings of the IEEE 1st International Forum on Research and Technologies for Society and Industry Leveraging a Better Tomorrow (RTSI), Turin, Italy, 16–18 September 2015; pp. 219–225. [Google Scholar]
- Bonthu, S.S.R.; Choi, S.; Baek, J. Comparisons of three-phase and five-phase permanent magnet assisted synchronous reluctance motors. IET Electr. Power Appl. 2016, 10, 347–355. [Google Scholar] [CrossRef]
- Yang, J.; Dou, M.; Dai, Z.; Zhao, D.; Zhang, Z. Modeling and fault diagnosis of inter-turn short circuit for five-phase PMSM based on Particle Swarm Optimization. In Proceedings of the IEEE Applied Power Electronics Conference and Exposition (APEC), Long Beach, CA, USA, 20–24 March 2016; pp. 3134–3139. [Google Scholar]
- Villani, M.; Tursini, M.; Fabri, G.; Castellini, L. Multi-phase fault tolerant drives for aircraft applications. In Proceedings of the Railway and Ship Propulsion Electrical Systems for Aircraft, Bologna, Italy, 19–21 October 2010; pp. 1–6. [Google Scholar]
- Aghili, F. Fault-Tolerant Torque Control of BLDC Motors. IEEE Trans. Power Electron. 2011, 26, 355–363. [Google Scholar] [CrossRef]
- Sun, Z.; Wang, J.; Jewell, G.W.; Howe, D. Enhanced Optimal Torque Control of Fault-Tolerant PM Machine under Flux-Weakening Operation. IEEE Trans. Ind. Electron. 2010, 57, 344–353. [Google Scholar]
- Wolmarans, J.J.; Polinder, H.; Ferreria, J.A.; Clarenbach, D. Modular sensorless control of high speed, fault tolerant machines. In Proceedings of the 2010 International on Power Electronics Conference (IPEC), Sapporo, Japan, 21–24 June 2010; pp. 2533–2539. [Google Scholar]
- Nahome, A.A.; Zaimeddine, R.; Liu, B.; Undeland, T. Vector control of direct drive six phase permanent magnet synchronous generators. In Proceedings of the IEEE Trondheim on PowerTech, Trondheim, Norway, 19–23 June 2011; pp. 1–7. [Google Scholar]
- Aghili, F. Energy-Efficient and Fault-Tolerant Control of Multiphase Nonsinusoidal PM Synchronous Machines. IEEEASME Trans. Mechatron. 2015, 20, 2736–2751. [Google Scholar] [CrossRef]
- Tursini, M.; Villani, M.; Di Tullio, A.; Fabri, G.; Collazzo, F.P. Off-line co-simulation of multiphase PM motor-drives. In Proceedings of the International Conference on Electrical Machines (ICEM), Lausanne, Switzerland, 4–7 September 2016; pp. 1138–1144. [Google Scholar]
- Tursini, M.; Di Leonardo, L.; Di Tullio, A.; Della Loggia, E. Transient analysis of multiphase PM motor-drives by non-linear modeling. In Proceedings of the International Symposium on Power Electronics, Electrical Drives, Automation and Motion (SPEEDAM), Anacapri, Italy, 22–24 June 2016; pp. 85–90. [Google Scholar]
- Villani, M.; Parasiliti, F.; Tursini, M.; Fabri, G.; Castellini, L. PM brushless motors comparison for a Fenestron® type helicopter tail rotor. In Proceedings of the International Symposium on Electrical Drives, Automation and Motion in Power Electronics (SPEEDAM), Anacapri, Italy, 22–24 June 2016; pp. 22–27. [Google Scholar]
- Villani, M.; Collazzo, F.P.; Tursini, M.; Fabri, G.; Castellini, L. PM brushless motor design for helicopter tail rotor. In Proceedings of the International Conference on Electrical Machines (ICEM), Lausanne, Switzerland, 4–7 September 2016; pp. 2669–2675. [Google Scholar]
- Choi, K.S.; Won, C.Y.; Jung, Y.C.; Kim, J.W. ZVS H-bridge inverter using soft switching boost converter. In Proceedings of the IEEE 6th International Conference in Power Electronics and Motion Control, IPEMC ’09, Wuhan, China, 17–20 May 2009; pp. 1488–1492. [Google Scholar]
- Sun, H.D.; Park, M.Y.; Park, J.H.; Kim, H.G.; Chun, T.W.; Nho, E.C. Novel H-bridge multi-level inverter with DC-link switches. In Proceedings of the IEEE 8th International Conference on Power Electronics and ECCE Asia (ICPE ECCE), Jeju, Korea, 30 May–3 June 2011; pp. 1734–1741. [Google Scholar]
- Yu, F.; Huang, L.; Wang, S. A novel direct torque control of PMSM based on three-phase H-bridge inverter. In Proceedings of the International Conference on Electrical Machines and Systems (ICEMS), Beijing, China, 20–23 August 2011; pp. 1–3. [Google Scholar]
- SiC Power Module. CAS325M12HM2 CREE Semiconductor. Available online: https://www.wolfspeed.com/downloads/dl/file/id/967/product/204/cas325m12hm2.pdf (accessed on 3 September 2016).
- Yapa, R.; Forsyth, A.J.; Todd, R. Analysis of SiC technology in two-level and three-level converters for aerospace applications. In Proceedings of the 7th IET International Conference on Machines and Drives (PEMD 2014), Manchester, UK, 8–10 April 2014; pp. 1–6. [Google Scholar]
- Biela, J.; Schweizer, M.; Waffler, S.; Kolar, J.W. SiC versus Si: Evaluation of Potentials for Performance Improvement of Inverter and DC/DC Converter Systems by SiC Power Semiconductors. IEEE Trans. Ind. Electron. 2011, 58, 2872–2882. [Google Scholar] [CrossRef]
- Fabre, J.; Ladoux, P.; Piton, M. Characterization and Implementation of Dual-SiC MOSFET Modules for Future Use in Traction Converters. IEEE Trans. Power Electron. 2015, 30, 4079–4090. [Google Scholar] [CrossRef]
- Onambele, C.; Mpanda, A.; Giacchetti, F.; Elsied, M. High Performance SiC MOSFETs for Fault Tolerant Applications. In Proceedings of the International Conference on Renewable Energies and Power Quality (ICREPQ’17), Malaga, Spain, 4–6 April 2017. [Google Scholar]
- Onambele, C.; Mpanda, A.; Elsied, M.; Giacchetti, F. Highly Efficient Drive System based on SiC MOSFETs for High Power Electric Transportation. In Proceedings of the International Conference on Compatibility, Power Electronics and Power Engineering (CPE-POWERENG), Cadiz, Spain, 4–6 April 2017. [Google Scholar]
Figure 1.
Helicopter power system description.

Figure 2.
Matlab-Simulink/LTspice® co-simulation structure.

Figure 3.
LTspice® model of the power converter.

Figure 4.
Off-line co-simulation model [12].
Figure 4.
Off-line co-simulation model [12].

Figure 5.
Motor Control loop.

Figure 6.
3D ICEPAK Silicon Carbide (SiC) module available modeling methods: Single-junction model (left) and triple-junction model (right).
Figure 6.
3D ICEPAK Silicon Carbide (SiC) module available modeling methods: Single-junction model (left) and triple-junction model (right).

Figure 7.
3-D proposed n-junction model.
Figure 8.
Proposed arrangement of phases: Two phases per module (Left) & Hexaphase power converter (Right).
Figure 8.
Proposed arrangement of phases: Two phases per module (Left) & Hexaphase power converter (Right).
Figure 9.
SiC power module connected to DC-bus capacitor.
Figure 10.
Gate driver of SiC module.

Figure 11.
Complete test setup for the characterization of the SiC module.
Figure 12.
Gate driver output signals—From top: VGS2; VGS1; VCMD.
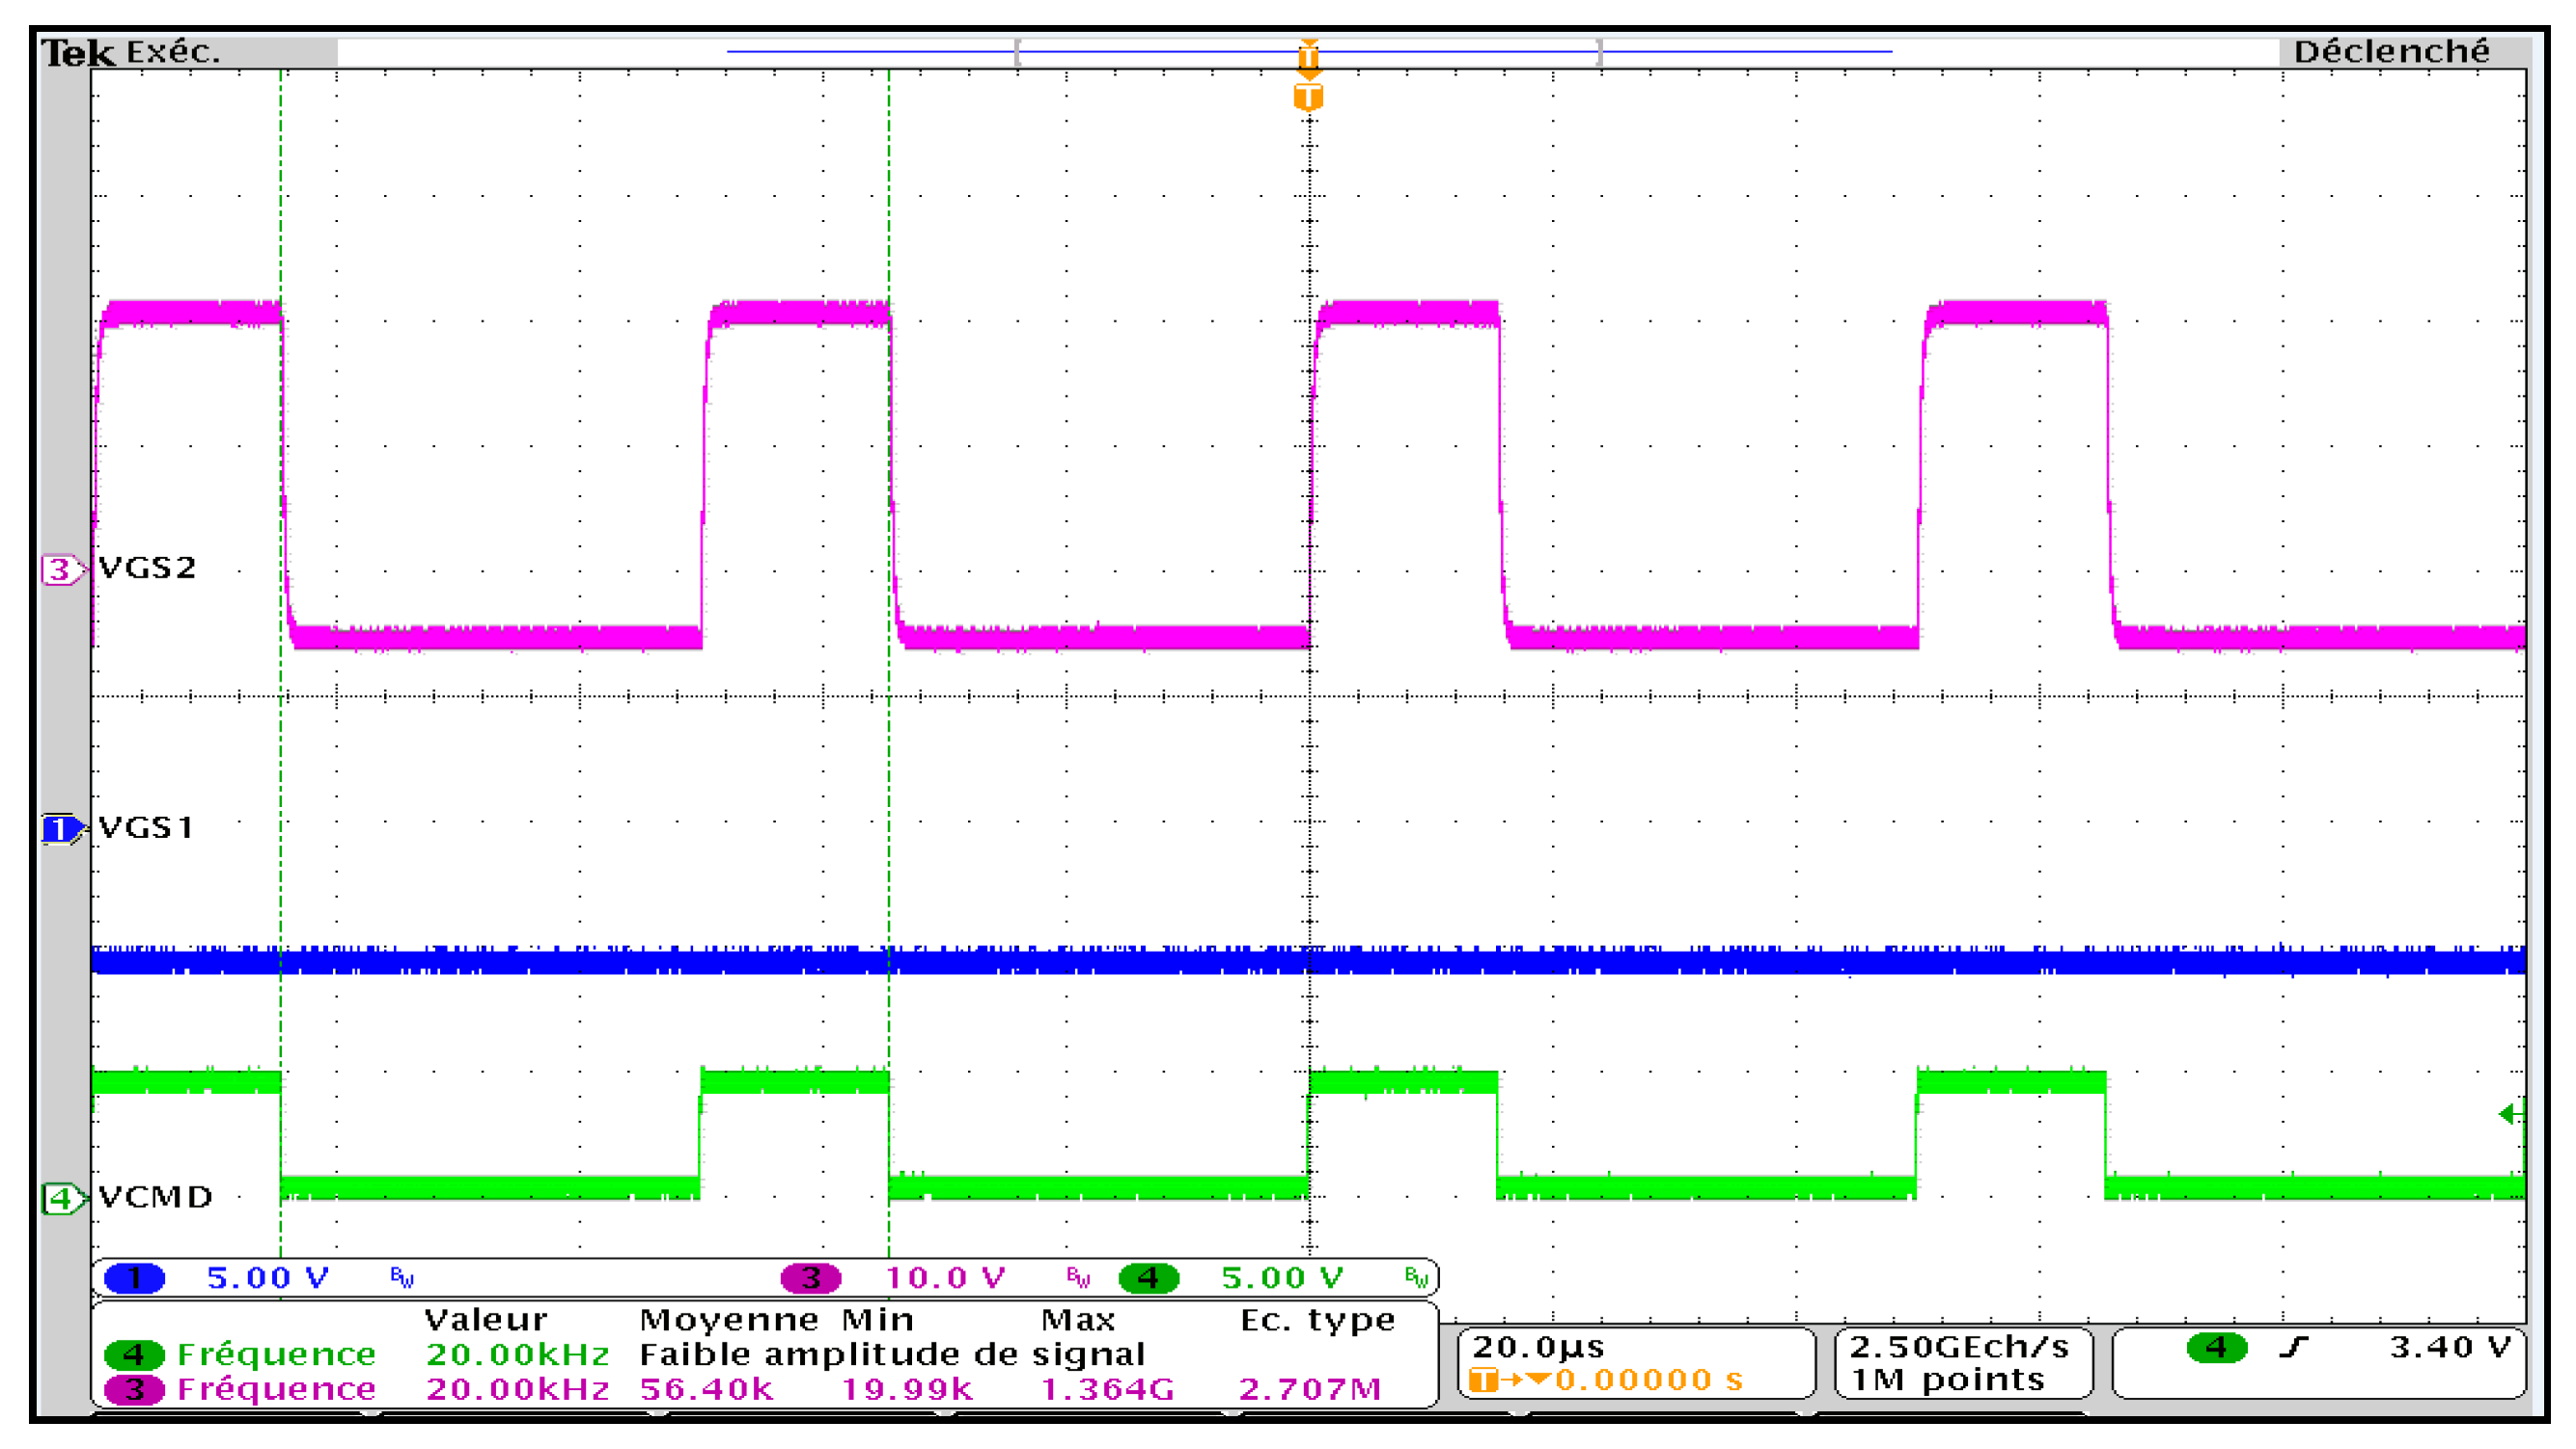
Figure 13.
SiC module CAS325M12HM2 (left)—Double-pulse test setup scheme (right).
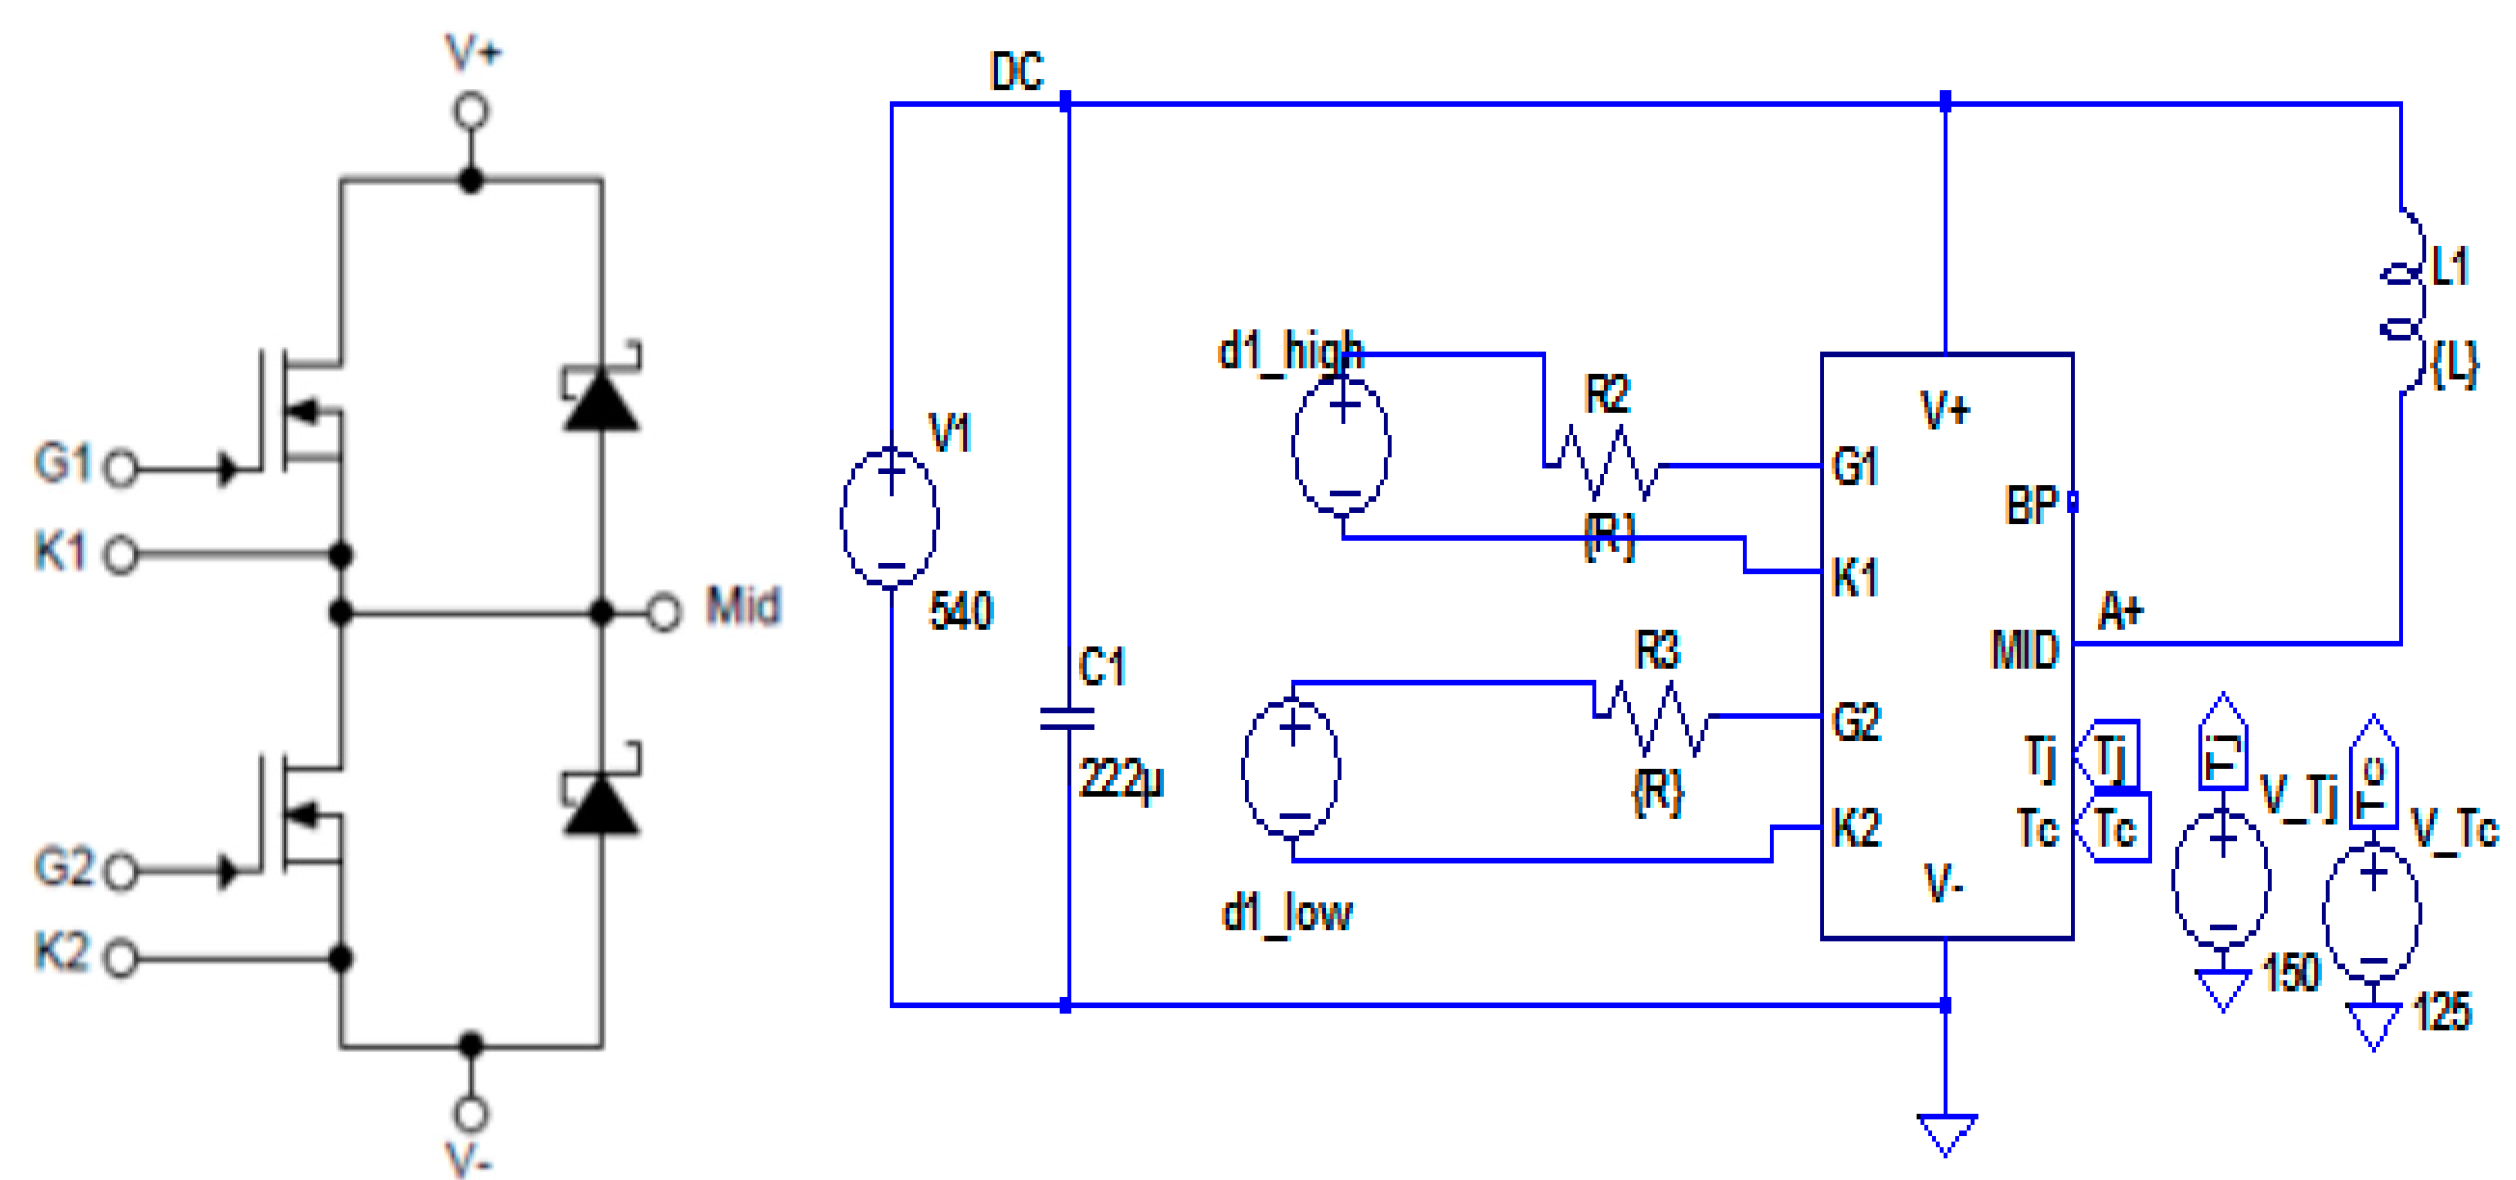
Figure 14.
Turn-on characteristics (VDS (blue); ID (purple); P (red)).

Figure 15.
Turn-off characteristics (VDS (blue); ID (purple); P (red)).

Figure 16.
Fischer LAV10 cooling aggregate.

Figure 17.
Temperature convergence.

Figure 18.
(a) Steady-state temperature distribution; (b) Enclosure temperature.


Figure 19.
Transient time plot.

Figure 20.
Temperature map at t = 0 s.

Figure 21.
Temperature map at t = 60 s.

Figure 22.
Temperature map at t = 120 s.
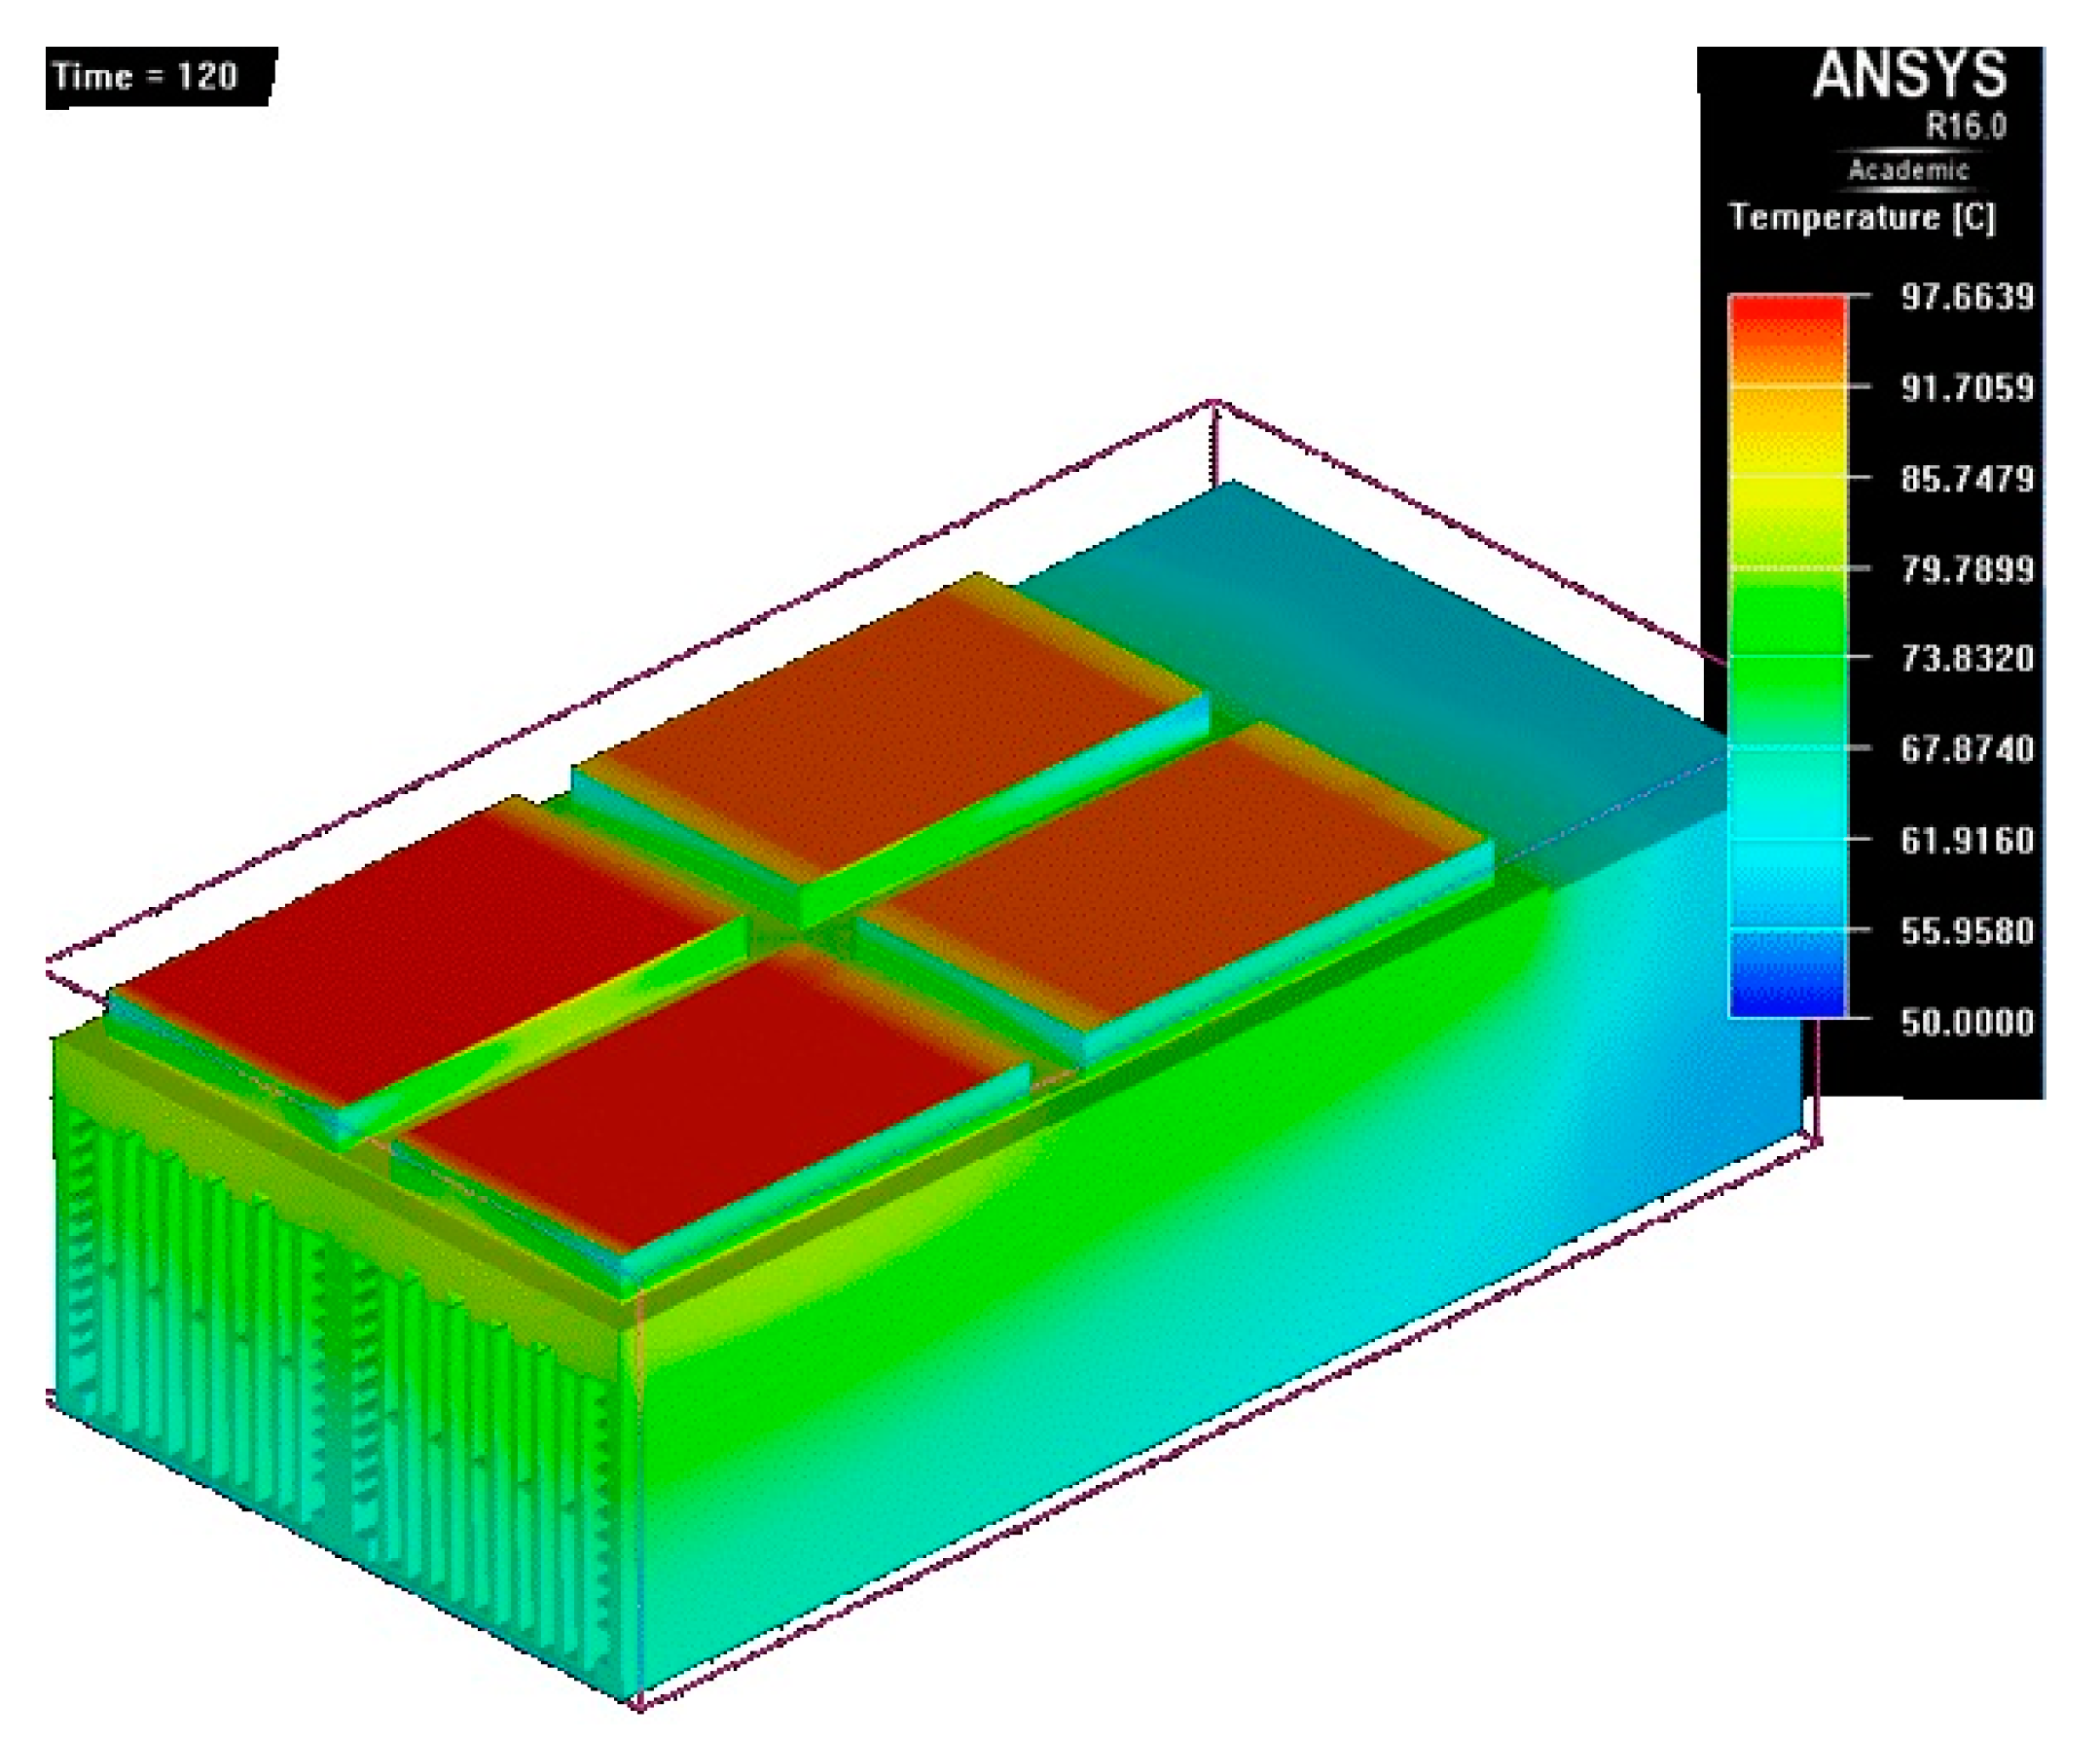
Figure 23.
Temperature map at t = 180 s.

Figure 24.
Temperature map at t = 240 s.
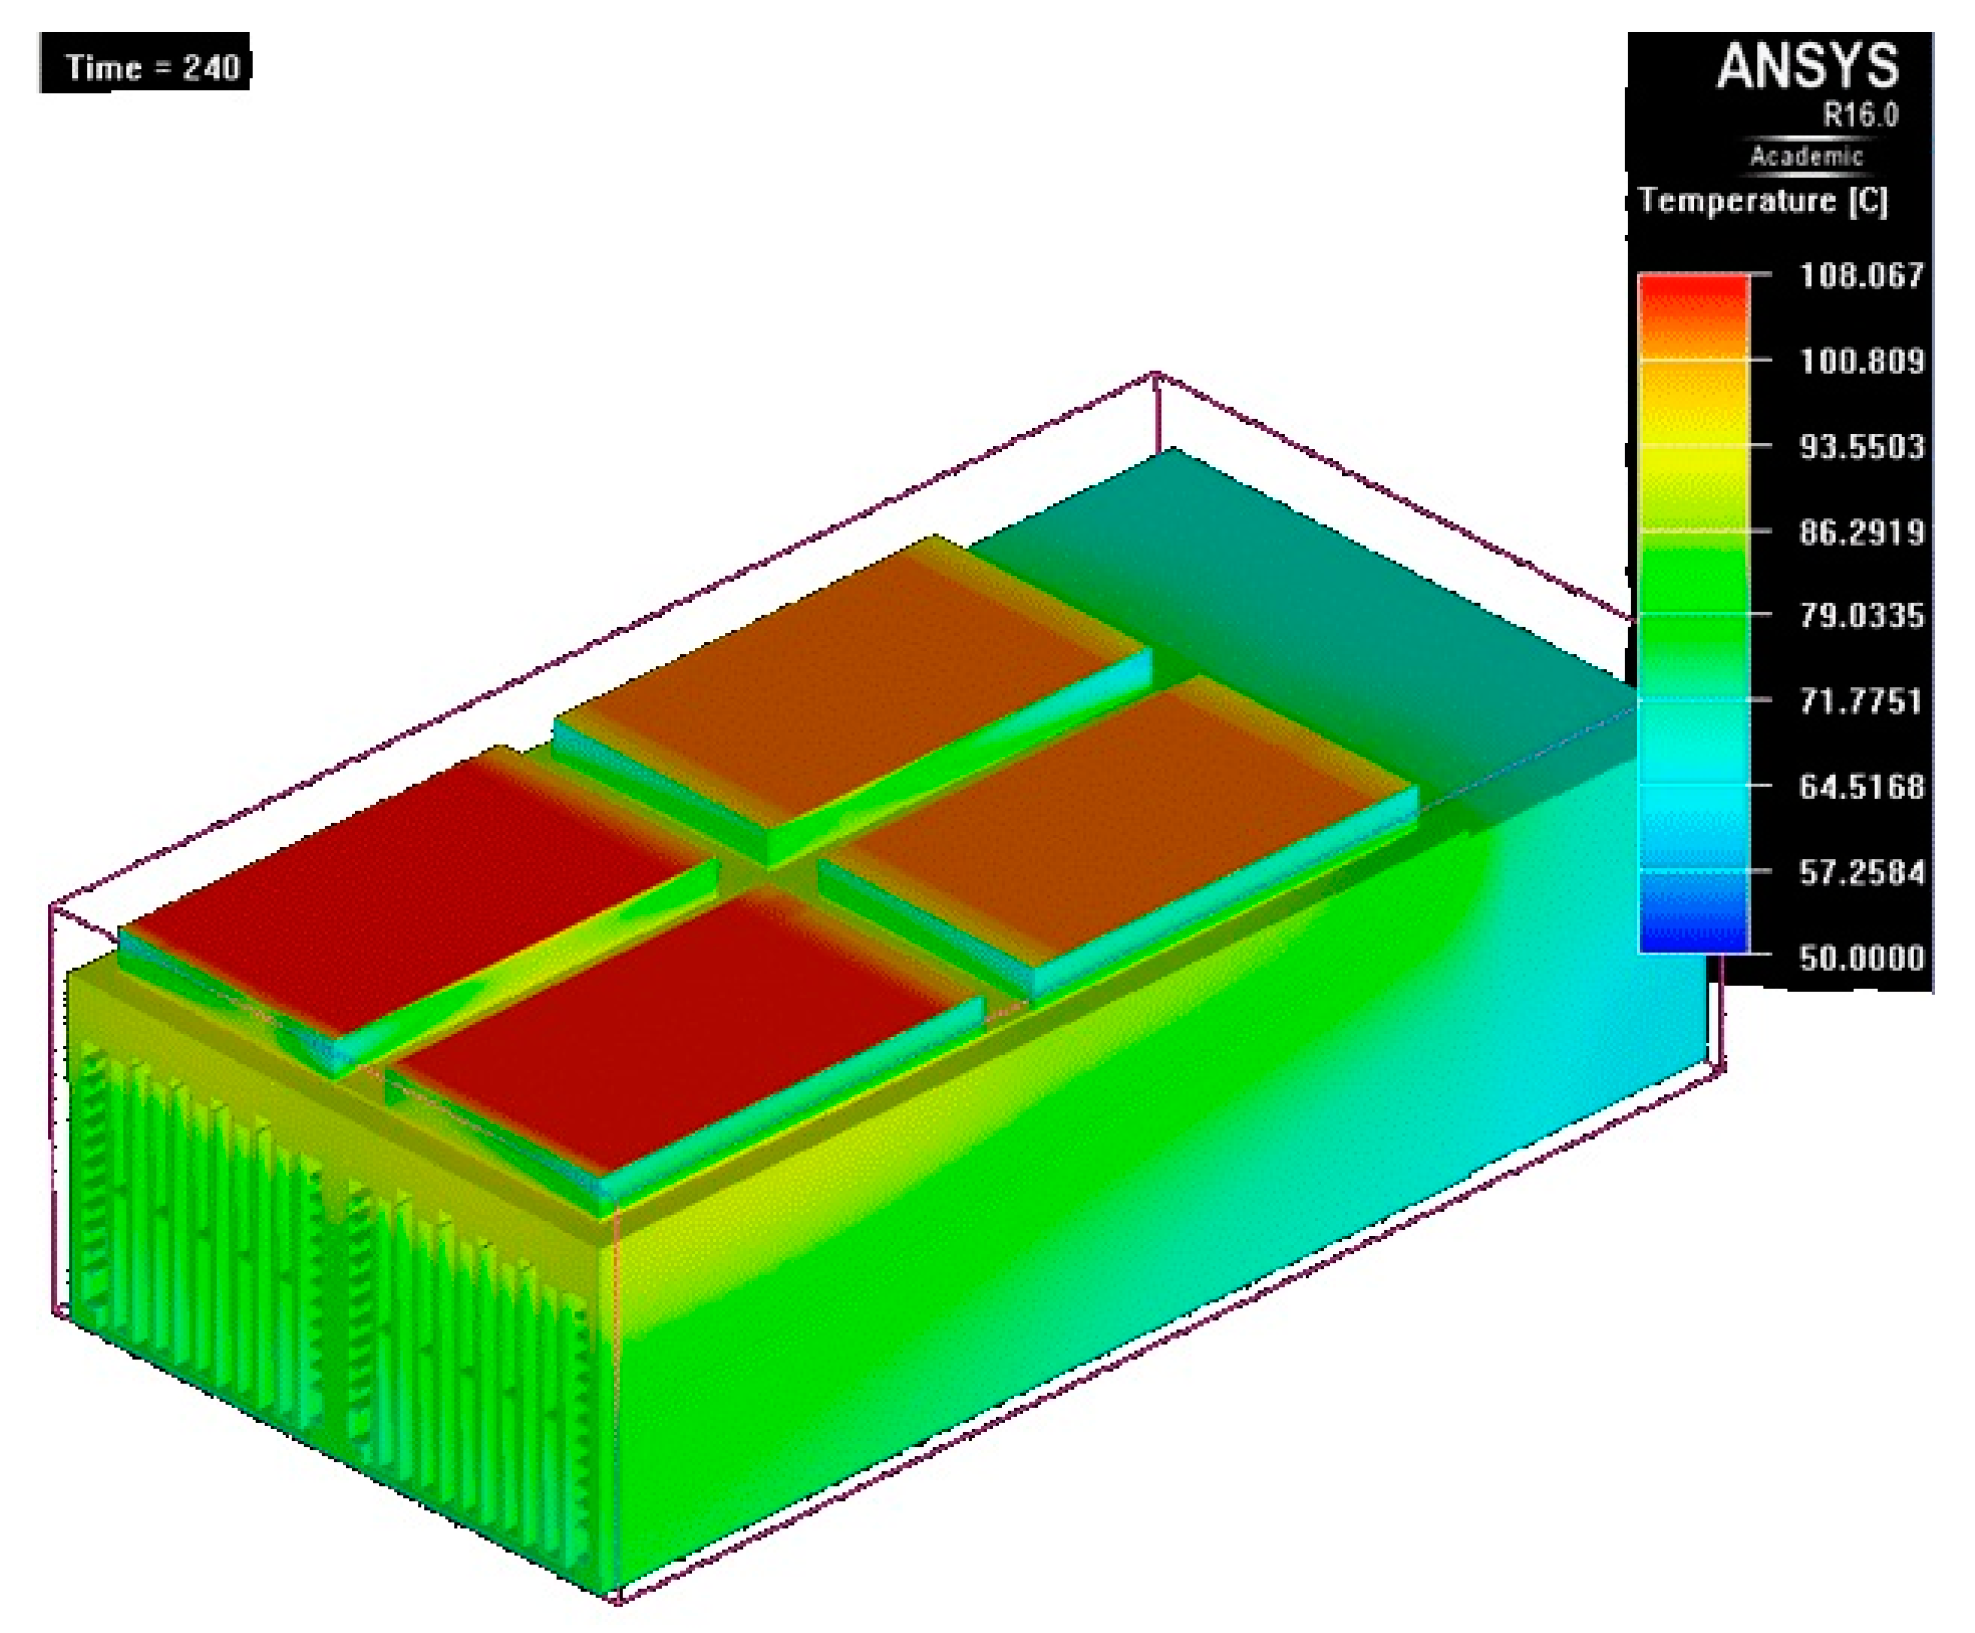
Figure 25.
Temperature map at t = 290 s.

Figure 26.
Temperature map at t = 292 s.

Figure 27.
Temperature map at t = 295 s.

Figure 28.
Temperature map at t = 298 s.

Figure 29.
Gate-to-Source voltages (VGS) from Simulink.
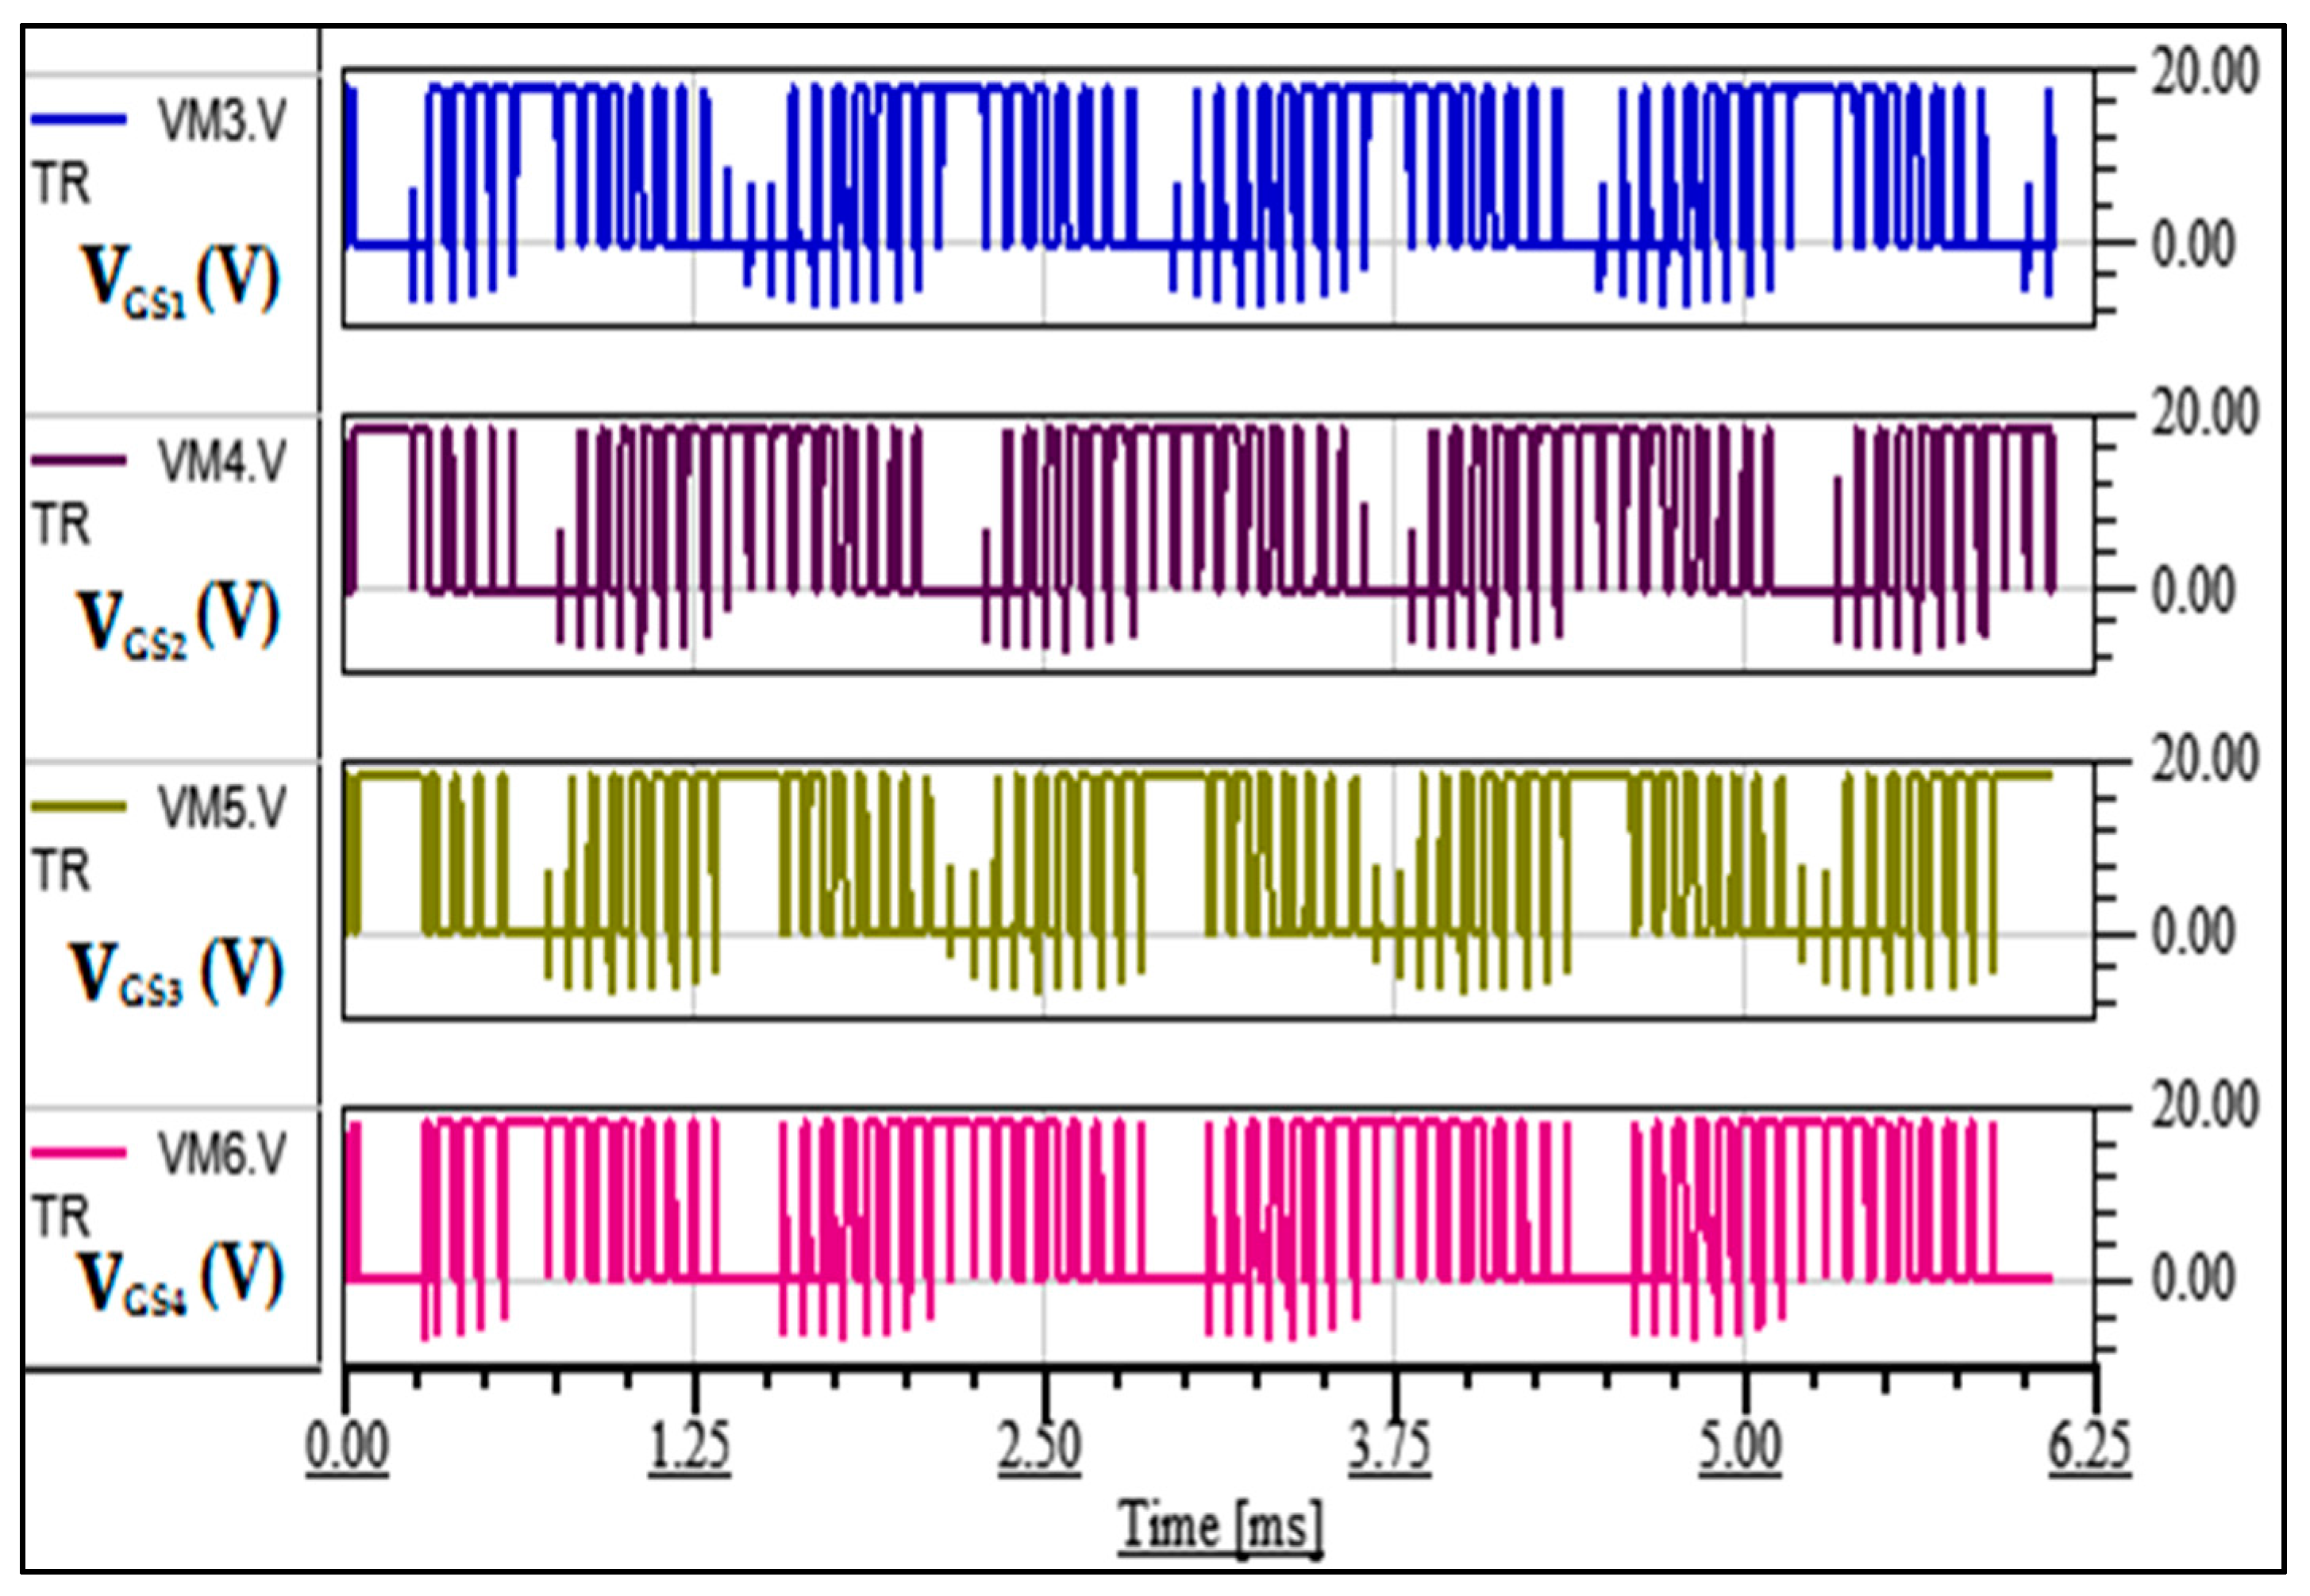
Figure 30.
Back-electromotive force (BEMF) voltage and the phase output current.

Figure 31.
Motor speed (rpm), Phase current (A) and Torque (Nm).

Figure 32.
Output voltage from LTspice® to Simulink.

Figure 33.
Input current, input voltage, input power, output power.

Table 1.
Switching Energy losses at 540 VDC, VGS = −5/20 V and 100 A.
| Test Conditions | Turn on Losses (mJ) | Turn off Losses (mJ) | Total Energy Losses (mJ) |
|---|---|---|---|
| 25 °C | 4.3 | 1.9 | 6.2 |
| 100 °C | 5.3 | 2.6 | 7.9 |
| 125 °C | 5.6 | 3.7 | 9.3 |
| 150 °C | 5.8 | 3.1 | 8.9 |
© 2017 by the authors. Licensee MDPI, Basel, Switzerland. This article is an open access article distributed under the terms and conditions of the Creative Commons Attribution (CC BY) license (http://creativecommons.org/licenses/by/4.0/).
Share and Cite
MDPI and ACS Style
Onambele, C.; Elsied, M.; Mpanda Mabwe, A.; El Hajjaji, A. Multi-Phase Modular Drive System: A Case Study in Electrical Aircraft Applications. Energies 2018, 11, 5. https://doi.org/10.3390/en11010005
AMA Style
Onambele C, Elsied M, Mpanda Mabwe A, El Hajjaji A. Multi-Phase Modular Drive System: A Case Study in Electrical Aircraft Applications. Energies. 2018; 11(1):5. https://doi.org/10.3390/en11010005
Chicago/Turabian StyleOnambele, Charles, Moataz Elsied, Augustin Mpanda Mabwe, and Ahmed El Hajjaji. 2018. "Multi-Phase Modular Drive System: A Case Study in Electrical Aircraft Applications" Energies 11, no. 1: 5. https://doi.org/10.3390/en11010005
Note that from the first issue of 2016, this journal uses article numbers instead of page numbers. See further details here.