Battery Dimensioning and Life Cycle Costs Analysis for a Heavy-Duty Truck Considering the Requirements of Long-Haul Transportation


1
Electrochemical Energy Conversion and Storage Systems Group, Institute for Power Electronics and Electrical Drives (ISEA), RWTH Aachen University, Jaegerstr. 17/19, 52066 Aachen, Germany
2
Juelich Aachen Research Alliance, JARA-Energy, 52425 Juelich, Germany
3
Institute for Power Generation and Storage Systems (PGS), E.ON Energy Research Center, RWTH Aachen University, Mathieustr. 10, 52074 Aachen, Germany
*
Author to whom correspondence should be addressed.
Energies 2018, 11(1), 55; https://doi.org/10.3390/en11010055
Submission received: 15 November 2017
/
Revised: 22 December 2017
/
Accepted: 23 December 2017
/
Published: 28 December 2017
(This article belongs to the Section I: Energy Fundamentals and Conversion)
Abstract
:The use of heavy-duty battery electric trucks for long-haul transportation is challenging because of the required high energy amounts and thus the high capacity of traction batteries. Furthermore a high capacity battery implies high initial costs for the electric vehicle. This study investigates the required battery capacity for battery electric trucks considering the requirements of long-haul transportation in Germany and compares the life cycle costs of battery electric trucks and conventional diesel trucks in different transportation scenarios. The average consumption is simulated for different battery electric truck configurations on the main German highways and transportation scenarios incorporating battery charging during driver rest periods. The results show that in average case the required battery would restrict the payload to only 80% of a usual diesel truck payload that might be acceptable considering the statistical payload use. The life cycle costs in the examined scenarios also considering the charging infrastructure show that battery electric trucks can already perform on the same costs level as diesel trucks in certain scenarios.
1. Introduction
The road freight transportation achieved a transportation share of 72% and produced 93% of the carbon dioxide emissions from surface freight transport in Germany in the year 2010 [1]. In contrast to passenger cars, the carbon dioxide emissions from the road freight transport increased from 1999 to 2011 by approx. 15% [1]. To achieve the climate goals of reducing the greenhouse gas emissions it is necessary to also investigate sustainable drivetrains for heavy-duty trucks in long-haul transportation. The battery electric trucks include an electric drivetrain with a traction battery as the energy source. One of the main challenges of this drivetrain, especially concerning the transportation of heavy goods for long distances, is the range limitation of the traction battery as it has a significantly lower energy density compared to fuel. Overcoming this limitation requires a complementary combination of a properly dimensioned traction battery and charging infrastructure. Nevertheless the overall efficiency of the battery electric drivetrain is high compared to diesel drivetrains and fuel cell electric drivetrains [2].
Many studies investigating alternative drivetrains for trucks focus on diesel hybrid trucks [3], natural gas trucks [3,4], fuel cell hybrid trucks [4,5], catenary or inductive grid-integrated trucks [4,5] and alternative fuels [6]. In [4,5] the use of battery electric trucks for long-distances is considered as not possible because of the high energy requirements and the assumed daily ranges that would necessitate a very heavy battery and restrict the payload [4]. Instead the battery electric trucks are only considered as a solution for local distribution trucks because of their lower daily range [5]. In [6] the battery electric trucks do not appear as a viable option for long-haul transportation due to the low energy density of batteries.
However the energy densities of lithium batteries have doubled from 1990 to 2010 [7] and their prices have decreased to only 20% compared with a decade ago [8,9] making lithium batteries more attractive for use in electric vehicles. Thus, some manufacturers like Tesla and Maschinenfabrik Augsburg-Nürnberg (MAN) are developing battery electric semi-trailer trucks. While MAN’s semi-trailer truck [10] is designed for delivery applications, Tesla plans to produce a class 8 truck for long-haul transportation [11]. The studies [12,13] also consider the battery electric heavy-duty trucks and assume battery capacities of 270 kWh and 400 kWh. The battery electric trucks are compared to conventional and other alternative heavy-duty trucks in terms of their life cycle costs and emissions in [12] and in terms of the fuel economy in [13]. As the battery is an important part of the battery electric truck, affecting i.e., the energy consumption, payload and life cycle costs, it requires a more detailed investigation on the dimensioning of battery capacity and the corresponding charging infrastructure for real-world operation scenarios.
This work expands the scope of the studies mentioned above to the detailed analysis of the requirements in long-haul transportation creating realistic long-haul transportation scenarios for the case of Germany and includes the dimensioning and costs analysis of the charging infrastructure.
In this study a vehicle simulation model for the battery electric truck is developed, parameterized and used to simulate the energy consumption for the created transportation scenario and thus to calculate the required battery capacity and charging infrastructure. Furthermore the integration of the battery into the truck is considered in terms of payload restrictions and compared to statistical requirements. Based on this analysis the life cycle costs of battery electric trucks including charging infrastructure are assessed for the chosen transportation scenarios. As the traction battery is an important part of vehicle costs an aging model is included to calculate battery lifetime depending on the transportation scenario. Finally the results are compared to a conventional heavy-duty truck simulated in the same transportation scenario as the battery electric truck.
2. Materials and Methods
2.1. Requirements and Restrictions of Long-Haul Transportation
On German highways the long-haul freight transportation is mostly provided by semi-trailer trucks with a total weight of up to 40 t including the load weight [14]. In general driving distances over 150 km are considered as long-haul transportation. Figure 1 shows the number of long-haul trips for different distances within German inland freight transportation for years 2013 and 2014.
The trips cover a variety of distance levels, but about 69% of trips in 2014 have a distance of below 350 km. Assuming an average trip speed of 80 km/h truck drivers can drive these trips without a rest period. A rest period of at least 45 min is compulsory after 4.5 h driving according to the EU legislative regulation [17]. The rest period can also be split into two rest periods of 15 min and 30 min and the shorter rest period can be shifted within the 4.5 h driving sequence. Subsequently to the longer rest period of 30 min or 45 min, the driver is allowed to drive an additional 4.5 h sequence. Afterwards the daily driving time maximum is reached and the nightly rest period follows. This driving time pattern is used in this study to define the transportation scenarios described in Section 2.5. However, the German trucks account for only 20% of transportation performance within the transnational goods transport [18] where long-haul routes are common. Hence foreign trucks also have to be considered, as done in this study to set the number of parking trucks when dimensioning the charging infrastructure in Section 3.3.
According to the German road traffic licensing regulations [19] the gross vehicle weight of a semi-trailer truck can reach up to 40 t, depending on the number of axles. For freight transportation not only the load’s weight but also the volume is important. In practice the trucks often do not completely use all the available payload because their load reaches the maximum available volume. Figure 2 illustrates this relation based on the statistical data from [16]. Generally a higher volume usage corresponds to a higher payload usage. However the trucks loaded to a volume of over 90% only use about 70% of their payload on average. In this case it can be assumed that the load is limited by the available space so the payload is not completely utilized. This payload surplus can be used to integrate a high capacity traction battery as discussed in the Section 3.2.
To recharge the traction batteries during a driver rest period the rest facilities on highways require charging stations. The required number of charging stations corresponds to the number of trucks parking at the rest facilities. While during daytime only a few trucks are parked, during the night the parking capacities of rest facilities are well used. In [20] the number of parked trucks at night-time at over 2113 rest facilities along German highways was investigated. In average of ca. 33.4 trucks per facility were parked for the night rest period. On the other hand during the day only a few trucks use the rest facilities. According to the statistics [21] it can be assumed that at most 17% or 5.6 trucks park during the day on a highway rest facility. This data is used to dimension the charging infrastructure for the battery electric trucks in Section 3.3.
2.2. Modeling of Battery Electric Truck
In order to estimate the energy consumption and to dimension the battery capacity a detailed simulation model of a battery electric truck was created. The model implementation in Matlab/Simulink R2015b (Natick, MA, USA) shown in Figure 3 consists of a route model, driver model, driving resistances model, drivetrain model and battery model. Furthermore a graphical user interface was developed to parameterize the model and to analyze the simulation results.
First the route model imports a route profile that consists of GPS coordinates and elevation data as well as additional information that can be maximum driving speed, position of resting facilities, duration of rest periods and charging stations. Depending on the actual vehicle position the route defined signals are provided from route model to the following blocks. These signals are reference speed, slope, position, maximum charging station power and brake signal if a resting facility is reached or the reference speed is exceeded.
The driver model provides the set acceleration to meet the reference speed by accelerating or decelerating the vehicle. Provided the set acceleration, the slope and the actual velocity, the vehicle model calculates the set power Pdrive, set to overcome the driving resistance that is the sum of air resistance, rolling resistance, slope resistance and acceleration resistance. The power Pdrive, set is calculated according to the equations:
where vact is the actual velocity of the vehicle. The air drag resistance force Fair is calculated using the air drag coefficient cw, the reference front area A of the vehicle and the mass density ρair of the air according to the equation:
The rolling resistance force Froll is calculated according to the formula:
where g is the gravitational acceleration, mgross is the gross vehicle weight including the load, croll is the rolling resistance coefficient and α is the gradient angle. The slope resistance force Fslope is calculated according to:
The acceleration force Facceleration is calculated using the acceleration aset and the sum of translational and rotatory contributions:
For the rotatory contribution to the acceleration force the mass of wheels mwheels and their dynamic radius rwheel as well as the rotating parts of motor and shaft JASM and the gear ratio igear are considered.
The drivetrain model contains two different drivetrain types: an electric drivetrain to simulate a battery electric truck and a diesel drivetrain to simulate a conventional diesel truck. The electric drivetrain for the battery truck consists of battery, converter, electric machine and gearbox. The resulting power transfer equation for the electric drivetrain is:
where ηgearbox is the efficiency of the gearbox, ηmot&conv is the efficiency of motor and converter and Pel, set is the set power for the battery to deliver.
The battery model calculates the power Pel, act that the battery can deliver depending i.e., on the parameters of the modeled cell, state of charge (SOC), temperature and actual state of health. The electric input and output of the traction battery is scaled to the model of a single cell (see Section 2.3). This provides a detailed simulation of the battery calculating the voltage, current, SOC and temperature profiles for the simulated route that are used by the cell aging model after the driving simulation.
The conventional diesel drivetrain consists of the models for diesel motor and gearbox. The corresponding power transfer equation for the diesel drivetrain is:
where Pdiesel, set is the set power for diesel motor to deliver.
After the actually deliverable battery power Pel, act or diesel motor power Pdiesel, act is calculated, the available power Pdrive, act to overcome the driving resistances and the actual speed vact are calculated (Figure 3) using the Equations (1)–(7) and replacing the set values by actual values.
2.3. Parameterization of the Truck Simulation Model
The truck simulation model was parameterized for a heavy-duty semi-trailer truck with a gross vehicle weight of up to 40 t. As the rolling and air frictions essentially influence the energy consumption of the long-haul vehicle [22], two truck configurations with different values for air and rolling drag coefficients are considered. Table 1 shows the main parameters of the truck configurations “low losses” and “average losses” that were used to simulate the battery truck as well as the diesel truck. The used values for air drag and rolling drag coefficients correspond to the low and average values in the range given in [23,24] for European semi-trailer truck.
The driver model contains the acceleration and deceleration strategy for a heavy-duty truck. The set acceleration varies depending on the actual velocity as shown in Figure 4. These values correspond to the acceleration of a 40 t diesel truck [22] and multiplied with a factor 0.7 as it is assumed that the vehicle doesn’t accelerate at full power at standard driving situation. The deceleration is assumed to be constant at 0.9 m/s2. The driver tries to meet the reference speed of the route by accelerating or decelerating the vehicle.
The electric machine and the according converter are implemented by the efficiency map depending on the shaft speed and torque of a three-phase permanent magnet electric motor [25]. As the nominal power of this motor is 188 kW, two motors were implemented in the simulation model to provide the suitable power of 376 kW for a heavy-duty truck. To get the required torque, a gearbox with transmission ratios depending on the vehicle speed was implemented. The efficiency of the gearbox is assumed to be constant 0.94 which is an average value according to values given in [26].
The used holistic cell model consists of the impedance based electric model, thermal model and aging model. It is parameterized for two cell types with data according to Table 2 [27,28]. The cells use the same chemistry but differ in their housing forms, nominal capacities and maximum current rates as well as maximum number of cycles and battery costs. The current rate is defined as the current divided by the nominal cell capacity and provides a measure to compare currents of cells with different capacities. The maximum number of full cycles in Table 2 is determined by the mathematical cell aging model described below at the ambient temperature of 15 °C and the current rate of 1 C until the end of life of the cell is reached which is usually defined by 20% capacity loss or by reaching the doubled internal resistance. The cycle number is determined and shown here to demonstrate the different lifetime capability of these cells and to assume the costs of batteries comprising the particular cell types. According to the actual battery prices [8] and considering the numbers of full cycles, the costs of the batteries are assumed and given in Table 2.
The electric cell model is described in detail in the study [28] and represents the impedance based electric cell model consisting of an equivalent electric network with a series resistance, two ZARC elements and an open circuit voltage source. It is connected with the cell thermal model which calculates the cell temperature based on ohmic losses and heat transfer resistance for different mounting conditions [28]. The cell aging model calculates the calendar and the cycle aging depending on the resulting cell voltage, current, temperature and state of charge and using the aging functions derived from the accelerated cell aging tests. The calendar and cycle aging are finally added to get the total cell aging [28]. The holistic cell aging model was verified with profiles for city and highway driving matching the measurements well for capacity loss that is limiting the cell lifetime [28].
For the conventional diesel drivetrain a diesel engine and a gearbox were implemented. The characteristic consumption curves of the diesel engine were scaled to fit the consumption values of a diesel motor with Euro VI emission standard for heavy-duty trucks [29]. The implemented gearbox for the diesel engine includes 12 gear ratios and its efficiency was assumed to be equal to that of battery electric truck.
2.4. Dimensioning of the Traction Battery Capacity
To get an average value for the energy demand the battery electric truck was simulated on the main German highways A1 to A9. The GPS data for routes on these highways were gained from web mapping services [30,31] and completed with altitude profile from Shuttle Radar Topography Mission [32]. Figure 5 exemplarily shows the elevation profiles of two highways located in different German regions. The highway A2 is located in a rather flat region in the north of Germany and the highway A8 is located in a hilly region in the south of Germany which is reflected by a more alternating elevation profile. As the highways A1, A4 and A8 are not continuous, connecting country roads were used. The maximum allowed highway speed was set to 85 km/h and the traffic is not considered, so the differences in consumption values mainly result from different highway topologies and truck configurations according to Table 1. The gross vehicle weight is set to 40 t not depending on the payload.
Figure 6 shows the simulated specific energy consumption for the truck configurations “low losses” and “average losses” according to Table 1. The specific consumption varies from 1.09 kWh/km on highway A2 in direction west for the truck configuration “low losses” to 2.04 kWh/km on highway A8 in direction west for the truck configuration “average losses”. The consumption is in average about 28% smaller for the truck configuration “low losses” that shows the importance of low air and rolling drag coefficients. A low air drag coefficient can be reached by using i.e., side claddings, wind tunnels and roof spoiler while a low rolling coefficient can be reduced by choosing energy saving tires and maintaining the air pressure inside the tires [23]. The average specific consumption calculated from all simulated trips results in 1.33 kWh/km for the truck configuration “low losses” and in 1.83 kWh/km for the truck configuration “average losses”.
According to the legislative conditions (Section 2.1) the maximum driving period of a truck is 4.5 h, so the battery should be able to cover the corresponding route length and afterwards the battery can be charged during the driver’s rest period, provided there is a charging station at the rest facility. Assuming an average speed of 80 km/h a truck can cover 360 km within one 4.5 h driving period. Taking the calculated specific average consumption on highways for the truck configurations “low losses” and “average losses”, the required energy amount for one driving period is 478.8 kWh and 658.8 kWh, respectively.
In general the end of life of a battery is defined by 20% capacity loss or by reaching a doubled internal resistance. To account for the battery aging 20% of required energy amount for one driving period are added. This reserve is also suitable for the common truck operation and for varying truck parameters depending, i.e., on tire wear, weather conditions and traffic. Finally, the average required traction battery capacity to cover one 4.5 h driving period on the highway results in ca. 600 kWh for the truck configuration “low losses” and in ca. 825 kWh for the truck configuration “average losses”.
For the high consumption route with 2.0 kWh/km the required energy amount for one driving period is about 720 kWh, respectively, and considering the 20% reserve the resulting traction battery capacity is 900 kWh.
The determined battery capacities are significantly higher than the values of 270 kWh and 400 kWh assumed in comparable studies [12,13] due to the specified driving period and routes. The determined capacity values are used for the simulation of the transport scenarios specified in the next section and the integration of the traction battery into the truck is analyzed in Section 3.2.
2.5. Definition of Transportation Scenarios
To calculate the life cycle costs of a battery electric truck and compare them to a diesel truck, two different transportation scenarios are considered. In the first transportation scenario a route with average consumption is considered while the second scenario considers a route with high consumption according to the results in the previous chapter.
Following legislative conditions (Section 2.1) a daily operation sequence of 4.5 h driving, 45 min rest period followed by the next 4.5 h driving period is assumed. The remaining daily time of 14 h 15 min is used for the rest period.
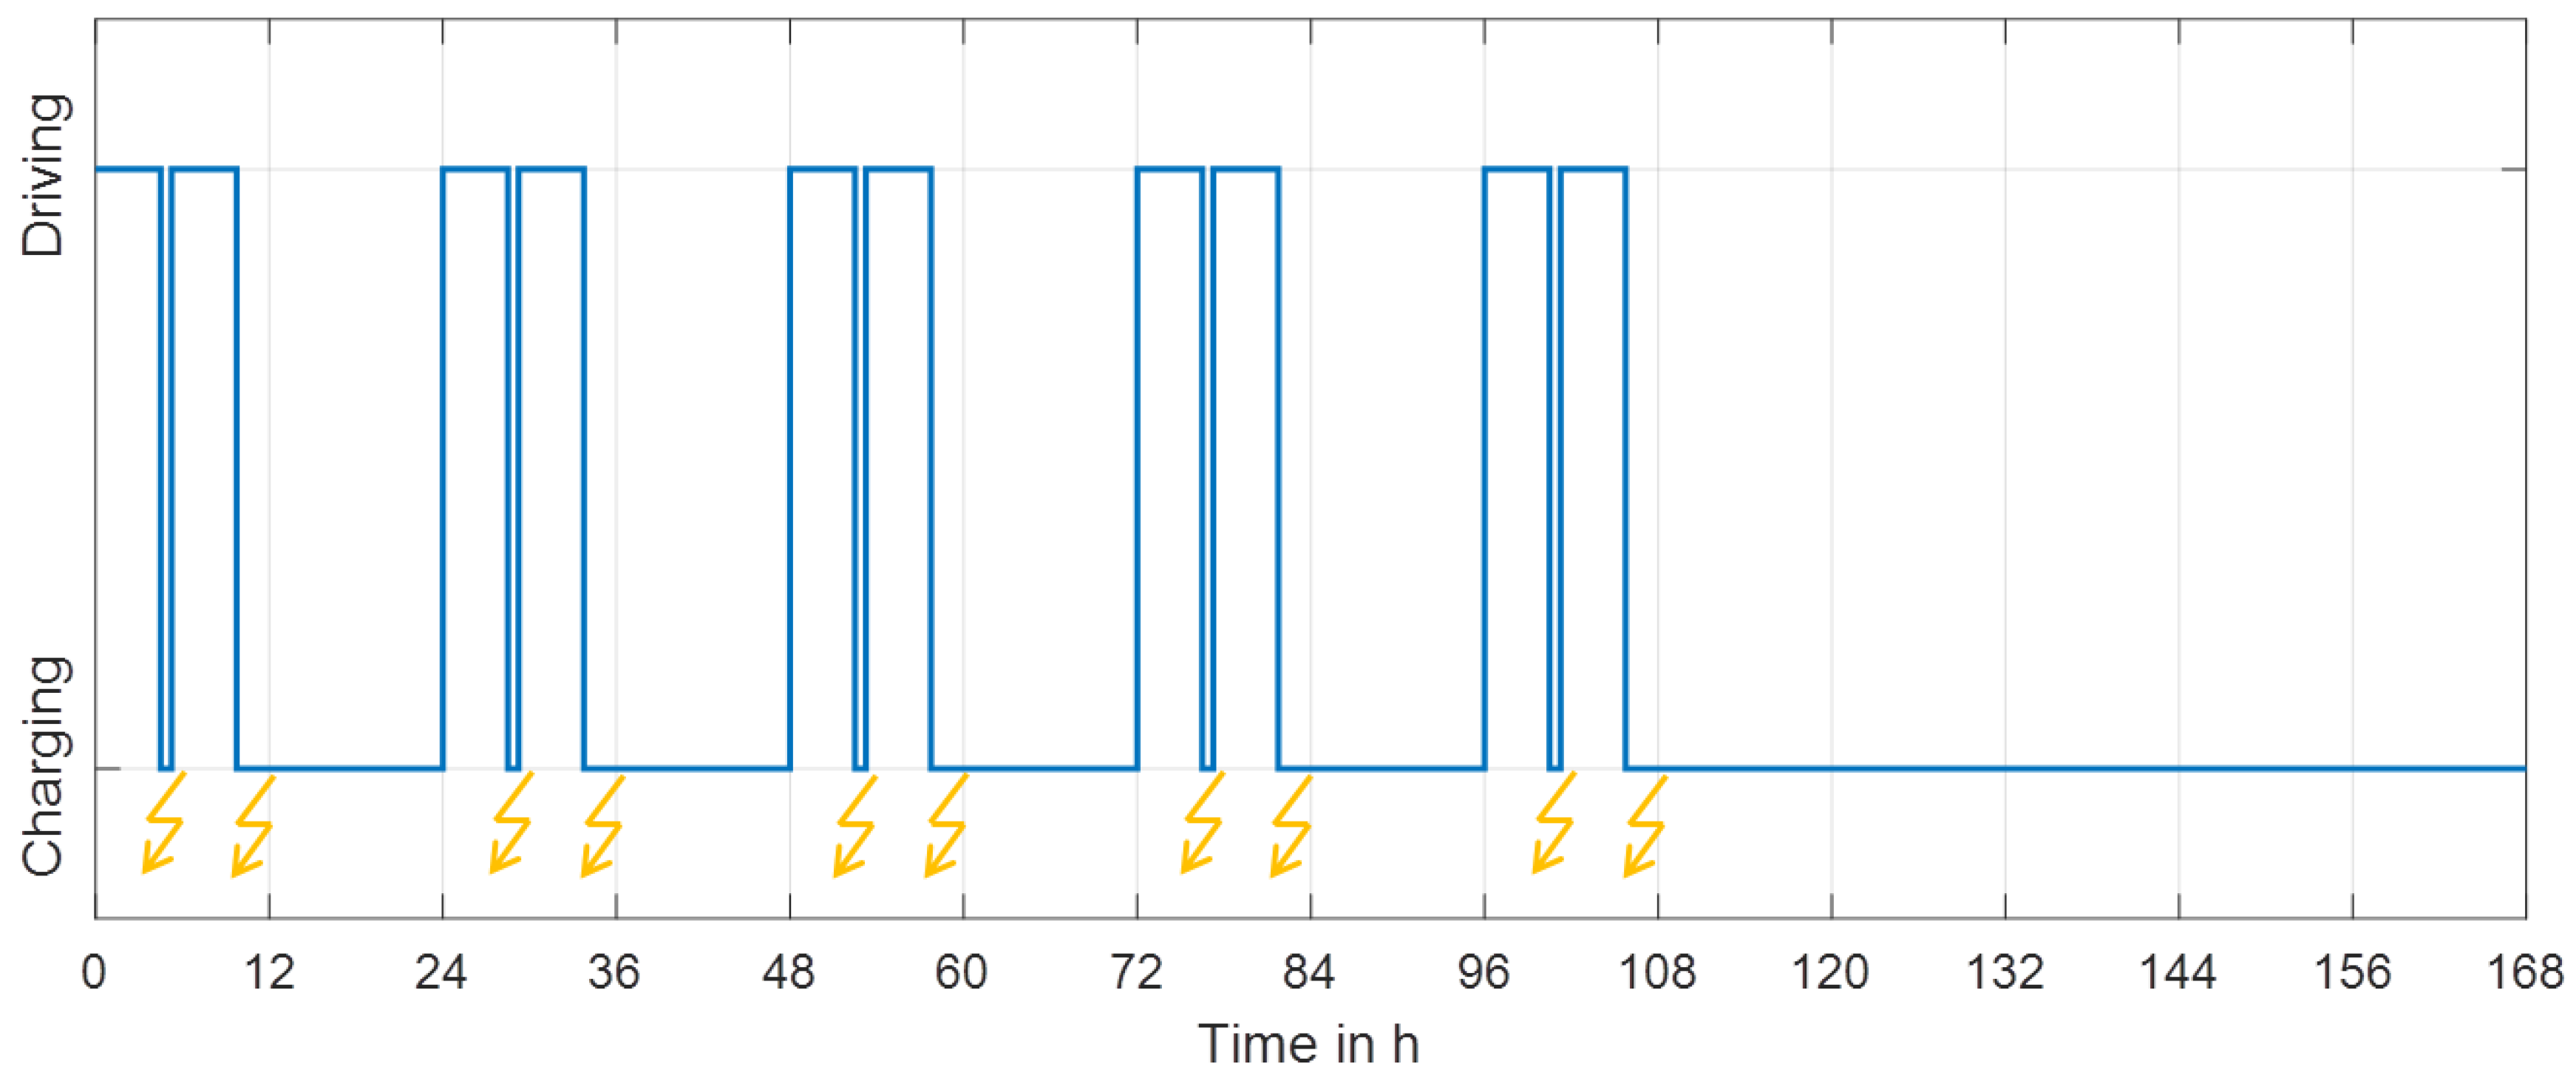
The 45 min rest period is used to fast charge the battery for the next driving period. The night rest period is used to charge the battery with low power, because of longer available time period. The slow charging at night would reduce the stress for the battery due to minor currents and minor temperature rise. The required charging power is calculated using the energy consumption on the route and the available charging time. The used charging method is charging with constant current and followed by charging with constant voltage (CC-CV). This method is used for the slow as well as for the fast charging to optimally use the driver’s rest period. The resulting daily driving sequence is shown in Figure 7. Furthermore it is assumed that the truck drives the same daily sequence 5 days per week and 52 weeks per year. The resulting weekly driving sequence is also shown in Figure 7.
For the daily driving sequence in the first transportation scenario a route with an average consumption is chosen. While for the second transportation scenario a route with high consumption was chosen. Table 3 lists the main characteristics of these routes as well as the assumed truck payload. The shown altitude profiles of the routes in Figure 8 as well as the underlying GPS data were gained from web mapping services [30,31] with altitude data provided from [32].
The described transportation scenarios are examined for the truck configurations shown in Table 1 with 17.5 t payload for the electric as well as for the diesel truck. The same payload for different truck types is assumed to account for different maximum payloads as the traction battery with high capacity may restrict the available payload. This corresponds to the average payload usage of 70% for long-haul trucks (Section 2.1).
2.6. Determination of Life Cycle Costs for Battery Electric Truck and Diesel Truck
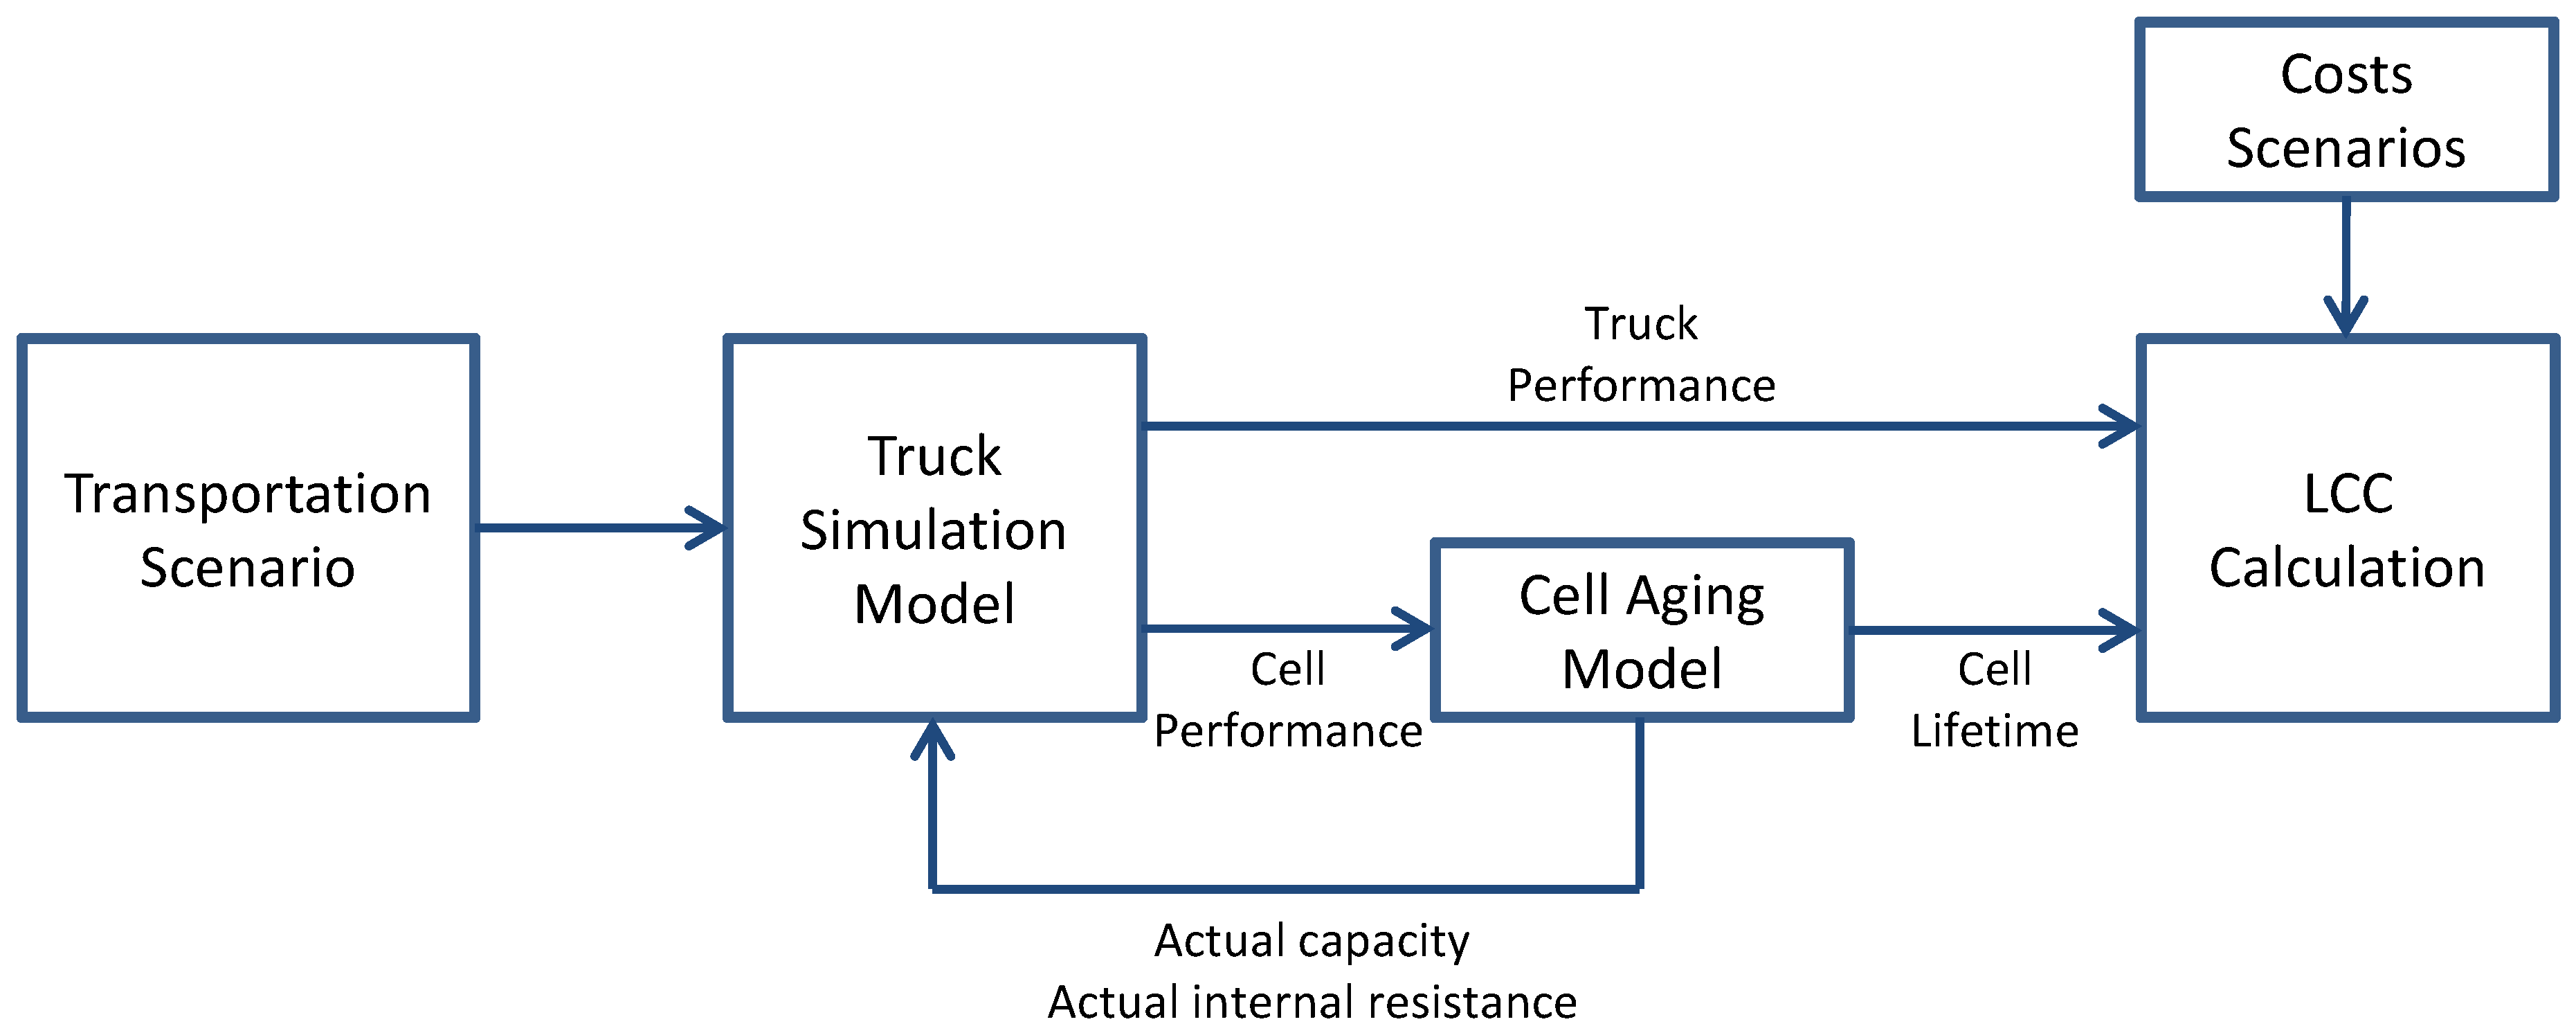
To compare the battery electric truck and the diesel truck the life cycle costs (LCC) of both technologies are determined for the described transportation scenarios. Figure 9 shows the data flow required for truck simulation and LCC calculation. The transportation scenarios containing the daily driving sequence and truck parameters are passed to the truck simulation model described in Section 2.2. The truck simulation model provides: (i) the truck performance data containing the resulting velocity, components power and energy or diesel consumption, and (ii) the cell performance data containing the voltage, current, temperature and SOC of a battery cell used in the simulation. After running one simulation in the specified transportation scenario, the cell performance data is passed to the cell aging model [28] and used to calculate the actual capacity and internal resistance of the cell. Both are calculated assuming an unaltered cell performance data for one year and then passed back to the truck simulation model to calculate the cell and truck performance for the next year. Finally after the cell reaches the end of life (80% of the initial capacity or a doubled internal resistance), LCC calculation is executed. It gets the truck and cell performance data as well as costs scenarios which are sets of cost parameters for the several components, energy, fuel, services and price developments.
Figure 10 gives an overview of cost components considered in this calculation. Initially the costs for the vehicle which consist of vehicle body, battery, motor and electric equipment like power electronics and charging coupling are paid. The electric energy or fuel consumption is gained from the truck simulation model for a weekly driving sequence and scaled for the truck lifetime. For battery electric trucks the infrastructure is considered in terms of charging stations on the resting areas. For diesel trucks no infrastructure costs are calculated but considered as included into the diesel price. The fixed costs include annual taxes and insurance fees. The variable costs include fees that are depending on mileage and consist of service fees and toll. Appendix A shows the main parameters for calculation of life cycle costs.
The LCC calculation is based on the net present value NPV that is calculated for all components. NPV provides the present value of future component costs Ct depending on the interest rate i and the residual value of the component RVT. The NPV is calculated using the formula:
where t is the current year and T is the scenario duration. To account for different component lifetimes the residual value RVT for truck components and charging infrastructure are calculated. The linear residual value progression is assumed according to the formula:
where C0 is the component cost at the beginning of scenario, Lrem, t is the remaining lifetime of the component, L0 is the total component lifetime and j is the inflation rate. The assumed inflation rate for the calculation is 1.39%/a and the assumed interest rate is 2.2%/a.
Finally Table 4 summarizes the scenario combinations considered for LCC calculation. The LCC are calculated for the maximum mileage of 1,000,000 km that usually is the lifetime mileage of a conventional diesel truck. The last LCC calculations 9 and 10 are carried out for the diesel truck to compare the different drivetrain technologies.
3. Results and Discussion
3.1. Transportation Scenarios
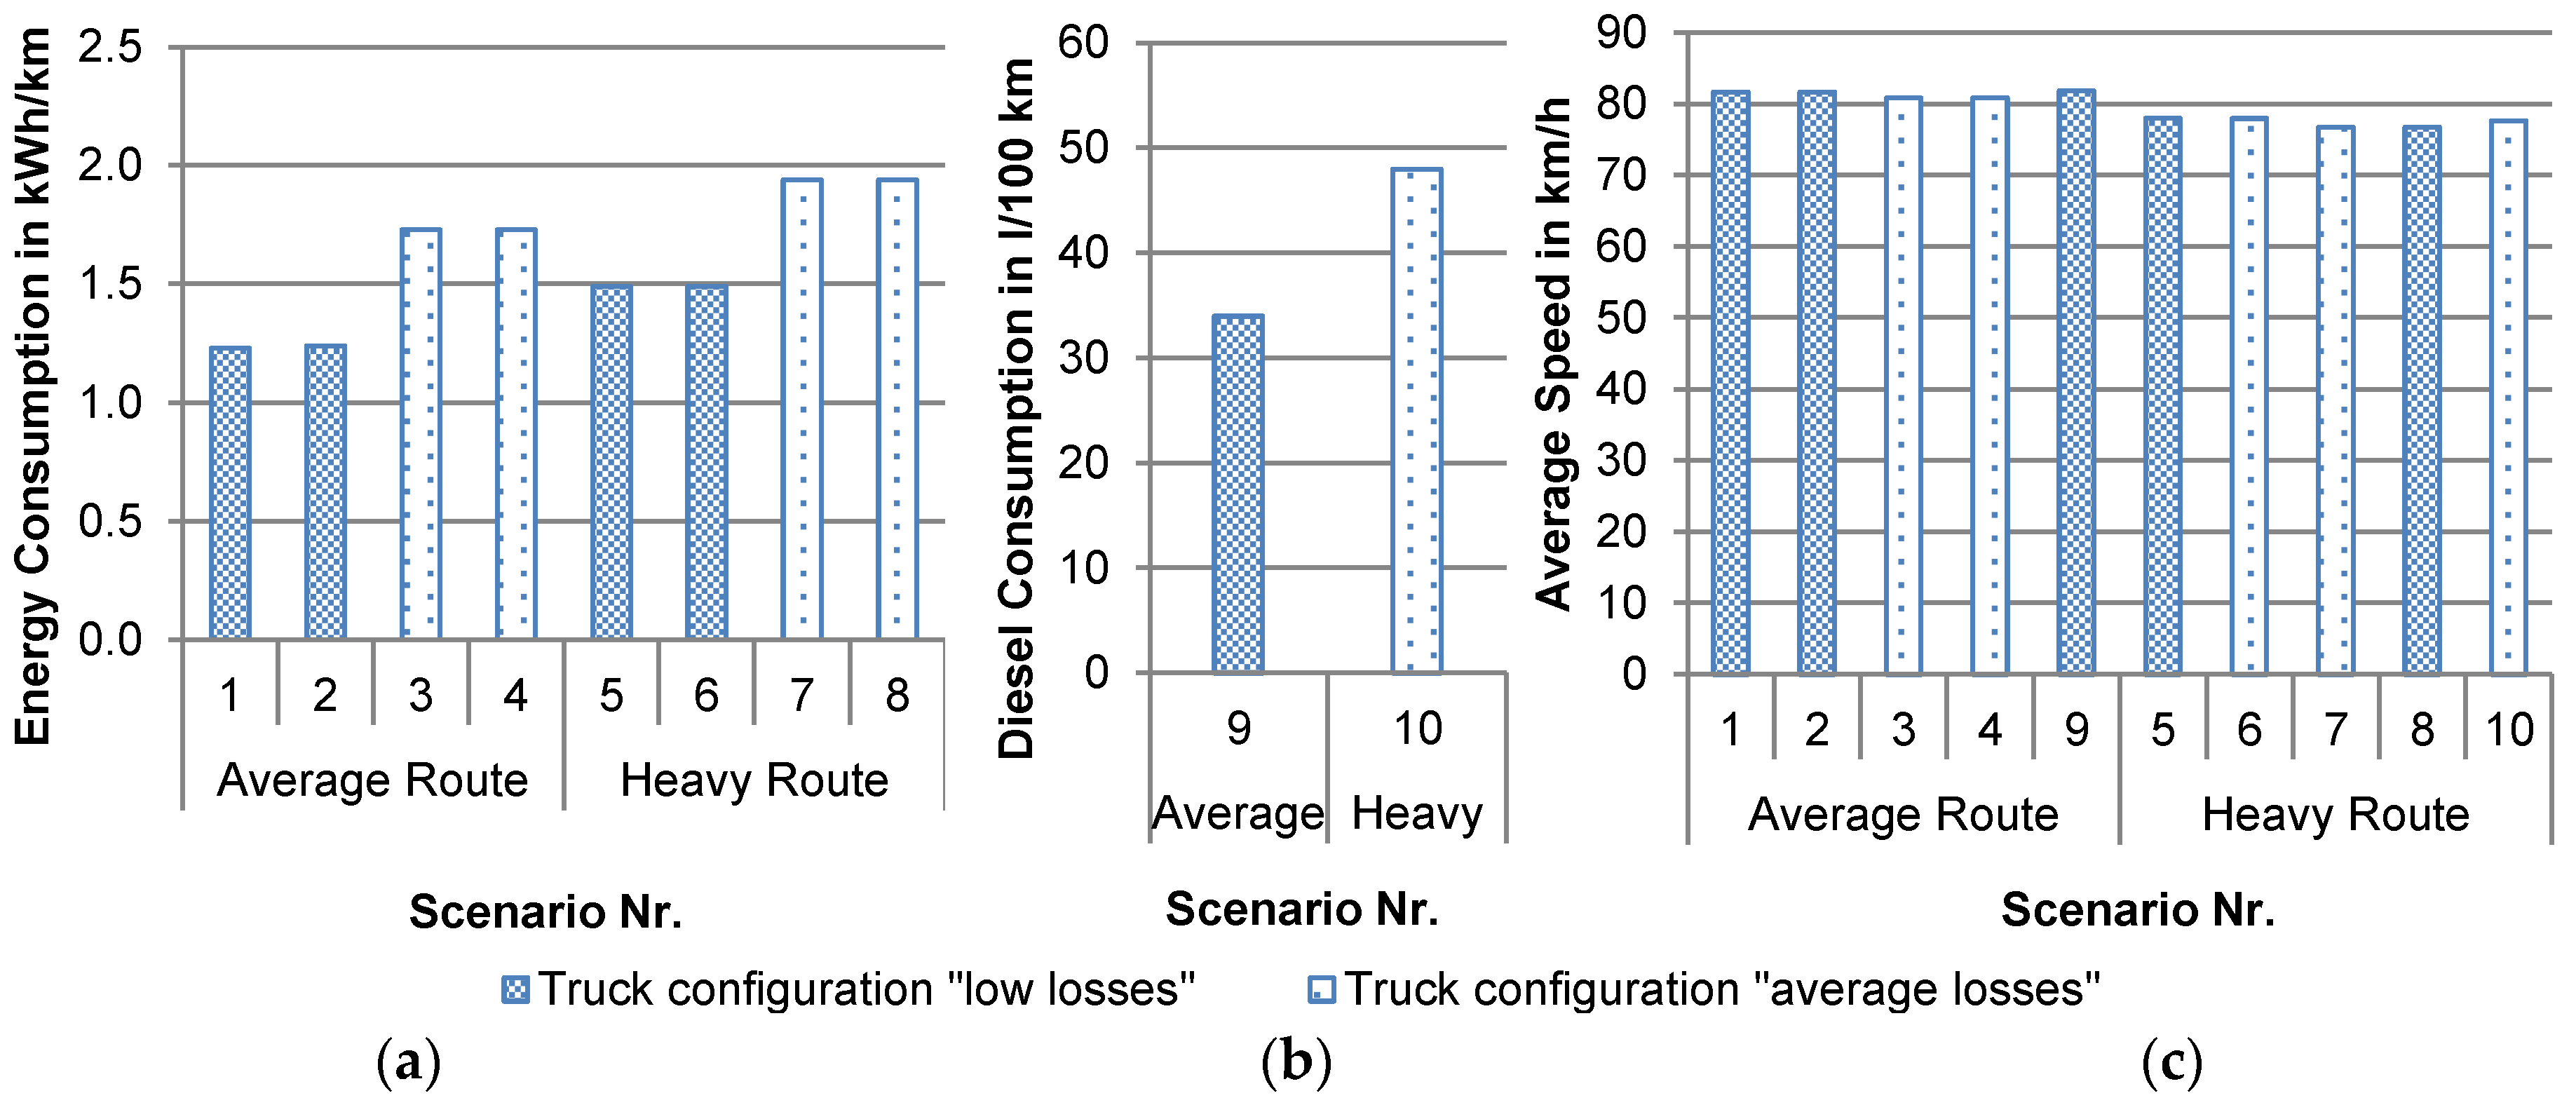
Transportation scenarios with the parameters according to Table 4 are evaluated using the simulation model described previously. The resulting energy and diesel consumption as well as the average speed are shown in Figure 11. Due to different transportation scenarios and truck configurations the energy consumption of battery electric truck varies between 1.23 kWh/km and 1.94 kWh/km. The consumption of the diesel truck varies between 34 L/100 km and 48 L/100 km. The variation in diesel consumption depending on truck and route parameters is lower because a large part of fuel energy (56% for a 40 t truck on a flat route [33]) is dissipated in diesel engine heat. Assuming the diesel energy density of 11.8 kWh/kg and the diesel density of 0.83 kg/L the equivalent energy consumption of a diesel truck is 3.33 kWh/km for the average route and 4.70 kWh/kg for the heavy route. These consumption values are about 2.5 times higher (depending on the particular scenario) than for the simulated battery electric trucks due to the higher drivetrain efficiency of battery electric trucks.
The average speed of the simulated trips also differs depending on the scenario. This is mainly caused by speed limits on the connecting country roads in the heavy route scenarios and by traction power limit of the electric machine or the diesel motor as the power requirements for the heavy route are higher than for the average route.
The shown energy consumptions are almost independent of the considered cells as the parametrized lithium ion cells are composed of identical anode and cathode materials and show similar round-trip efficiency in the simulations. However the resulting cell lifetimes are different, as shown later in Section 3.4.
Figure 12 shows the cell performance data for one daily driving sequence. The shown curves are from scenarios with the lowest and the highest energy consumptions. From the SOC curves it can be seen that the depth of discharges for both scenarios are approx. equal for the driving section before the 45 min rest period and afterwards the SOC of the high consumption Scenario 7 reaches lower values. However the SOC range in the Scenario 7 is between 90% and 20% leaving reserves for capacity decreasing due to battery aging and varying truck parameters in everyday operation. The SOC of the Scenario 1 reaches 100% during the 45 min rest period. Knowing the energy consumption for the next driving period, the SOC curve could be shifted to a less stressing range provided the fast charging terminates at the initial SOC of 90%.
Despite the high charging power of 880 kW for the average scenario (see Section 3.3) and 960 kW for the heavy scenario during the 45 min rest period, the maximum charging current rate for both cells is in the range of 1 C to 1.5 C. The current rates diagram in Figure 12 shows an excerpt from driving profile where the charging process during the 45 min rest period can be seen. Due to high battery capacity and thus high cell number the current rates on cell level are relatively small during charging and driving, so the maximum charging current is not exceeded and the initial SOC is reached after the charging process. For scenarios with Cell 2 the maximum charge current rate of 1 C is not exceeded, still providing sufficient energy for the next driving section. During driving, the maximum values of cell current rates in the high consumption simulation are lower because of the higher battery capacity. Because of low current on cell level also the temperature rise is limited to max. 12 °C above the start temperature assuming a passive cooling system for the cells to achieve higher energy density of the battery. This peak temperature is observed during the fast charging. During driving and slow charging there is no significant temperature rise, because the cell currents are smaller than during fast charging. The battery performance at low temperatures is still sufficient as the driving power demand is low compared to the maximum battery power. Fast charging is carried out during the rest period after a driving period so the battery temperature is sufficient to accept higher charging currents. The energy demand for the cabin heating of a heavy-duty truck is small compared to the driving energy demand so the battery dimensioning is almost not influenced, so the cell performance data shows that the stress on cell level is limited due to high capacity of the traction battery.
3.2. Integration of Traction Battery
The high capacity of the traction batteries required to cover the driving sequences in the simulated transportation scenarios, results in high battery weight and volume, so the integration of these batteries into the battery electric truck has to be considered to determine the available payload and space.
The weight of diesel traction components becoming obsolete in the battery electric truck (diesel engine, fuel tank, exhaust after treatment system, diesel exhaust fluid (DEF) tank) is assumed in this study to be approx. 1700 kg based on particular weight values from components data sheets [34,35,36]. The breakdown of the diesel truck weight in Figure 13 shows that vehicle body without the diesel drivetrain is the main weight component of the diesel truck. Assuming a battery energy density of 0.125 kWh/kg and 0.200 kWh/L as reported in the literature [2,12,37] and according to recent developments (i.e., the battery pack of Tesla Model S [38]), the weight and volume of the traction battery are calculated. Also the weights of further electric drivetrain components like electric motor including power electronics [25] and gearbox [39] are considered altogether as 450 kg. For the gearbox of the battery electric truck the same weight is assumed as for that of the diesel truck. The battery weights are calculated for the 600 kWh, 825 kWh and 900 kWh traction batteries that are determined in Section 2.4. Figure 13 shows that the traction battery becomes the second heaviest component of the truck. However the limitation of the maximum payload of the battery electric truck is at most 23% compared to the diesel truck.
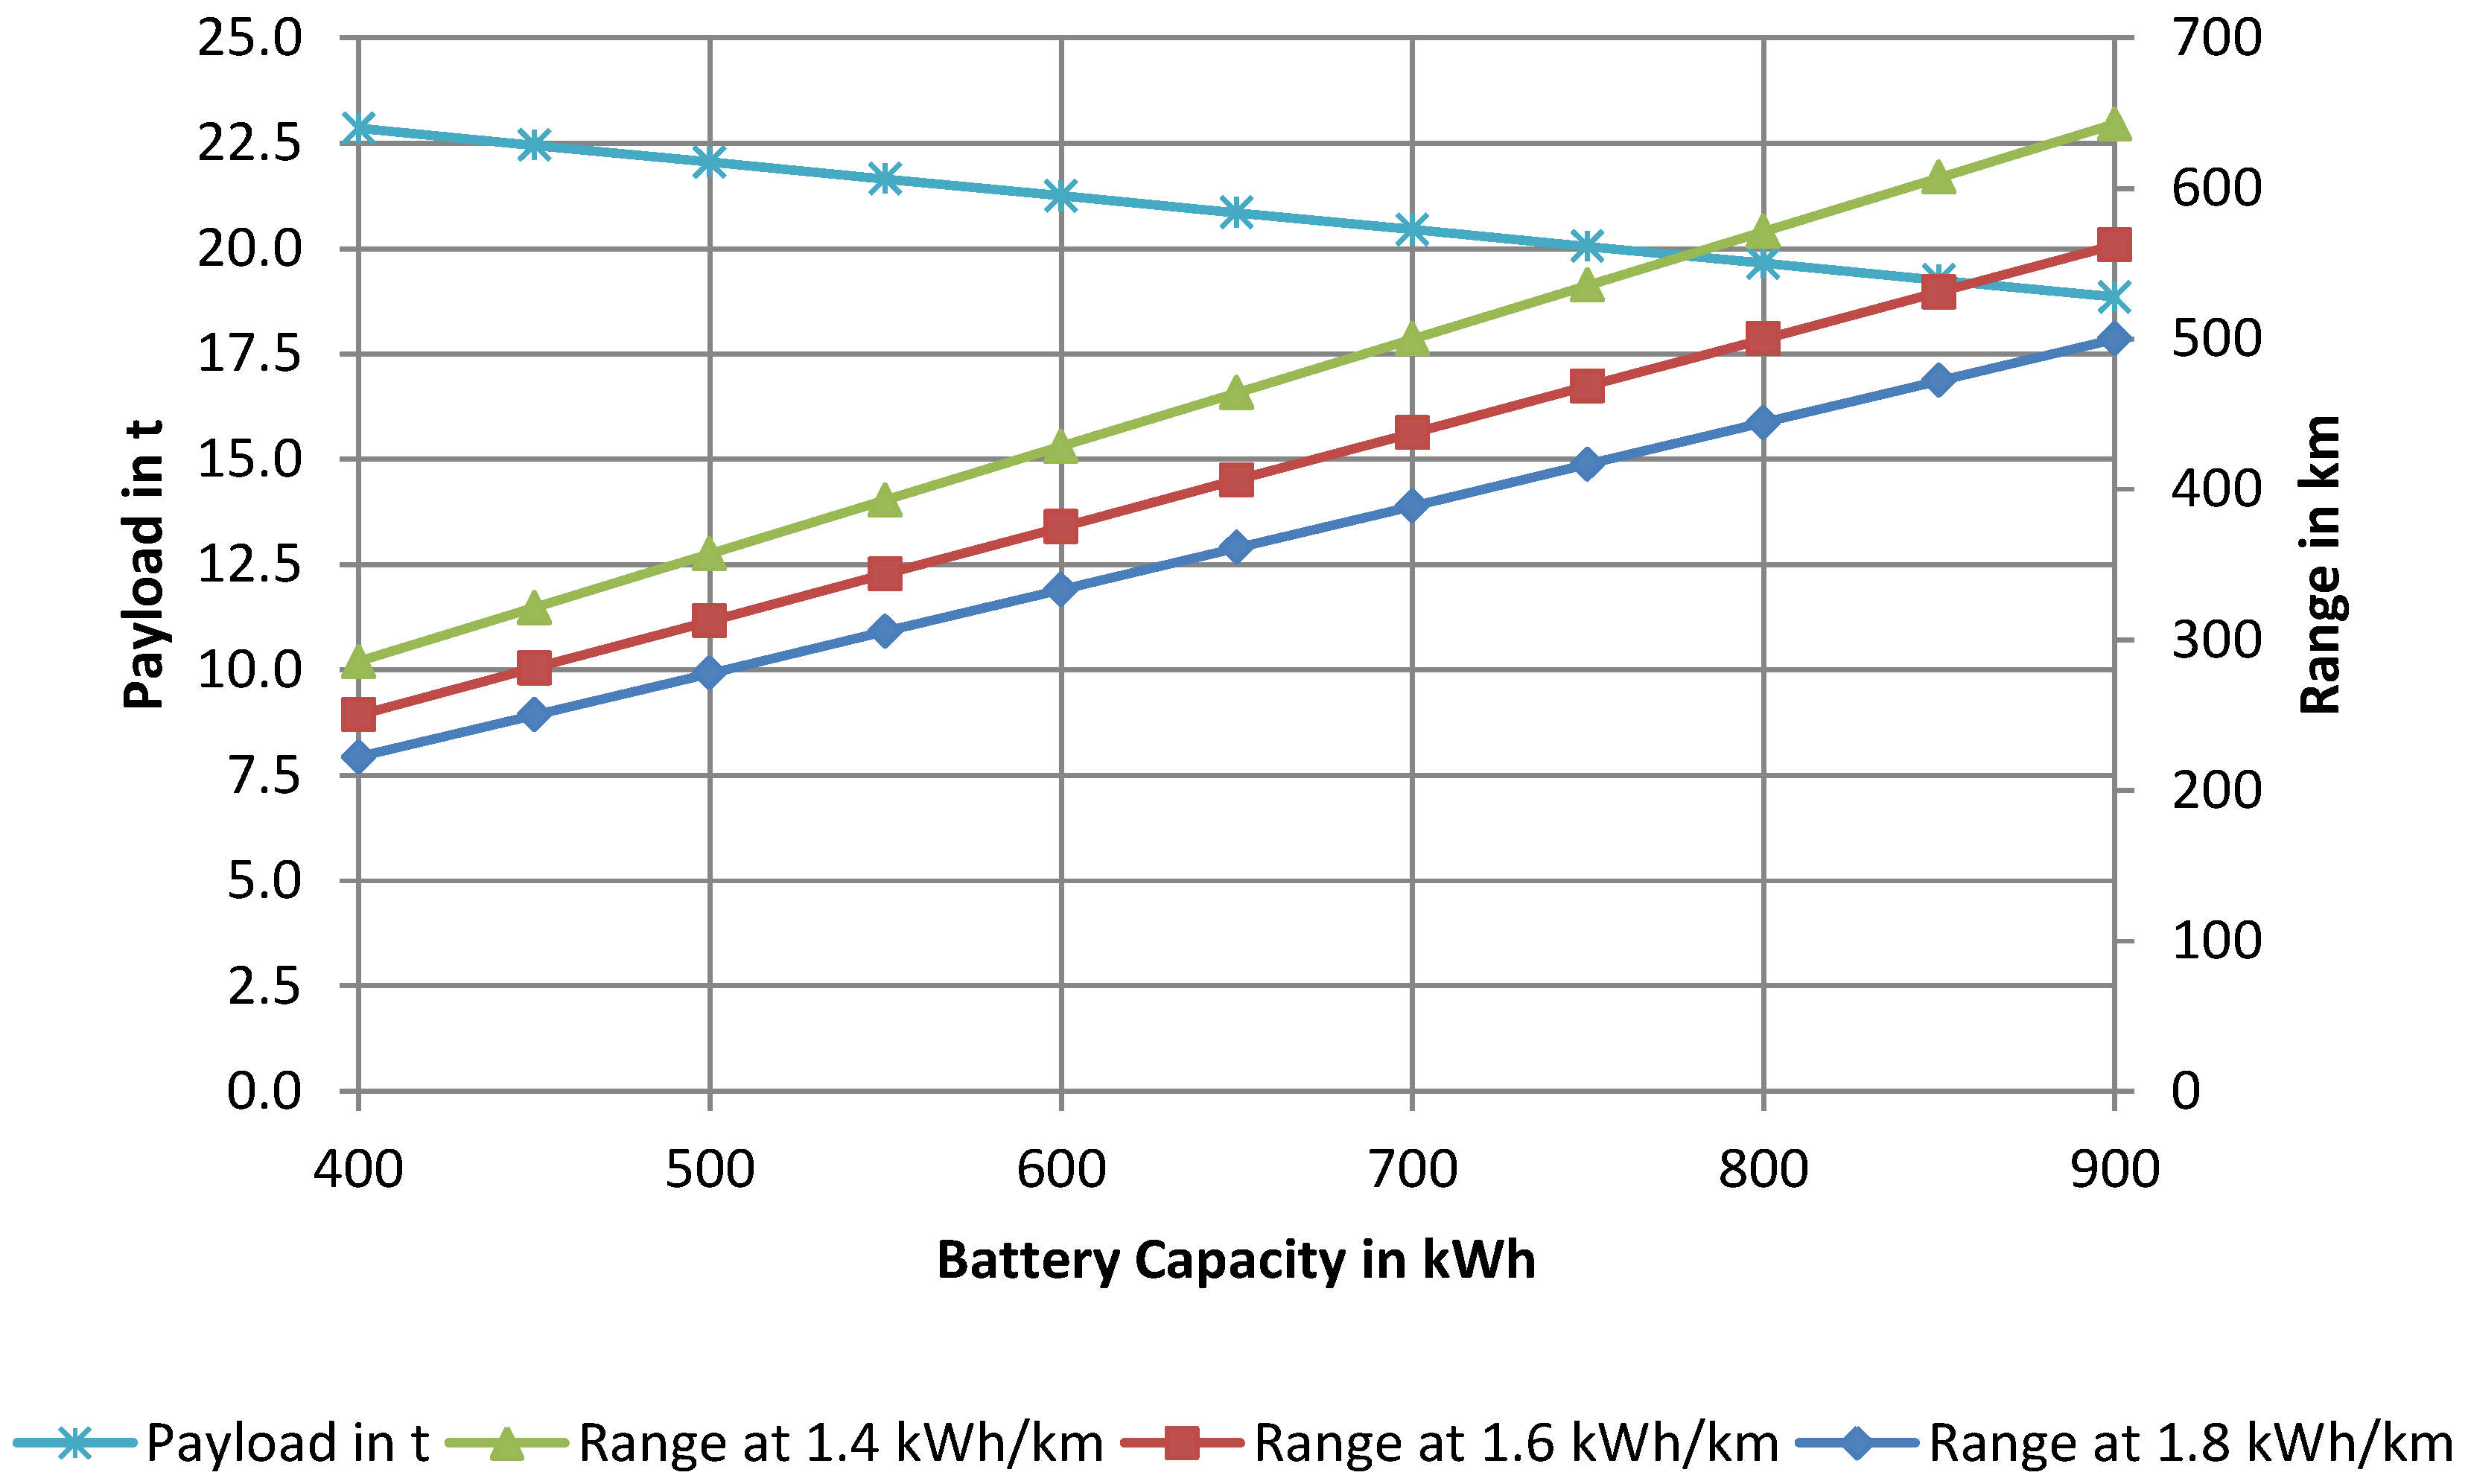
Considering the above mentioned assumptions, the integration of an 825 kWh battery with a weight of 6.6 t for the average scenario results in 20 t maximum payload. This corresponds to ca. 80% of the maximum payload of the conventional diesel truck. According to the statistical average payload use of 70% for long-haul trucks (Section 2.1), the payload reduction due to this traction battery might be acceptable. Furthermore, the 900 kWh battery with the weight of ca. 7.2 t for the high consumption scenario might be acceptable in terms of payload as the resulting available payload of ca. 19.4 t corresponds to 77% of the maximum payload of the conventional diesel truck. The relation between the battery capacity and the available payload as well as the resulting maximum range is shown in the Figure 14. Due to high available payload the payload reductions caused by the traction battery are limited.
Additionally, the available space for the integration of the traction battery has to be considered. According to above mentioned assumptions, 825 kWh and 900 kWh batteries require a volume of 4125 L and 4550 L respectively. The electric machine requires a volume of ca. 50 L [25] and the gearbox volume is assumed to be equal for diesel and battery electric trucks. Leaving out the diesel motor and tank results in approx. 1900 L [34,35] available volume that is obviously not sufficient for the battery integration. Due to this fact the battery can be split to multiple battery packs so a part of the battery can be placed i.e., in the frame of the semi-trailer underneath the loading platform which offers approx. 4000 L volume.
However it should be considered that the overall energy density of the battery can decrease due to more complex battery setup. Also the distribution and center of vehicle weight has to be considered by the manufacturer in order to place the particular battery packs.
3.3. Dimensioning and Cost Analysis of the Charging Infrastructure
The charging infrastructure is dimensioned according to the average statistical usage of rest areas and for the trucks’ average energy consumption on the highways. According to the defined transportation scenarios the truck has to be recharged within 45 min rest period or within the night rest period at rest areas on the highway. Assuming the average energy consumption of 658.8 kWh on main highways (Section 2.4) the average charging power required for the 45 min rest period results in ca. 880 kW. The slow charging at night rest period can be realized with a power of 50 kW so the charging process takes 13.2 h and fits into the night rest period.
The assumed parking trucks numbers on the highway rest areas during the day and night (Section 2.1) determine the required number of fast and slow charging stations per average rest area given in the Table 5. As only few trucks are parked at rest areas during the day, the number of fast charging stations is less than that of slow charging stations for the night rest period. In sum the number of charging stations satisfies the average trucks number at night. Taking into account the power electronics efficiency ŋpe of 0.95 and the transformers efficiency ŋtr of 0.98, the required total grid connection power Prest area for the charging infrastructure of the considered average rest area is calculated according to the following equation and stated in Table 5:
where ncha, slow and ncha, fast are the numbers of slow and fast simultaneous charging events respectively, Pcha, slow and Pcha, fast are the charging powers per truck at the respective charging station.
The abovementioned charging infrastructure is dimensioned for the case of an average charging place. For a large rest area with i.e., 150 parking trucks the infrastructure composition can be scaled resulting in 26 fast charging stations and 124 slow charging stations with 31,235 kW total grid connection power are required. To illustrate this power level, the total grid connection power of the charging infrastructure on this rest area can be compared to power level of a railway substation. For example, on a new railway route between Erfurt and Leipzig/Halle three railway substations each with 30,000 kW total transformer power (two transformers each with 15,000 kW) are used to supply high-speed passenger trains and freight trains [40]. The power of one of these substations is in the range of the considered trucks charging infrastructure of large rest area.
According to the costs stated in Table A2 the construction costs of an average rest area with charging stations are calculated. There is an uncertainty concerning the costs for charging infrastructure as no high power charging stations for heavy-duty trucks are available on the market. Therefore the assumed costs are based on the communication with manufacturers of charging equipment for public busses which also use high charging powers of up to 500 kW. As the assumed costs are already retail prices no additional retail factor for charging infrastructure is used. Also the residual value of the charging infrastructure is not considered for this section to show the initial construction costs for an average charging place but included in the further LCC analysis.
The total construction costs for the charging infrastructure of the considered average rest area are approx. 3.323 million € (Figure 15) whereat the charging stations costs (consisting of power electronics and coupling connection costs) is the major part with approx. 42%. Again the major part of the charging stations costs is induced by power electronics. The costs for a high power charging station are significantly higher than for a slow charging station as power electronics with high power output and a complex coupling connection for high currents are necessary. For the slow charging stations the standardized manual charging connectors can be used. The finishing costs indicate the costs referred to construction works of charging stations and grid connections.
In total 2113 charging places with infrastructure specified in Table 5 are necessary to cover all rest areas on German highways and to provide charging stations for parking trucks (according to Section 2.1). Provided the number of battery electric trucks using the charging infrastructure, the total costs of all charging places can be split to participating trucks that is done in the next section to calculate the life cycle costs of one truck.
3.4. Life Cycle Costs for Battery Electric Truck and Diesel Truck
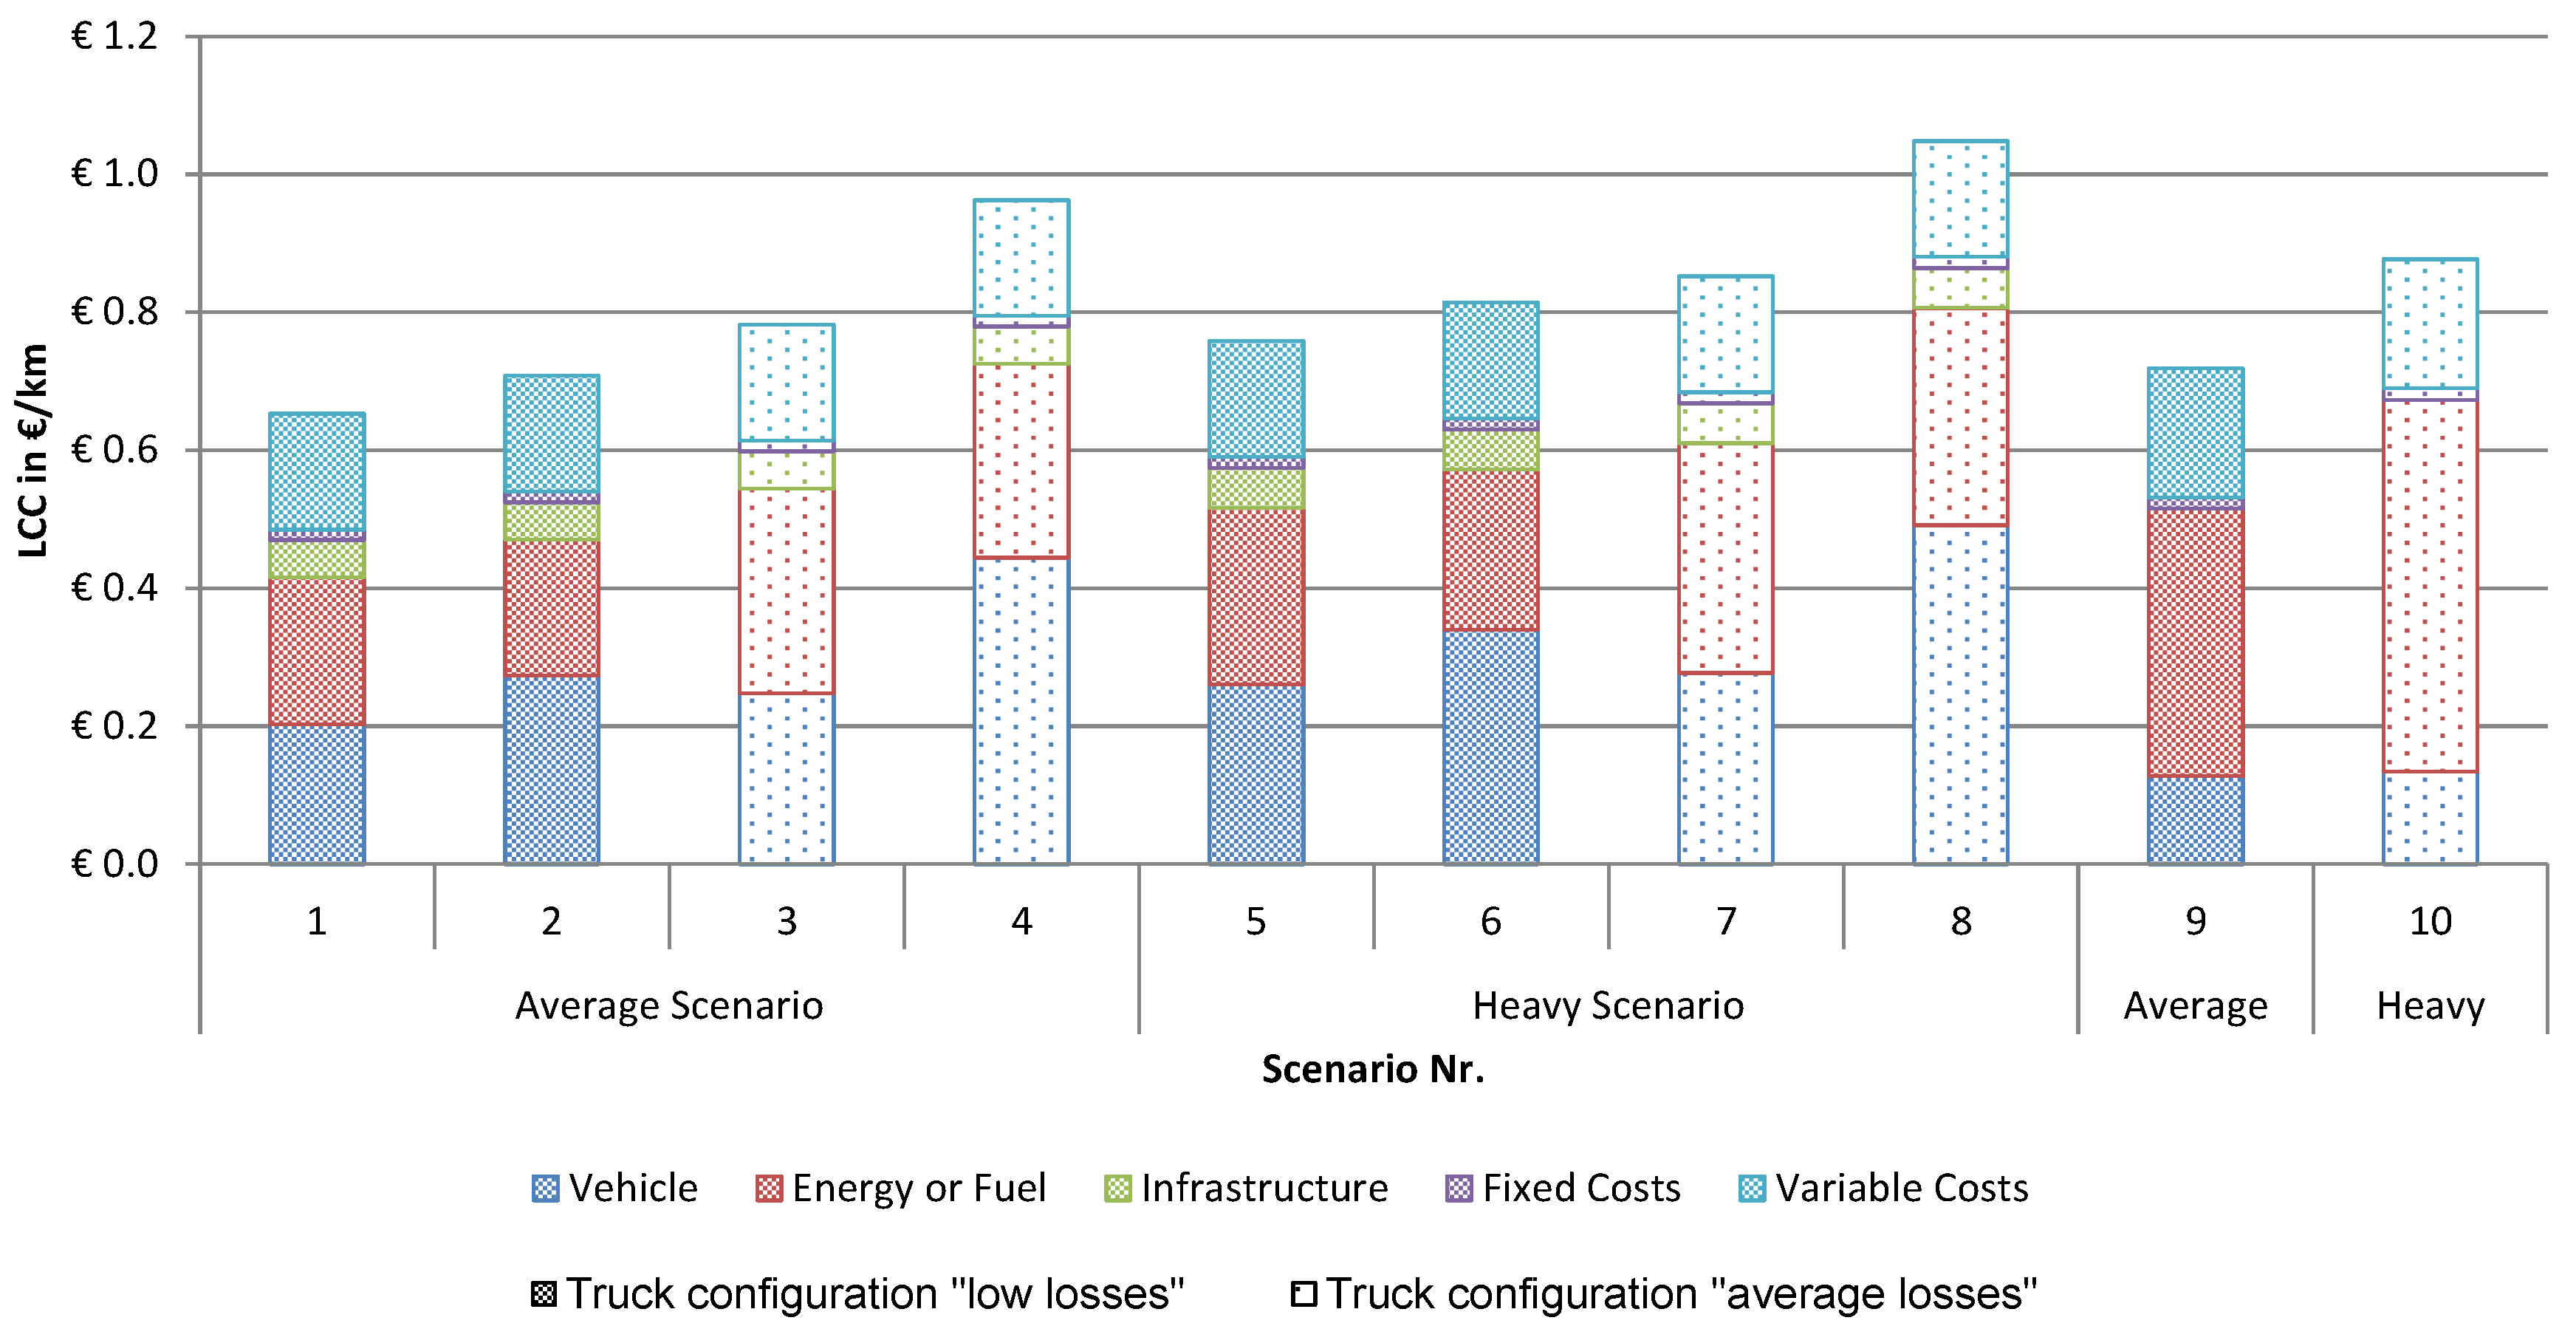
Based on the simulation results for the considered operation scenarios, the life cycle costs for battery electric and diesel trucks are calculated using the costs parameters in Appendix A. The resulting scenario duration is limited by 5 years because it exceeds the maximum scenario mileage. The total mileages reached in the average and heavy route scenarios are ca. 939,600 km and 895,800 km, respectively. The composition of LCC divided by mileage driven in each scenario is shown in Figure 16. It can be observed that in most scenarios the battery electric trucks (Scenarios 1 to 8) perform at comparable costs as diesel trucks (Scenarios 9 and 10).
The LCC costs of the average route scenarios with truck configuration “low losses” (Scenarios 1 and 2) are approximately the same as for the diesel truck Scenario 9 under equal conditions. While the main costs driver for diesel trucks is fuel costs, for the battery electric truck in the Scenario 1 the vehicle, energy and variable costs represent almost equal LCC parts. The higher vehicle costs for the battery electric truck are compensated by lower energy costs for operation. Scenario 2 shows higher LCC due to higher vehicle costs that are explained by a shorter lifetime of the battery Cell 2 used in this scenario.
The charging infrastructure costs are equal in all battery truck scenarios because the infrastructure is assumed for the average consumption case as described in Section 3.3. As the charging infrastructure costs are split to all heavy-duty trucks parked at highway rest areas during night (ca. 71,000 trucks [20]) and because of the higher lifetime of infrastructure (Table A2), the infrastructure costs for a particular truck are a minor part of the total LCC.
In general the scenarios with battery Cell 2 show higher vehicle costs because the battery needs to be exchanged during the scenario duration of 5 years. For the battery Cell 1 mathematical aging model [28] yields very high cell lifetime over 20 years showing the good cycling stability of this cell. To gain more realistic values the lifetime for this cell was restricted to 12 years that correspond to a typical calendar lifetime. The lifetime of Cell 2 in the considered scenarios varies from 2.3 years in Scenario 8 to 3.6 years in Scenario 6 affecting battery exchanges during the scenario duration. The lower cycling durability of the Cell 2 is reflected by lower battery costs as stated Section 2.3.
The LCC of battery electric trucks in heavy route scenarios are characterized by higher vehicle and energy costs as battery capacity and energy consumptions are higher. Compared to the diesel truck in heavy route scenario the battery electric trucks with Cell 1 (Scenarios 5 and 7) result in slightly lower LCC. Again the limited lifetime of Cell 2 induces high vehicle costs and thus higher LCC especially for Scenario 8.
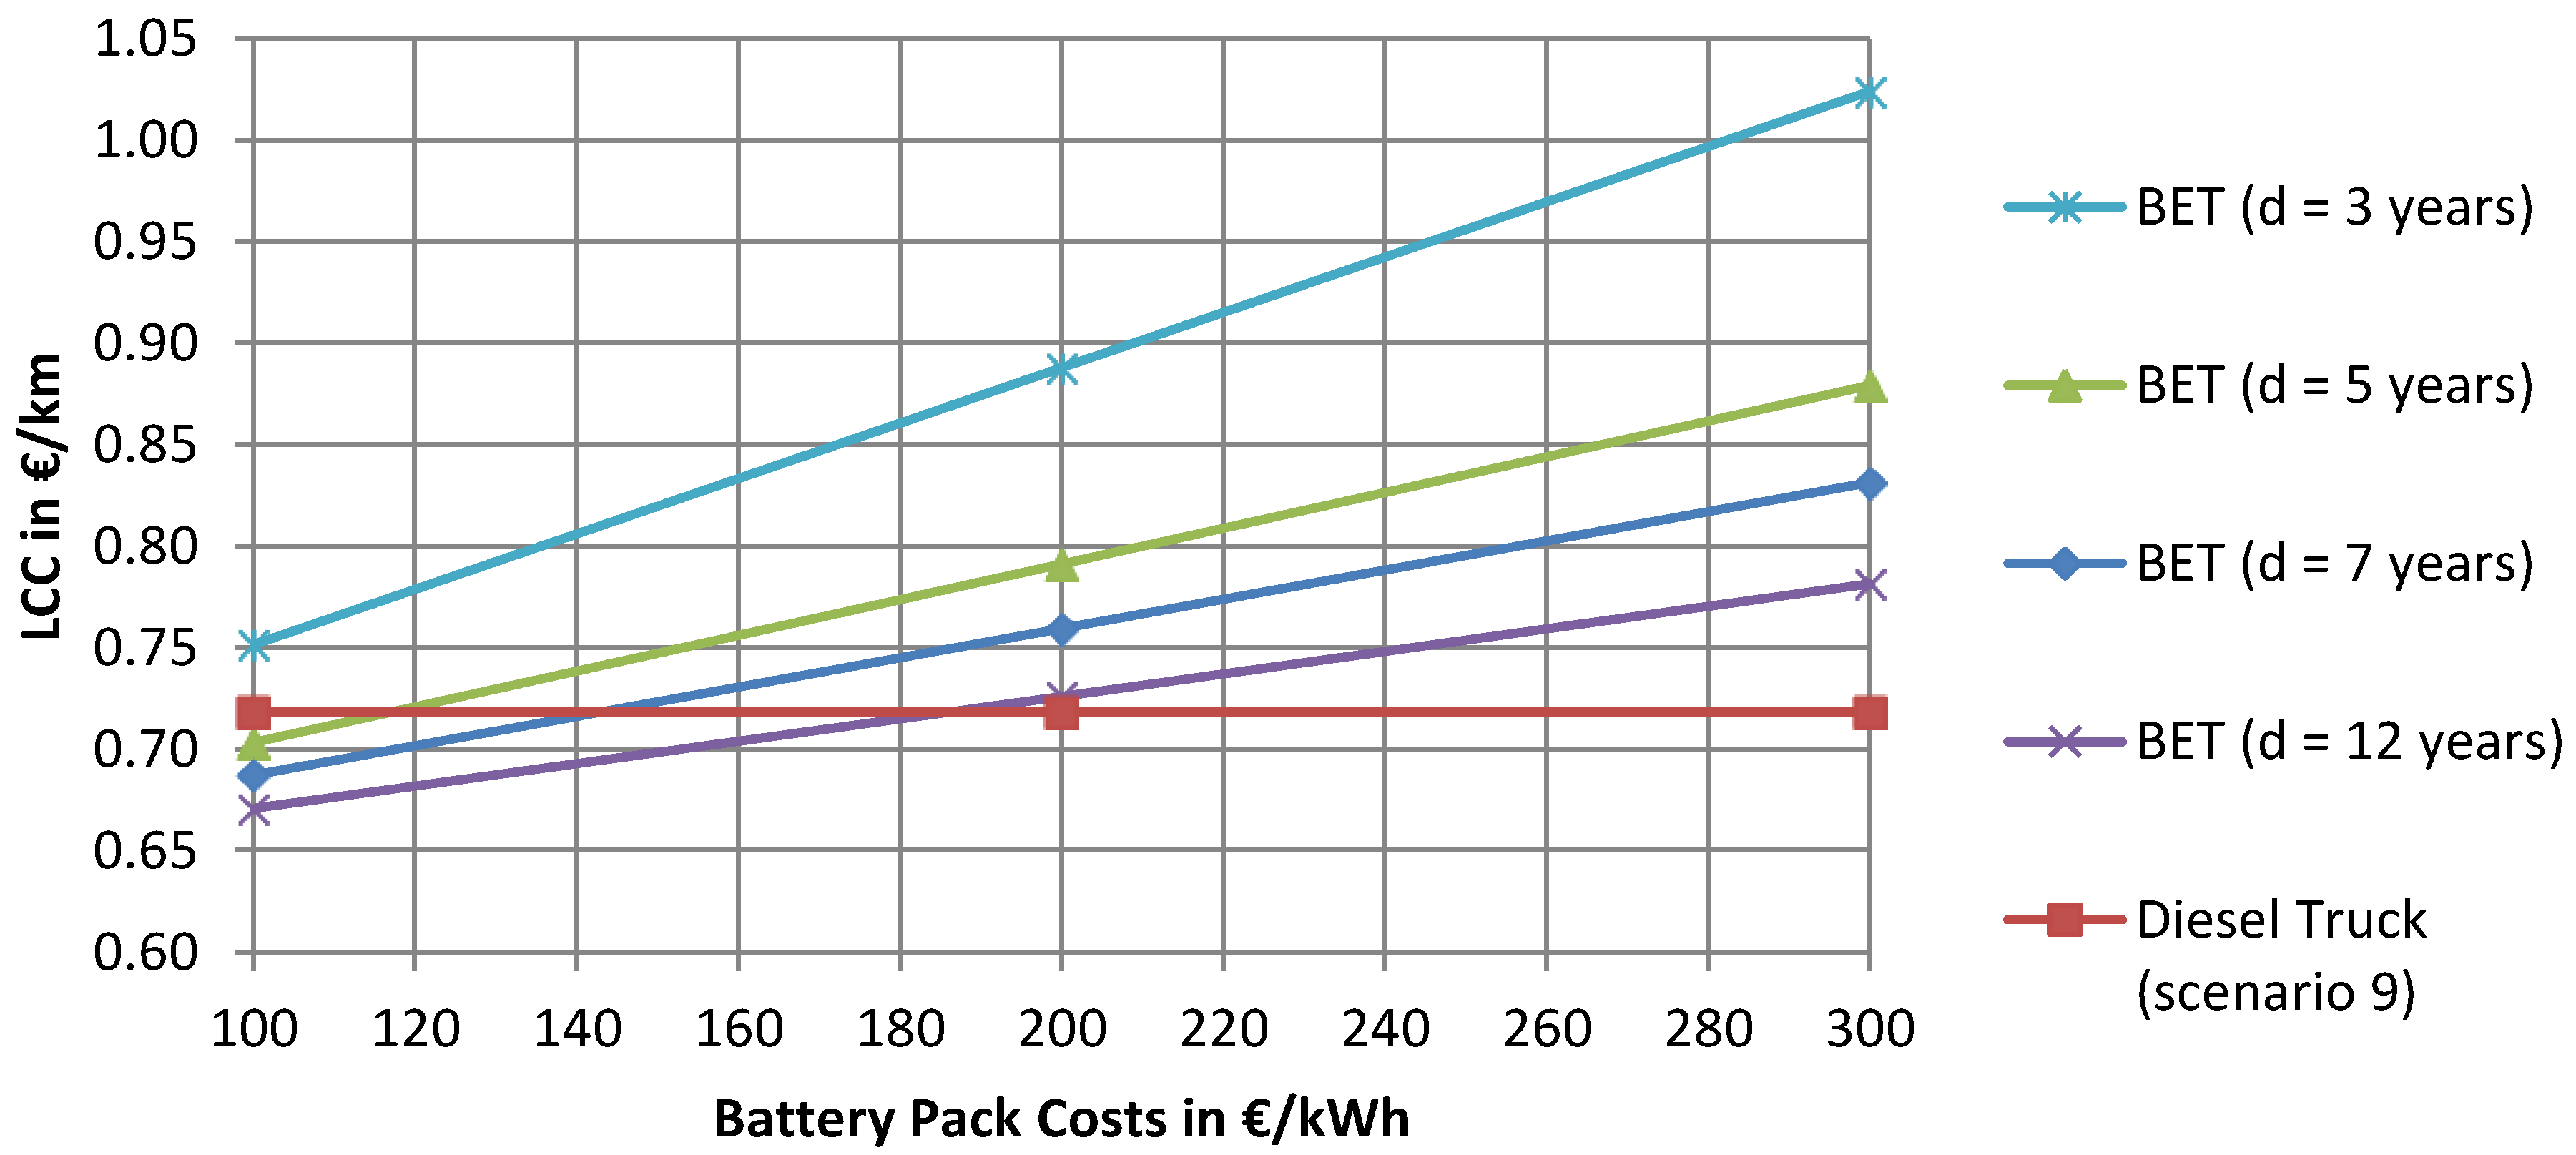
The variation between scenarios with different cells shows that the LCC results are highly dependent on the battery lifetime. As the battery costs are a major part of vehicles costs the impact of battery pack price and lifetime on total LCC is further examined. An average scenario (Scenario 3) is taken for this purpose and compared to the average diesel truck Scenario 9 while battery costs and lifetime are varied independently of the particular cell. The results in Figure 17 show that the costs parity can be achieved at different points and is a trade-off between battery lifetime and battery invest costs. For example for a battery lifetime of 7 years and the battery investment costs of 145 €/kWh the cost parity with diesel truck is achieved. Although the battery prices today might be higher, the battery prices are expected to decrease in the next decade [8,9] achieving the level necessary for the costs parity.
In summary, the LCC results for considered scenarios show that battery electric trucks can perform at the same costs level as the conventional diesel trucks. Although the initial costs for vehicle (especially for the battery) and infrastructure are higher than for the diesel truck, the more efficient electric drivetrain leads to lower energy costs during operation. The vehicle costs are highly affected by the battery lifetime and resulting battery exchanges.
4. Conclusions
This study analyzes the energy consumption, required battery size and life cycle costs of battery electric heavy-duty trucks with a gross weight of up to 40 t operated in long-haul transportation. The requirements of long-haul operation in Germany are considered based on statistical data and legislative conditions. To calculate the energy consumption of the battery electric truck a simulation model was created and parametrized for different semi-trailer truck configurations. Subsequently the energy consumption on the main German highways is simulated and the traction battery is then dimensioned for maximum trip duration of 4.5 h to 825 kWh which is an average value for the considered main highways and truck configurations.
The resulting tank-to-wheel energy consumption for battery electric trucks varies between ca. 1.23 and 1.94 kWh/km. Compared to the simulated diesel trucks the battery electric drivetrain shows a ca. 2.5 times higher efficiency. Due to high battery capacity the currents on cell level and the temperature rise are relatively small during charging and driving. During fast charging at the 45 min rest period the maximum cell current rates are in the range of 1 C to 1.5 C. Furthermore the payload restrictions due to the integration of the high capacity traction battery into a semi-trailer truck were examined. The maximum payload of a battery electric truck results in ca. 80% of the maximum diesel truck payload after integration of an 825 kWh battery. This restriction might be acceptable considering the fact that the average payload used by conventional long-haul trucks is ca. 70%.
Finally the life cycle costs of heavy-duty trucks including the charging infrastructure were calculated. Compared to diesel truck the vehicle costs are significantly higher due to high capacity battery. On the other hand the energy costs for battery electric trucks are smaller due to higher drivetrain efficiency. The main costs driver of the charging infrastructure for the battery electric trucks is the power electronics as high charging powers at the rest areas are required for fast charging. However the charging infrastructure costs per one battery electric truck are a minor part of its total life cycle costs, while vehicle and energy costs are the main costs drivers. The total life cycle costs show that battery electric trucks can perform at the same costs level as the conventional diesel trucks. However the life cycle costs show also high dependency on battery lifetime and resulting battery exchanges. Considering the decreasing battery prices and increasing battery energy densities the battery electric trucks may become a profitable option despite harsh requirements of long-haul transportation.
Acknowledgments
This work and the publishing of this open access publication were supported by the foundation Karl-Vossloh-Stiftung (grant number S047/10038/2015).
Author Contributions
The research of the statistical data, simulation model development as well as simulation and results analysis were done by Ivan Mareev. Jan Becker contributed to the identification of cell models, the implementation of the simulation model as well as the choice of scenarios. Dirk Uwe Sauer contributed to all of the parts.
Conflicts of Interest
The authors declare no conflict of interest. The founding sponsors had no role in the design of the study; in the collection, analyses, or interpretation of data; in the writing of the manuscript, and in the decision to publish the results.
Appendix A

Table A1.
Costs parameters for battery electric trucks and electricity used in LCC calculation.
| Parameter | Value | Source |
|---|---|---|
| Battery Electric Truck | ||
| Vehicle Body (w/o drivetrain) | 60,000 € | [5] |
| Battery with Cell 1 | 300 €/kWh | [8] and own estimation |
| Battery with Cell 2 | 200 €/kWh | [8] and own estimation |
| Battery Price Development | −6.7%/a | [8] |
| E-Machine | 17 €/kW | [5] |
| Power Electronics | 21.5 €/kW | [5] |
| Electricity | ||
| Electricity, net | 0.139 €/kWh | [41] |
| Electricity price development | 3.7%/a | [42] |
Table A2.
Costs parameters for charging infrastructure used in LCC calculation. The source for the costs parameters in this table is private communication with manufacturers, who want to stay anonymous [43].
Table A2.
Costs parameters for charging infrastructure used in LCC calculation. The source for the costs parameters in this table is private communication with manufacturers, who want to stay anonymous [43].
| Parameter | Value |
|---|---|
| Charging Infrastructure | |
| Power Electronics (Fast Charging Station) | 149,000 € |
| Power Electronics (Slow Charging Station) | 9800 € |
| Coupling Connection (Fast Charging Station) | 21,000 € |
| Coupling Connection (Slow Charging Station) | 1400 € |
| Finishing Costs (Fast Charging Station) | 85,000 € |
| Finishing Costs (Slow Charging Station) | 10,000 € |
| Transformer | 45 €/kW |
| Connection to Grid (assuming 1 km distance) | Fix: 259,000 €, Var: 140 €/m, Total: 399,000 € |
| Contribution towards Network | 60.44 €/kW |
| Lifetime Transformer | 25 a |
| Lifetime Power Electronics | 12 a |
Table A3.
Costs parameters for diesel truck used in LCC calculation.
| Parameter | Value | Source |
|---|---|---|
| Diesel Truck | ||
| Diesel Truck | 120,000 € | [5] |
| Diesel Fuel, net | 0.949 €/L | [44,45] |
| Diesel Fuel Price Development | 2.3%/a | [44] |
Table A4.
Costs parameters for fixed and variable costs used in LCC calculation.
| Parameter | Value | Source |
|---|---|---|
| Fixed Costs | ||
| Battery Electric Truck Taxes | 0 €/a | [46] |
| Diesel Truck Taxes | 556 €/a | [46] |
| Insurance | 2936 €/a | [41] |
| Variable Costs | ||
| Service for Battery Electric Truck | 0.04 €/km | [5] |
| Service for Diesel Truck | 0.06 €/km | [5] |
| Tolls | 0.135 €/km | [47] |
References
- Hütter, A. Verkehr auf Einen Blick; Statistisches Bundesamt: Wiesbaden, Germany, 2013. [Google Scholar]
- Campanari, S.; Manzolini, G.; Garcia de la Iglesia, F. Energy analysis of electric vehicles using batteries or fuel cells through well-to-wheel driving cycle simulations. J. Power Sources 2009, 186, 464–477. [Google Scholar] [CrossRef]
- Dünnebeil, F.; Reinhard, C.; Lambrecht, U.; Kies, A.; Hausberger, S.; Rexeis, M. Zukünftige Maßnahmen zur Kraftstoffeinsparung und Treibhausgasminderung bei Schweren Nutzfahrzeugen; Umweltbundesamt: Dessau-Roßlau, Germany, 2015. [Google Scholar]
- Hülsmann, F.; Mottschall, M.; Hacker, F.; Kasten, P. Konventionelle und Alternative Fahrzeugtechnologien bei Pkw und Schweren Nutzfahrzeugen—Potenziale zur Minderung des Energieverbrauchs bis 2050; Öko-Institut e.V.: Freiburg, Germany, 2014. [Google Scholar]
- Den Boer, E.; Aarnink, S.; Kleiner, F.; Pagenkopf, J. Zero Emissions Trucks: An Overview of State-of-the-Art Technologies and Their Potential; CE Delft, DLR: Delft, The Netherlands, 2013. [Google Scholar]
- Schäfer, A.; Dray, L.; Andersson, E.; Ben-Akiva, M.E.; Berg, M.; Boulouchos, K.; Dietrich, P.; Fröidh, O.; Graham, W.; Kok, R.; et al. TOSCA Project Final Report: Description of the Main S&T Results/Foregrounds; University of Cambridge: Cambridge, UK, 2011. [Google Scholar]
- Zu, C.-X.; Li, H. Thermodynamic analysis on energy densities of batteries. Energy Environ. Sci. 2011, 4, 2614. [Google Scholar] [CrossRef]
- Nykvist, B.; Nilsson, M. Rapidly falling costs of battery packs for electric vehicles. Nat. Clim. Chang. 2015, 5, 329–332. [Google Scholar] [CrossRef]
- Knupfer, S.M.; Hensley, R.; Hertzke, P.; Schaufuss, P.; Laverty, N.; Kramer, N. Electrifying Insights: How Automakers Can Drive Electrified Vehicle Sales and Profitability; McKinsey & Company: New York, NY, USA, 2017. [Google Scholar]
- MAN SE MAN at the IAA Commercial Vehicles 2016: A Future-Proof Portfolio. Available online: https://www.corporate.man.eu/en/press-and-media/presscenter/MAN-at-the-IAA-Commercial-Vehicles-2016_-a-future-proof-portfolio-264385.html (accessed on 21 August 2017).
- Electrek Tesla Semi. Available online: https://electrek.co/guides/tesla-semi/ (accessed on 21 August 2017).
- Sen, B.; Ercan, T.; Tatari, O. Does a battery-electric truck make a difference?—Life cycle emissions, costs, and externality analysis of alternative fuel-powered Class 8 heavy-duty trucks in the United States. J. Clean. Prod. 2017, 141, 110–121. [Google Scholar] [CrossRef]
- Zhao, H.; Burke, A.; Zhu, L. Analysis of Class 8 hybrid-electric truck technologies using diesel, LNG, electricity, and hydrogen, as the fuel for various applications. In Proceedings of the 2013 World Electric Vehicle Symposium and Exhibition (EVS27), Barcelona, Spain, 17–20 November 2013; pp. 1–16. [Google Scholar]
- Wolf, A. Modell zur Straßenbautechnischen Analyse der Durch den Schwerverkehr Induzierten Beanspruchung des BAB-Netzes: [Bericht zum Forschungsprojekt F 1100.3406002 des Arbeitsprogramms der Bundesanstalt für Straßenwesen]; Wirtschaftsverl, N.W., Ed.; Berichte der Bundesanstalt für Strassenwesen, Strassenbau; Verlag für neue Wissenschaft GmbH: Bremerhaven, Germany, 2010; ISBN 978-3-86918-000-7. [Google Scholar]
- European Union (EC). Regulation (EC) No 561/2006 of the European Parliament and of the Council of 15 March 2006 on the Harmonisation of Certain Social Legislation Relating to Road Transport and Amending Council Regulations (EEC) No 3821/85 and (EC) No 2135/98 and Repealing Council Regulation (EEC) No 3820/85 (Text with EEA Relevance)—Declaration; European Union: City of Brussels, Belgium, 2006. [Google Scholar]
- Bundesamt für Güterverkehr. Marktbeobachtung Güterverkehr, Auswertung der Arbeitsbedingungen in Güterverkehr und Logistik 2015-I; Bundesamt für Güterverkehr: Köln, Germany, 2015. [Google Scholar]
- Kraftfahrt-Bundesamt. Verkehr Deutscher Lastkraftfahrzeuge—Inlandsverkehr, Jahr 2013 (VD 3); Kraftfahrt-Bundesamt: Flensburg, Germany, 2014. [Google Scholar]
- Kraftfahrt-Bundesamt. Verkehr Deutscher Lastkraftfahrzeuge—Inlandsverkehr, Jahr 2014 (VD 3); Kraftfahrt-Bundesamt: Flensburg, Germany, 2015. [Google Scholar]
- StVZO Straßenverkehrs-Zulassungs-Ordnung vom 26. April 2012 (BGBl. I S. 679), die Zuletzt Durch Artikel 2 der Verordnung vom 18. Mai 2017 (BGBl. I S. 1282) Geändert Worden ist. Available online: https://www.gesetze-im-internet.de/stvzo_2012/BJNR067910012.html (accessed on 21 July 2017).
- Kathmann, T.; Schroeder, S.; Bär, A. Lkw-Parken auf BAB—Auswertung der Bundesweiten Erhebung der Parkstandnachfrage an BAB 2013; Bundesministerium für Verkehr, Bau und Stadtentwicklung: Berlin, Germany, 2014. [Google Scholar]
- Lüttmerding, A.; Gather, M.; Heinitz, F.; Hesse, N. Belegung der Autobahnplätze Durch LKW in Thüringen: Bestandsaufnahme und Grundsätzliche Maßnahmenempfehlungen; Berichte des Institus Verkehr und Raum, Band 3; Institut Verkehr und Raum der Fachhochschule Erfurt: Erfurt, Germany, 2008. [Google Scholar]
- Biermann, J.-W. Fahrzeugauslegung. In Energiemanagement im Kraftfahrzeug: Optimierung von CO2-Emissionen und Verbrauch Konventioneller und Elektrifizierter Automobile; Liebl, J., Lederer, M., Rohde-Brandenburger, K., Roth, M., Schäfer, H., Eds.; ATZ/MTZ-Fachbuch; Springer Vieweg: Wiesbaden, Germany, 2014; pp. 101–162. ISBN 978-3-658-04450-3. [Google Scholar]
- Appel, W.; Brähler, H.; Dahlhaus, U.; Esch, T.; Kopp, S.; Rhein, B. Fahrmechanik. In Nutzfahrzeugtechnik: Grundlagen, Systeme, Komponenten; Hoepke, E., Appel, W., Eds.; ATZ-MTZ Fachbuch; Springer Vieweg: Wiesbaden, Germany, 2013; pp. 37–119. ISBN 978-3-8348-1795-2. [Google Scholar]
- European Union (EC). Regulation (EC) No 661/2009 of the European Parliament and of the Council of 13 July 2009 Concerning Type-Approval Requirements for the General Safety of Motor Vehicles, Their Trailers and Systems, Components and Separate Technical Units Intended Therefor; European Union: City of Brussels, Belgium, 2009. [Google Scholar]
- GKN Land Systems GKN Electric Motor and Generator Technology: Technical Datasheet. Available online: http://products.gknlandsystems.info/fileadmin/user_upload/pdf/Electrics/DS_GKN_electric_motor_technology_64_GB_1214.pdf (accessed on 7 March 2017).
- Naunheimer, H.; Bertsche, B.; Lechner, G.; Ryborz, J.; Novak, W. Überblick über das System Verkehr-Fahrzeug-Getriebe. In Fahrzeuggetriebe: Grundlagen, Auswahl, Auslegung und Konstruktion; VDI-Buch; Springer: Berlin, Germany, 2007; pp. 28–72. ISBN 978-3-540-30625-2. [Google Scholar]
- Käbitz, S.; Gerschler, J.B.; Ecker, M.; Yurdagel, Y.; Emmermacher, B.; André, D.; Mitsch, T.; Sauer, D.U. Cycle and calendar life study of a graphite|LiNi1/3Mn1/3Co1/3O2 Li-ion high energy system. Part A: Full cell characterization. J. Power Sources 2013, 239, 572–583. [Google Scholar] [CrossRef]
- Schmalstieg, J.; Käbitz, S.; Ecker, M.; Sauer, D.U. A holistic aging model for Li(NiMnCo)O2 based 18650 lithium-ion batteries. J. Power Sources 2014, 257, 325–334. [Google Scholar] [CrossRef]
- Daimler AG. Diesel and Gas Engine Systems for EURO VI on-Highway Applications; Product Brochure; Daimler AG: Stuttgart, Germany, 2013. [Google Scholar]
- Google Maps. Available online: https://www.google.de/maps/ (accessed on 21 August 2017).
- GPS Visualizer. Available online: http://www.gpsvisualizer.com/ (accessed on 21 August 2017).
- SRTM Shuttle Radar Topography Mission. Available online: https://www2.jpl.nasa.gov/srtm/ (accessed on 21 August 2017).
- Bode, O.; Bode, M. Untersuchung des Rollwiderstands von Nutzfahrzeugreifen auf Echten Fahrbahnen; FAT-Schriftenreihe 255; Forschungsvereinigung Automobiltechnik e.V. (FAT): Berlin, Germany, 2013. [Google Scholar]
- DAF Trucks Deutschland Modellbeschreibung XF 440 FT 4x2 Sattelzugmaschine. Available online: http://www.daftrucks.de/de-de/trucks/specsheets-search-page (accessed on 30 August 2017).
- DAF Components MX-11 Euro 6 Coach & Bus Engine. Available online: http://www.daf.com/~/media/Files/DAF%20Trucks/Trucks/Components/MX-11/PACCAR-MX-11-coach-bus-engine-folder-2013.pdf (accessed on 30 August 2017).
- Volvo Trucks. Fahrzeugspezifikation Volvo FH 500 4x2 Sattelzugmaschine; Volvo Trucks: Gothenburg, Sweden, 2015. [Google Scholar]
- Patil, P.G. Developments in Lithium-Ion Battery Technology in The Peoples Republic of China; Transportation Technology Research and Development Center, Energy Systems Division, Argonne National Laboratory: Argonne, IL, USA, 2008.
- Henninge, V. The Tesla Model S Battery: A Battery Pack Analysis Study. In Proceedings of the Advanced Automotive & Stationary Battery Conference, Mainz, Germany, 25–28 January 2016. [Google Scholar]
- ZF Friedrichshafen Truck & Van Driveline Technology—Product Overview. Available online: https://ci-portal.zf.com/global/media/product_media/trucks/trucks_product_overviews/product_overview_truck_van_transmissions.pdf (accessed on 30 August 2017).
- DB Netz Verkehrsprojekt Deutshe Einheit Nr.8—Unterwerke. Available online: http://www.vde8.de/Unterwerke------_site.site..ls_dir._nav.358_likecms.html (accessed on 30 August 2017).
- Hacker, F.; von Waldenfels, R.; Mottschall, M. Wirtschaftlichkeit von Elektromobilität in Gewerblichen Anwendungen: Betrachtung von Gesamtnutzungskosten, Okonomischen Potenzialen und Möglicher CO2-Minderung; Öko-Institut e.V.: Berlin, Germany, 2015. [Google Scholar]
- Strompreise.de Strompreis kWh—Was Kostet Eine Kilowattstunde? Available online: https://www.strompreise.de/strompreis-kwh/ (accessed on 21 August 2017).
- Mareev, I. Personal Communication with Charging Equipment Manufacturers; RWTH Aachen University: Aachen, Germany, 2016. [Google Scholar]
- Statista GmbH Durchschnittlicher Dieselpreis in Deutschland bis 2017. Available online: https://de.statista.com/statistik/daten/studie/779/umfrage/durchschnittspreis-fuer-dieselkraftstoff-seit-dem-jahr-1950/ (accessed on 21 August 2017).
- Statista GmbH Zusammensetzung des Dieselpreises im Juni. 2017. Available online: https://de.statista.com/statistik/daten/studie/803/umfrage/zusammensetzung---verbraucherpreis-fuer-diesel/ (accessed on 21 August 2017).
- KraftStG. Kraftfahrzeugsteuergesetz. Available online: https://www.gesetze-im-internet.de/kraftstg/BJNR005090927.html (accessed on 21 August 2017).
- Toll Collect GmbH. Toll Rates. Available online: https://www.toll-collect.de/en/toll_collect/bezahlen/maut_tarife/maut_tarife.html (accessed on 21 August 2017).
Figure 1.
Number of trips for different distance levels over 150 km performed by commercial vehicles within German inland freight transportation for years 2013 and 2014 (data from [15,16]).

Figure 2.
Average payload usage of trucks within German inland transportation depending on loading volume usage (data from [16]).
Figure 2.
Average payload usage of trucks within German inland transportation depending on loading volume usage (data from [16]).
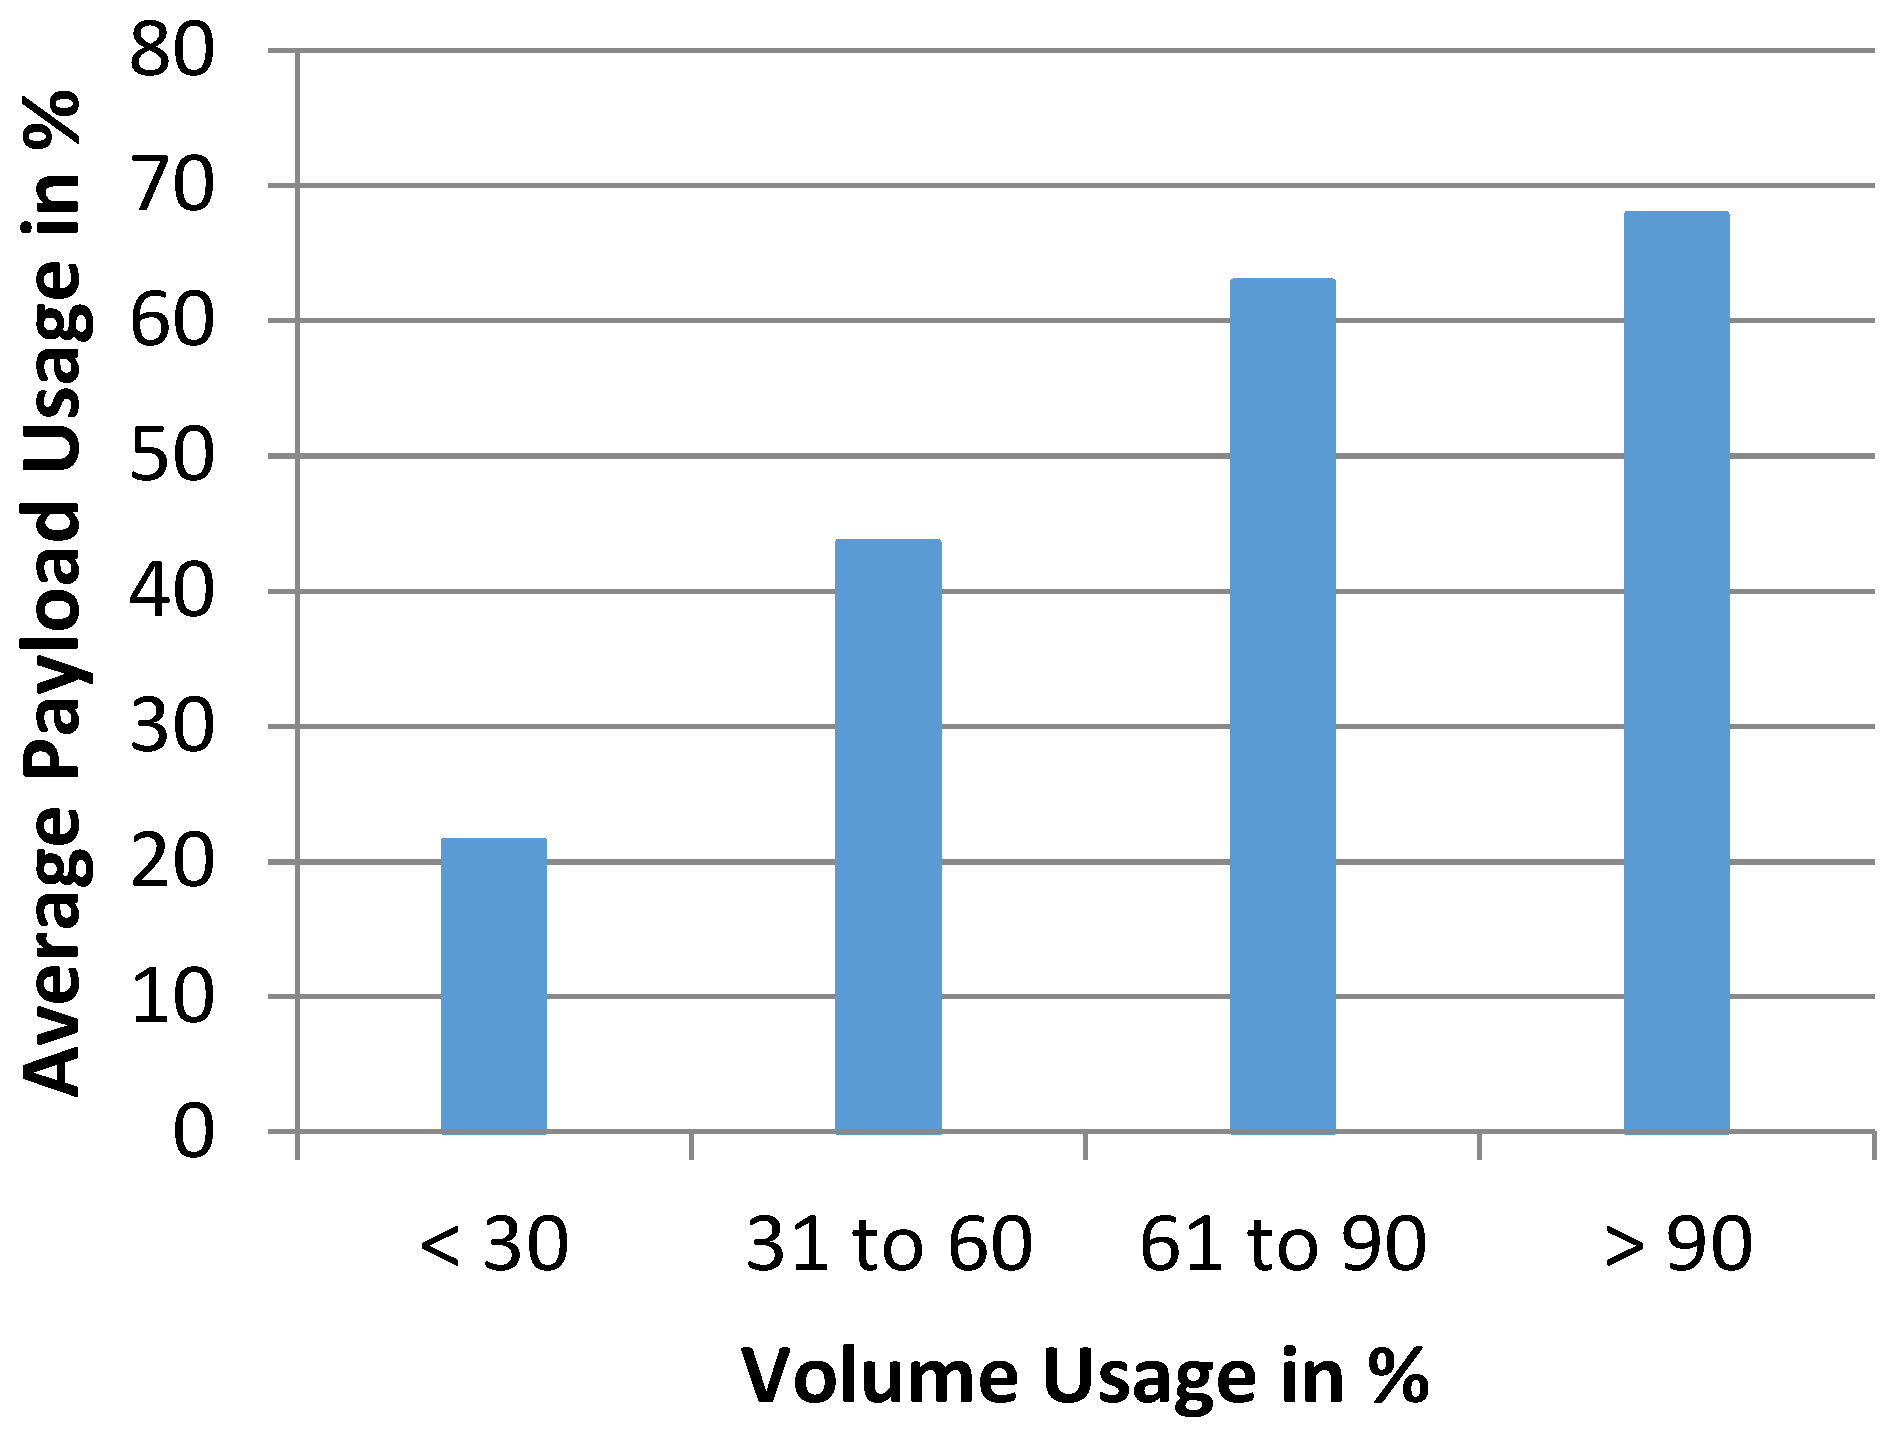
Figure 3.
Overview of the truck simulation model containing electric and diesel drivetrain types inside the drivetrain model block.
Figure 3.
Overview of the truck simulation model containing electric and diesel drivetrain types inside the drivetrain model block.

Figure 4.
The set acceleration for the semi-trailer truck depending on the actual velocity.
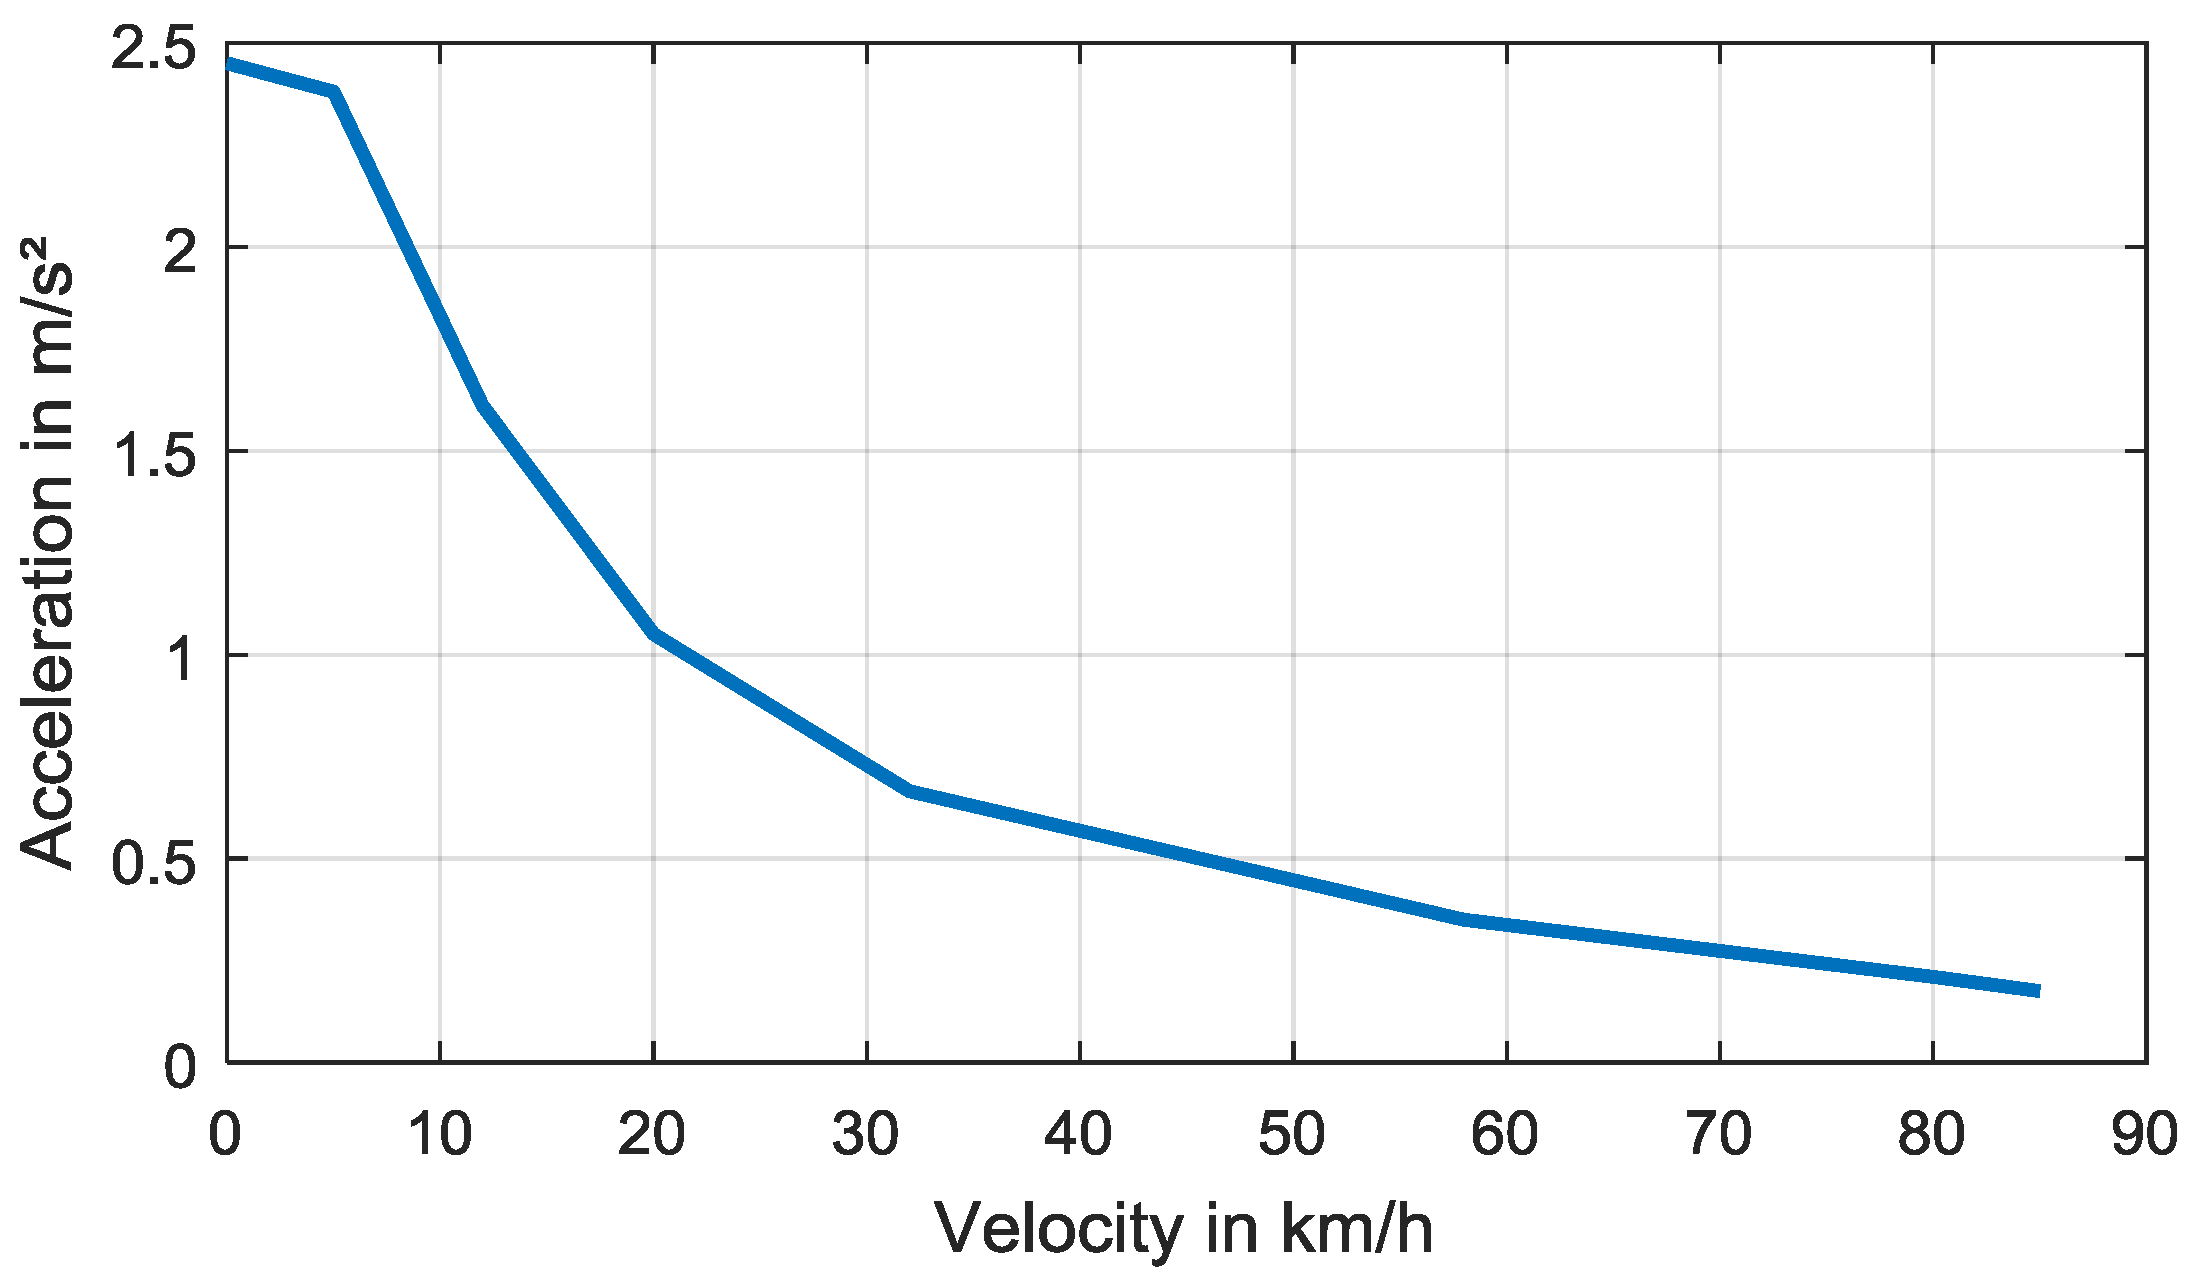
Figure 5.
Elevation profiles of German highways A2 and A8 in direction west.
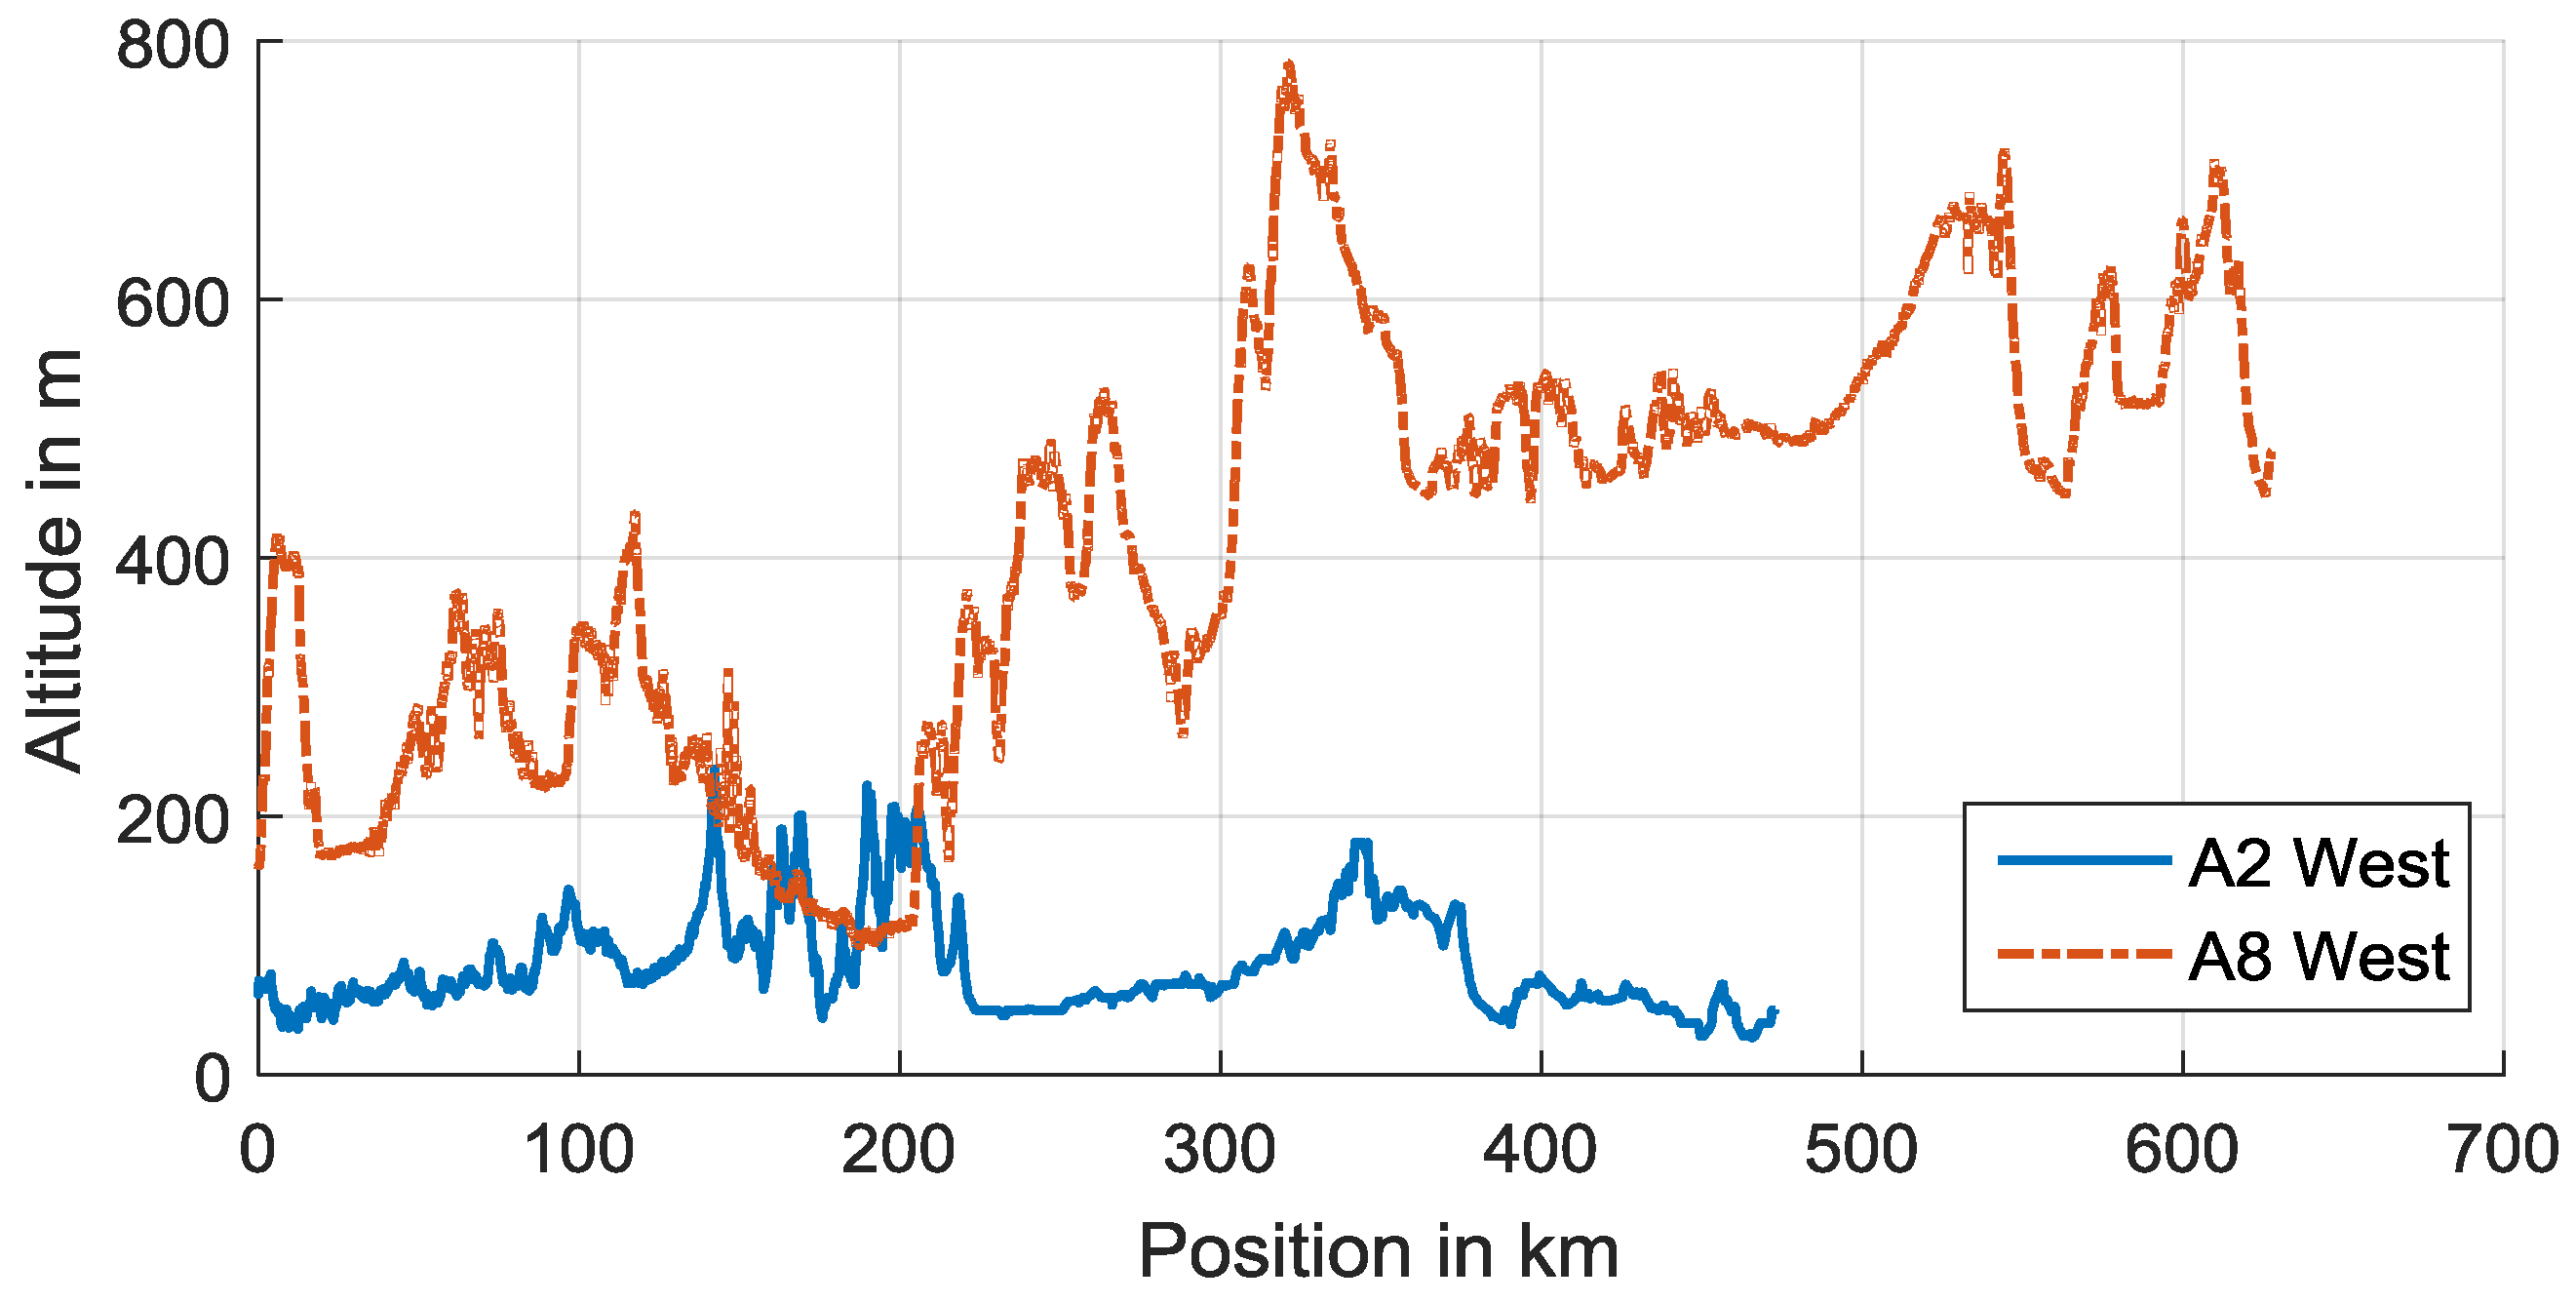
Figure 6.
The specific consumption of battery electric trucks with considered configurations on different highways.
Figure 6.
The specific consumption of battery electric trucks with considered configurations on different highways.
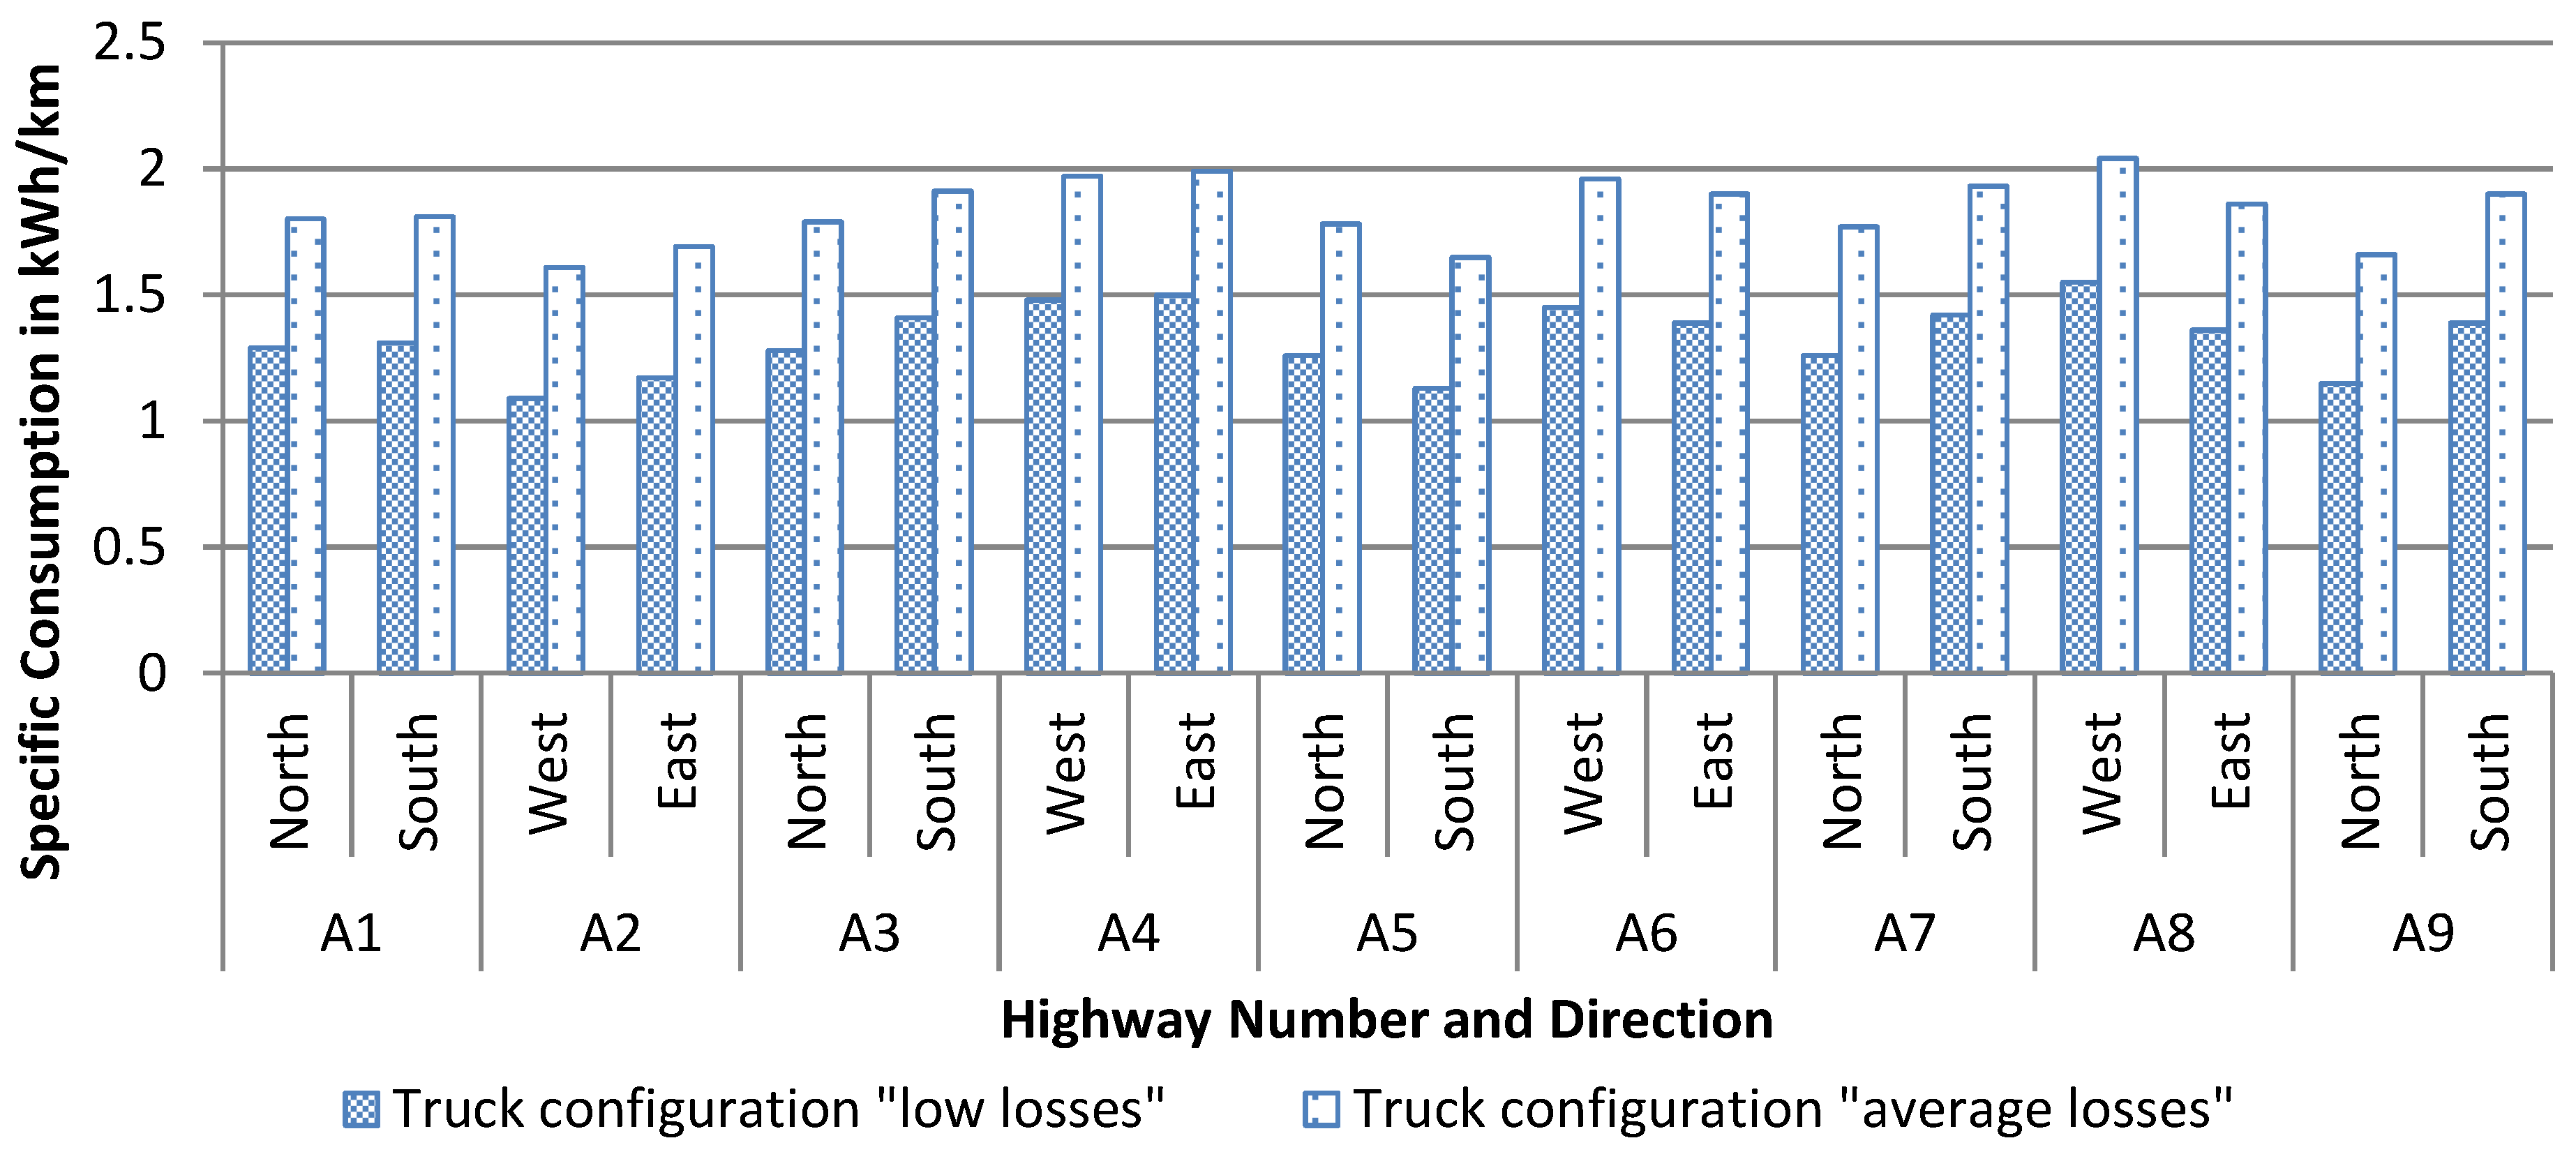
Figure 7.
The weekly driving sequence for the battery electric truck consisting of 5 daily driving sequences and charging periods (beginning is marked by flash sign).
Figure 7.
The weekly driving sequence for the battery electric truck consisting of 5 daily driving sequences and charging periods (beginning is marked by flash sign).

Figure 8.
Altitude profiles of the routes for the transportation scenarios.
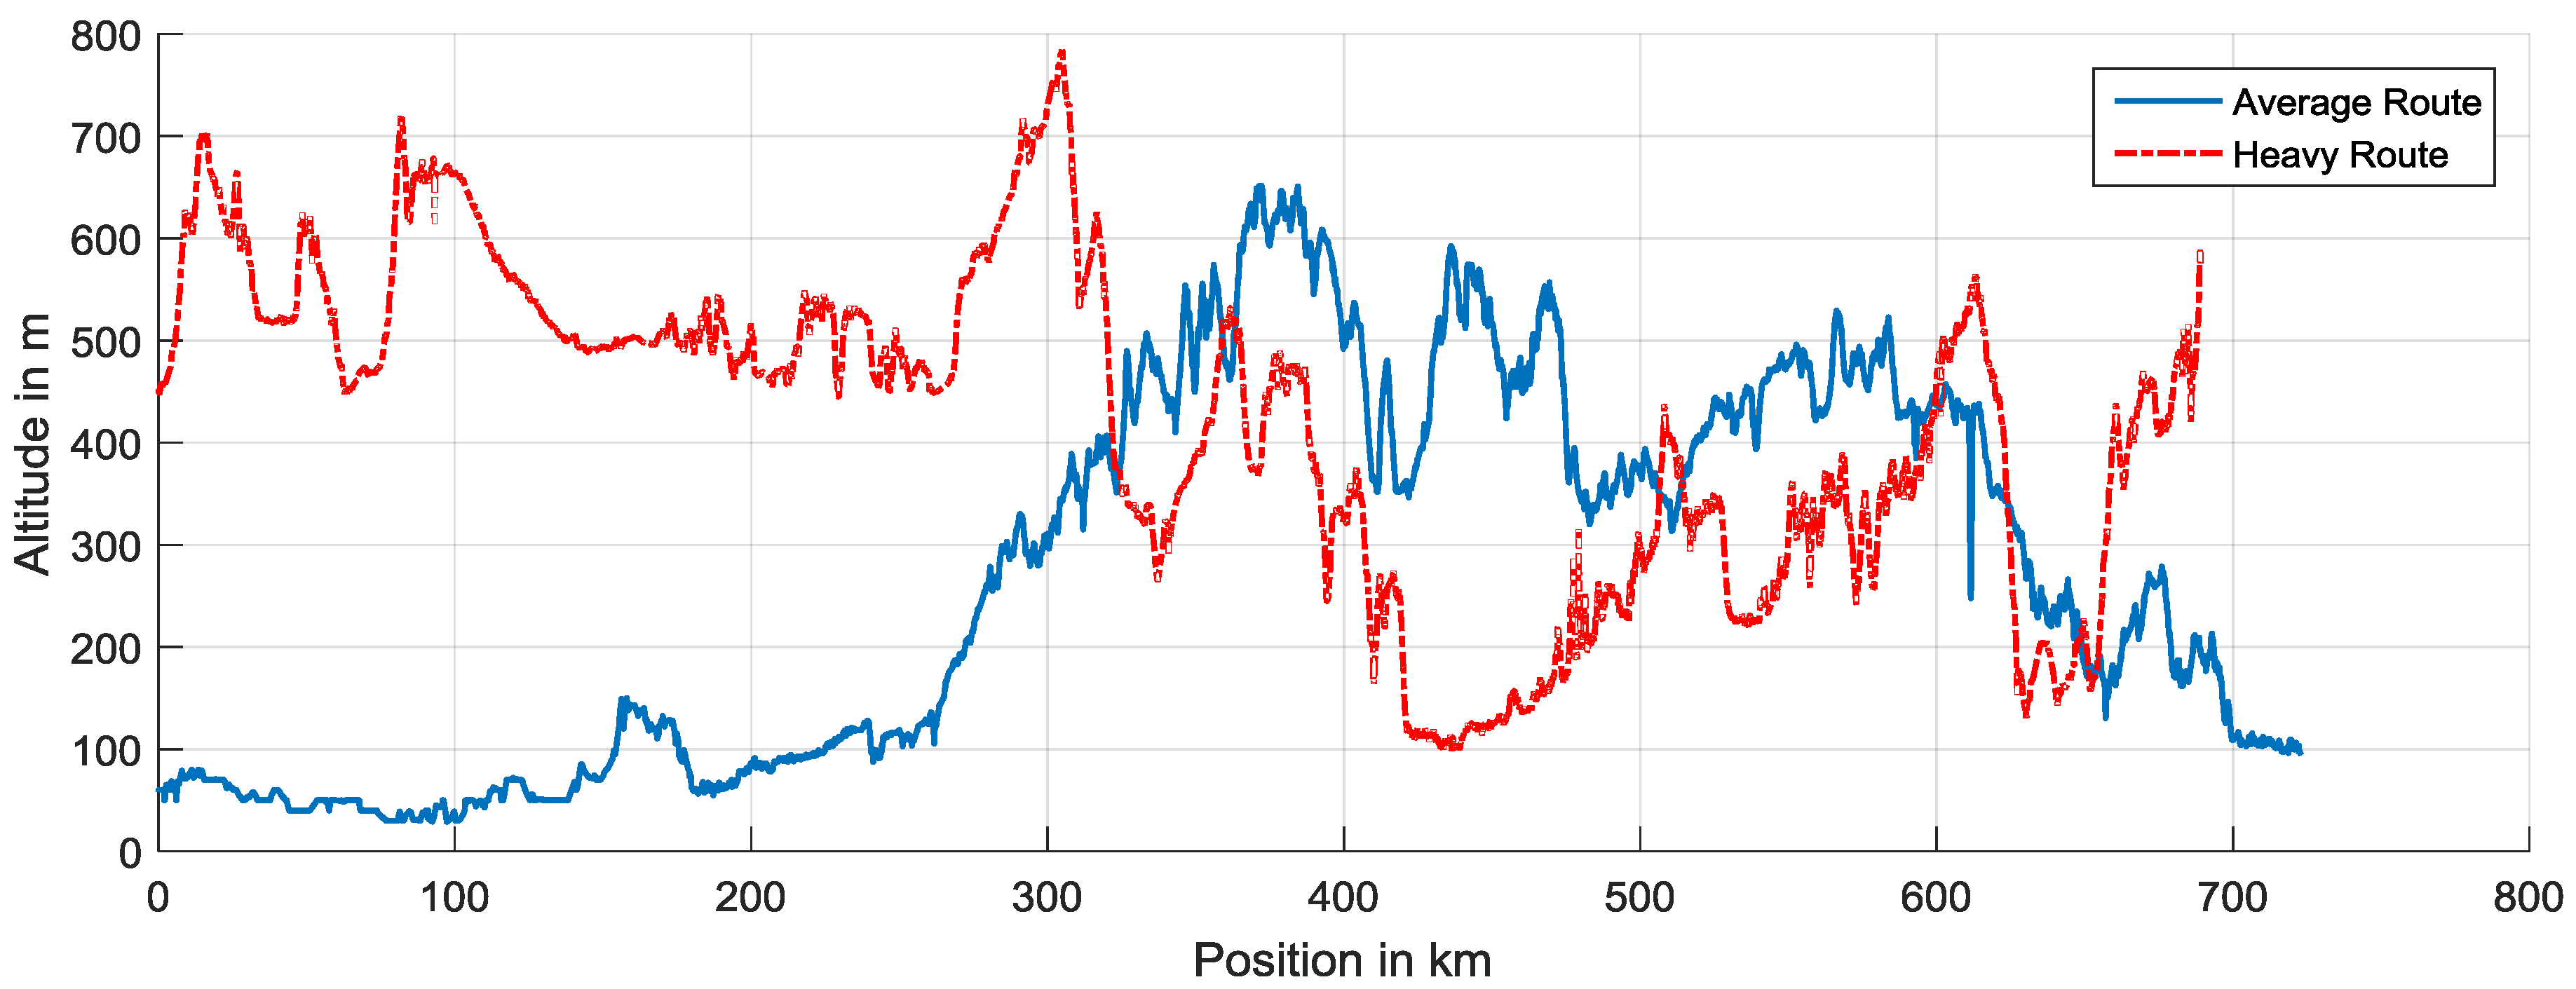
Figure 9.
Data required for the calculation of life cycle costs of a truck.

Figure 10.
Composition of life cycle costs for the battery electric truck or diesel truck.
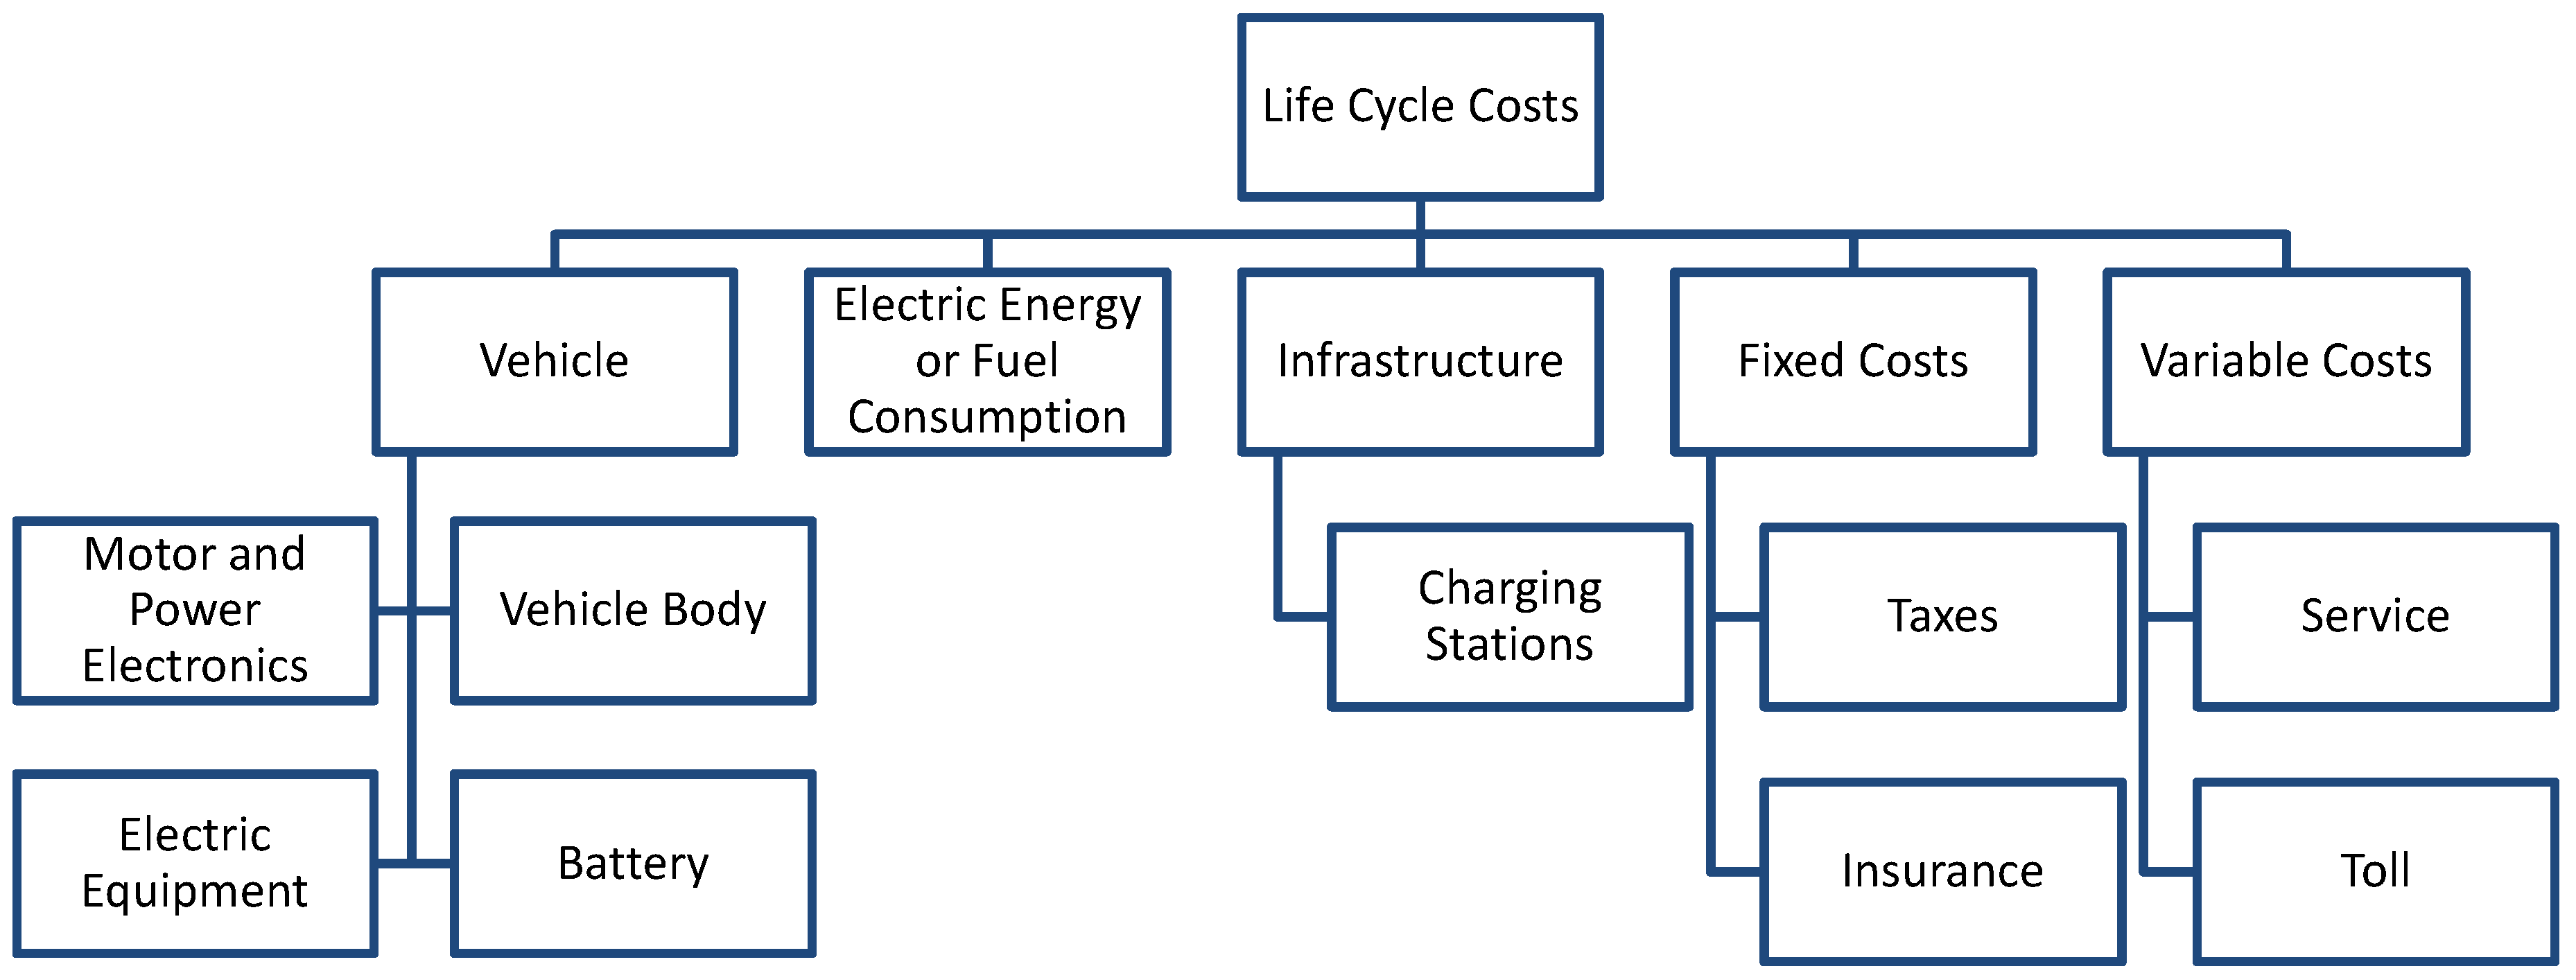
Figure 11.
Simulation results: (a) Energy consumption of battery electric truck; (b) fuel consumption of diesel truck and (c) average speed for considered transportation scenarios and truck configurations.
Figure 11.
Simulation results: (a) Energy consumption of battery electric truck; (b) fuel consumption of diesel truck and (c) average speed for considered transportation scenarios and truck configurations.

Figure 12.
(a) SOC and (b) cell temperature for a daily driving sequence; (c) cell current rates during fast charging for Scenarios 1 and 7 (identical cell types but different transportation scenarios).
Figure 12.
(a) SOC and (b) cell temperature for a daily driving sequence; (c) cell current rates during fast charging for Scenarios 1 and 7 (identical cell types but different transportation scenarios).
Figure 13.
Weight breakdown of main truck components for the diesel trucks and battery electric trucks with different traction batteries.
Figure 13.
Weight breakdown of main truck components for the diesel trucks and battery electric trucks with different traction batteries.
Figure 14.
Payload and range of the battery electric truck depending on the average energy consumption.
Figure 14.
Payload and range of the battery electric truck depending on the average energy consumption.

Figure 15.
(a) Costs composition for a particular charging station; (b) Composition of total construction costs for an average charging place equipped with 6 fast and 28 slow charging stations.
Figure 15.
(a) Costs composition for a particular charging station; (b) Composition of total construction costs for an average charging place equipped with 6 fast and 28 slow charging stations.
Figure 16.
Life cycle costs of the heavy-duty trucks in the specified scenarios related to the total mileage.
Figure 16.
Life cycle costs of the heavy-duty trucks in the specified scenarios related to the total mileage.

Figure 17.
Relative life cycle costs of a battery electric truck (BET) depending on the battery pack costs and battery lifetime d.
Figure 17.
Relative life cycle costs of a battery electric truck (BET) depending on the battery pack costs and battery lifetime d.

Table 1.
The main vehicle parameters used for the following simulations.
| Truck Configuration | Gross Weight | Air Drag Coefficient cw | Rolling Drag Coefficient croll |
|---|---|---|---|
| “low losses” | 40,000 kg | 0.48 | 0.004 |
| “average losses” | 40,000 kg | 0.63 | 0.007 |
Table 2.
Technical data of cells contained in the electric cell model and assumed costs of battery pack containing the particular cell type.
Table 2.
Technical data of cells contained in the electric cell model and assumed costs of battery pack containing the particular cell type.
| Cell Id | Cell Type | Chemistry | Nominal Capacity | Nominal Voltage | Max. Charge Current Rate | Max. Discharge Current Rate | Number of Cycles (15 °C, 1 C) | Assumed Battery Pack Costs |
|---|---|---|---|---|---|---|---|---|
| Cell 1 | High Energy (Pouch Bag Cell) | Li(NiMnCo)O2 | 10 Ah | 3.6 V | 2 C | 5 C | 7400 Cycles | 300 €/kWh |
| Cell 2 | High Energy (18650 Cell) | Li(NiMnCo)O2 | 2.15 Ah | 3.6 V | 1 C | 5 C | 500 Cycles | 200 €/kWh |
Table 3.
Transportation scenarios containing different routes.
| Transportation Scenario | Daily Route Length | Highway Sections | Payload |
|---|---|---|---|
| “average route” | 723 km | A6, A9, A10, A11 | 17.5 t |
| “heavy route” | 689 km | A8, A65, A8, A1 | 17.5 t |
Table 4.
Scenarios and main parameters considered for life cycle costs (LCC) calculation.
| Scenario Nr. | Transportation Scenario | Truck Configuration | Drivetrain | Cell Id | Battery Capacity | Truck Payload |
|---|---|---|---|---|---|---|
| 1 | “average route” | “low losses” | Electric | Cell 1 | 600 kWh | 17.5 t |
| 2 | “average route” | “low losses” | Electric | Cell 2 | 600 kWh | 17.5 t |
| 3 | “average route” | “average losses” | Electric | Cell 1 | 825 kWh | 17.5 t |
| 4 | “average route” | “average losses” | Electric | Cell 2 | 825 kWh | 17.5 t |
| 5 | “heavy route” | “low losses” | Electric | Cell 1 | 825 kWh | 17.5 t |
| 6 | “heavy route” | “low losses” | Electric | Cell 2 | 825 kWh | 17.5 t |
| 7 | “heavy route” | “average losses” | Electric | Cell 1 | 900 kWh | 17.5 t |
| 8 | “heavy route” | “average losses” | Electric | Cell 2 | 900 kWh | 17.5 t |
| 9 | “average route” | “low losses” | Diesel | - | - | 17.5 t |
| 10 | “heavy route” | “average losses” | Diesel | - | - | 17.5 t |
Table 5.
Average rest area with charging infrastructure for trucks.
| Fast Charging Stations | Slow Charging Stations | |
|---|---|---|
| Charging power Pcha per truck | 880 kW | 50 kW |
| Number of simultaneous charging events ncha | 6 | 28 |
| Required total grid connection power Prest area | 7175 kW | |
© 2017 by the authors. Licensee MDPI, Basel, Switzerland. This article is an open access article distributed under the terms and conditions of the Creative Commons Attribution (CC BY) license (http://creativecommons.org/licenses/by/4.0/).
Share and Cite
MDPI and ACS Style
Mareev, I.; Becker, J.; Sauer, D.U. Battery Dimensioning and Life Cycle Costs Analysis for a Heavy-Duty Truck Considering the Requirements of Long-Haul Transportation. Energies 2018, 11, 55. https://doi.org/10.3390/en11010055
AMA Style
Mareev I, Becker J, Sauer DU. Battery Dimensioning and Life Cycle Costs Analysis for a Heavy-Duty Truck Considering the Requirements of Long-Haul Transportation. Energies. 2018; 11(1):55. https://doi.org/10.3390/en11010055
Chicago/Turabian StyleMareev, Ivan, Jan Becker, and Dirk Uwe Sauer. 2018. "Battery Dimensioning and Life Cycle Costs Analysis for a Heavy-Duty Truck Considering the Requirements of Long-Haul Transportation" Energies 11, no. 1: 55. https://doi.org/10.3390/en11010055
Note that from the first issue of 2016, this journal uses article numbers instead of page numbers. See further details here.