An Investigation on the Efficiency Correction Method of the Turbocharger at Low Speed


1
Department of Mechanical Engineering, Korea University of Technology and Education, Chungnam 31253, Korea
2
Green Car Power System R & D Division, Korea Automotive Technology Institute, Chungnam 31214, Korea
3
R & D Center, Keyyang precision Co. LTD, Gyeongsangbuk 39537, Korea
*
Author to whom correspondence should be addressed.
Energies 2018, 11(2), 269; https://doi.org/10.3390/en11020269
Submission received: 14 December 2017
/
Revised: 12 January 2018
/
Accepted: 16 January 2018
/
Published: 23 January 2018
(This article belongs to the Section I: Energy Fundamentals and Conversion)
Abstract
:The heat transfer in the turbocharger occurs due to the temperature difference between the exhaust gas and intake air, coolant, and oil. This heat transfer causes the efficiency of the compressor and turbine to be distorted, which is known to be exacerbated during low rotational speeds. Thus, this study proposes a method to mitigate the distortion of the test result data caused by heat transfer in the turbocharger. With this method, the representative compressor temperature is defined and the heat transfer rate of the compressor is calculated by considering the effect of the oil and turbine inlet temperatures at low rotation speeds, when the cold and the hot gas test are simultaneously performed. The correction of compressor efficiency, depending on the turbine inlet temperature, was performed through both hot and cold gas tests and the results showed a maximum of 16% error prior to correction and a maximum of 3% error after the correction. In addition, it shows that it is possible to correct the efficiency distortion of the turbocharger by heat transfer by correcting to the combined turbine efficiency based on the corrected compressor efficiency.
1. Introduction
In recent years, turbocharging has become a key technology in increasing performance and fuel economy of both gasoline and diesel engines. Therefore, an accurate evaluation of turbocharger performance, and the matching and control of a turbocharger using an engine model have become more important [1,2,3,4,5,6].
Generally, the manufacturer of turbocharger supply the compressor and turbine maps. There are two main problems. One is the distortion of the efficiency of compressor and turbine due to heat transfer [2,3,7,8,9,10].
The other is the difference of the operation speed. The New European Driving Cycle (NEDC) shows that the engine operation point along the test cycle are at the lowest part load range of the engine map [3] and Schorn [5]. Serrano [7] and Nakhjiri [9] suggest increased distortion of efficiency results within about 40–50% of the maximum speed of the turbocharger. For this reason, turbocharger manufacturers provide performance map data for more than that. However, actual operation range of turbocharger includes under 40–50% of maximum speed. Therefore, the accurate compressor and turbine efficiency at low speeds are necessary.
Some studies on the effect of heat flows and the correction for the compressor efficiency have been carried out [3,6,11,12]. Luis [13] directly estimated the heat flow through the measurement of the temperature profile, and Njoya et al. [2] proposed a simple correction method based on the assumption that the real peak efficiency is on the one line. Otobe et al. [3] indicated the heat flows are mainly caused by the boundary conditions of lubricating oil, cooling water and exhaust gas. The experiments made under different conditions less than 90,000 rpm showed the effect of heat flows on the compressor and turbine efficiency becomes higher in lower speed. Lüddecke et al. [6] suggested a simple heat transfer correction model and showed the results of the corrected of the compressor and turbine efficiency by performing hot gas tests with an insulated turbocharger. The experiment was conducted under various coolant temperatures, with a fixed oil temperature of 90 °C. However, there are no direct measurements to correct the low speed performance (under 40% of the maximum rotation speed) of the turbocharger corresponding to the actual operation range of the engine.
There have been many studies to correction of the compressor efficiency and turbine overall efficiency in low rotational speed range. For these studies, mostly required detail specification and data, such as thermodynamic data, surface temperature measurement data and geometrical information. However, a simpler approach is needed in the actual experimental environment. On the other hand, the type of turbocharger (for diesel engine) and various experimental methods suggested that the use of the coolant was not essential. Therefore, it is first necessary to study the correction method depending on the oil temperature in the low rotational speed range of turbocharger. Accordingly, this study was intended to specify the various correction methods that would be relatively easy to use in the actual turbocharger manufacturing environment, and a method for distorting efficiency depending on the oil and turbine inlet temperature was proposed by a cold gas test and hot gas test.
In this study, we propose a correction method for the distortion of the compressor and turbine efficiency in the low speed range of simultaneously performing the cold gas test and the hot gas test in the low speed range and examine the validity of the correction method using the experimental results of the turbocharger manufacturer.
2. Turbine and Compressor Efficiency of the Turbocharger
The actual output power () of the compressor is transmitted from the turbine output power () and includes the loss due to the mechanical efficiency () generated in the transmission process. The relation with the output power of the isentropic turbine () is expressed by the following Equation (1):
From Equation (1), the isentropic turbine efficiency () and the mechanical efficiency of the turbocharger are defined by the turbine overall efficiency (), and the following Equation (2) is obtained:
The compressor output using the overall efficiency of the turbine is given by the following Equation (3):
The combined turbine efficiency is defined as the ratio of the actual compressor output to the ideal turbine output as shown in Equation (4):
Therefore, for accurate turbine efficiency evaluation, priority is given to low speed efficiency correction for the compressor. The compressor output is defined as the ratio of the isentropic compressor output to the isentropic compressor efficiency as follows Equation (5):
Isentropic compressor efficiency is the ratio of the work a compressor performs under the insulated condition to that of an actual compressor under normal conditions, and is expressed in the Equation (6) [3]:
Compressor efficiency is measured by the test bench, including heat flux to the compressor (), and is expressed in Equation (7):
The measured compressor efficiency is distorted due to the heat transfer to the compressor, and, in order to correct this, the following corrected compressor efficiency is introduced [3,7]:
At this time, the heat transfer is expressed by the following Equation (9):
However, the mechanical efficiency of the turbocharger is expressed as the ratio of compressor power to turbine power, as shown in the following Equation (10), or as turbine power including mechanical loss, as shown in the following Equation (11):
Compressor power and turbine power of the above Equations are expressed as the following Equations (12) and (13):
3. Test Bench and Experiment Method
In this study, Test 1 for development and Test 2 for verification were conducted for the efficiency correction method with a turbocharger of the same model. For this study, the laboratory test bench and turbocharger manufacturer’s test bench were used. The normal turbocharger test bench of manufacturer was designed for hot gas test, thus distortion of compressor efficiency at the low speed range was inevitable. Therefore, a separate device was required to conduct a cold gas test to avoid heat distortion, and, in this study, a turbocharger test bench was built to enable the utilization of cold gas test. The basic structure of the two test benches was the same as with a 2-loop hot gas stand with separate gas flow from the compressor and turbine [14]. However, the laboratory test bench used an electric heater to maintain constant turbine inlet temperature instead of the burner during a cold gas test, and compressor housing was insulated to minimize heat transfer distortion. In addition, test result compatibility of two test benches was presented to the result of compression ratio and the same rotational speed.
Test 1 is an experiment to develop an efficiency correction method using a test bench manufactured by the laboratory, and the cold gas test and hot gas test were conducted in the low rotational speed range of the turbocharger.
The lab-made test bench consisted of a piping system, a sensor system, valve control and data acquisition system, burner system and other supplementary systems as shown in Figure 1. For accurate pressure and temperature measurements, three point measurements were applied, and turbine and oil temperature were controlled using a separate oil temperature control device and cylindrical jet burner.
During the cold gas test and the hot gas test for the development of an efficiency correction method for Test 1, the compressor rotation speed was changed to 52,000 rpm (0.26 ), 74,000 rpm (0.37 ) and 98,000 rpm (0.5 ). In the cold gas test at the compressor rotation speed of 74,000 rpm, the oil temperature was adjusted to 38 °C, 62 °C, and 93 °C. The turbine inlet temperature during the cold gas test was controlled to about 40 °C and the turbine inlet temperature during the hot gas test was maintained at about 600 °C.
The oil flow rate in the test was further calibrated by referring to the oil flow rate measurement results of the turbocharger manufacturer. In addition, using a hot gas test bench of Figure 2 carried out by the turbocharger manufacturer. The experimental condition of Test 1 shown in Table 1.
Test 2 was conducted for the application and verification of the efficiency correction method using the hot gas test bench of the turbocharger manufacturer. At this time, the compressor rotation speed was changed to 50,000 rpm, 60,000 rpm and 70,000 rpm, and the turbine inlet temperature was varied from 300 °C to 600 °C, and the compressor efficiency correction method was applied to the test results. In addition, the accuracy of the efficiency correction method was verified by comparing the results of the cold gas test using the laboratory test bench. The experiment conditions of test 2 as shown in Table 2.
The test turbocharger was a waste gate turbocharger (WGT) for a 2-L gasoline engine. The turbocharger housing was insulated to prevent heat loss and efficiency distortion. At this time, the coolant was not supplied to the turbocharger. The test turbocharger specification as shown in Table 3.
4. Result Analysis and Efficiency Correction (Test 1)
4.1. Effects of Temperature Changes from Oil and Turbine Inlet
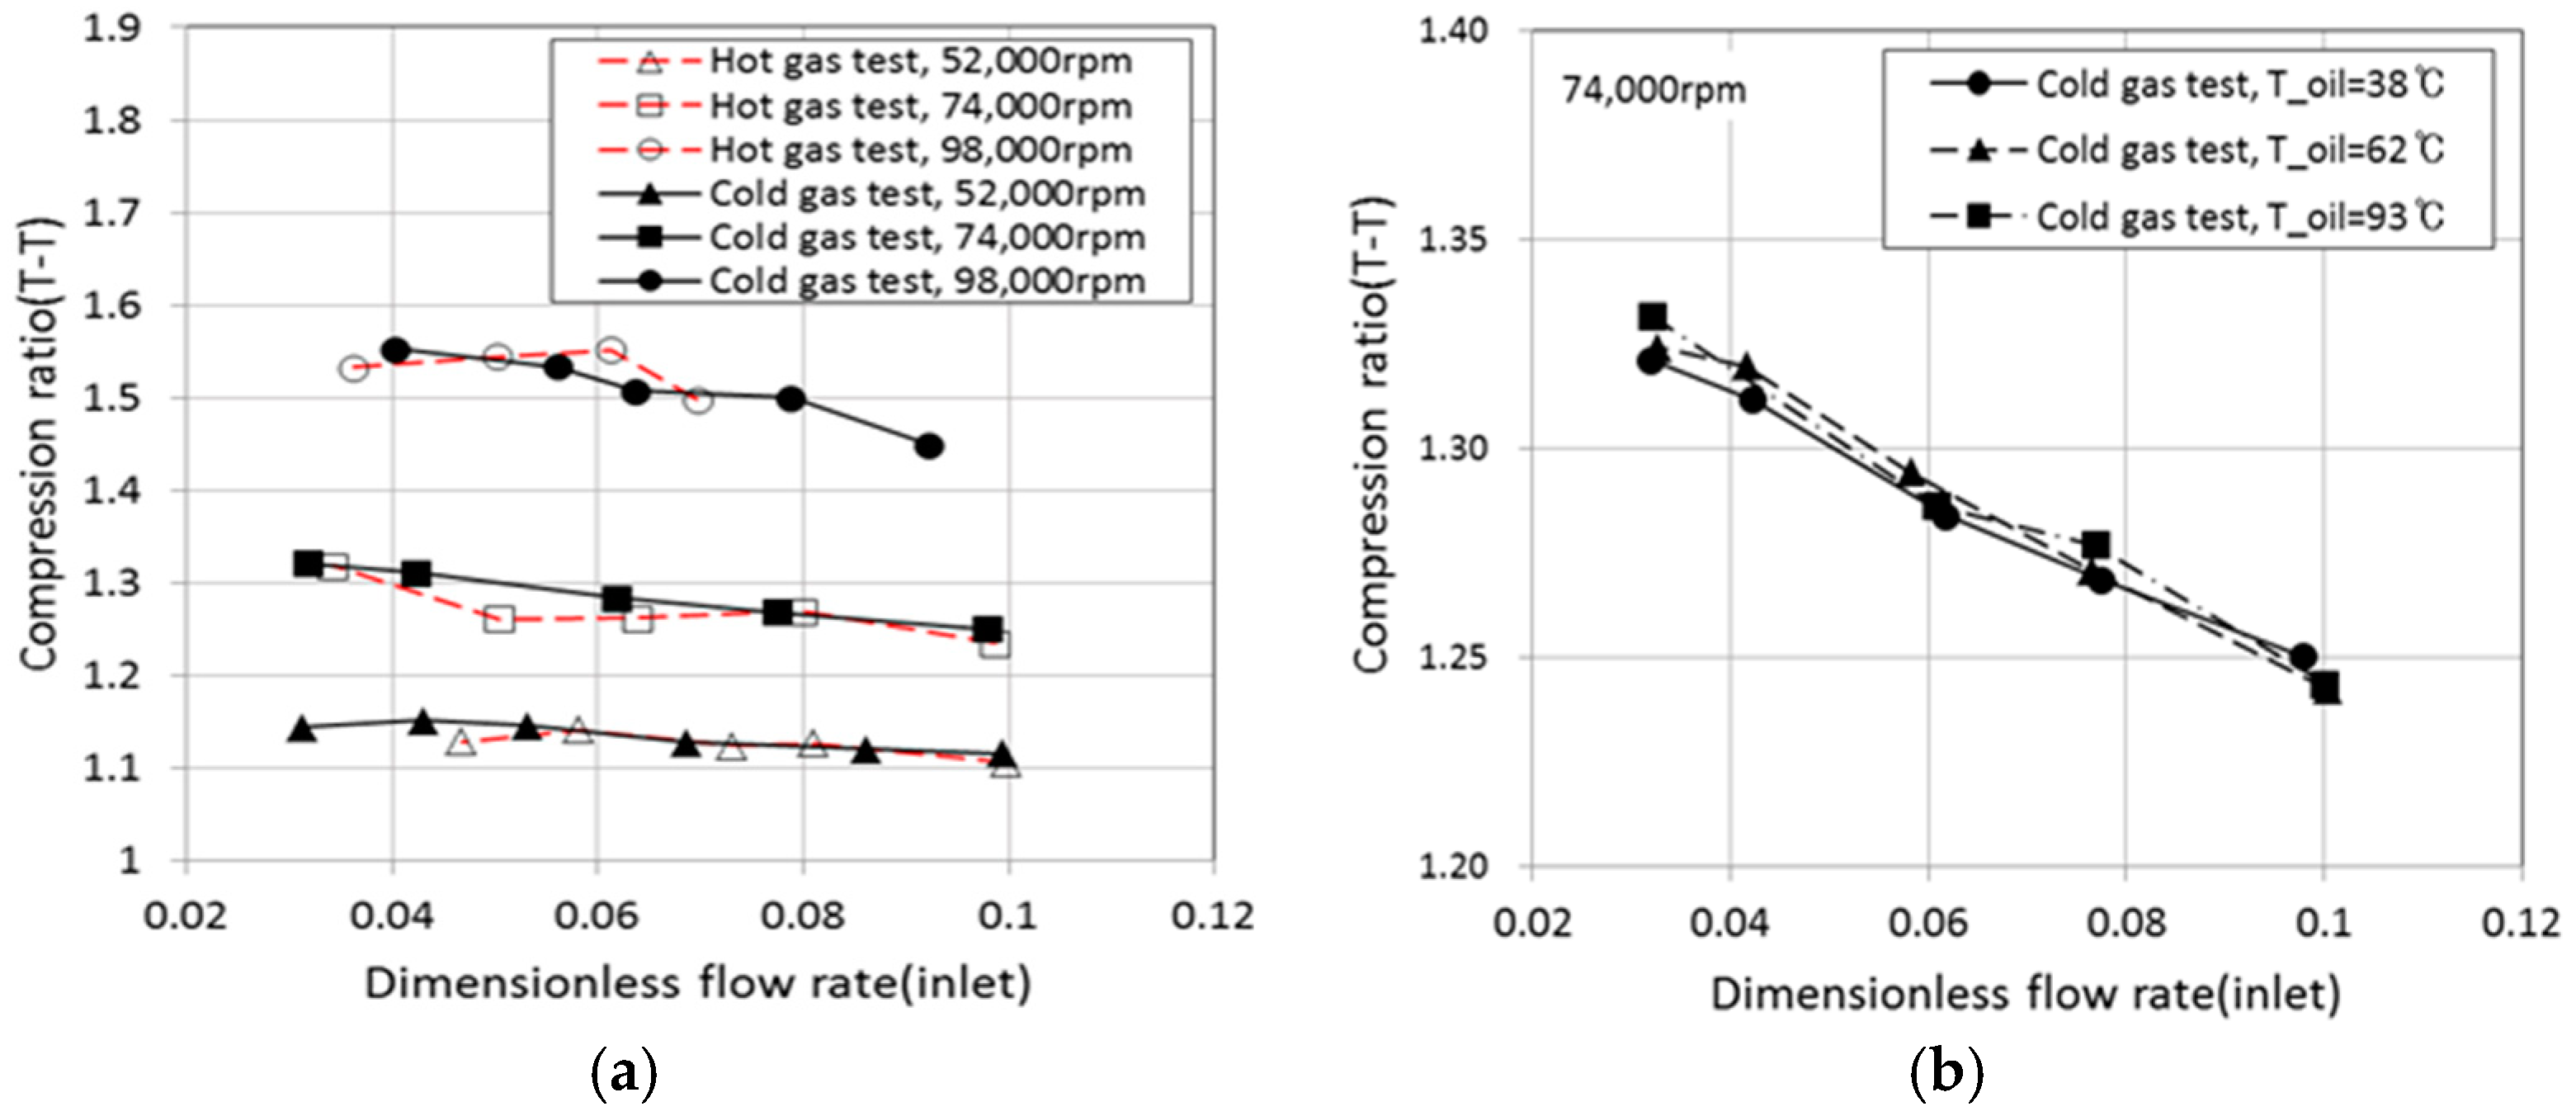
Figure 2 shows the compression pressure ratio results by measuring the changes in temperatures of both the turbine inlet and the oil. As seen below, the compression pressure ratio was not significantly affected by these changes. The result is identical to the findings of previous studies [3,8].
Figure 3 shows the compressor efficiency results by measuring the changes in temperatures of both the turbine inlet and the oil.
In addition, the average amount of change in compressor efficiency, as shown in Figure 3a, is higher during lower rotational speeds of the compressor, from 16% at 52,000 rpm to 9% at 74,000 rpm and 5% at 98,000 rpm. Both (a) and (b) of the results of Figure 3 show that the compressor efficiency value decreased when the oil and turbine inlet temperatures were increased. This is because of the distortion effect, which indicates a decrease in efficiency. This can be explained in Equation (7), in which the denominator increases due to the heat transfer outside of the compressor. Therefore, in order to estimate the corrected compressor efficiency, it is necessary to calculate the heat transfer to the compressor.
4.2. Calculation of the Heat Transfer to the Compressor
Various heat transfer phenomena occur in the turbocharger. There are conduction, convection, and radiation between air, gas, oil, water, shaft, and housing. In general, the effect of conduction of oil and water is dominant, radiation and outer convection effects are small.
In this study, the insulated turbocharger without the cooling water was used in the experiment. Therefore, a simple heat transfer model, which considered only the conduction between the compressor and oil and gas was introduced as shown in Equation (14). Coefficients and are values related with the heat conduction including the geometrical data and thermal conductivity of oil and exhaust gas, respectively, as shown in Equation (15). The representative temperature of compressor is the algebraic average of the inlet and outlet temperature of air:
4.3. Correction of Compressor Efficiency (Test 1)
The coefficients and of the Equations (14) and (15) were determined to minimize differences when the compressor efficiency was corrected. At this time, the reference temperature was set at 38 °C, where the heat transfer from oil is the lowest.
The values 1.0 and 0.25 were selected as and through many calculations based on experiment results. The coefficients and Equations (14) and (15) were determined to minimize differences when the compressor efficiency was corrected. Therefore, in the cold gas test, it is necessary to set the oil temperature to minimize the heat transfer inside the turbocharger.
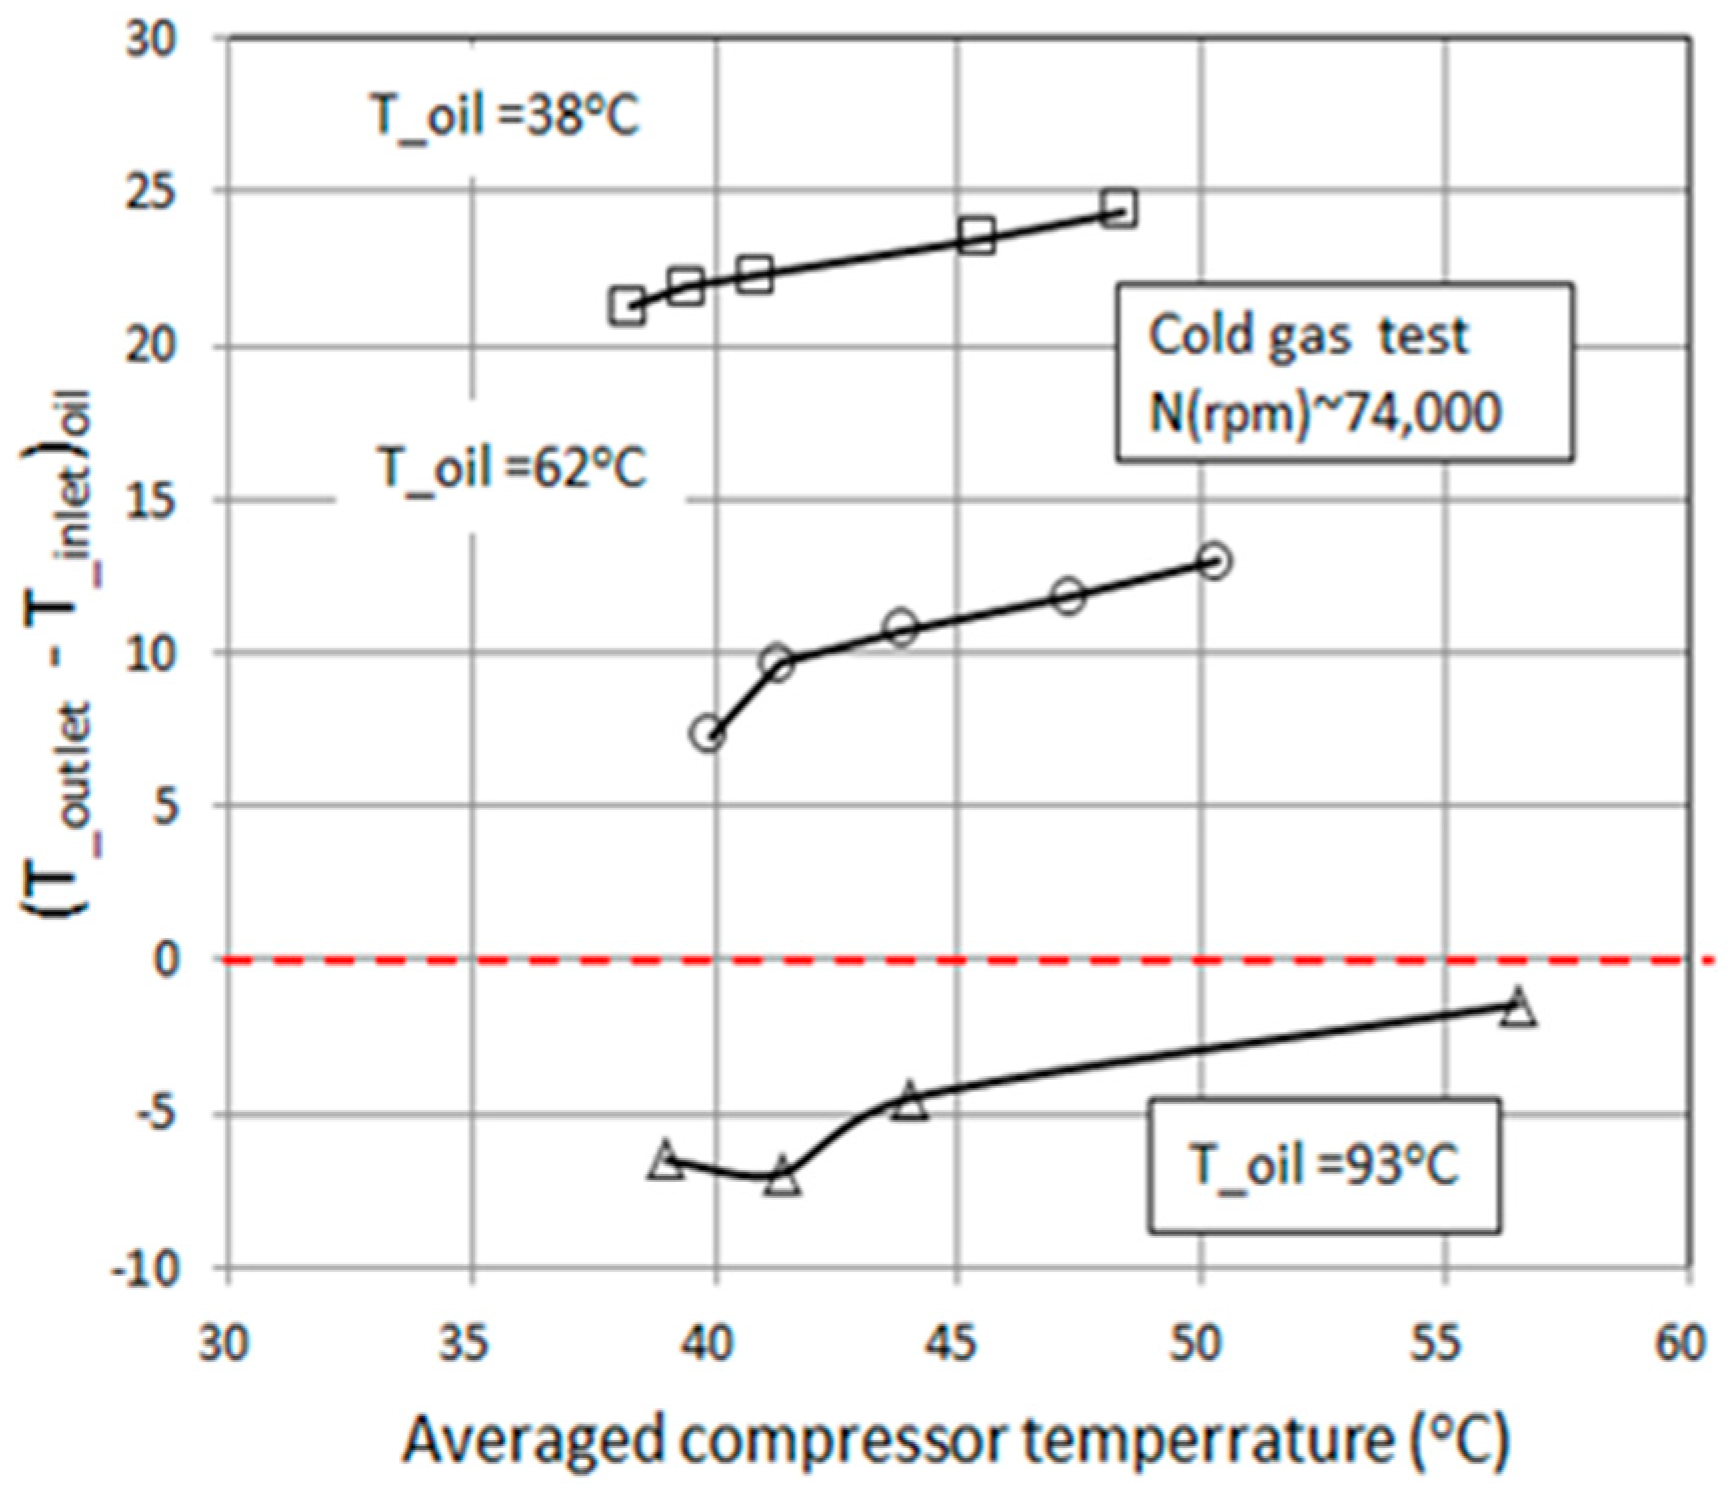
Figure 4 shows the relationship between the oil inlet and outlet temperatures and the compressor average temperature for the three conditions of 38, 62, and 93 °C in a 74,000 rpm cold gas test.
As shown in the figure, as the oil temperature increases, the oil inlet/outlet difference is decreasing. When the oil temperature is 93 °C, it can be seen that a distortion phenomenon occurs in which the oil outlet temperature becomes lower than the oil inlet temperature.
In principle, if there is no internal heat transfer, the temperature must be higher at the outlet temperature depending on the friction of the compressor shafts, and, therefore, too high an oil temperature in a cold gas test can lead to heat transfer to the compressor or turbine side.
On the other hand, Figure 5 shows the compressor average temperature and turbine shear temperature in the experiment corresponding to the turbocharger rotation speed corresponding to the condition of less than 40% of the maximum rotational speed, which is the range of thermal distortion shown in the references, suggests a result of 38 °C. From the above analysis, a method was proposed to correct the compressor efficiency during cold gas testing by setting the standard value of the oil temperature to 38 °C.
The values 1.0 and 0.25 were selected as and through many calculations based on experiment results using the least square method.
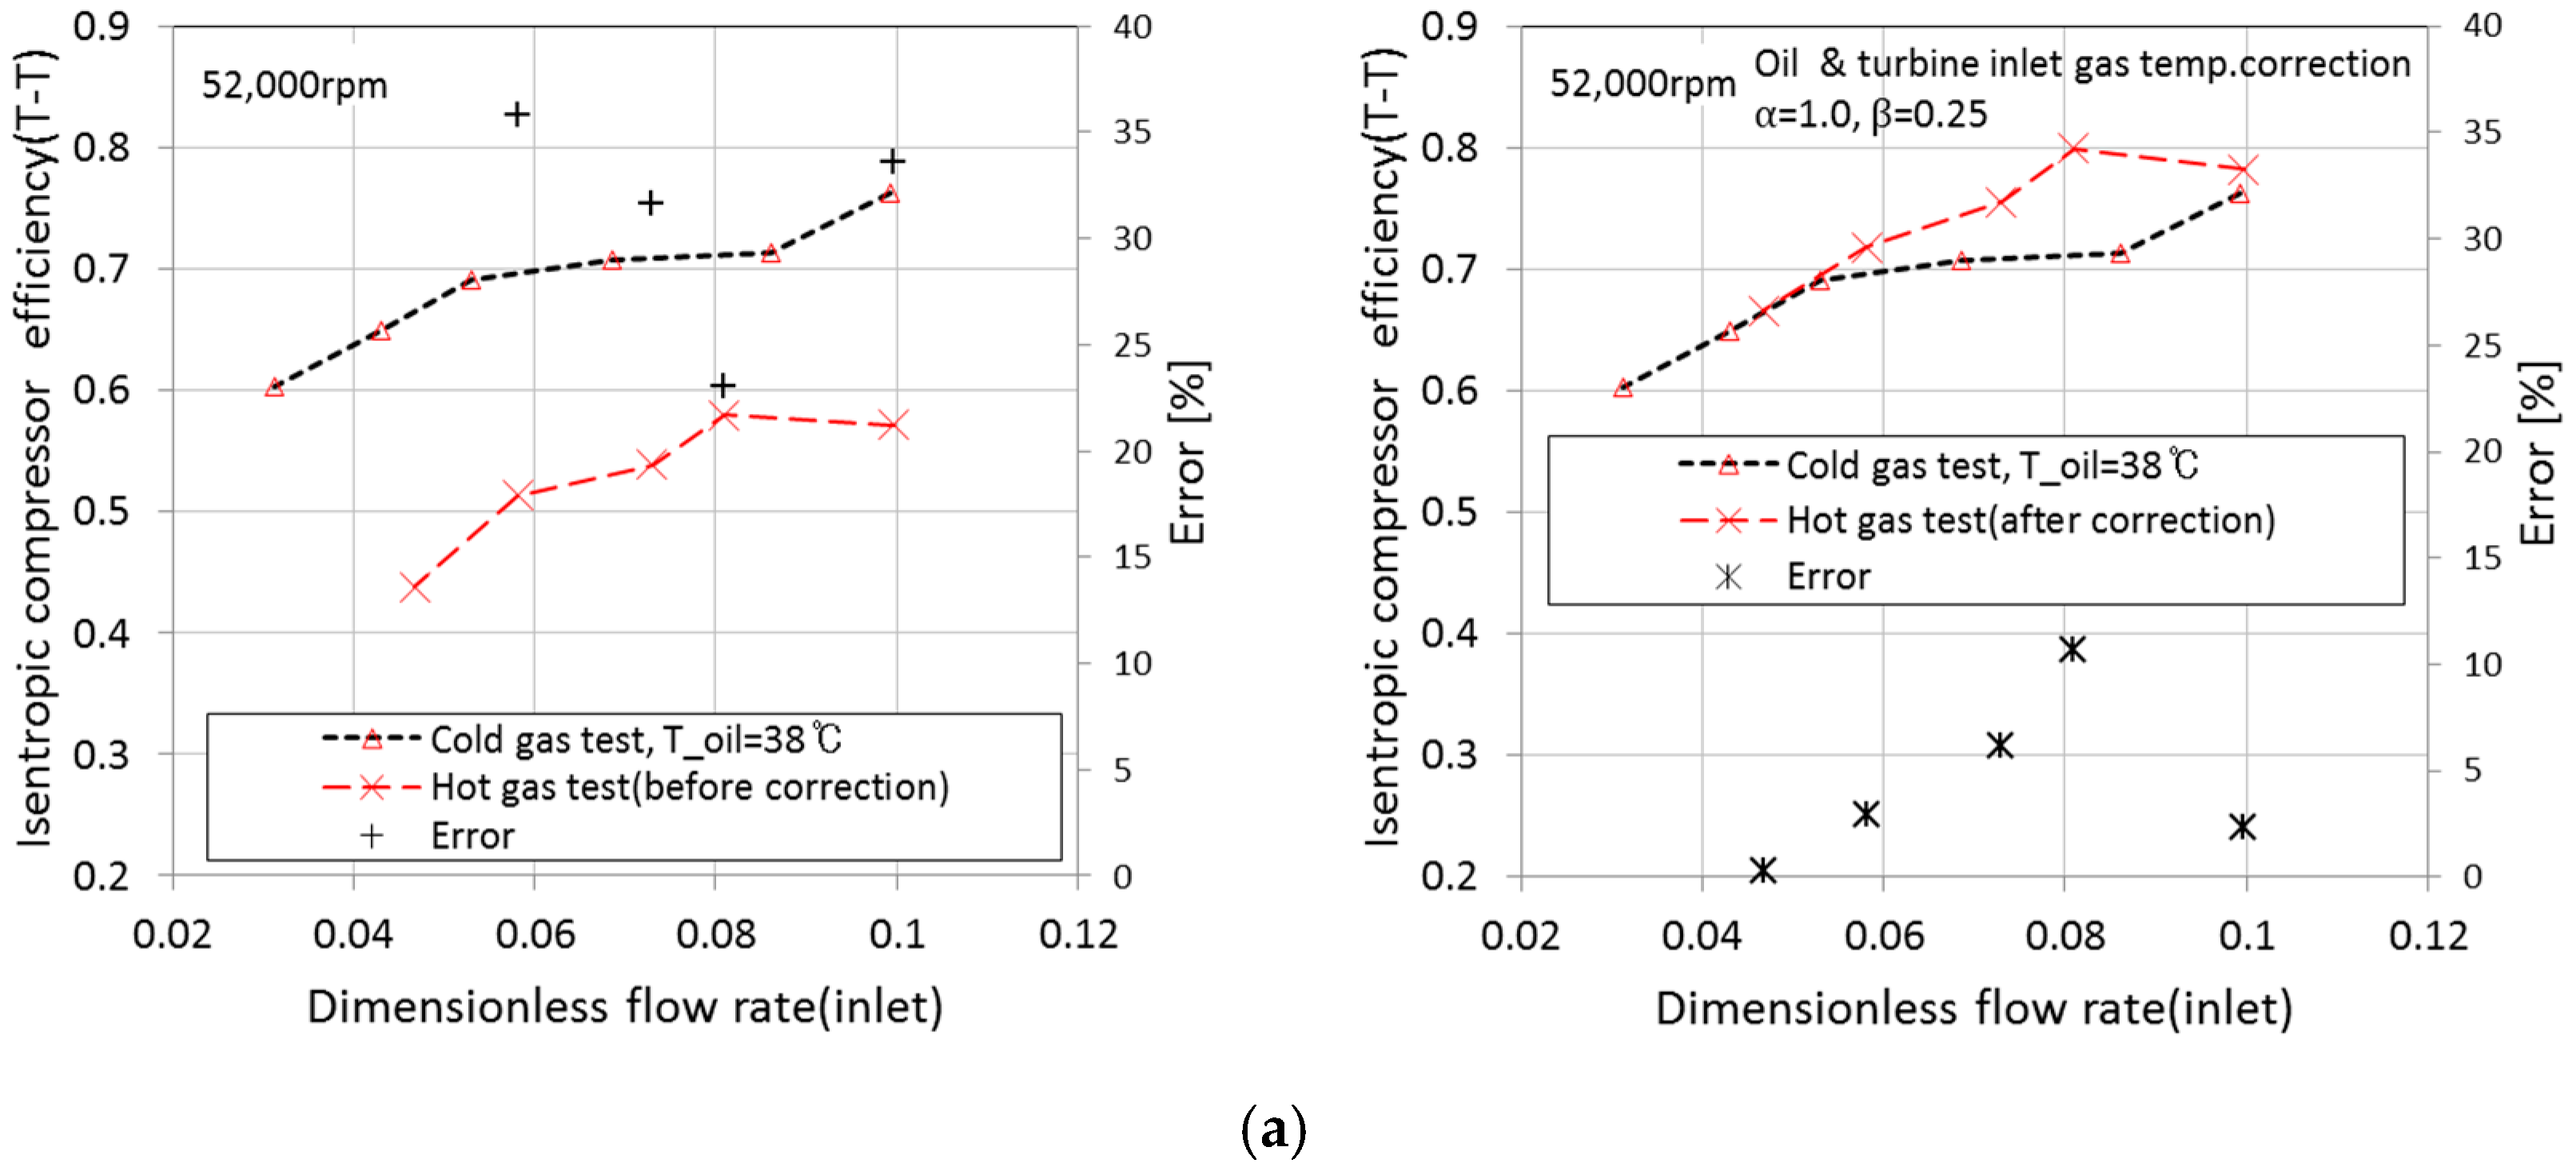
Figure 4 and Figure 5 show the efficiency correction results, according to oil temperature and turbine inlet temperature using the above coefficients. It can be confirmed that the error in efficiency between the results of the hot gas test and the results of the cold gas test in all experiment rotational speed conditions are reduced compared to the efficiency before correction shown in Figure 4.
The errors of the compressor efficiency due to the change of the oil temperature and the inlet temperature of the turbine based on the cold gas test (oil temperature 38 °C) were decreased from 6.0% to 1.7% (averaged value) and 18% to 3% (averaged value), and the underestimated compressor efficiency was corrected as you can see.
Figure 6 and Figure 7 shows the efficiency correction result, according to oil temperature and turbine inlet temperature using the above coefficients. It can be confirmed that the error in efficiency between the result of the hot gas test and the result of the cold gas test in all experiment rotational speed conditions are reduced compared to the efficiency before correction shown in Figure 3.
In particular, the result shows that the correction accuracy of efficiency improves as the rotation speed becomes relatively high. In addition, it was judged that there was no distortion of the correct result, which did not cause a large difference from the pre-correction efficiency at the oil temperature of 38 °C, as in setting the coefficient according to the temperature of the oil.
4.4. Verification of Compressor Efficiency Correction (Test 2)
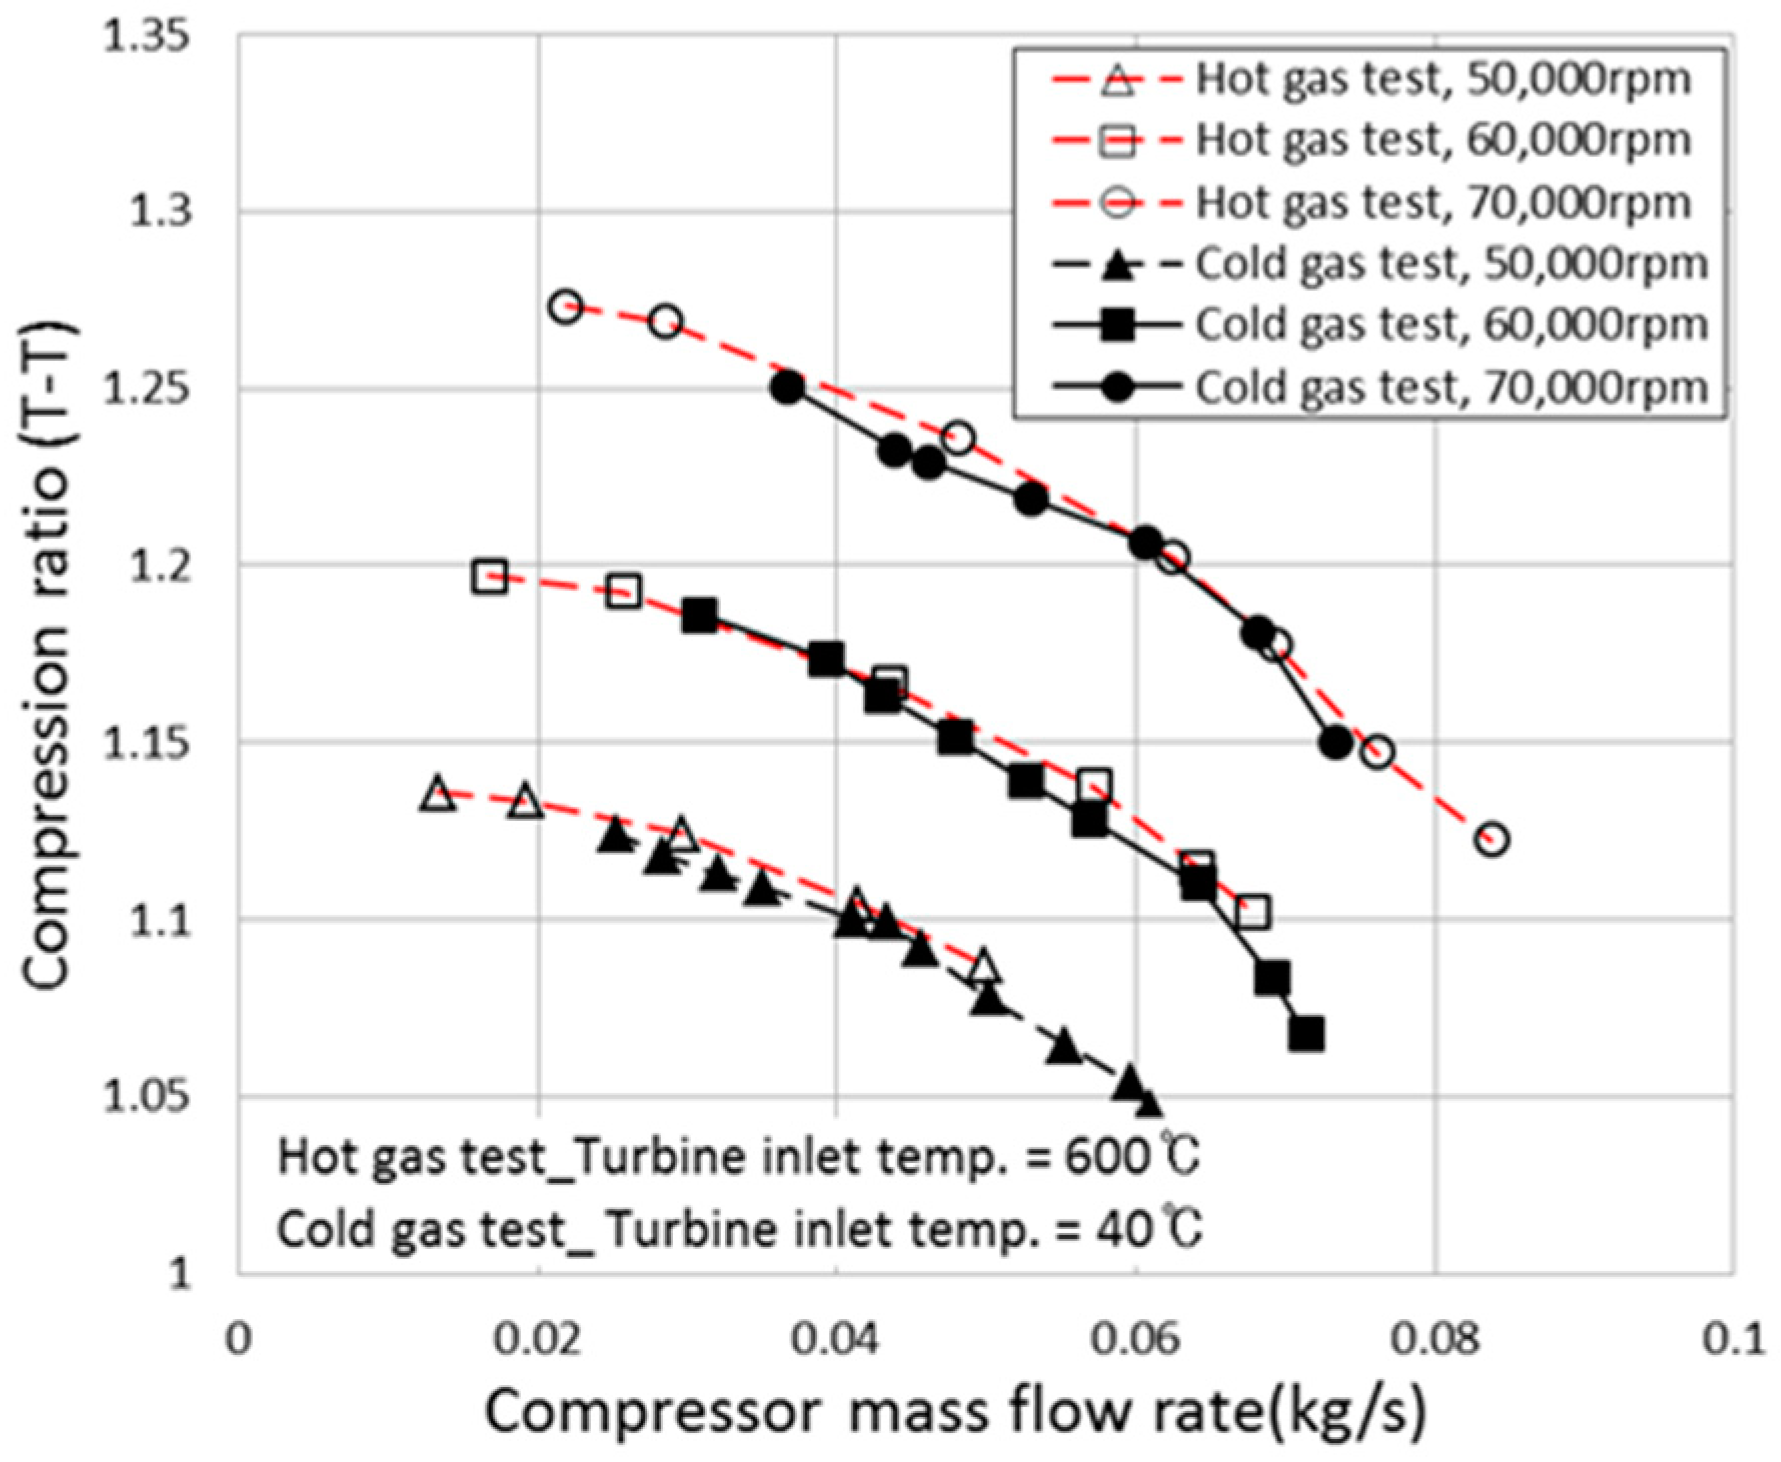
Compression pressure ratios were compared between the hot gas test of the turbocharger manufacturer and the cold gas test results of this laboratory to confirm the validity of the compressor efficiency. As shown in Figure 8, it can be confirmed that it was performed under relatively similar conditions.
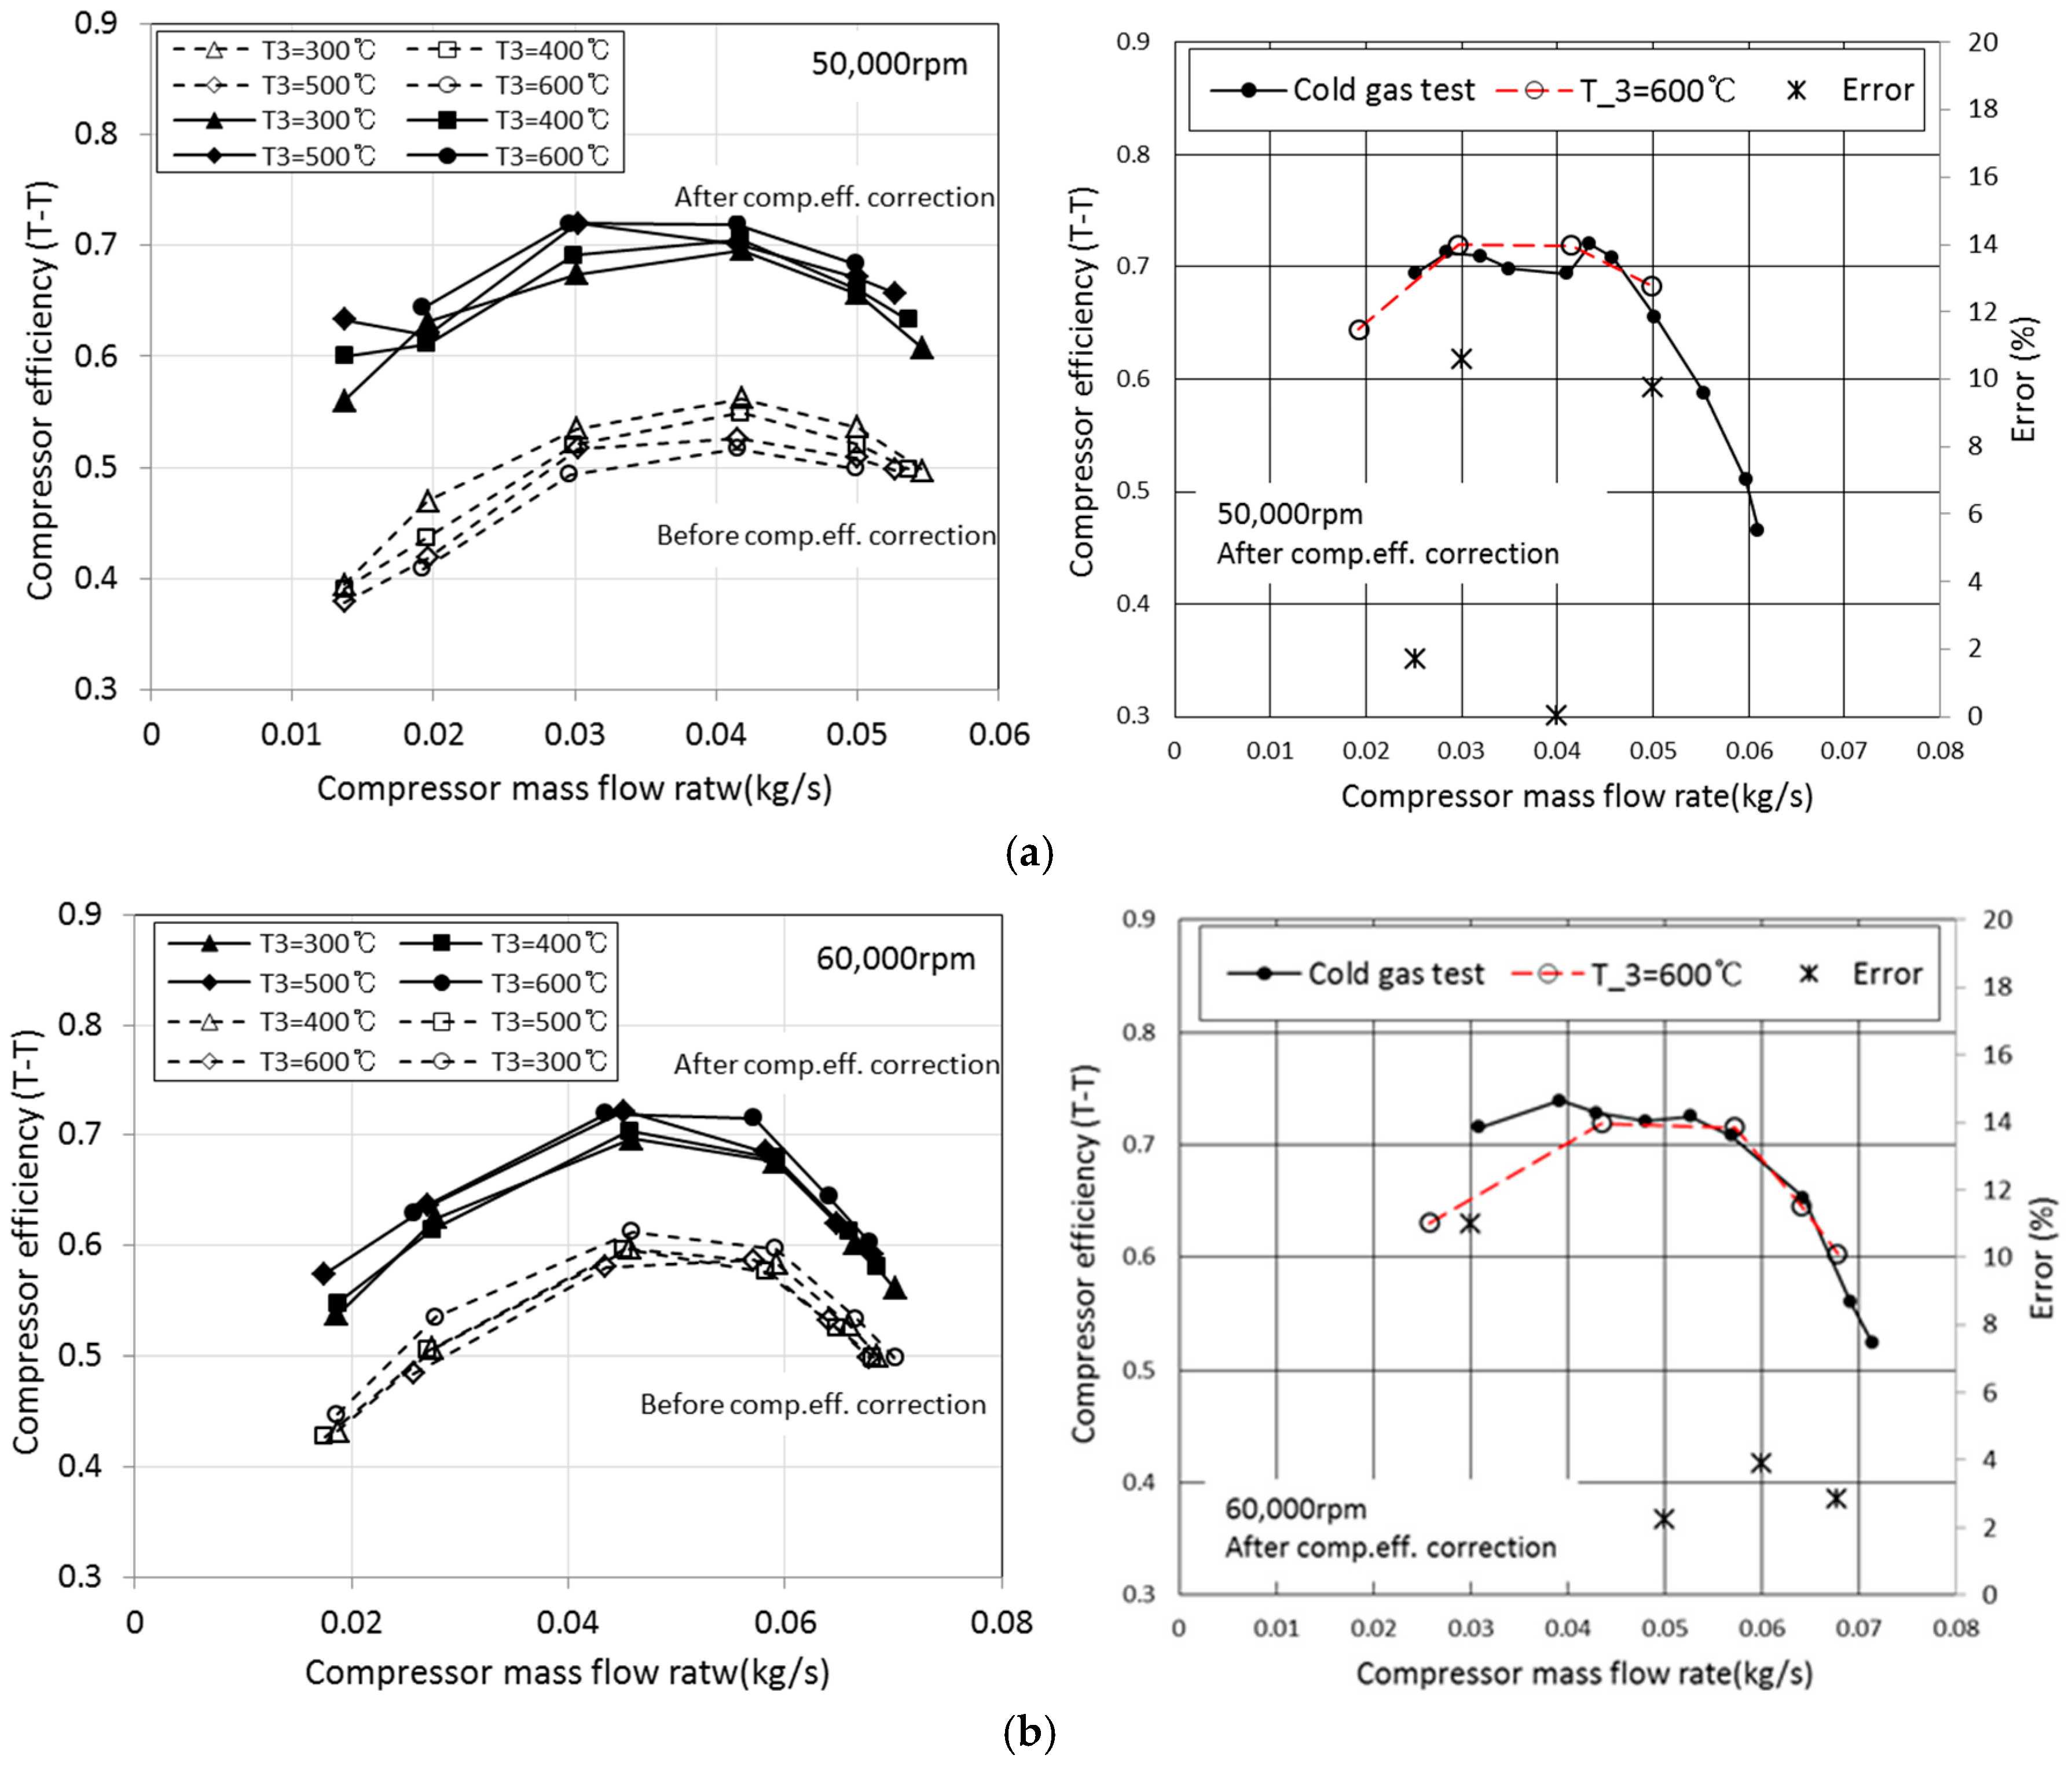
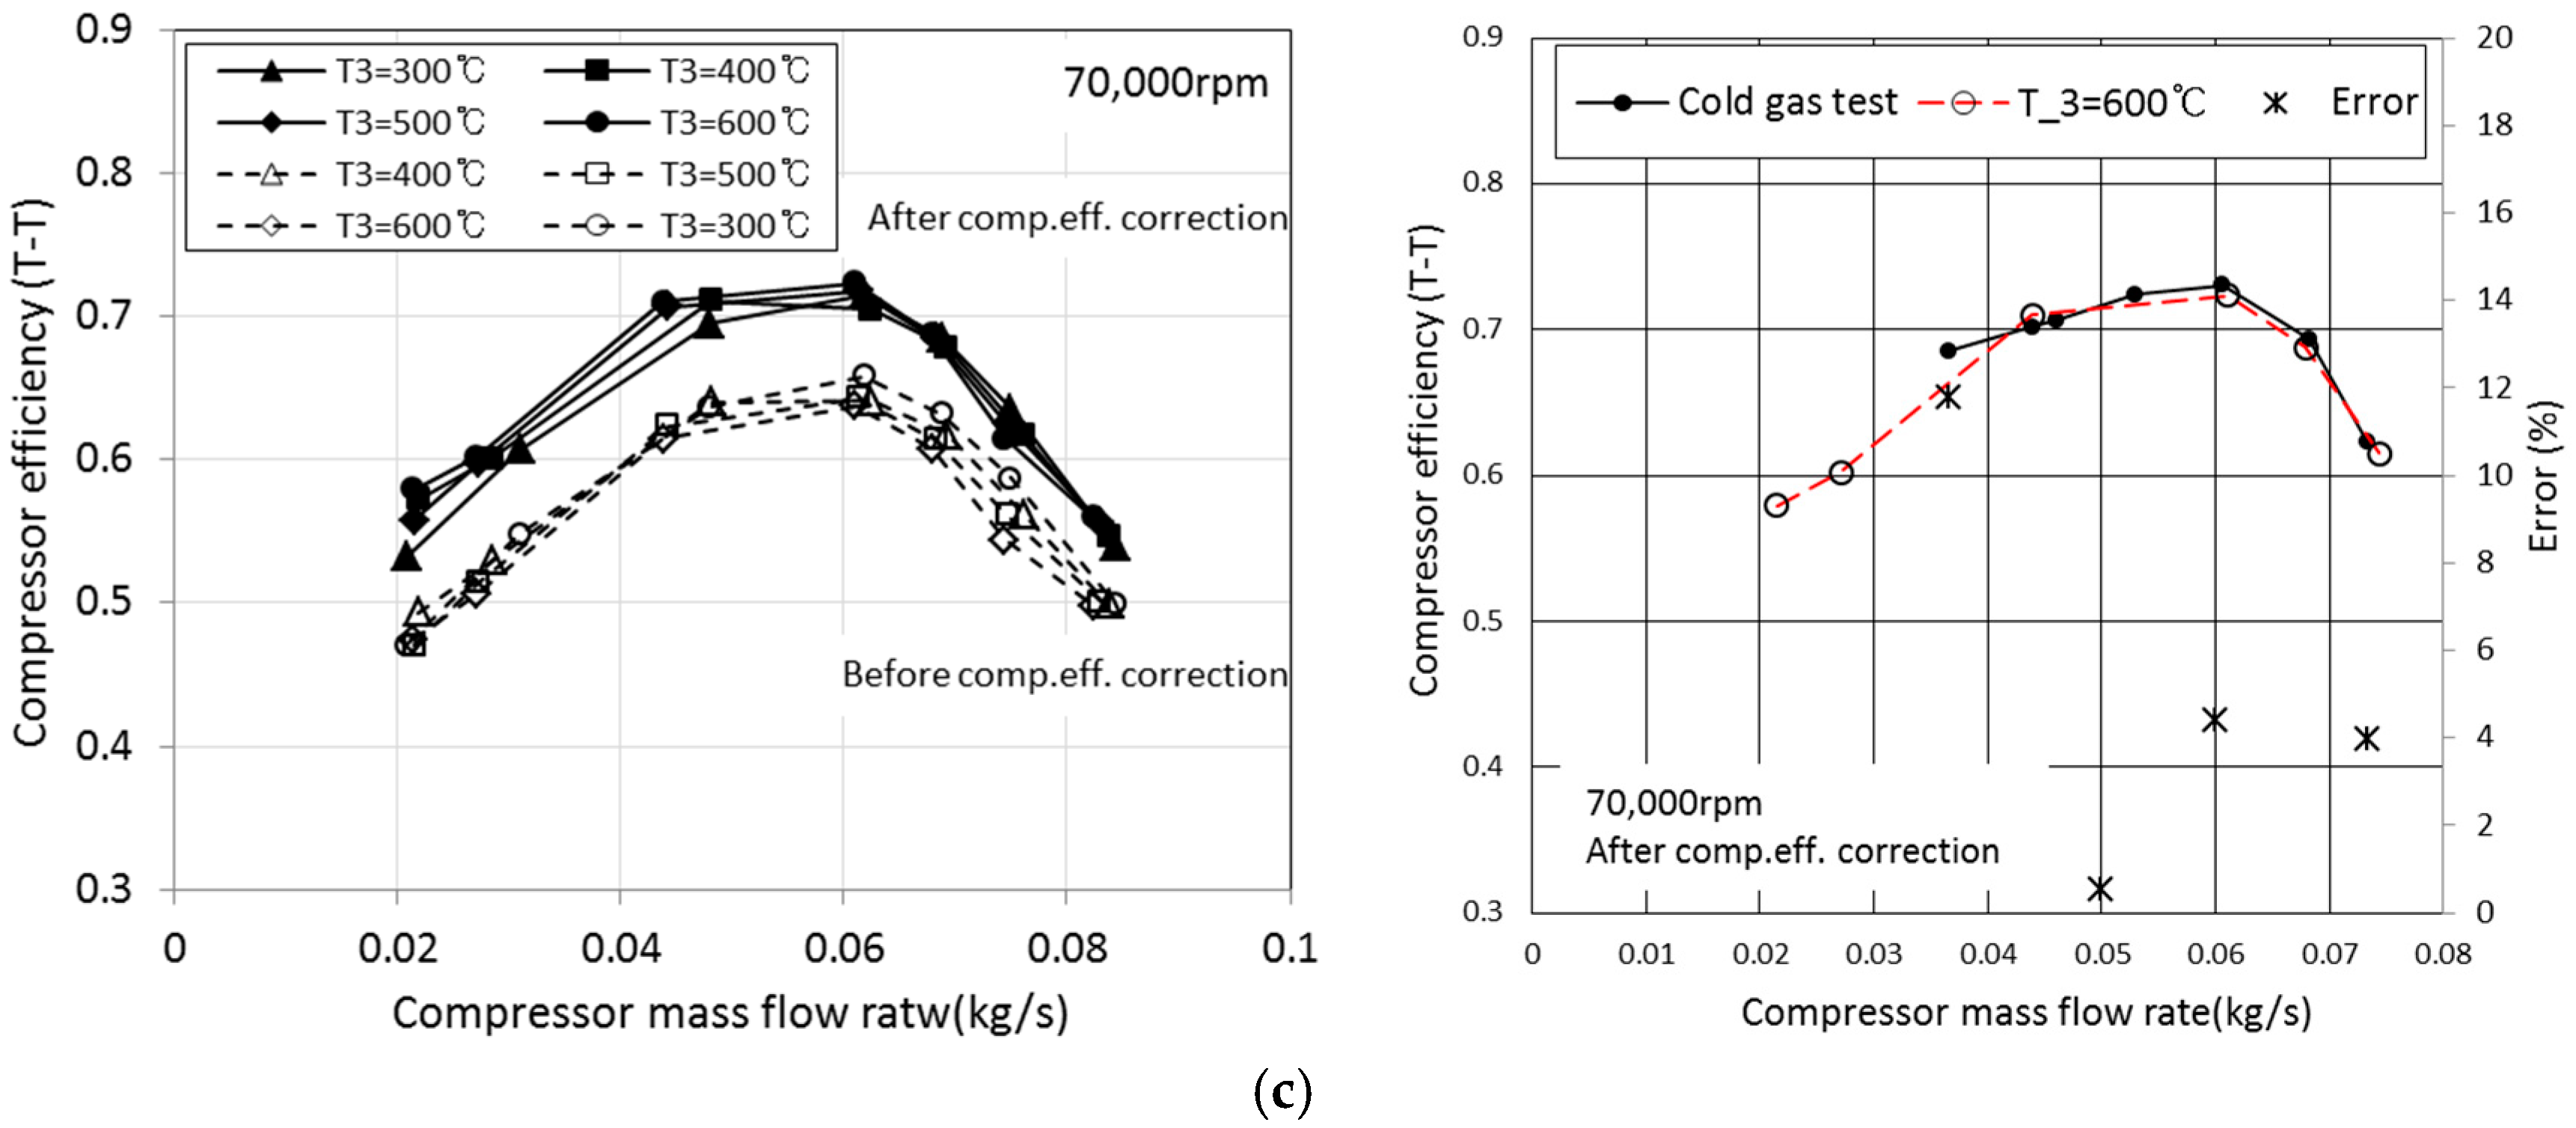
The results of applying the compressor efficiency correction method to the manufacturer’s experiment results are shown in Figure 9.
In the case before the efficiency correction of the compressor, the efficiency tends to be lower as the rotation speed of the compressor is lower, and, at the same time, the deviation is deepened between the compressor efficiency depending on the turbine inlet temperature. However, after the compressor has been corrected, it can be seen that the deviation between the efficiency of the compressor corresponding to the turbine inlet temperature even in the low speed section is reduced, the efficiency is increased and the underestimation is corrected.
In order to verify the efficiency correction of the compressor, we compare the laboratory cold gas test results with the manufacturer’s corrected hot gas test results and shown in Figure 9.
As can be seen from the following results, we can see that the cold gas test results, minimizing distortion due to heat transfer and the manufacturer’s correction results are relatively in good agreement within the maximum error of 11%.
4.5. Verification of Turbine Efficiency Correction
Turbine efficiency is evaluated through isentropic turbine efficiency and combined turbine efficiency. However, the isentropic efficiency is calculated as the temperature before and after the turbine, and the distortion due to the heat transfer limits the accuracy of the efficiency evaluation.
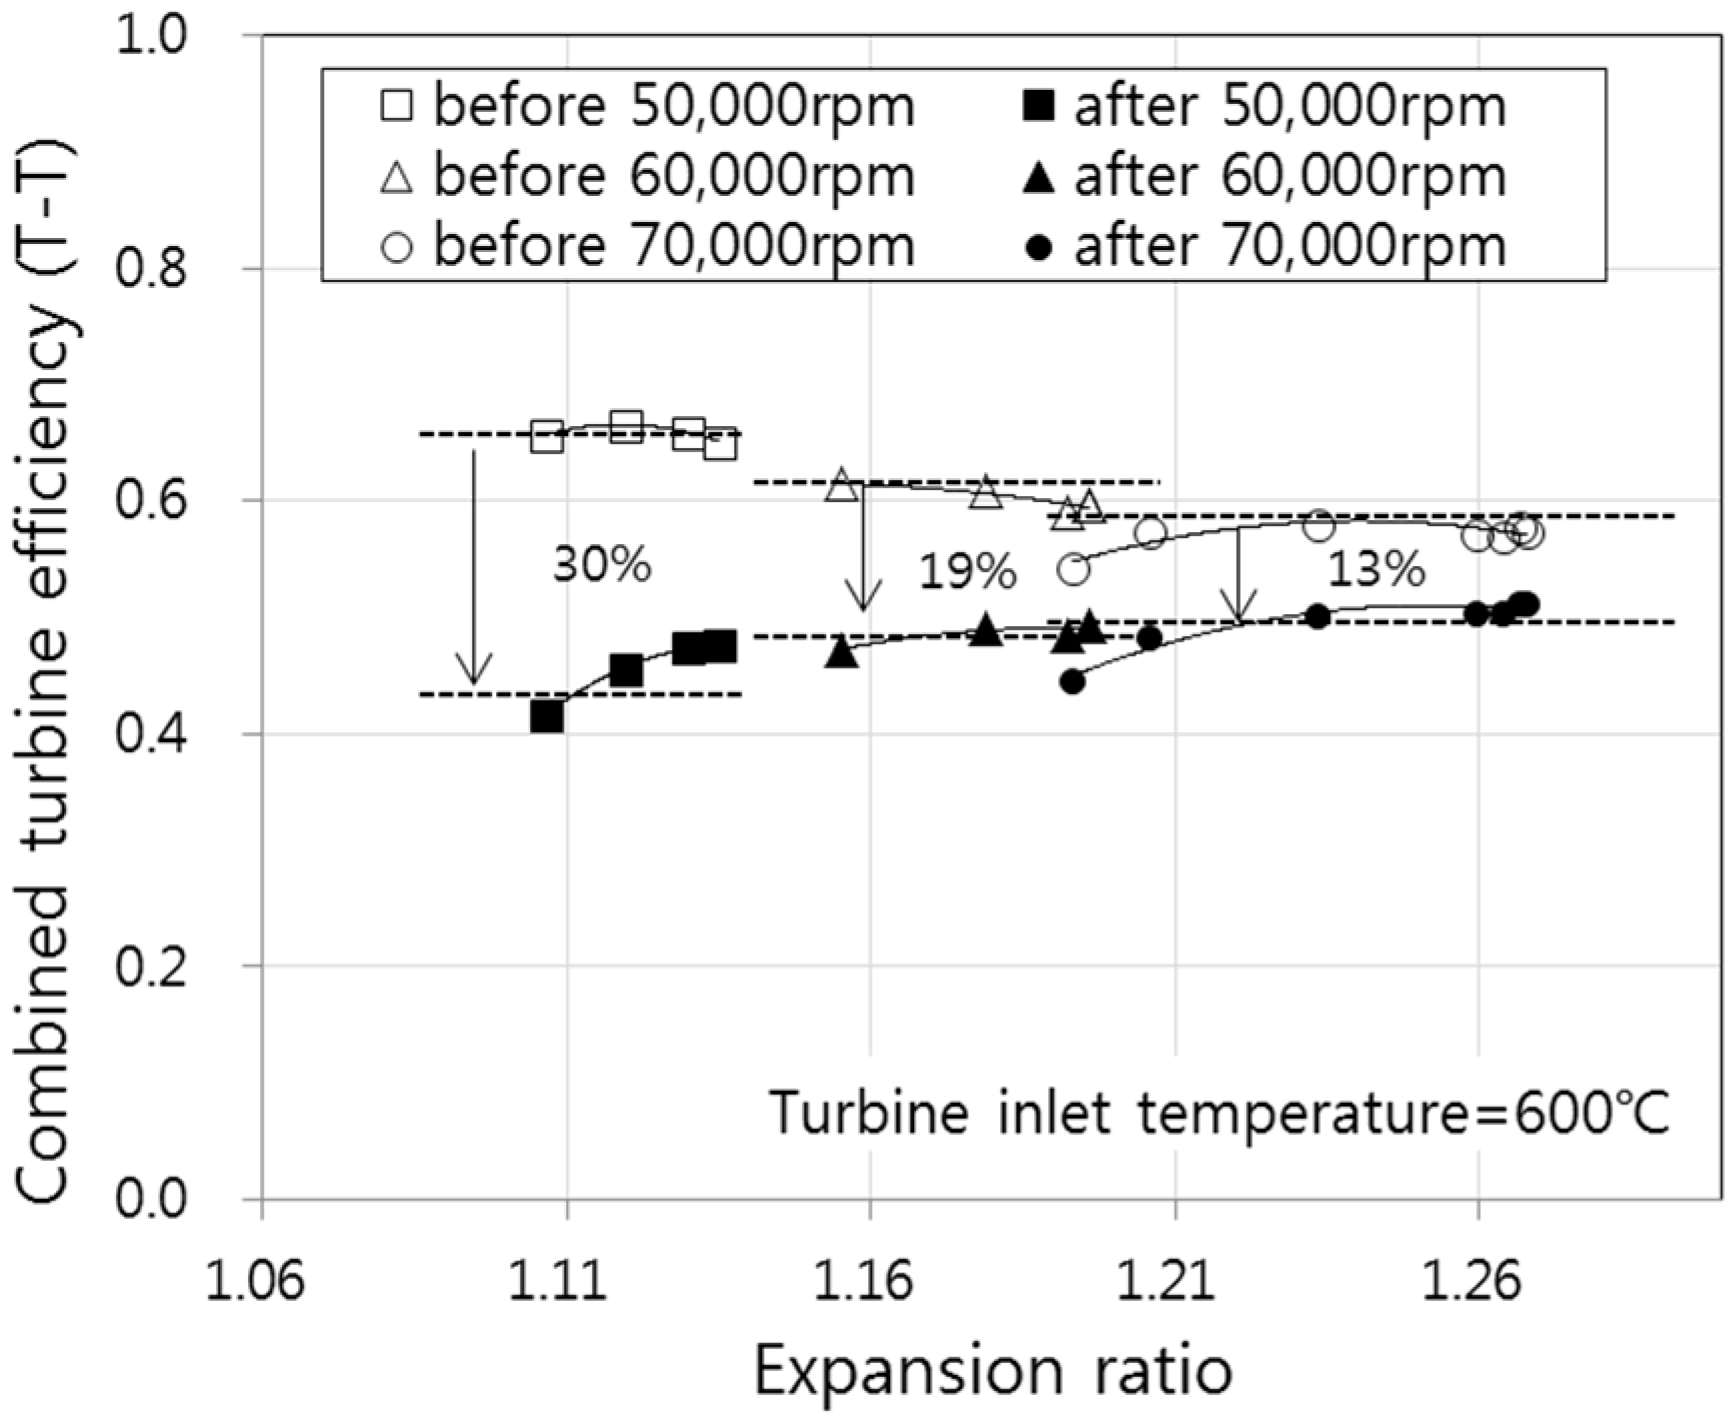
Therefore, the combined turbine efficiency based on compressor output as shown in Equation (4) was applied to mitigate heat transfer distortion. Figure 10 shows the results of the combined turbine efficiency using the calibrated compressor efficiency results for the turbocharger manufacturer’s hot gas test results.
For the combined turbine efficiency with corrected compressor efficiency, the average efficiency variation before and after correction was 30% at 50,000 rpm, 19% at 60,000 rpm, and 13% at 70,000 rpm. It is confirmed that the efficiency correction effect at low speed was high.
5. Conclusions
This study proposed a method to correct the compressor efficiency calculations of a laboratory made turbocharger test bench during low rotational speeds, ranging from 52,000 rpm to 98,000 rpm. The results are as follows:
- (1)
- Heat transfer from the outside during these low speeds causes underestimation of compressor efficiency.
- (2)
- The heat transfer rate of the oil to the compressor was calculated by analyzing cold gas test results, and performed a correction of compressor efficiency calculation depending on the oil temperature.
- (3)
- The correction of compressor efficiency, depending on the turbine inlet temperature, was performed through both hot and cold gas tests, and the results showed a maximum of 23% error prior to correction and a maximum of 5% error after the correction at 52,000 rpm.
- (4)
- The corrected compressor efficiency during the tests of the oil and turbine inlet temperatures did not show a significant difference as compared to the cold gas test results during the oil temperature at 38 °C, which indicates minimum distortion from the heat transfer effect during low speed, thus confirming that there was no distortion during the correction process.
- (5)
- In order to verify the efficiency correction method of an additional compressor, a compressor efficiency correction method was applied to the results of manufacturer’s hot gas test. Showing the tendency of compressor efficiency results to match through the laboratory cold gas test, the reliability of the compressor efficiency correction method of the objection method was verified.
- (6)
- Based on the corrected compressor efficiency, the turbine combined efficiency results were corrected by the turbocharger manufacturer, and the overestimation of the turbine combined efficiency by heat transfer was lowered, and it was confirmed that the turbine combined efficiency correction was possible.
Acknowledgments
This study is part of the results from (Development of Foundation Technology on the Turbocharger for Improving Low Speed Performance and Responding to High Emission Temperature of over 950 °C of a High Performance Gasoline Engine), which is a World Class 300 R & D technology development project sponsored by the Small and Medium Business Administration, and we thank the related organizations for their support.
Author Contributions
Jin Eun Chung and Jae Woo Chung conceived and designed the study; Nam Ho Kim, Sang Woon Lee and Gi Yong Kim performed the experiments; Jin Eun Chung and Jae Woo Chung analyzed the result; Jin Eun Chung, Jae Woo Chung and Sang Woon Lee wrote the draft of manuscript; Jin Eun Chung, Jae Woo Chung and Sang Woon Lee contributed to the revision of manuscript.
Conflicts of Interest
The authors declare no conflicts of interest.
Abbreviations
The following abbreviations are used in this manuscript:
| Coefficient of heat transfer from the lubricant oil | |
| Coefficient of heat transfer from the exhaust gas | |
| Cp. c | Specific heat at constant compressor pressure |
| Cp. t | Specific heat of turbine gas |
| Dc | Compressor blade diameter |
| hc | Specific compressor enthalpy |
| hc,corr | Corrected specific enthalpy in compressor |
| hc,mea | Measured specific compressor enthalpy |
| his,c | Isentropic compressor enthalpy |
| c | Air mass flow rate |
| t | Turbine gas flow rate |
| Pc | Compressor power |
| Pis,c | Isentropic compressor power |
| Pis,t | Isentropic turbine power |
| Ploss | Mechanical friction loss power |
| Pt | Turbine power |
| Heat transfer rate to compressor | |
| qc | Heat flux to compressor |
| Tcomp | Representative compressor temperature |
| T1 | Compressor inlet temperature |
| T2 | Compressor outlet temperature |
| T2,is | Isentropic compressor outlet temperature |
| T3 | Turbine inlet gas temperature |
| T4 | Turbine outlet gas temperature |
| Uc | Compressor blade tip speed |
| Maximum compressor blade tip speed | |
| ηis,c | Isentropic compressor efficiency |
| ηis,c,corr | Corrected specific enthalpy in compressor |
| ηis,c,mea | Measured compressor efficiency |
| ηis,t | Isentropic turbine efficiency |
| ηm,TC | Mechanical efficiency of turbocharger |
| ηt | Turbine overall efficiency |
| ρc | Air density in compressor |
| Dimensionless flow rate | |
| c | Compressor work |
| is,c | Isentropic compressor work |
References
- Aghaali, H.; Angstrom, H.E. Improving Turbocharged Engine Simulation by Including Heat Transfer in the Turbocharger; SAE Technical Paper No. 2012-01-0703; SAE International: Warrendale, PA, USA, 2012. [Google Scholar]
- Njoya, T.; Nakhjiri, M.; Plez, P.F.; Frase, R. Scaling methods for matching tasks in turbocharged engines. In Proceedings of the ASME Turbo Expo 2014: Turbine Technical Conference and Exposition, Düsseldorf, Germany, 16–20 June 2014. [Google Scholar]
- Otobe, T.; Grigoroadis, P.; Sens, M.; Berndt, R. Method of performance measurement for low turbocharger speeds. In Proceedings of the 9th International Conference on Turbochargers and Turbocharging-Institution of Mechanical Engineers, Combustion Engines and Fuels Group, London, UK, 19–20 May 2010. [Google Scholar]
- Park, Y.; Park, K.; Min, K.; Sunwoo, M. Model-based feedforward control of the VGT in a diesel engine based on empirical models of compressor and turbine efficiencies. Int. J. Automot. Technol. 2015, 16, 561–570. [Google Scholar] [CrossRef]
- Schorn, N.A. The Radial Turbine for Small Turbocharger Applications: Evoluation and Analytical Methods for Twin-Entry Turbine Turbochargers; SAE Technical Paper No. 2014-01-1647; SAE International: Warrendale, PA, USA, 2014. [Google Scholar]
- Serrano, J.R.; Olmeda, P.; Tiseira, A.; Luis Miguel Garcí-Cuevas, L.M. Importance of Mechanical Losses Modeling in the Performance Prediction of Radial Turbochargers under Pulsating Flow Conditions; SAE International: Warrendale, PA, USA, 2013. [Google Scholar]
- Serrano, J.R.; Guardiola, C.; Dolz, V.; Tiseira, A.; Cervelló, C. Experimental Study of the Turbine Inlet Gas Temperature Influence on Turbocharger Performance; SAE International: Warrendale, PA, USA, 2013. [Google Scholar]
- Lüddecke, B.; Filsinger, D.; Bargende, M. On wide mapping of a mixed flow turbine with regard to compressor heat flows during turbocharger testing. In Proceedings of the 10th International Conference on Turbochargers and Turbocharging, London, UK, 15–16 May 2012; pp. 185–202. [Google Scholar]
- Nakhjiri, M. Apparent and real efficiency of turbochargers under influence of heat flow. In Proceedings of the 14th International Symposium on Transport Phenomena and Dynamics of Rotating Machinery, Honolulu, HI, USA, 27 February–2 March 2012. [Google Scholar]
- Sundström, E.; Semlitsch, B.; Mihăescu, M. Similarities and differences concerning flow characteristics in centrifugal compressors of different size. In Springer Proceedings in Physics; Springer: Berlin, Germany, 2016; Volume 185, pp. 457–464. [Google Scholar]
- Griffith, R.C.; Slaughter, S.E.; Mavrosakis, P.E. Applying Ball Bearings to the Series Turbochargers for the Caterpillar® Heavy-Duty on-Highway Truck Engines; SAE International: Warrendale, PA, USA, 2007. [Google Scholar]
- Marelli, S.; Marmorato, G.; Capobianoco, M.; Rinaldi, A. Heat Transfer Effects on Performance Map of a Turbocharger Compressor for Automotive Applicatio; SAE International: Warrendale, PA, USA, 2007. [Google Scholar]
- Luis, D. Experiments and Modeling of Automotive Turbochargers under Unsteady Conditions. Ph.D. Thesis, Universitat Politècnica de València, Valnecia, Spain, 2014. [Google Scholar]
- Engine Power Test Code Committee. Turbocharger Gas Stand Test Code, SAE Standard; SAE International: Warrendale, PA, USA, 2007. [Google Scholar]
Figure 1.
Schematic diagram and a picture of the laboratory test bench.
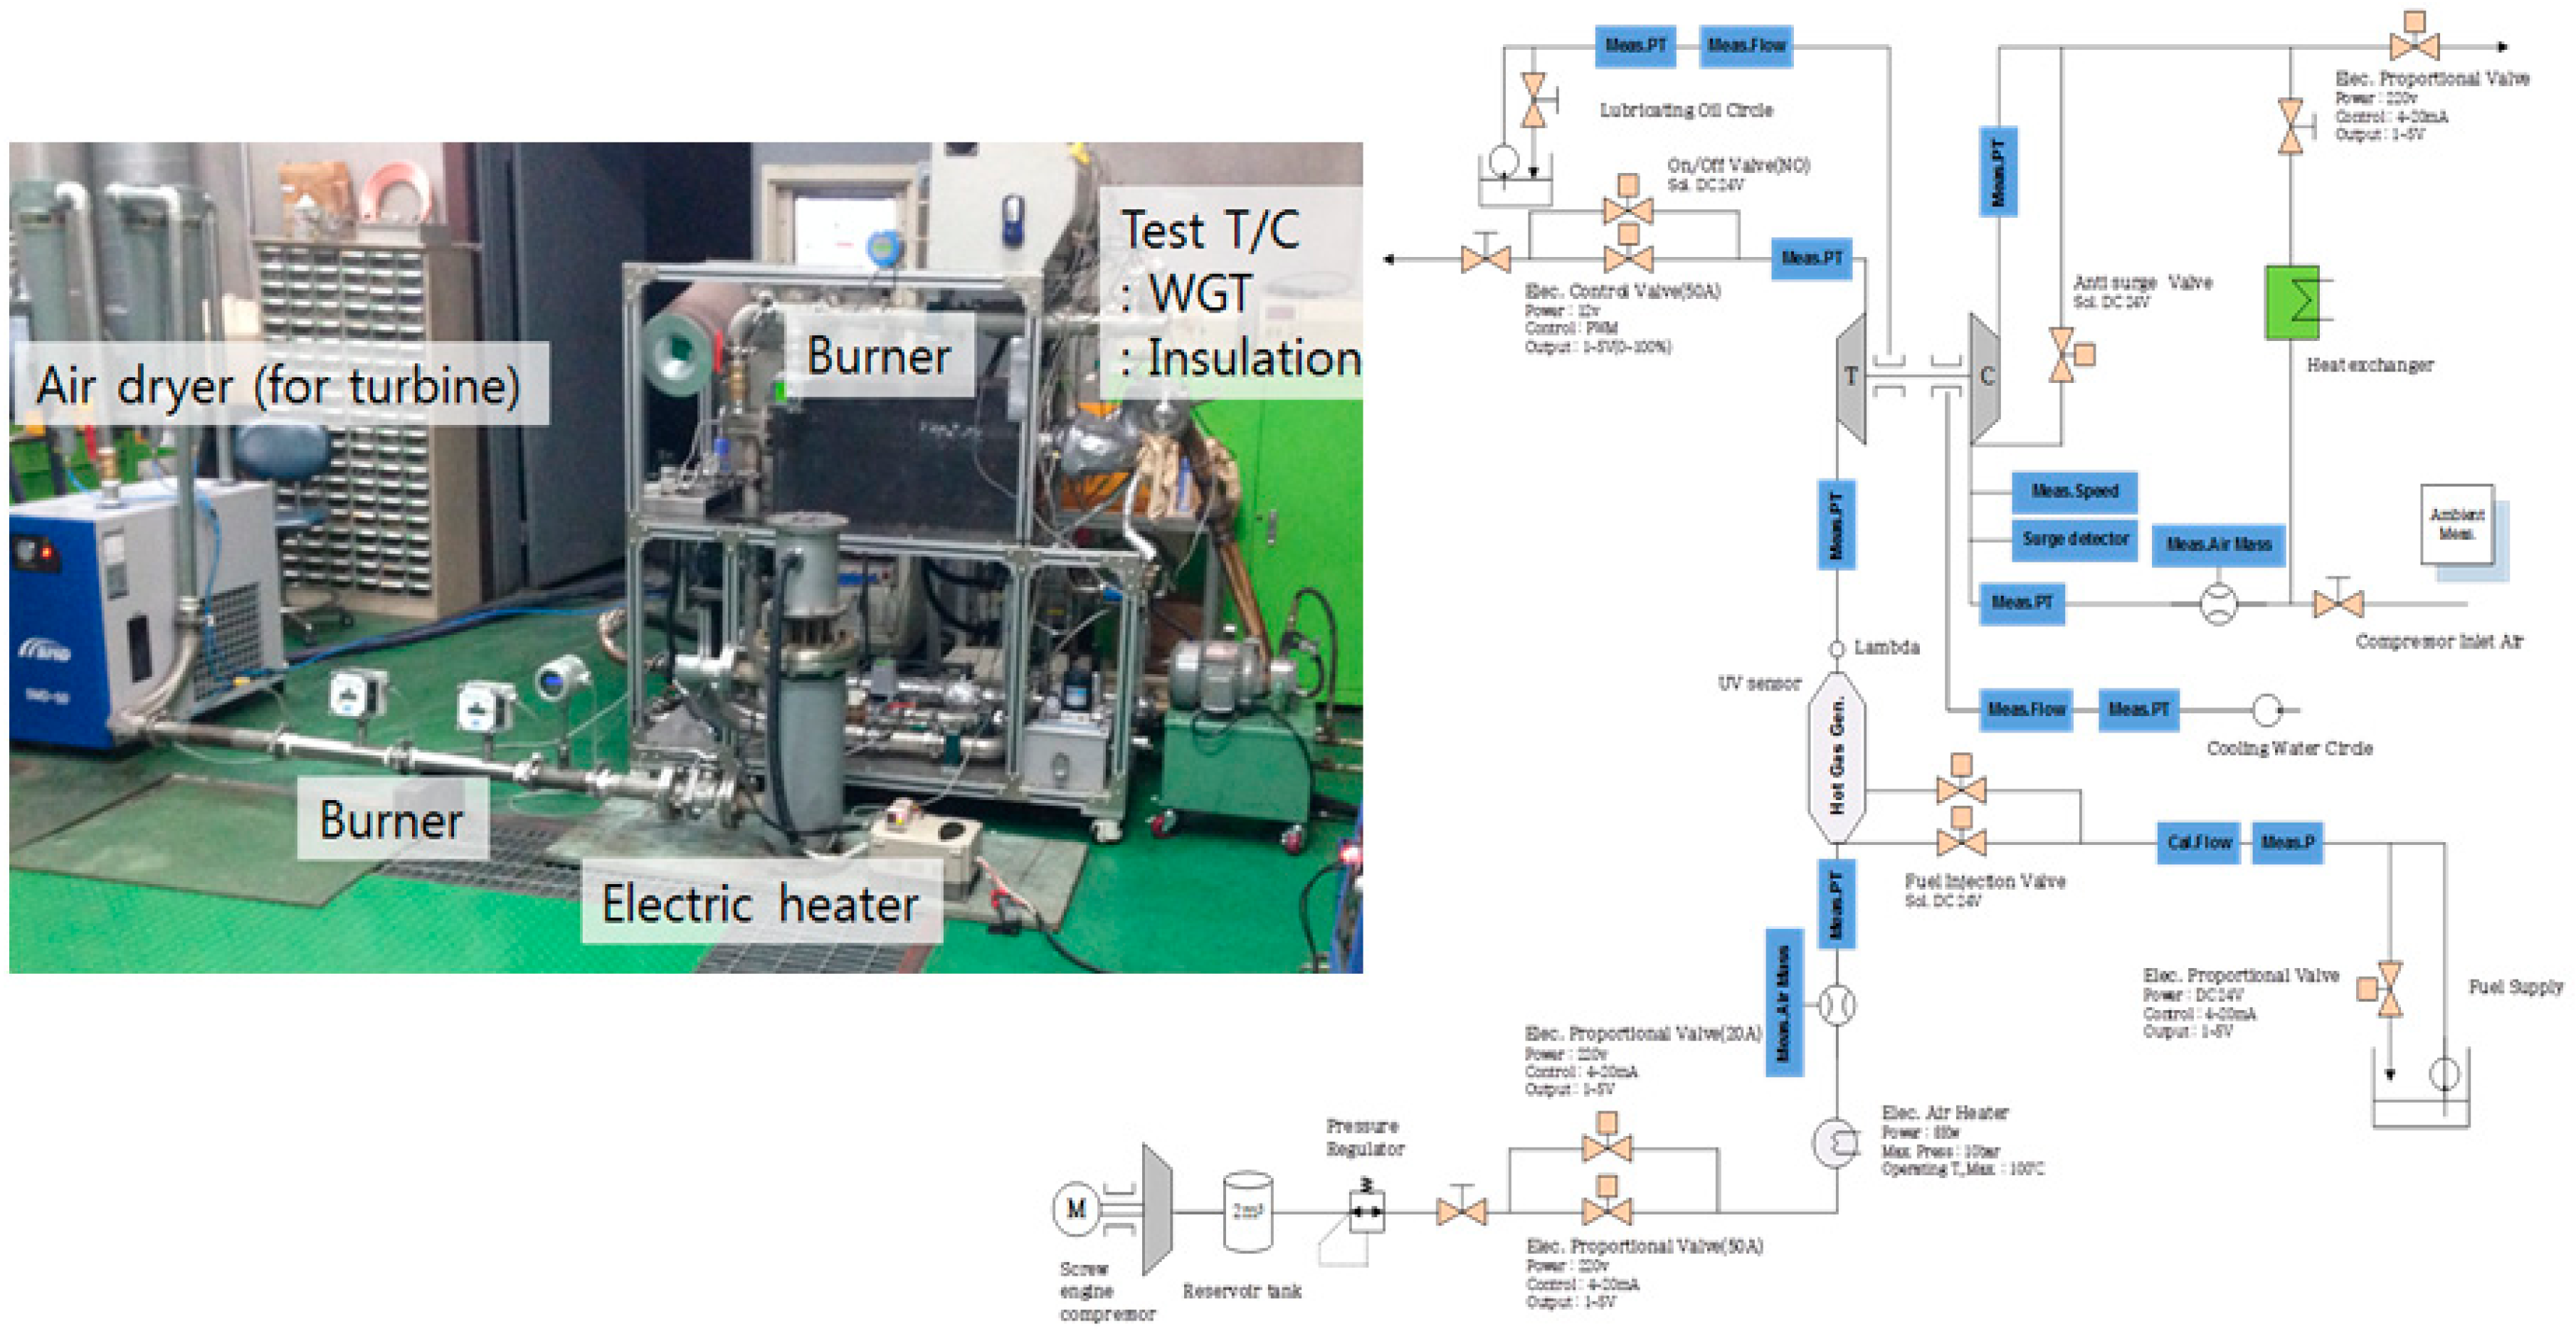
Figure 2.
Comparisons’ pressure ratio in the cold gas test and hot gas test. (a) Comparisons of cold gas test results and hot gas test results; (b) comparisons of oil inlet temperature variation cold gas test results.
Figure 2.
Comparisons’ pressure ratio in the cold gas test and hot gas test. (a) Comparisons of cold gas test results and hot gas test results; (b) comparisons of oil inlet temperature variation cold gas test results.

Figure 3.
Isentropic compressor efficiency in a cold gas test and hot gas test. (a) Comparisons of cold gas test results and hot gas test results; (b) comparisons of oil inlet temperature variation cold gas test results.
Figure 3.
Isentropic compressor efficiency in a cold gas test and hot gas test. (a) Comparisons of cold gas test results and hot gas test results; (b) comparisons of oil inlet temperature variation cold gas test results.
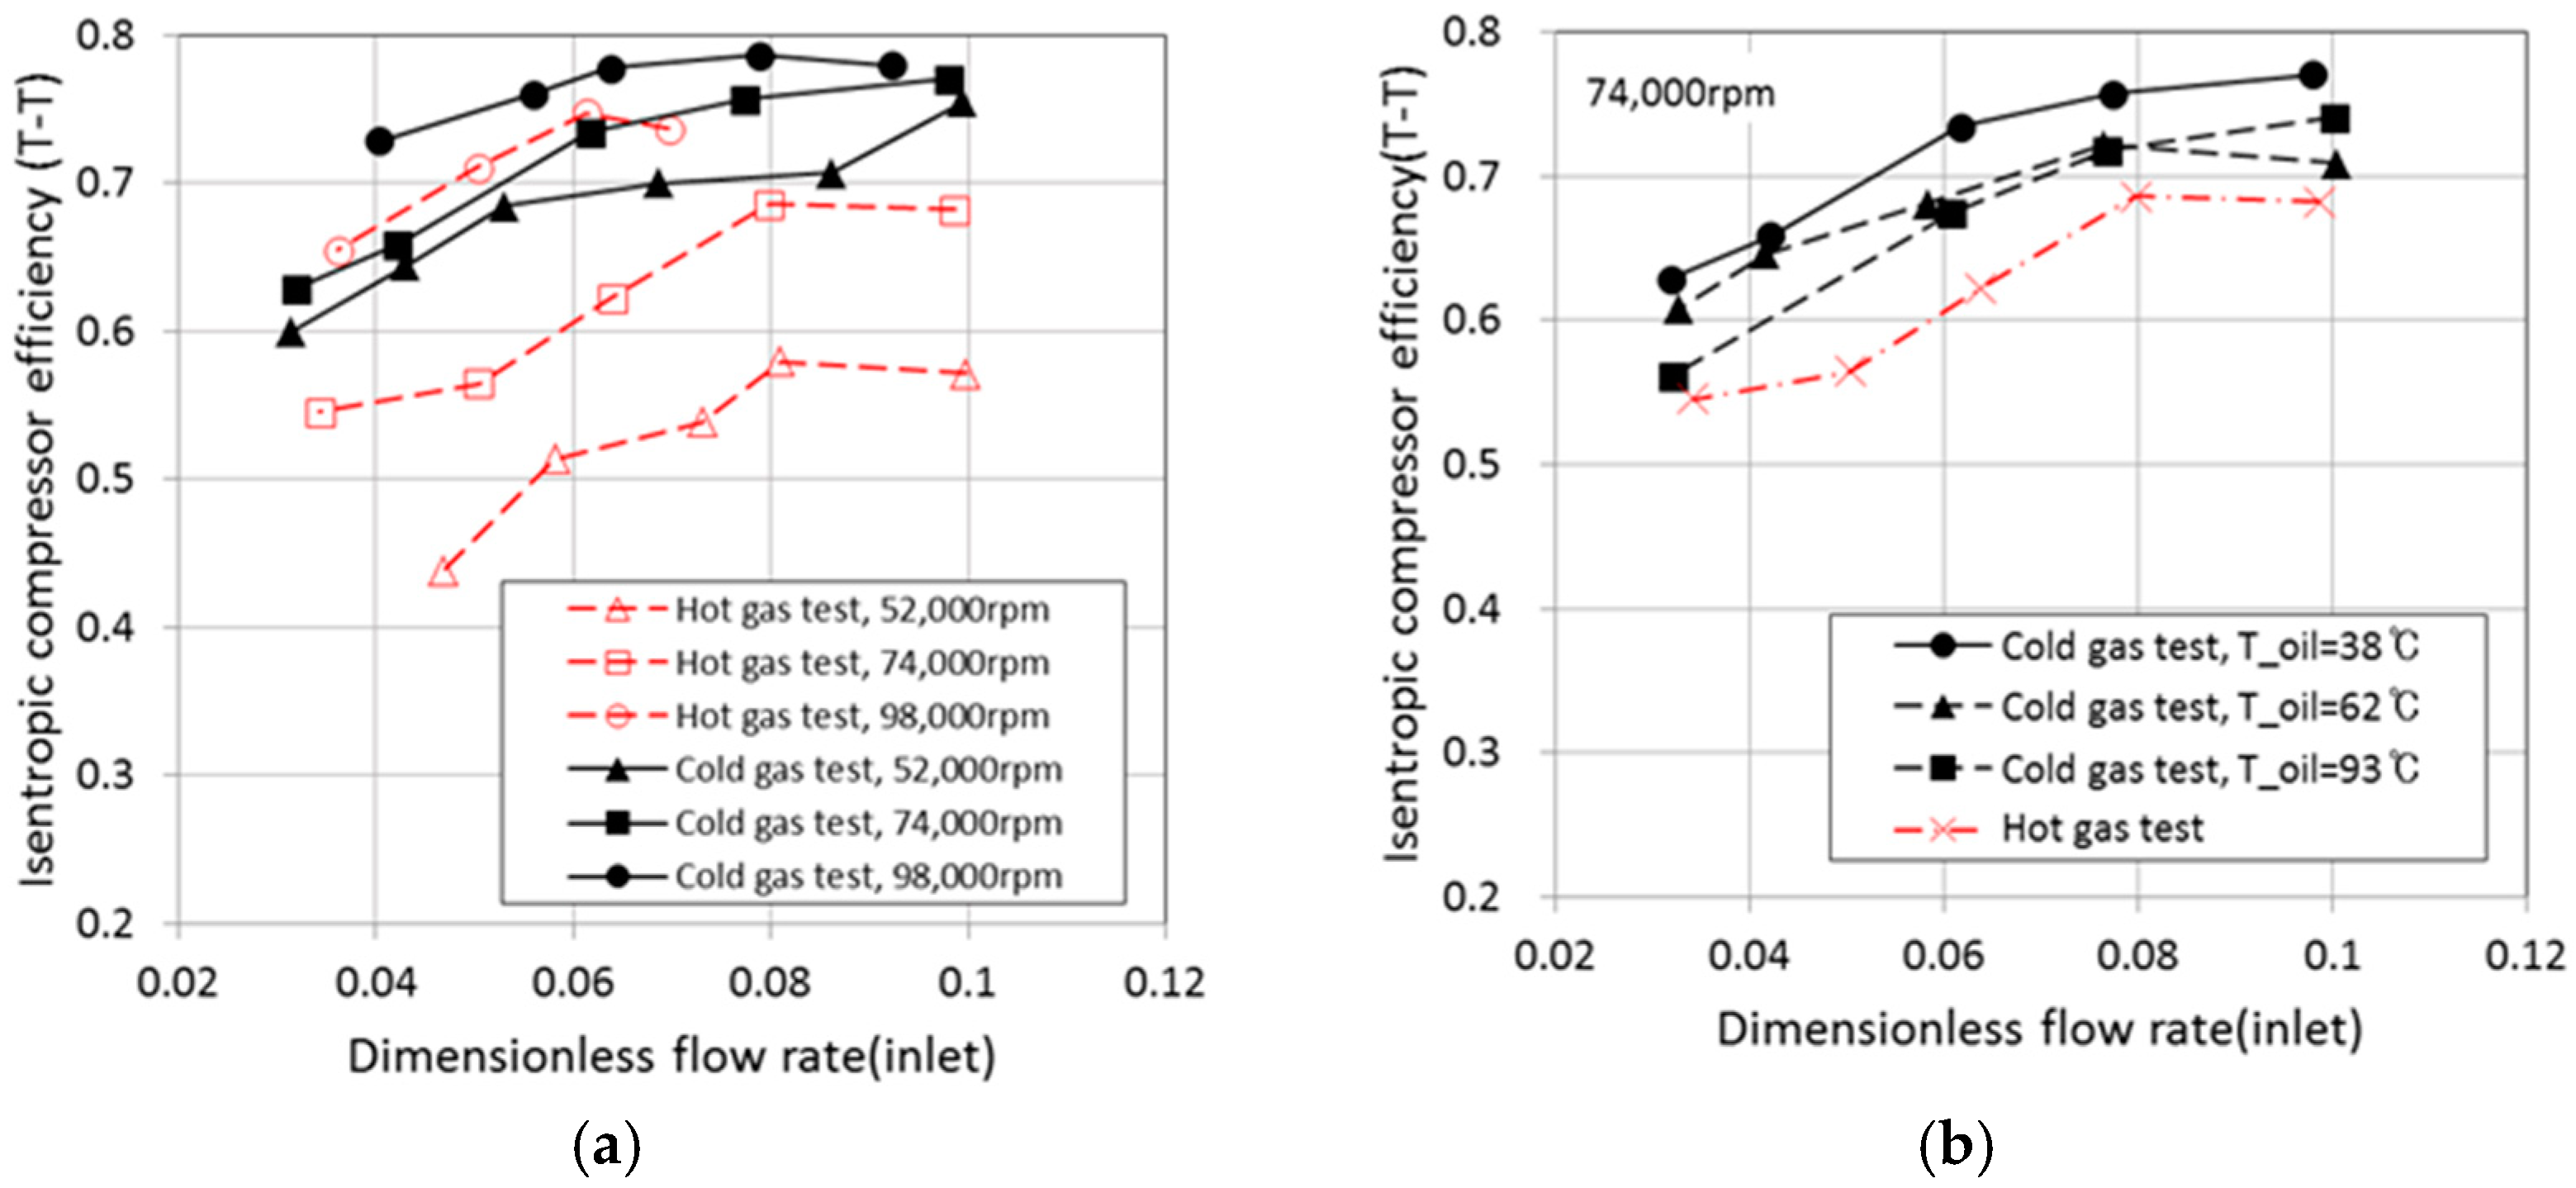
Figure 4.
Oil temperature drop, according to oil inlet temperature condition.

Figure 5.
Average compressor and turbine inlet gas temperature in a cold gas test.
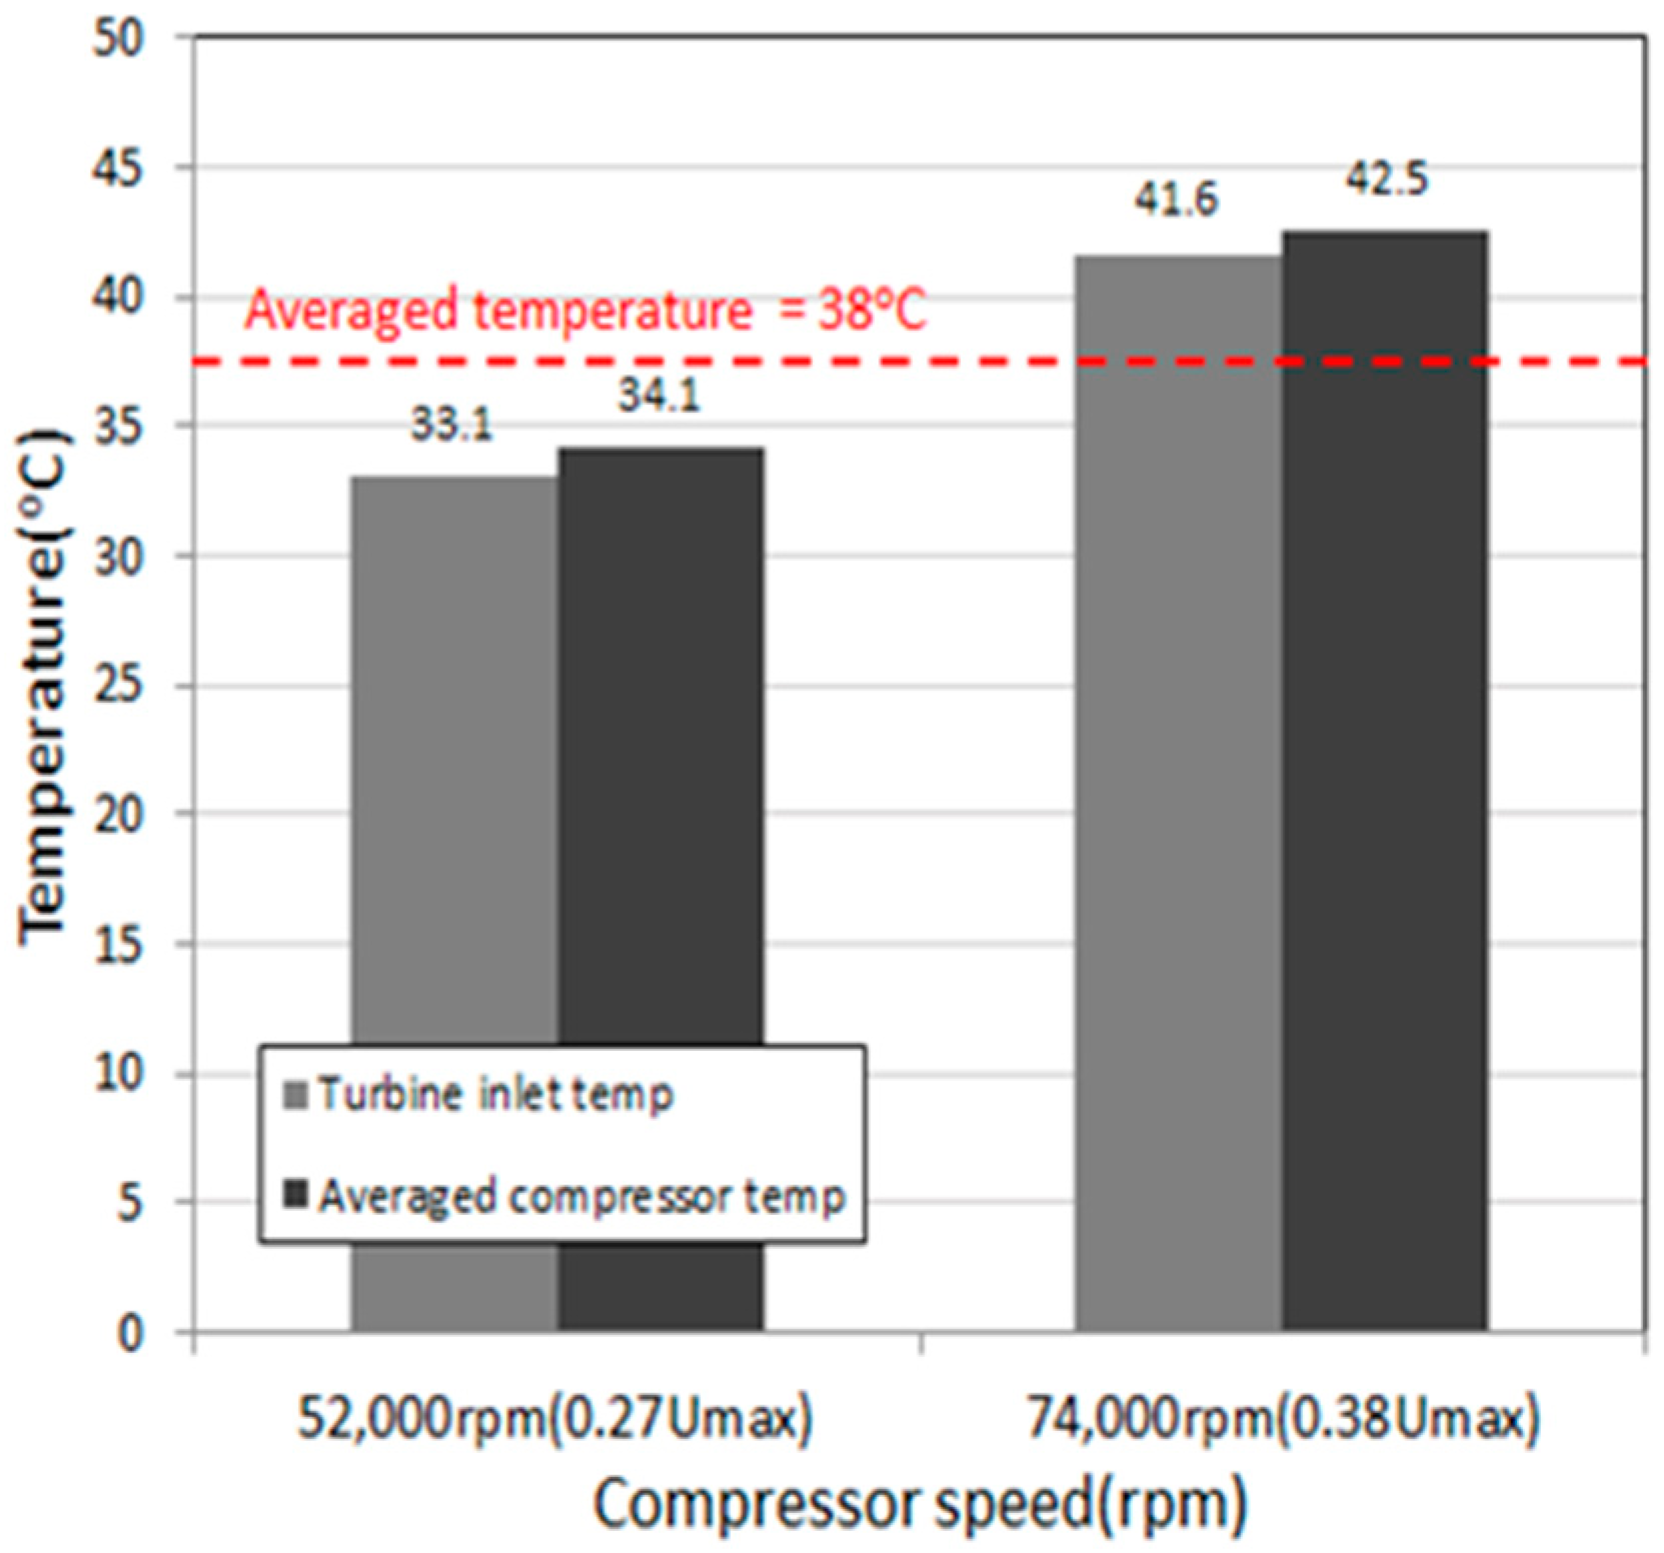
Figure 6.
Comparisons of isentropic compressor efficiency of oil inlet temperature variation at cold gas test results. (a) Before correction of oil inlet temperature at 74,000 rpm; (b) after correction of oil let temperature at 74,000 rpm.
Figure 6.
Comparisons of isentropic compressor efficiency of oil inlet temperature variation at cold gas test results. (a) Before correction of oil inlet temperature at 74,000 rpm; (b) after correction of oil let temperature at 74,000 rpm.
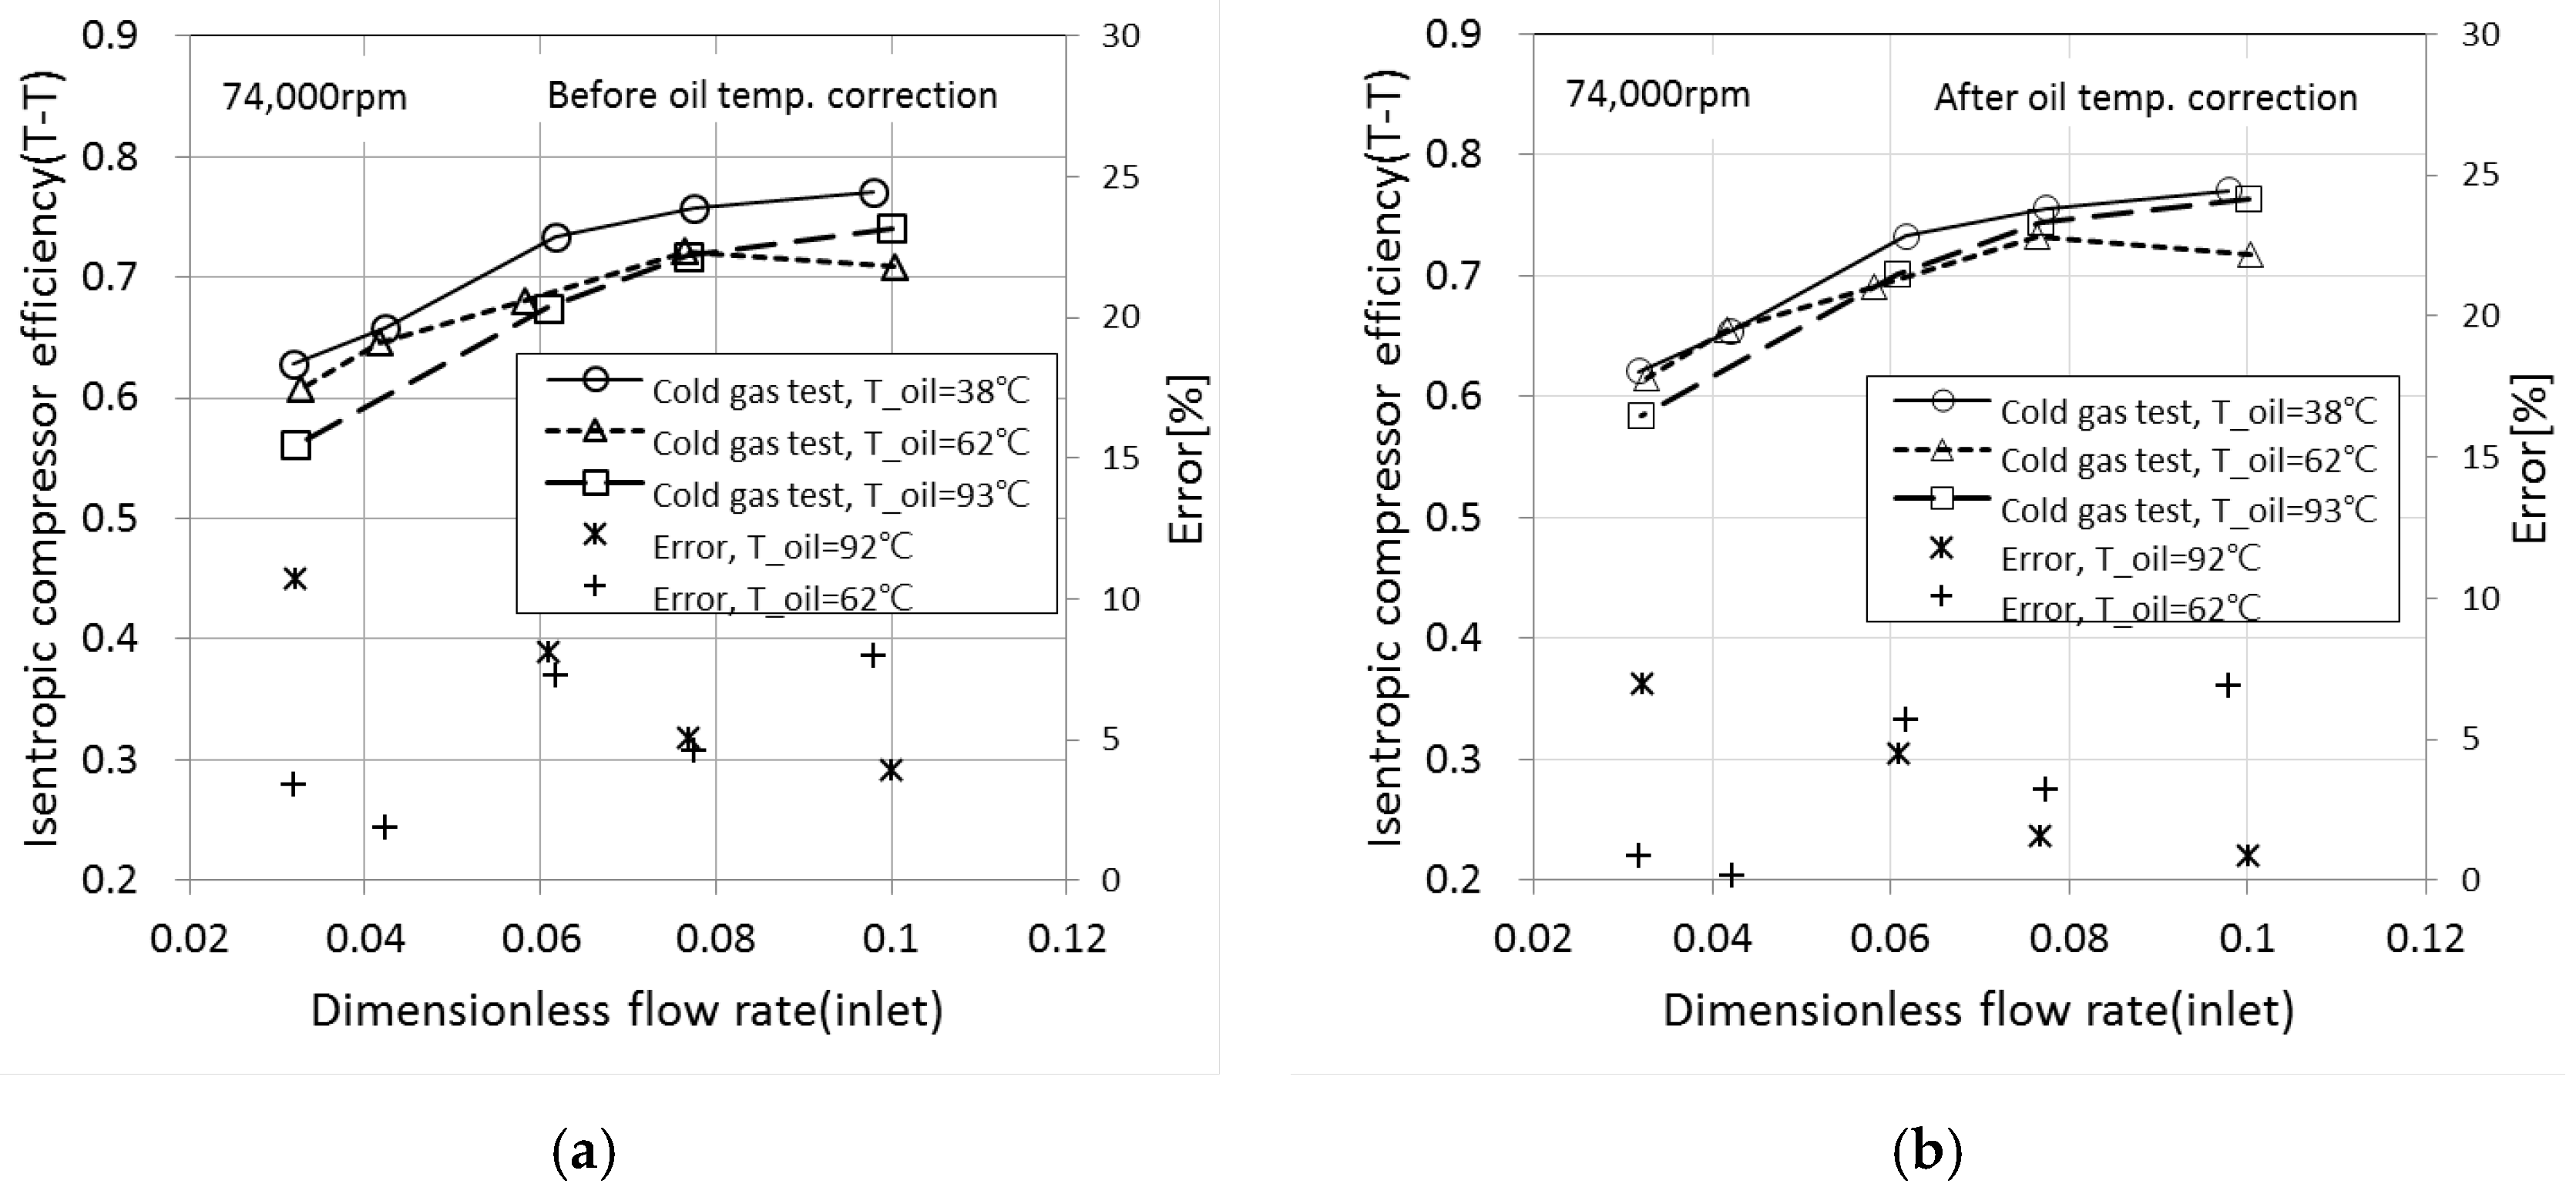
Figure 7.
Results of the isentropic compressor efficiency correction for oil inlet temperature and turbine inlet gas temperature. (a) compressor speed at 52,000 rpm; (b) compressor speed at 74,000 rpm; (c) compressor speed at 98,000 rpm.
Figure 7.
Results of the isentropic compressor efficiency correction for oil inlet temperature and turbine inlet gas temperature. (a) compressor speed at 52,000 rpm; (b) compressor speed at 74,000 rpm; (c) compressor speed at 98,000 rpm.


Figure 8.
Comparison of compression pressure ratio results of cold and hot gas tests for compressor efficiency correction verification.
Figure 8.
Comparison of compression pressure ratio results of cold and hot gas tests for compressor efficiency correction verification.

Figure 9.
Graph of the compressor efficiency correction application and verification result for manufacturer’s hot gas test results. (a) compressor speed at 50,000 rpm; (b) compressor speed at 60,000 rpm; (c) compressor speed at 70,000 rpm.
Figure 9.
Graph of the compressor efficiency correction application and verification result for manufacturer’s hot gas test results. (a) compressor speed at 50,000 rpm; (b) compressor speed at 60,000 rpm; (c) compressor speed at 70,000 rpm.


Figure 10.
Compressor of corrected combined turbine efficiency by rotational speed at the turbine inlet temperature of 600 °C.
Figure 10.
Compressor of corrected combined turbine efficiency by rotational speed at the turbine inlet temperature of 600 °C.

Table 1.
Experimental condition of efficiency correction method development.
| Test 1 | Efficiency Correction Method Development | ||
|---|---|---|---|
| Condition | Unit | Cold Gas Test | Hot Gas Test |
| Turbine inlet temp. | °C | 40 (Electric heater used) | 600 (Diesel fuel burner used) |
| Oil inlet temp. | °C | 38, 62, 93 | 75 |
| Compressor speed | rpm | 52,000 (0.26 74,000 (0.37 ), 98,000 (0.5 ) | |
| Compressor inlet temp. | °C | Ambient temperature | |
| Device Manufacturer | Laboratory-made | ||
| Insulation treatment | External insulation treatment | ||
| Compression ratio | Change (Maintain rotation speed) | ||
| Coolant Supply | None (Prevent of temperature distortion by heat transfer) | ||
Table 2.
Experimental conditions of efficiency correction method verification.
| Test 2 | Efficiency Correction Method Application | ||
|---|---|---|---|
| Condition | Unit | Hot Gas Test (Turbocharger Maker) | Cold Gas Test (Reference Test) |
| Turbine inlet temp. | °C | 300, 400, 500, 600 | 40 |
| Oil inlet temp. | °C | 95 | 38 |
| Compressor speed | rpm | 50,000 (0.25 ), 60,000 (0.3 ,) 70,000 (0.35 ) | |
| Compressor inlet temp. | °C | Ambient temperature (Based on 20 °C) | Ambient temperature |
| Device Manufacturer | Kratzer automation | Laboratory-made | |
| Insulation treatment | External insulation treatment | ||
| Compression ratio | Change (Maintain rotation speed) | ||
| Coolant Supply | None (Prevent of temperature distortion by heat transfer) | ||
Table 3.
Experimental turbocharger specification data.
| Turbo. Max. Speed () | Compressor | Turbine | Bearing | Type |
|---|---|---|---|---|
| Wheel Dia. | Wheel Dia. | |||
| rpm | mm | mm | - | - |
| 195,000 | 56 | 47 | Full Floating | WGT |
© 2018 by the authors. Licensee MDPI, Basel, Switzerland. This article is an open access article distributed under the terms and conditions of the Creative Commons Attribution (CC BY) license (http://creativecommons.org/licenses/by/4.0/).
Share and Cite
MDPI and ACS Style
Chung, J.E.; Chung, J.W.; Kim, N.H.; Lee, S.W.; Kim, G.Y. An Investigation on the Efficiency Correction Method of the Turbocharger at Low Speed. Energies 2018, 11, 269. https://doi.org/10.3390/en11020269
AMA Style
Chung JE, Chung JW, Kim NH, Lee SW, Kim GY. An Investigation on the Efficiency Correction Method of the Turbocharger at Low Speed. Energies. 2018; 11(2):269. https://doi.org/10.3390/en11020269
Chicago/Turabian StyleChung, Jin Eun, Jae Woo Chung, Nam Ho Kim, Sang Woon Lee, and Gi Yong Kim. 2018. "An Investigation on the Efficiency Correction Method of the Turbocharger at Low Speed" Energies 11, no. 2: 269. https://doi.org/10.3390/en11020269
Note that from the first issue of 2016, this journal uses article numbers instead of page numbers. See further details here.