Lost Gas Mechanism and Quantitative Characterization during Injection and Production of Water-Flooded Sandstone Underground Gas Storage

1
College of Earth Science and Engineering, Shandong University of Science and Technology, Qingdao 266590, China
2
College of Resources Science and Technology, Beijing Normal University, Beijing 100875, China
*
Author to whom correspondence should be addressed.
Energies 2018, 11(2), 272; https://doi.org/10.3390/en11020272
Submission received: 25 December 2017
/
Revised: 18 January 2018
/
Accepted: 19 January 2018
/
Published: 23 January 2018
(This article belongs to the Section L: Energy Sources)
Abstract
:A gas–water two-phase fluid is present in a reservoir before a water-flooded sandstone gas reservoir is rebuilt. Therefore, in the process of injection and production of the rebuilt underground gas storage, the injected gas is easily blocked by the water in the pores, and the efficiency is low, resulting in a significant loss of gas. The study completely utilizes the geological data and dynamic operation monitoring data of a water-flooded sandstone underground gas storage and clarifies the rule of the gas–water three-phase seepage in a high-intensity injection–production process. Moreover, the main control factors of the low efficiency of this type of underground gas storage are clarified. The lost gas generated in the injection–production process is described from two aspects: microcosmic experiment and macroscopic law analysis. The type, mechanism, and occurrence state of the loss gas are clearly defined, its main type is “water trapped gas”, it formed when the gas rushing into the water area under high pressure and surrounded by water, and its occurrence of this kind of lost gas is mainly sporadic or continuous free gas. A gas–water two-phase mathematical model that can simulate the high-intensity injection–production process is set up according to the experimental result, this model is used to simulate the operation process of the Ban 876 underground gas storage. Based on the simulation results, the gas–water macroscopic movement rule and macroscopic accumulation mode of the lost gas are defined, and then the collection area of the lost gas is predicted and quantitatively described. The calculation results show that the lost gas in one cycle is about 775 × 104 m3, which are mainly concentrated in the inner of the gas-water transition zone. According to the numerical simulation result, six new wells have been designed to develop its internal lost gas, they all have good predictions, can increase the working gas volume of 3000 × 104 m3 and reduce the single cycle lost gas by 50%, which is only 326 × 104 m3. This provides guidance for the expansion and exploitation of the same type of water-flooded sandstone underground gas storage.
1. Introduction
In 1915, Canada built the first underground gas storage in the world. Until the 1940s, the number of underground gas storage sites slowly increased, and the technology of building libraries also lagged [1]. After World War II, the role of underground gas storage gradually emerged, which also accelerated its construction speed, and numerous underground gas storage systems were built worldwide. Initially, the research on gas storage was mainly based on the theory of oil and gas exploration and development. However, with the continuous operation of underground gas storage, a series of unsolved technical problems became gradually exposed. Some researchers started to realize that the law of fluid seepage during the high-strength injection and production of underground gas storage was different from the classical Darcy law [2]. They started studying the law of oil–gas–water relative seepage in the process of strong injection and intensive production. By establishing their mathematical model, numerical simulation was performed to simulate the operation process of underground gas storage to improve its operation efficiency.
There are many kinds of containers for the storage of natural gas, but they all can be roughly divided into two types: ground gas storage and underground gas storage. Ground gas storage systems are generally built in a natural gas transfer station near the city or in a gas station in the center of the city, their size are small and the pressure of the container is low. The natural gas in these storage tanks requires long distance transport using LNG transport which will increase the safety hazards of urban traffic [3]. Therefore, the above–ground gas storage is generally used in small scale gas stations which can’t store large amounts of natural gas, and they can’t fundamentally solve the contradiction between supply and demand of natural gas in big cities. The underground gas storage has a large scale and can be directly connected to the gas transmission pipeline, which can realize continuous gas supply and effectively solve the contradiction between supply and demand of natural gas in big cities [4,5]. Underground gas storage has the following characteristics:
- (1)
- The storage space of the underground gas storage is large, the gas storage pressure is high and the permeability is good.
- (2)
- The underground gas storage has good trap conditions, high safety and high reliability.
- (3)
- The underground gas storage can use the fluid in the reservoir as the gasket to provide the basic pressure for it.
- (4)
- There is no need for repeated exploration in the underground gas storage, the original gas production equipment can be used.
1.1. Research Status of High-Speed Injection and Production Mechanism of Underground Gas Storage
During the mid-1970s, Petrusch studied in detail the technical difficulties in rebuilding a condensate gas reservoir as an underground gas storage, and performed a single-well gas injection experiment. He believed that the high-strength gas injection during the operation of underground gas storage was different from conventional gas injection, which was the first experimental study on the injection and production mechanism of underground gas storage. Subsequently, Billiotte established a two-dimensional micro gas–water relative permeability model experiment in the laboratory, and added a barrier membrane in the glassware to simulate the gas–water seepage resistance in the reservoir. He used this model to simulate the gas injection and gas recovery process, and obtained some basic rules for the injection and production processes of underground gas storage. However, because the cores used in the experiment were artificial, these laws were only suitable for homogeneous reservoirs and unsuitable for strong heterogeneous sandstone reservoirs [6]. Wang used artificial cores to test the rock compressibility, porosity, and permeability by a repeatedly lifting and confining pressure. The experiment confirmed that the permeability exhibited a hysteresis effect with pressure cycling [7]. In recent years, with some new problems in the injection and production processes in underground gas storage, researchers have also improved the injection production experimental equipment to reflect a more realistic reservoir environment. By using an improved core clamping experimental equipment, the problem of pressure lag response in the gas production process was simulated, which explained why the lower limit of the pressure in a numerical simulation was higher than the actual gas production pressure. These studies basically revealed the principle of gas–water seepage as nonlinear seepage in the high-intensity injection and production processes [8]. However, the above-mentioned experiments are limited to the seepage in the gas production process, and the gas channeling phenomenon in gas injection is not studied in detail.
1.2. Research on Gas Loss and Mathematical Model in Injection and Production Processes of Underground Gas Storage
In the 1970s of the last century, computer technology began to be applied in the simulation field of underground gas storage. Some researchers began to develop underground gas storage simulators and applied them in a computer environment [9]. However, there are a few quantitative simulation studies on the injection production indices and the injection production process itself for underground gas storage [10]. Lang first used a three-dimensional (3D) gas expansion model to simulate the running status of an underground natural gas storage, and predicted the associated operation parameters of gas storage [11]. Subsequently, a single-phase simulator was developed to consider the movement of the gas–water interface, and it was used to predict the pore volume utilization and reasonable injection production rate [12]. Simultaneously, a two-dimensional gas–water percolation model established by researchers was applied to the injection and production operation of the Sciotac aquifer underground gas storage in Illinois. Good results were achieved, which laid the foundation for the development of a gas–water two-phase flow model [13]. To describe the effect of the injection gas and original gas mixture on the injection and production, Bittkow established a two-dimensional mixture model, simulated the gas–water macro movement rule in the process of injection and production, and determined the rule of seepage and influencing factors of the mixture [14]. Ory set a two-phase flow grid model using the Gauss Newton optimal algorithm and singular value decomposition (SVD) method. The model was used to fit the short-term operation process of underground gas storage, and its effect was better [15]. Kurihara modified the traditional component state equation and established a component state equation with the consideration of molecular diffusion and water-soluble gas adsorption, and developed a simulator. The simulator was targeted more than any other commercial software for examining the variation in the gas component and calculation of the pore volume, but it has not been widely used [16]. Tan established a mathematical model for underground gas storage, which was rebuilt by using exhausted gas reservoirs. The flow equation of the model used a nonlinear seepage law, and the Darcy law was appropriately corrected. A mathematical model for the injection and production dynamics of this type of underground gas storage has been established. The fractional step method was used to solve the problem, and the amount of gas leakage in the injection and production processes was calculated [17]. Based on the Warren–Root dual pore model, Fu established a mathematical model for underground gas storage considering the deformation of the medium, and used it to simulate the operation process of a depleted fractured reservoir rebuilt underground gas storage, and achieved good results [18]. By using the implicit finite difference method, Xu studied the operation of an underground gas storage rebuilt by an exhausted gas reservoir, and solved the flow equation of natural gas [19]. In 2012, Zhao analyzed the effect of the reservoir structure characteristics, reservoir heterogeneity, and injection and production plan on gas injection based on the gas–water two-phase flow theory and a numerical simulation method, and confirmed the influencing factors of the gas injection effect [20].
In summary, most of the related studies in the literature are routine experiments and simulations for the gas–water two-phase flow. Moreover, the models built in these studies did not consider the lost gas in the high-intensity injection production. The main purpose of this study is to clarify the type, mechanism, state and volume of the lost gas in the underground gas storage. So far, the concept of “lost gas” has not been widely accepted. Although we all know that there are many losses of gas in the process of high-intensity injection and production of underground gas storage, but the ways they lose, the positions they gather and the states they exist, all these problems are not clear, so we carried out this study, and choose the Ban 876 underground gas storage as an example to explain the process in detail. A comprehensive description of the lost gas is made by means of experimental mechanism, mathematical model and numerical simulation, the lost gas mechanism and occurrence status can be found out. Thus, it can provide guidance for the rational operation of the water flooded sandstone underground gas storage, and avoids the loss of gas.
2. Gas Loss during Operation of Underground Gas Storage
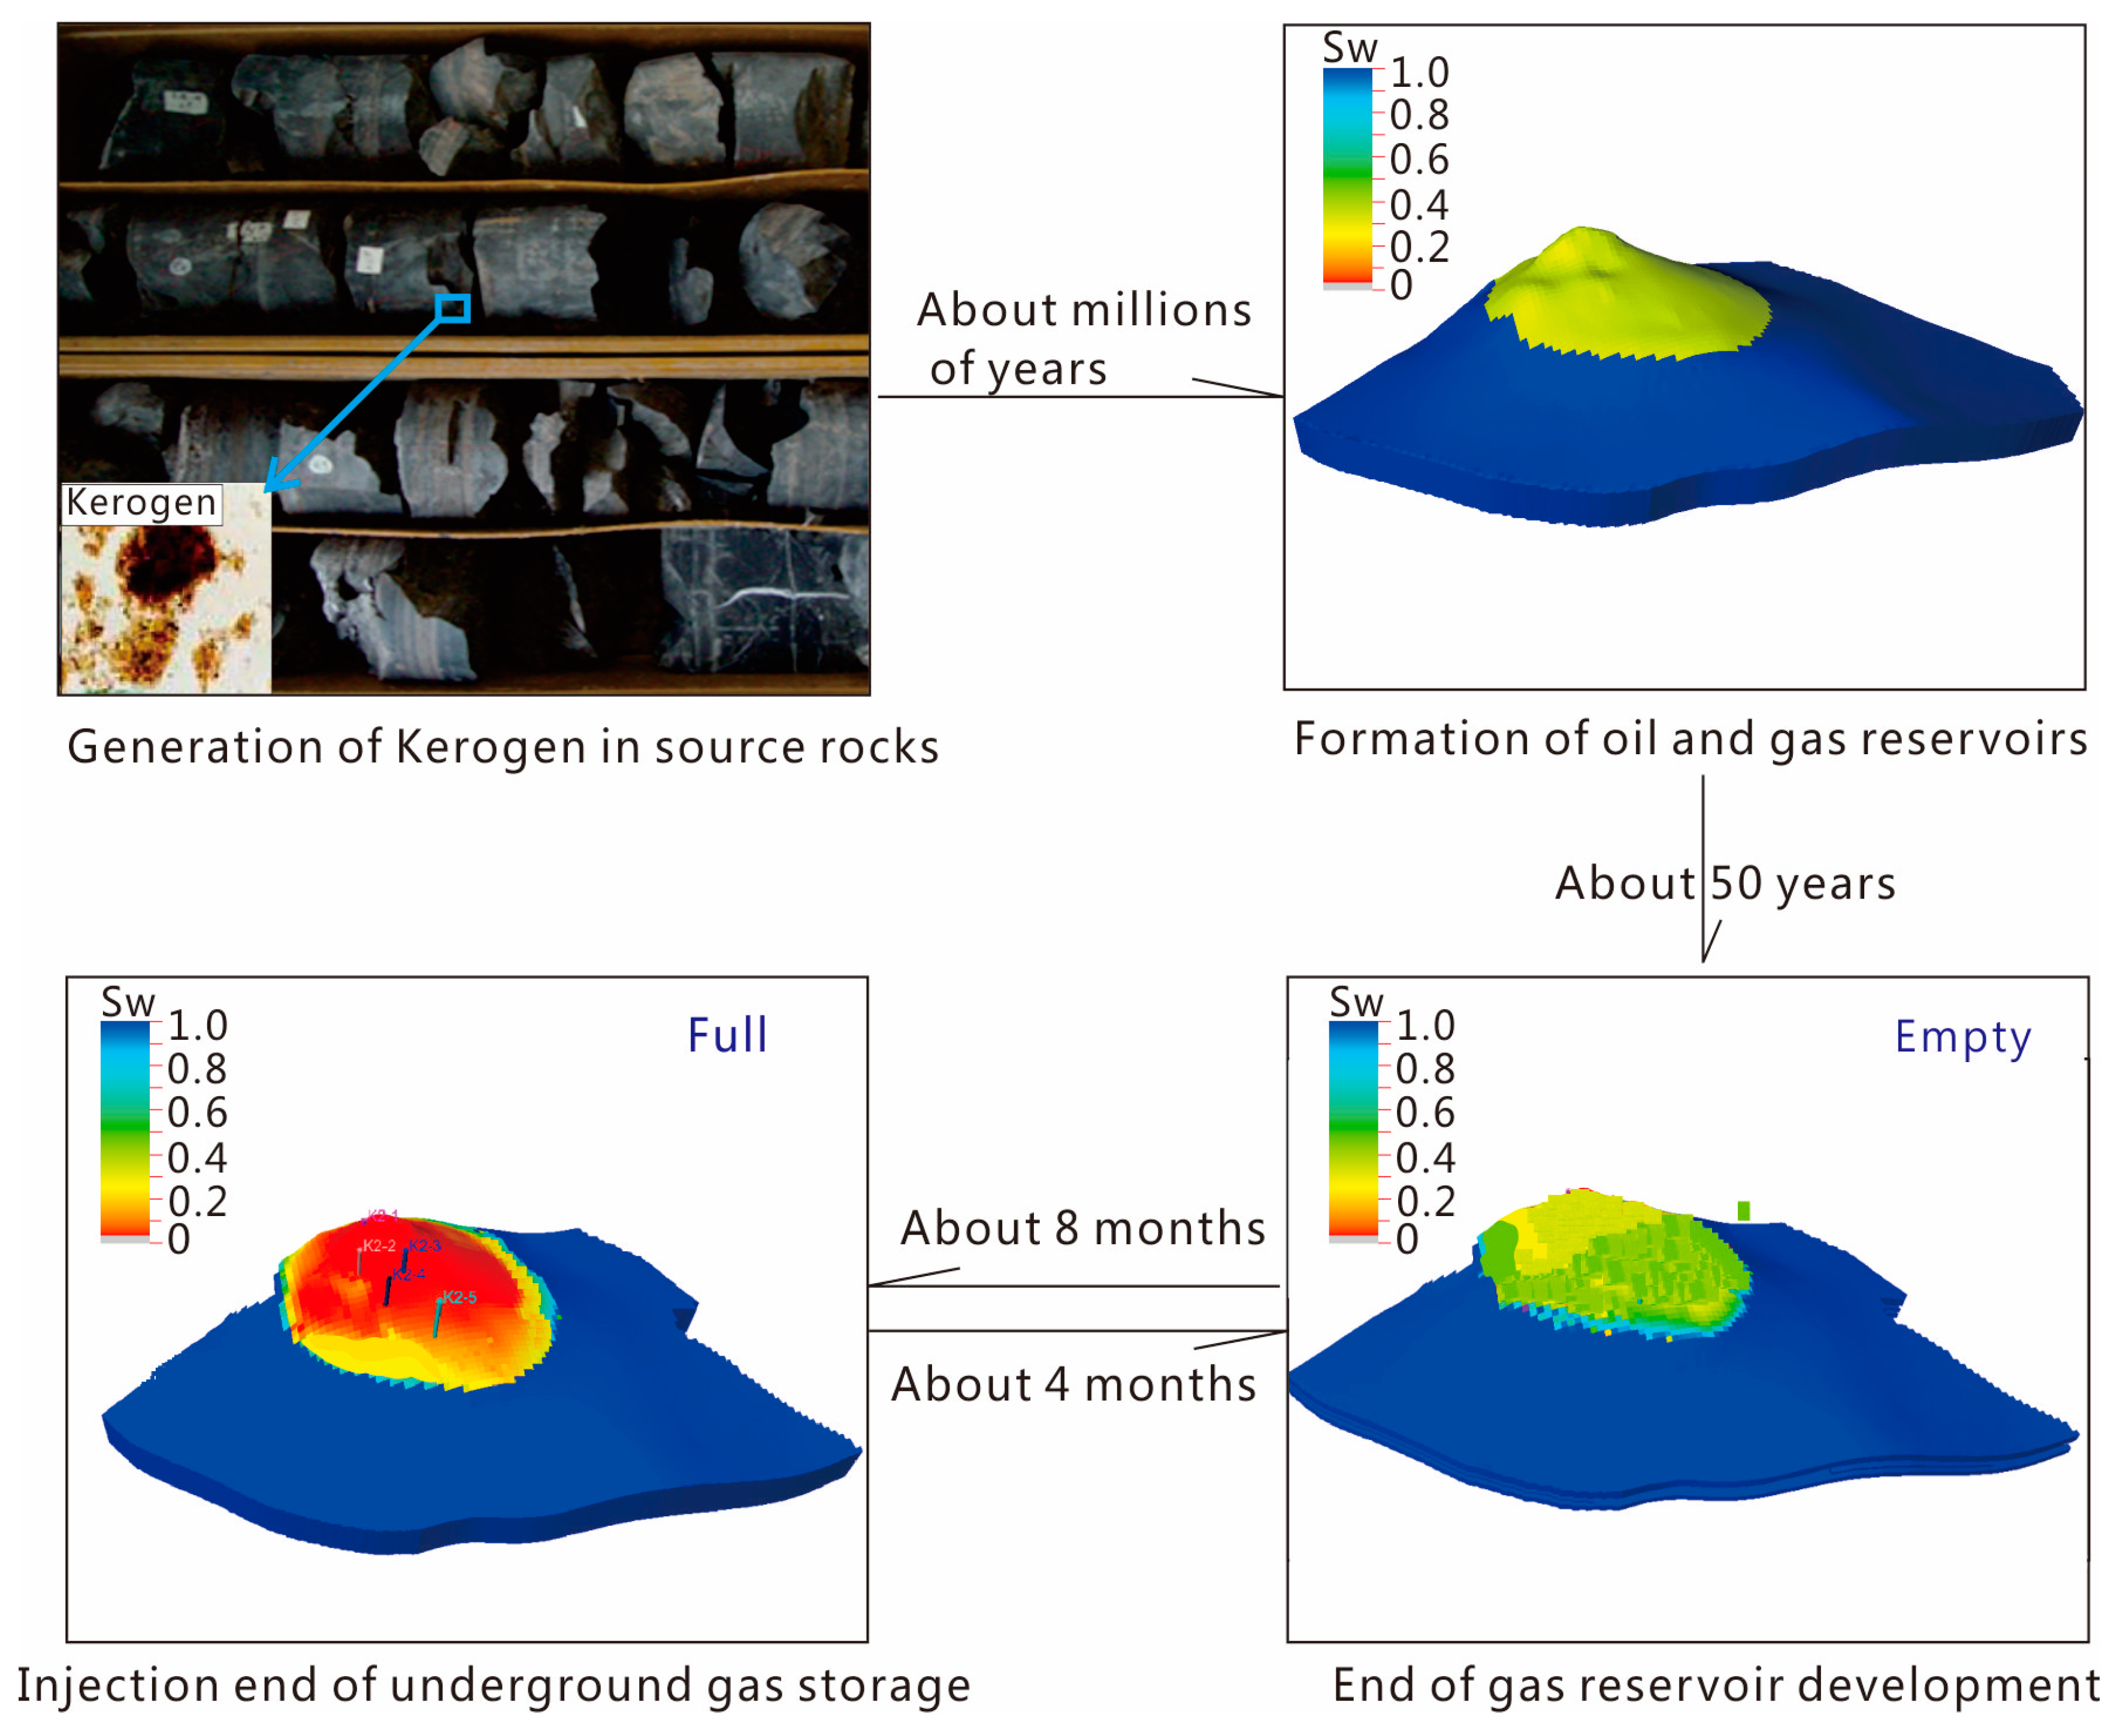
The operation process of underground gas storage is very different from the process of the formation and development of conventional oil and gas reservoirs. These differences are mainly reflected in the fact that the formation of gas reservoirs may take millions of years to tens of millions of years, whereas a gas reservoir will take 30–50 years from development to abandonment. However, the injection and production process of underground gas storage will require one year (eight months for gas injection and four months for gas extraction) (Figure 1). Rapid injection and extraction leads to the rapid filling and release of gas in the reservoir rocks, which embodies a high-strength injection and production process [21]. This is very different from the traditional theory of petroleum geology, oil and gas accumulation theory, and fluid seepage theory, and it also results in some difficulties in the research.
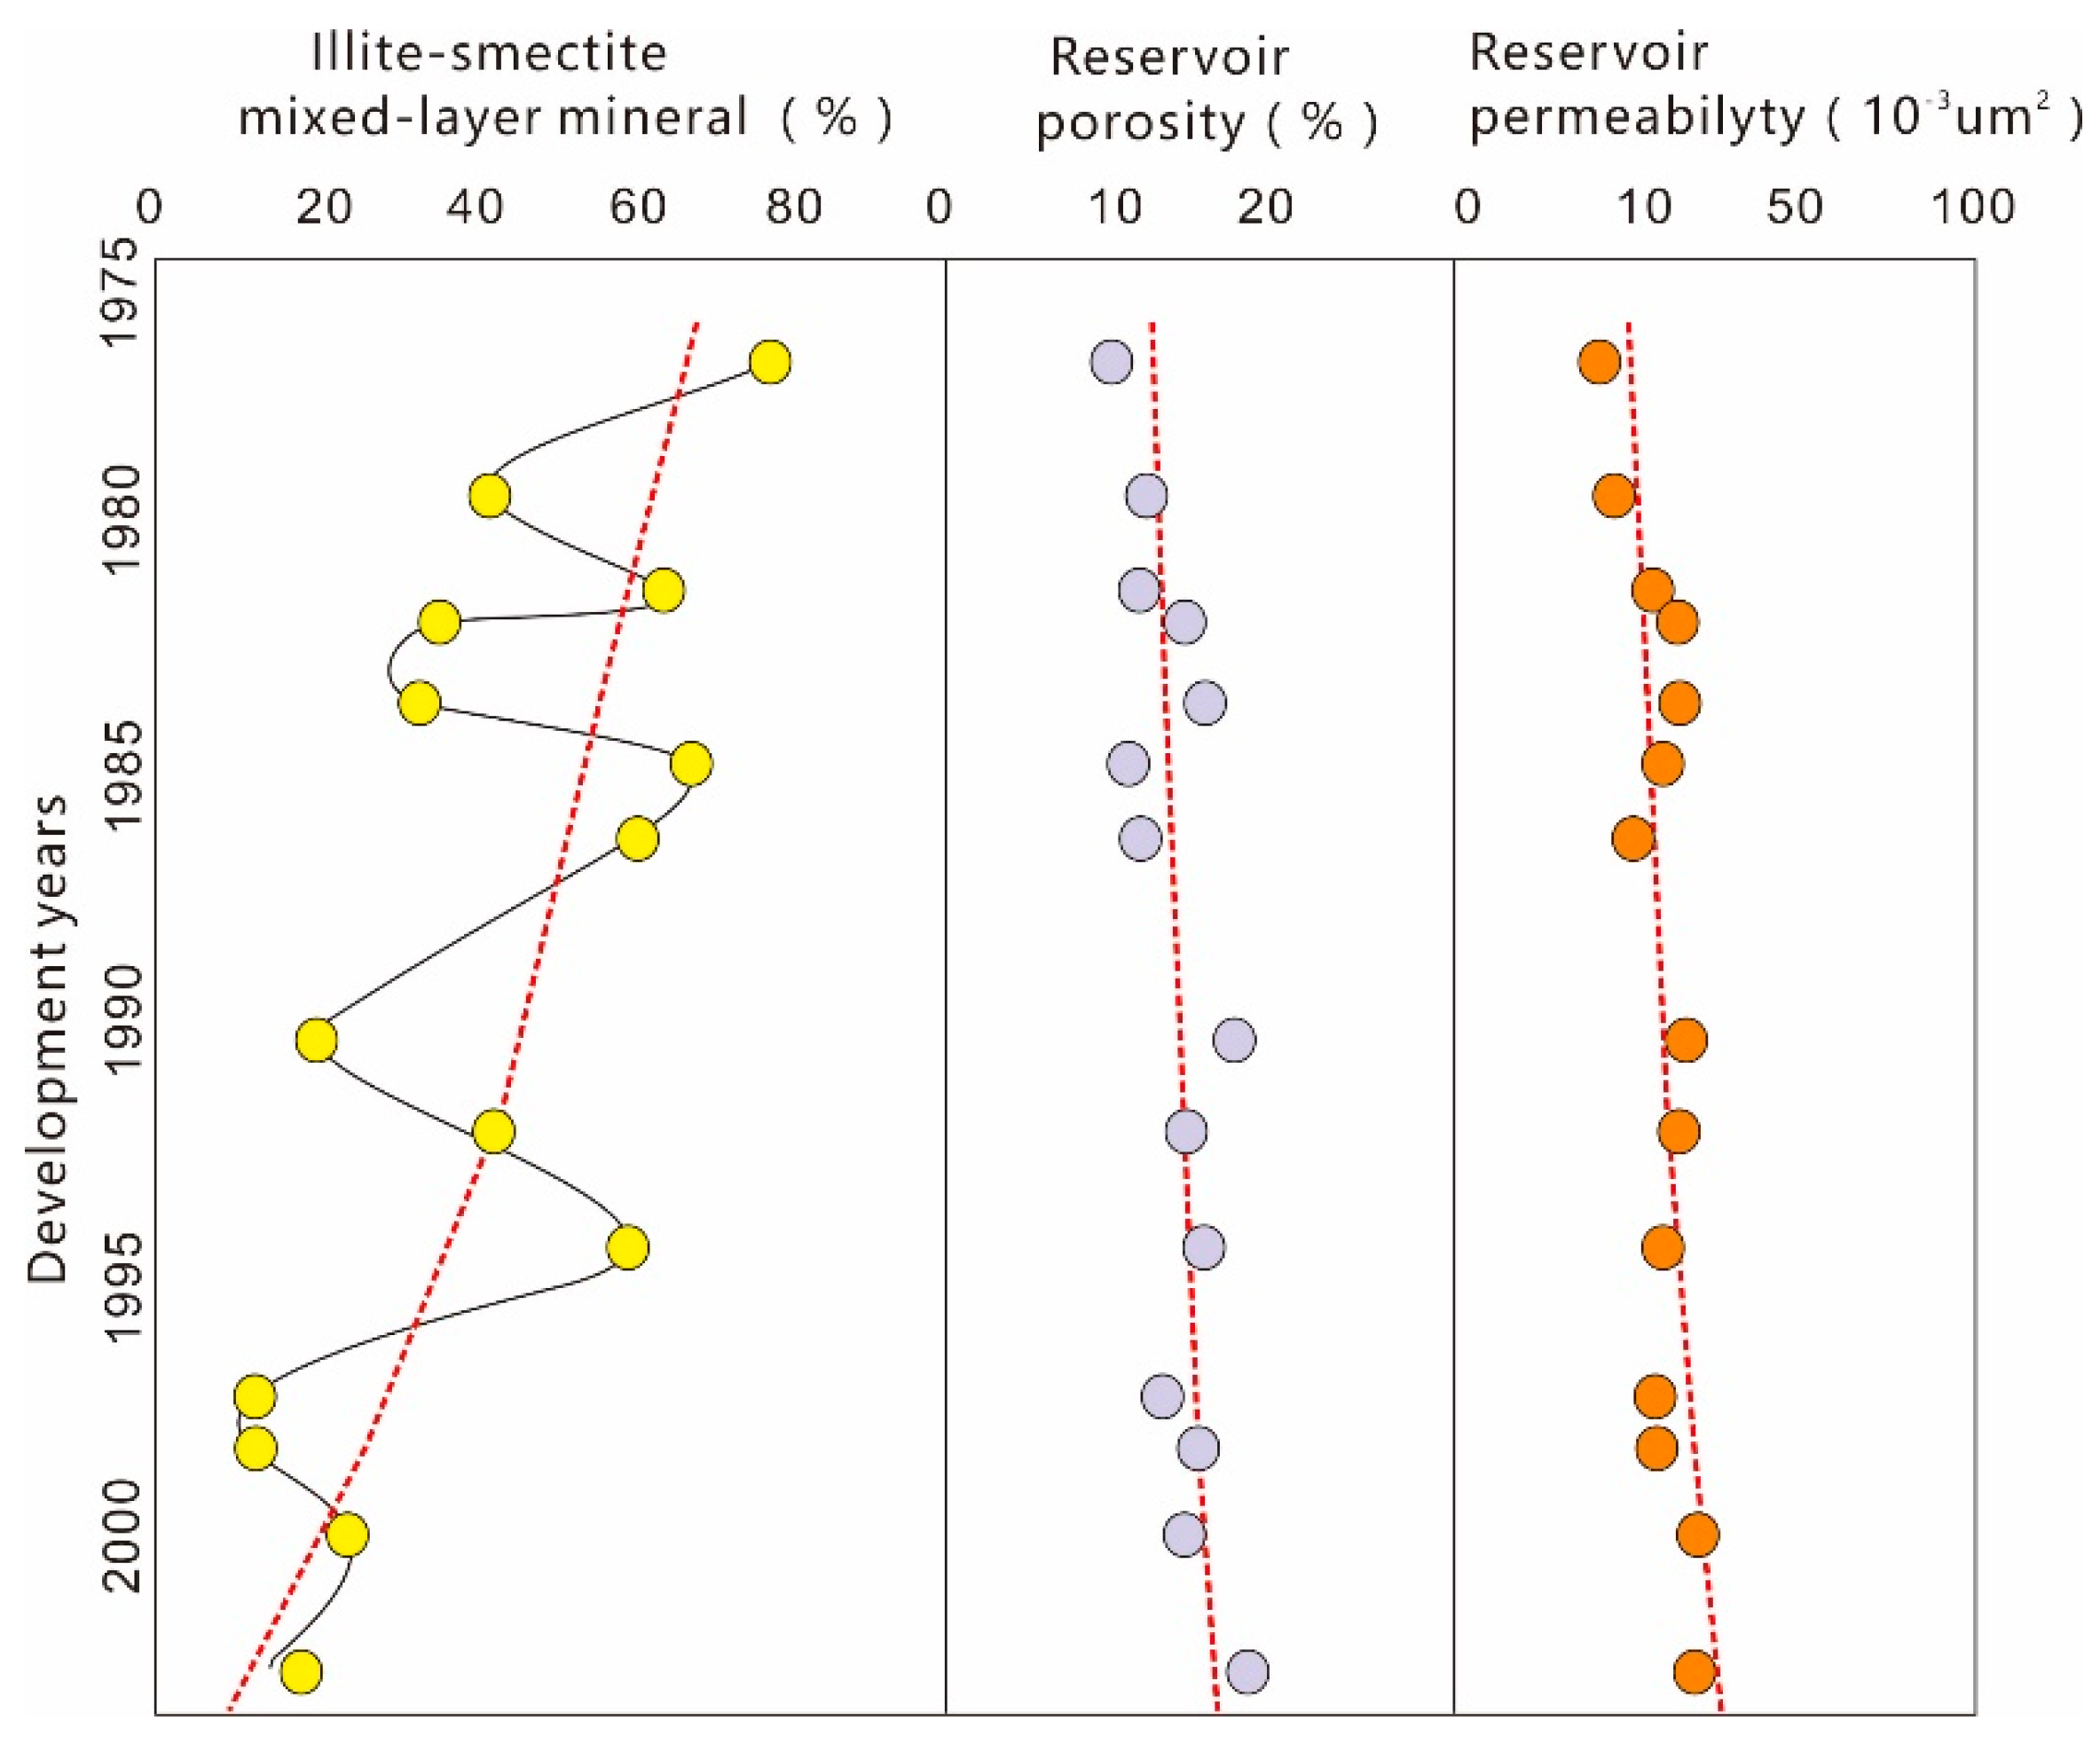
The high-intensity injection and production mode not only changes the rule of fluid seepage, but also has a significant effect on the pore structure of the rocks, thereby modifying the structural characteristics of the primary pores in the reservoirs. For an oil field developed by water injection, the clay minerals in the inner pores of the reservoir will change with the continuous flow of water. In the pore of this reservoir, a change in the illite–smectite mixed layer is the most obvious, and its content gradually decreases, which may increase the porosity and permeability of the rock (Figure 2). However, this type of change in the reservoir permeability is not always positive. Sometimes some authigenic minerals will fall off, which may block the pores and reduce the permeability.
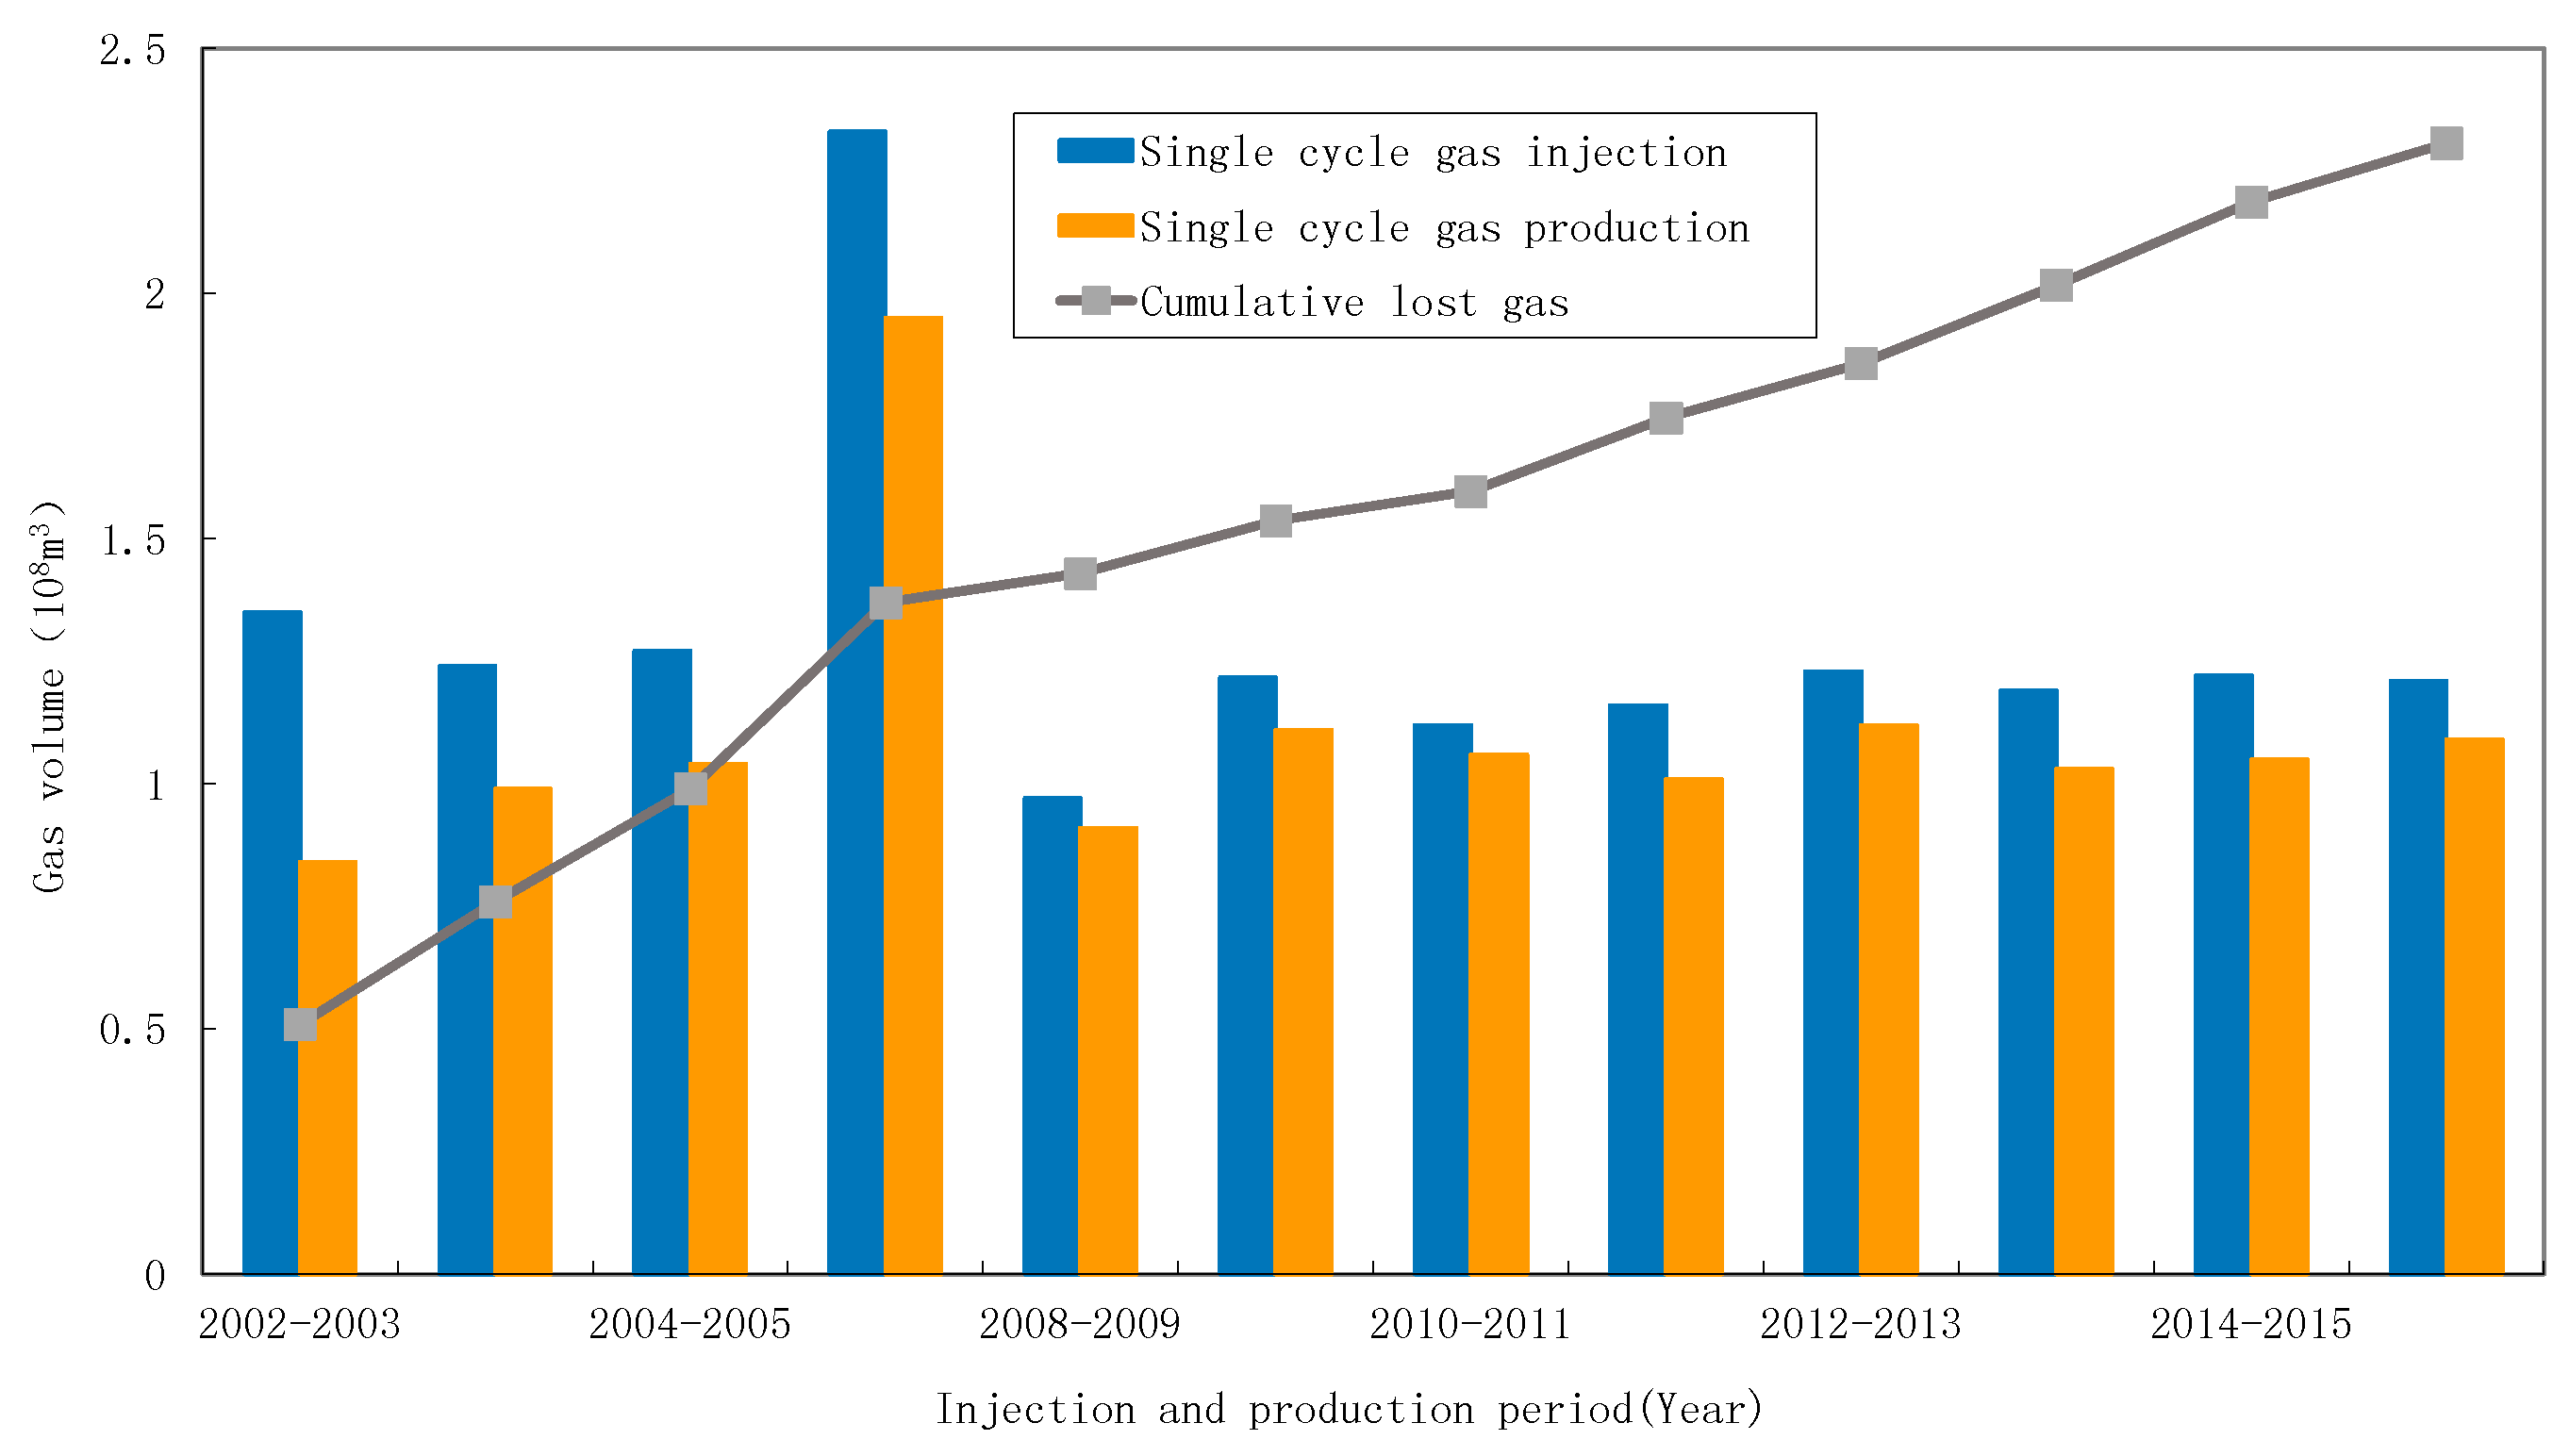
Under the influence of the high-intensity injection and production mode of the underground gas storage, the gas-water seepage law in the reservoir became disordered, causing the usual percolation channels to change, leading to an area where the original gas is difficult to reach and will be filled with natural gas under a high pressure. In such a case, the discontinuity in the residual water in reservoirs may cause the gas to escape; this escaping gas is easily captured by water bodies, resulting in the loss of gas. Therefore, there is a large amount of gas loss in the process of injection and production of underground gas storage. At present, most of the underground gas storage systems in China are associated with a large amount of gas loss, and they have been exhibiting a low efficiency for a long time. The utilization of the J51 underground gas storage in Huabei was suspended in 2012 owing to its low injection and production efficiency. Figure 1 presents the statistical map of the injection and production volume of the B876 underground gas storage in Dagang in North China. The map shows that the gas production in one cycle is always less than that in gas injection (2005–2008 period of abnormal injection production is combined into a cycle), and the loss volume increases with the number of years. At the end of 2015, the total lost gas volume is 2.26 × 10⁸ m3, accounting for 18.7% of the total work volume. Therefore, the underground gas storage operation efficiency was low and the waste of natural gas was serious (Figure 3).
3. Production Mechanism of Lost Gas
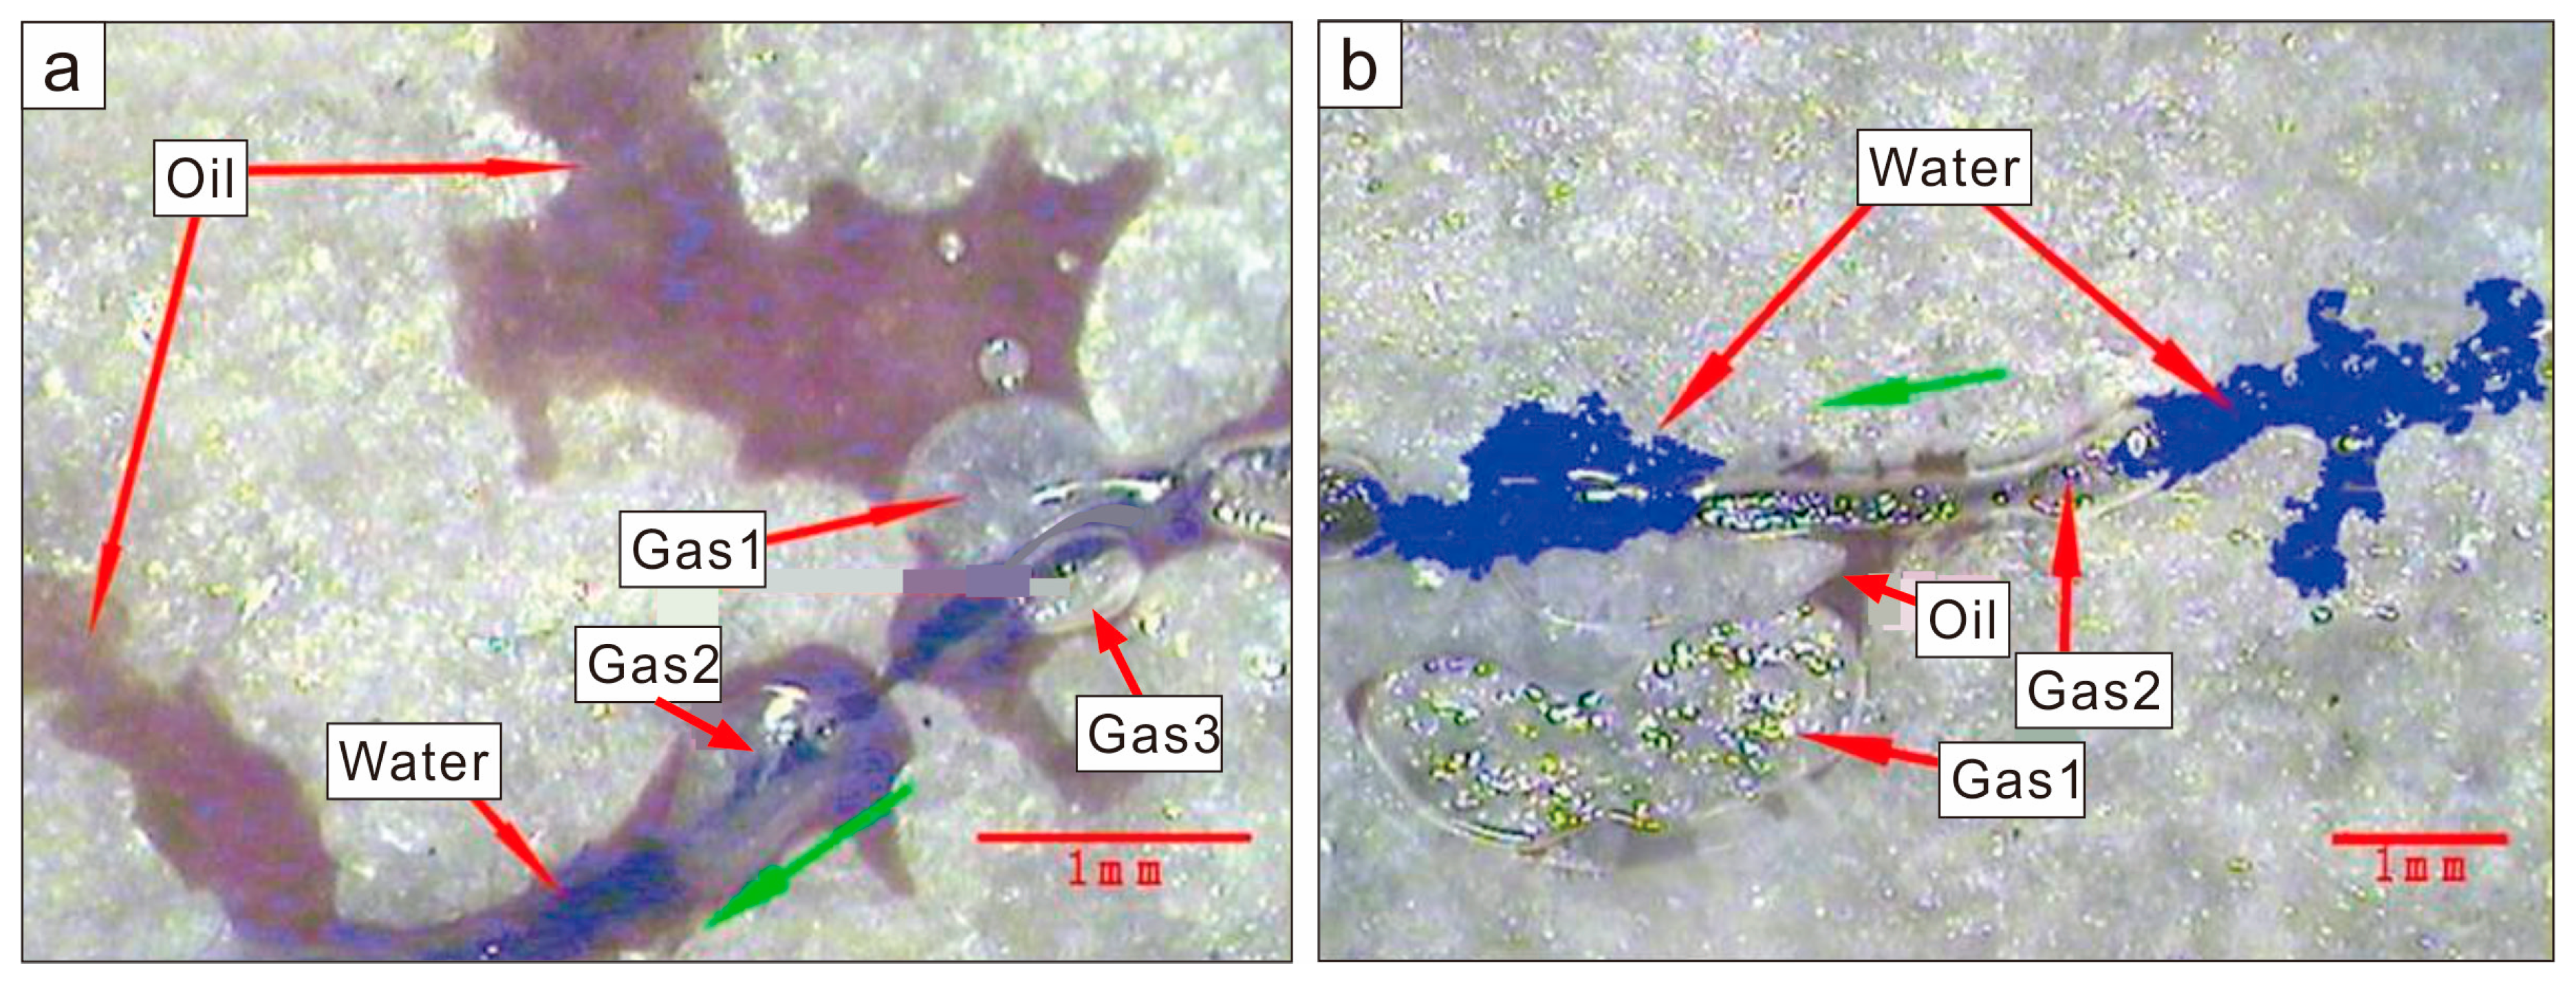
To understand how gas is lost, we first discuss the formation mechanism. Generally, the gas escape channels in the reservoirs are faults, caprock cracks, and connected channels of water bodies. These parameters will be strictly screened when reconstructing the underground gas storage. If there is a possible gas leakage, the gas reservoir will not be converted into an underground gas storage. Moreover, the operating pressure of the underground gas storage is also in a reasonable range. Therefore, for the underground gas storage rebuilt from oil and gas reservoirs, the gas is generally not lost through the cover and fault [22]. Therefore, it can be preliminarily determined that there are two main types of gas losses in the process of injection and production of underground gas storage, except for the gasket. In one case, the gas is captured by a water body, and is called water lock gas (water wrapped gas). In the second case, the gas is captured by the remaining oil. Some of the gas is mixed with oil, and is co-mined. Some of the gas is enclosed in a continuous oil phase to form the oil lock gas (oil wrapped gas) [23]. Figure 4 depicts the microcosmic occurrence of water locked gas and oil locked gas during the high-speed injection and production processes of gas storage.
Compared with underground gas storage rebuilt by a gas–water two-phase gas reservoir, the gas loss of an underground gas storage rebuilt by a gas reservoir with an oil ring will be more serious. Because the simple gas drive water efficiency is high, the gas filling rate in the original gas top area is high, lost gas is mainly water locked gas, and proportion of the lost gas is relatively small. However, for an underground gas storage rebuilt by a gas reservoir with an oil ring, there are three types of fluid in the reservoir. The injected gas has a low diffusion efficiency because it is blocked by the residual oil and water and the gas channeling is serious [24,25,26]. In addition, the crude oil is easily saturated again and dissolves a part of the gas, so that the loss of gas is larger. Statistics show that the filling rate of the original gas cap of the gas–water two-phase underground gas storage can reach up to 80%, whereas the charge rate of the original gas cap of a three-phase underground gas storage is less than 70%, and the filling rate of the oil ring is less than 50%, which is quite different (Figure 5).
3.1. Simulation of Microcosmic Formation Mechanism of Gas Loss
The mechanism of the lost gas can be characterized usually by two approaches. One method uses the physical experimental equipment to characterize the microscopic mechanism of the formation of the lost gas, and the other characterizes the macro accumulation law of the lost gas via numerical simulation. Using these two methods, we can accurately obtain the distribution state and quantity of the lost gas in the process of underground gas storage and injection, and provide guidance for developing this part of the lost gas.
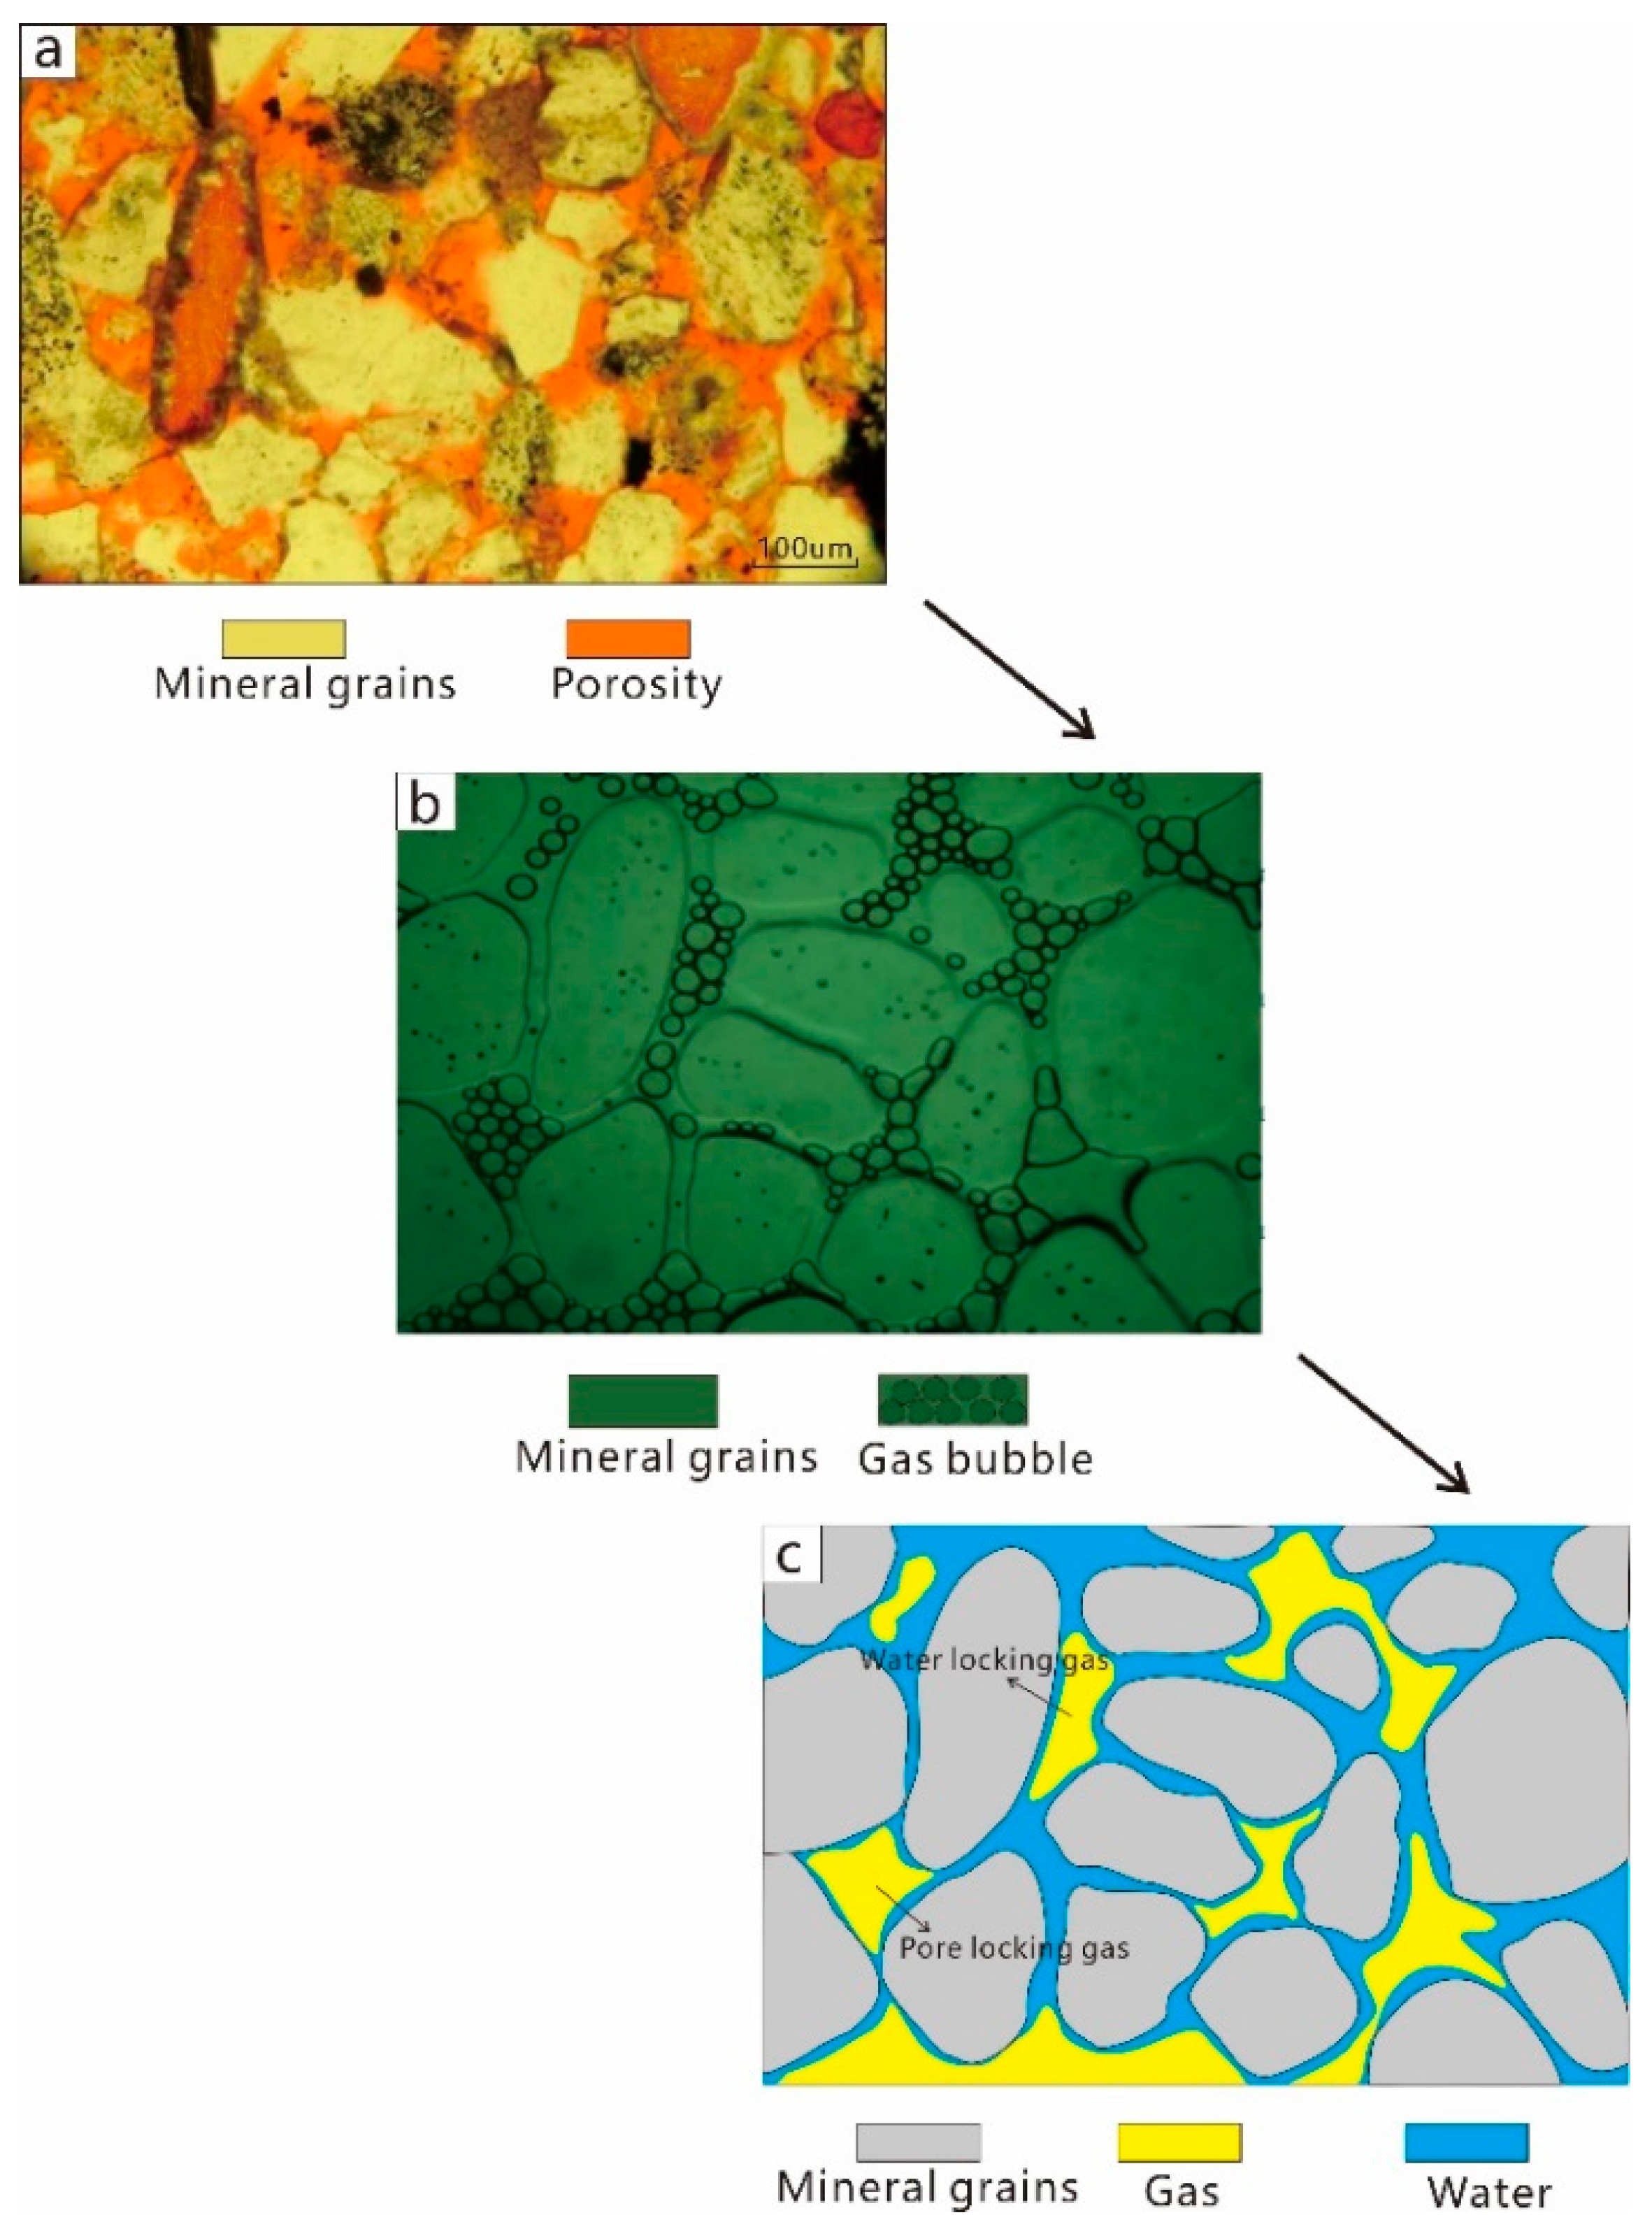
The microscopic characteristics of the lost gas are defined mainly by fluid displacement experiments. In conventional gas–water displacement experiments, although the real core can replace the actual characteristics of the underground porous media, because of its small volume (D = 100 mm, Φ = 25 mm), the characterization of various phenomena will be constrained. For example, under the condition of high-speed injection and production, a small-sized core cannot express the seepage rule between a three-phase fluid and the study of the occurrence law of the lost gas cannot be conducted, and so it cannot be quantitatively characterized. In this study, we use a micro etching model to perform the experimental simulation of the visual fluid seepage rule. This experiment can intuitively describe the accumulation type and occurrence rule of the lost gas, and help develop the qualitative characterization of the lost gas (Figure 6). The main steps of the study are as follows:
- (1)
- The characteristics of the pore throat and clay minerals and wettability of the reservoir are analyzed, and the micro etching model is constructed based on the core analysis data.
- (2)
- The experimental simulations of gas–drive water and water–drive gas are conducted, and the occurrence of a gas–water two-phase flow in the process of displacement and end is observed.
- (3)
- The type of gas loss is categorized according to the experimental results, and the occurrence state of the lost gas is characterized under the microcosmic conditions.
The purpose of glass-etching model displacement experiment is to find out the relationship between gas and water, when the high-speed injection gas meets the residual water. This experiment is widely applied in the field of oil displacement mechanism research, such as the mechanism research of nitrogen foam flooding [27], and the displacement mechanism of heavy oil [28]. However, these experiments are not designed for the high-intensity injection production process of underground gas storage, the injection pressure of these experiments are generally lower than 10 MPa. In this paper, a different experiment has been carried out, the glass clamp holder was modified. With the thickened glass clamp holder, the injection pressure can be raised to 30 MP, which can simulate the high-intensity injection production process of underground gas storage. Thus, the mechanism and state of the loss gas can be obtained under the microscopic condition.
3.2. Macroscopic Quantitative Characterization of Lost Gas
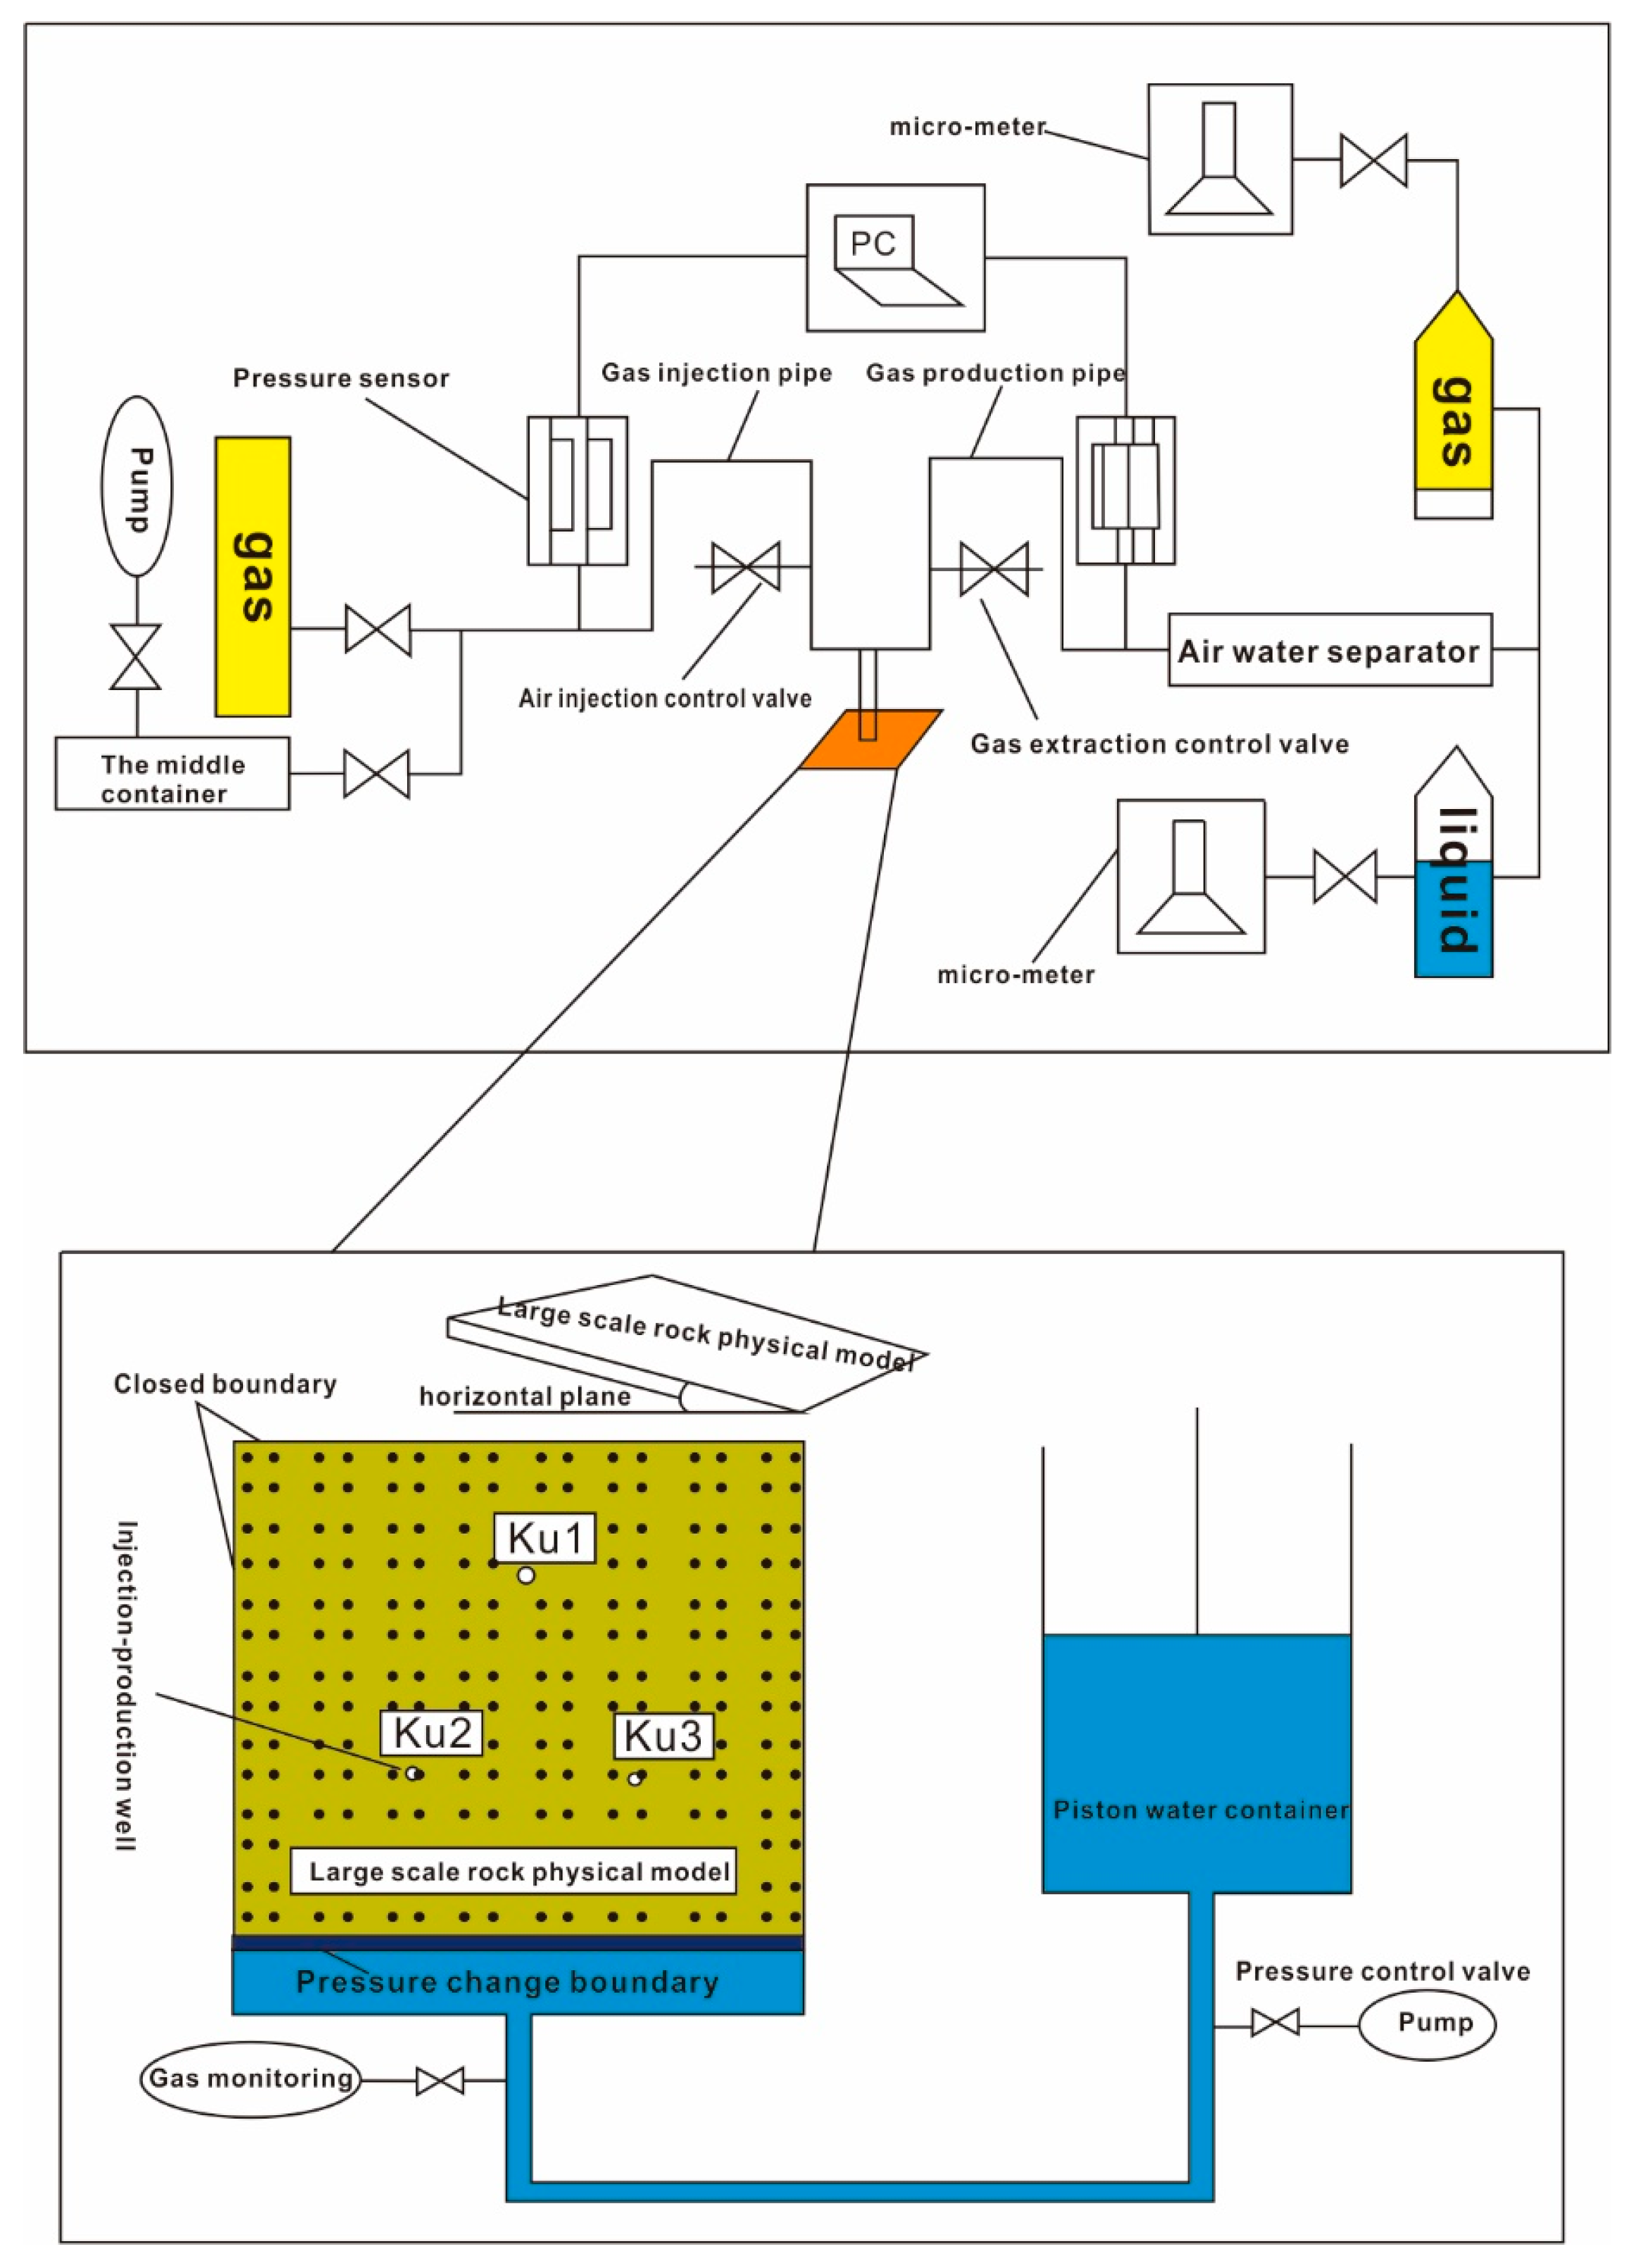
Through the micro etching model experiment, the lost gas sealed by the water in the pore can be characterized. Questions regarding the lost gas formation and presence in actual reservoir rocks and about the quantity of gas sealed by the water body are important issues. However, these problems cannot be solved only by a single etching model. In this view and based on the experiment on the microscopic occurrence mechanism of the lost gas, in this study, we have tentatively designed flat cores (size: 300 mm × 300 mm × 45 mm). The material of these flat cores is artificial quartz sand, which is processed according to the pore structure, grain size, cementation type, and diagenesis type of the real stratum rock core. Compared with the conventional displacement experiments, the experimental equipment and experimental process used in this study are quite different. First, based on the conventional drive experimental device, large-sized core clamping tools, pressure sensing devices, and metering devices used in this experiment are retrofitted. Next, the physical injection and production processes of underground gas storage are simulated using a high-pressure injection and production system. Finally, the lost gas in the injection and production process is quantitatively characterized by recording the liquid and gas flow in the gas injection and recovery processes. Figure 7 displays the simulation system of the high-strength injection and production process of underground gas storage.
There are three well points in this experiment: two wells are near the water body and one well is at a high position. This experiment can simulate the plane of the gas–water production relation and interaction between the fluids. It can simultaneously calculate the amount of gas captured in the water area, and quantitatively describe the lost gas. To simulate the gas–water exchange during the injection and production process, an active water body is added to the bottom of the rock heart, which is connected to a pressure-sensitive device. In the process of gas injection, the gas pushes down the water body, which simulates the backflow of the underground gas storage. During the process of gas production, the water body moves upward under a pressure control, which can simulate the water invasion of the underground gas storage.
Based on the large-sized core displacement device and the actual geological conditions, three large-sized cores are prepared, such that their permeability and porosity parameters are different. A total of 15 cycles of the gas–flooding water and gas production experiments are completed, and the lost gas in the process of high-speed gas injection and gas production under saturated water conditions is obtained (Table 1).
The flat sand rock injection and production experiment device is specially designed by the research members in our group based on the injection and production characteristics of the underground gas storage. Compared with others, this experiment has two advantages:
- (1)
- It can significantly increase injection pressure, the highest injection pressure can reach 50 MPa, can accurately simulate high intensity injection production process.
- (2)
- The experiment can simulate the gas production process, because a moving water body is connected to the bottom of the rock, this equipment can provide pressure for the gas recovery process.
By using this experiment equipment, the lost gas ratio in the injection and production process of underground gas storage can be simulated, and its volume can be quantified. According to the experimental results, the lost gas in a 300 × 300 × 10 mm plate rock is about 20% of the total injected gas volume, which is similar to the actual underground gas storage (17%). The experiment also provides guidance for the high-intensity injection and production numerical simulation of underground gas storage.
4. Mathematical Model of High-Strength Injection and Production Process
As the operation of underground gas storage is a high-strength injection and production process, the internal pressure increases linearly with the increase in the gas injection rate. Therefore, we need to consider the deviation caused by the inertial force of the high-speed flow of gas and modify Darcy’s law. When considering the lost gas, we should also modify the left side of the equation. When we build mathematical models, we first obtain the amount of the lost gas based on the data from the physical experiments, and then establish its functional relation with the rock permeability, water content, and injection rate. In accordance with this formula, the conventional injection production equation of gas storage is corrected, and a mathematical model for describing the lost gas accurately in the high-intensity injection and production process is established [29].
At present, most studies are based on the basic law of gas seepage and Darcy’s linear law, and various mathematical models are established with stable and unstable seepage. These models assume that the high-pressure physical parameters of the gas are constant, and they are obviously not satisfied with the requirements for the numerical simulation of the gas storage. In the process of the high-speed injection and production in underground gas storage, the actual gas seepage is an unstable nonlinear process. Because of the rapid change in the formation pressure, the high-pressure physical parameters of natural gas vary with pressure. Natural gas flows according to the non-Darcy seepage law, and the seepage process is more complex [30,31].
Therefore, in view of the “high-speed” characteristic of the process of injection and production in underground gas storage, the following basic assumptions are made:
- (1)
- The fluid in the reservoir has two phases of gas and water, and the flow process of the fluid remains isothermal.
- (2)
- The viscosity, compression factor, and compression coefficient of natural gas change with the change in pressure.
- (3)
- The flow of natural gas in the pores is a high-speed non-Darcy percolation, whereas the water phase satisfies Darcy’s linear law.
- (4)
- Because the compressibility of the injected gas is much higher than the compressibility of the pores, the elasticity of the rock is ignored.
4.1. Equation of Motion
The classical Darcy’s law will be not be applicable when a gas is percolating at a high speed in a pore. Under this condition, the generally accepted view is that with the increase in the flow velocity, the departure from Darcy’s law is first caused by an inertia effect and then by a turbulence effect.
At present, the starting point of the non-Darcy flow description is based on a classical equation proposed by Forchheimer in 1901:
Based on Formula (1), the original Forchheimer equation can be generalized to a multiphase flow:
In Equations (1) and (2), L represents gas, oil, or water; PL represents the pressure of the fluid; its unit is MPa; VL represents the flow rate of the fluid; its unit is cm/s; νL represents the fluid viscosity; its unit is mPa·S; KrL represents the relative permeability of the fluid, and it is non–dimensional; ρL represents the density of the fluid; its unit is g/cm3; βL represent each phase of the non-Darcy coefficient, its unit is cm−1; and g represents the acceleration of gravity; its unit is cm (S2)−1.
At present, non-Darcy coefficient βL in the development well is generally determined by the analysis of the pressure test results of the gas production, but these data are not always valid. A more widely used method is the empirical relationship established by Geertsmaand et al. [32,33].
The empirical expression for a single-phase flow by the Geertsma method is as follows:
The empirical expression for a multi-phase flow by the Geertsma method is as follows:
In view of the gas phase non-Darcy flow, two methods have been proposed by Fredrick and Graves to determine the non-Darcy coefficient:
In Equations (3)–(6), Swr represents the bound water saturation, and it is dimensionless; Phi represents porosity, and it is dimensionless; and Krg represents the relative permeability of the gas phase, and it is dimensionless.
In fact, the above empirical equations exhibit a good consistency in their form, and they can be summed up as the following expression:
In Equation (7), α, N1, and N2 are all empirical parameters, and these coefficients are all 0, except for the gas phase, i.e., only the non-Darcy flow of the gas is considered.
4.2. State Equation
Because the pressure increases or decreases very rapidly in the process of injection and production in underground gas storage, the high-pressure physical parameters of natural gas can no longer be regarded as constants. In the gas state equation, the dynamic variation in compression coefficient Cg, compression factor Z, and viscosity μg should be reflected.
The gas state equation is as follows:
where γg represents the relative density of natural gas, and it is dimensionless; Ma represents the air molecular mass; its unit is g/(mol); Z represents the natural gas compression factor, and it is dimensionless; T represents the formation temperature; its unit is K; and R represents the universal gas constant, its unit is (kPa·m3)·(mol·K)−1.
The isothermal compression equation of natural gas is:
The calculation of the natural gas compressibility factor is based on the compression factor calculation model established by Dranchuk [34] (Referred as the D-A-K method). It is obtained by fitting the Standing–Katz chart with the Starling–Carnahan equation of state. Its expression is as follows:
In Equations (10) and (11), A1–A8 are constants; Tpr is the corresponding temperature; its unit is K; ppr is the corresponding pressure; its unit is MPa; and V is an intermediate variable.
Specifically, A1 = 0.31506237, A2 = −1.04670990, A3 = −0.57832729, A4 = 0.53530771, A5 = −0.61232032, A6 = −0.10488813, A7 = 0.68157001, and A8 = 0.68446549.
The calculation of the natural gas viscosity adopts the Lee–Gonzalez–Eakin relation:
In Equation (12), X and λ are intermediate variables, and they are defined as follows:
In Equations (13) and (14), Mg represents the molecular mass of natural gas, and its unit is g/(mol).
4.3. Conversion of Natural Gas Pressure and Pseudo Pressure
The integral function of the gas pseudo pressure was proposed by Alhussaing and Ramey [35], and the integral expression is as follows:
The calculation methods for the pressure function include analytic, semi analytic, and numerical integration methods. Usually, the pressure function is calculated by the numerical integration method based on the components of natural gas. In this study, the numerical integral method is used to calculate the pseudo pressure of the gas phase, and the formula can be written as:
4.4. Continuity Equation
According to the above formula and law of conservation of matter, the continuity equation for the mass conservation of the gas can be expressed as follows:
Gas phase:
Water phase:
In Equations (17) and (18), Sg and Sw are the gas and water saturation, respectively, and they are dimensionless.
Equation (2) can be rewritten as:
where:
Therefore, the equation of motion of the gas phase can be written as:
The water phase still follows Darcy’s law, and its motion equation is as follows:
In Equations (21) and (22), D represents the elevation, which is based on the depth (elevation) in the vertical direction of the reference surface, and its unit is cm.
Equations (21) and (22) are replaced by Equations (17) and (18), to yield:
Gas phase:
Water phase:
Neglecting the gas gravity and the compressibility of the pores, the mass conservation equation can be obtained:
Gas phase:
Water phase:
4.5. Auxiliary Equations
Saturation equation:
Capillary pressure equation:
In Equation (28), pcgw represents the capillary pressure, its unit is MPa.
Equations (25)–(28) together with the fixed solution conditions constitute a complete mathematical model of the high-speed non-Darcy flow, in which the dynamics of the gas PVT is considered.
On the basis of this model, the numerical simulation of the high-strength injection and production processes of the Ban 876 underground gas storage is conducted. The main simulation parameters are the injection production gas, loss of gas, injection production pressure, and pressure diffusion.
5. Numerical Simulation of High-Strength Injection and Production Process
On the basis of the previous physical experiments and mathematical models, the Ban 876 sandstone underground gas storage is selected as an example, and a 3D gas mixing model is established that can characterize the gas–water nonlinear seepage law in the high-intensity injection production process. According to the dynamic operation data of the gas reservoir, the actual amounts of the injection and production in the entire the period are fitted. Based on the qualified fitting effect, the directions of the gas flow in the gas injection process and of water coning during the production process are predicted, and the macroscopic movement of gas and water and the breathing passage are clarified. The gas–water macroscopic movement law is determined, and the main channel of the fluid rapid seepage is clarified [36]. Accordingly, the distribution of the lost gas in the Ban 876 underground gas storage is analyzed and defined, and the loss gas is quantified. Effective technical countermeasures for the loss of gas movement and potential digging in the operation of this type of underground gas storage are proposed [37].
5.1. Numerical Simulation Division of Ban 876 Underground Gas Storage
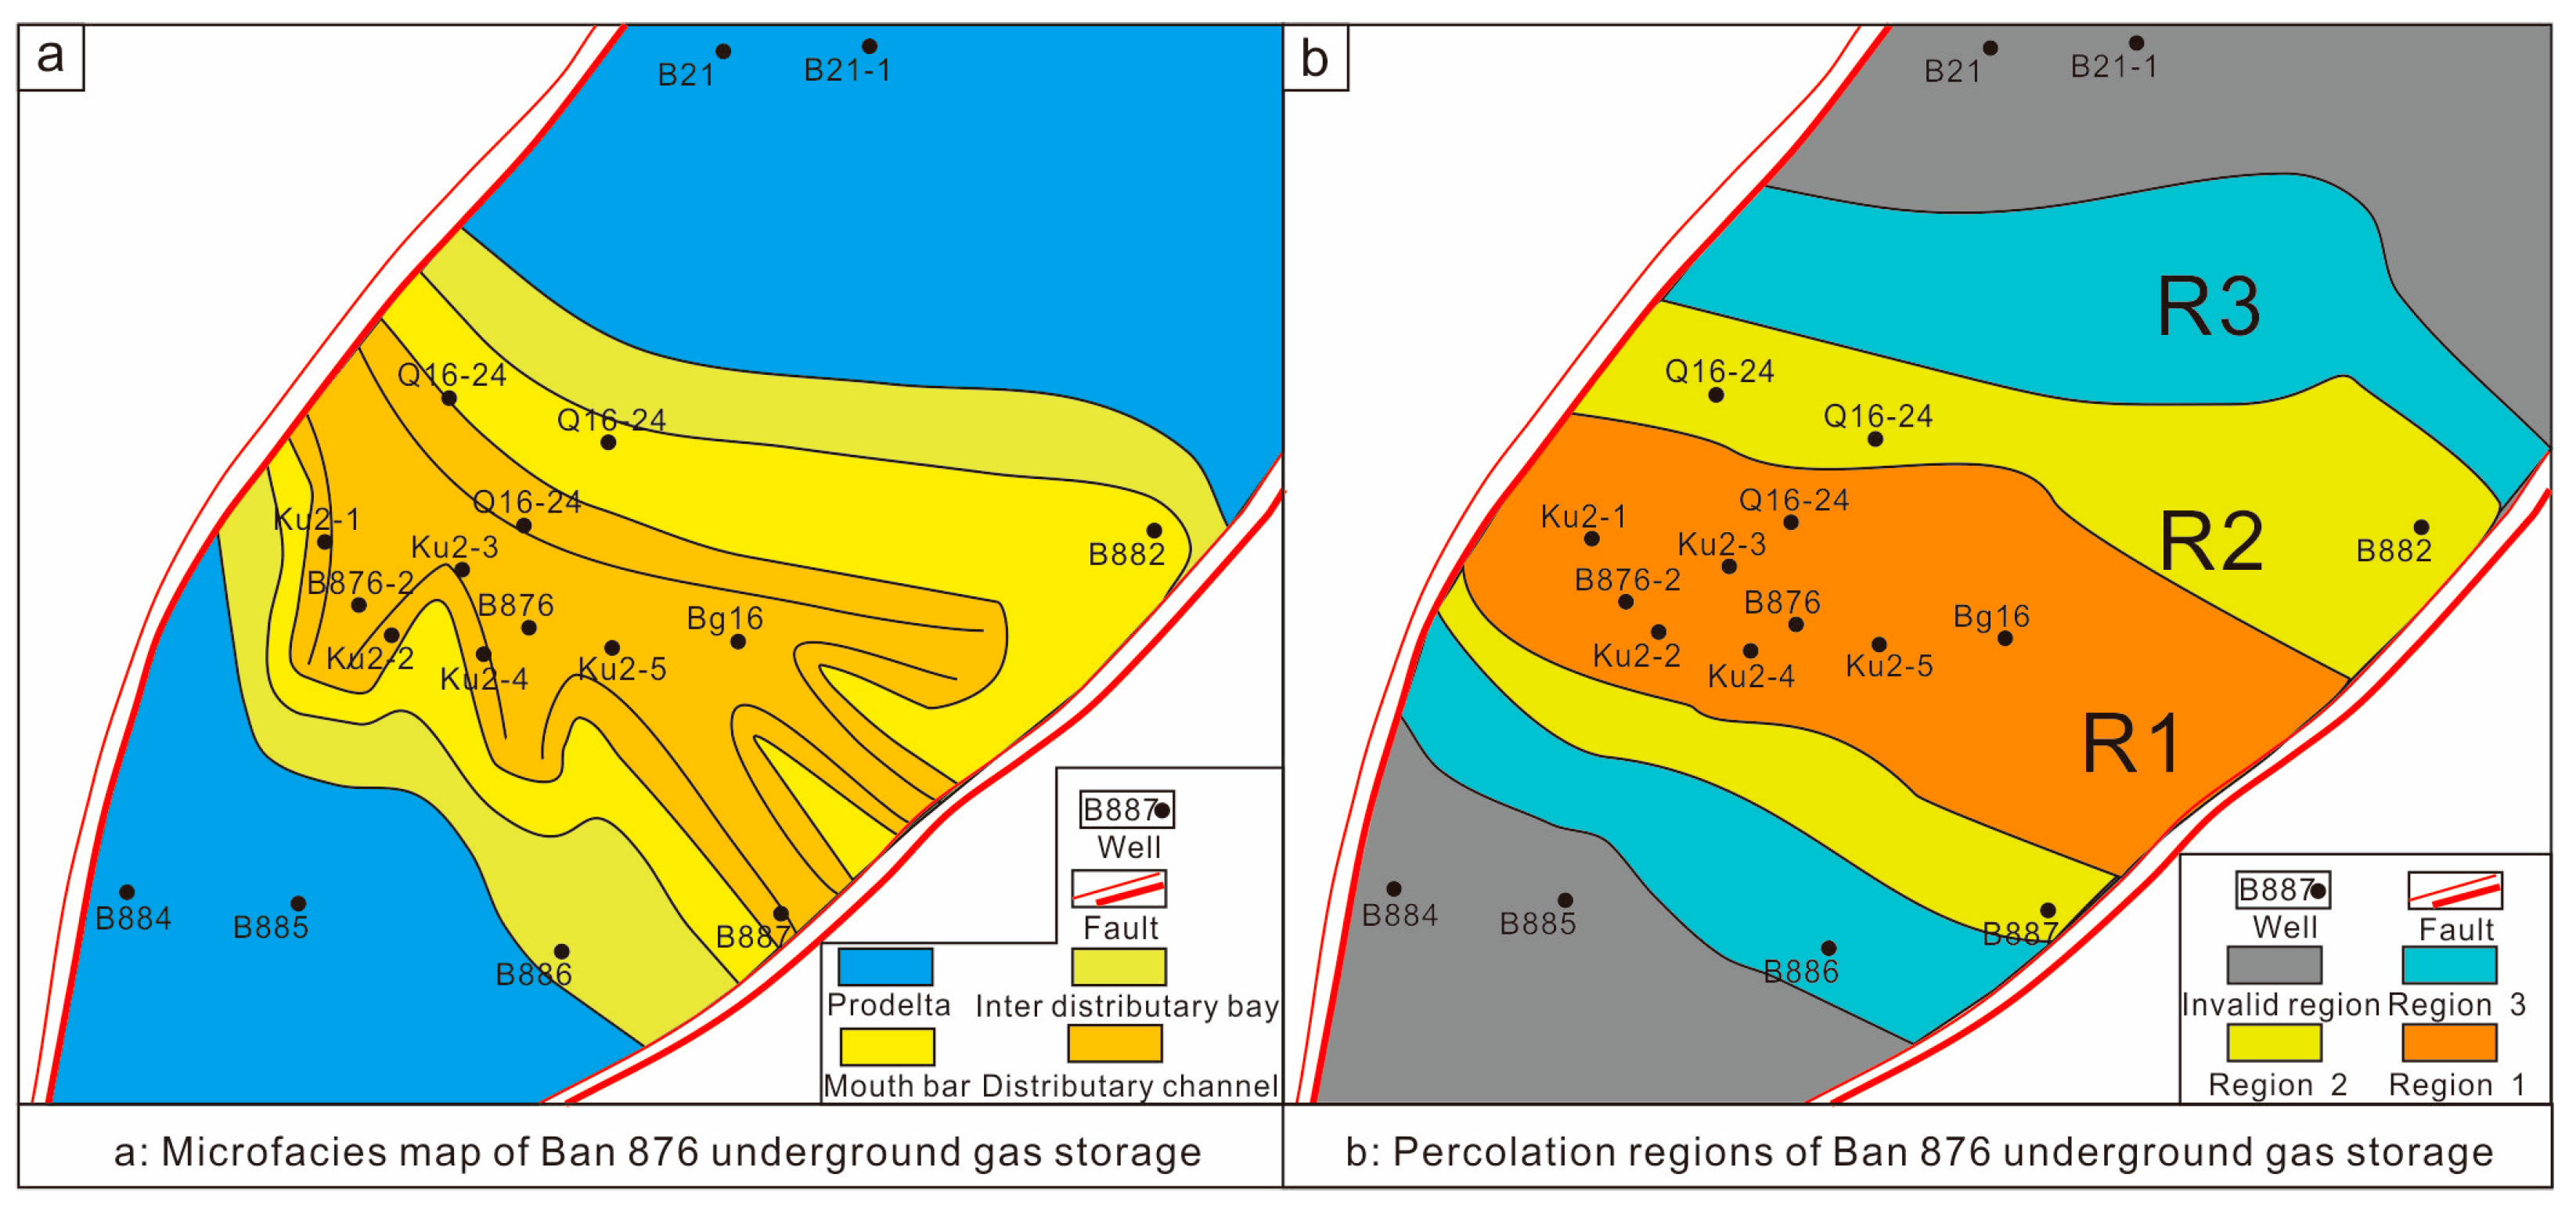
The distribution rules of the physical property (porosity, permeability) of sand are affected by the different sedimentary microfacies and flow units. To reflect the effect of different sand body types and physical properties on the fluid seepage, it is necessary to divide the numerical simulation model into different percolation zones according to the distribution of the sedimentary microfacies and flow units. Ban 876 underground gas storage can be divided into three sedimentary microfacies in the plane: the middle part is the channel sand body, other side is the mouth bar sand body, and sheet sand. The sand body thickness and physical property change significantly from the middle to the both the sides. The distribution of the flow units inside the sand body is controlled by the sedimentary microfacies. The flow performance of the main channel is relatively good, but the flow property of the thin sand body at the edge is reduced. There is a certain regularity in the physical distribution of the Ban 876 underground gas storage. Sand bodies which is formed by the channel deposition are usually located in the central part, with good physical properties, and most of them belong to first-class reservoirs. The injection production wells of the gas storage reservoirs are also located on the channel sand bodies.
According to the study of the distribution law of the sedimentary microfacies and flow units, the Ban 876 underground gas storage is divided into three different percolation regions. Numerical simulation is conducted in different seepage zones using different relative permeability curves to reflect the actual seepage characteristics of each area to improve the fitting rate of the gas–water movement rule in the underground gas storage (Figure 8).
5.2. High Pressure Physical Parameters of the Natural Gas
The static parameters of natural gas and reservoir are basic parameters for numerical simulation, such as pressure, temperature, density and so on. These parameters determine the state of fluid and control their seepage rules, the exact numeric value must be given according to the results of the physical experiment (Table 2).
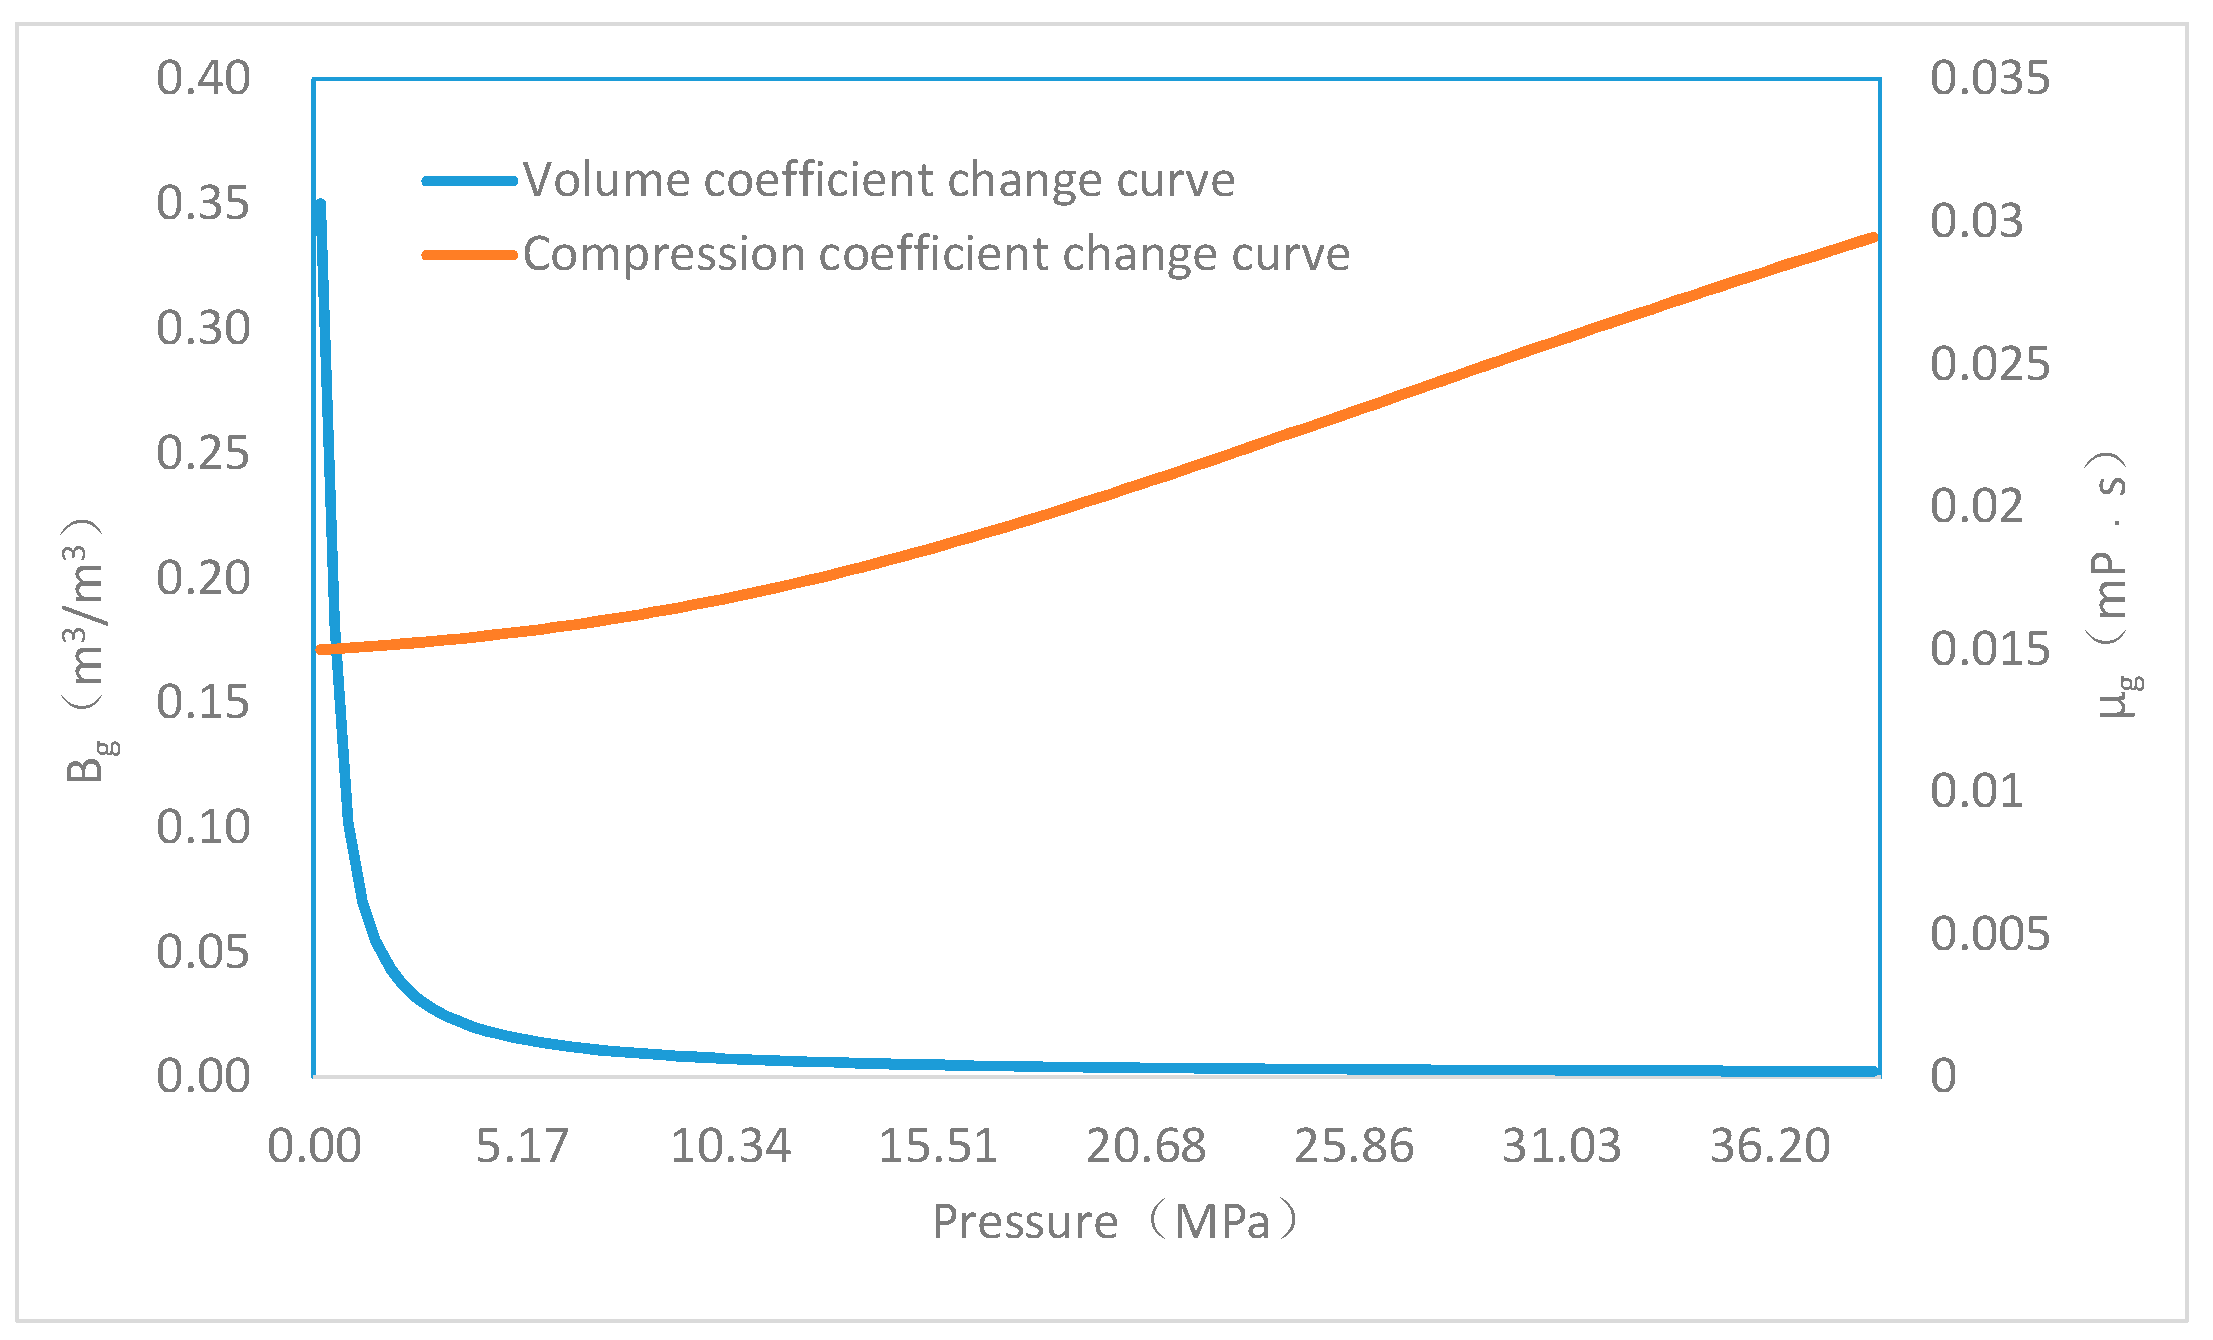
The compressibility factors, volumetric coefficients, compressibility and viscosity of natural gas vary with the pressure of gas reservoirs. It is of great practical significance to quantitatively describe the change rules of these parameters for numerical simulation (Figure 9).
5.3. Gas–Water Macroscopic Motion Law in the Process of Gas Injection
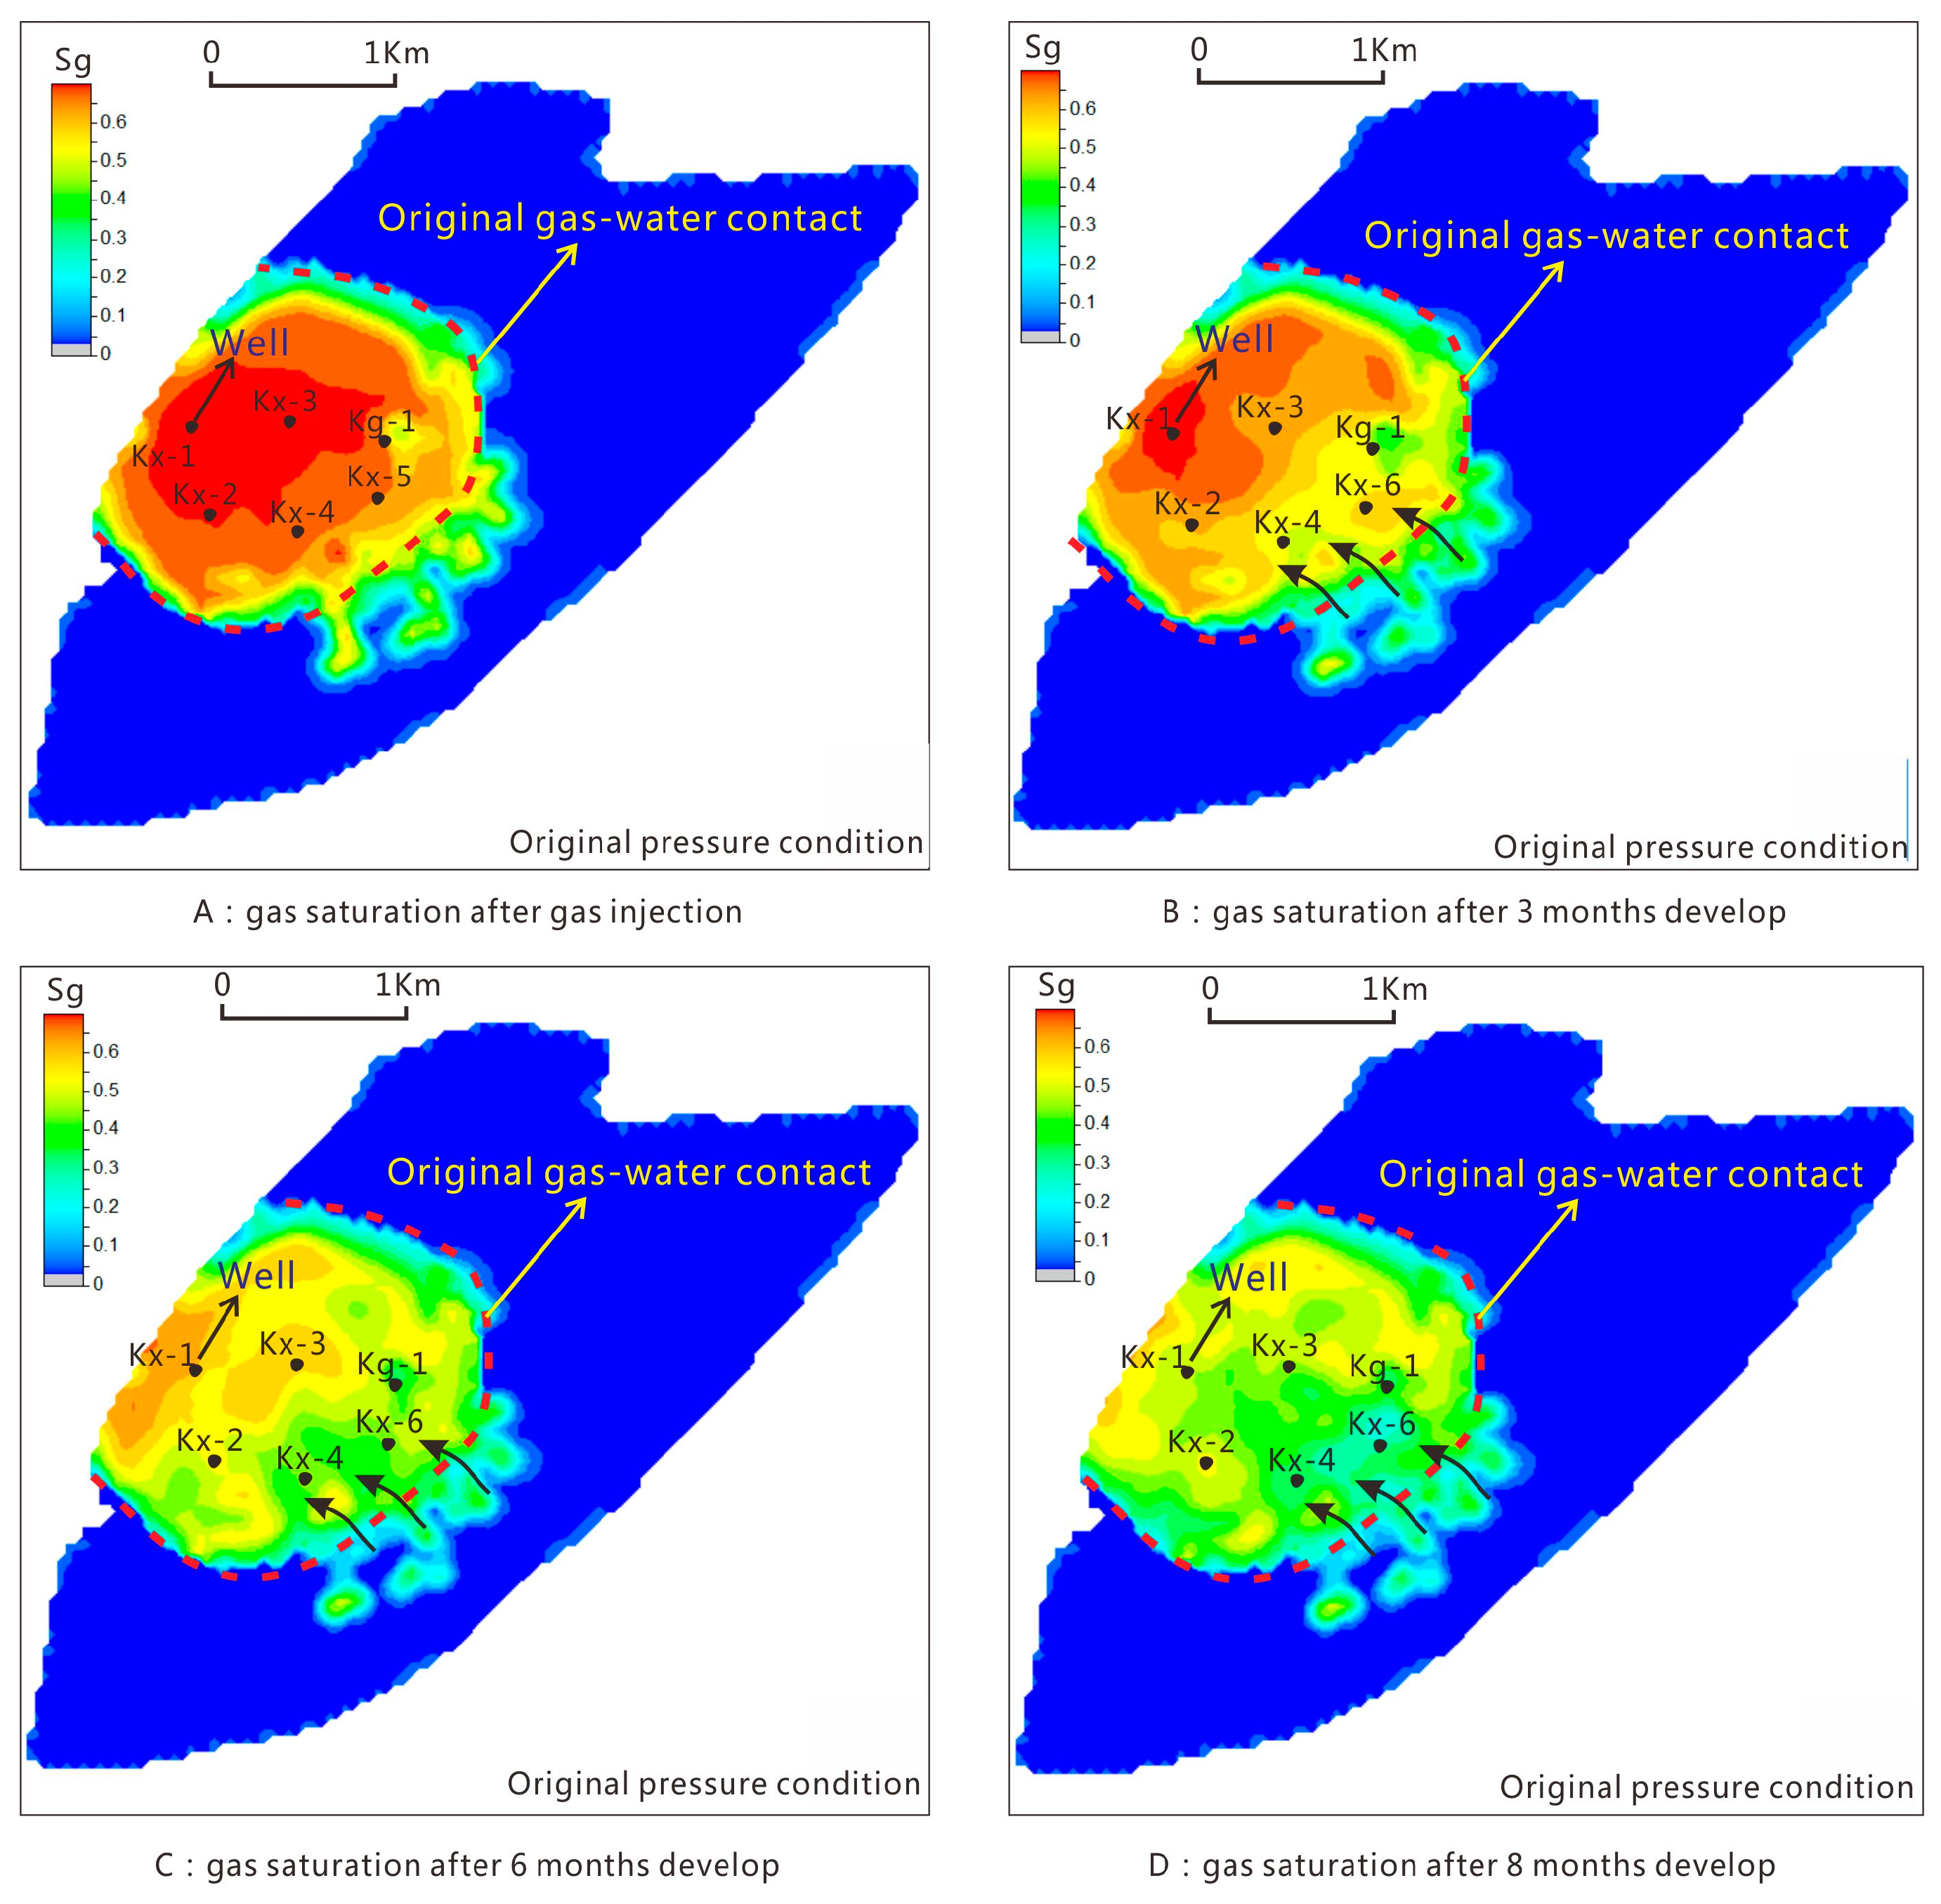
Figure 10 displays the gas saturation distribution map in different gas injection periods of the Ban 876 underground gas storage. The following conclusions can be obtained by the analysis of the chart:
- (1)
- In the process of gas injection, the main migration channel of the gas is the sand body with a high physical property that is the extension direction of the braided channel. Along this channel, the gas rapidly advances to the southeast and enters the water body to form a lost gas.
- (2)
- In other directions of poor physical property, such as the sand bar on both sides of the braided channel and sand sheet, as the pressure gradient of the gas flooding in this area decreases, the diffusion of the gas becomes slow and the gas front does not change obviously.
- (3)
- Owing to the serious pressure deficit in the southeast direction of the Ban 876 underground gas storage, the gas expands to the water body along this direction, and the gas water front moves forward by approximately 400 m, forming a gas–water transition zone of a certain width.
The following conclusions can be obtained by using the numerical simulation data body to calculate the volume of the fluid. At the end of the gas injection period, the total amount of gas channeling (the gas below the gas–water interface) reaches 4441.4 × 104 m3, forming the lost gas. Most of the lost gas is concentrated in the position of the central channel sand body. The sand body at the side of the gas storage is limited by the thickness and physical condition, and the gas channeling is relatively small.
5.4. Gas–Water Macroscopic Motion Law in the Process of Gas Production
The following conclusions can be obtained by analyzing the gas concentration variation during the production process of the Ban 876 underground gas storage:
- (1)
- In the process of gas production, the direction of water invasion is basically consistent with the gas channeling direction in the gas injection process. The water advances rapidly toward the northwest (gas reservoir) along the high-permeability zone of the braided river.
- (2)
- On both sides of the braided channel with poor physical properties, owing to the effect of the physical properties and small scale of the water body, the invasion rate of the edge water is slow, and the gas water boundary has not changed significantly.
- (3)
- When the gas in the underground gas storage is continuously removed, the formation pressure drops drastically, and the distribution law of the fluid in the gas storage changes significantly. In the main sand body, the water comes from the northwest invade obviously, the gas–water front moves approximately 200 m toward the gas reservoir, and the gas–water transition zone with a certain width is formed in the gas storage.
Figure 11 shows the gas saturation diagram of the Ban 876 underground gas storage at different gas recovery stages.
5.5. Law of Gas–Water Macroscopic Movement in the Process of Injection and Production of Underground Gas Storage
The macroscopic analysis shows that the motion law of gas and water is obviously controlled by the sedimentary facies belt, and there is a significant difference between the sedimentary facies belts.
- (1)
- The sand body formed by the braided channel has a high thickness and good physical property. Therefore, they are the main channels of the gas and water migration, and the direction of the gas channeling is consistent with the direction of water invasion.
- (2)
- Owing to the effect of the complex sedimentary facies, the heterogeneity of the underground gas storage is quite different, which leads to an uneven movement of the gas–water front, forming a long and narrow gas–water channel.
- (3)
- The structural fluctuation of the Ban 876 underground gas storage is minor and the total elevation difference is less than 30 m. Thus, relative seepage of the gas and water are promoted. Therefore, in the process of the high-strength injection and production, the gas–water transition zone with a width of 600 m is formed, which resulted in a decrease in the effective gas of the underground gas storage, reducing the operational efficiency of the gas reservoir.
6. Macroscopic Occurrence and Quantitative Description of Lost Gas in Underground Gas Storage
The production mechanism of the lost gas in the high-strength injection and production process of the Ban 876 underground gas storage can be determined by performing numerical simulation. Accordingly, there are two main approaches to produce lost gas:
- (1)
- One type of lost gas is formed above the original GWC (gas-water contact). Because of the difference in the physical property and distribution of the remaining fluid, the injection and production processes cannot be well corresponded. Therefore, in some areas, a part of the gas is surrounded by water. When the gas is produced, the pressure decreases. This part of the gas cannot escape from the bondage of water and forms the dynamic trap lost gas (Figure 12A).
- (2)
- Another part of the lost gas is formed under the original GWC. Because of the good physical property, the channel sand body easily forms a gas–water movement channel. In case of high-speed gas injection, under a strong pressure drive, a part of the gas will move along the high-permeability channel to the water, far away from the GWC, and it will be surrounded by the water body. When the gas is extracted, the thrust of the water body is obviously far below the gas injection pressure, and this part of the gas cannot be produced, and the lost gas is formed (Figure 12B). The characteristics of this part of the lost gas are large scale, but it is generally relatively isolated and far away from the injection and production wells.
6.1. Occurrence of Lost Gas Loss above GWC
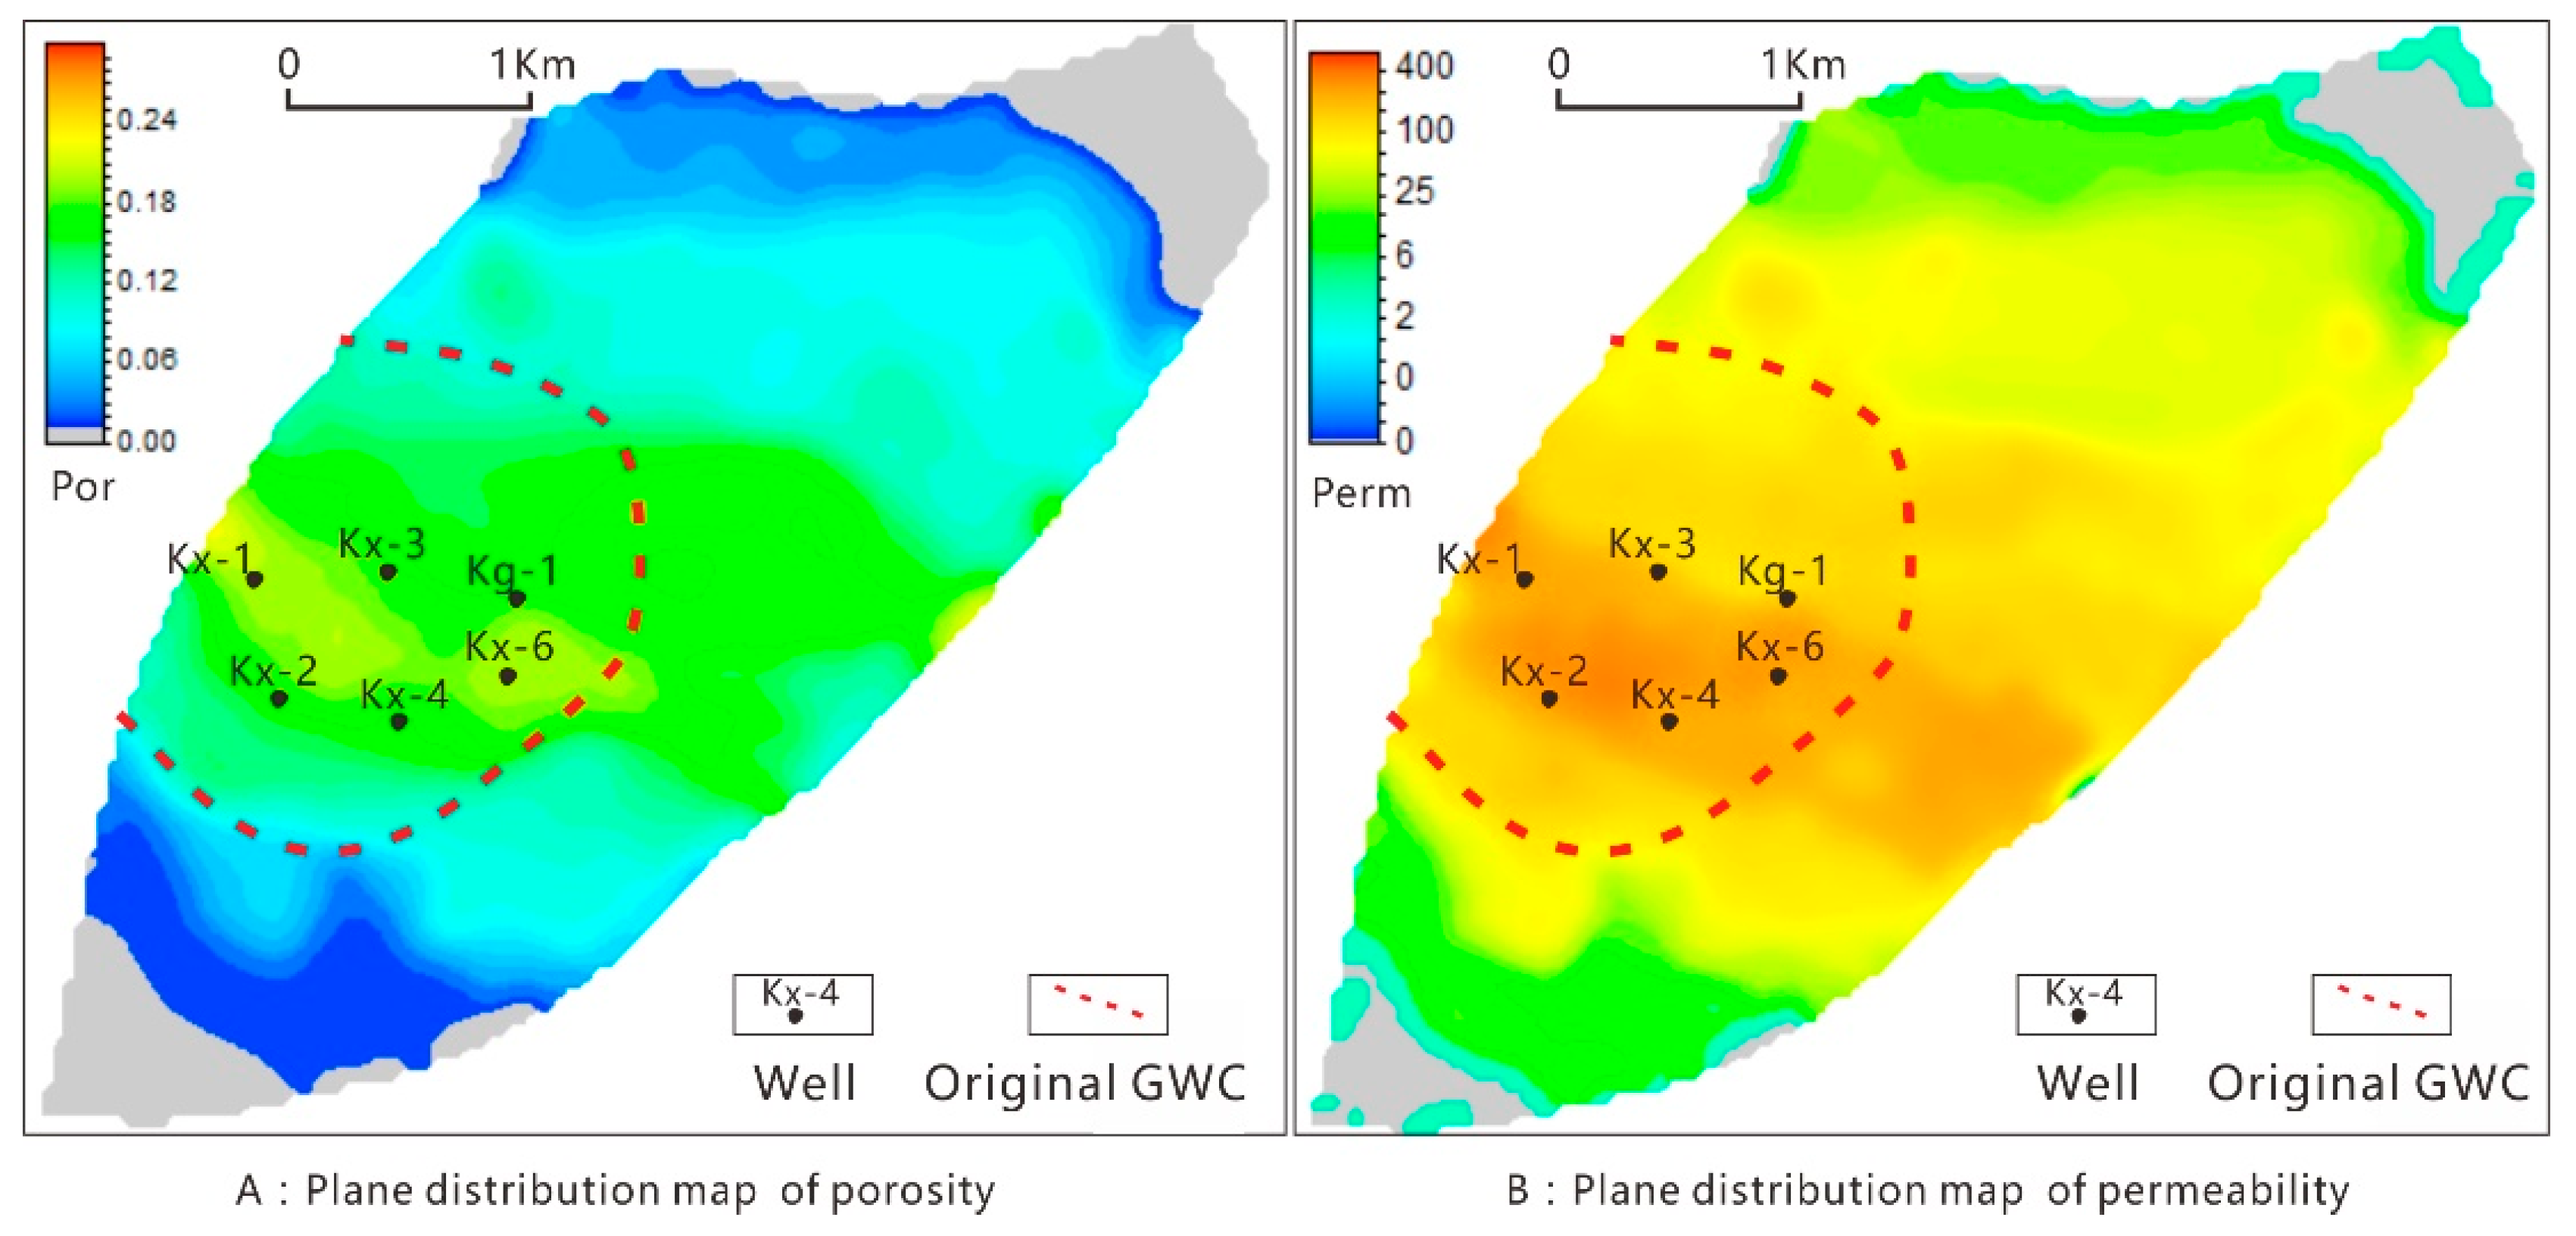
Above the GWC, the thickness of the sand body is generally high and physical property is good. However, owing to the differences in the sedimentary facies on the plane, the physical property of the channel center is obviously better than that on both sides. All wells of the Ban 876 underground gas storage are located in the braided channel sand bodies, and among them, Kx-1 is located in the structural high part, where the physical conditions are the best. The remaining wells are located in the downstream direction of the braided channel, where the physical properties are good. The northeast and southwest parts lack well control, and the property is poor (Figure 13).
According to the previous research, it is clear that the positions where the lost gas is most easily produced have poor physical conditions or are far away from the well. This leads to the question on the amount of gas stored in the two positions. The lost gas here can be quantified by using the numerical simulation results. At the end of gas production, the average pressure of the underground storage is 16 MPa; however, the waste gas reservoir pressure is 8 MPa. Therefore, we calculate of the lost gas volume at the end of each gas production cycle based on the gas amount of the first gas injection cycle when the pressure is up to 16 MPa.
The calculation results show that the lost gas produced in the first injection and production cycle is approximately 755.6 × 10⁴ m3. With the increase in the number of injection and production cycles, the amount of single-cycle loss gas does not change significantly, and is basically maintained at a stable level. The average single-period loss of gas in the 15 injection production cycles is approximately 775.2 × 10⁴ m3. Figure 14 displays the statistical graph of the loss of gas per cycle.
6.2. Occurrence of Lost Gas below GWC
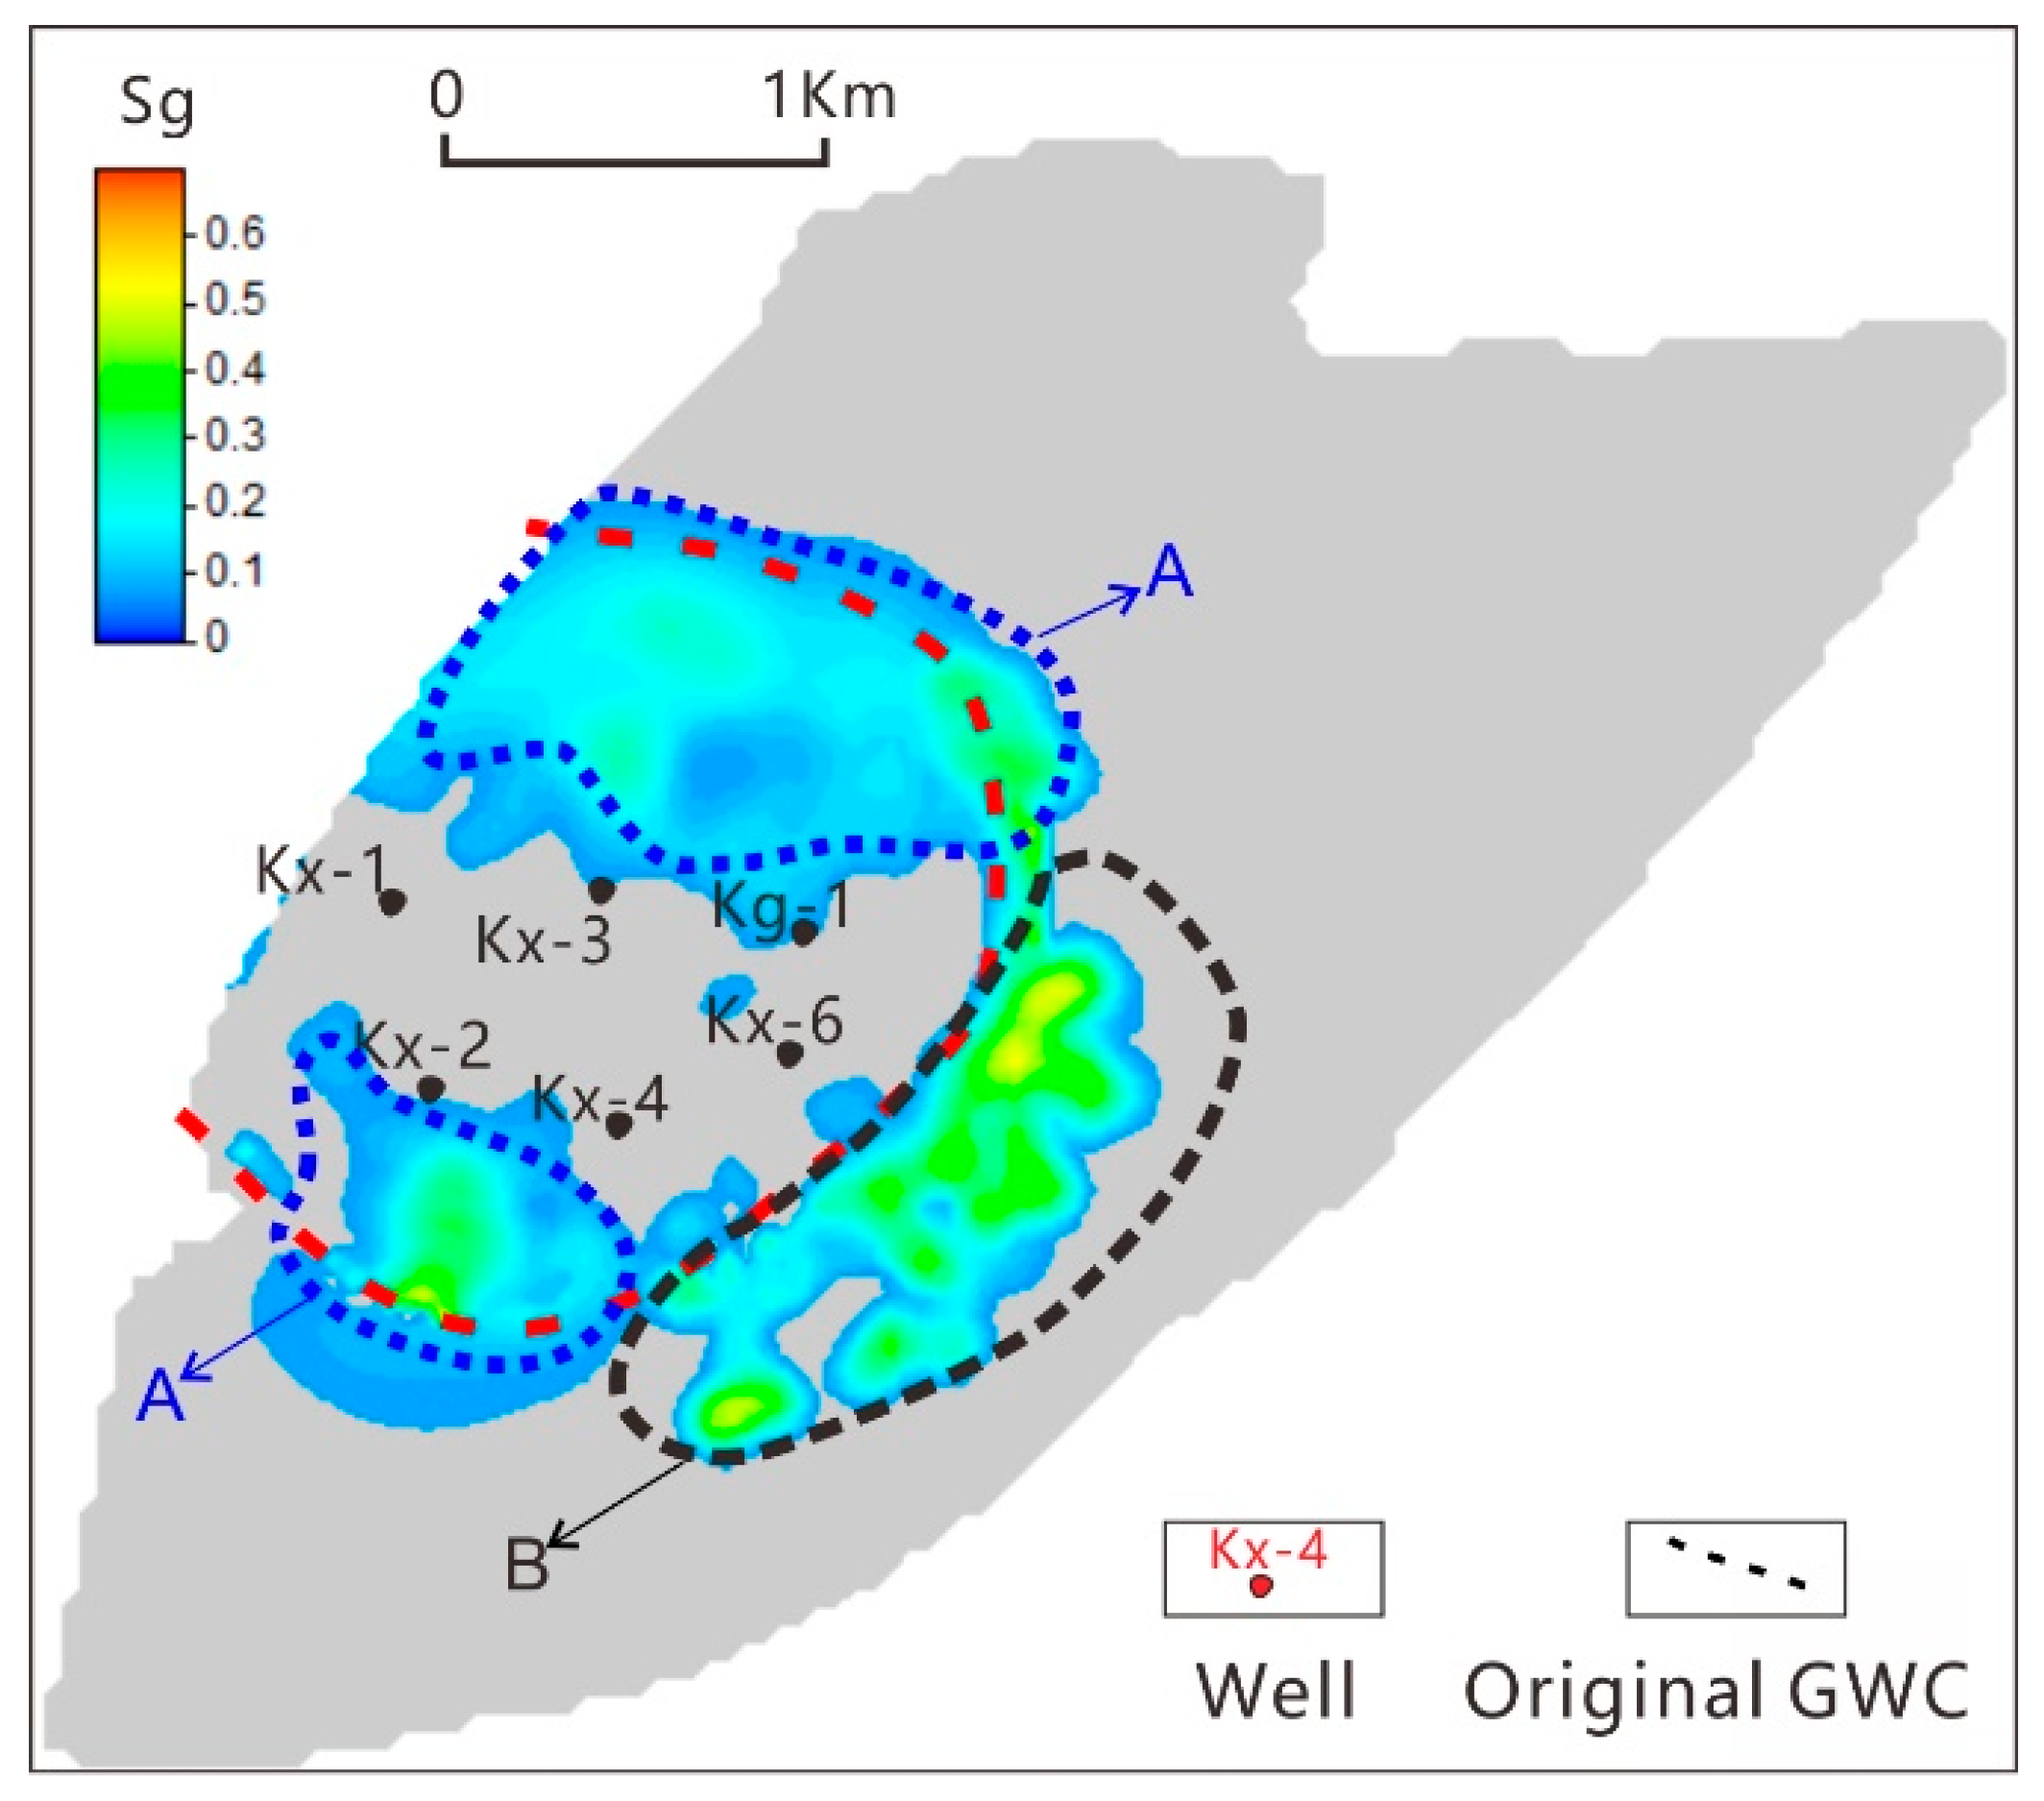
Below the gas and water interface, the lost gas is mainly concentrated in the braided channel sand bodies. The proportion of the lost gas in the sand body with poor physical condition is very small, and there is only some gas spillover near the GWC in the southwest direction. Therefore, it can be concluded that the gas water channel can most easily lose the gas. The loss gas at these locations is usually generated under high-intensity injection conditions. When the underground gas storage begins to produce gas, the water cannot provide enough driving pressure, and a part of the escaping gas is trapped, resulting in the formation of the lost gas.
The following conclusions can be obtained by comparing and analyzing the volume of gas before and after the injection and production of Ban 876 underground gas storage:
Once the gas is driven by a high pressure into the water area far away from the injection well, it is hard to be produced, and most of the gas forms the lost gas. After the end of the gas production, the abundance of the gas below the GWC (where the lost gas collects) decreased by only 10%. The single-cycle stable lost gas volume is approximately 1200 × 104 m3, which accounts for 12% of the total working gas volume. The resource waste is very serious, and therefore, to use this part of the gas, it is necessary to perform the necessary measures to dig the latent energy (Figure 15).
7. Development and Utilization of Lost Gas Reasonably
The lost gas in the plate of the Ban 876 underground gas storage is mainly concentrated in two locations, and this can be verified according to the analysis of the macro movement rule of gas–water in the process of injection and production, i.e., the uncontrolled zone of the injection production well and seepage channel of the gas–water transition zone.
- (1)
- The areas not controlled by the injection wells: the wells of the Ban 876 underground gas storage are all distributed on the mainstream line of the braided river, but this is not conducive to the gas advancing toward the thin sand bodies on both the sides. Although the sand body of the northeast is thin with a poor physical property, its area is very large. The current well network cannot control this area, and there is a certain expansion potential here. It is suggested that the two new drilling wells are arranged in this area (Figure 15a).
- (2)
- The seepage channel of the gas–water transition zone: during the gas injection process, the gas will diffuse along the main line to the water area, and during the process of gas production, the water will also invade the gas reservoir in the same direction because of the rapid pressure drop inside the gas reservoir. Owing to the effect of the physical property and well pattern control, the gas diffusion and indentation of the underground gas storage are mainly concentrated in the direction of the mainstream line. Therefore, a gas and water transition zone with a width of 630 m is formed along this direction. To develop and utilize this part of the lost gas, it is suggested that two new drilling rigs be arranged in the area (Figure 16b).
After the implementation of the new scheme, the storage capacity of the Ban 876 underground gas storage was expanded, and its working gas volume increased by 3900 × 104 m3. The average increase in the three new wells (Kn-1, Kn-2, and Kn-3) in the well blank area is approximately 400 × 104 m3. When the gas injection was stopped, the gas saturation increased, and the gas–water front began to move into the northeast water body. When the gas production stopped, the gas saturation became less than before, but only slightly. A weak water invasion began in the northeast. Three new wells (Kn-4, Kn-5, Kn-6) were arranged in the gas–water transition zone, and their productivity was approximately 700 × 104 m3. In the direction of gas injection, the diffusion of gas in the direction of the main line did not change much, but it became more uniform. When the gas production was finished, the water invaded the gas reservoir by more than 60 m (Figure 17).
In this paper, six new wells are designed according to the optimal scheme to develop the accumulation of lost gas in the reservoir, and the numerical model prediction results of these wells are all good. However, considering the problems of investment and environment, only three wells have been selected for adjustment, two wells are located in the gas-water transition area (near Kn-4 and Kn-5), and the other well is located in the uncontrolled area of well pattern in the north (near Kn-1). These three wells have been put into operation in June 2015. Compared with the previous operation cycles of Ban 876 underground gas storage, the single cycle lost gas volume of 2015–2017 decreased to 50%, which was only 326 × 104 m3, while the working gas volume increased by 2000 × 104 m3. This scheme has effectively improved the operating efficiency of the 876 underground gas storage, and provides guidance for the potential of other underground gas storage.
8. Discussion
8.1. The Difference between Darcy and Non-Darcy Flow in the Model
In the high-intensity injection and production process of underground gas storage, the formation pressure rate changes very fast, and the gas seepage law will also change. With the increase of pressure gradient, the factors controlling gas seepage velocity loss began to change from the initial viscous force to viscous force and inertia force, even controlled by inertia force only. Therefore, whether the non-Darcy effect is considered in the mathematical model will have a great influence on the development index of underground gas storage in the early or late stages. In the numerical simulation of natural gas reservoir or underground gas storage, the advantages of considering the non-Darcy effect can be summarized as follows [38,39]:
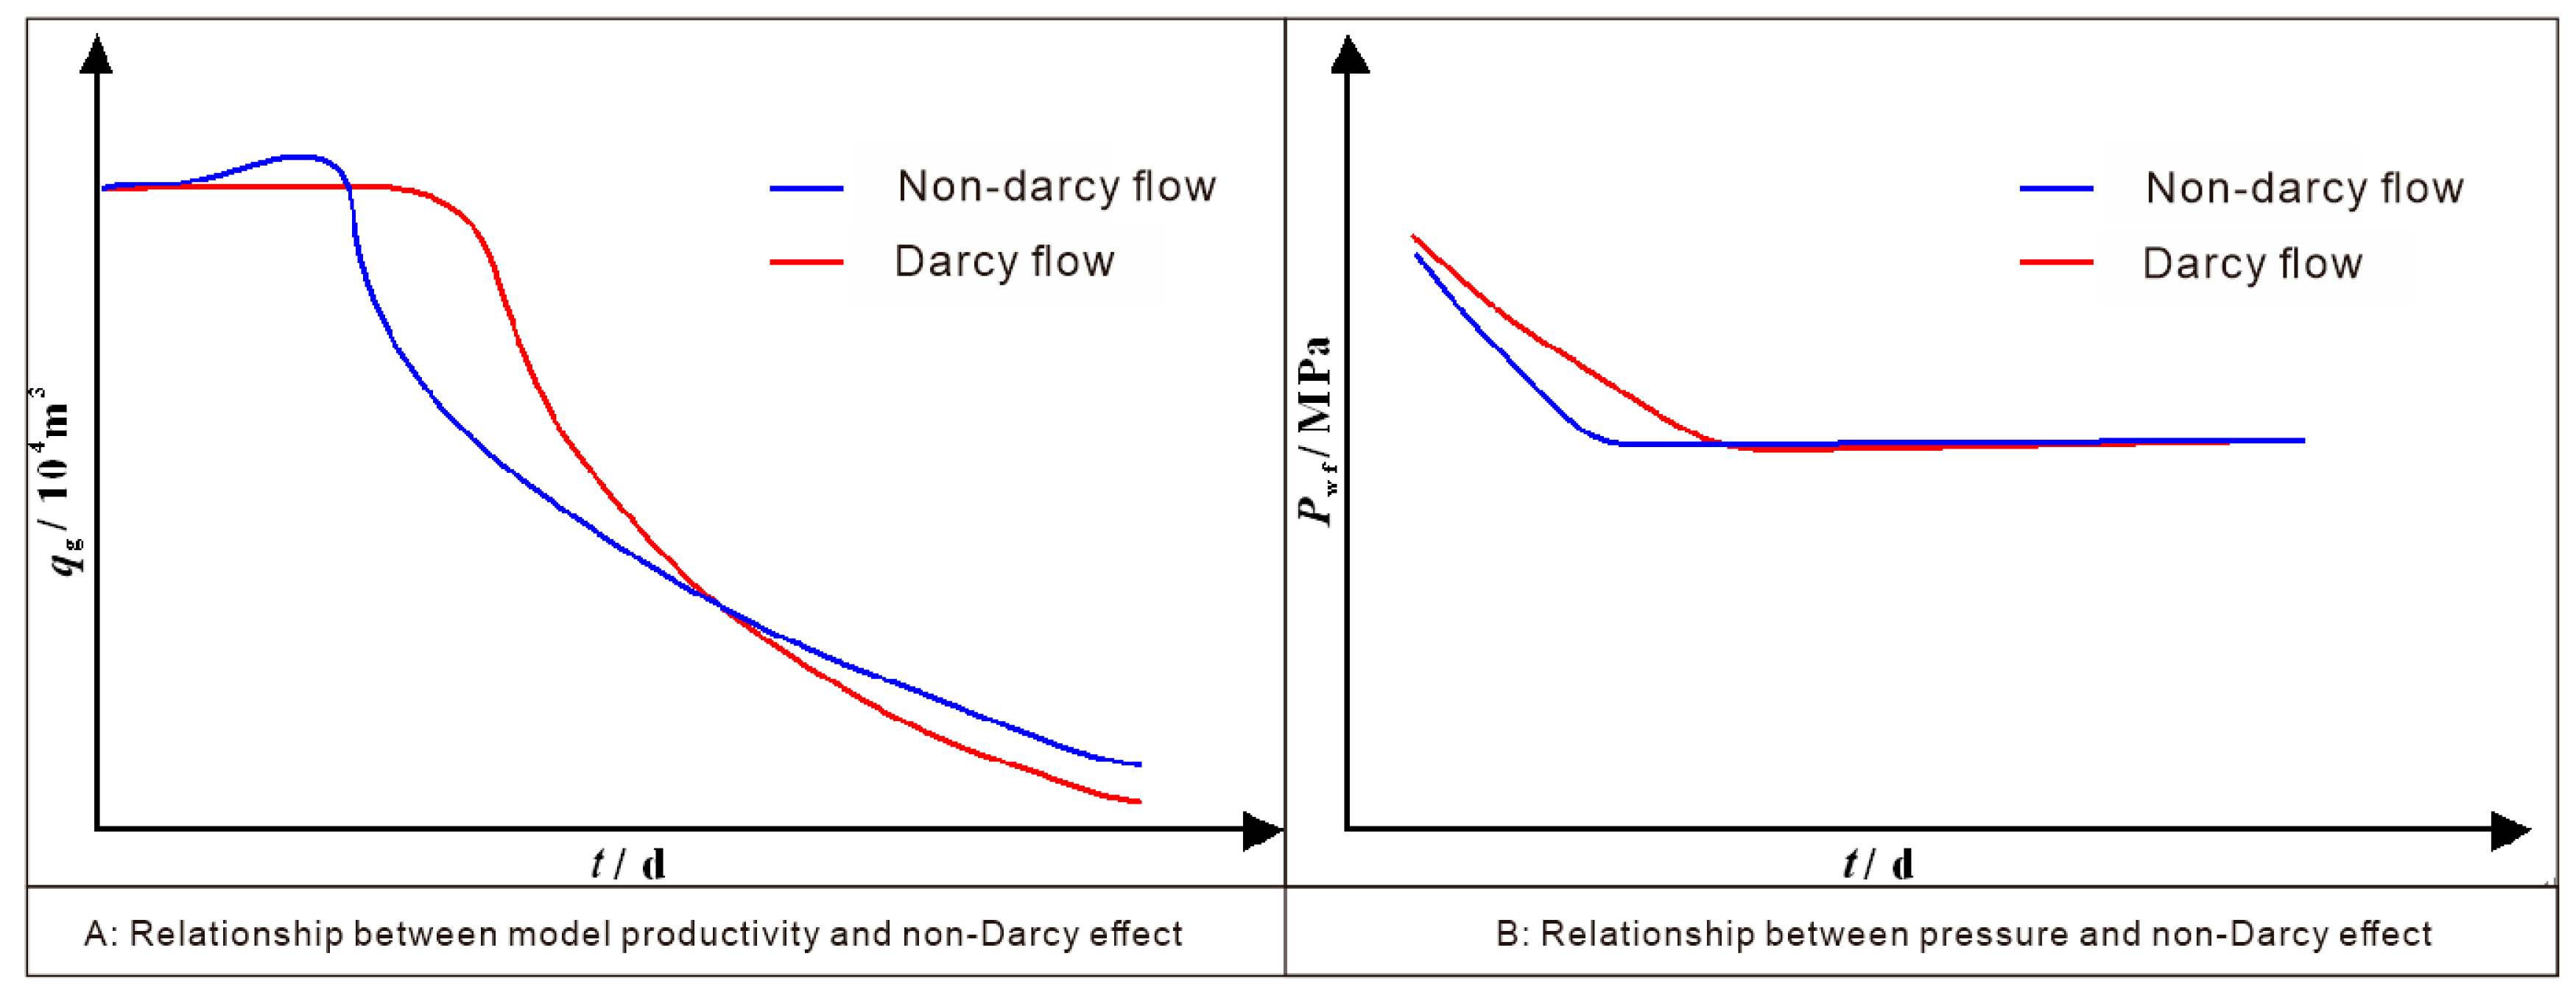
- (1)
- For the whole underground gas storage, when the model does not consider the non-Darcy effect, its stable production period will be longer, and it will remain relatively high productivity for a long time after the stable production period. But in the later development period, the situation reverses, and when the model considers the non-Darcy effect, its productivity will be higher (Figure 18A).
- (2)
- For the single well productivity, when the model considers the non-Darcy effect, it will have a significant influence on the bottom pressure of the single well. At this time, the pressure gradient in the early stage of production of gas well is larger, the flow pressure drops faster, and the gas well productivity is high. If the model does not consider the non-Darcy effect, the flow pressure drop of the gas well is slow, and the single well productivity in the same time is low (Figure 18B).
Therefore, during the simulation of high-intensity injection and production process, in order to correctly simulate the dynamic production process of underground gas storage or gas wells, the impact of non-Darcy effect on development must be considered.
8.2. The Recommendations for Decreasing of Gas Losses
In order to avoid excessive gas loss, the following measures are proposed in the construction of water flooded underground gas storage.
- (1)
- The undeveloped or low developed gas reservoirs should be chosen as the destination of an underground gas storage, because the more complete the gas reservoir, the smaller the amount of invasion of the water body. In this way, the storage space can be fully utilized to avoid gas leakage.
- (2)
- The main fluid percolation channel in the underground gas storage must be found out, so as to arrange the injection-production wells in the area of the channel as far as possible to cut off the intrusion route of the water body.
- (3)
- Try to use the perfect injection-production well network as far as possible to avoid the formation of blank areas, where tend to store the lost gas.
- (4)
- Reasonable injection and production pressure should be used as far as possible to avoid the gas channeling and water coning [40].
8.3. The Advantages and Disadvantages of the Construction of Underground Gas Storage
The promotion of any new technology will involve problems related to ecology, environment, economy, society and energy, and some will even cause lot of serious impacts on the ecosystem and environment. But whether the new technology is good or not, it can’t be judged by one of the single index, but it should be judged by a comprehensive evaluation index. Underground gas storages, especially the ones that has been put into operation in China recent years, have great diseconomy, which causes a large amount of gas loss. However, in another way, the construction of these storages has effectively solved the contradiction between the supply and demand of natural gas in large cities [36]. Since 2017, Beijing has implemented haze control policies and changed most of the power plants’ fuel from coal to natural gas, thus reducing pollutant emissions and improving the environment. After entering the winter, the amount of natural gas consumption suddenly increased, while the supply and demand of natural gas in Beijing could also maintain equilibrium, this is mainly due to the more than 20 underground gas storages around it. I believe that with the deepening of research, China’s underground gas storage construction technology will change rapidly and gradually improve, and the loss of gas will also be less and more efficient.
9. Conclusions
(1) In the process of high-strength injection and production of underground gas storage, a large amount of lost gas will be produced. There are two main types of the lost gas: one is the water lock gas, the other is the oil package gas. The lost gas volume in the initial operation of the underground gas storage which was rebuilt by water flood sand gas reservoir can account for about 24% of the total working gas (an example of the Ban 876 underground gas storage).
(2) In the high-strength injection and production process of underground gas storage, the seepage of gas no longer follows Darcy’s law. Based on this theory, the conventional Darcy’s law is corrected, and combined with physical experimental data, a mathematical model that can describe the loss of gas in high-strength injection and production process is established.
(3) Based on the mathematical model, the numerical simulation of the operation process of waterflood sandstone underground gas storage (Ban 876) is carried out, the main movement direction of gas-water is defined, which is consistent with the extension direction of the distributary channel sand bodies. Due to the multi cycle injection-production, a transition zone of 600m width is formed in the gas-water movement channel. In this transition zone, the alternation between the gas and water is frequent, this area is also the most vulnerable place for lost gas.
(4) Based on the numerical simulation results, the lost gas of Ban876 underground gas storage is qualitatively and quantitatively characterized, including their aggregation area and volume. According to the actual situation, the lost gas development plan (six new injection-production wells) was designed, three wells in the gas water transition area, and other wells in the well-uncontrolled area. The prediction results of the new scheme show that it can effectively improve the operating efficiency of the Ban 876 underground gas storage. On the basis of this, the effective technical countermeasures for the lost gas development in the operation process of waterflood underground gas storage are put forward.
Acknowledgments
The authors would like to thank the workers of Dagang oilfield of Petrochina for supplying researching data.
Author Contributions
Jinkai Wang contributed to the concept, thought and organization of the study, and completed the writing of most of the manuscripts. Hengyi Liu contributed significantly to the physical experiments. Jinliang Zhang performed the experiment data analyses and wrote the manuscript of this part. Jun Xie analyzed the numerical simulation results of Ban876 underground gas storage and put forward good suggestions.
Conflicts of Interest
The authors declare no conflict of interest.
Funding Sources
This article is funded by two foundations: Project (51504143) supported by the National Natural Science Foundation of China; Project (51674156) supported by the National Natural Science Foundation of China.
References
- Li, T.; Zhang, Y. Construction and Development of Underground Gas Storage. Oil Gas Storage Transp. 2000, 19. [Google Scholar] [CrossRef]
- Mohanty, S.; Vandergrift, T. Long Term Stability Evaluation of an Old Underground Gas Storage Cavern Using Unique Numerical Methods. Tunn. Undergr. Space Technol. 2012, 30, 145–154. [Google Scholar] [CrossRef]
- Confort, M.J.F.; Mothe, C.G. Estimating the required underground natural gas storage capacity in Brazil from the gas industry characteristics of countries with gas storage facilities. J. Nat. Gas Sci. Eng. 2014, 18, 120–130. [Google Scholar] [CrossRef]
- Hagemann, B.; Rasoulzadeh, M.; Panfilov, M.; Ganzer, L.; Reitenbach, V. Hydrogenization of underground storage of natural gas. Comput. Geosci. 2016, 20, 595–606. [Google Scholar] [CrossRef]
- Wojdan, K.; Ruszczycki, B.; Michalk, D.; Swirski, K. Method for Simulation and Optimization of Underground Gas Storage Performance. Oil Gas Sci. Technol. Rev. IFP Energies Nouv. 2014, 69, 1237–1249. [Google Scholar] [CrossRef]
- Billiotte, J.A. Experimental Micromodeling and Numerical Simulation of Gas-Water Injection-Withdraw Cycles as Applied to Underground Gas Storage. In Proceedings of the SPE Annual Technical Conference and Exhibition, New Orleans, LA, USA, 23–26 September 1990; pp. 483–491. [Google Scholar]
- Wang, Z.; Guo, P.; Zhou, D.; Gao, H. Changes of Rock Compressibility Porosity and Permeability in the Injection Process. Xinjiang Pet. Geol. 2006, 27, 191–193. [Google Scholar]
- Jha, B.; Bottazzi, F.; Wojcik, R.; Coccia, M.; Bechor, N.; McLaughlin, D.; Herring, T.; Hager, B.H.; Mantica, S.; Juanes, R. Reservoir characterization in an underground gas storage field using joint inversion of flow and geodetic data. Int. J. Numer. Anal. Methods Geomech. 2015, 39, 1619–1638. [Google Scholar] [CrossRef]
- Zhao, S.; Wang, J. Injection and Production Technology of Underground Gas Storage; Petroleum Industry Press: Beijing, China, 2000; pp. 1–15, 56–75. [Google Scholar]
- Barker, J.W.; Evans, S.C. Predictive Model for Viscous Fingering in Compositional WAG model. SPE Reserv. Eng. 1995, 10, 16–121. [Google Scholar] [CrossRef]
- Lang, Z.; Bittkow, P.; Kretzschmar, H. Reservoir-Mechanical Optimization of the Hrusky Underground Gas Storage in Czechoslovakia Using a Three-dimensional Gas Expansion Model. Energietechnik 1979, 29, 479–484. [Google Scholar]
- Damle, A.S.; Berry, R.M.; Kothari, K.M. Single-Phase Simulation of an Aquifer Gas Storage Field. In Proceedings of the SPE Gas Technology Symposium, Dallas, TX, USA, 13–15 June 1988; Article No. 17744. pp. 373–379. [Google Scholar]
- Sawyer, W.K.; Zuber, M.D.; Bues, A.D. Reservoir Simulation and Analysis of the Sciota Aquifer Gas Storage Pool. In Proceedings of the SPE Annual Western Regional Meeting, Pittsburgh, PA, USA, 9–11 November 1998; pp. 59–68. [Google Scholar]
- Bittkow, P.; Kretzschmar, H.-J.; Kana, J. Simulation of Conversion of Lobodice Underground Gas Storage Facility from Town Gas to Natural Gas. Erdoel Erdgas Kohle 1991, 107, 118–123. [Google Scholar]
- Ory, J.; Guedeney, K.; Brefort, B.; Schirrer, L. Semi-automatic History Matching Technique Applied to Aquifer Gas Storages. In Proceedings of the SPE Annual Technical Conference and Exhibition, San Antonio, TX, USA, 5–8 October 1997; pp. 177–192. [Google Scholar]
- Kurihara, M.; Liang, J.; Fujimoto, F.; Nghiem, L.; Sammon, P. Development and Application of Underground Gas Storage Simulator. In Proceedings of the SPE Asia Pacific Conference on Integrated Modelling for Asset Management, Yokohama, Japan, 25–26 April 2000; Volume 4, pp. 339–352. [Google Scholar]
- Tan, Y. Calculating Leakage of Underground Gas storage by Numerical Modeling. Nat. Gas Ind. 2003, 23, 99–101. [Google Scholar]
- Fu, Y.; Guo, X.; Du, Z.; Liu, L. Numerical Simulation Research on Underground Gas Storage Considering Fracture Deformation. J. Southwest Pet. Univ. 2007, 29, 92–94. [Google Scholar]
- Xu, Z.; Jiang, J.; Ge, J.; Zhang, L.; Chen, K. Dynamic Numerical Simulation of Injection-Production in Depleted Reservoir Underground Gas Storage. Nat. Gas Explor. Dev. 2011, 34, 53–55. [Google Scholar]
- Zhao, B.; Li, Y.; Tian, J.; Wang, Z. Numerical simulation of the injection and production effect of aquifer gas storage. Oil Gas Storage Transp. 2012, 31, 211–214. [Google Scholar]
- Wang, J.; Zhang, J.; Xie, J.; Ding, F. Initial Gas Full-component Simulation Experiment of Ban-876 Underground Gas Storage. J. Nat. Gas Sci. Eng. 2014, 18, 131–136. [Google Scholar] [CrossRef]
- Cheng, X.; Liu, G.; Xiong, J. Research on The Experimental Technology of Whole-diameter Core Water Flooding Technology. Daqing Pet. Geol. Dev. 1993, 12, 46–51. [Google Scholar]
- Lu, Y.; Zuo, S.; Ge, Z.; Xiao, S.; Cheng, Y. Experimental Study of Crack Initiation and Extension Induced by Hydraulic Fracturing in a Tree-Type Borehole Array. Energies 2016, 9, 514. [Google Scholar] [CrossRef]
- Jia, Z.; Yang, Q.; Lan, Y.; Zhang, H. Experimental Study on the Microphysical Simulation of Water Displacement Oil. Daqing Pet. Geol. Dev. 2002, 21, 46–49. [Google Scholar]
- Zhu, J.; Jang, Z.; Huang, Y. An Experimental Study of the Distribution of the Remaining Oil. J. Pet. Univ. 1997, 21, 40–42. [Google Scholar]
- Zhu, Y.; Xu, A.; Lu, X. Oil Water Displacement Experiments in Glass Micromodels for Yanan Reservoir Rocks, Changqing Oilfield. Pet. J. 1989, 10, 40–48. [Google Scholar]
- Sun, Q.; Li, Z.; Li, S.; Jiang, L.; Wang, J.; Wang, P. Utilization of Surfactant-Stabilized Foam for Enhanced Oil Recovery by Adding Nanoparticles. Energy Fuels 2014, 28, 2384–2394. [Google Scholar] [CrossRef]
- Sedaghat, M.; Mohammadzadeh, O.; Kord, S.; Chatzis, I. Heavy Oil Recovery Using ASP Flooding: A Pore-Level Experimental Study in Fractured Five-spot Micromodels. Can. J. Chem. Eng. 2016, 94, 779–791. [Google Scholar] [CrossRef]
- Peng, C.; Meng, L.; Guo, P. Development and Application of 3D Physical Model Flooding Experimental Simulation Device. Pet. Exp. Geol. 2013, 35, 570–573. [Google Scholar]
- Hou, J.; Li, Z.; Zhang, S.; Cao, X.; Song, X.; Gao, D. Experimental and Simulation Study on the Construction of Three-dimensional Network Model of Rock. China Sci. G 2008, 51, 1761–1774. [Google Scholar] [CrossRef]
- Wang, Y.; Li, X.; He, J.; Zhao, Z.; Zheng, B. Investigation of Fracturing Network Propagation in Random Naturally Fractured and Laminated Block Experiments. Energies 2016, 9, 588. [Google Scholar] [CrossRef]
- Frederick, D.C.; Graves, R.M. New Correlations to Predict Non-Darcy Flow Coefficients at Immobile and Mobile Water Saturation. In Proceedings of the SPE Annual Technical Conference and Exhibition, New Orleans, LA, USA, 25–28 September 1994. [Google Scholar]
- Geertsma, J. Estimating the Coefficient of Inertial Resistance in Fluid Flow through Porous Media. Soc. Pet. Eng. J. 1974, 14, 445–450. [Google Scholar] [CrossRef]
- Dranchuk, P.M.; Kassem, H. Calculation of Z Factors for Natural Gases Using Equations of State. J. Can. Pet. Technol. 1975, 14, 34–36. [Google Scholar] [CrossRef]
- Al-Hussainy, R.; Ramey, H.J., Jr. Application of Real Gas Flow Theory to Well Testing and Deliverability Forecasting. J. Pet. Technol. 1966, 18, 637–642. [Google Scholar] [CrossRef]
- Ding, G.; Xie, P. Current Situation and Development of Underground Gas Storage in China. Nat. Gas Ind. 2006, 26, 111–113. [Google Scholar]
- Tian, W.; Wang, M.; Zhu, W.; Han, J.; Nie, F. Study on the law of oil, gas and water three phase seepage in tight sandstone. J. Shaanxi Univ. Sci. Technol. 2016, 34, 114–118. [Google Scholar]
- Zhang, Q.; Lu, T.; Lu, J. Non Darcy Flow Binomial Deliverability Test Formula. Nat. Gas Ind. 2004, 24, 83–85. [Google Scholar]
- Zhao, X.; Yao, A.J.; Cui, C.; Su, Y. High Speed Non-Darcy Percolation Model Considering Real Gas PVT Dynamics. Oil Drill. Technol. 2009, 37, 78–81. [Google Scholar]
- Le Van, S.; Chon, B.H. Applicability of an Artificial Neural Network for Predicting Water-Alternating-CO2 Performance. Energies 2017, 10, 842. [Google Scholar] [CrossRef]
Figure 1.
Difference between the operation of gas storage and the formation and development of conventional oil and gas reservoirs.
Figure 1.
Difference between the operation of gas storage and the formation and development of conventional oil and gas reservoirs.

Figure 2.
The relationship between the change of reservoir pore and the development of water injection.
Figure 2.
The relationship between the change of reservoir pore and the development of water injection.

Figure 3.
Dynamic curve of the actual operation of B876 underground gas storage.

Figure 4.
The occurrence of lost gas in the pores of the three phase coexistence of oil and gas water. (a) Gas 1 is the oil wrapped gas; Gas 2 is the water wrapped gas; Gas 3 is wrapped by water and oil. (b) Gas 1 is the oil wrapped gas; Gas 2 is the water wrapped gas.
Figure 4.
The occurrence of lost gas in the pores of the three phase coexistence of oil and gas water. (a) Gas 1 is the oil wrapped gas; Gas 2 is the water wrapped gas; Gas 3 is wrapped by water and oil. (b) Gas 1 is the oil wrapped gas; Gas 2 is the water wrapped gas.

Figure 5.
The macroscopic distribution of lost gas in the injection and production process of different types of underground gas storage.
Figure 5.
The macroscopic distribution of lost gas in the injection and production process of different types of underground gas storage.
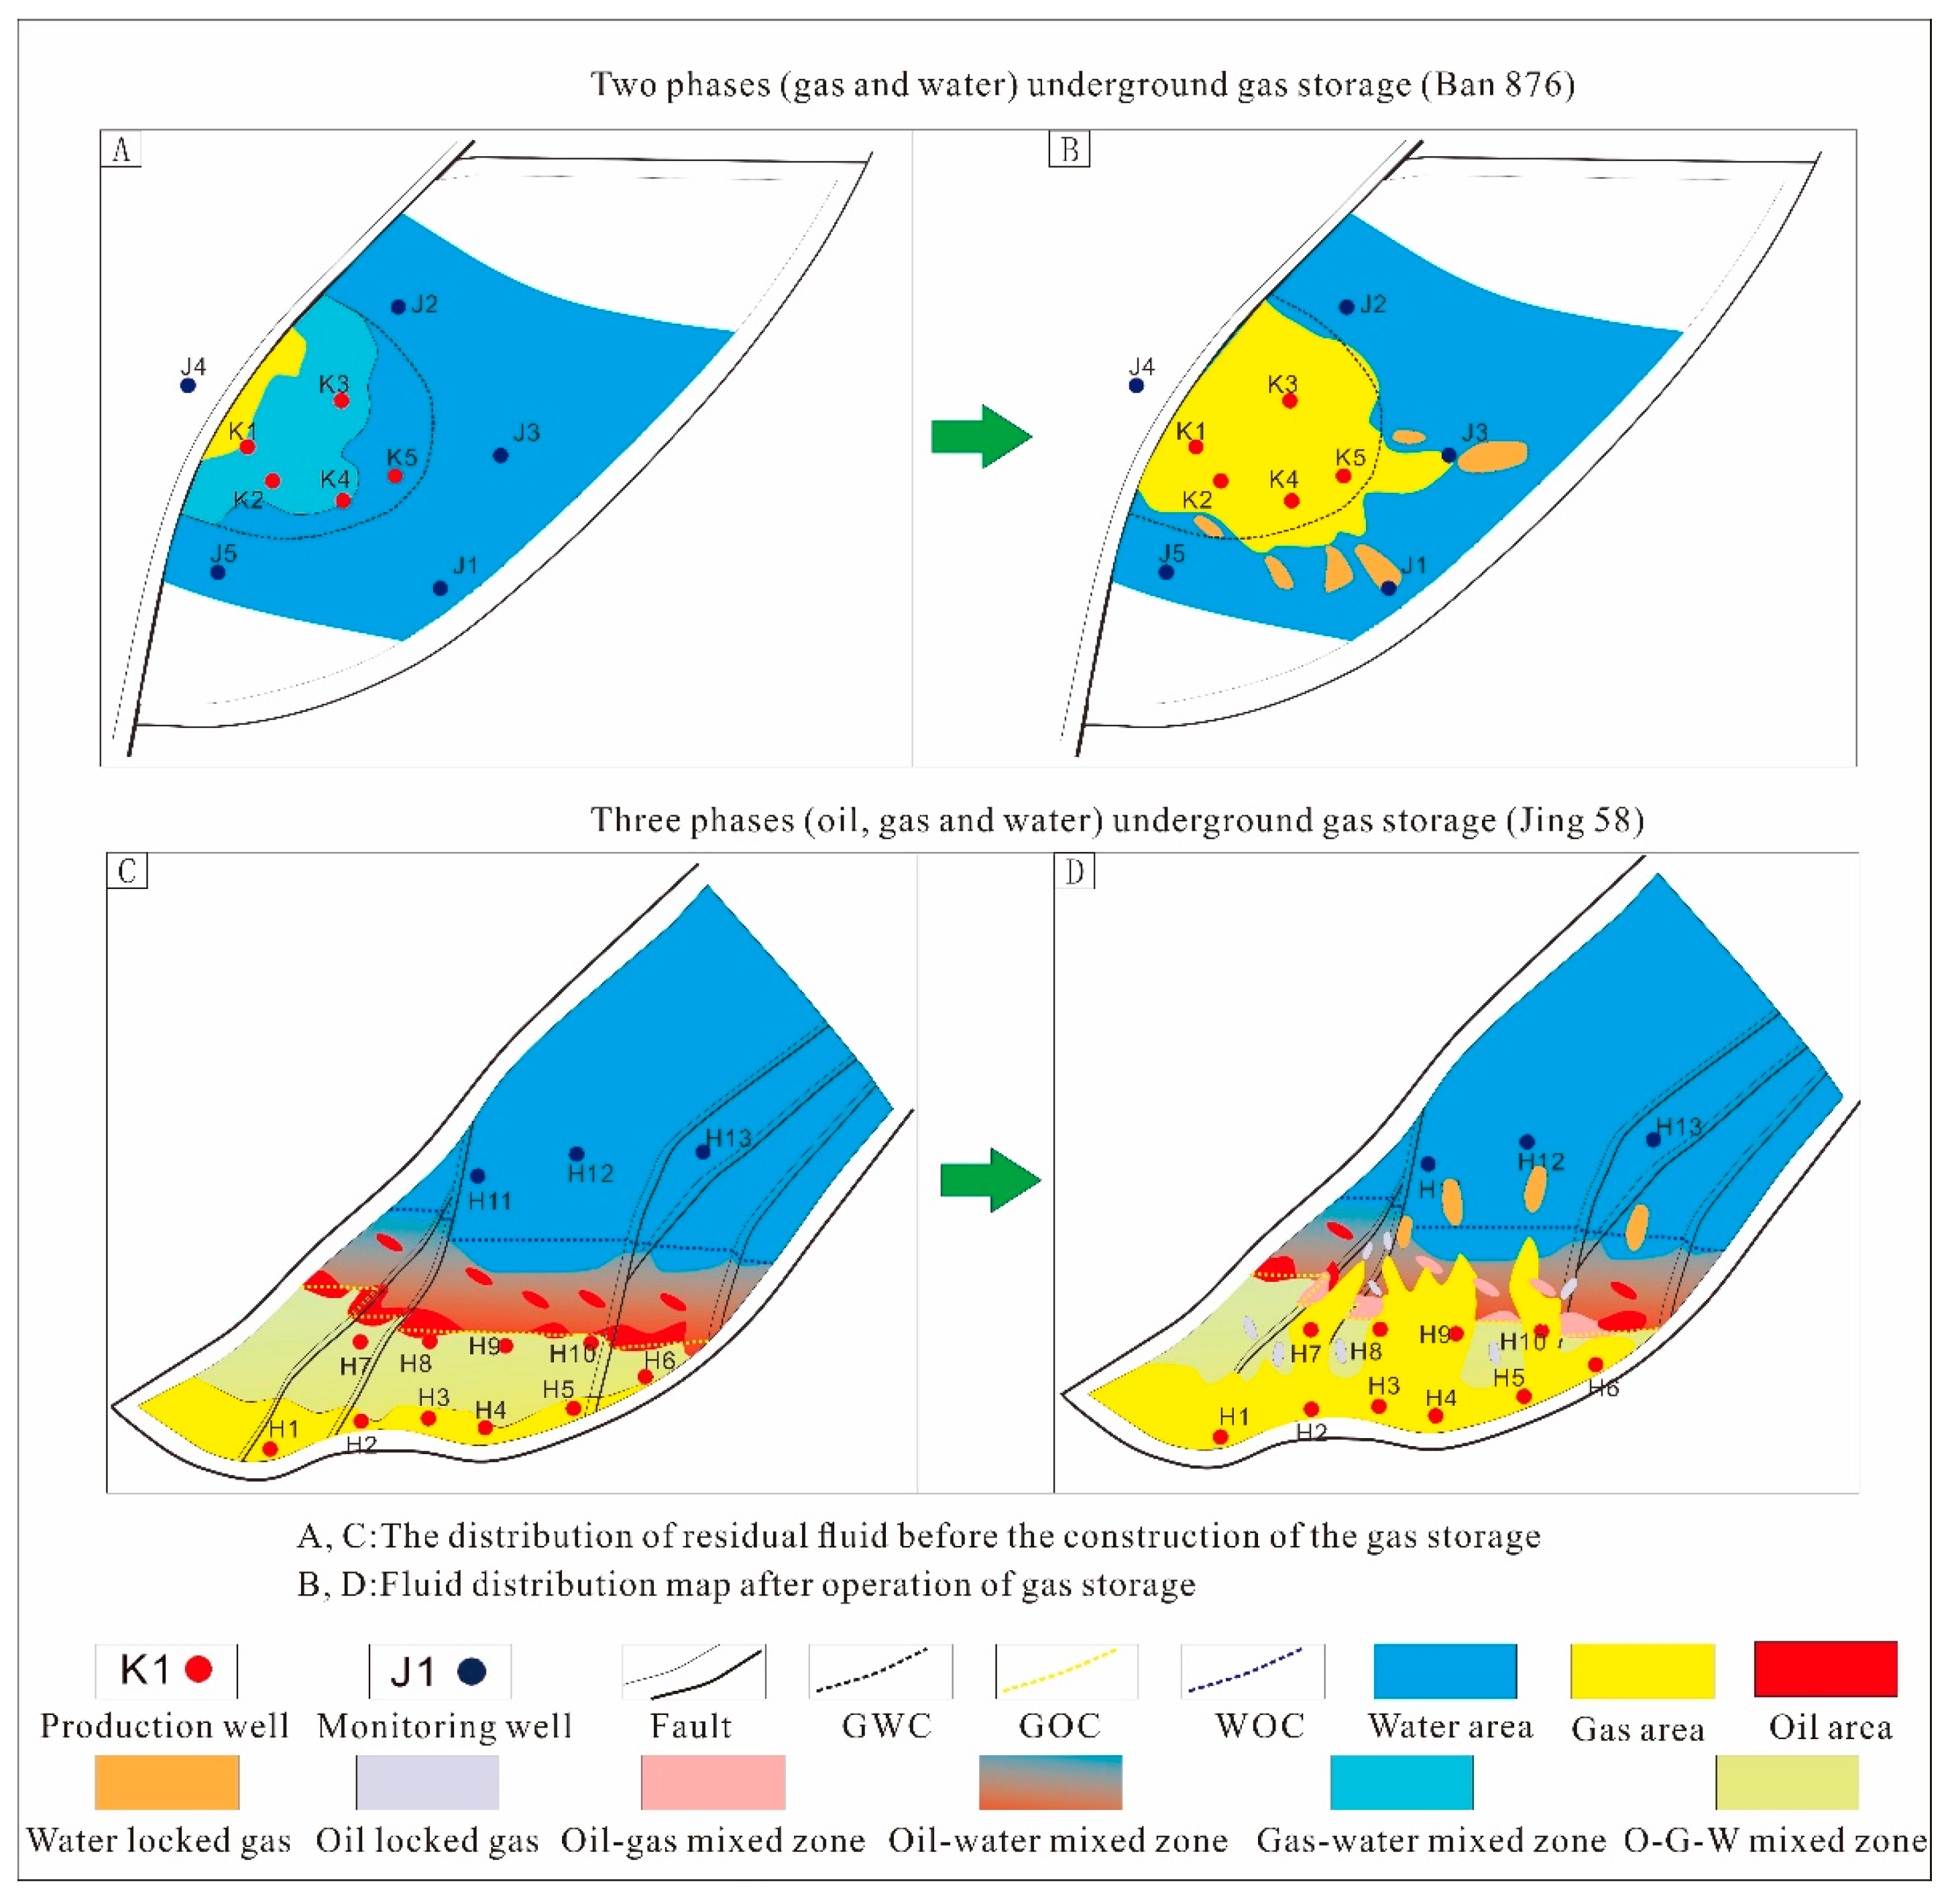
Figure 6.
Preparation and experiment of micro etching model. (a) Characterization of the micro pore structure of rock. A thin slice of rock is selected, and its structural characteristics are observed under a microscope. It is found that the pore type of this rock is intergranular, they do not have good sorting, heterogeneity is strong, and pore structure is complex. (b) Micro etch model displacement process. Before the process starts, the model of the pore filled with water is constructed and kept stationary for a period. After the fluid is stable, the gas flooding experiments are conducted. (c) Mechanism and type of microcosmic occurrence of gas loss. Generally, there are two types of gas in the microscopic pores: one is the gas blocked by the water body, and this part of the gas is dynamically closed; and the other is the gas blocked by the pore, which is closed at rest.

Figure 7.
Simulation system of the high-strength injection and production process.

Figure 8.
Microfaciesand different percolation regions of Ban 876 underground gas storage.

Figure 9.
The relationship between high pressure physical parameters and pressure.

Figure 10.
The direction of gas channeling in the process of gas injection.
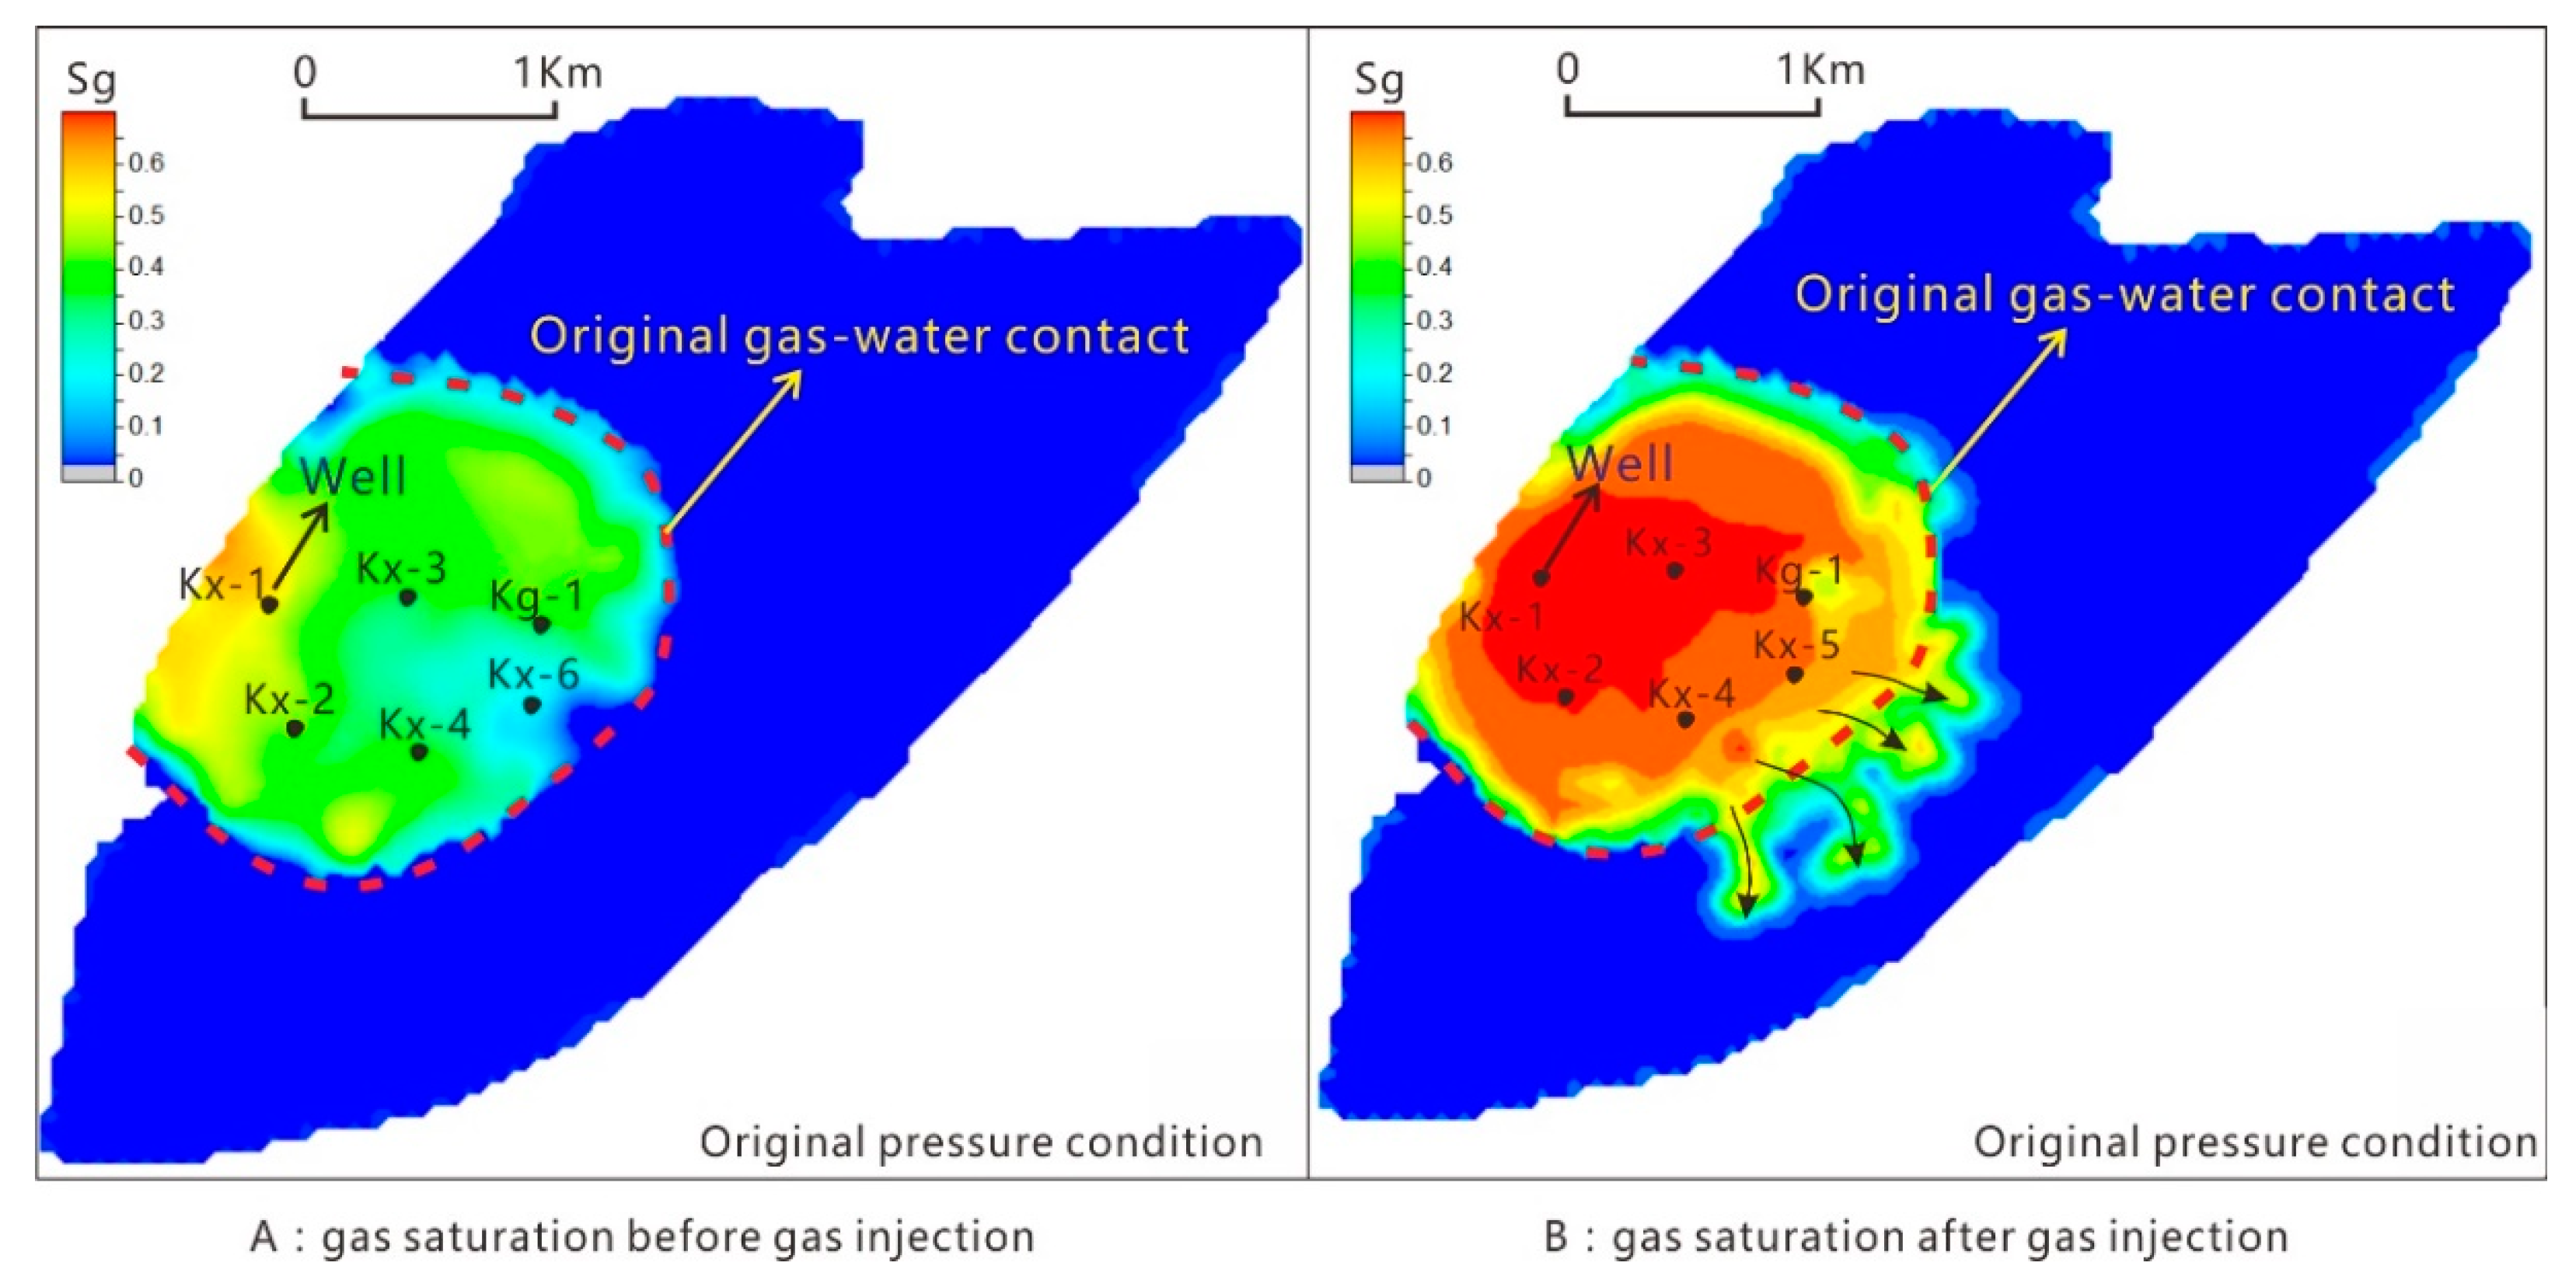
Figure 11.
Water invasion direction in the process of gas production.

Figure 12.
The two types of gas loss.

Figure 13.
Plane distribution map of porosity and permeability of Ban 876 underground gas storage.

Figure 14.
Single cycle lost gas statistics diagram of Ban 876 underground gas storage.
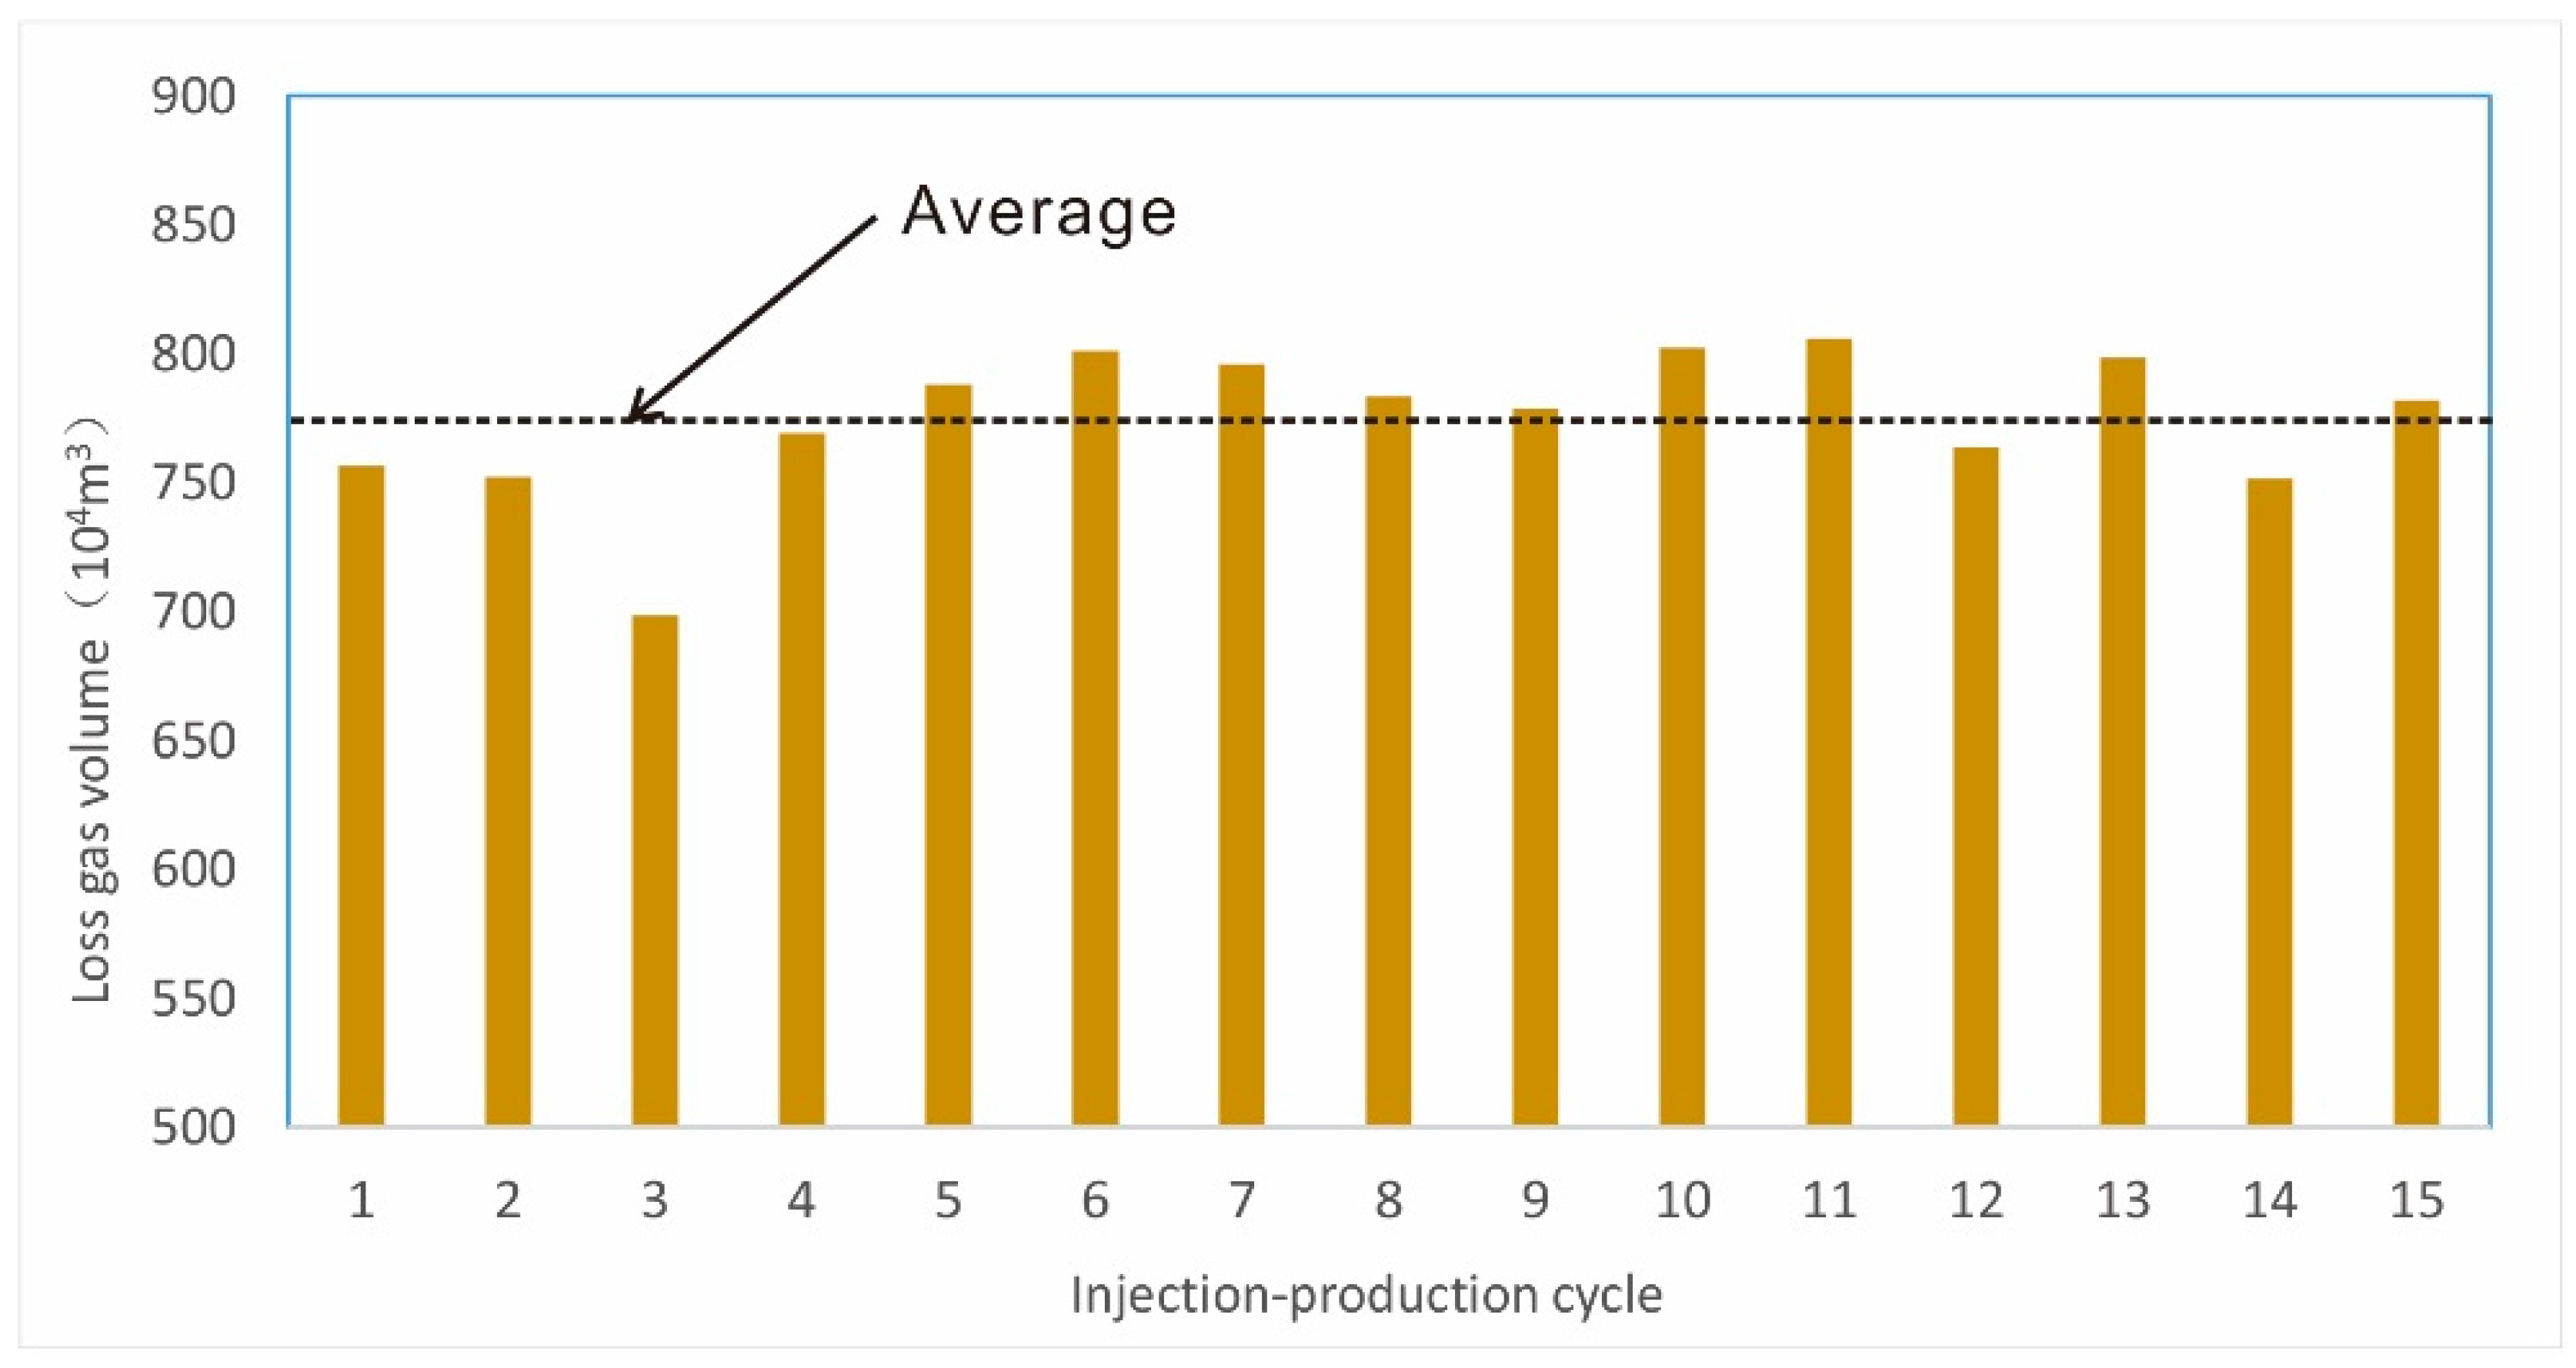
Figure 15.
Contrast diagram of gas abundances below GWC before and after gas extraction.
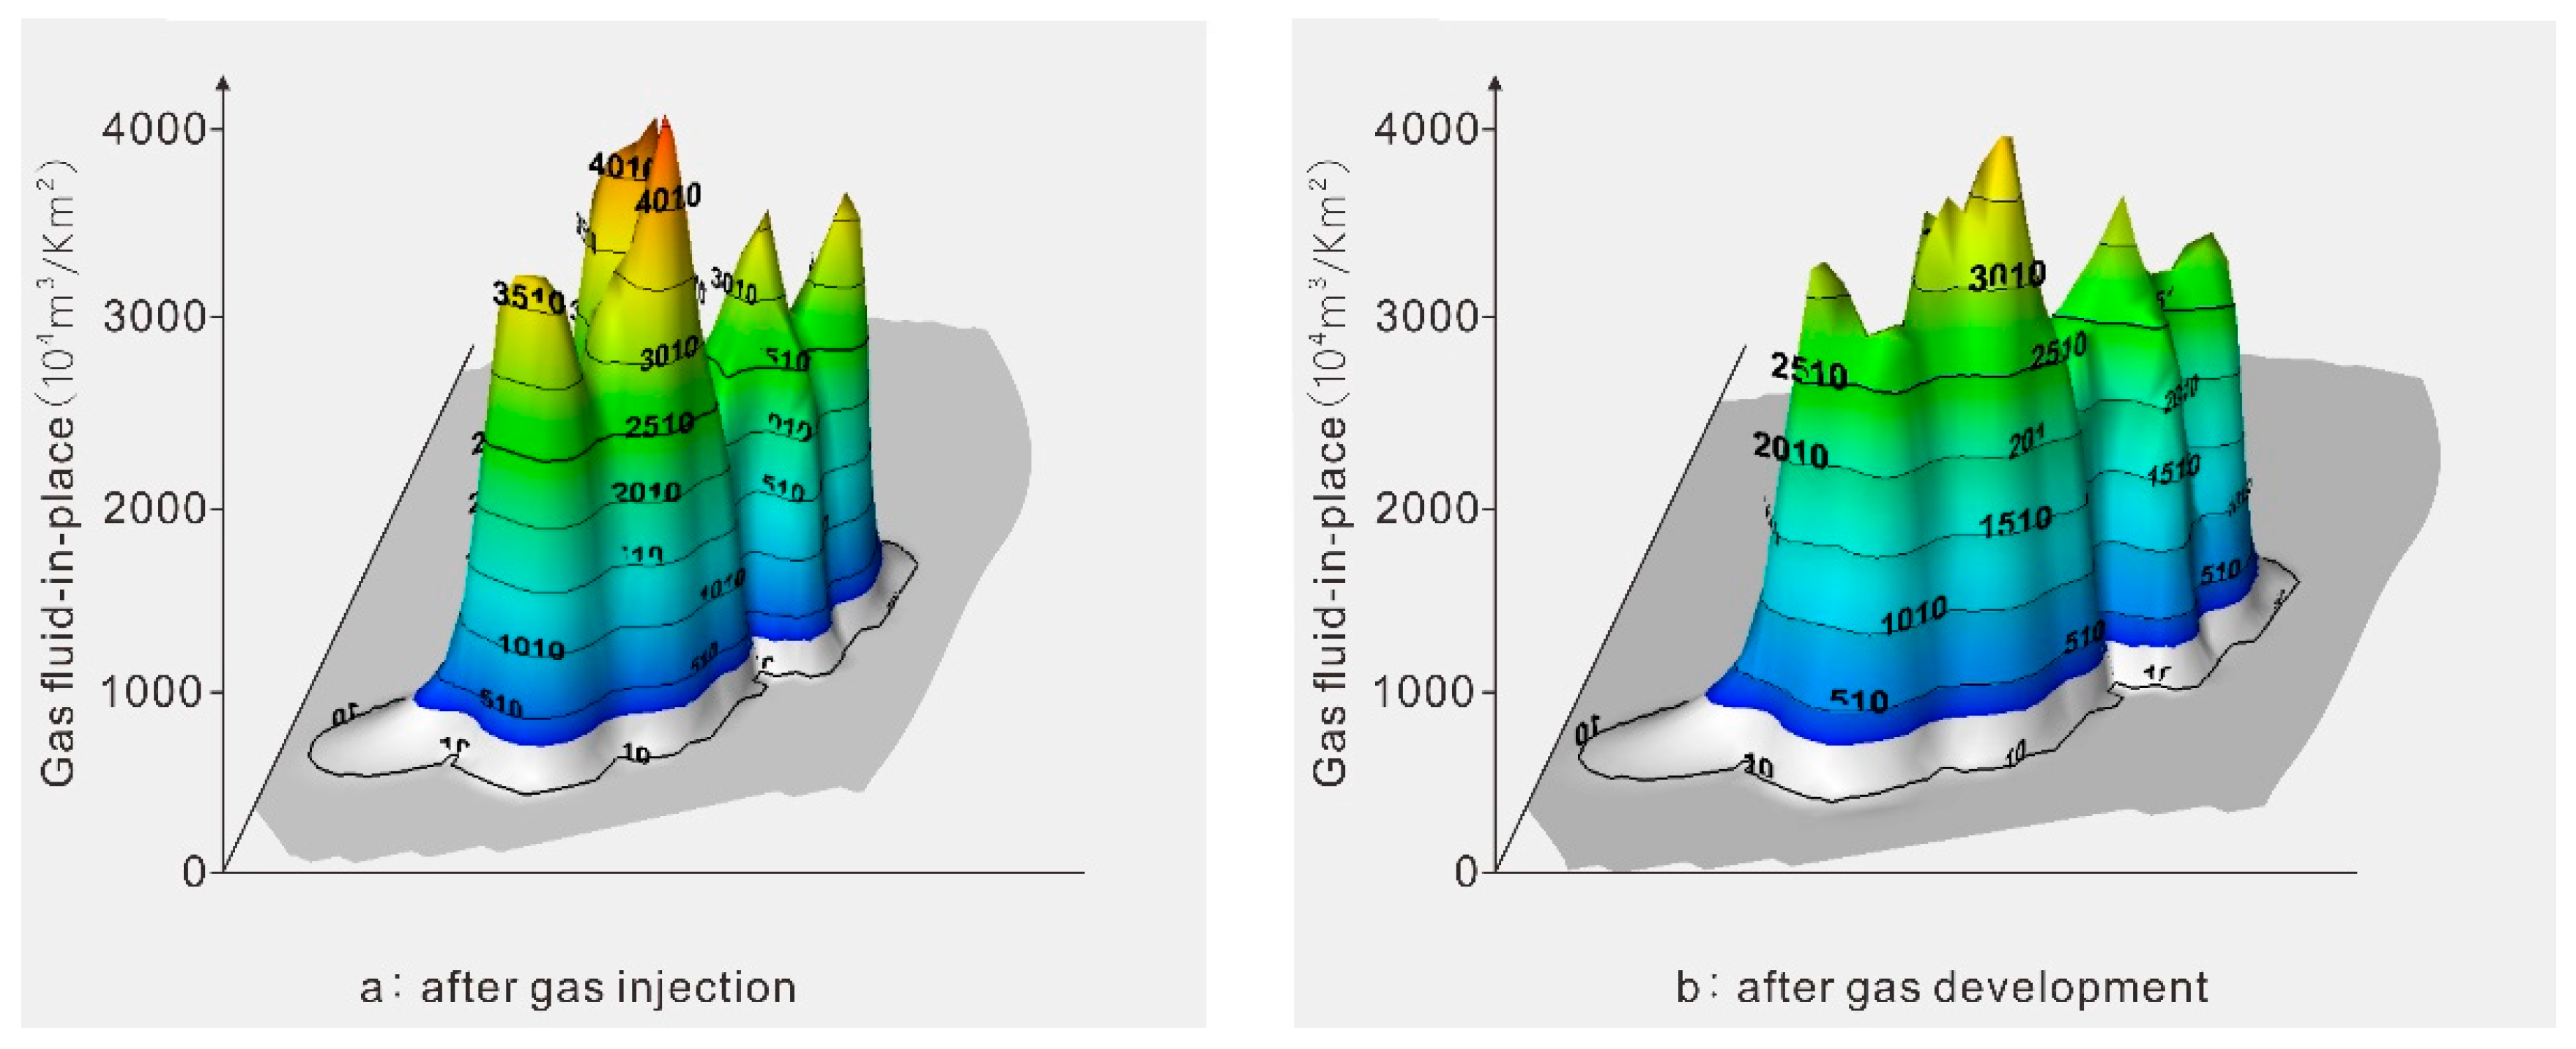
Figure 16.
Potential taping scheme for different types of lost gas.
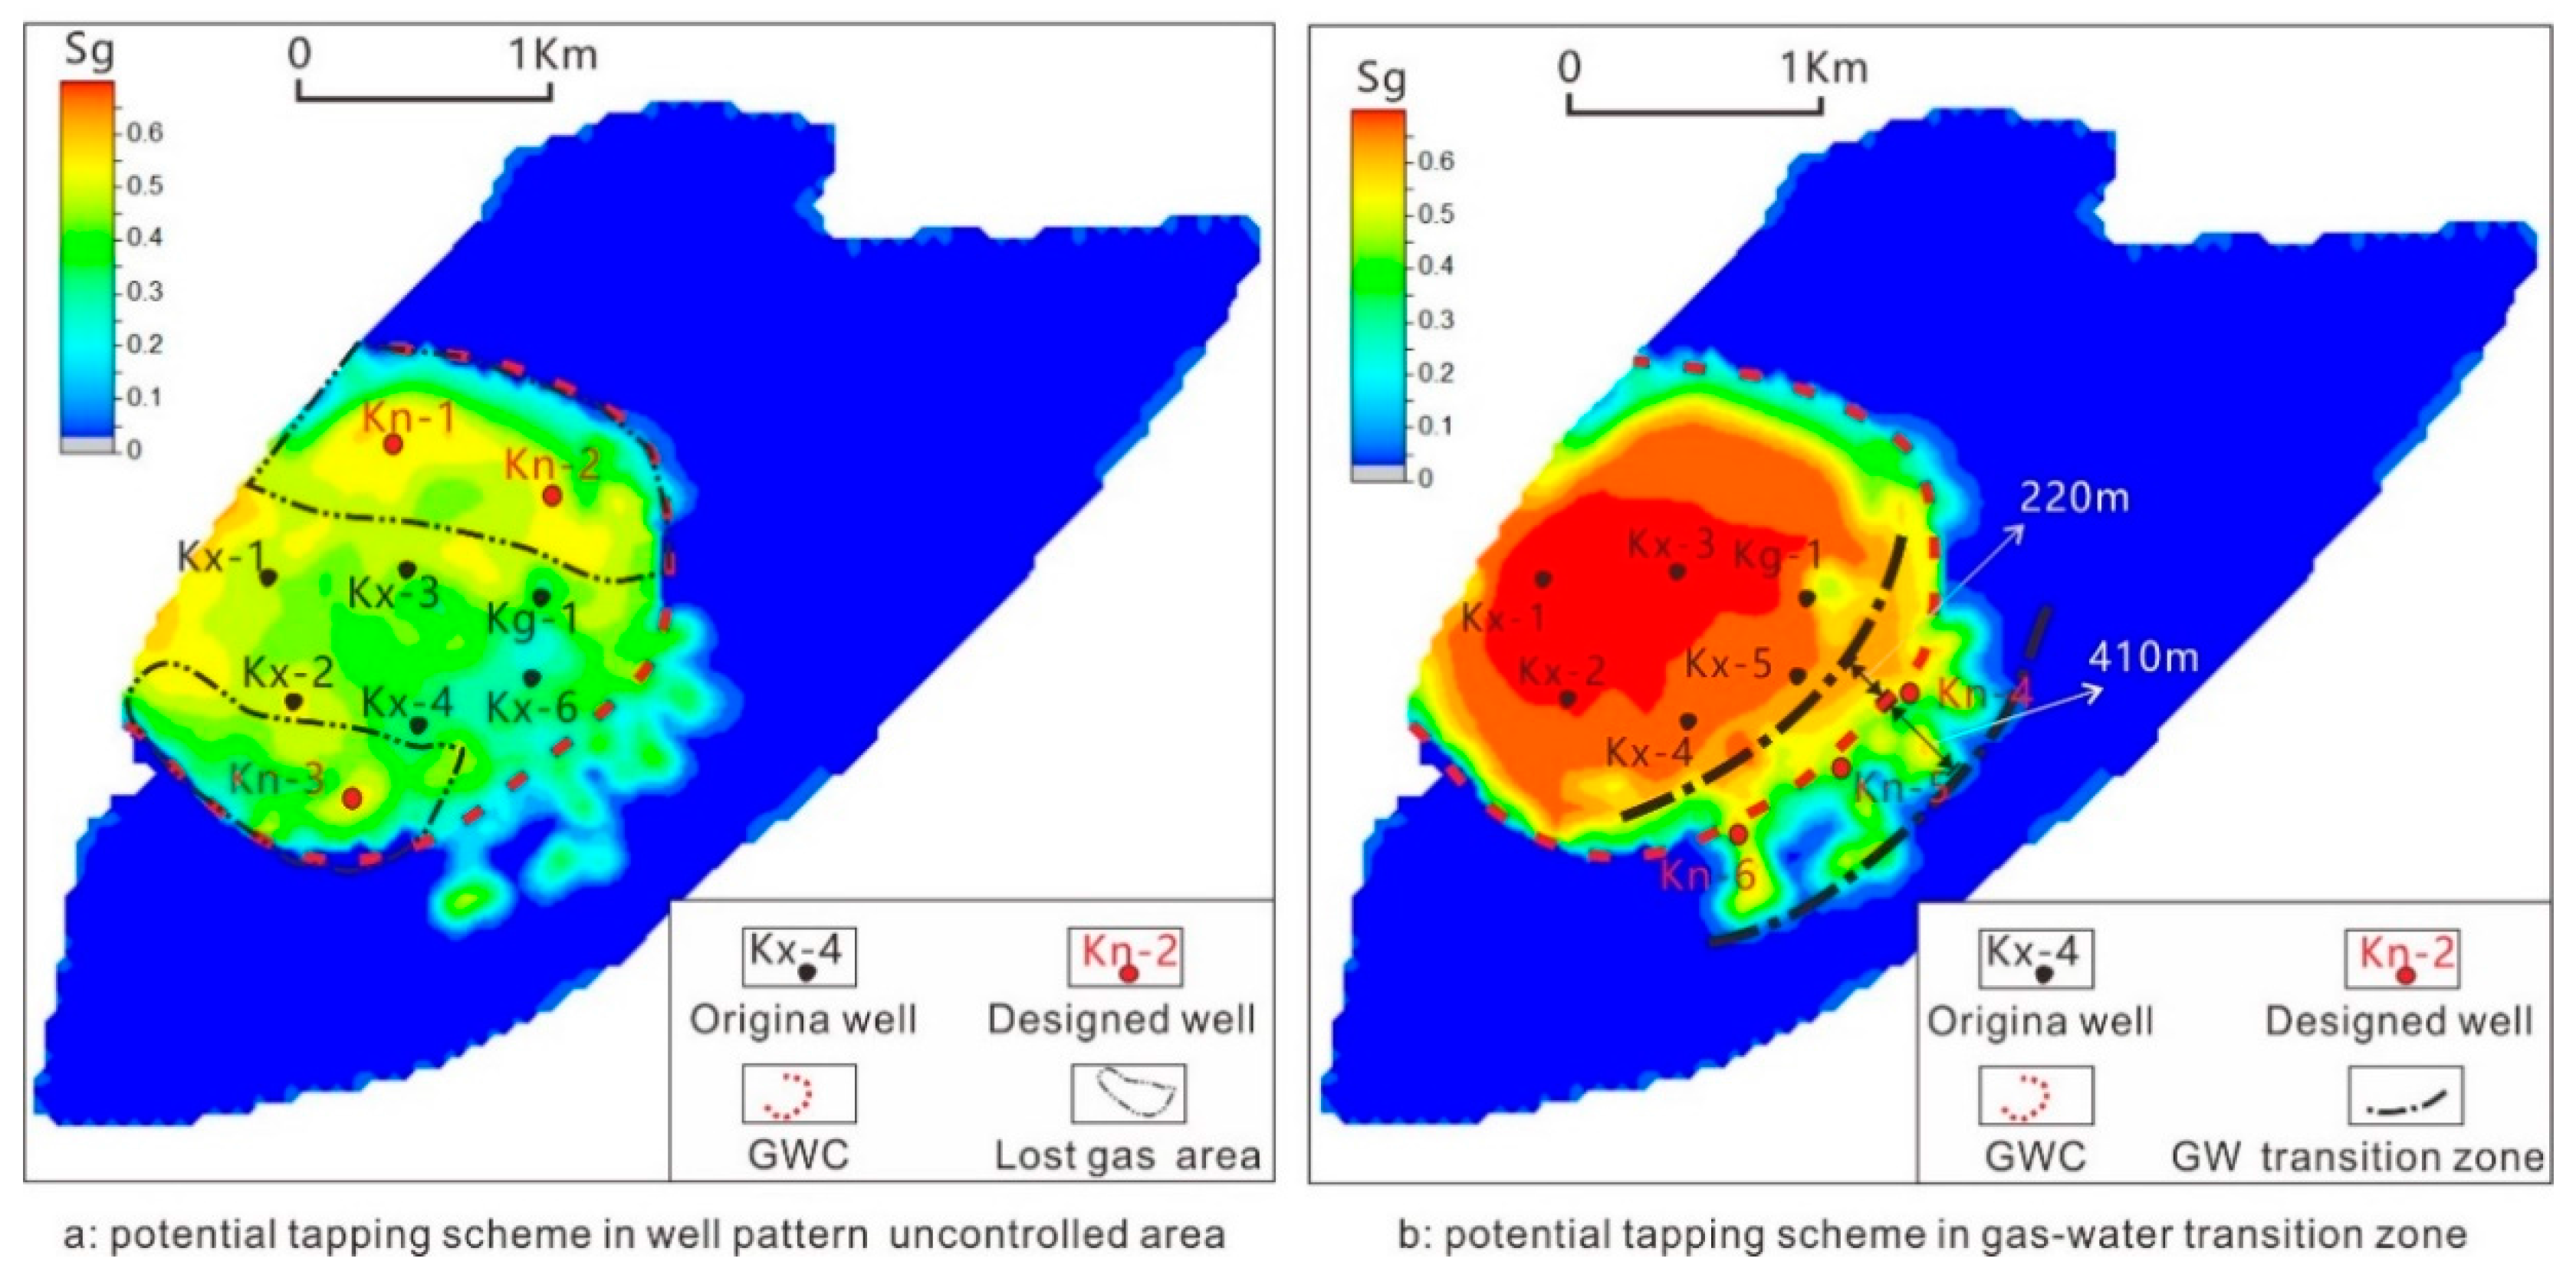
Figure 17.
Prediction of the tapping potential scheme for Ban 876 underground gas storage.

Figure 18.
The effect of non-Darcy effect on the productivity and pressure of underground gas storage is considered.
Figure 18.
The effect of non-Darcy effect on the productivity and pressure of underground gas storage is considered.

Table 1.
Experimental parameters of the large-sized core experiment and amount of lost gas.
| Sample Number | Experimental Serial Number | Gas Injection(m3) | Gas Ptoduction(m3) | Water Production(mm3) | Produced Water Volume(PV) | Lost Gas Volume(m3) |
|---|---|---|---|---|---|---|
| B-1 | 1 | 0.324 | 0.263 | 0.184 | 20 | 0.061 |
| B-1 | 2 | 0.295 | 0.222 | 0.237 | 26 | 0.073 |
| B-1 | 3 | 0.321 | 0.244 | 0.253 | 28 | 0.077 |
| B-1 | 4 | 0.372 | 0.275 | 0.192 | 21 | 0.097 |
| B-1 | 5 | 0.311 | 0.252 | 0.224 | 25 | 0.059 |
| B-2 | 1 | 0.283 | 0.221 | 0.176 | 20 | 0.062 |
| B-2 | 2 | 0.312 | 0.223 | 0.255 | 28 | 0.089 |
| B-2 | 3 | 0.259 | 0.167 | 0.211 | 23 | 0.092 |
| B-2 | 4 | 0.274 | 0.216 | 0.222 | 25 | 0.058 |
| B-2 | 5 | 0.342 | 0.268 | 0.265 | 29 | 0.074 |
| B-3 | 1 | 0.263 | 0.189 | 0.211 | 23 | 0.074 |
| B-3 | 2 | 0.272 | 0.206 | 0.191 | 21 | 0.066 |
| B-3 | 3 | 0.257 | 0.175 | 0.215 | 24 | 0.082 |
| B-3 | 4 | 0.276 | 0.222 | 0.189 | 21 | 0.054 |
| B-3 | 5 | 0.345 | 0.261 | 0.212 | 24 | 0.084 |
Table 2.
Statistical table of natural gas fluid parameters.
| Formation pressure (MPa) | 21 |
| Formation temperature (°C) | 89 |
| Natural gas density (g/cm3) | 0.0001 |
| Rock compression coefficient (10−4 MPa−1) | 4.575 |
| Formation water viscosity (mPa·s) | 0.38 |
| Viscosity parameters of formation water (1/MPa) | 3.28 × 10⁻⁴ |
© 2018 by the authors. Licensee MDPI, Basel, Switzerland. This article is an open access article distributed under the terms and conditions of the Creative Commons Attribution (CC BY) license (http://creativecommons.org/licenses/by/4.0/).
Share and Cite
MDPI and ACS Style
Wang, J.; Liu, H.; Zhang, J.; Xie, J. Lost Gas Mechanism and Quantitative Characterization during Injection and Production of Water-Flooded Sandstone Underground Gas Storage. Energies 2018, 11, 272. https://doi.org/10.3390/en11020272
AMA Style
Wang J, Liu H, Zhang J, Xie J. Lost Gas Mechanism and Quantitative Characterization during Injection and Production of Water-Flooded Sandstone Underground Gas Storage. Energies. 2018; 11(2):272. https://doi.org/10.3390/en11020272
Chicago/Turabian StyleWang, Jinkai, Hengyi Liu, Jinliang Zhang, and Jun Xie. 2018. "Lost Gas Mechanism and Quantitative Characterization during Injection and Production of Water-Flooded Sandstone Underground Gas Storage" Energies 11, no. 2: 272. https://doi.org/10.3390/en11020272
Note that from the first issue of 2016, this journal uses article numbers instead of page numbers. See further details here.