Integrated Optimization of Speed Profiles and Power Split for a Tram with Hybrid Energy Storage Systems on a Signalized Route

School of Electrical Engineering, Southwest Jiaotong University, Chengdu 610031, China
*
Author to whom correspondence should be addressed.
Energies 2018, 11(3), 478; https://doi.org/10.3390/en11030478
Submission received: 10 January 2018
/
Revised: 10 February 2018
/
Accepted: 13 February 2018
/
Published: 25 February 2018
(This article belongs to the Section D: Energy Storage and Application)
Abstract
:A tram with on-board hybrid energy storage systems based on batteries and supercapacitors is a new option for the urban traffic system. This configuration enables the tram to operate in both catenary zones and catenary-free zones, and the storage of regenerative braking energy for later usage. This paper presents a multiple phases integrated optimization (MPIO) method for the coordination of speed profiles and power split considering the signal control strategy. The objective is to minimize the equivalent total energy consumption of all the power sources, which includes both the energy from the traction substation and energy storage systems. The constraints contain running time, variable gradients and curves, speed limits, power balance and signal time at some intersections. The integrated optimization problem is formulated as a multiple phases model based on the characters of the signalized route. An integrated calculation framework, using hp-adaptive pseudospectral method, is proposed for the integrated optimization problem. The effectiveness of the method is verified under fixed time signal (FTS) control strategy and tram priority signal (TPS) control strategy. Illustrative results show that this method can be successfully applied for trams with hybrid energy storage systems to improve their energy efficiency.
1. Introduction
Trams have been one of the most popular urban rail transit vehicles in the past few years due to the economic and environmental advantages. There are some routes including both catenary zones and catenary-free zones, because some sections that are not suitable for setting up catenary in business centers or the tourist attraction. A tram with on-board energy storage systems (ESSs) can drive autonomy in the catenary-free zones [1]. For the tram with on-board ESSs, a method is called to improve the energy efficiency of the overall system. Apart from energy-efficient design of vehicles, eco-driving and the utilization of regenerative braking energy are recognized as the most promising methods [2]. Eco-driving refers to the optimization of driving strategies, which can reduce the energy consumption and ensure the punctuality of trips. The utilization of regenerative braking energy can be realized by on-board ESSs, according to properly conserving the electric braking energy and delivering power for the next traction operation [3]. The coordinate optimization of the two problems can increase the energy efficiency and enhance the performance of the tram. Hence, the research focuses on the integrated optimization of speed profiles and power split for a tram with on-board ESSs.
Former studies for speed profiles were based on trains with a single power source, either electric power or fossil fuel. Their purpose is to calculate the optimized speed profiles under fixed time and operation constraints. The solution methods can be classified into indirect methods and direct methods. Indirect methods are based on the conclusions of Pontryagin maximum principle (PMP). The optimal shape of single train speed profiles optimization problem is obtained in [4], which consists of Maximum Power, Cruising, Coasting and Maximum braking. In order to get the optimal speed profiles, Liu et al. [5] discussed the optimal switching condition based on PMP. The calculation method of local optimal switching points is studied by Howlett [6]. Wang et al. [7] summarized the optimal switching rules of optimal modes considering regenerative braking, and a global linkage algorithm was proposed with different gradients and speed limits. Direct methods can optimize speed profiles without any pre-defined knowledge. Typically, mathematical programming algorithms, such as mixed-integer linear programming (MILP) [8], sequential quadratic programming (SQP) [9] and evolutionary methods [10,11], are used to calculate speed profiles directly based on the optimization model. Lu et al. [12] compared the results of single train trajectory optimization by ant colony optimization (ACO) algorithm, genetic algorithm (GA) and dynamic programming (DP).
Traffic management, at intersections, is realized by signal lights, which is controlled by a signal controller. FTS and TPS [13] are two typically signal control strategies in the tram systems. TPS refers that the signal time should be adjusted to guarantee the tram to pass intersections without any influence. FTS means that the cycle of signal time is constant, and the tram has to stop before the stop-line if the signal light is red, which may lead to the increase in operation time and energy consumption. To solve this problem, signaling influence is considered as a time constraint in [14,15], and green wave can be realized to avoid idling. Haahr [16] used DP to deal with the constraints of intermediate passage points, and the energy consumption can be decreased. However, the utilization of regenerative braking energy is not considered in the studies.
The main challenges of using the regenerative braking energy lie in the power split strategies of different power sources. The conditions of power supply are different in catenary zones and catenary-free zones. In catenary zones, the power sources contain the traction substation and on-board ESSs. For the irreversible substation, regenerative energy cannot be absorbed if there are no accelerating vehicles in the same segment of traction power supply. Meanwhile, the voltage of the catenary would rise and damage the system infrastructure potentially [17]. In catenary-free zones, the tram is only powered by on-board ESSs. Hence, the type of ESSs plays an important role to enhance performance of the tram. Presently, batteries (BTs) and supercapacitors (SCs) [18,19] are widely used in transportation regions for on-board ESSs. The BTs have high energy density but a low power density, and the characters limit their standalone application in trams. The SCs can provide high power density and fast response but low energy capacity. Hence, hybrid energy storage systems (HESSs) combined the BTs with the SCs can improve the operation performance of the tram [20,21].
Energy management strategies are proposed to achieve minimum cost of the multi-sources system. The approaches can be grouped into two main categories: optimization-based and rule-based. The theoretical optimal power sharing results can be obtained by global optimization algorithms such as DP [22] or GA [23]. Li et al. [24] proposed a state machine strategy based on droop control to coordinate multiple power sources. However, the drive cycle has known in advance. Shen et al. [25] presented an intelligent online algorithm to optimize the power split of HESSs based on neural networks. The rules of Rule-based methods are derived from optimal control theory and human experience [26], without a priori knowledge or a reference speed curve. The overall efficiency of the system would be influenced and suboptimal results might be obtained.
In the above studies, the optimization of speed profiles and power split for the tram with HESSs are studied separately. However, speed curves and power split interact with each other based on the power flow of the system. The coordination of speed profiles and the charging/discharging control instructions simultaneously is considered in [27]. Besides, speed limitations, gradients and signaling constraints are not considered, and the SCs are the only ESSs. The results of a catenary zone are discussed. It is a significant challenge to improve the energy efficiency of the tram with on-board HESSs. In this paper, a multiple phases integrated optimization model is established to coordinate operational constraints of the tram, the signaling, traction power supply system (TPSS), optimal running states connection between catenary zones and catenary-free zones, and the MPIO method is verified under two different signal control strategies: TPS and FTS.
To conclude, the contributions of this paper are given as follows. Firstly, a multiple phases integrated optimization model for coordination of speed profiles and power split of multiple power sources has been established. The variable gradients, speed limits, timetable, signal timing and the character of TPSS are considered. Secondly, a simulation framework, using hp-adaptive pseudospectral [28] approach, is introduced to solve the integrated optimization problem. Thirdly, two signal control strategies are discussed to verify the efficiency of the MPIO method. The simulation results indicate the energy saving potential of the method.
The rest of this paper is organized as follows. Section 2 presents the system models of the hybrid tram and two different signal control strategies. In Section 3, the multiple phases optimization model and the calculation framework are developed to solve the energy efficiency problem. In Section 4, several case studies are evaluated. Conclusions are given in Section 5.
2. System Modeling
2.1. System Description and Power Flow
The diagram of a tram with on-board HEESs and its electrical power flow is shown in Figure 1. This hybrid tram consists of three traction units and one trailer unit. The traction units are driven by the traction system via converters. The BTs and the SCs are connected to the intermediate direct current (DC) link bus by bidirectional DC/DC converters, respectively. This connection can deliver energy from the ESSs to DC bus, and vice versa. In addition, the BTs and the SCs can be controlled independently. The TPSS contains both catenary zones and catenary-free zones. In catenary zones, the tram is mainly powered by irreversible substations; moreover, on-board HESSs are used for peak-power regulation during full power and maximum regenerative braking modes. The tram is directly fed from on-board HESSs in catenary-free zones, and the HESSs are always in charging or discharging mode to satisfy the power request from the transmission system.
The power flow of this hybrid tram can be described as Equation (1):
here, is a binary parameter that represents the supply power mode. In catenary zones, the parameter is equal to 1, while the parameter is equal to 0 when the tram in catenary-free zones. , , and are the power in intermediate DC link of catenary, the BTs, the SCs and traction system, respectively. It is defined that , , are positive when power plants supply power to tram. and are negative when the components are charged. is negative when the regenerative braking power returns to the catenary. The auxiliary system is related to comfort and some functions of the tram, which mainly provides power for the devices including cooling fans of traction systems, the lighting system, air conditioning system and air compressor [29]. In the running process, the power change of the auxiliary system is minor, so the value is assumed as a constant value all of catenary zones and catenary-free zones in practice engineering application. is the power of auxiliary system.
2.2. Tram Movement Modeling
The braking behaviour of hybrid tram depends on a blending control strategy, which consists of electrical braking and pneumatic braking. The electrical braking power can return to the on-board HESSs or the catenary, but the pneumatic braking power is consumed by the braking system. Hence, it is necessary to calculate the force of electrical braking and pneumatic braking separately. The longitudinal dynamics model of a tram moving along a track, using Newton’s second law, is derived as Equations (2) and (3):
where v, t and s are the speed, running time and position of the tram, respectively. M is total weight of tram including the passengers; denotes the weighted average rotary mass coefficient; , , are the maximum traction force, electric brake force and pneumatic brake force provided by the drive system under speed v. , and are the traction, electric brake and the pneumatic brake control variables, respectively. is resistance of tram movement that correlated to speed v. Equation (4) is adopted to model such resistance, where the value of a, b and c are constant for a specific tram [30]. is the sum of gradient and curve resistance.
here, g is the gravitational acceleration, and is track slope angle. r is the radius of the curve, and R is a constant number. Tram operation process is constrained by the characteristics of the vehicle, the control variabies should be satisfied,
In addition, the path constraints and boundary constraints are shown in Equation (7).
where is the speed limit of tram at position s. denotes the position of station i, and is the planned running time from to .
The power at the wheels , according to mechanical force and vehicle speed, can be calculated as Equation (8). The power , going upstream to the intermediate DC link, is expressed as Equation (9) considering energy loss in the transmission process.
greater than zero represents the traction mode; less than zero represents regenerative braking mode. is equal to zero, which represents that the tram is coasting or only conducting pneumatic braking. is the conversion efficiency of traction system which is mainly affected by the running speed and torque. However, it is hard to obtain the accurate quantitative relationship between the energy efficiency and the influence factors. Hence, the equivalent efficiency is expressed as constant values [31], which is obtained from experience.
2.3. Power Plant Model
2.3.1. Catenary Model
The irreversible substations are modelled as an ideal DC voltage source in series with an equivalent resistance and a diode [32], as shown in Figure 2. The catenary is virtually divided into two parts by the tram, and the equivalent resistances and change with the tram position, calculated by Equation (10). The substation power and catenary power can be deduced as Equations (11) and (12). The voltage of catenary should be limited to between the minimum value and the maximum value , as illustrated in Equation (13).
here, represents the resistivity coefficient of catenary; l denotes the distance between two adjacent stations; and are the distance between the traction substation and the station, respectively. indicates the voltage of catenary when the tram at the position s; and are current of catenary shown in Figure 2.
2.3.2. On-Board Hybrid Power Plant Model
Equivalent electric circuit model is an effective method to describe the charging/discharging characteristic of the HESSs. As for battery [33], a voltage source, , in series with an inner resistance is considered, and the power at the terminals can be calculated by Equation (14). denotes the remaining capacity of the BTs, which is changed with the output/input current . The law of change is portrayed by Equation (15), and the position is chosen as the independent variable to be consistent with tram movement model. Generally, should be limited to a range, and the current output/input should not exceed its given boundary. Those constraints are given as inequality Equations (16) and (17).
where is the current of BTs, and are the efficiency of DC/DC converters and the BTs charging/discharging process; Q is the nominal capacity of BTs. and are the lower and upper limitations of BTs current. and denote the minimum and maximum bounds of SOC for BTs, respectively. Both the open circuit voltage and the resistance are changed with , and the relationship is determined by experiments.
The equivalent electric energy of the BTs is calculated as
where is the equivalent electric energy of the BTs; is the rated voltage of the BTs.
Similarly, the SCs is regarded as a capacitor in series with a resistance as shown in Figure 2. The SCs output/input power is calculated using Equation (19).
where , and are the actual voltage, current and resistance of the SCs.
The actual voltage and SOC of the SCs are defined as Equations (20) and (21). The and are subject to Equations (22) and (23).
here, is the efficiency of the SCs charging/discharging process; C is the capacitance of the SCs. and are the SCs voltage limits; and are the minimum and maximum bounds of SOC for the SCs; and are the lower and upper limitation of current for the SCs.
The equivalent electric energy of the SCs is calculated as
where is the equivalent electric energy of the SCs.
2.4. Signal Control Strategies
The tram shares the road with other traffic at some intersections. The traffic is managed by signal controller, and tram has to stop before the stop-line if the signal is red. One way to avoid idling is to optimise tram speed with signal information. The two types of signal control strategies widely used in the road are illustrated as follows:
2.4.1. Fixed Time Signal Strategy
For a FTS programs, the total cycle time is constant. To improve the operational efficiency of tram, it is a feasible approach that optimizes tram trajectory to allow the tram travel in green wave [12,13]. The green wave means that the tram passes through the intersections without stopping as illustrated in Figure 3. There are two signal-controlled intersections between two stations A and B. The green wave can be realized by taking the signal cycle into account, which illustrates as the green dotted area. For a given signal cycle i ( is equal to ), the green wave at can be realized as Equation (25).
where is the tram operation time at intersection ; and denote the start and end time of green signal at intersection p in signal cycle i, respectively. and are the start and end time of red signal at intersection p in signal cycle i, respectively.
2.4.2. Tram Priority Signal Strategy
In small tram networks, TPS strategy is to grant tram priority over other traffic that the tram can pass intersections without a stop, and the operation speed is not affected by the traffic light. Three adjustment methods, which are green extension, early green and phase insertion have been described in [34].
3. Integrated Optimization Model and Solution Method
Speed curves and power split interact with each other based on the balance of power flow. An integrated model is used to analyze the overall system that includes TPSS, HESSs, tram dynamic model and signal information.
3.1. Multiple Phases Concept
In order to describe the problem accurately, a multiple phases concept is introduced. A signalized route can be divided into a finite number sections by following key points:
- the points of changing power supply mode;
- the points of traffic light;
- the points of changing speed limits;
- the points of start and stop stations.
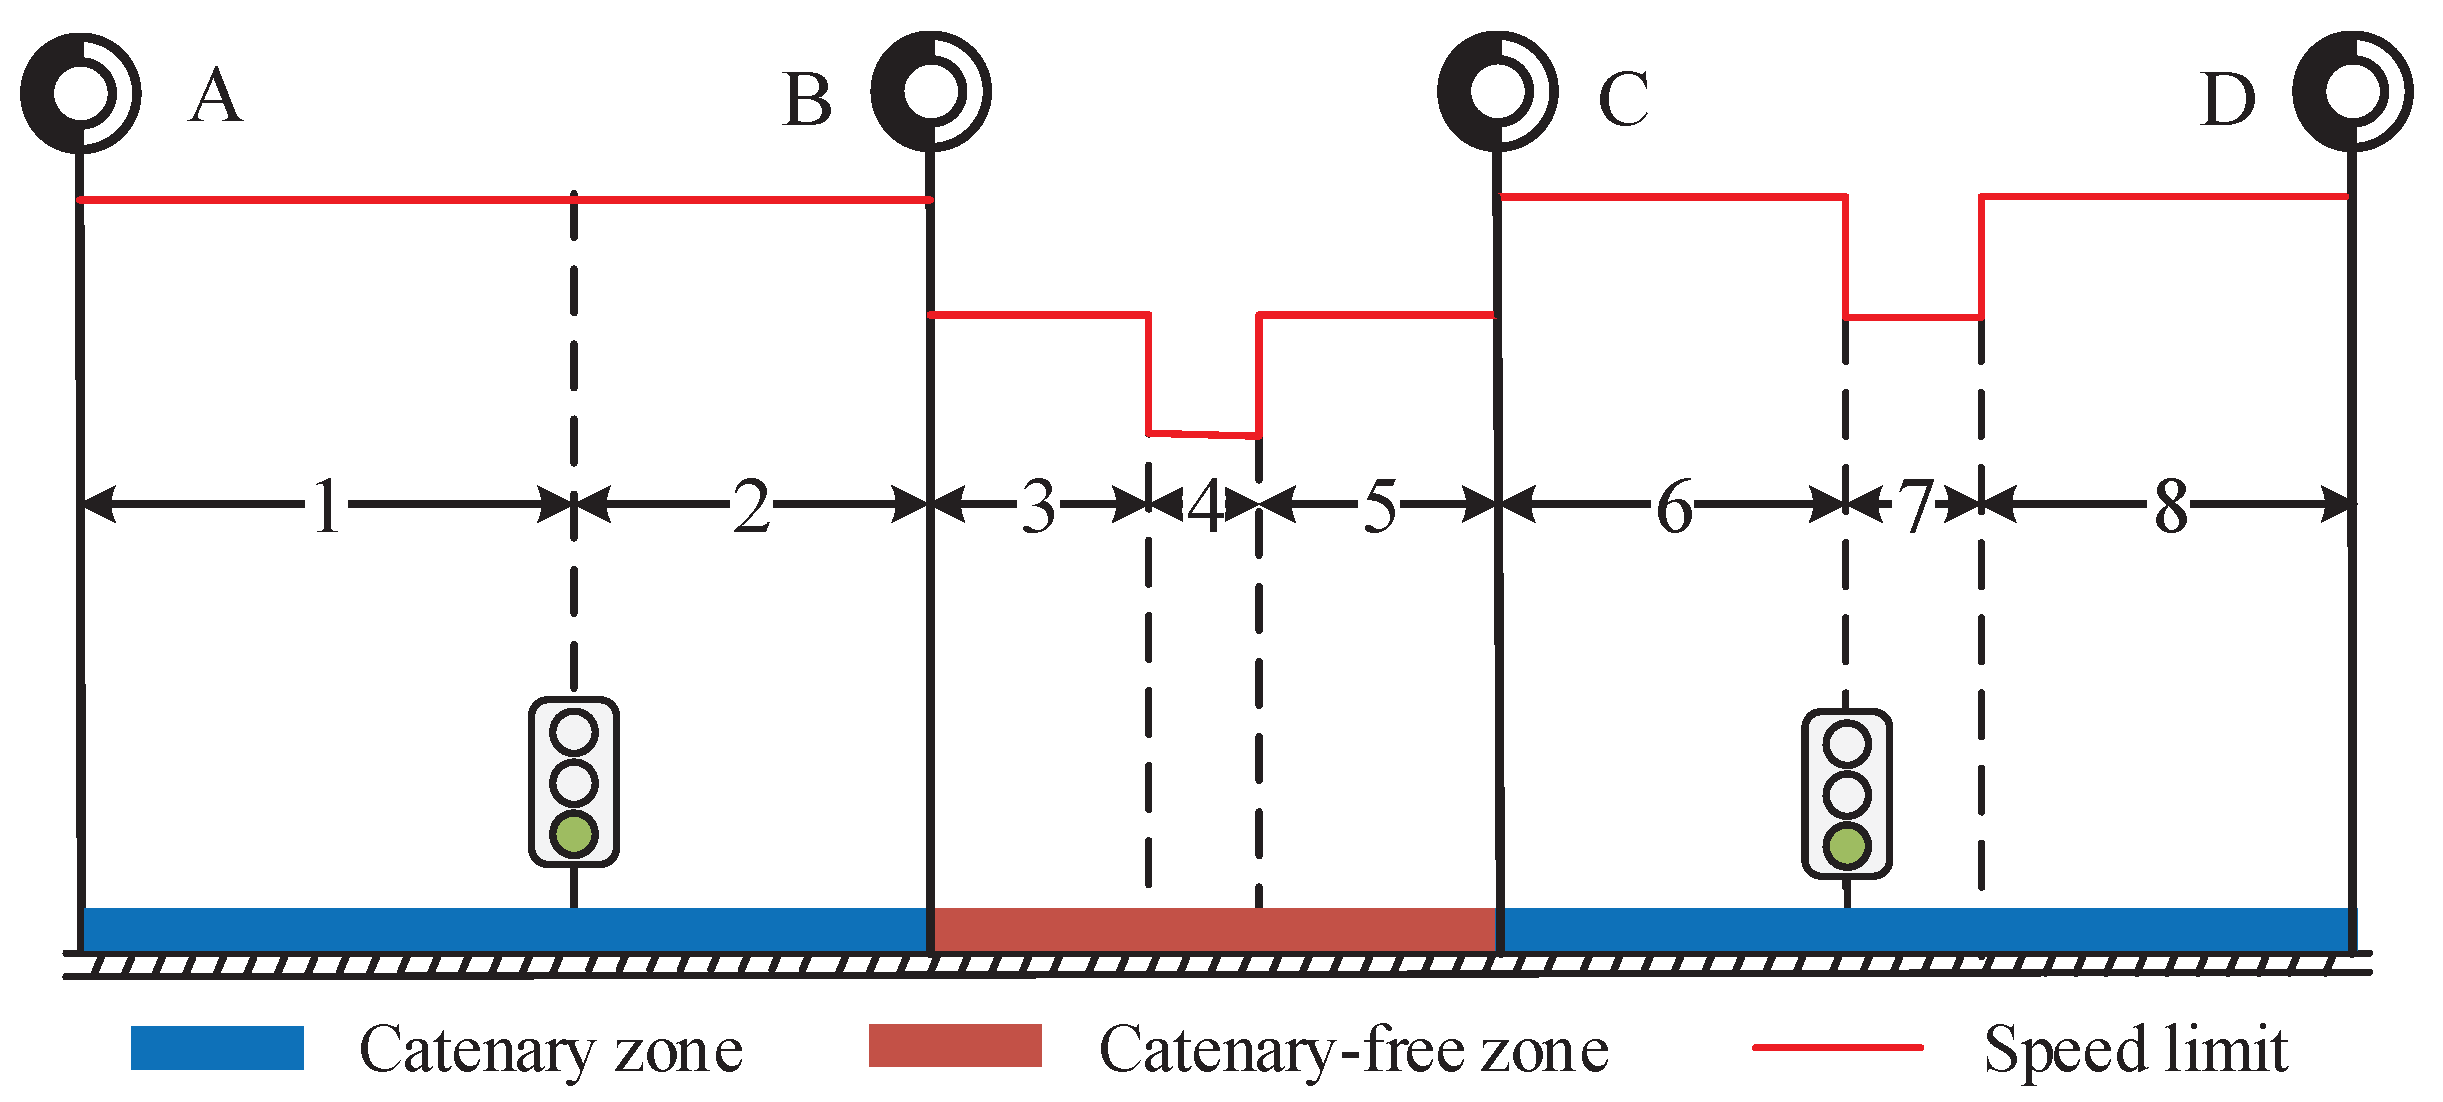
Each section is called a “phase”. In any particular phase, speed limit, TPSS mode, signal constraint and cost function are unique based on above criteria. The complete model is then obtained by properly linking adjacent phases via linkage conditions. The set of the whole trajectory that contains R distinct phases is denoted by . The set of catenary zones and catenary-free zones are denoted by and , where , and . Consider a tram travelling from station A to station D through station B and C, and the line has two intersections. As a result, the trajectory is divided into 8 phases if signal controller adopts FTS strategy, = {1, 2, 6, 7, 8}, = {3, 4, 5}, which is illustrated in Figure 4. If the strategy of signal controller is TPS, the signals are not cut-off points. In this case, the phase 1 and phase 2 can be merged due to the first signal which is no longer a cut-off point, but phase 6 and phase 7 should not be merged because the second signal is also a point of changing speed limits. So the whole trajectory is divided into 7 phases when TPS strategy is adopted.
3.2. Multiple Phases Integrated Optimization Model
A multiple phases integrated model is used to optimize the total equivalent electrical energy both from the traction substation and the on-board HESSs. Let denotes tram position in phase , which locations at interval , and the cost function in phase r is portrayed as
here, is the tram speed in phase r; is a variable that represents the power supply mode in phase r, which is defined as Equation (27). , and are equivalent energy consumption of the catenary, the SCs and the BTs, respectively. The electric braking energy can be fed back to the catenary if on-board HESSs can not absorb the energy. The utilization of this part energy depends on other trams in the same power supply section. To simplify the integrated optimization problem in this paper, the energy is regarded as a fixed proportion returned to the catenary. The equivalent electrical energy cost functions of the HESSs are illustrated as two penalty coefficients and .
The power of traction power substation and catenary are detemined by the catenary voltage , calculated by Equations (29) and (30).
The power of SCs and BTs in phase r are calculated as
where is the voltage of SCs in phase r. and are current of the SCs and the BTs in phase r, respectively. The power at tram wheel rim is deduced by Equation (33), which is converted to the DC link shown as Equation (34).
here, and represent traction and electric braking force control variables in phase r, respectively. and are maximum traction force and electric braking force in phase r, respectively. and denote the power at the wheels and the intermediate DC link in phase r, respectively. The electric power balance in phase r is a path constraint, which is illustrated as Equation (35):
The system states changing with position, in phase r, are formulated as 1
Here, represents pneumatic braking force control variable; is maximum pneumatic braking force, and are running time, SOC of BTs in phase r, respectively. The variables are bounded by the following limits
Define the state vector and the control vector , so that the state constraints, in phase , can be described as:
For the whole journey, the state variables must be continuous. In each phase, the state variables are constrained by the dynamic equations, so the continuity is guaranteed. The constraints in the boundary of each phase can be given as
The general multiple phases integrated optimization problem can be formulated as Equation (43).
where is the dirivative of the objective Equation (26), represents the dynamic constraints Equations (36)–(39), consists of the inequality constraints Equations (25) and (40), and denotes the equality constraints Equation (35) individually. is the linkage conditions between the adjacent phase, presented in Equation (42).
3.3. Solution Framework and Method
The simulation framework is sketched in Figure 5. The input data include the tram data, infrastructure data, trip times and signal data. The tram data mainly contain the vehicle and HESSs parameters. The maximum traction force profile , the maximum electric braking force profile , the maximum pneumatic brake force profile , the tram mass M and the efficiency of the devices are vehicle parameters. HESSs parameters include the efficiency of the onboard devices. Speed limits, gradients, station locations and the information of TPSS are infrastructure data. Trip times of different sections are the boundary constraints for each phase, and signal data are the time constraints. The energy-efficient optimized solutions consist of tram operation strategies and control profiles of HESSs.
Pseudospectral methods for solving multiple phases train trajectory optimal control problems have been presented in [8,15]. The optimal control problem is transcribed to a discrete nonlinear programming problem at collocation points [35]. We use the Legendre-Gauss-Radau method [36] to solve the multiple phases integrated energy-efficient tram optimization problem with optimal control software GPOPS-II in MATLAB [37].
The introduction of the input data in GPOPS-II can be summarized as two steps. The first step is to divide the whole trajectory into multiple phases based on the input data and the multiple phases concept illustrated in Section 3.1. The second step is that assign the input data to the symbols of the general multiple phases integrated optimization model as illustrated in Equation (43). The model in phase r can be built based on the control signal and the power flow, shown in Figure 6, and the model can be solved by GPOPS-II following the users guide in [38].
4. Case Study
4.1. Simulation Data
The maximum traction force profile , the maximum electric braking force profile and the maximum pneumatic brake force profile are presented in Figure 7. The actual force is applied to the wheel, which is determined by the maximum force profiles and control variables.
The parameters of the tram are shown in Table 1, and the main specifications of the BTs and SCs are listed in Table 2. The SCs is composed by 80 Maxwell BMODO165 P048 B09 modules with 10 in series and 8 in parallel, and the total electric energy is 3.562 kW·h. The BTs is composed by 460 MV06203127NTPCA cells with 230 in series and 2 in parallel, and its total electric energy is 7.406 kW·h. The electric energy of the battery pack is obviously higher than the SCs. The reason is that the energy demand of lighting system, air conditioning system and air compressor has been considered under the faulty condition of hybrid tram. The SOC of HESSs at the end of catenary zones are required to be full of electricity, which allows the tram to run in the catenary-free zone without a stop.
A test line with four stations is adopted for the case study, and the total length of the line is 3600 m. Stations A, B, C and D are located at 0 m, 1200 m, 2000 m and 3600 m, respectively. The gradients and speed limits data are shown in Figure 8. The values of gradient vary from about −0.038 to 0.024. Note that the minimum speed limit is 30 km/h in the catenary-free zone, and the maximum value is 75 km/h.
The trip times and TPSS modes for the direction from station A to station D are shown in Table 3. In addition, two signals are located at 720 m and 2700 m, respectively.
The test line has four substations, and the distance between the station and substation is assumed to 300 m. Note that the section is a cetenary-free zone from station B to C. The electric information of TPSS is given in Table 4.
4.2. Case A: Fixed Time Signals Control Strategy
In heavily routes, it is hard to adjust signal time for one tram vehicle as other vehicles approach the intersection, and the FTS control strategy is adopted in case A. This strategy has non-conflicting movements with other vehicles. The green wave time windows are [60, 90] and [215, 245] for two traffic lights, respectively, which are given by the signal controller, and other simulation parameters are illustrated in Section 4.1. Then, the multiple phases integrated optimal model under the FTS control strategy is constructed.
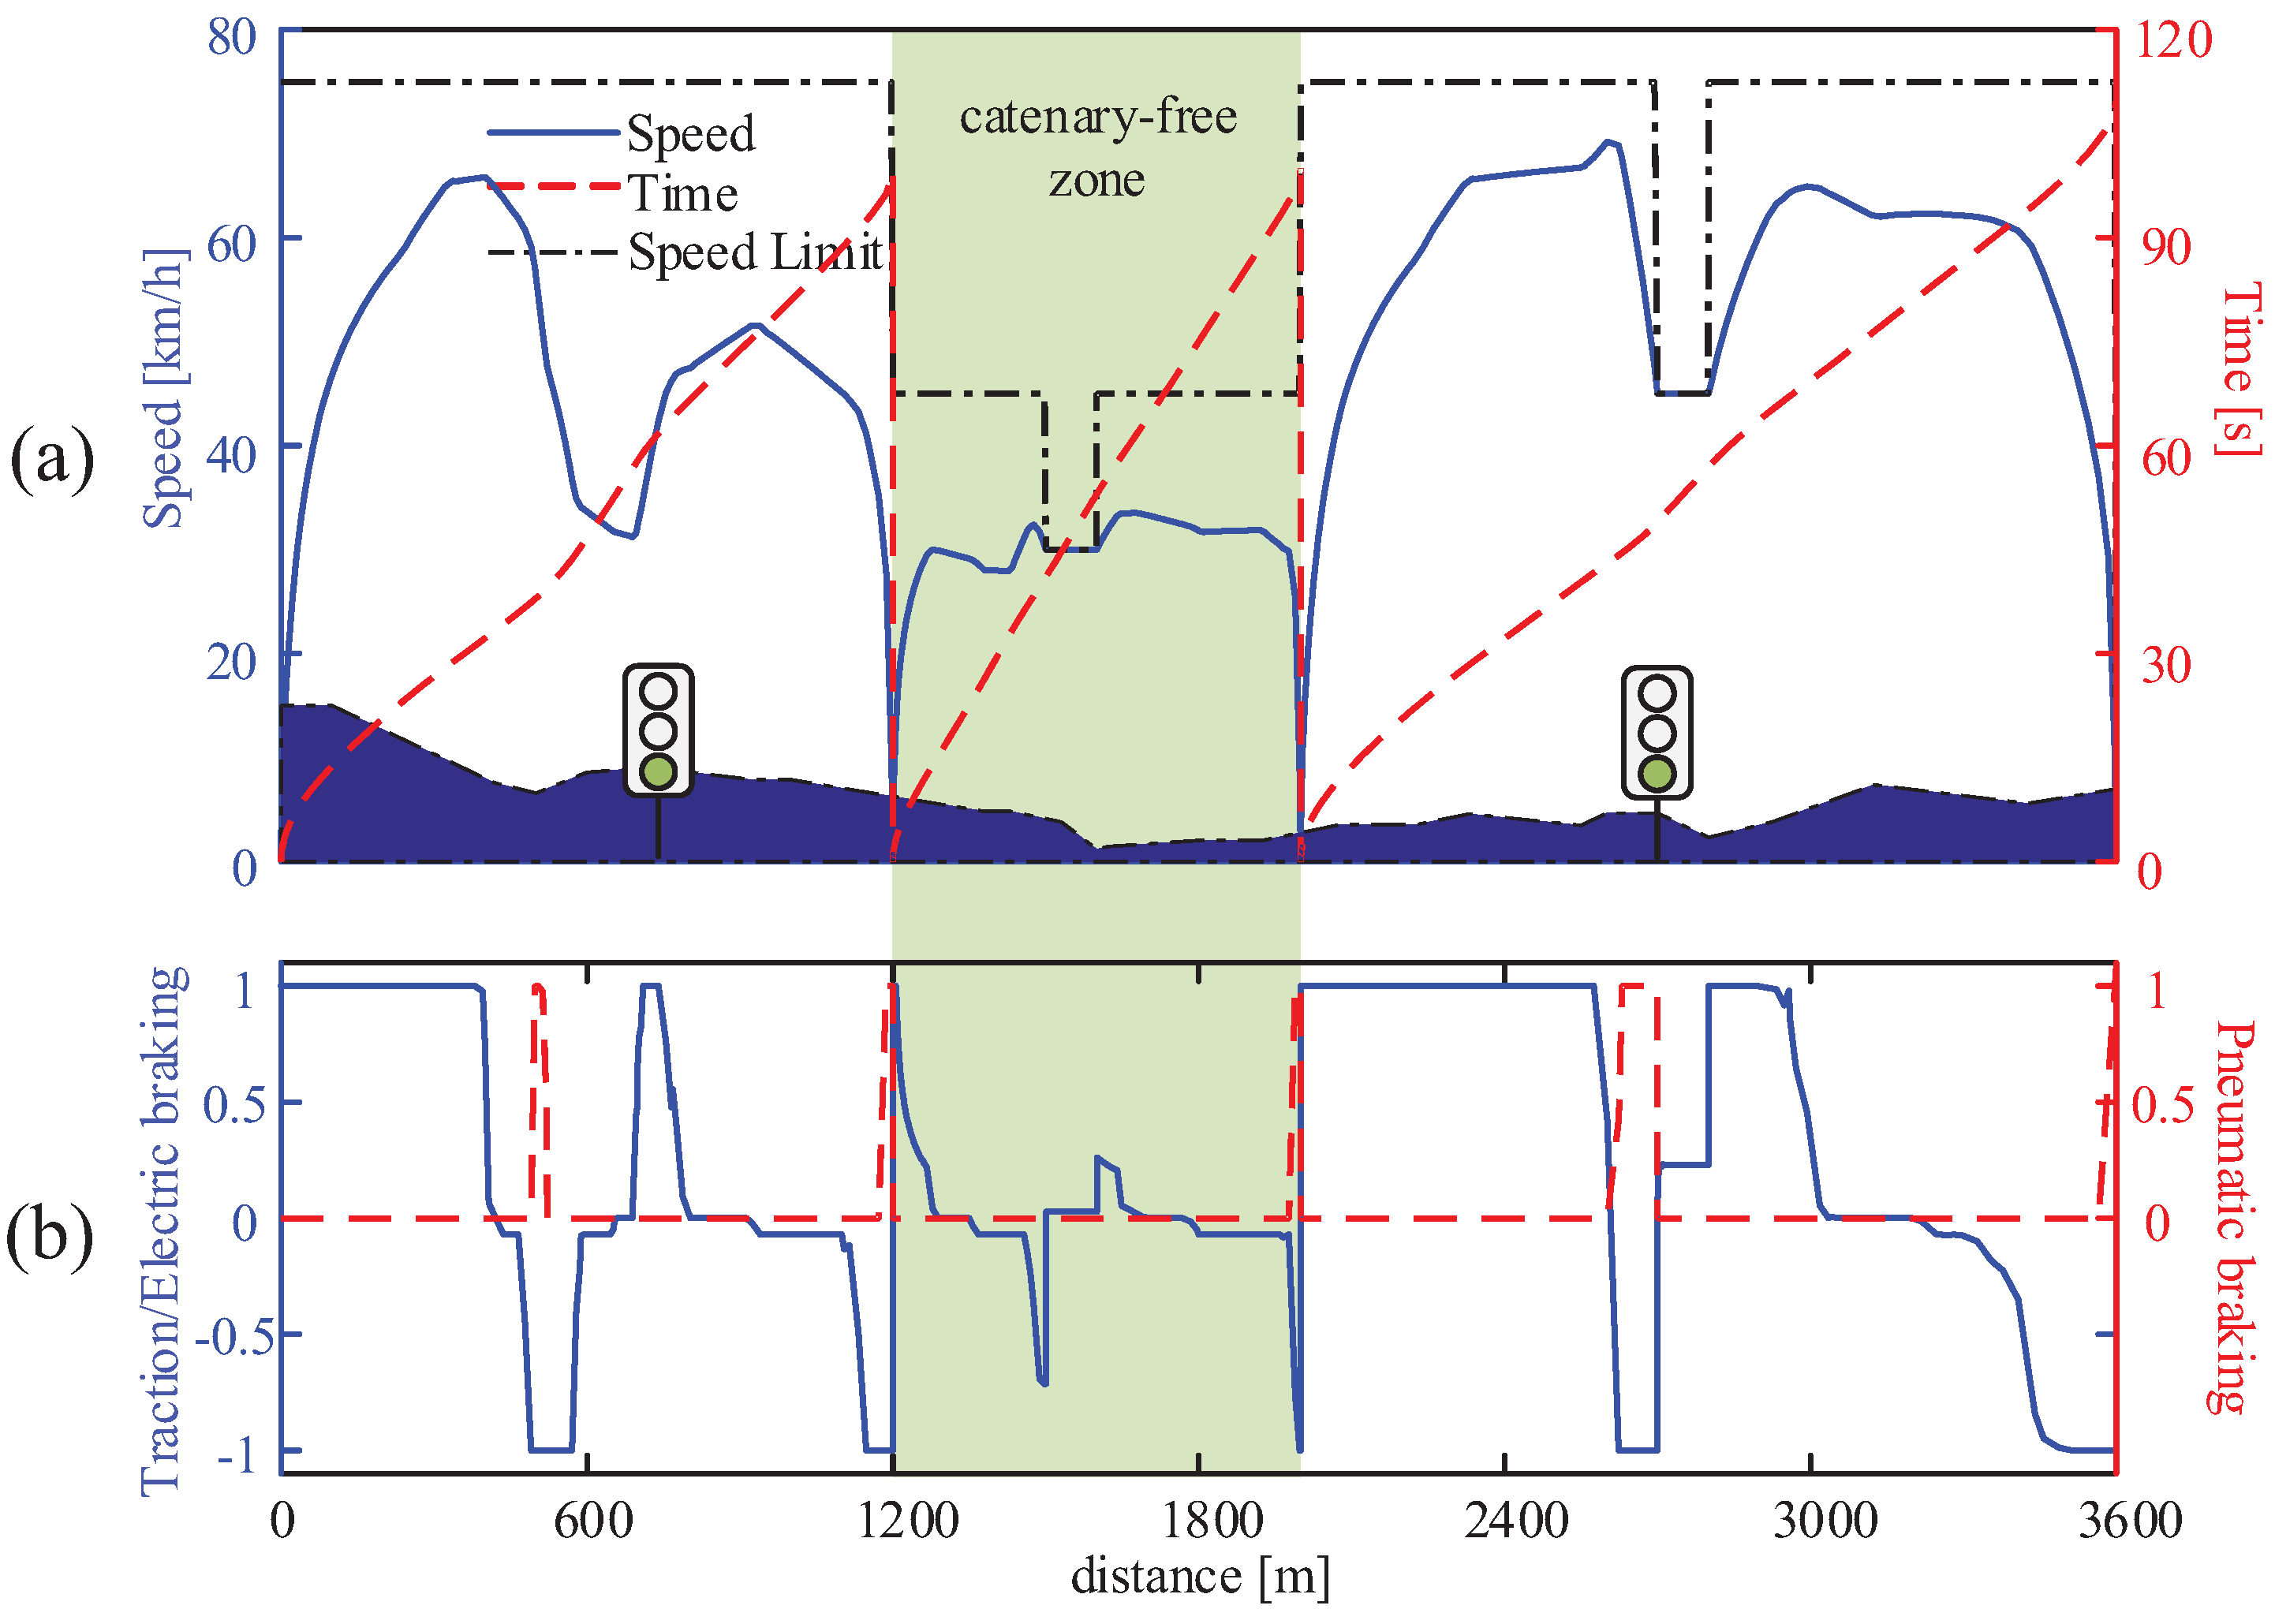
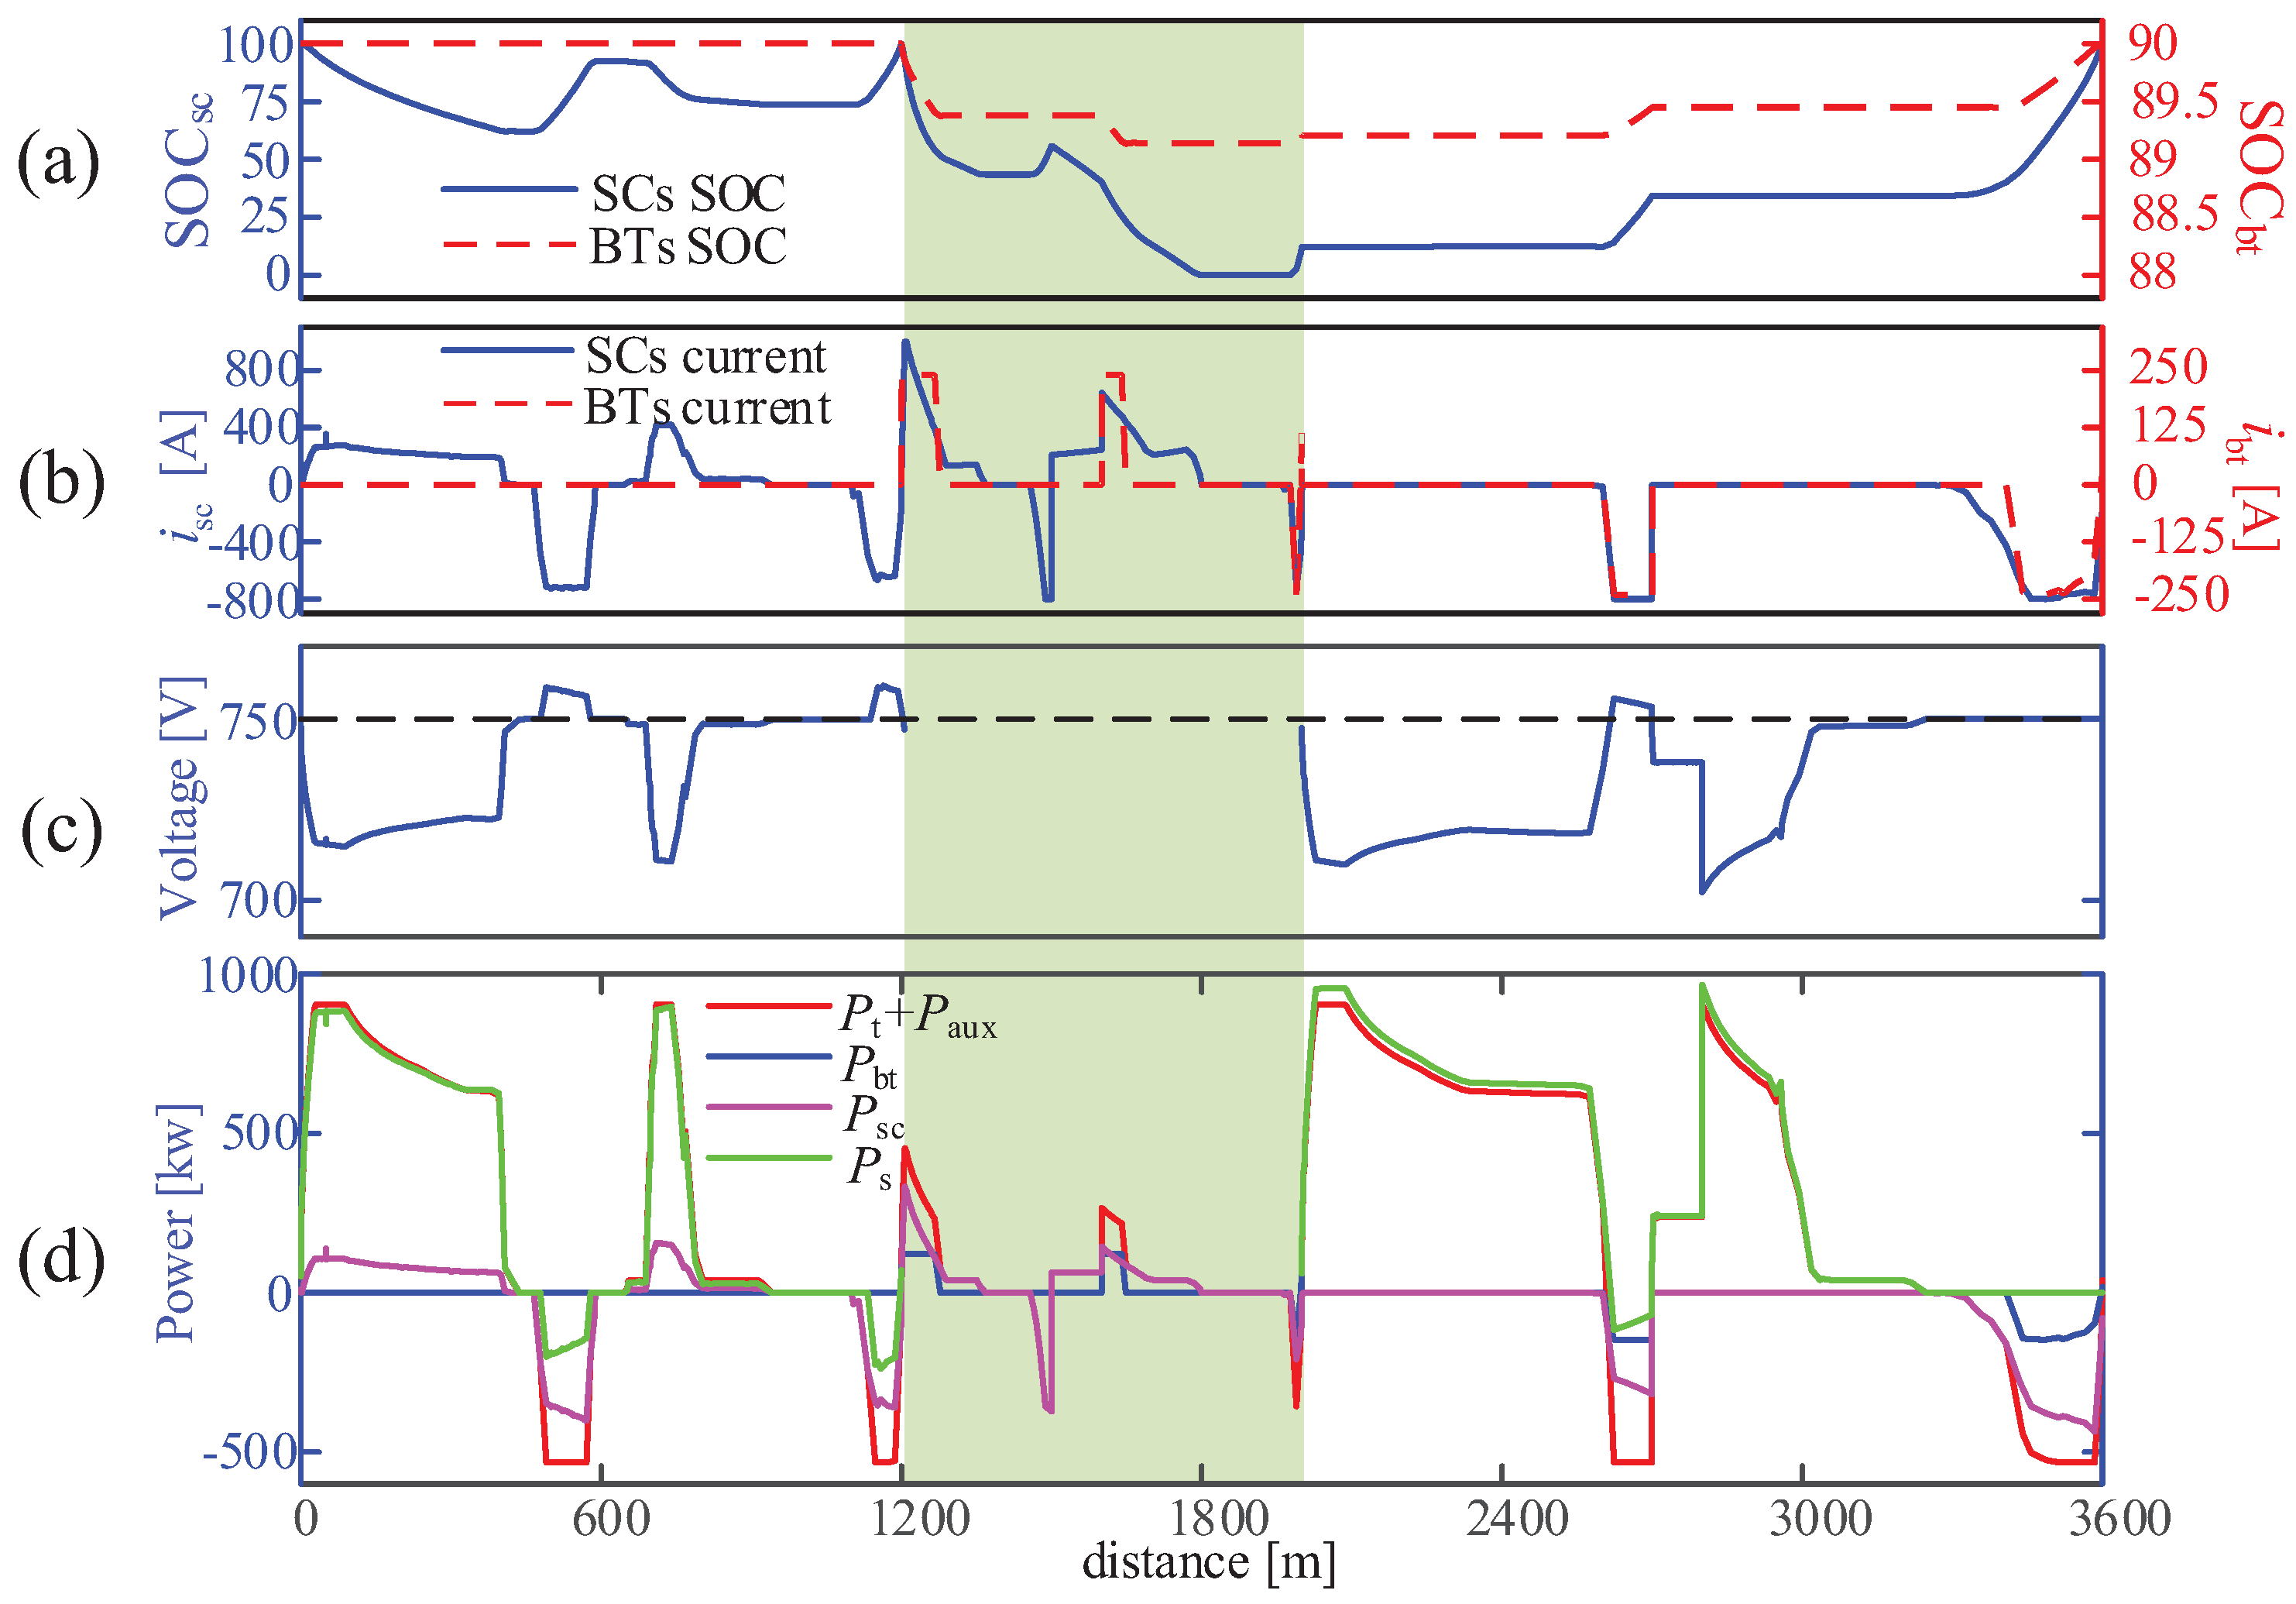
The integrated optimization results are illustrated in Figure 9 and Figure 10. The optimized tram speed, running time, control trajectories of traction, electric braking and pneumatic braking are detailed in Figure 9. The blue area at the bottom is the altitude of the gradient, as shown in Figure 9a, and the blue line represents the difference between the traction and electric braking in Figure 9b. The operation time are 60 s at signal 1 and 245 s at signal 2, and the green wave of signaling is achieved. It can be observed that the maximum traction is adopted in the beginning of sections and the blending braking regime is used in the end of the sections. In the speed regulating process, different regimes that traction, coasting and electric braking are used according to the variable of gradients and speed limits. The tram arrives at each destination on time, and the optimized speed profiles never exceed the speed limits. The punctuality and accuracy of tram stop are ensured by such solutions. The optimized SOC, current trajectories, the catenary voltage and the power split of different power sources are given in Figure 10, respectively. In catenary zones, the traction substation is the primary energy source. The HESSs are used to supplement the power of the traction substation during the full traction and electric braking modes, and the SOC of the HESSs are full of electricity at the end of catenary zones. In the catenary-free zones, the HESSs can support the tram without a stop in the catenary-free zone. The SCs provide the major power for the tram due to their fast response.
From station A to B, the optimal strategy of the tram speed is maximum traction-partial traction-coasting-partial electric braking-maximum electric braking-blending braking. The partial traction control mode ensures that the tram speed increases slowly, and the braking is not applied before the position of the signal 1. The power of partial electric braking is equal to the auxiliary power during the partial electric braking. The electric braking power can return to the SCs and the catenary during the maximum electric braking stage, and the SCs absorb a large portion of the regenerative energy. The BTs are not used in this section. From station B to C, the switching of operation mode is frequent due to the speed limits. It can be seen that the SCs provide power at the acceleration stage, and regenerative energy is fully absorbed by the SCs when the tram decelerates to a low speed limit. At station C, the SOC of the SCs returns to 12.1% and the BTs to 89.21%. From station C to D, the initial values of the SOC are smaller than the ultimate values, the electric braking energy is absorbed by the HESSs to satisfy constraints of the SOC. Apart from the process of stopping, the blending braking also occurs before the tram enters into a low speed limit. The voltage of catenary fluctuates around 750 V, and the lowest point occurs at 2800 m when the catenary provides the tram with the maximum traction power. The SOC of the BTs is controlled between 89% and 90% due to their high-capacity.
Table 5 shows the energy consumption of the integrated optimization under the FTS strategy. The total equivalent energy consumption of the three sections on the signalized route is 6.0172 × 10⁷ J, and over 40% energy can be reused. The utilization of regenerative energy is defined as the ratio of the equivalent energy returned to the on-board HESSs and the catenary to the energy of the total electric braking energy at the wheels, which can reach 80.57% in the catenary-free zone, and the regenerative efficiency of the route is 73.35%. The energy loss is mainly caused by the transmission process and the efficiency of the power plants.
To assess the effectiveness of the integrated optimization results with signal information, the speed profiles based on human experience are summarized into Figure 11. In the first section, The tram accelerates to a target speed 65 km/h, holding it for a period of time. In order to cross the signalized intersection without a stop, the blending braking and maximum electric braking are applied. The speed of tram showed a significantly decreased trend during the period, reaching 31 km/h at 680 m. The tram passes the first signalized intersection at the 60th second. Then, the maximum traction mode is applied to arrive station B on time. The trajectories from station B to C are the same with case A, because the section has no signalized intersection. In the last section, the minimum-time strategy is applied to cross the second signalized intersection, and the tram passes the intersection at the 244th second. Then, the tram arrives station D punctuality. The optimized power split strategies of the HESSs are shown in Figure 12. It can be seen that the speed profiles has great influence on the results of power split strategies.
Table 6 shows the energy consumption based on speed profiles that are summarized from human experience. The equivalent energy consumption in the first section is nearly twice of case A. The switching between traction and braking to avoid red light that makes the tram consume additional energy. The equivalent energy consumption in the last section is also higher than case A because of longer traction distance before the signal 2. The total energy consumption of the route is 7.744 × 10⁷ J, and the utilization of regenerative energy is 70.56%.
For the hybrid tram, the integrated optimization problem of speed profiles and power split is complicated. It is hard for human experience to determine the drive profiles with the signal information and power split of different power sources. Although the coasting is applied in the running process, the equivalent energy consumption of human experience is significantly higher than the integrated optimized results in Table 5. The results show that 22.3% equivalent energy consumption can be reduced by the optimal solutions under the FTS strategy, and the regenerative efficiency is also improved by the integrated optimization.
4.3. Case B: Tram Priority Signals Control Strategy
For some newly built routes or tourist routes, TPS control strategy ensures that tram can run without traffic conflicts by signal time adjustment, and the service reliability can be improved. Hence, the TPS strategy is adopted in case B. The calculation of the integrated optimization problem is the same as no signals on the route. The trajectory can be divided into 7 phases according to the multiple phases concept.
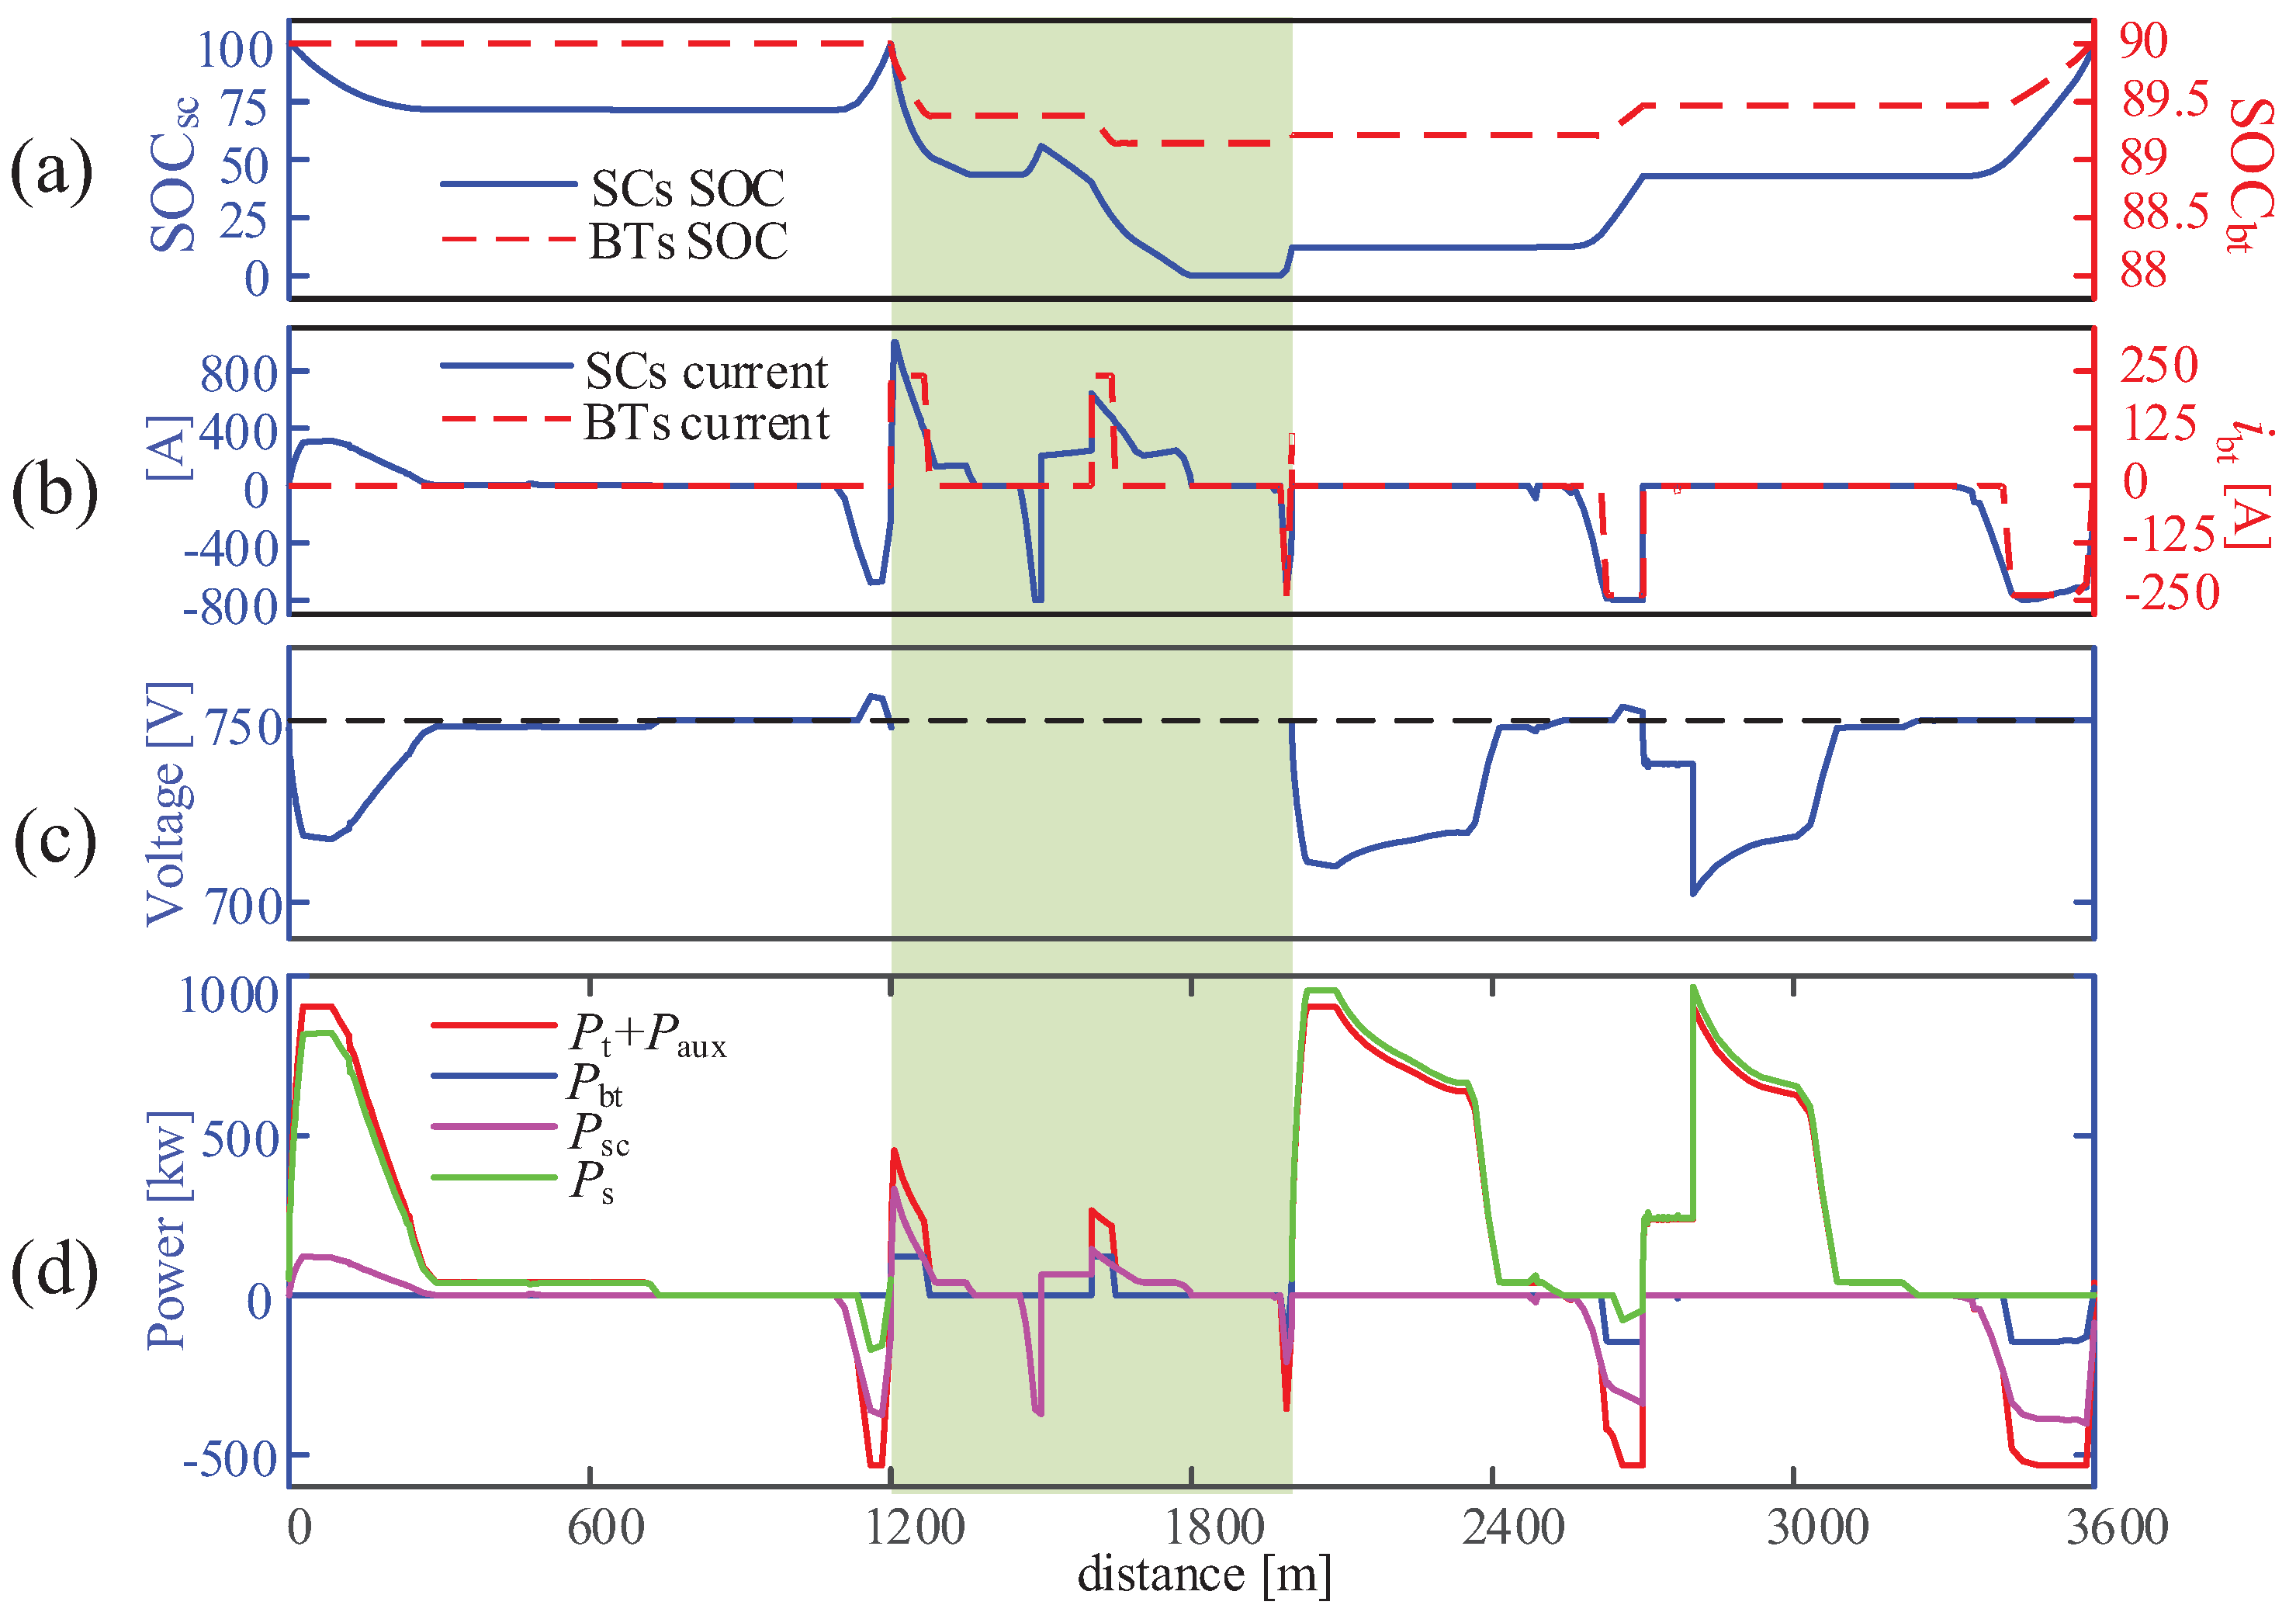
The operation profiles of the tram are shown in Figure 13 and the collaborative control strategies of different power sources are presented in Figure 14. The operation time are 54.42 s at signal 1 and 246.83 s at signal 2, which are not in the green wave time windows of case A. From station A to B, there are obvious differences in speed profiles compared with case A. The optimal strategy is also maximum traction-partial traction-coasting-partial electric braking-maximum electric braking-blending braking, but the distance of each mode is different. In summary, the maximum power, coasting and partial electric braking are longer and the partial traction, maximum electric braking and blending braking are shorter than case A. When the tram is coasting, the catenary fully supplys the auxiliary power. The power of partial electric braking is equal to the auxiliary power during the partial electric braking, which means that the catenary is more efficient than the SCs when the tram in the stage of coasting. From station B to C, the optimized results are the same with case A due to the same simulation condition. From station C to D, the distance of maximum traction is shorter than case A and the blending braking is only applied in the process of stopping, which are shown in Figure 13b.
Table 7 shows the energy consumption of the tram integrated optimization under the TPS strategy. The total equivalent energy consumption of the three sections on the signalized route is 5.891 × 10⁷ J, and the regenerative efficiency can be improved to 73.35%.
Compared with the FTS strategy, the integrated optimal results can reduce the equivalent energy consumption by 2.09% under the TPS strategy. The utilization of regenerated energy is also improved by the MPIO method.
5. Conclusions
In this paper, a tram with the BTs and the SCs that operates on a signalized route including both catenary zones and catenary-free zones is studied. The traction substation is the primary energy source, and the HESSs are used to supplement the power of the traction substation during the full traction and electric braking modes. For the integrated optimization of speed profiles and power split, a multiple phases integrated optimization model is established with the objective to minimize the equivalent total energy consumption. The hp-adaptive pseudospectral method has been applied to calculate the problem. The results demonstrate that this strategy is able to coordinate speed profiles and power split strategies of multiple power sources according to the characteristics of the hybrid tram and the signalized route. Meanwhile, the utilization rate of regenerative is increased. Two signal control strategies are discussed in the simulation. For the FTS strategy, 22.3% of the equivalent energy consumption can be reduced by the optimized solution compared with human experience. For the TPS strategy, the reduction of 2.09% the equivalent energy consumption can be realized under the TPS strategy. A novel approach for the advanced integrated optimization of hybrid tram is provided to improve the energy efficiency.
The method proposed in this paper is based on the predefined capacity of the HESSs. The interactions between the MPIO and the capacity of the HESSs will be studied in our future work, which is similar with integrated optimization framework for hybrid electric vehicles presented in Hu. et al. [39]. The time windows of the signalized intersections are known in advance in case A, which may change under different traffic flows. More efficiency algorithms are needed to update the integrated optimal strategies in real time, and fast optimization methods will be explored.
Acknowledgments
This work was supported by the National Key Research and Development Program of China under Grant 2016YFB1200502.
Author Contributions
Zhuang Xiao and Qingyuan Wang conceived the outline of the study; Qingyuan Wang provided the tool of GPOPS-II. Zhuang Xiao contributed to design the algorithm and write the paper. gave reviews and helped to revise the paper. Yuqing Zhu analyzed the simulation results. Xiaoyun Feng provided the tram, infrastructure, on-board HESSs, and the TPSS data.
Conflicts of Interest
The authors declare no conflict of interest.
References
- Allegre, A.L.; Bouscayrol, A.; Delarue, P.; Barrade, P.; Chattot, E.; El-Fassi, S. Energy storage system with supercapacitor for an innovative subway. IEEE Trans. Ind. Electron. 2010, 57, 4001–4012. [Google Scholar] [CrossRef]
- González-Gil, A.; Palacin, R.; Batty, P.; Powell, J.P. A systems approach to reduce urban rail energy consumption. Energy Convers. Manag. 2014, 80, 509–524. [Google Scholar] [CrossRef]
- González-Gil, A.; Palacin, R.; Batty, P. Sustainable urban rail systems: Strategies and technologies for optimal management of regenerative braking energy. Energy Convers. Manag. 2013, 75, 374–388. [Google Scholar] [CrossRef]
- Asnis, I.A.; Dmitruk, A.V.; Osmolovskii, N.P. Solution of the problem of the energetically optimal control of the motion of a train by the maximum principle. USSR Comput. Math. Math. Phys. 1985, 25, 37–44. [Google Scholar] [CrossRef]
- Liu, R.; Golovitcher, I.M. Energy-efficient operation of rail vehicles. Transp. Res. Part A Policy Pract. 2003, 37, 917–932. [Google Scholar] [CrossRef]
- Howlett, P.G.; Pudney, P.J.; Vu, X. Local energy minimization in optimal train control. Automatica 2009, 45, 2692–2698. [Google Scholar] [CrossRef]
- Wang, Q.Y.; Geng, C.; Feng, X.Y. On Optimal Switches for Energy Efficient Control of a Train Considering Regenerative Braking. In Proceedings of the IEEE 18th International Conference on Intelligent Transportation Systems, Las Palmas de Gran Canaria, Spain, 15–18 September 2015; pp. 1810–1816. [Google Scholar]
- Wang, Y.H.; De Schutter, B.; van den Boom, T.J.J.; Ning, B. Optimal trajectory planning for trains—A pseudospectral method and a mixed integer linear programming approach. Transp. Res. C Emerg. Technol. 2013, 29, 97–114. [Google Scholar] [CrossRef]
- Miyatake, M.; Ko, H. Optimization of train speed profile for minimum energy consumption. IEEJ Trans. Electr. Electron. Eng. 2010, 5, 263–269. [Google Scholar] [CrossRef]
- Ke, B.R.; Lin, C.L.; Yang, C.C. Optimisation of train energy-efficient operation for mass rapid transit systems. IET Intell. Transp. Syst. 2012, 6, 58–66. [Google Scholar] [CrossRef]
- Song, D.Y.; Song, W.T. A novel dual speed-curve optimization based approach for energy-saving operation of High-Speed trains. IEEE Trans. Intell. Transp. Syst. 2016, 17, 1564–1575. [Google Scholar] [CrossRef]
- Lu, S.F.; Hillmansen, S.; Ho, T.K.; Roberts, C. Single-Train Trajectory Optimization. IEEE Trans. Intell. Transp. Syst. 2013, 14, 743–750. [Google Scholar] [CrossRef]
- Sermpis, D.; Fousekis, K.; Papadakos, P. Tram priority at signal-controlled junctions. Transport 2012, 165, 87–96. [Google Scholar] [CrossRef]
- Albrecht, T.; Binder, A.; Gassel, C. Applications of real-time speed control in rail-bound public transportation systems. IET Intell. Transp. Syst. 2013, 7, 305–314. [Google Scholar] [CrossRef]
- Wang, P.L.; Goverde, R.M.P. Multiple-phase train trajectory optimization with signalling and operational constraints. Transp. Res. C Emerg. Technol. 2016, 69, 255–275. [Google Scholar] [CrossRef]
- Haahr, J.T.; Pisinger, D.; Sabbaghian, M. A dynamic programming approach for optimizing train speed profiles with speed restrictions and passage points. Transp. Res. B Methodol. 2017, 99, 167–182. [Google Scholar] [CrossRef]
- Iannuzzi, D.; Ciccarelli, F.; Lauria, D. Stationary ultracapacitors storage device for improving energy saving and voltage profile of light transportation networks. Transp. Res. C Emerg. Technol. 2012, 21, 321–337. [Google Scholar] [CrossRef]
- Fernandez, L.M.; Garcia, P.; Garcia, C.A.; Jurado, F. Hybrid electric system based on fuel cell and battery and integrating a single dc/dc converter for a tramway. Energy Convers. Manag. 2011, 52, 2183–2192. [Google Scholar] [CrossRef]
- Ciccarelli, F.; Iannuzzi, D.; Tricoli, P. Control of metro-trains equipped with onboard supercapacitors for energy saving and reduction of power peak demand. Transp. Res. C Emerg. Technol. 2012, 24, 36–49. [Google Scholar] [CrossRef]
- Meinert, M. New mobile energy storage system for rolling stock. In Proceedings of the IEEE European Conference on Power Electronics and Applications, Barcelona, Spain, 8–10 September 2009; pp. 1–10. [Google Scholar]
- Han, Y.; Li, Q.; Wang, T.H.; Chen, W.R.; Ma, L. Multi-source coordination energy management strategy based on soc consensus for a pemfc-battery-supercapacitor hybrid tramway. IEEE Trans. Veh. Technol. 2018, 67, 296–305. [Google Scholar] [CrossRef]
- García, P.; Fernández, L.M.; Torreglosa, J.P.; Jurado, F. Operation mode control of a hybrid power system based on fuel cell/battery/ultracapacitor for an electric tramway. Comput. Electr. Eng. 2013, 39, 1993–2004. [Google Scholar] [CrossRef]
- Herrera, V.; Gaztanaga, H.; Milo, A.; Saez, A. Optimal energy management of a battery-supercapacitor based light rail vehicle using genetic algorithms. In Proceedings of the IEEE Conference on Energy Conversion Congress and Exposition (ECCE), Montreal, QC, Canada, 20–24 September 2015; pp. 1359–1366. [Google Scholar]
- Li, Q.; Yang, H.; Han, Y.; Li, M.; Chen, W.R. A state machine strategy based on droop control for an energy management system of pemfc-battery-supercapacitor hybrid tramway. Int. J. Hydrogen Energy 2016, 41, 16148–16159. [Google Scholar] [CrossRef]
- Shen, J.Y.; Khaligh, A. A Supervisory Energy Management Control Strategy in a Battery/Ultracapacitor Hybrid Energy Storage System. IEEE Trans. Transp. Electr. 2015, 1, 223–231. [Google Scholar] [CrossRef]
- Santucci, A.; Sorniotti, A.; Lekakou, C. Power split strategies for hybrid energy storage systems for vehicular applications. J. Power Sources 2014, 258, 395–407. [Google Scholar] [CrossRef]
- Miyatake, M.; Matsuda, K. Energy saving speed and charge/discharge control of a railway vehicle with on–board energy storage by means of an optimization model. IEEJ Trans. Electr. Electron. Eng. 2009, 4, 771–778. [Google Scholar] [CrossRef]
- Darby, C.L.; Hager, W.W.; Rao, A.V. An hp-adaptive pseudospectral method for solving optimal control problems. Optim. Control Appl. Methods 2011, 32, 476–502. [Google Scholar] [CrossRef]
- Ma, W.; Wang, W.; Hu, R.N.; Wang, Z.Y. Auxiliary power supply system of passenger train based on photovoltaic and energy storage. In Proceedings of the IEEE 11th Conference on Industrial Electronics and Applications (ICIEA), Hefei, China, 5–7 June 2016; pp. 784–788. [Google Scholar]
- Rochard, B.P.; Schmid, F. A review of methods to measure and calculate train resistances. Proc. Inst. Mech. Eng. Part F J. Rail Rapid Transit 2000, 214, 185–199. [Google Scholar] [CrossRef]
- Lin, X.; Wang, Q.Y.; Wang, P.L.; Sun, P.F.; Feng, X.Y. The Energy-Efficient Operation Problem of a Freight Train Considering Long-Distance Steep Downhill Sections. Energies 2017, 10, 794. [Google Scholar] [CrossRef]
- Frilli, A.; Meli, E.; Nocciolini, D.; Pugi, L.; Rindi, A. Energetic optimization of regenerative braking for high speed railway systems. Energy Convers. Manag. 2016, 129, 200–215. [Google Scholar] [CrossRef]
- Hu, X.S.; Li, S.B.; Peng, H. A comparative study of equivalent circuit models for Li-ion batteries. J. Power Sources 2012, 198, 359–367. [Google Scholar] [CrossRef]
- Shi, J.G.; Sun, Y.S.; Schonfeld, P.; Qi, J. Joint optimization of tram timetables and signal timing adjustments at intersections. Transp. Res. C Emerg. Technol. 2017, 83, 104–119. [Google Scholar] [CrossRef]
- Darby, C.L.; Hager, W.W.; Rao, A.V. Direct trajectory optimization using a variable low-order adaptive pseudospectral method. J. Spacecr. Rockets 2011, 48, 433–445. [Google Scholar] [CrossRef]
- Garg, D.; Patterson, M.; Hager, W.W.; Rao, A.V.; Huntington, G.T. A unified framework for the numerical solution of optimal control problems using pseudospectral methods. Automatica 2010, 46, 1843–1851. [Google Scholar] [CrossRef]
- Patterson, M.A.; Rao, A.V. GPOPS-II: A MATLAB Software for Solving Multiple-Phase Optimal Control Problems Using hp-Adaptive Gaussian Quadrature Collocation Methods and Sparse Nonlinear Programming. ACM Trans. Math. Softw. 2014, 41, 1–37. [Google Scholar] [CrossRef]
- Patterson, M.A.; Rao, A.V. GPOPS-II: A General-Purpose MATLAB Software for Solving Multiple-Phase Optimal Control Problems. Available online: http://gpops2.com/resources/gpops2UsersGuide.pdf (accessed on 24 February 2018).
- Hu, X.S.; Moura, S.J.; Murgovski, N.; Bo, E.; Cao, D.P. Integrated optimization of battery sizing, charging, and power management in plug-in hybrid electric vehicles. IEEE Trans. Control Syst. Technol. 2016, 24, 1036–1043. [Google Scholar] [CrossRef]
Figure 1.
HESSs tram operation system and power flow.
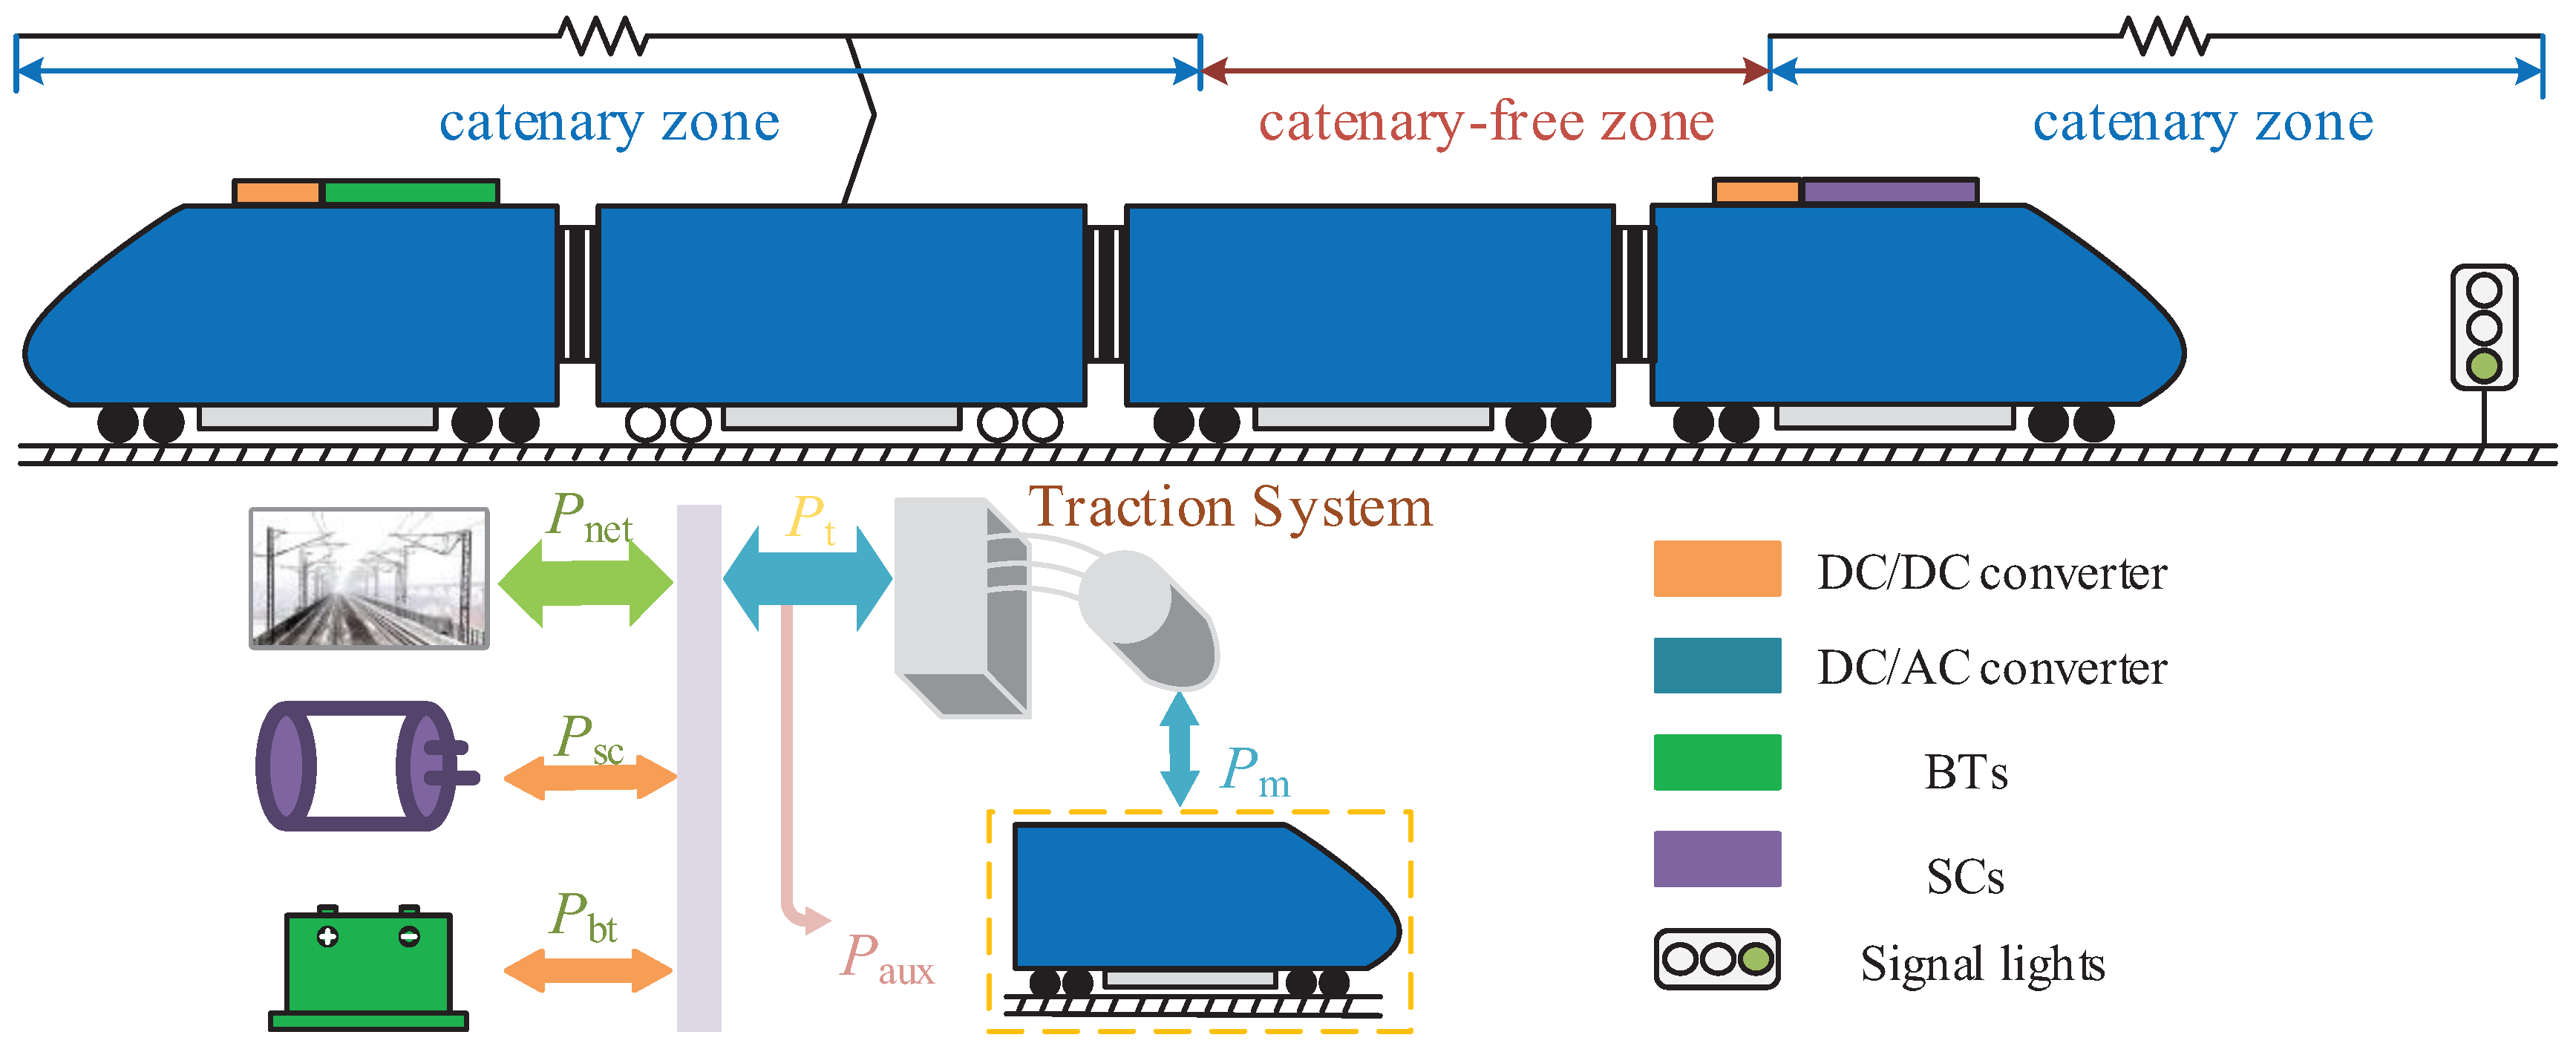
Figure 2.
Power plant model.
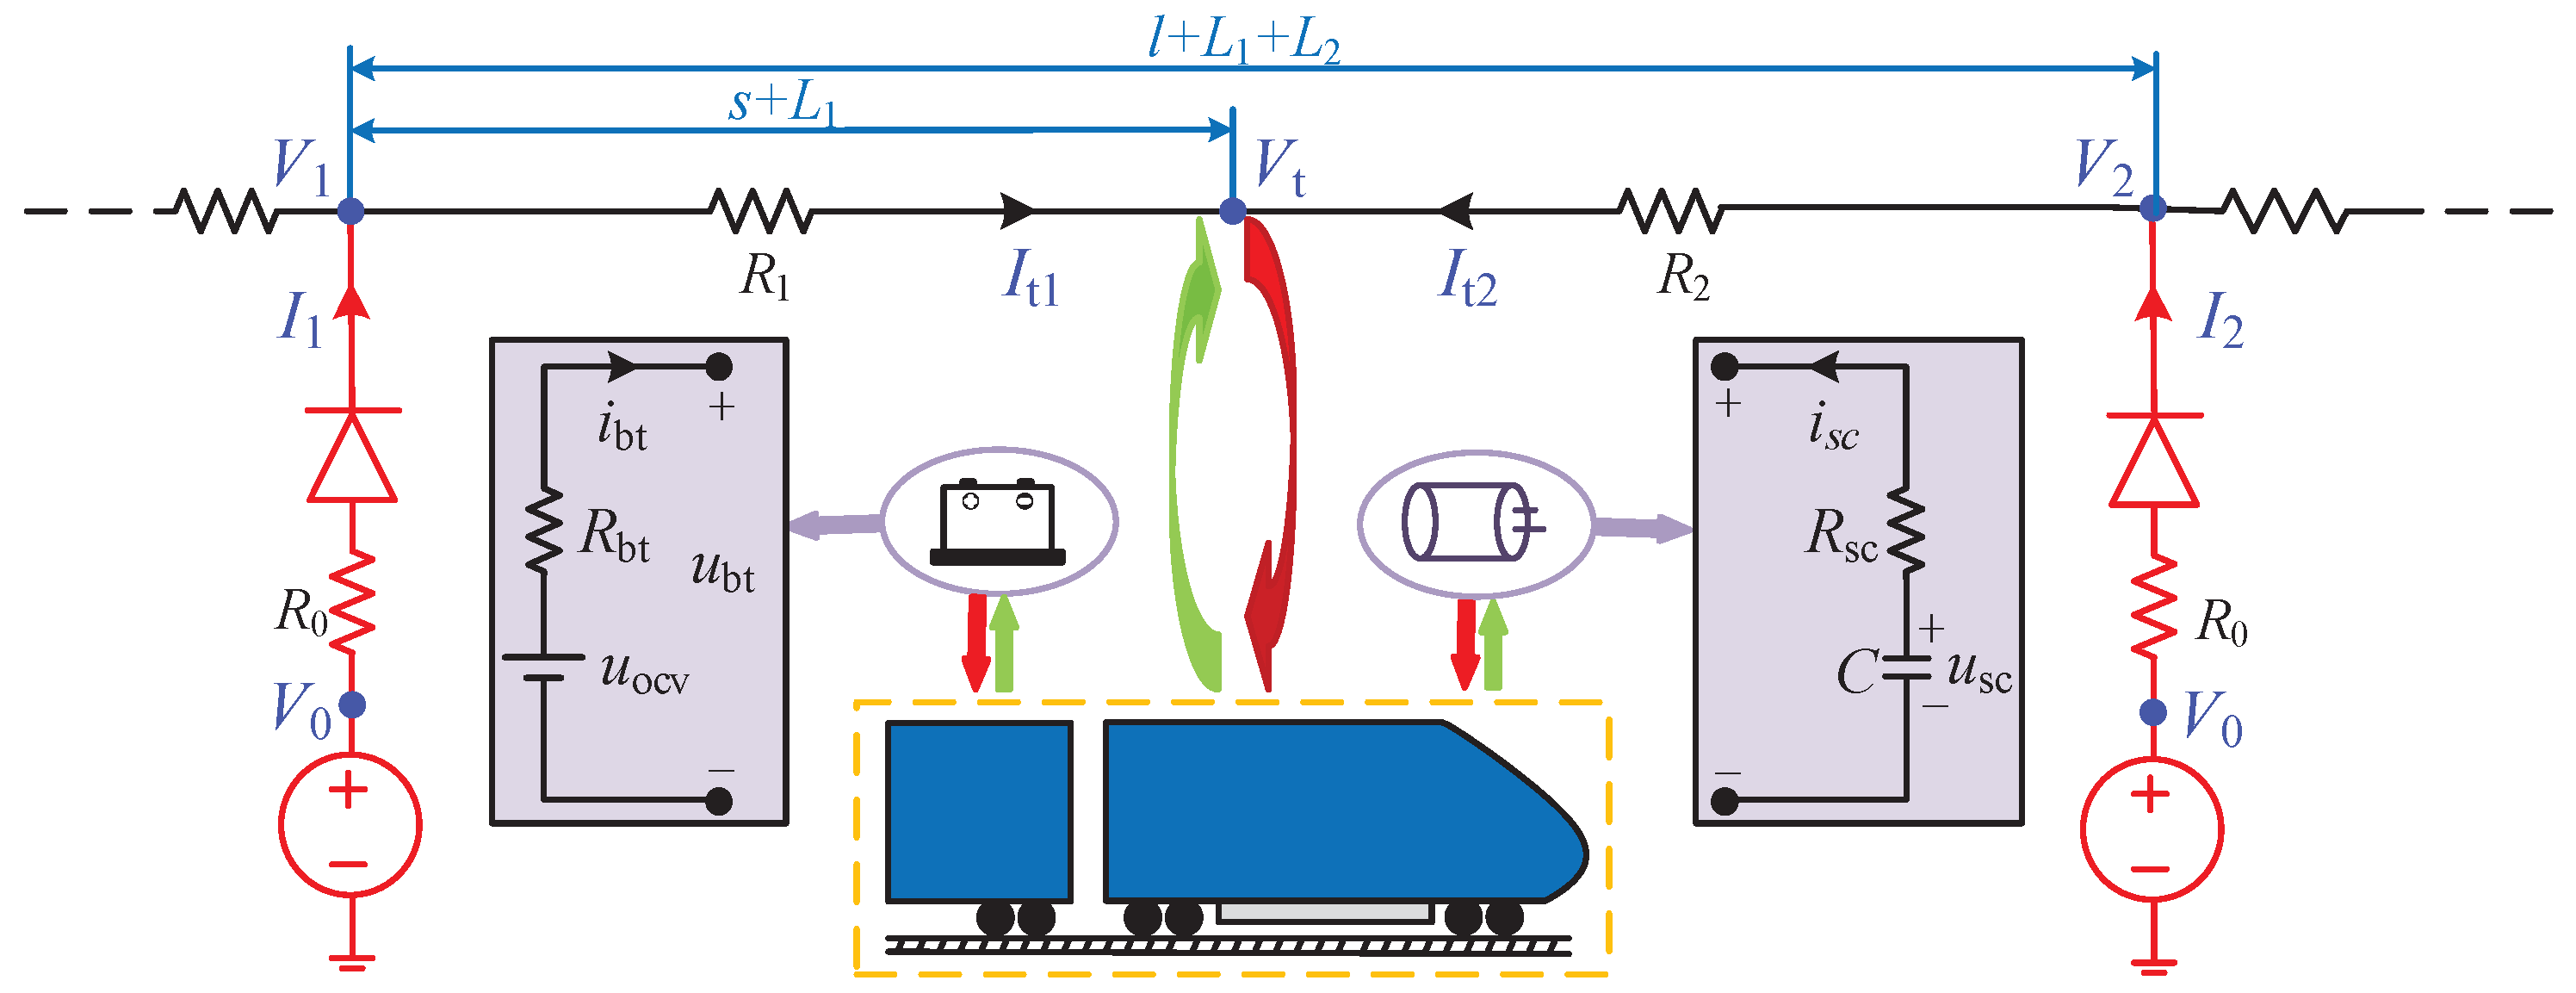
Figure 3.
Illustration of green wave.
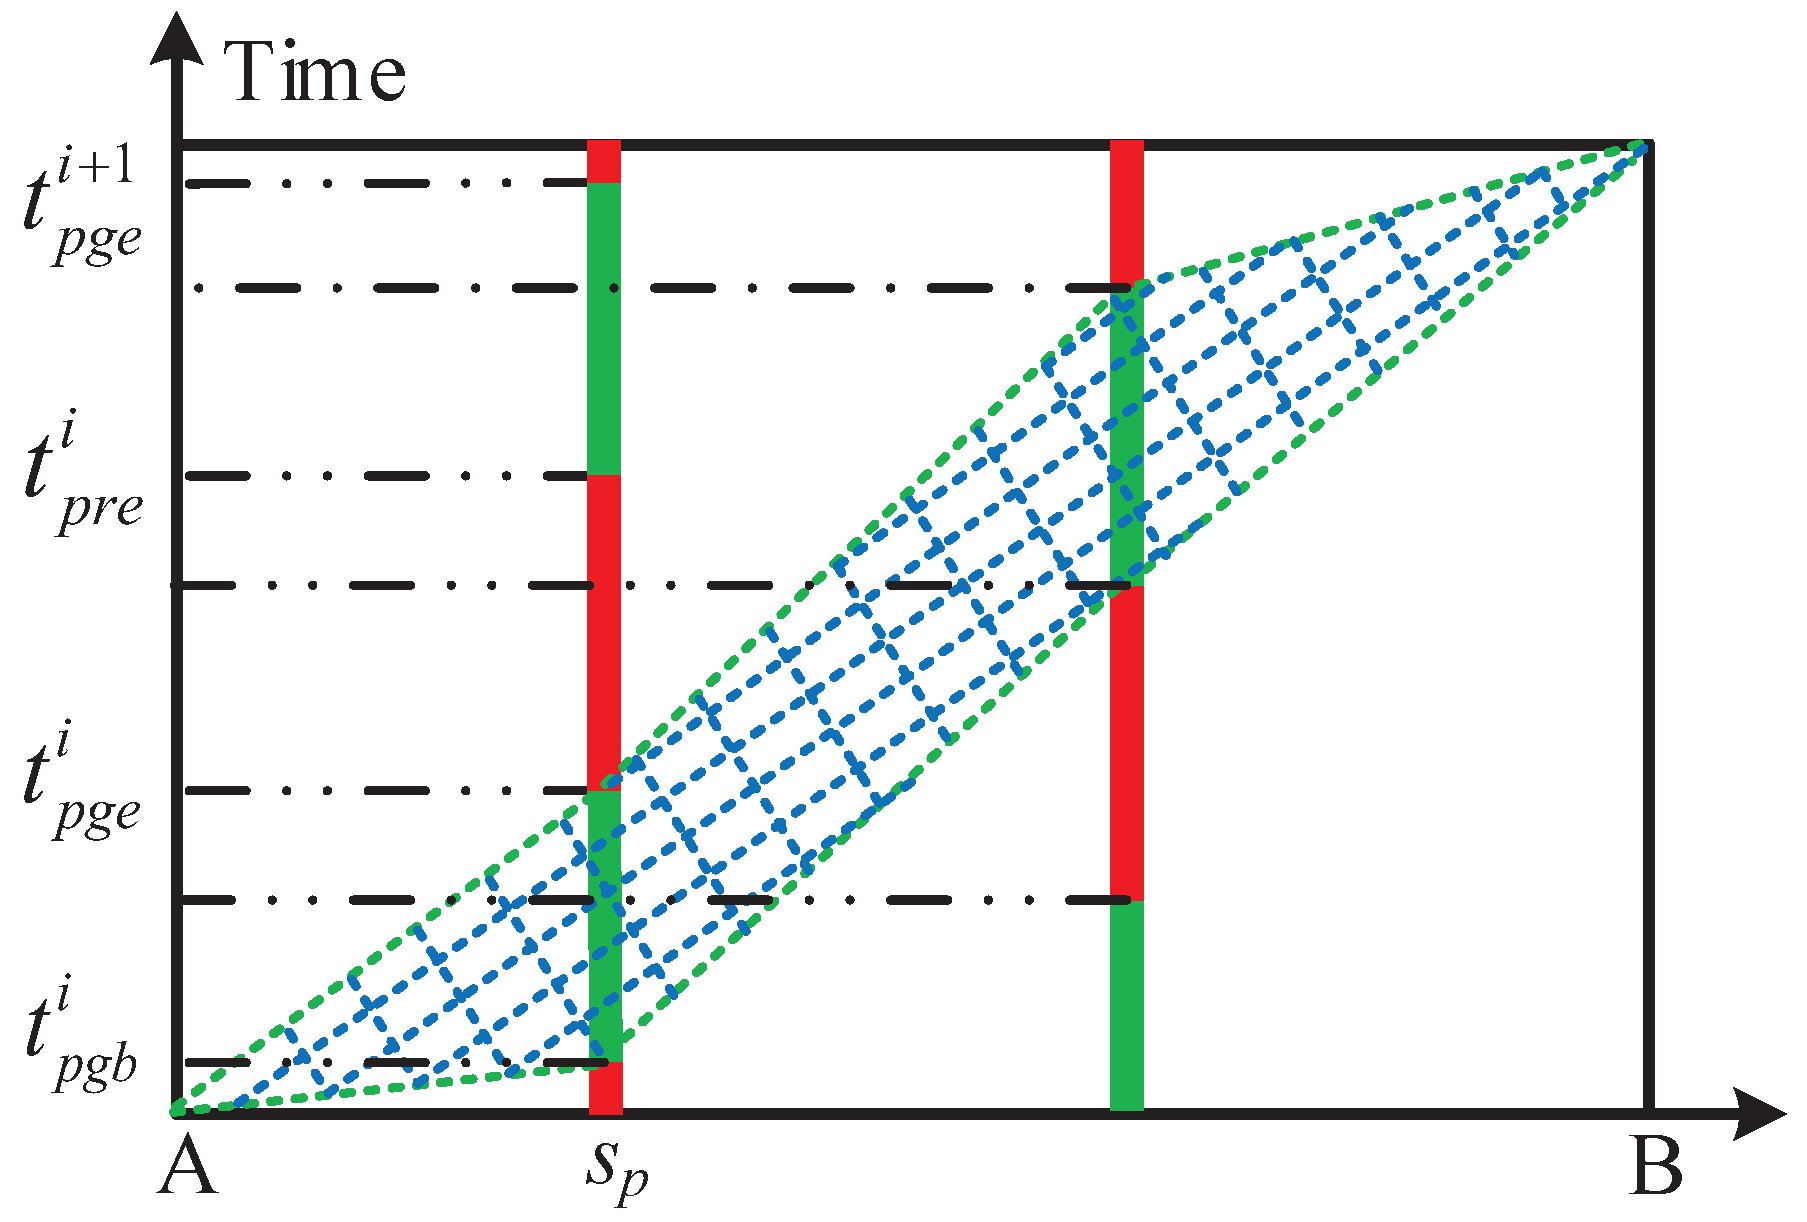
Figure 4.
Illustration of multiple phases concept.

Figure 5.
The simulation framework of the integrated optimization.
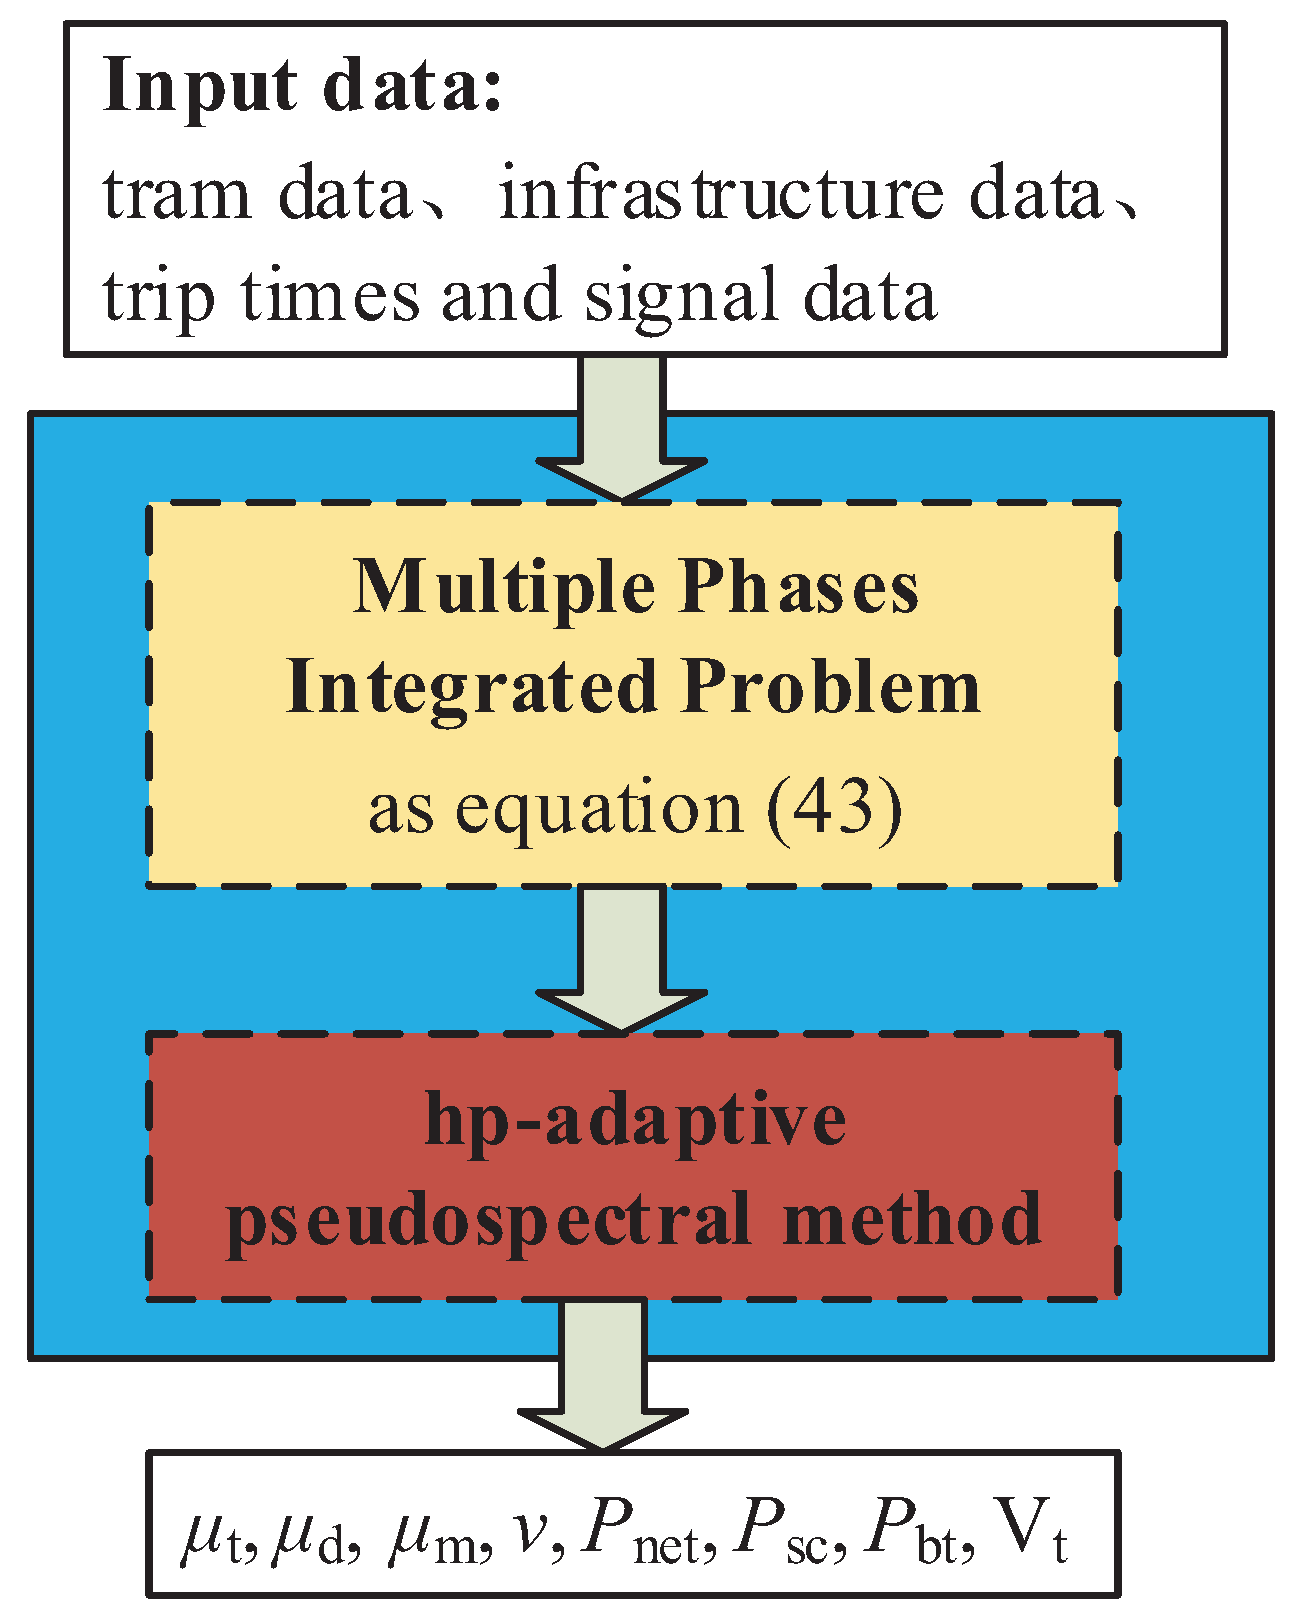
Figure 6.
The control signal and power flow in phase r.
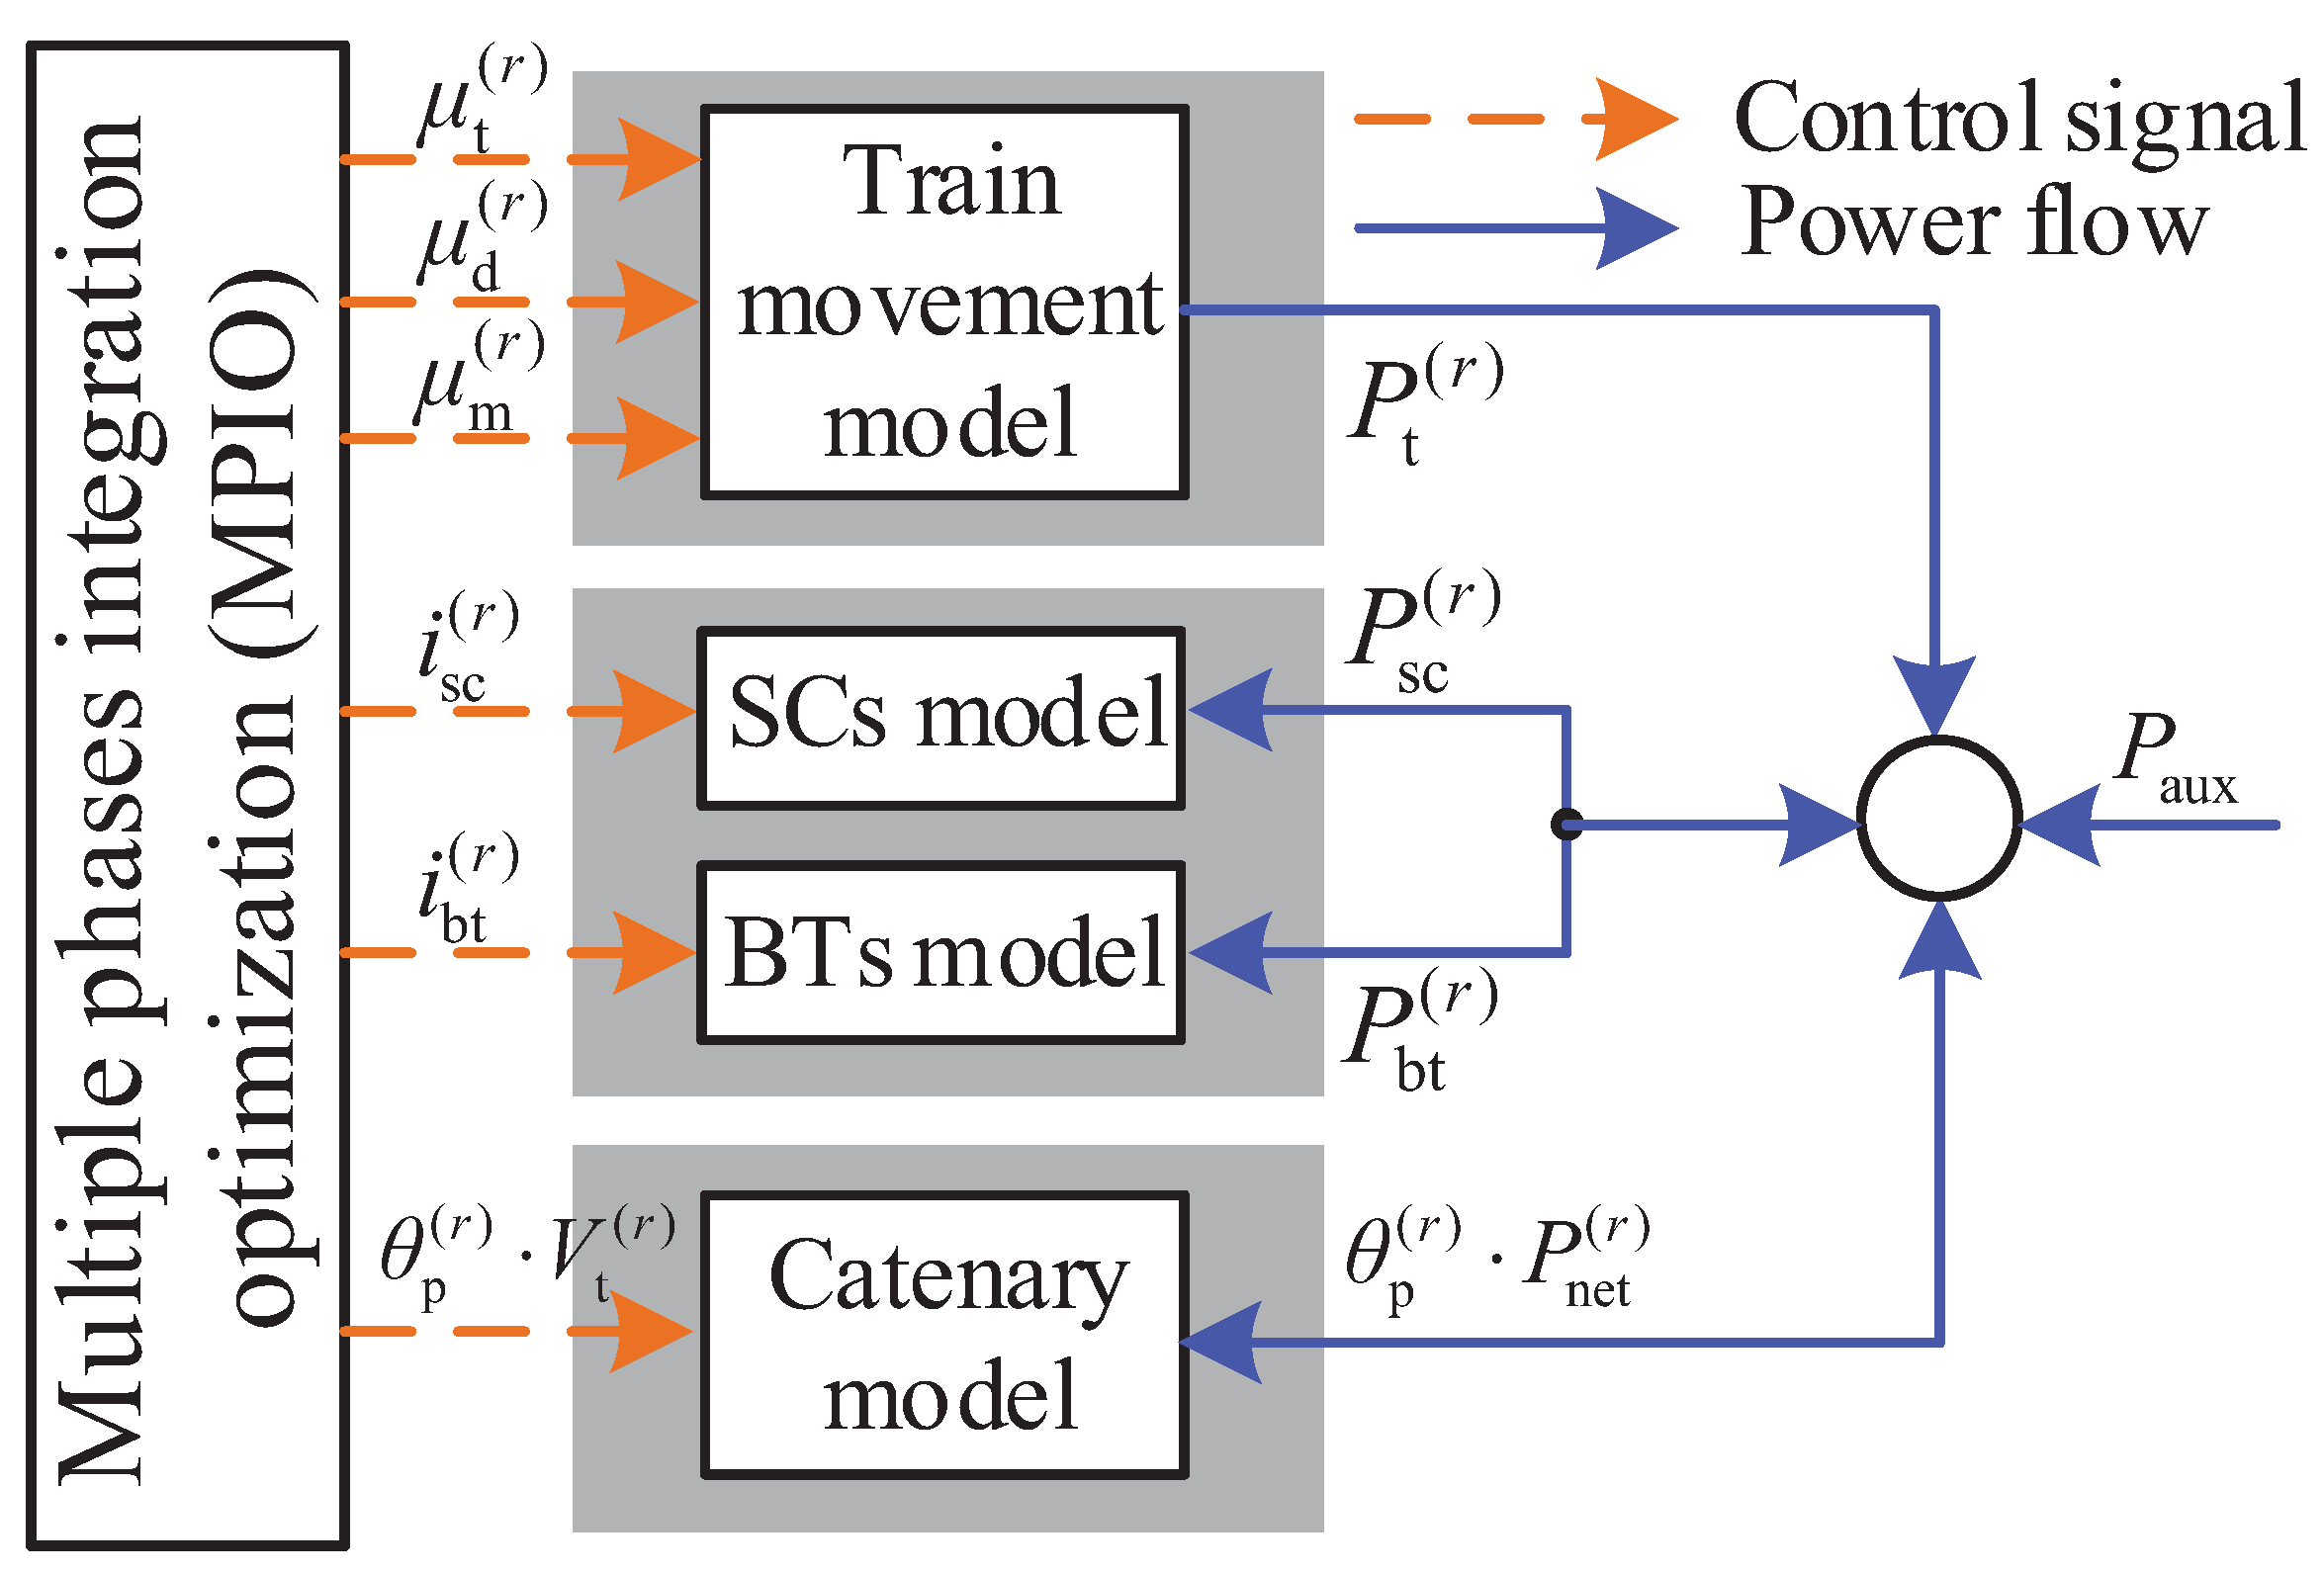
Figure 7.
The maximum traction and braking forces of the tram: (a) The maximum traction force; (b) The maximum braking force.
Figure 7.
The maximum traction and braking forces of the tram: (a) The maximum traction force; (b) The maximum braking force.
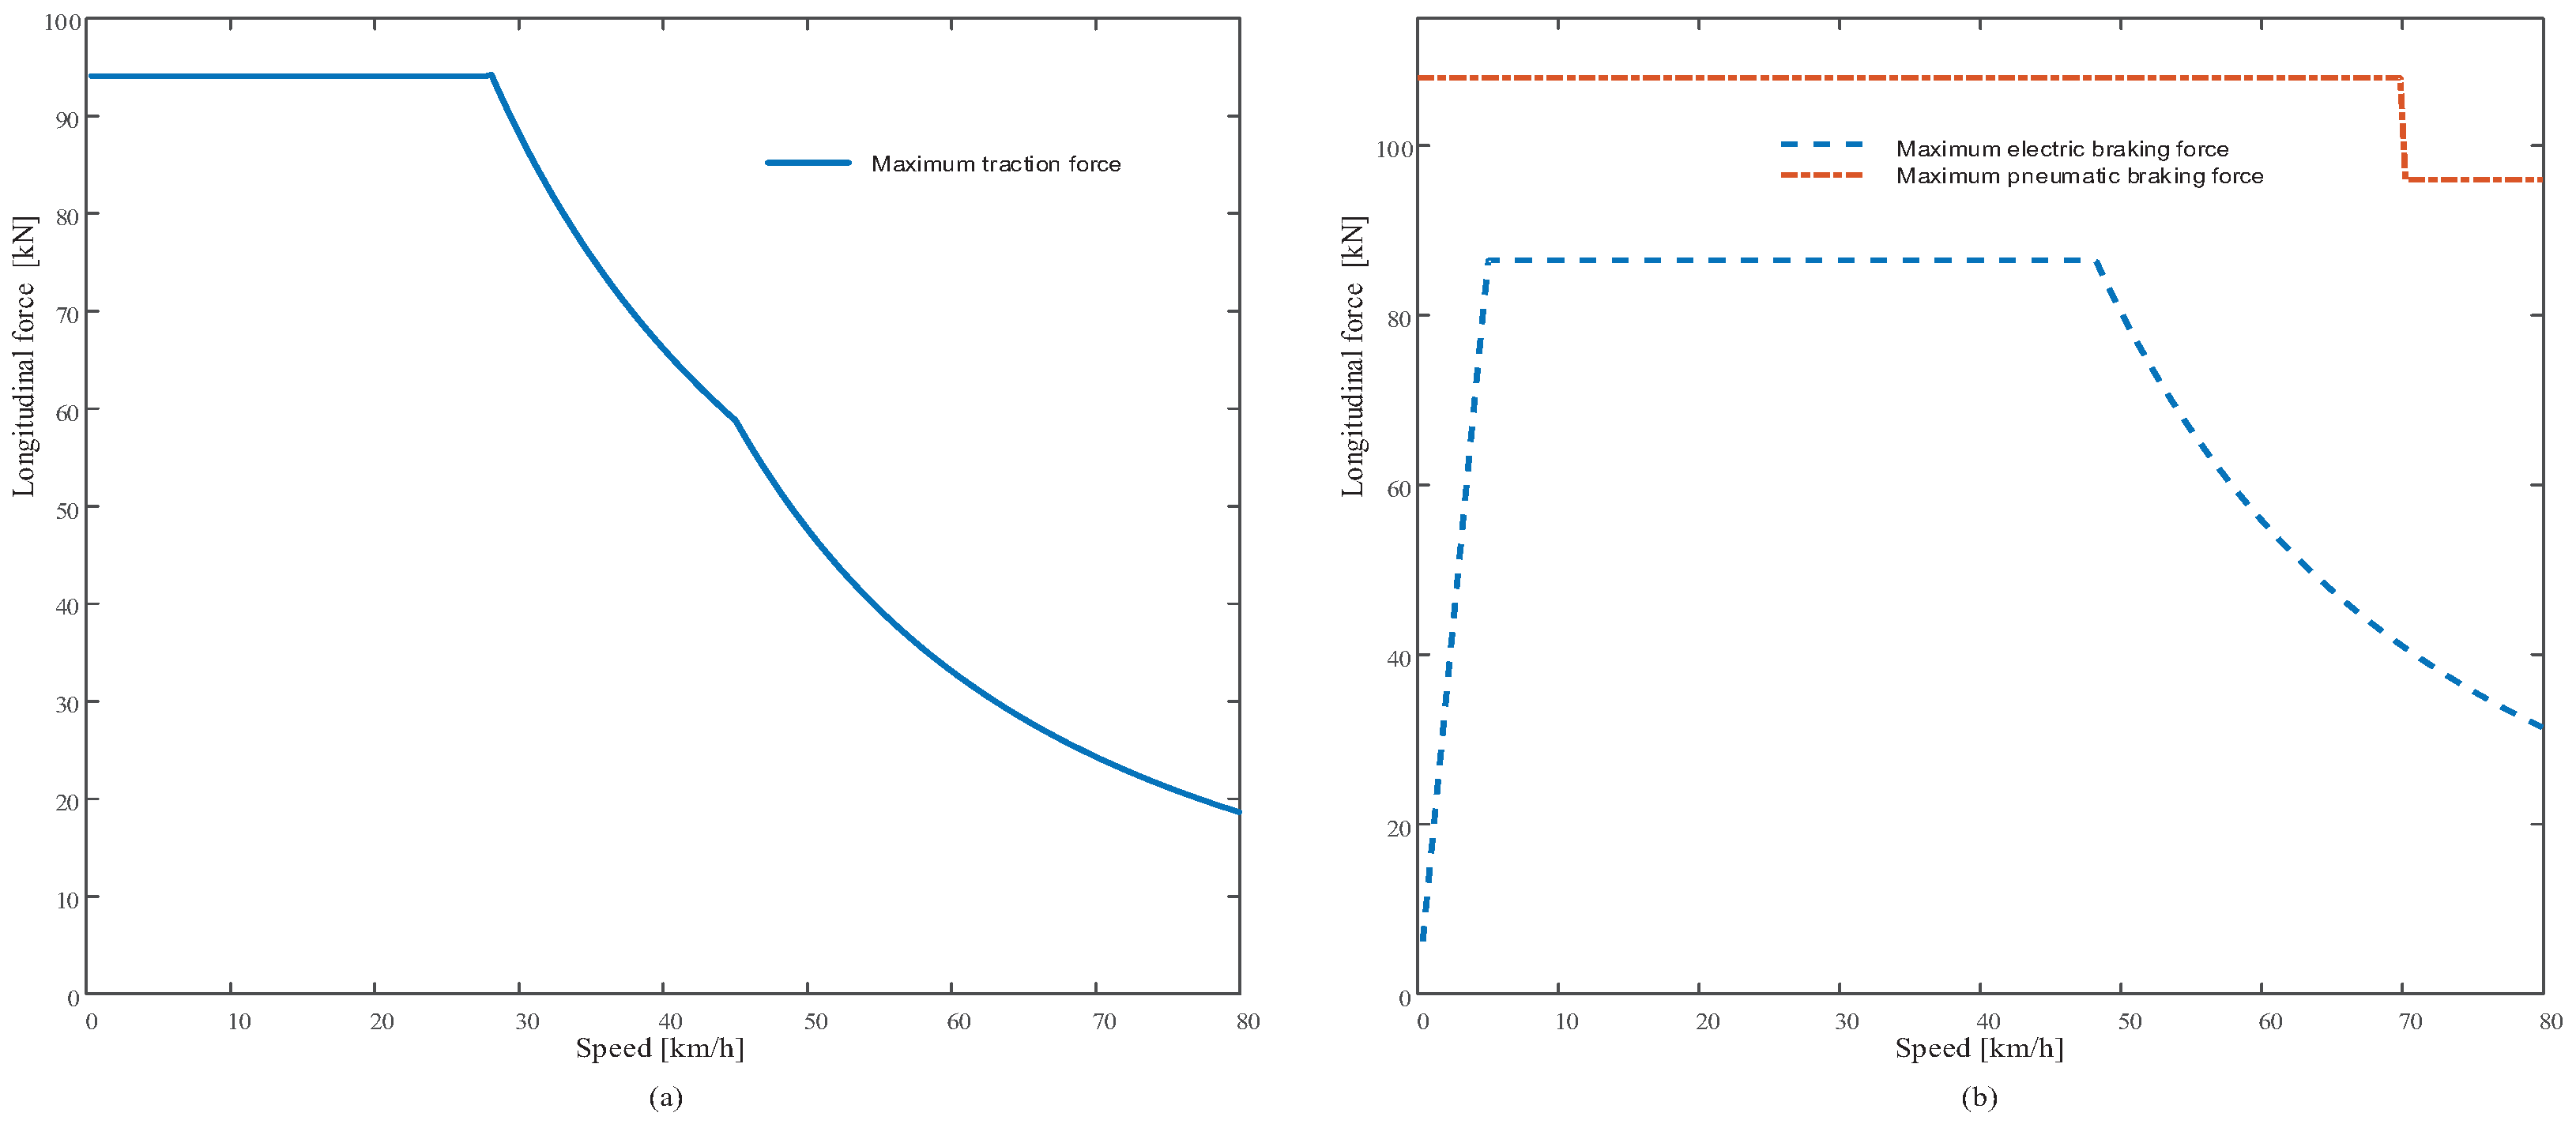
Figure 8.
Gradients and speed limits of the test line: (a) The gradients; (b) The speed limits.
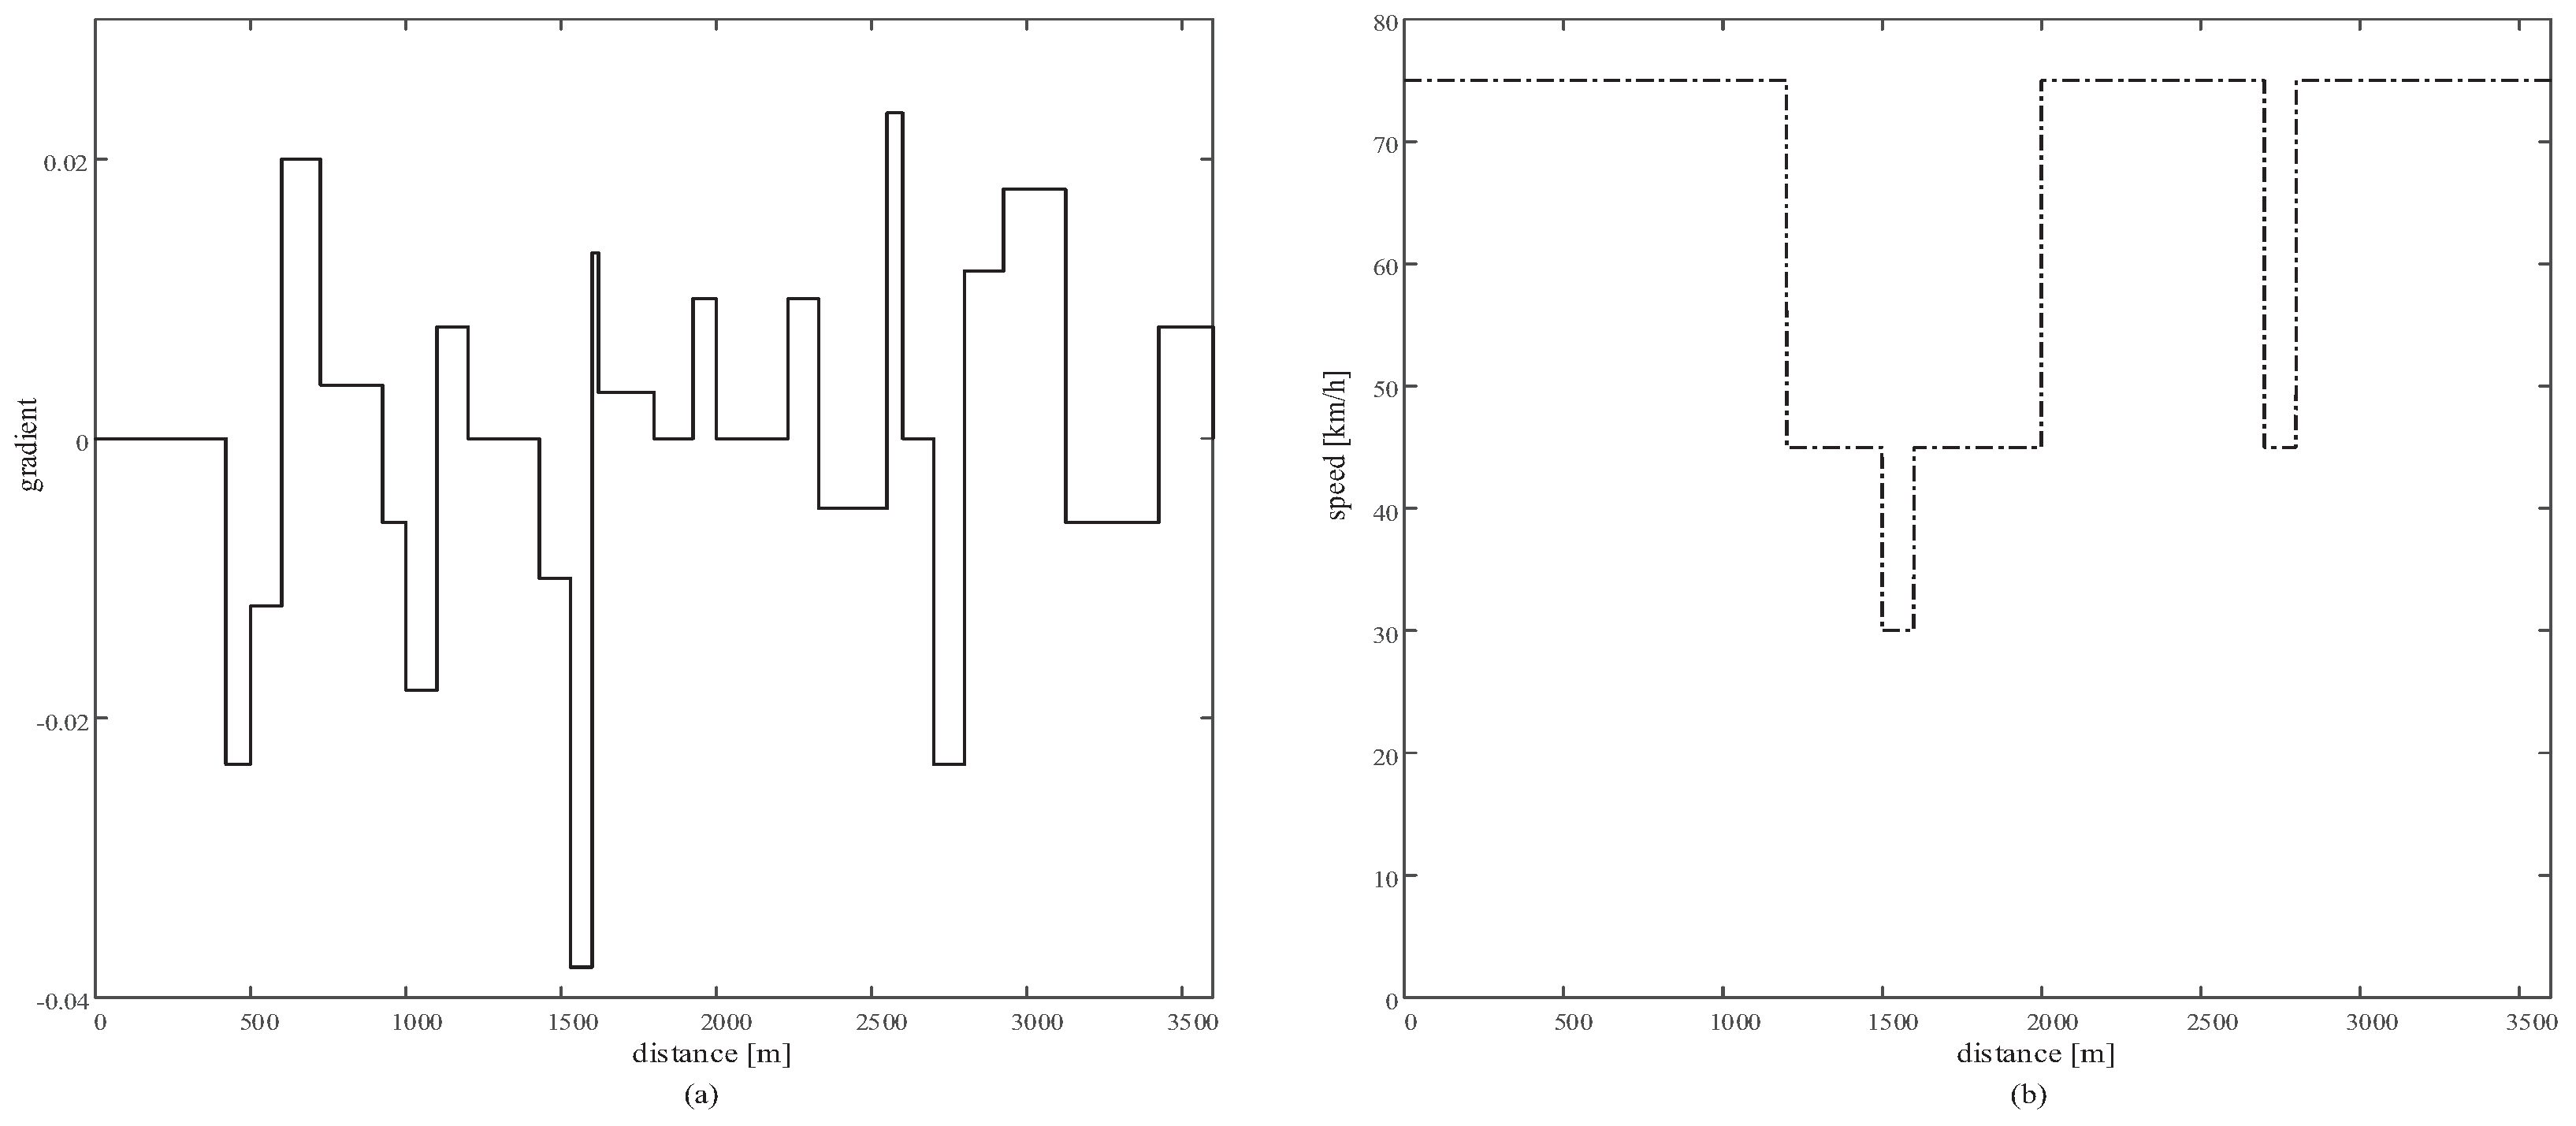
Figure 9.
The optimized trajectories of the tram under the FTS strategy: (a) The speed profile; (b) The traction/braking control curve.
Figure 9.
The optimized trajectories of the tram under the FTS strategy: (a) The speed profile; (b) The traction/braking control curve.
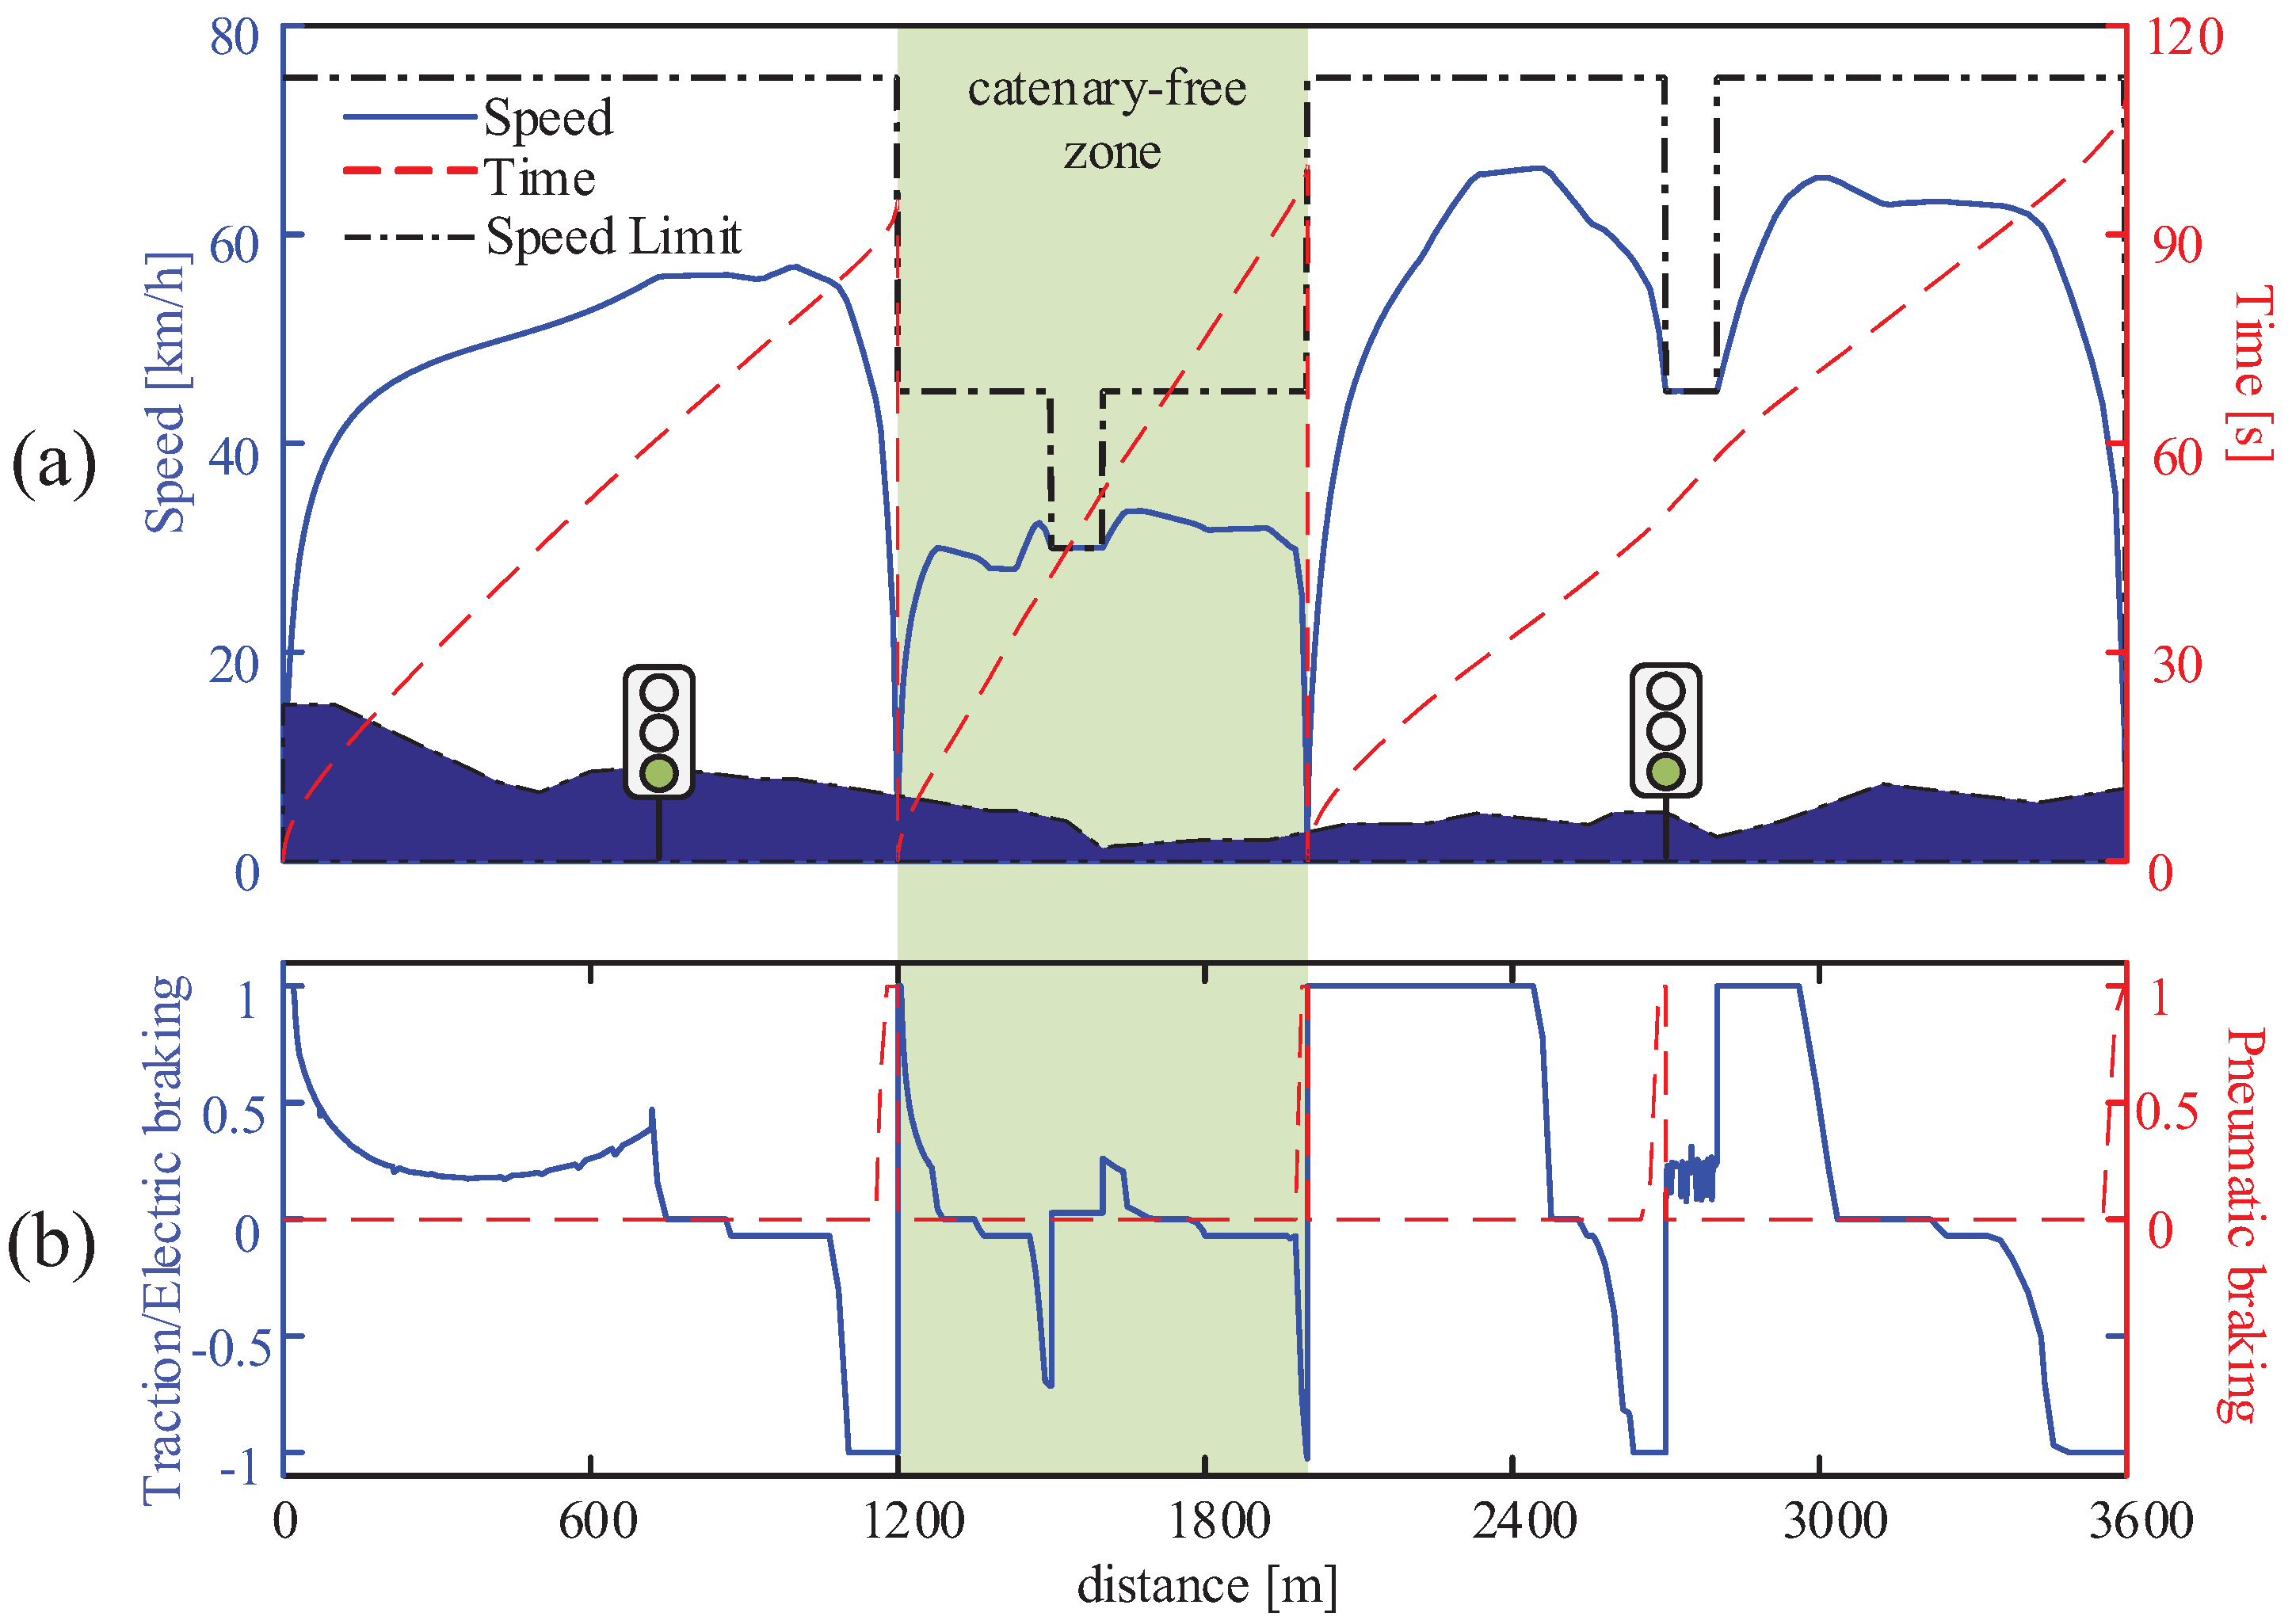
Figure 10.
The optimized power split strategies of the tram under the FTS strategy: (a) The SOC curves; (b) The current curves; (c) The voltage curve of catenary; (d) The power curves.
Figure 10.
The optimized power split strategies of the tram under the FTS strategy: (a) The SOC curves; (b) The current curves; (c) The voltage curve of catenary; (d) The power curves.
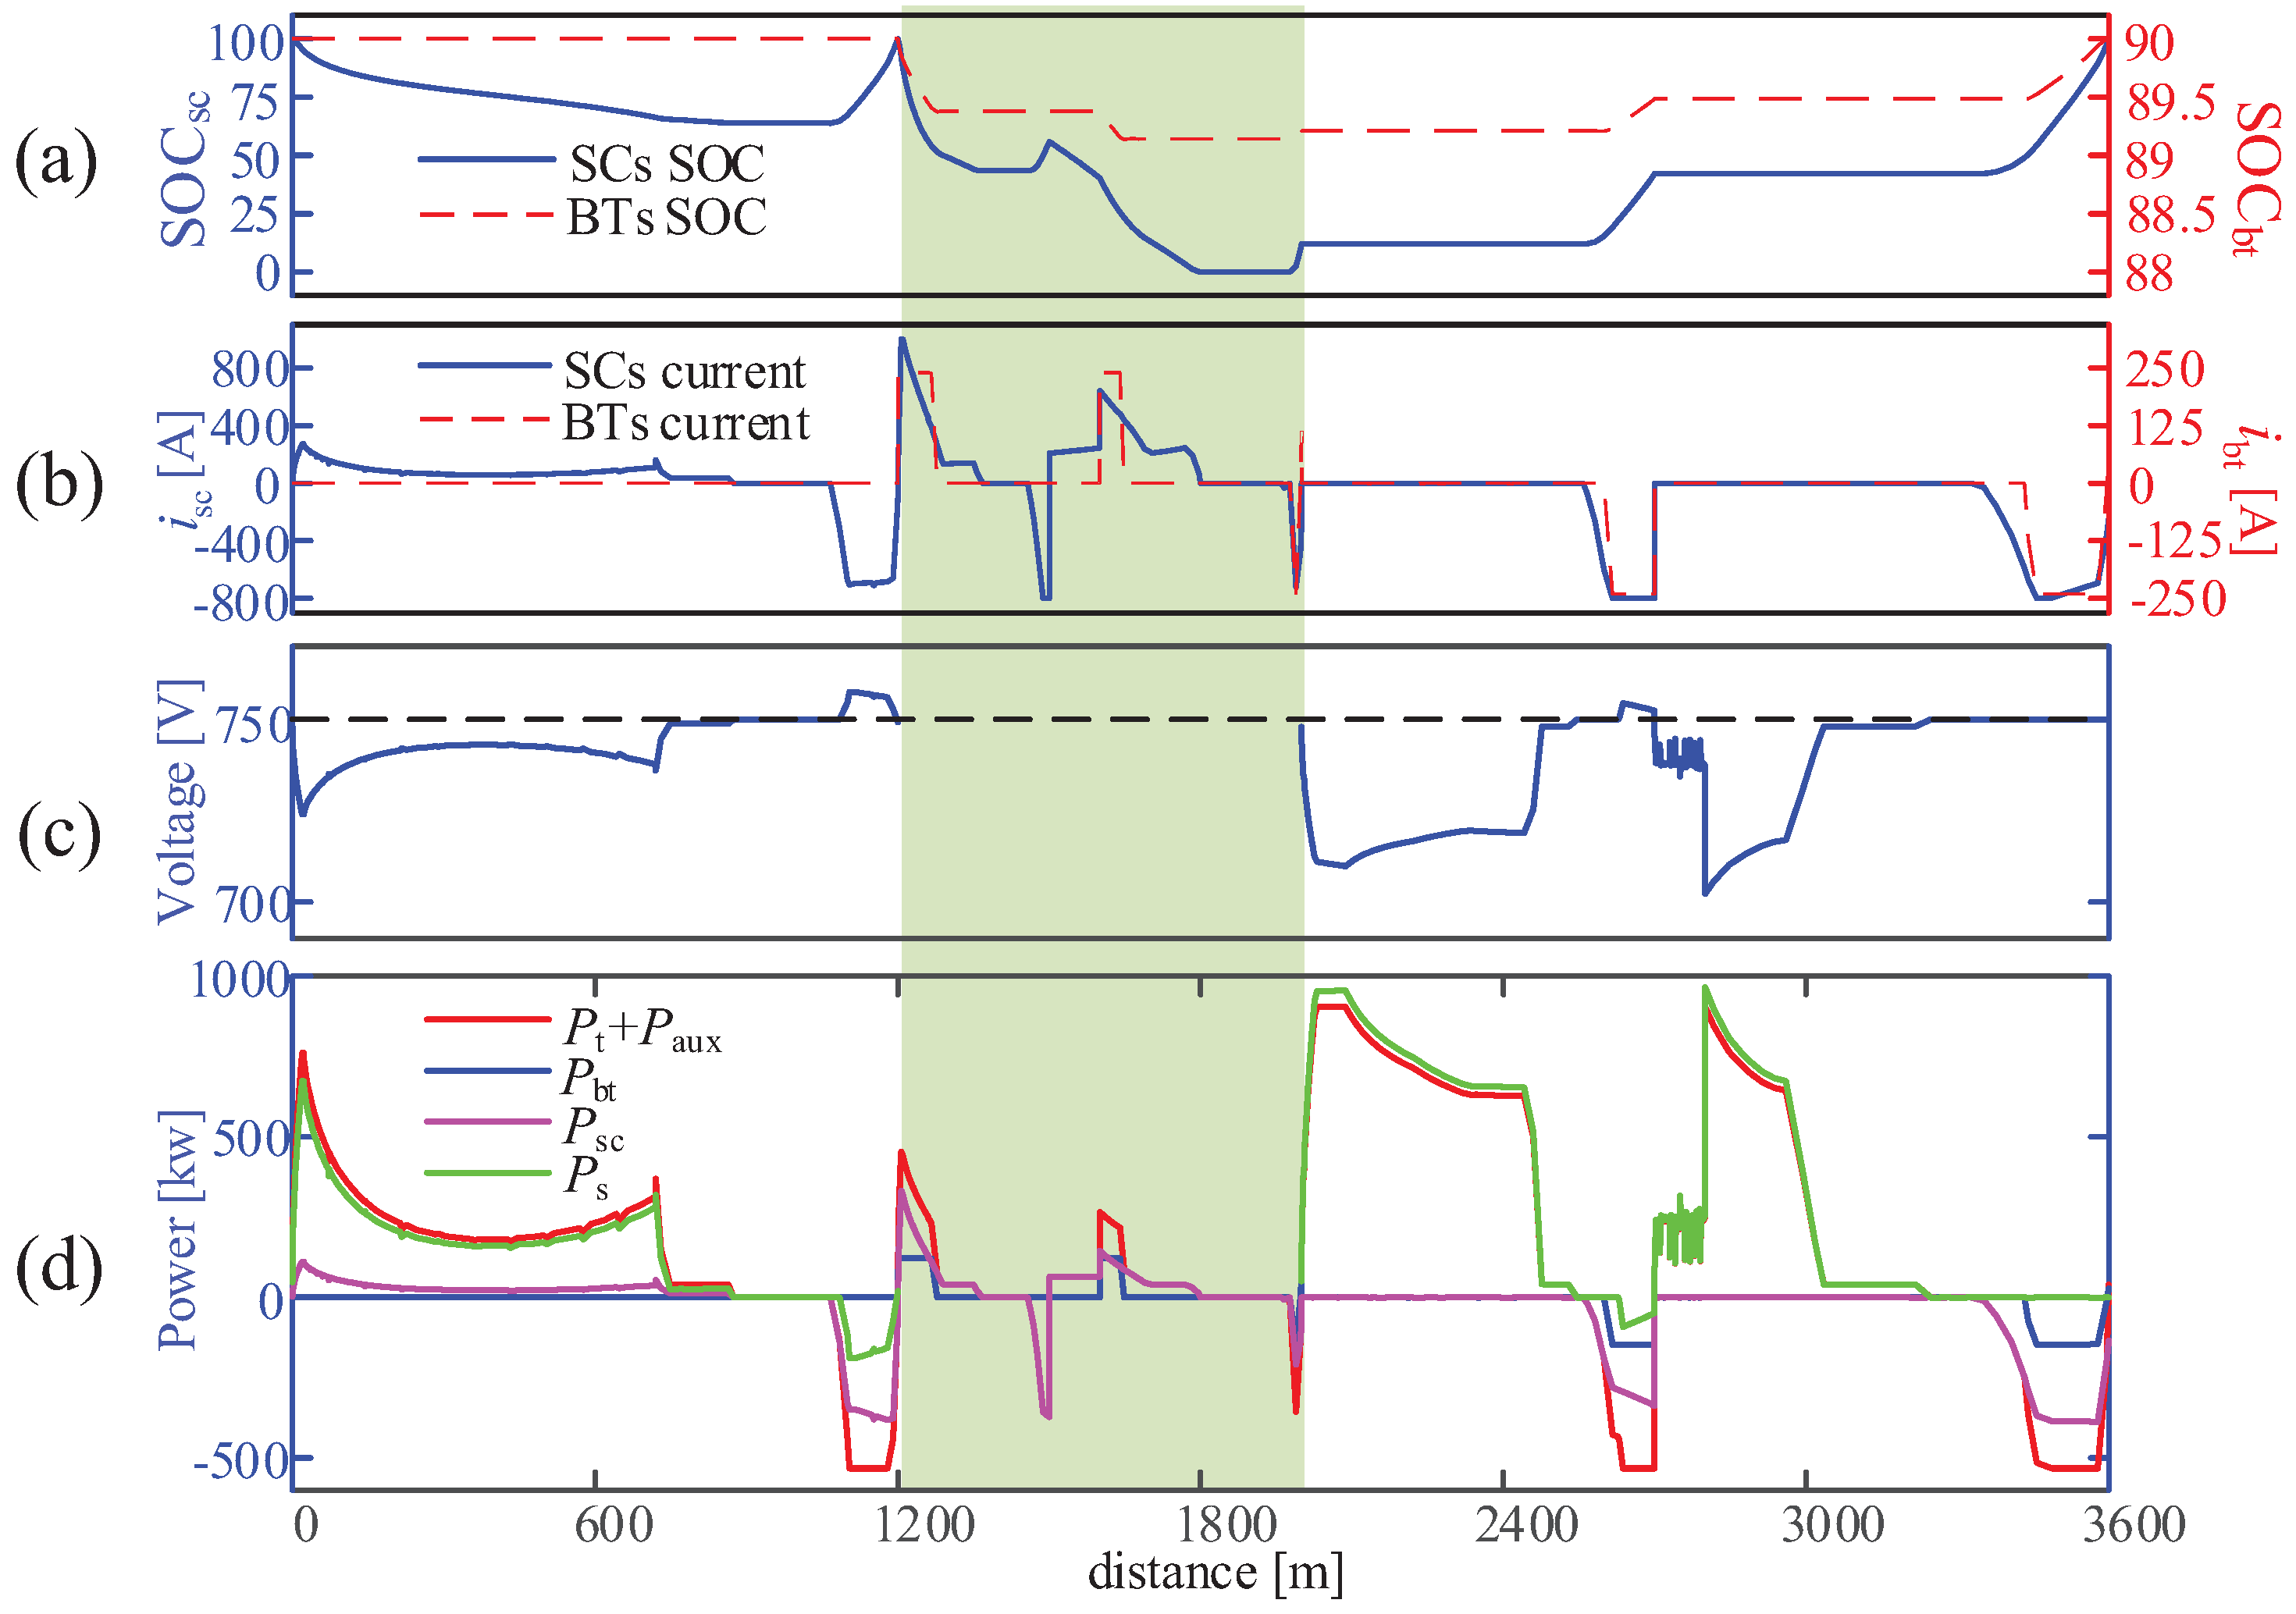
Figure 11.
The human experience trajectories of the HESSs tram under the FTS strategy: (a) The speed profile; (b) The traction/braking control curve.
Figure 11.
The human experience trajectories of the HESSs tram under the FTS strategy: (a) The speed profile; (b) The traction/braking control curve.

Figure 12.
The power split strategies based on the speed profiles under the FTS strategy: (a) The SOC curves; (b) The current curves; (c) The voltage curve of catenary; (d) The power curves.
Figure 12.
The power split strategies based on the speed profiles under the FTS strategy: (a) The SOC curves; (b) The current curves; (c) The voltage curve of catenary; (d) The power curves.

Figure 13.
The trajectories of the integrated optimization under the TPS strategy: (a) The speed profile; (b) The traction/braking control curve.
Figure 13.
The trajectories of the integrated optimization under the TPS strategy: (a) The speed profile; (b) The traction/braking control curve.
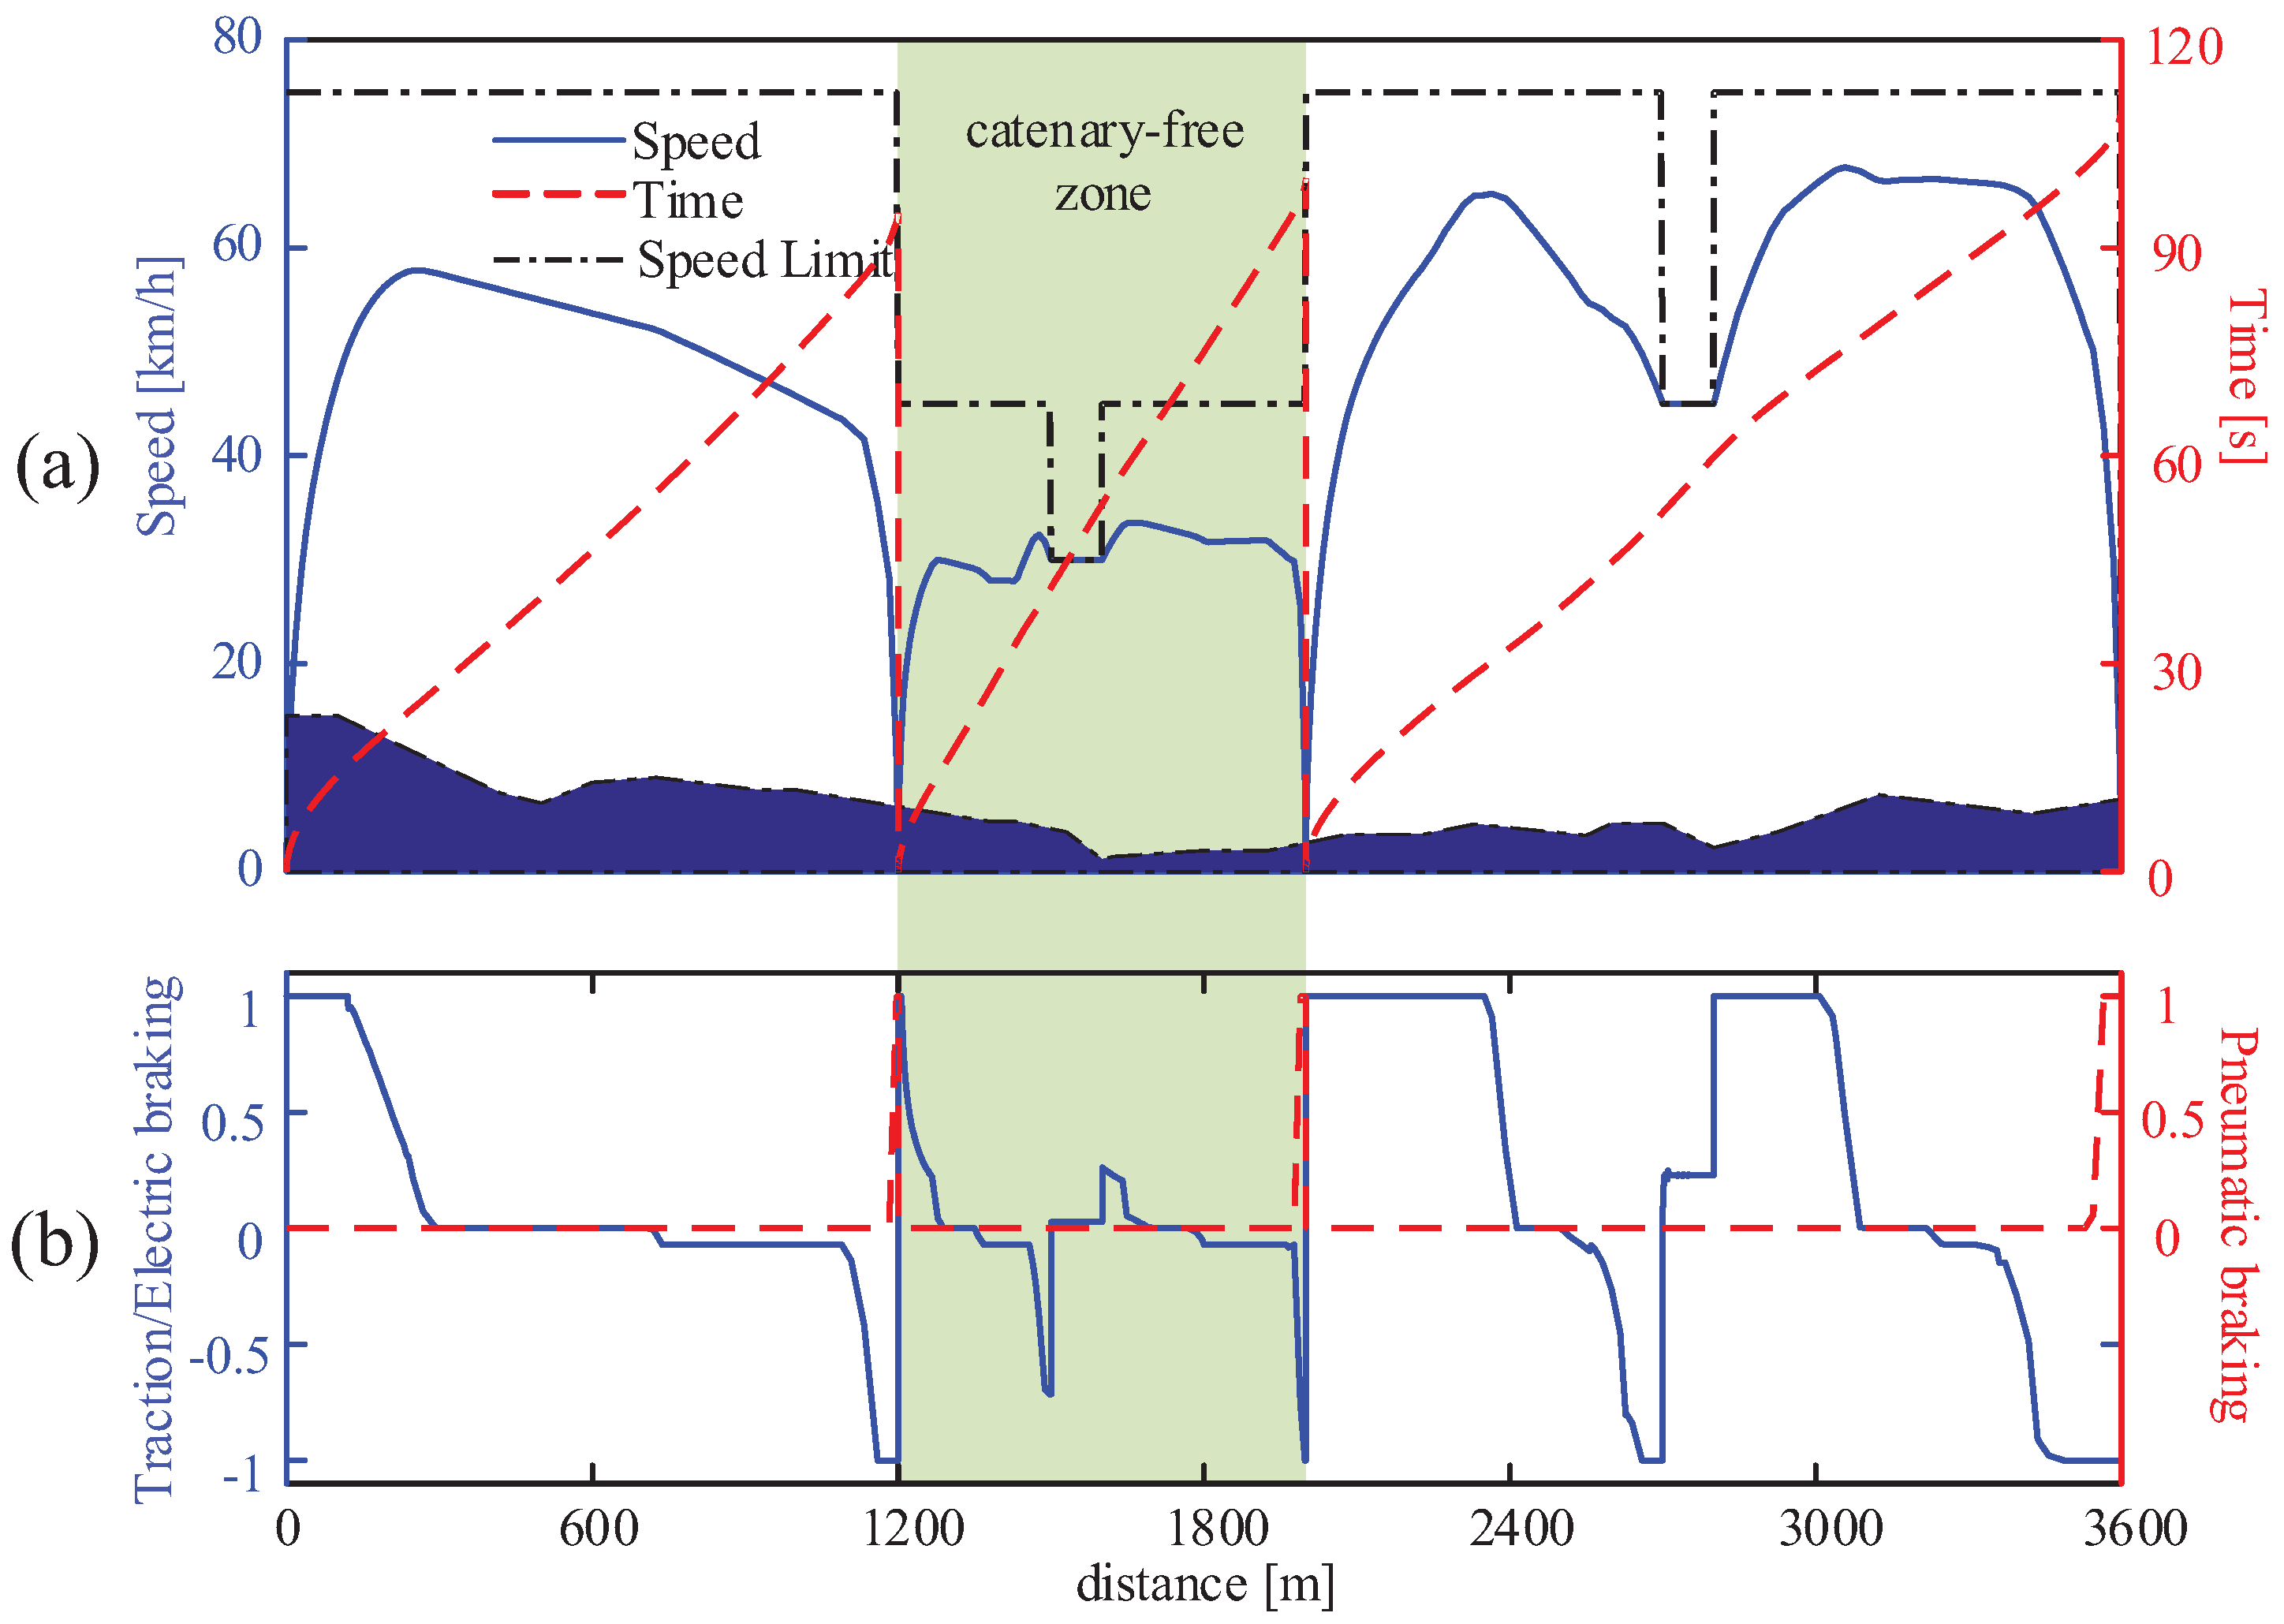
Figure 14.
The power split strategies of the integrated optimization under the TPS strategy: (a) The SOC curves; (b) The current curves; (c) The voltage curve of catenary; (d) The power curves.
Figure 14.
The power split strategies of the integrated optimization under the TPS strategy: (a) The SOC curves; (b) The current curves; (c) The voltage curve of catenary; (d) The power curves.

Table 1.
Parameters of the tram.
| Parameters | Value | Parameters | Value |
|---|---|---|---|
| Mass with full load (t) | 80 | Auxiliary power (kW) | 40 |
| Traction motors efficiency % | 92 | Gear box efficiency % | 98 |
| DC/DC converter efficiency % | 93 | DC/AC converter efficiency % | 93 |
Table 2.
Main specifications of the HESSs.
| Parameters | SCs | BTs |
|---|---|---|
| Rated capacity | 132 F | 20 Ah |
| Range of the voltage (V) | 190–480 | 528 |
| Range of the current (A) | −800–1000 | −240–240 |
| Maximum power (kW) | 480 | 126 |
| Initial SOC % | 90 | 100 |
| End SOC % | 90 | 100 |
| Maximum SOC % | 100 | 90 |
| Minimum SOC % | 0 | 20 |
| Average efficiency % | 95 | 92 |
| Electric energy (kW·h) | 3.562 | 7.406 |
Table 3.
Operation condition of the test line.
| Section | Distance (m) | Trip Times (s) | TPSS Modes |
|---|---|---|---|
| A–B | 1200 | 95 | The catenary zone |
| B–C | 800 | 100 | The catenary-free zone |
| C–D | 1600 | 110 | The catenary zone |
Table 4.
Electric parameters of the TPSS.
| Parameters | Value | Parameters | Value |
|---|---|---|---|
| Substation DC voltage (V) | 750 | Minimum voltage limitation | 650 |
| Equivalent resistance (/km) | 0.03 | Maximum voltage limitation | 900 |
| Catenary resistivity coefficient (/km) | 0.04 |
Table 5.
The energy consumption of the integrated optimization under the FTS strategy.
| Section | Substation Energy | BTs Energy | SCs Energy | Equivalent Energy | Braking | Regenerative |
|---|---|---|---|---|---|---|
| Consumption | Consumption | Consumption | Consumption | Energy | Energy | |
| A–B | 1.536 × 10⁷ | 0 | 1.216 × 10⁶ | 1.657 × 10⁷ | 7.238 × 10⁶ | 4.949 × 10⁶ |
| B–C | 0 | 2.249 × 10⁶ | 2.673 × 10⁶ | 4.922 × 10⁶ | 3.850 × 10⁶ | 3.102 × 10⁶ |
| C–D | 3.868 × 10⁷ | 0 | 0 | 3.868 × 10⁷ | 1.408 × 10⁷ | 1.038 × 10⁷ |
Table 6.
The energy consumption of the human experience strategies under the FTS strategy.
| Section | Substation Energy | BTs Energy | SCs Energy | Equivalent Energy | Braking | Regenerative |
|---|---|---|---|---|---|---|
| Consumption | Consumption | Consumption | Consumption | Energy | Energy | |
| A–B | 2.780 × 10⁷ | 0 | 1.856 × 10⁶ | 2.966 × 10⁷ | 1.138 × 10⁷ | 7.331 × 10⁶ |
| B–C | 0 | 2.249 × 10⁶ | 2.673 × 10⁶ | 4.922 × 10⁶ | 3.850 × 10⁶ | 3.102 × 10⁶ |
| C–D | 4.286 × 10⁷ | 0 | 0 | 4.286 × 10⁷ | 1.401 × 10⁷ | 1.020 × 10⁷ |
Table 7.
The energy consumption of the integrated optimization under the TPS strategy.
| Section | Substation Energy | BTs Energy | SCs Energy | Equivalent Energy | Braking | Regenerative |
|---|---|---|---|---|---|---|
| Consumption | Consumption | Consumption | Consumption | Energy | Energy | |
| A–B | 1.493 × 10⁷ | 0 | 9.631 × 10⁵ | 1.589 × 10⁷ | 6.133 × 10⁶ | 4.081 × 10⁶ |
| B–C | 0 | 2.249 × 10⁶ | 2.673 × 10⁶ | 4.922 × 10⁶ | 3.850 × 10⁶ | 3.102 × 10⁶ |
| C–D | 3.810 × 10⁷ | 0 | 0 | 3.810 × 10⁷ | 1.399 × 10⁷ | 1.040 × 10⁷ |
© 2018 by the authors. Licensee MDPI, Basel, Switzerland. This article is an open access article distributed under the terms and conditions of the Creative Commons Attribution (CC BY) license (http://creativecommons.org/licenses/by/4.0/).
Share and Cite
MDPI and ACS Style
Xiao, Z.; Sun, P.; Wang, Q.; Zhu, Y.; Feng, X. Integrated Optimization of Speed Profiles and Power Split for a Tram with Hybrid Energy Storage Systems on a Signalized Route. Energies 2018, 11, 478. https://doi.org/10.3390/en11030478
AMA Style
Xiao Z, Sun P, Wang Q, Zhu Y, Feng X. Integrated Optimization of Speed Profiles and Power Split for a Tram with Hybrid Energy Storage Systems on a Signalized Route. Energies. 2018; 11(3):478. https://doi.org/10.3390/en11030478
Chicago/Turabian StyleXiao, Zhuang, Pengfei Sun, Qingyuan Wang, Yuqing Zhu, and Xiaoyun Feng. 2018. "Integrated Optimization of Speed Profiles and Power Split for a Tram with Hybrid Energy Storage Systems on a Signalized Route" Energies 11, no. 3: 478. https://doi.org/10.3390/en11030478
Note that from the first issue of 2016, this journal uses article numbers instead of page numbers. See further details here.