Regenerative Braking Compensatory Control Strategy Considering CVT Power Loss for Hybrid Electric Vehicles

1
State Key Laboratory of Mechanical Transmission, Chongqing University, Chongqing 400044, China
2
School of Automotive Engineering, Chongqing University, Chongqing 400044, China
3
Department of Mechanical Engineering, University of Michigan-Dearborn, Dearborn, MI 48128, USA
*
Author to whom correspondence should be addressed.
Energies 2018, 11(3), 497; https://doi.org/10.3390/en11030497
Submission received: 17 January 2018
/
Revised: 6 February 2018
/
Accepted: 8 February 2018
/
Published: 27 February 2018
Abstract
:Hybrid electric vehicles (HEV) equipped with continuously variable transmission (CVT) adjust the motor operating point continuously to achieve the optimal motor operating efficiency during regenerative braking. Traditional control strategies consider the CVT efficiency as constant, while the CVT efficiency varies in different operating conditions. In order to reflect the transmission efficiency more accurately during regenerative braking, the CVT theoretical torque loss model is firstly established which then leads to the battery–front motor–CVT joint operating efficiency model. The joint operating efficiency model indicates that the system efficiency is influenced by input speed, input torque, CVT speed ratio, and battery SOC (state of charge). The compensatory strategy for the front motor barking force is proposed to make full use of its braking power and the CVT speed ratio control strategy is modified to maintain the optimal operating efficiency of the system. The simulations are performed under three typical braking conditions and UDDS, NYCC, US06 respectively, the results show that the modified control strategy increases the front motor braking power and improves the system operating efficiency.
1. Introduction
HEV can improve fuel economy and reduce emissions significantly by regenerative braking [1,2]. HEV equipped with CVT can further improve the vehicle energy recovery rate because a proper CVT ratio control strategy enables the regenerative braking system to operate in a more efficient region [3].
At present, the research on CVT regenerative braking systems mainly focuses on the braking force distribution strategy and the regenerative braking system efficiency optimization. In the aspect of braking force distribution strategy, Zhang Junzhi et al. put forward a new regenerative braking force distribution strategy which increased the proportion of rear regenerative braking force, and a higher regeneration efficiency was achieved [4]. Shu Hong et al. developed a maximum energy recapture energy management strategy and used sequential quadratic programming (SQP) algorithm to optimize the CVT ratio control strategy [5]; Guoqing Xu et al. designed a fuzzy logic based braking force distribution strategy which took the required braking force, vehicle speed, battery SOC, and temperature as input [6]. In the aspect of system efficiency optimization, Hoon Yeo et al. considered the battery SOC and vehicle velocity as the weight factors to determine the regenerative torque and a CVT ratio control strategy is proposed for optimal motor operation [7]; Tao Deng et al. analyzed the relationship between battery charging efficiency, motor operating efficiency, and CVT efficiency, and proposed the CVT ratio control strategy which considered the battery–motor–CVT joint high efficiency [8]. Liang Li et al. analyzed process and advantages of AMT (automated mechanical transmission) downshifting and proposed the downshift strategy for an electric vehicle equipped with AMT. In addition, a nonlinear sliding mode observer was designed to obtain the actual hydraulic brake torque to achieve the cooperative control of regenerative braking and hydraulic braking [9,10].
In these studies above, they all considered the CVT efficiency as constant. However, the CVT efficiency varies with different operating conditions. Therefore, the proposed regenerative braking control strategy cannot be applied for the actual regenerative braking system with optimal system efficiency.
In this paper, a four-wheel drive hybrid electric vehicle equipped with CVT is taken as the research platform. The theoretical torque loss and transmission efficiency model of CVT is firstly established. The battery–motor–CVT joint operating efficiency model is further established based on the CVT efficiency model. Through motor braking force compensation and CVT ratio control strategy, the more efficient recovery of braking energy is achieved.
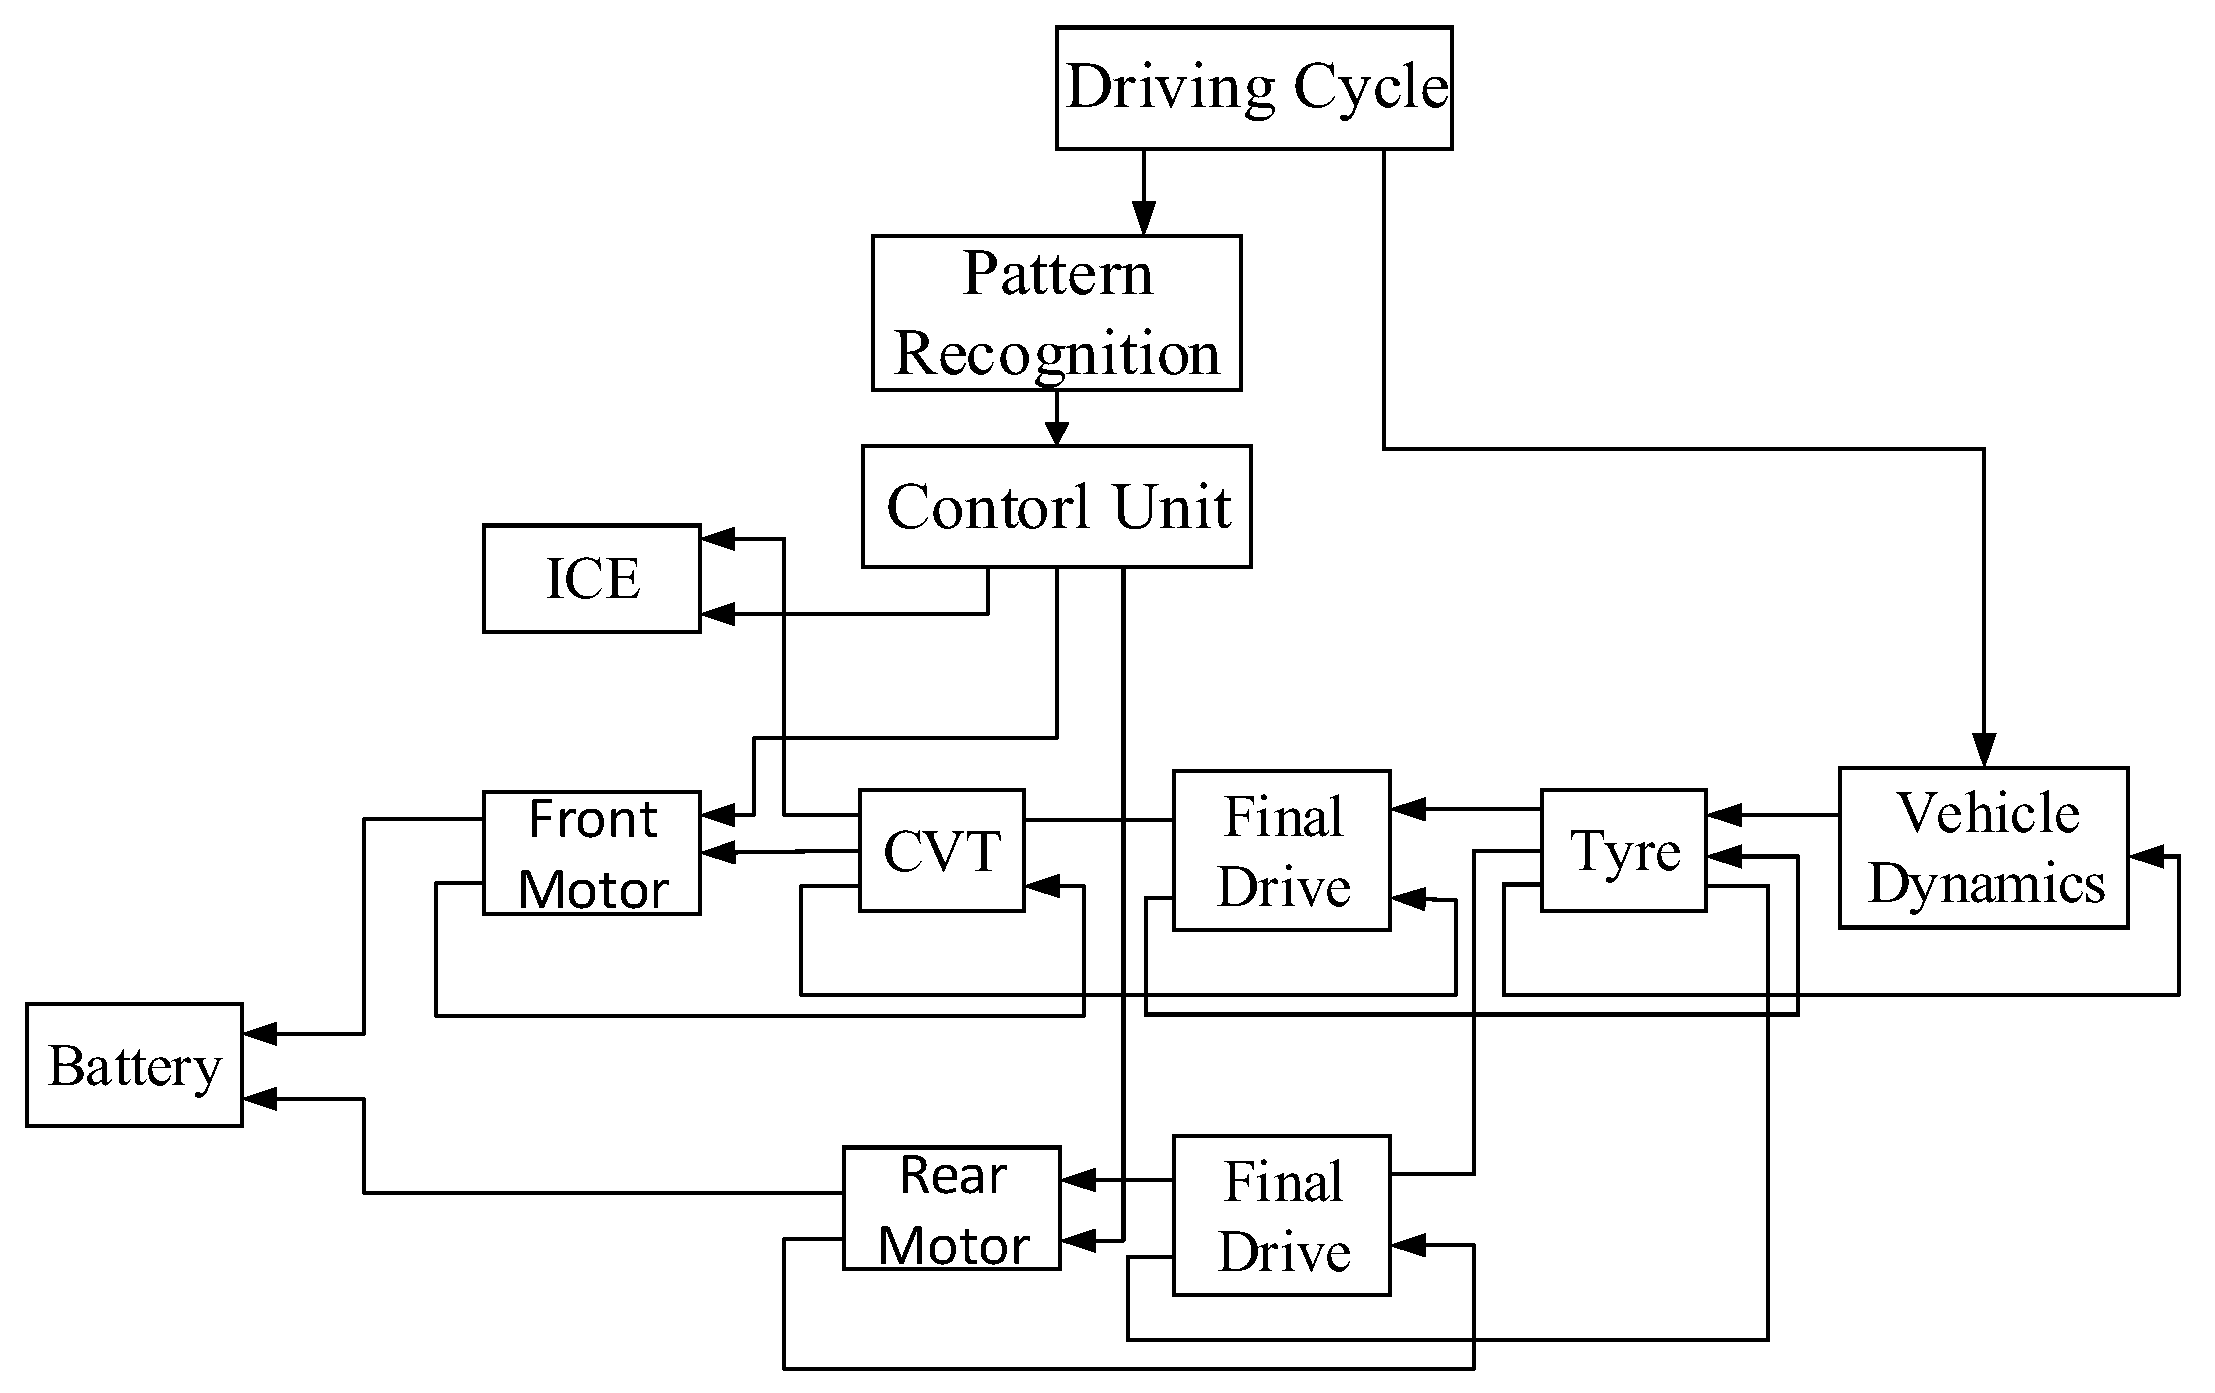
2. HEV Configuration and Model Establishment
2.1. HEV Configuration
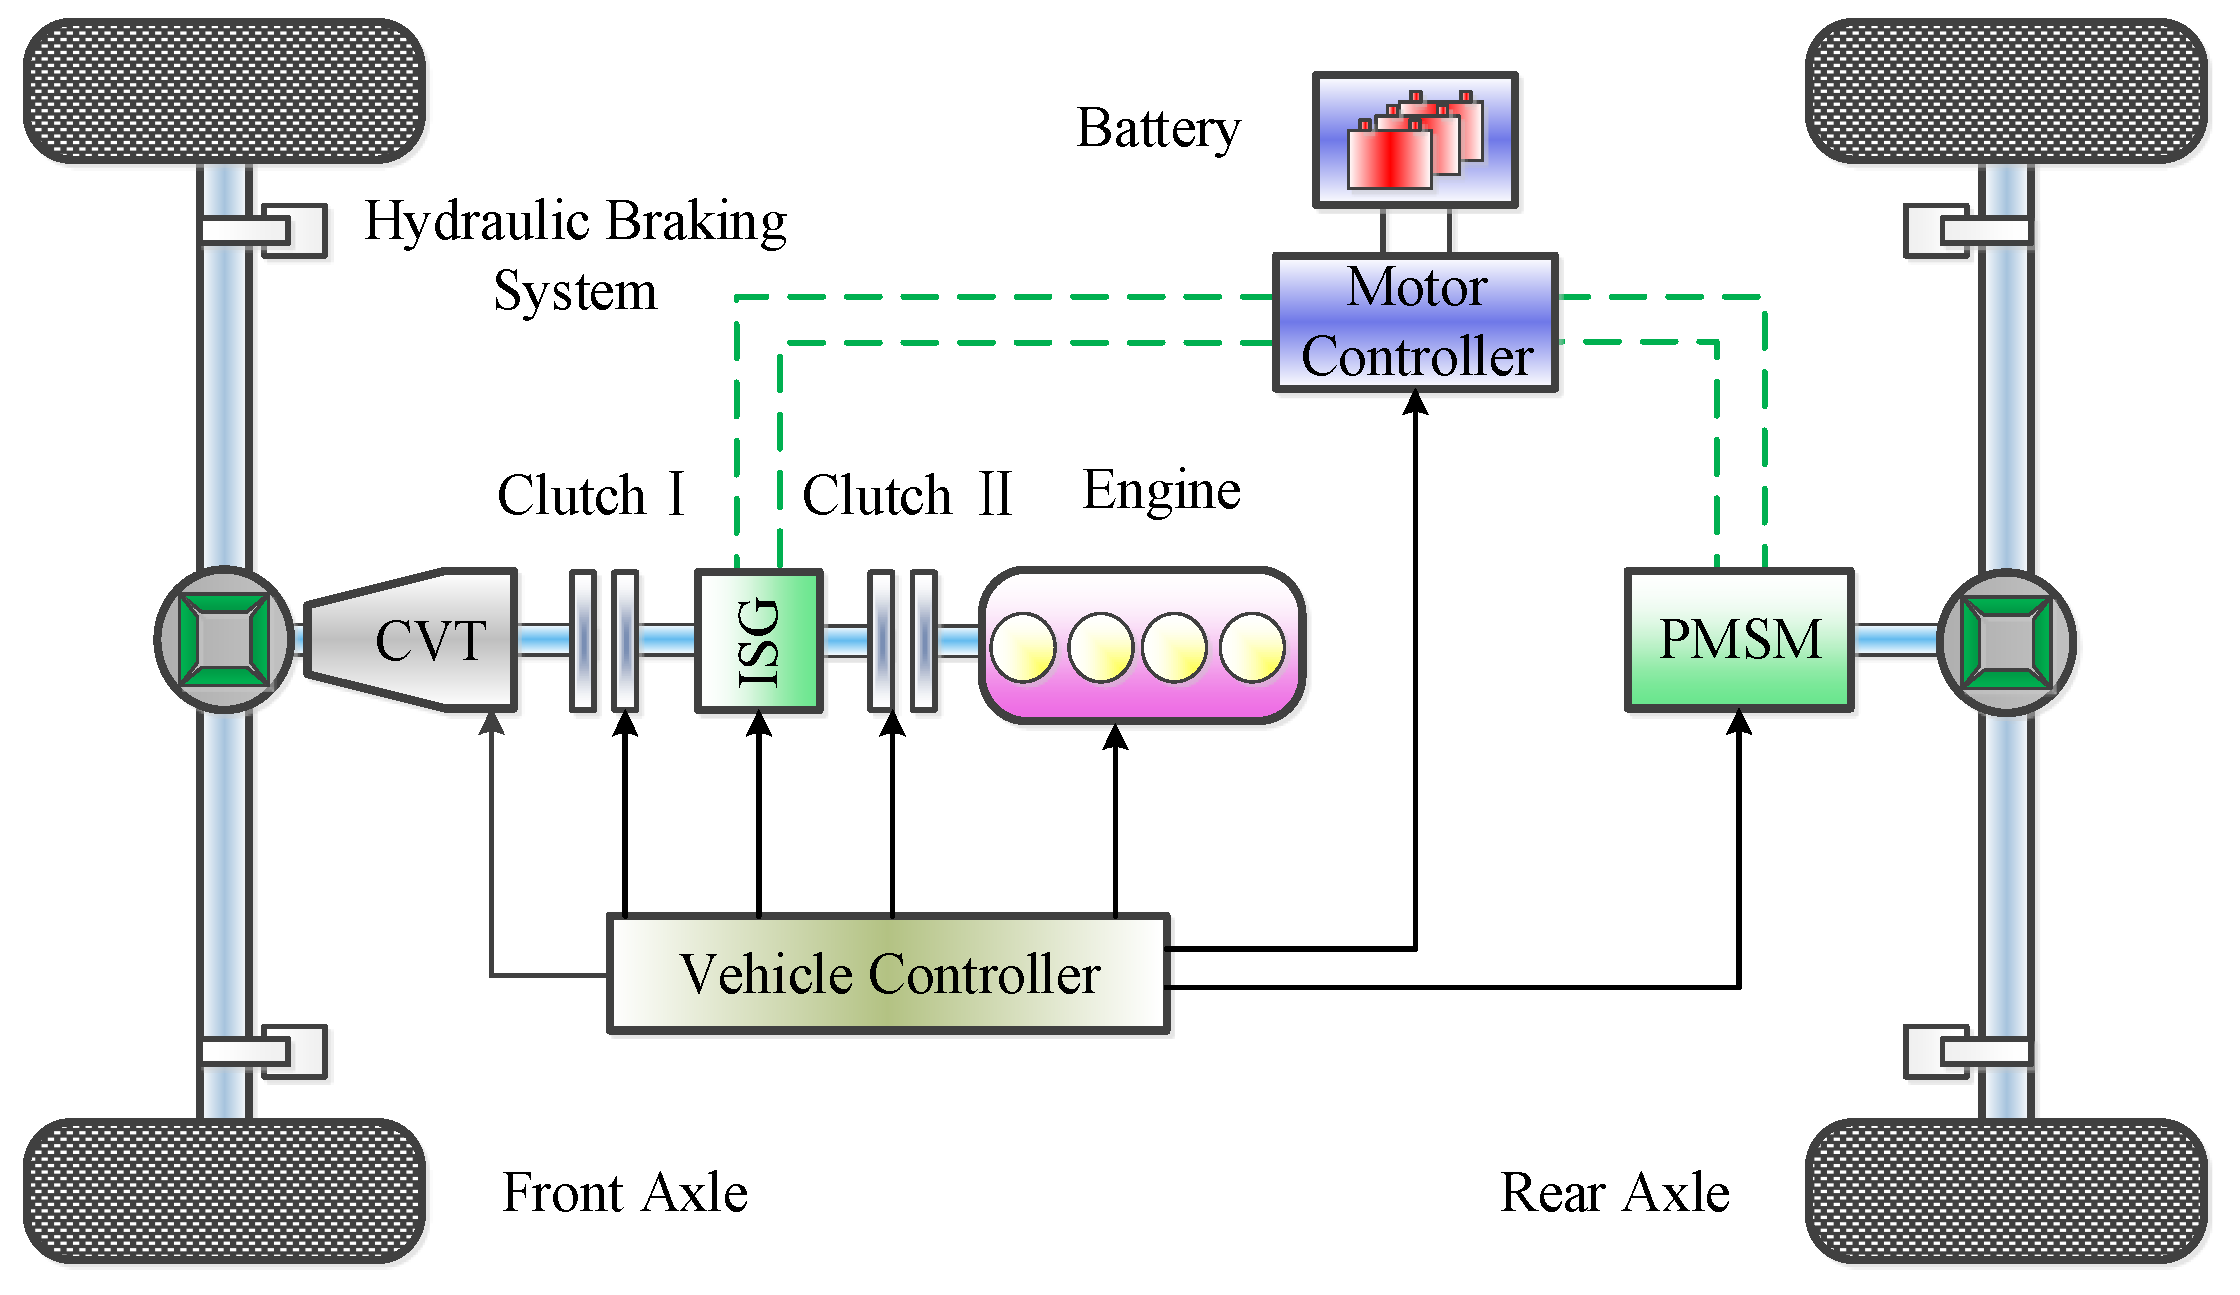
The configuration of the four-wheel drive hybrid electric vehicle studied in this paper is shown in Figure 1. The front axle is driven by engine and a coaxial ISG (integrated starter and generator) motor. Power interruption and connection is achieved by clutch I and clutch II. The rear axle is driven by rear motor alone. The transmission used in the vehicle is metal pushing V-belt type CVT. The vehicle data and main component parameters are shown in Table 1.
2.2. CVT Torque Loss and Efficiency Models
The torque loss of CVT in power transmission consists of three parts [11,12,13]: (1) torque loss due to band friction; (2) pulley deflection loss; (3) belt slip loss.
The parameters related in modeling are listed in Table 2.
2.2.1. Torque Loss Due to Band Friction
Figure 2 shows the geometry of the band pack around a number of segments. It can be seen from Figure 2 that the rotation radius of bands within the band pack is bigger than the segments. The rotation radius of segment is R as shown in Figure 2 while the rotation radius of bands are . The inequality of the rotation radius leads to the inconsistent linear velocity between the bands and segment, and also between bands within the band pack. Hence, relative motion exists between the above-mentioned components. The torque loss due to band friction can be calculated as:
where is the normal force acting on band; is the relative velocity between band (i) and band (i − 1); is the input speed.
2.2.2. Pulley Deflection Loss
The pulley deflection caused by axial clamping force leads to the belt actual path differs from the ideal path as shown in Figure 3. This results in the relative motion between the pulley and the segments engaged in pulley. This part of torque loss can be divided into two parts: pulley wedge loss and pulley penetration loss.
At entrance the belt will contact with the pulley in advance by a distance , and the belt will remain in contact with the pulley by a distance at exit. The pulley wedge loss can be calculated as:
where and represent the segment number engaged in primary and secondary wedge zone respectively; and represent the relative speed between segment and pulley; and represent the contact force between segment and pulley.
When the belt travelling along its trajectory except wedge zone in the pulley, the belt will be able to penetrate into the rear of the wrap angle by distance . The pulley penetration loss can be calculated as:
where and represent the energy consumed when one segment slides into and out of the wedge angle; represents the rate of segments passing a point per second.
Totally, the torque loss due to pulley deflection will be:
2.2.3. Belt Slip Loss
When the bands are loaded in tension, they will stretch and if the segments are in compression they will reduce in thickness slightly. This will result in gaps existing somewhere in the belt system. Thus, the gaps will close and open periodically in the process of segments travelling around the pulley. The belt slip loss in this process can be calculated as:
where represents the segment slip speed; and represents the tangential force act on segment.
According to the discussion above, the torque loss of CVT is mainly related to its speed ratio, input speed, and input torque. The CVT torque loss map and transmission efficiency map, as shown in Figure 4 and Figure 5, are obtained based on the Formulas (2)–(6) where input speed is 2000 r/min. Figure 4 shows a good accordance with the torque loss model in [11] which was validated by experiments. This model is validated to be used for later analysis.
2.3. Battery–Motor–CVT Joint Efficiency Model
CVT efficiency varies with different operating conditions as discussed previously, therefore, it is inappropriate to take the CVT efficiency as a constant when designing a regenerative braking CVT control strategy. In addition, the efficiency of battery, motor and CVT should be considered globally to achieve the maximum efficiency of system. Figure 6 shows the efficiency map of front motor, rear motor, and battery charging efficiency map.
As can be seen from Figure 6, the efficiency of motor and battery are influenced by different variables. Taking the battery, motor and CVT as a whole system, its efficiency is influenced by input speed, input torque, CVT speed ratio, and battery SOC. By taking the CVT speed ratio and input power as independent variables, the battery–front motor–CVT joint operating efficiency map is obtained as Figure 7 where SOC is 0.7.
3. Braking Force Distribution and Compensation Strategy
The HEV in this study can recover the braking energy from both axles because motors are mounted in both axles. To minimize the power loss during braking energy recovery, the rear motor has priority, the front motor is in second priority, and hydraulic braking is in the last priority. Figure 8 shows the principle of braking force distribution in this paper. The blue dashed line is the ideal braking force distribution line. The red solid line is the braking force distribution strategy adopted in this paper.
3.1. Braking Strength z ≤ 0.09
The peak torque of rear motor can provide a braking strength of 0.09, so the braking force can be completely provided by rear motor when as shown in Figure 8 OA. The braking force distribution is formulated as:
where represents rear motor braking force; represents front motor braking force; represents front hydraulic braking force; represents rear hydraulic braking force.
3.2. Braking Strength 0.09 < z ≤ 0.5
To prevent the rear wheels being locked, increase the front motor braking force first as shown in Figure 8 AB. When the distribution line intersects with I curve at point B where braking strength is 0.25, the braking force distributes along the line BC.
3.2.1. 0.09 < z ≤ 0.25
When required braking force , the braking forces are distributed as:
where represents the maximum braking force can be provided by rear motor; represents the maximum braking force can be provided by rear motor.
When required braking force , the braking forces are distributed as:
3.2.2. 0.25 < z ≤ 0.5
The front and rear motors provide maximum braking force, and the remaining braking force is supplemented by hydraulic brake. The braking forces are distributed as:
where represents the front axle braking force; represents the rear axle braking force. and can be obtained from Figure 8 look-up table.
3.3. Braking Strength 0.5 < z ≤ 0.7
Considering the braking stability, the front and rear motor braking forces are linearly reduced to zero within the braking strength range of 0.5–0.7. The reduced amount of braking force is supplemented by hydraulic braking. The braking forces are distributed along CD as shown in Figure 8.
3.4. Braking Strength z > 0.7
Emergency braking conditions are when . In order to prevent regenerative braking interfering with ABS (antilock braking system), regenerative braking is turned off.
3.5. Front Motor Braking Force Compensatory Strategy
For the power loss in the process of transmission, the amount of CVT torque loss is compensated to the front regenerative braking system to ensure the front motor operating on its peak power after the power loss of CVT. The braking torque compensation is executed in three cases:
- (1).
- When required braking torque is less than or equal to front motor maximum braking torque , since no additional braking torque can be distributed on this condition, the motor braking force is not compensated.
- (2).
- When required braking torque is between the front motor maximum braking torque and the sum of and CVT torque loss , distribute the required braking Torque to front regenerative braking system.
- (3).
- When required braking torque is greater than the sum of and CVT torque loss , distribute to the front regenerative braking system.
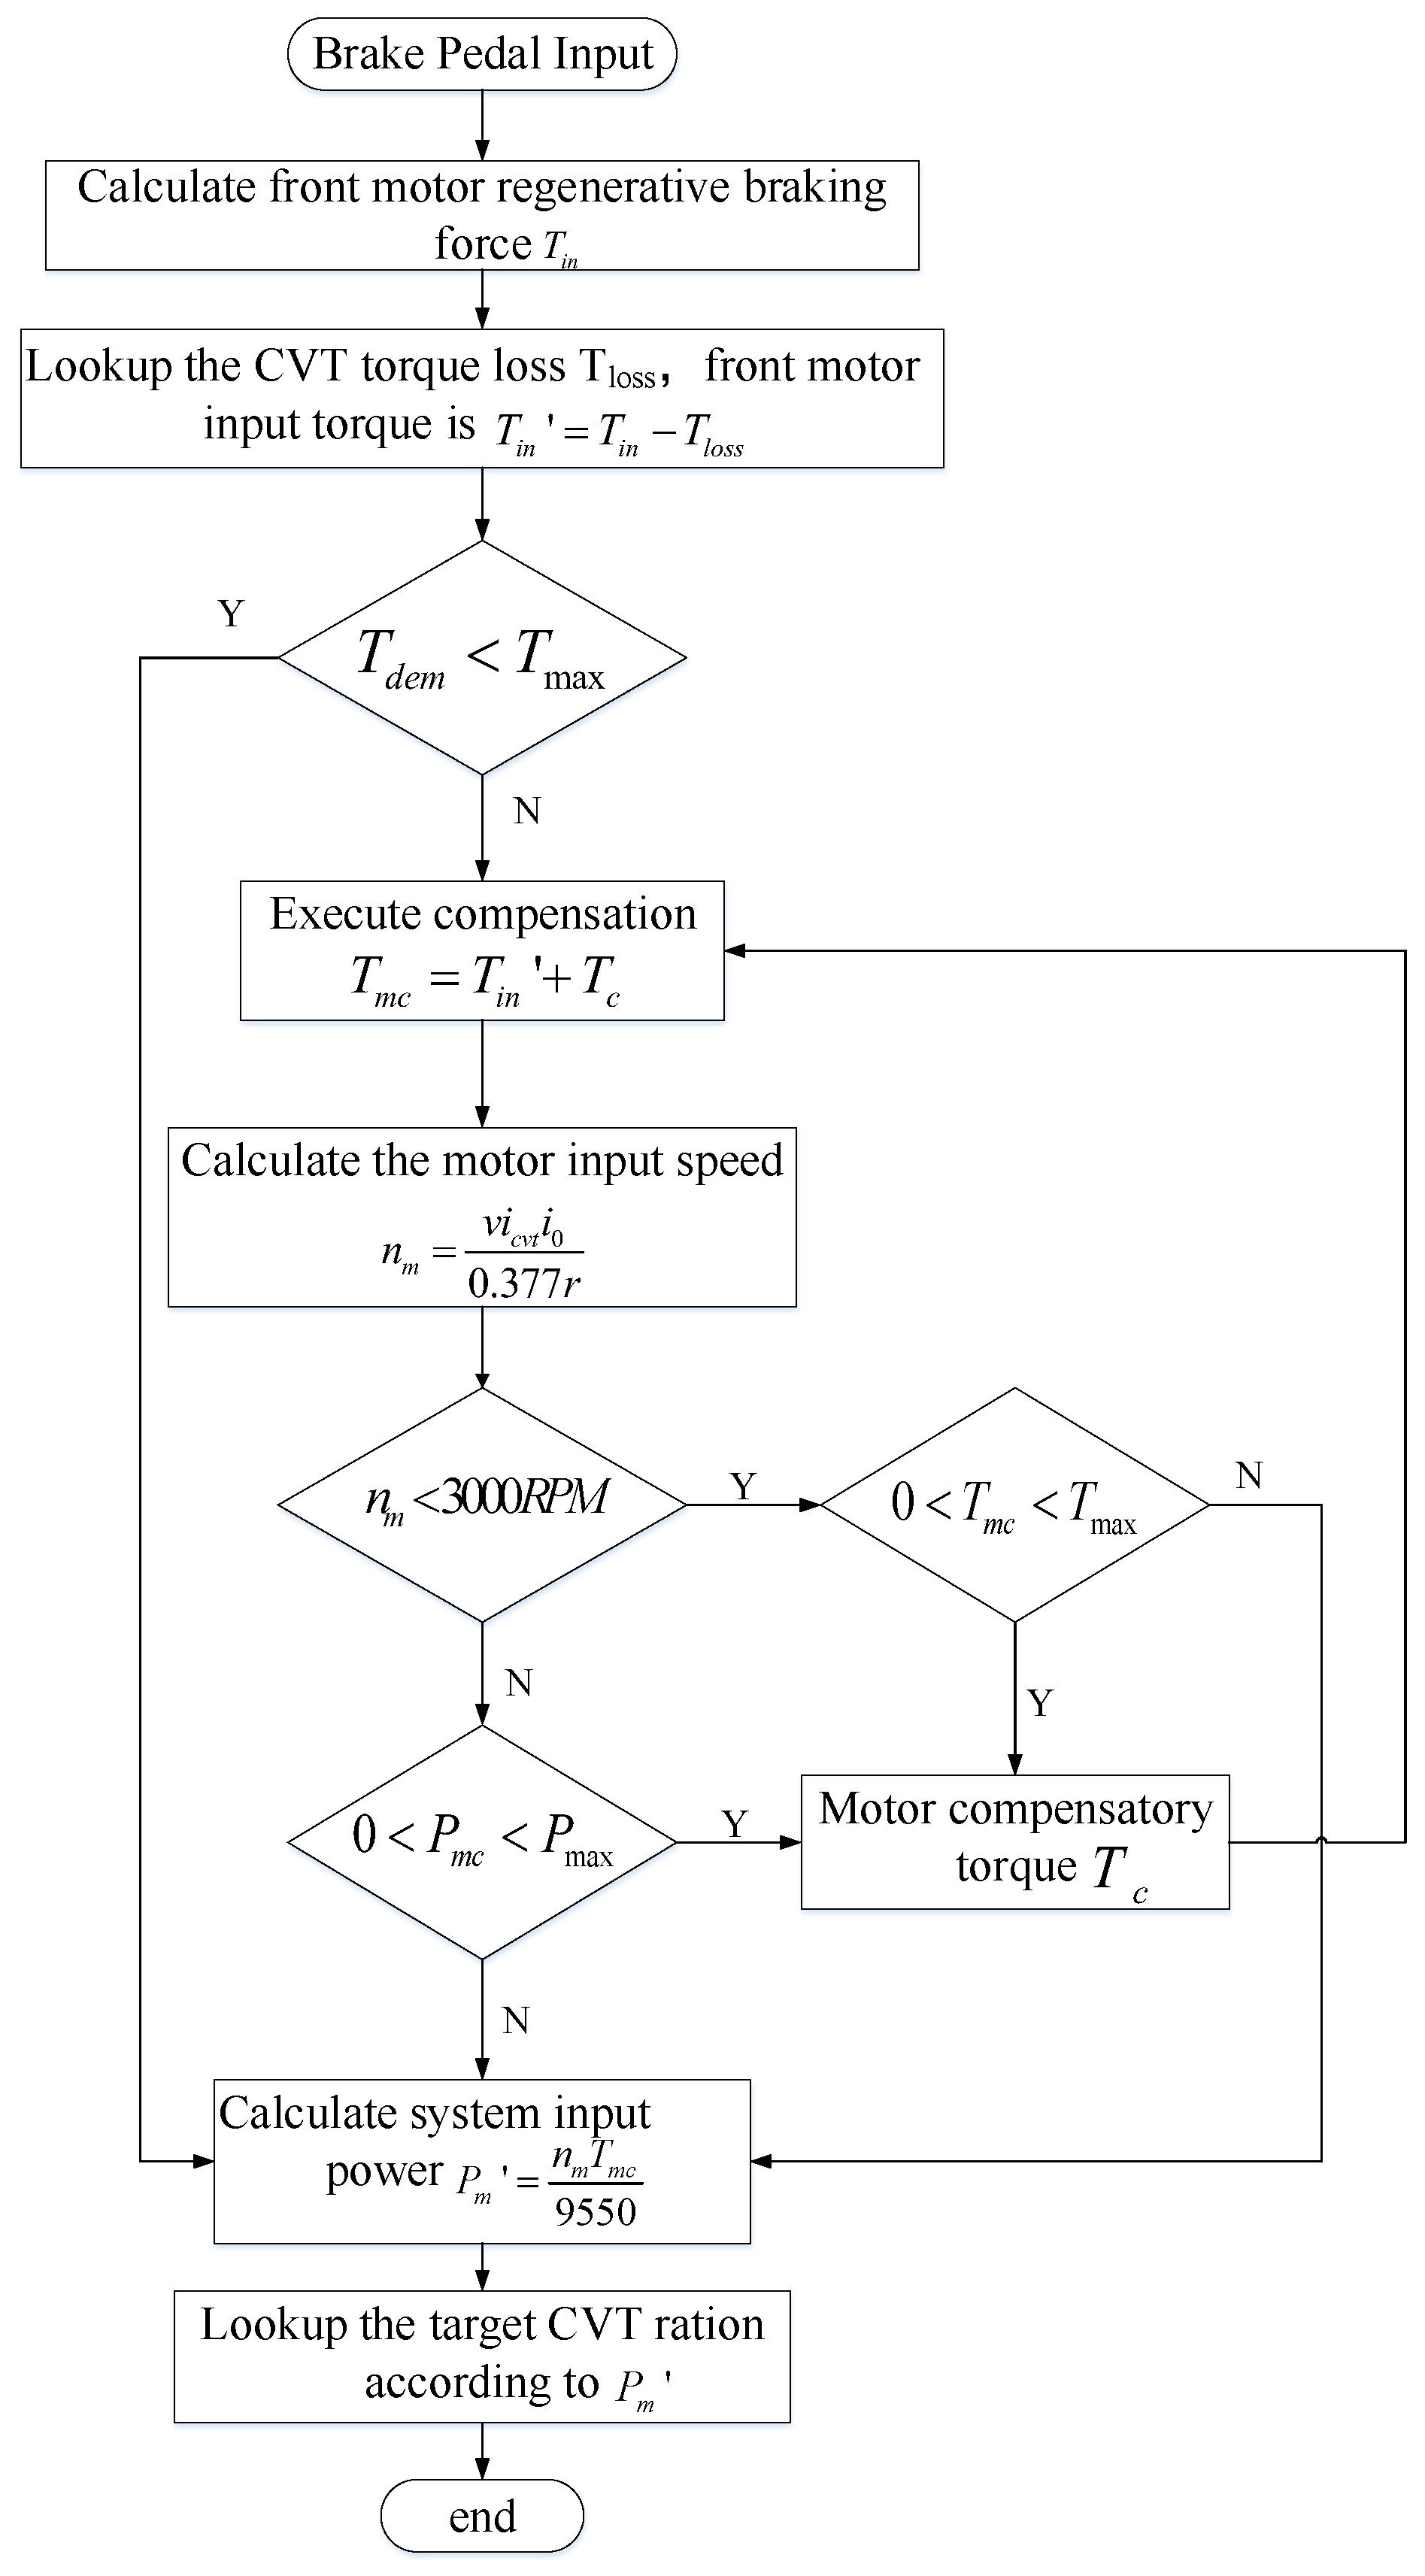
4. CVT Ratio Control Strategy
The purpose of the CVT ratio control strategy is to adjust the operating point of the regenerative braking system according to the regenerative braking power so that the regenerative braking system operates along its optimal efficiency line.
Traditional control strategy only considers how to ensure the motor work along the battery–motor joint high efficiency line, and does not consider the varying of CVT efficiency. Nevertheless, in this study the varying of CVT efficiency is taken into account and the barking force compensation is executed to front regenerative braking system, the high efficiency operating line has been changed compared with the previous system. To keep the system operating as efficient as possible, the CVT ratio control strategy needs to be modified. The CVT ratio modifying procedure is shown in Figure 9.
The detailed procedures are as follows: as the braking begins, the system input torque is obtained based on the braking force distribution strategy. Then the CVT torque loss can be obtained from the CVT torque loss table, the motor input torque before compensation is . If the required braking force is less than or equal to the front motor maximum braking torque , input to front motor directly. If , determine the motor operating in constant torque zone or constant power zone first then compensate the braking force to the front motor to ensure the front motor operates on peak torque or peak power. Finally, obtain the target CVT ratio according to the current system input power, input speed, and battery SOC by looking up the battery–motor–CVT joint optimal operating line table. When braking strength , vehicle is braking under emergency conditions, the CVT ratio is controlled at 0.4.
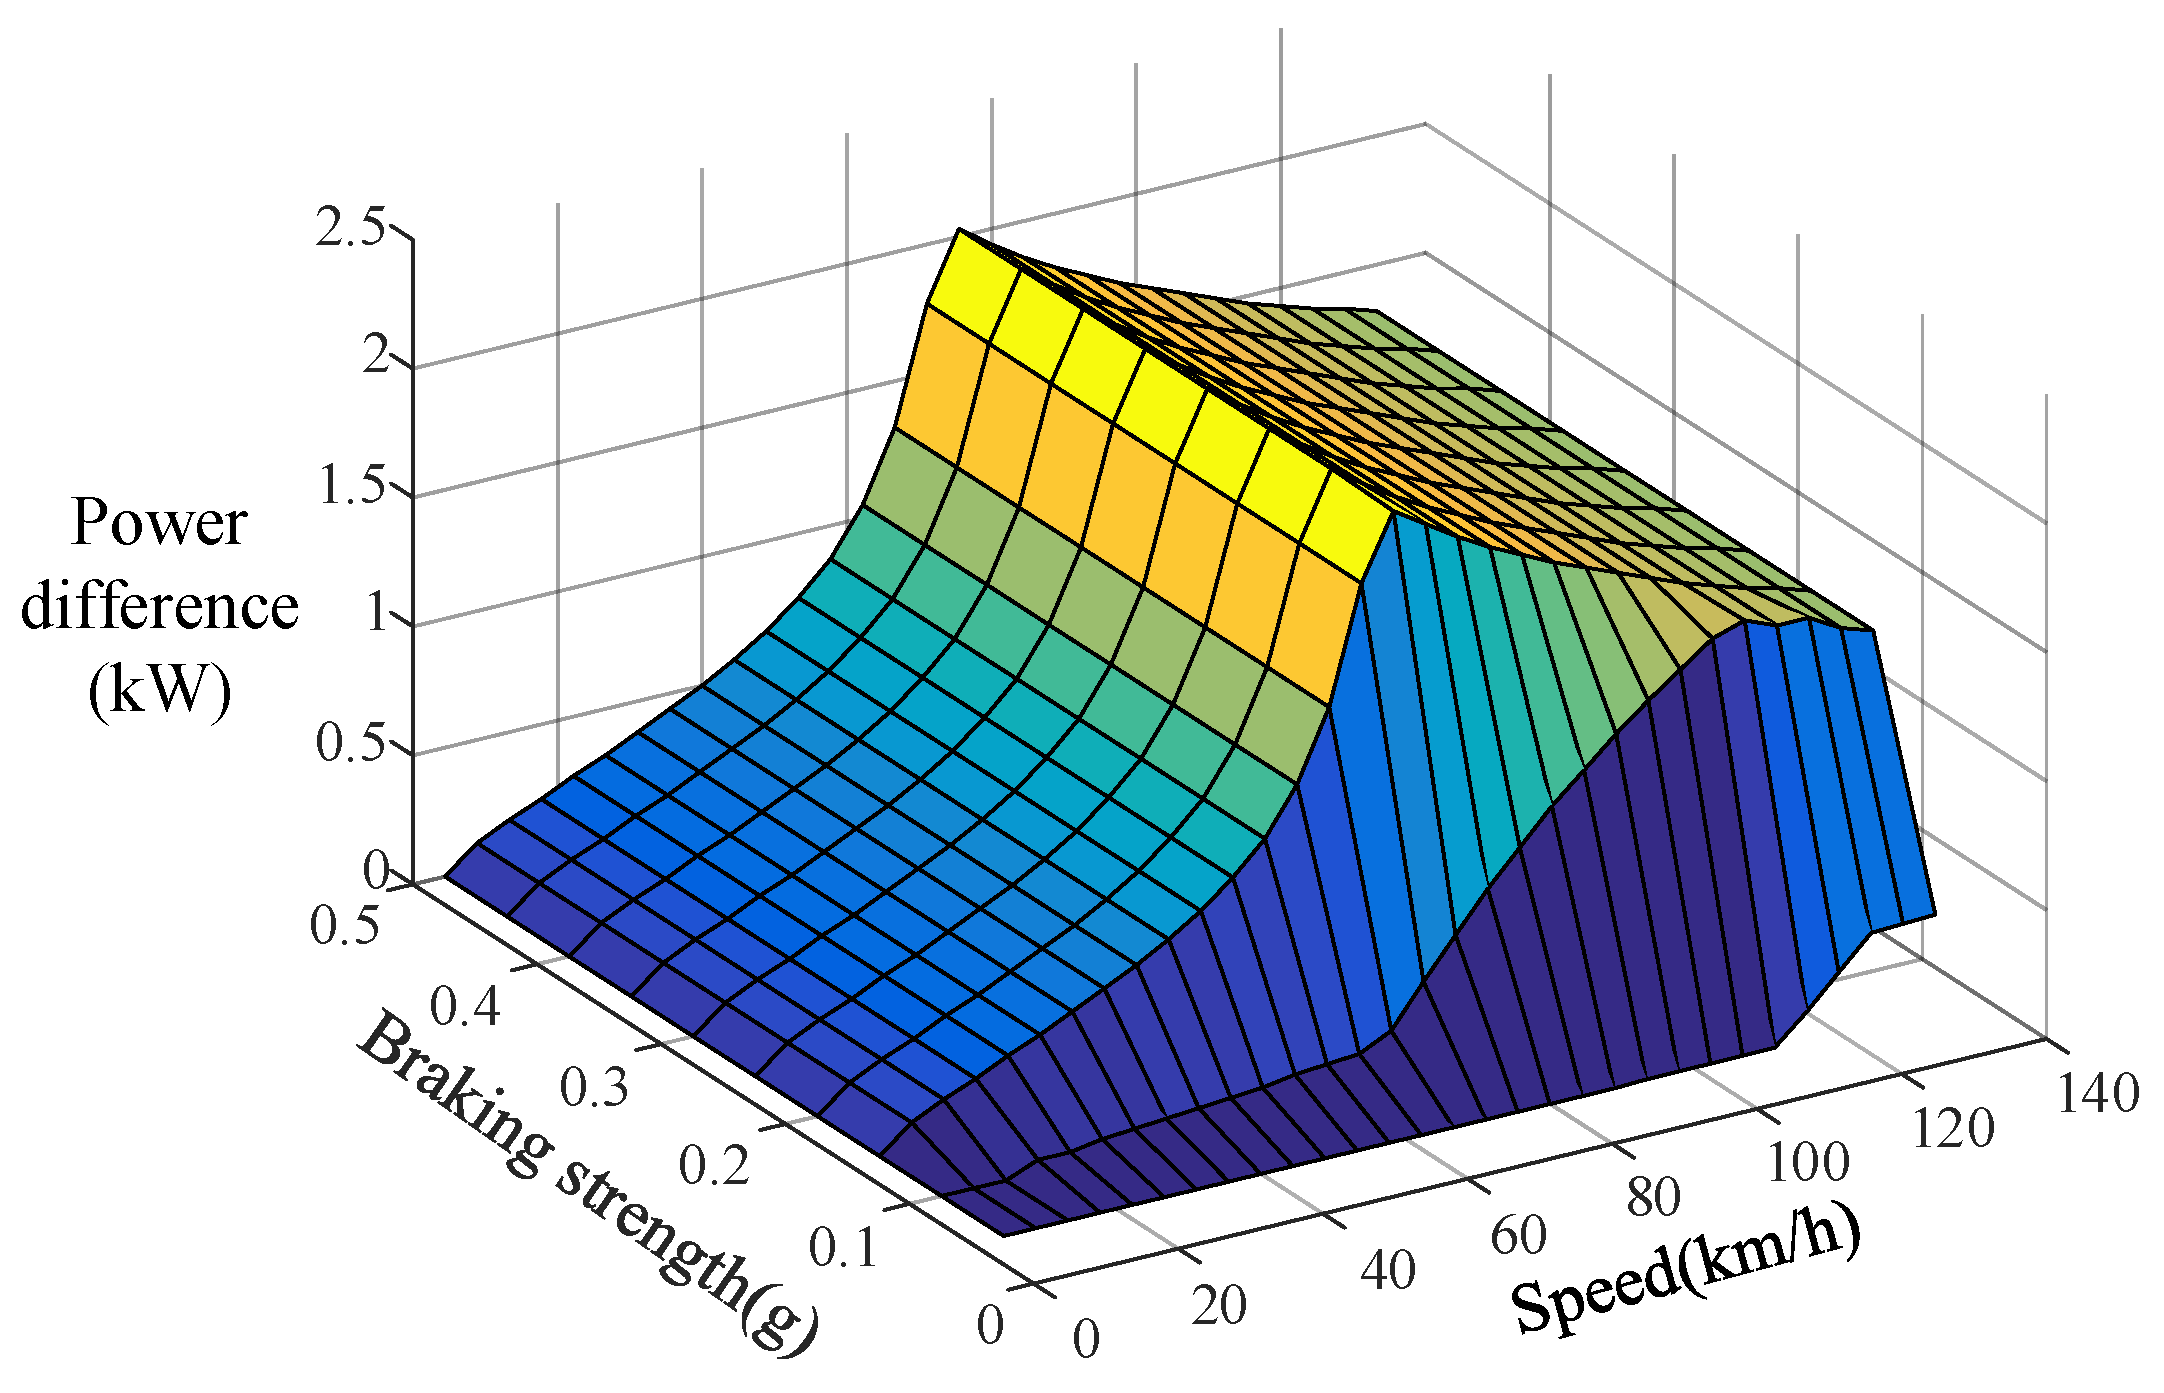
The modified CVT ratio map is compared with previous CVT ratio map in Figure 10. The power differences of motor input power before and after braking force compensation is shown in Figure 11. As can be seen from the figures, the input power of front motor is increased after compensation, so that the CVT ratio under the same braking conditions is higher than that before modifying as shown in Figure 10.
5. System Model and Simulation Analysis
5.1. Configuration of Simulation System
Backward simulation model is adopted as shown in Figure 12. Taking the driving cycle as system input to simulate the battery SOC consumed in the driving process and the SOC recovered in the braking process. The results show the energy recovery rate, front motor braking power and front motor efficiency because this study focuses on the verification of CVT control strategy.
5.2. Simulation Analysis
The simulation is performed under three typical braking conditions and UDDS (Urban Dynamometer Driving Schedule), NYCC (New York City Cycle), and US06. The results are compared with the results of previous control strategy which considers the CVT efficiency as constant and does not compensate braking force to front motor. The braking force compensatory strategy is compared with the strategy without compensation by comparing the front motor braking power. The CVT ratio control strategy is compared with the previous control strategy by comparing regenerative braking system efficiency.
5.2.1. Typical Braking Conditions Simulation
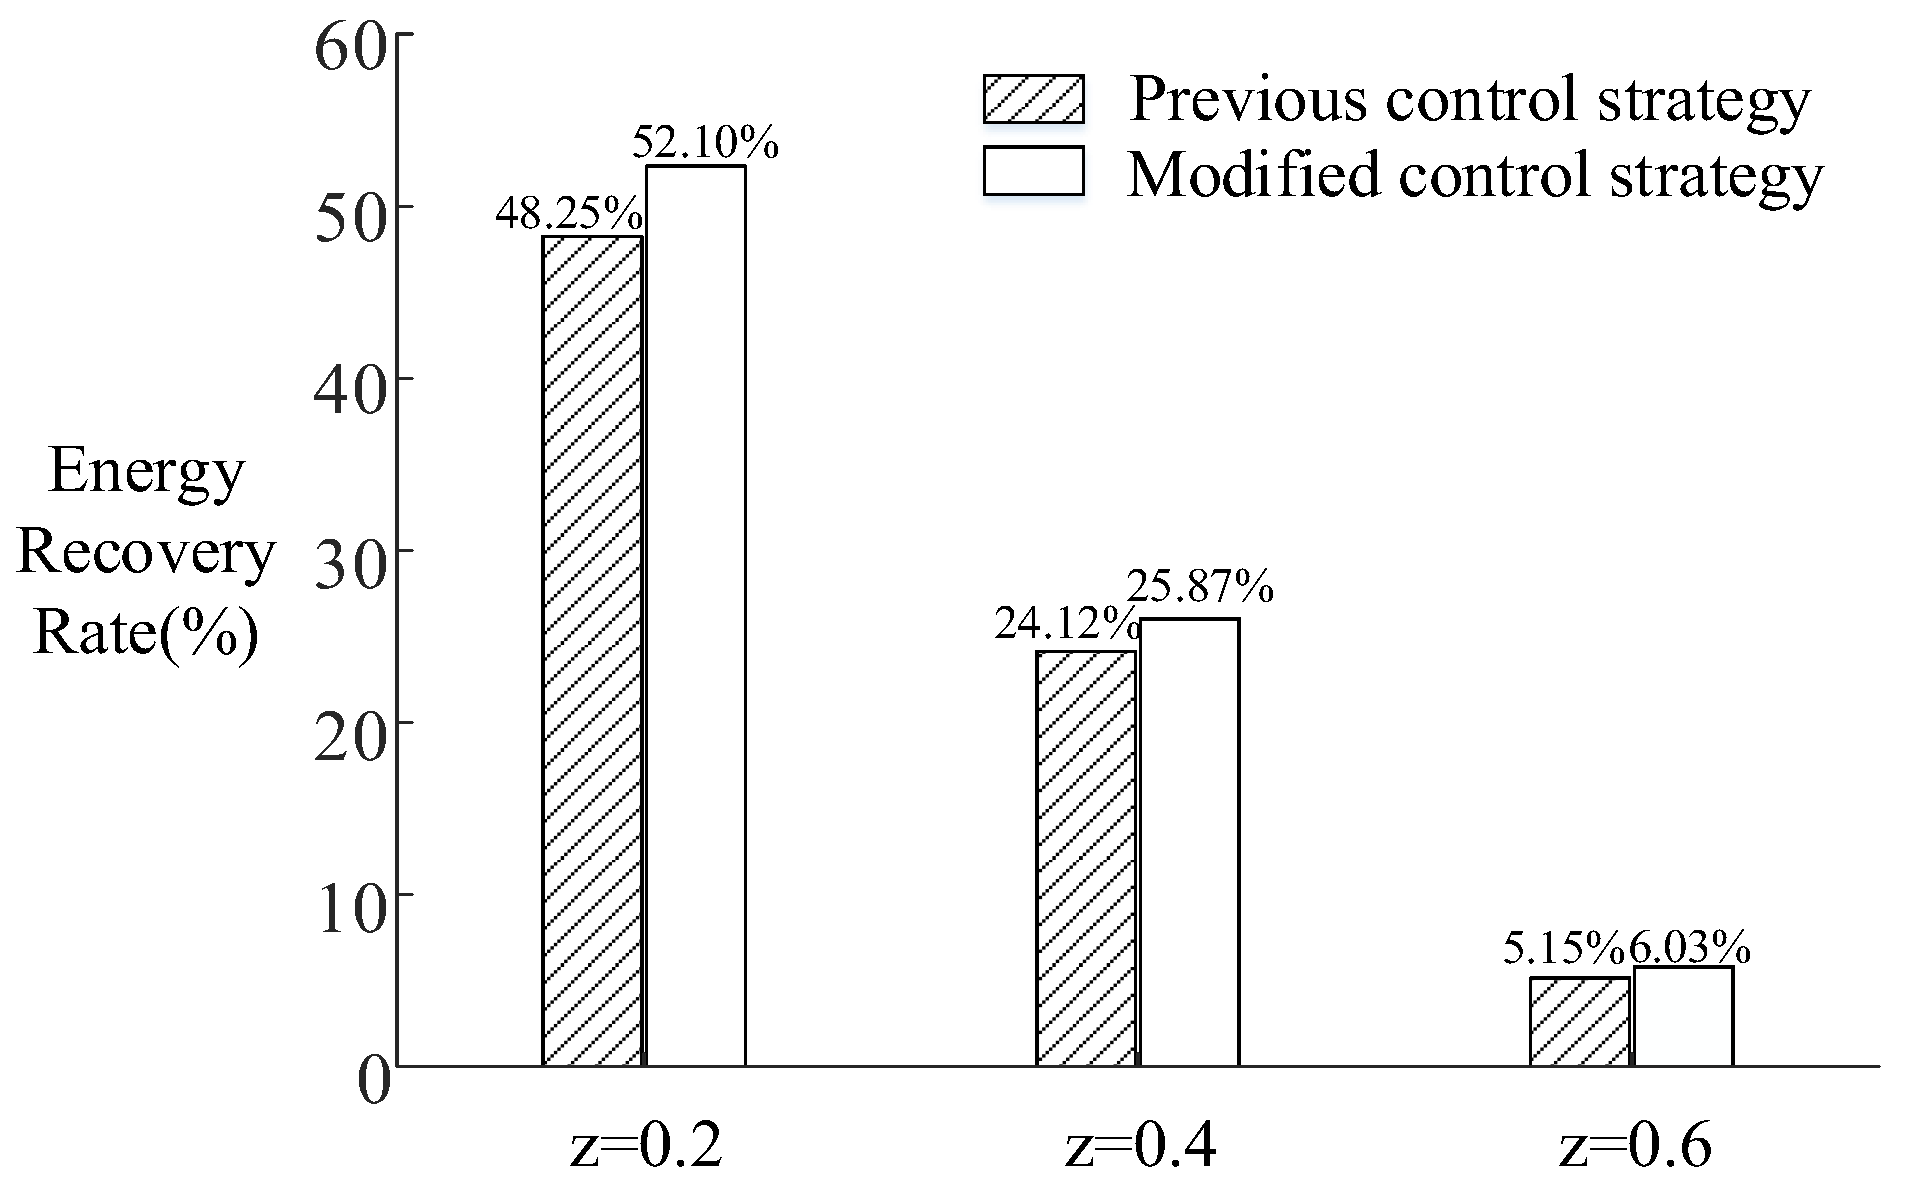
The simulations are performed at the initial speed of 100 km/h and the braking strength of 0.2, 0.4, and 0.6 respectively. The initial battery SOC is 0.7. The simulation results are shown in Figure 13 and Figure 14.
As can be seen from Figure 13, the motor braking power and system efficiency of modified control strategy under three typical braking conditions have been improved at different levels compared with the previous control strategy. The CVT ratio after revision is higher than before, indicating that the modified CVT ratio control strategy is more effective than the previous control strategy.
It can be seen from Figure 14 that since the braking time is shortening as the braking strength increases, the energy recovery rate is gradually reduced. The modified control strategy increases the energy recovery rate by 3.85, 1.75, and 0.88% respectively compared with the previous strategy.
5.2.2. Driving Cycle Simulation
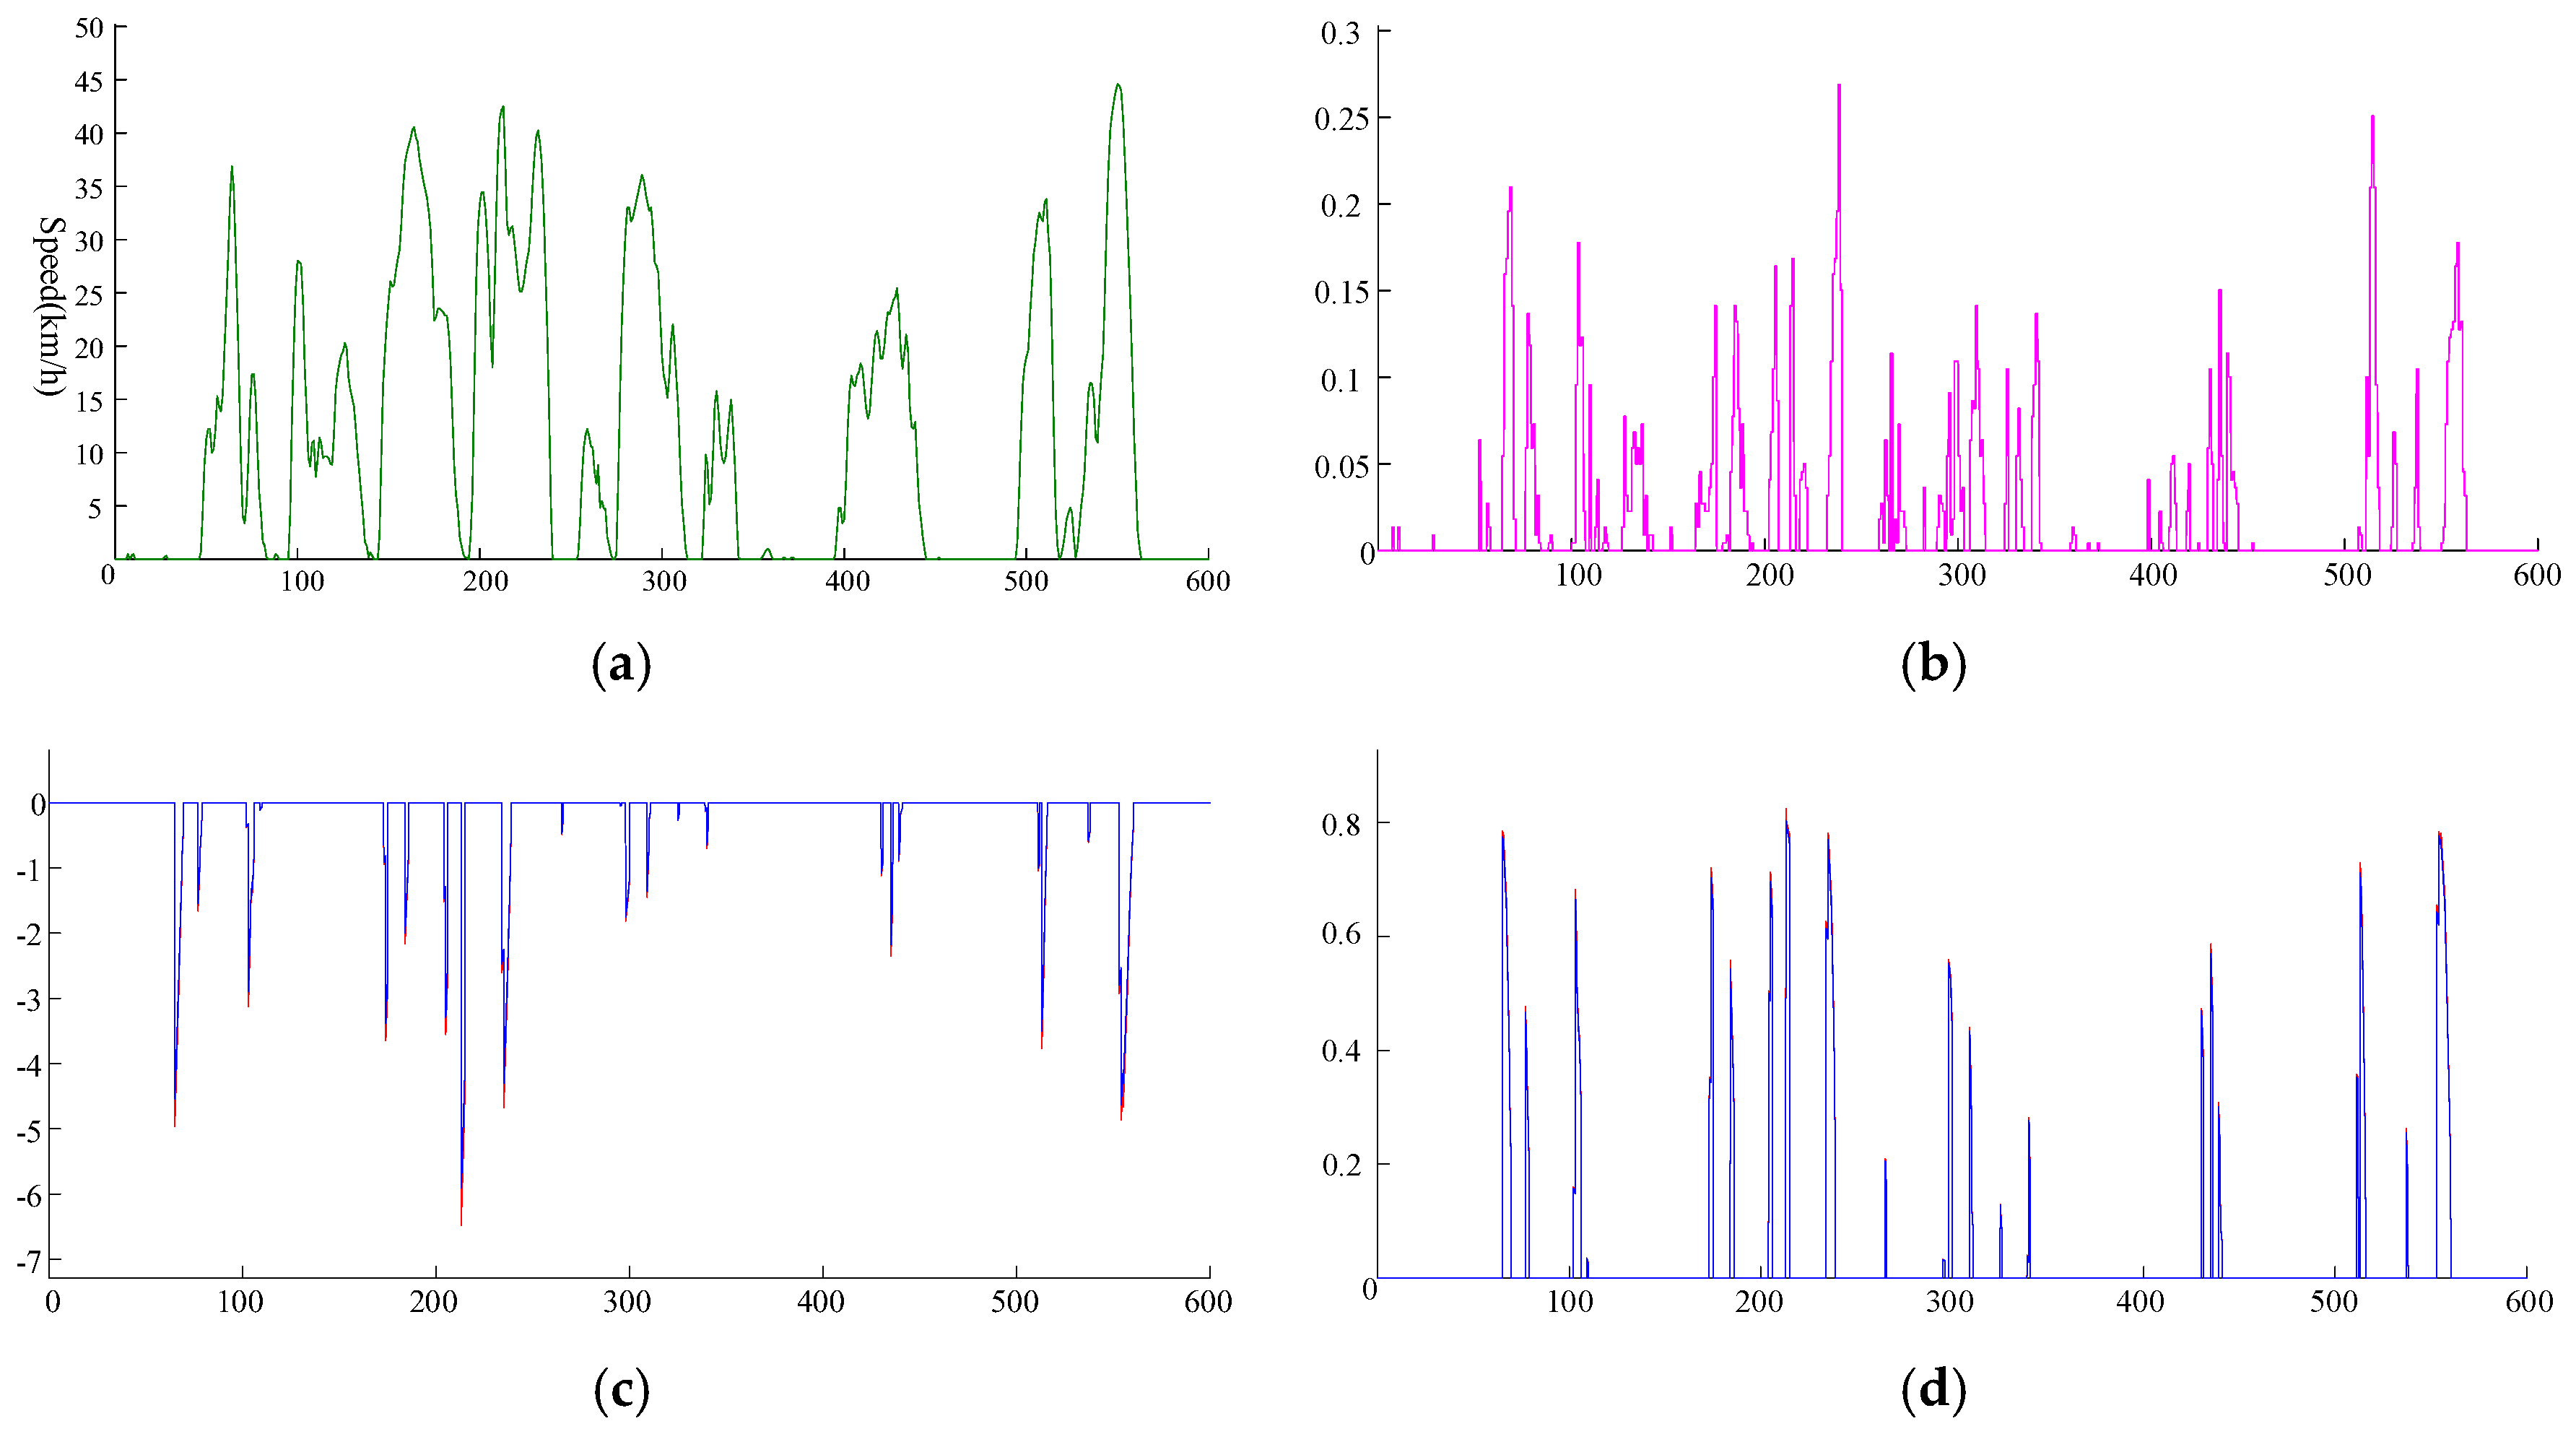
This study focuses on the CVT ratio control strategy which only acts on the front regenerative braking system. Hence, only the front regenerative braking system simulation results are shown for the convenience of verifying the CVT control strategy. Driving cycle simulations are performed under UDDS, NYCC, US06, since these driving cycles have relatively high braking strength so that the front regenerative braking system can be activated. The simulation results are shown in Figure 15, Figure 16, Figure 17, Figure 18 and Figure 19.
Take the UDDS simulation results for instance. Figure 16b shows that UDDS braking strength is between 0–0.15. Since the rear motor contributes most of the braking force when braking strength is less than 0.09 the braking power of the front motor cannot be fully utilized under UDDS. This can also be confirmed in Figure 16c that the maximum braking power of front motor is less than 8 kW during the entire driving cycle. Figure 16c shows that front motor regenerative braking power is increased compared with the strategy without compensation. This is because the front motor has been compensated for braking torque and has larger braking power than before. Figure 16d shows that the front motor has higher operating efficiency than before which can be more directly seen from Figure 18 which shows the motor operating points distributing closer to the optimal efficiency line. Therefore, the modified CVT ratio control strategy allows the motor to operate in a more efficient region. The same conclusions can be drawn from simulation results of NYCC and US06 as can be seen from Figure 16 and Figure 17.
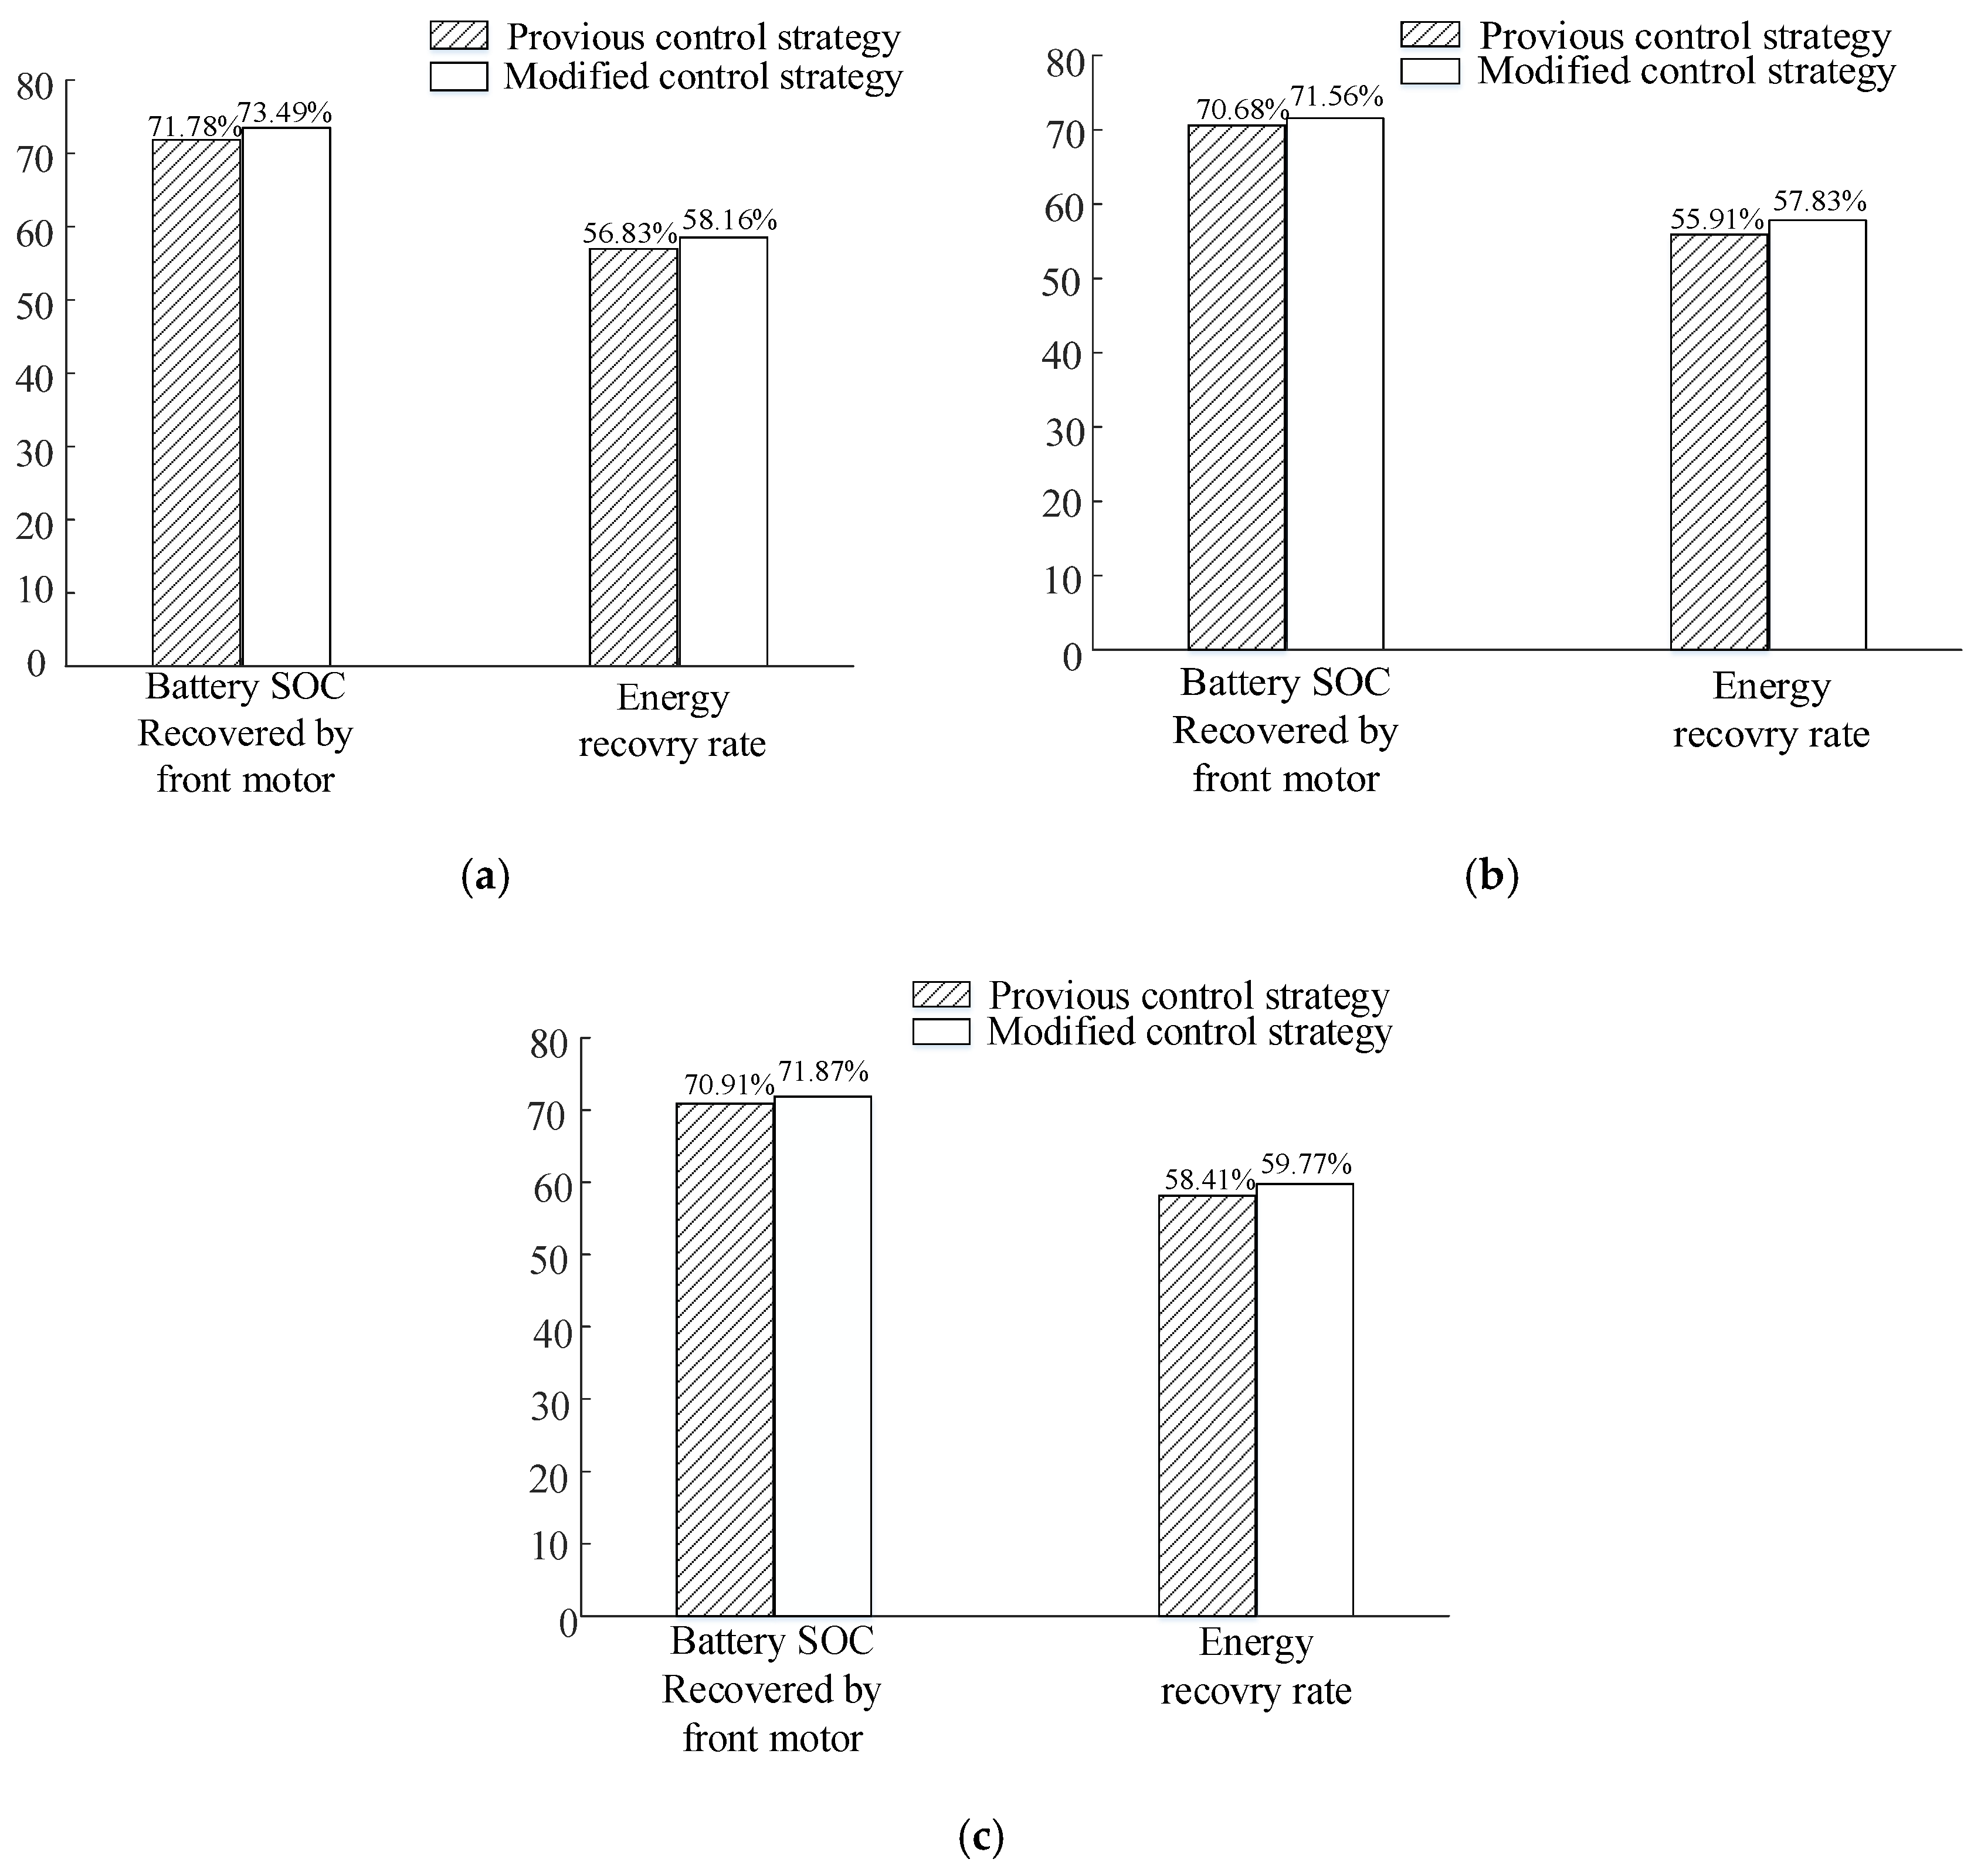
As can be seen from Figure 19, when the control strategy is performed under UDDS, the SOC recovered by the front motor is 1.78% before modification and 3.49% after modification. The energy recovery rate is 56.83% before modification and it is 58.16% after modification. The energy recovery rate increases by 1.33% after modification under UDDS. In addition, the energy recovery rate increases by 1.92% and 1.63% under NYCC and US06, respectively.
6. Conclusions
- (1).
- The theoretical model of CVT torque loss is established. The analysis shows that the CVT torque loss is related to its speed ratio, input torque, and input speed. Based on the CVT torque loss model, the battery–front motor–CVT joint efficiency model is established and the system optimal operating line is obtained.
- (2).
- To fully utilize the motor braking power, the front motor braking force compensatory strategy is proposed according to the relation between required braking force and front motor maximum braking force.
- (3).
- The optimal operating region of the regenerative braking system has changed after compensating braking force and considering the varying CVT efficiency. The previous CVT ratio control strategy is modified to ensure the system efficient operating.
- (4).
- Simulations are performed under three typical braking conditions and UDDS. The results show that the modified control strategy increases the front motor braking power and improves the system operating efficiency. The energy recovery rate is increased.
Acknowledgments
The research is supported by: (1) the National Natural Science Foundation of China (51575063); (2) the Chongqing Significant Application and Development Planning Project (cstc2015yykfC60003). The authors would also like to acknowledge the support from the State Key Laboratory of Mechanical Transmission of Chongqing University, China. The authors are indebted to the people who have helped to improve the paper.
Author Contributions
Yang Yang conceived the research idea and proposed the research methods. Xiaolong He established the models and conducted the simulations. Yi Zhang and Datong Qin analyzed the simulation data. Xiaolong He wrote the paper.
Conflicts of Interest
The authors declare no conflict of interest.
References
- Sovran, G.; Blaser, D. Quanlifying the Potential Impacts of Regenerative Braking on a Vehicle’s Tractive Fuel Consumption for the U.S., European, and Japanese Driving Schedules. In Proceedings of the SAE 2006 World Congress & Exhibition, Detroit, MI, USA, 3–6 April 2006. [Google Scholar]
- Kim, D.; Kim, H. Vehicle stability control with regenerative braking and electronic brake force distribution for a four-wheel drive hybrid electric vehicle. Proc. Inst. Mech. Eng. Part D J. Autom. Eng. 2006, 220, 683–693. [Google Scholar] [CrossRef]
- Wyczalk, F.A. Regenerative Braking Concepts for Electric Vehicle-A Primer. In Proceedings of the International Congress & Exposition 1992, Montreal, QC, Canada, 18–23 October 1992. [Google Scholar]
- Zhang, J.; Li, Y.; Lv, C.; Yuan, Y. New Regenerative Braking Control Strategy for Rear-driven Electrified Minivans. Energy Convers. Manag. 2014, 82, 135–145. [Google Scholar]
- Shu, H.; Qin, D.; Hu, M. Regenerative Braking Energy Management Strategy for Mild Hybrid Electric Vehicles. Chin. J. Mech. Eng. 2009, 45, 167–173. [Google Scholar] [CrossRef]
- Xu, G.; Li, W.; Xu, K.; Song, Z. An Intelligent Regenerative Braking Strategy for Electric Vehicles. Energies 2011, 4, 1461–1477. [Google Scholar] [CrossRef]
- Yeo, H.; Hwang, S.; Kim, H. Regenerative braking algorithm for a hybrid electric vehicle with CVT ratio control. Proc. Inst. Mech. Eng. Part D J. Autom. Eng. 2006, 220, 1589–1600. [Google Scholar] [CrossRef]
- Deng, T.; Lin, C.; Chen, B.; Ma, C. Regenerative Braking Control Strategy Based on Joint High-Efficiency Optimization. Adv. Mech. Eng. 2016, 8, 1–12. [Google Scholar] [CrossRef]
- Li, L.; Li, X.; Wang, X.; Song, J.; Li, C. Analysis of Downshift’s Improvement to Energy Efficiency of an Electric Vehicle during Regenerative Braking. Appl. Energy 2016, 176, 125–137. [Google Scholar] [CrossRef]
- Li, L.; Wang, X.; Xiong, R.; He, K.; Li, X. AMT Downshifting Strategy Design of HEV during Regenerative Braking Process for Energy Conservation. Appl. Energy 2016, 183, 914–925. [Google Scholar] [CrossRef]
- Akehurst, S.; Vaughan, N.D.; Parker, D.A. Modeling of loss mechanisms in a pushing metal V-belt continuously variable transmission. Part 1: Torque loss due to band friction. Proc. Inst. Mech. Eng. Part D J. Autom. Eng. 2004, 218, 1269–1281. [Google Scholar] [CrossRef]
- Akehurst, S.; Vaughan, N.D.; Parker, D.A. Modeling of loss mechanisms in a pushing metal V-belt continuously variable transmission. Part 2: Pulley deflection losses and total torque loss validation. Proc. Inst. Mech. Eng. Part D J. Autom. Eng. 2004, 218, 1283–1293. [Google Scholar] [CrossRef]
- Akehurst, S.; Vaughan, N.D.; Parker, D.A.; Simner, D. Modeling of loss mechanisms in a pushing metal V-belt continuously variable transmission. Part 3: Belt slip losses. Proc. Inst. Mech. Eng. Part D J. Autom. Eng. 2004, 218, 1295–1306. [Google Scholar] [CrossRef]
Figure 1.
Configuration of the hybrid electric vehicle.

Figure 2.
Geometry of bands and segments travelling in a wrap angle.
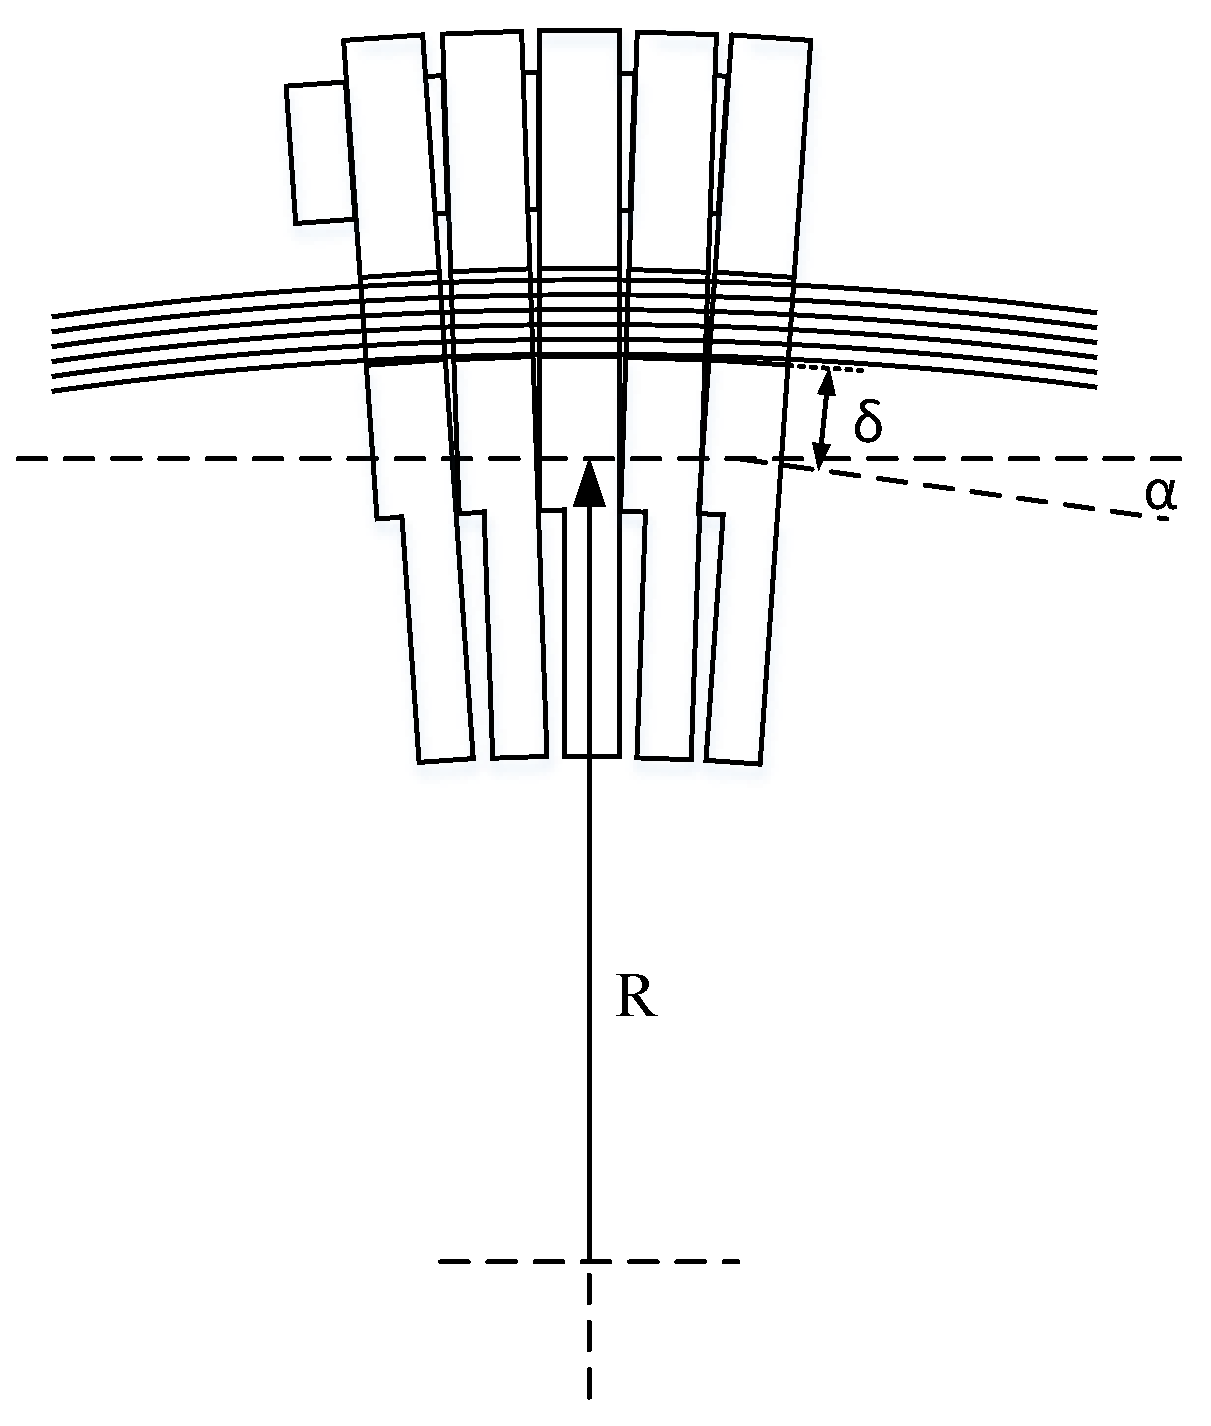
Figure 3.
Geometry of a deformed pulley.
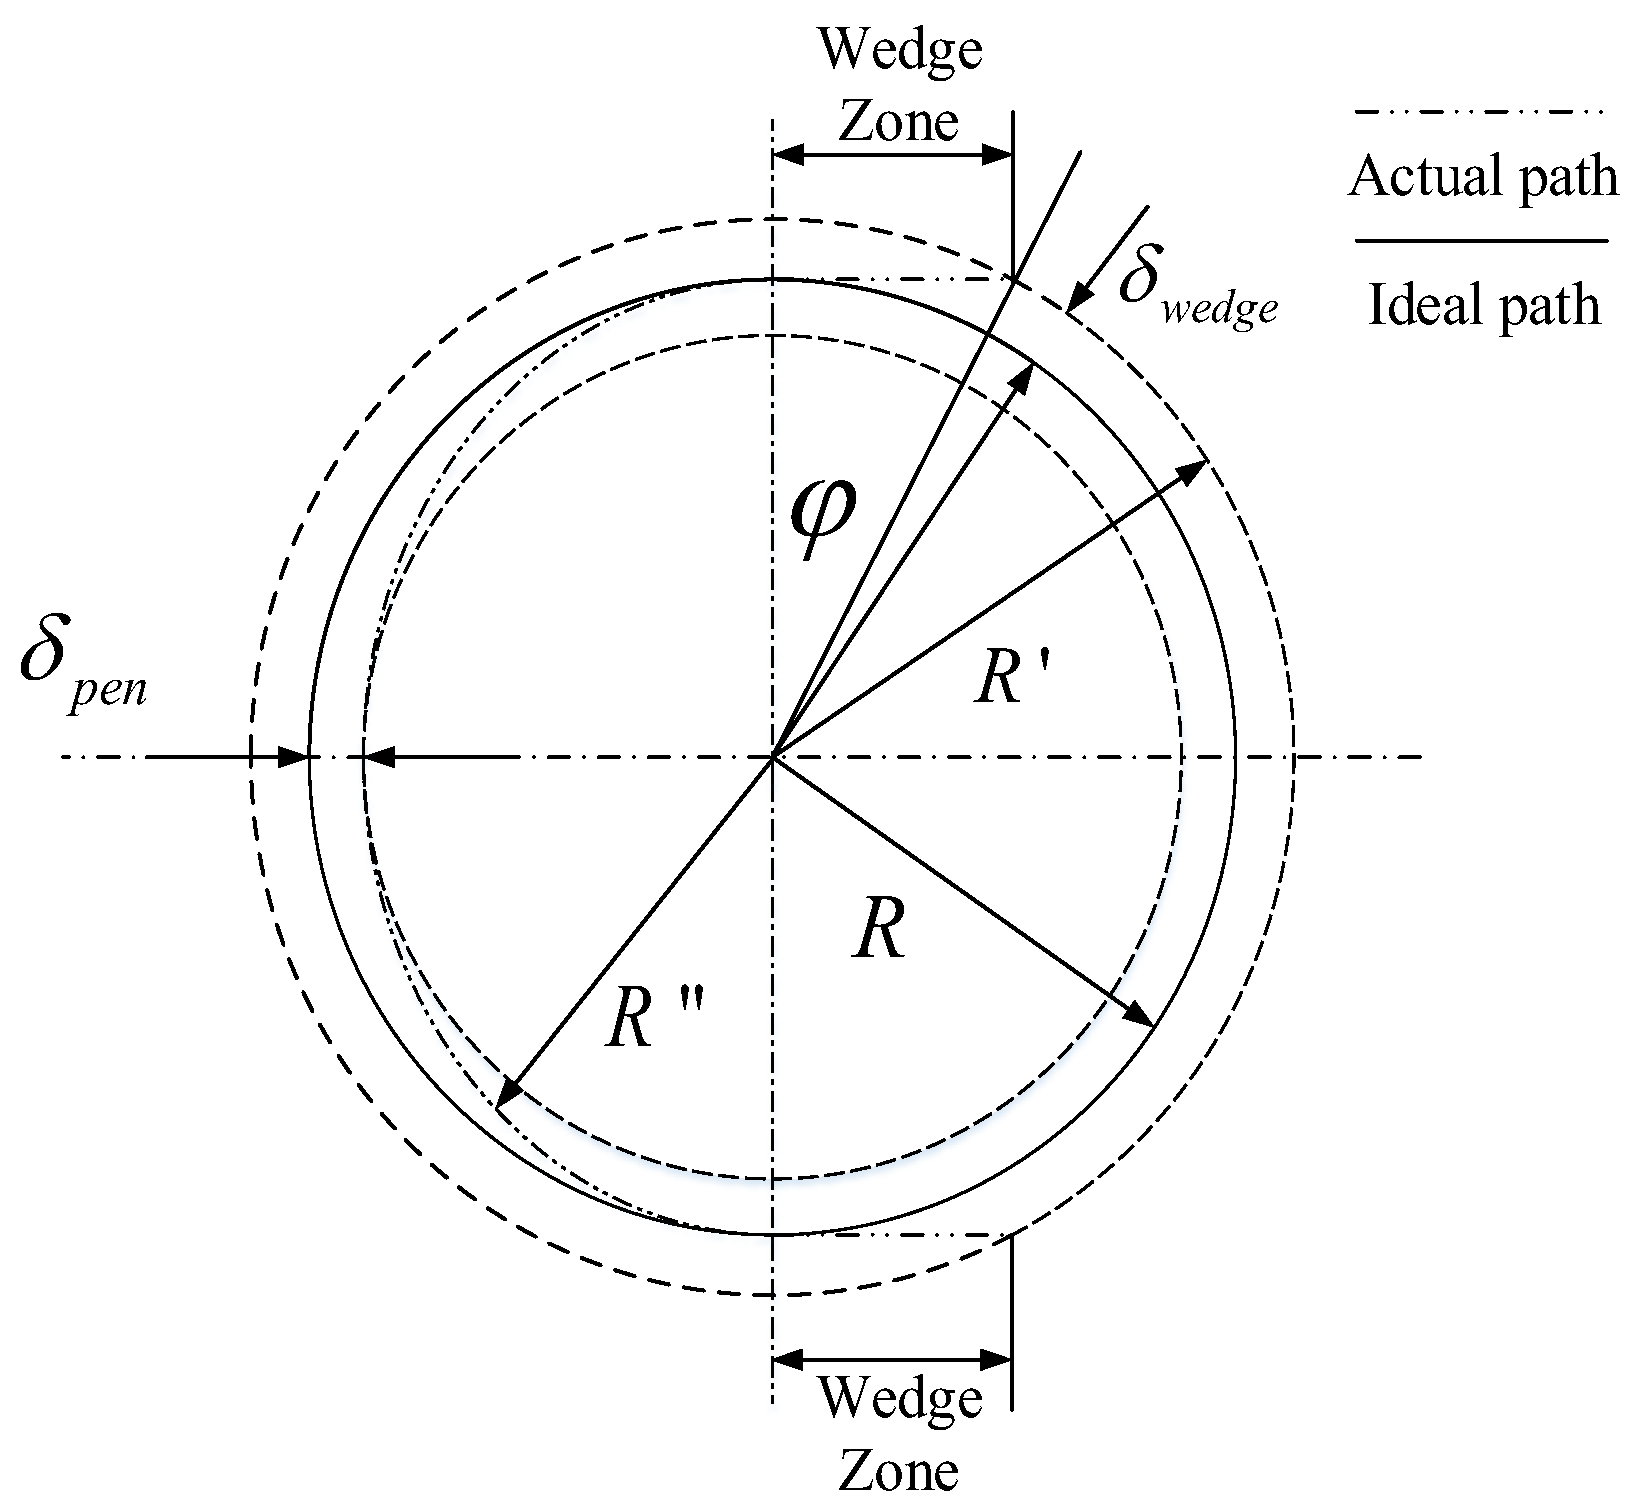
Figure 4.
CVT torque loss map.
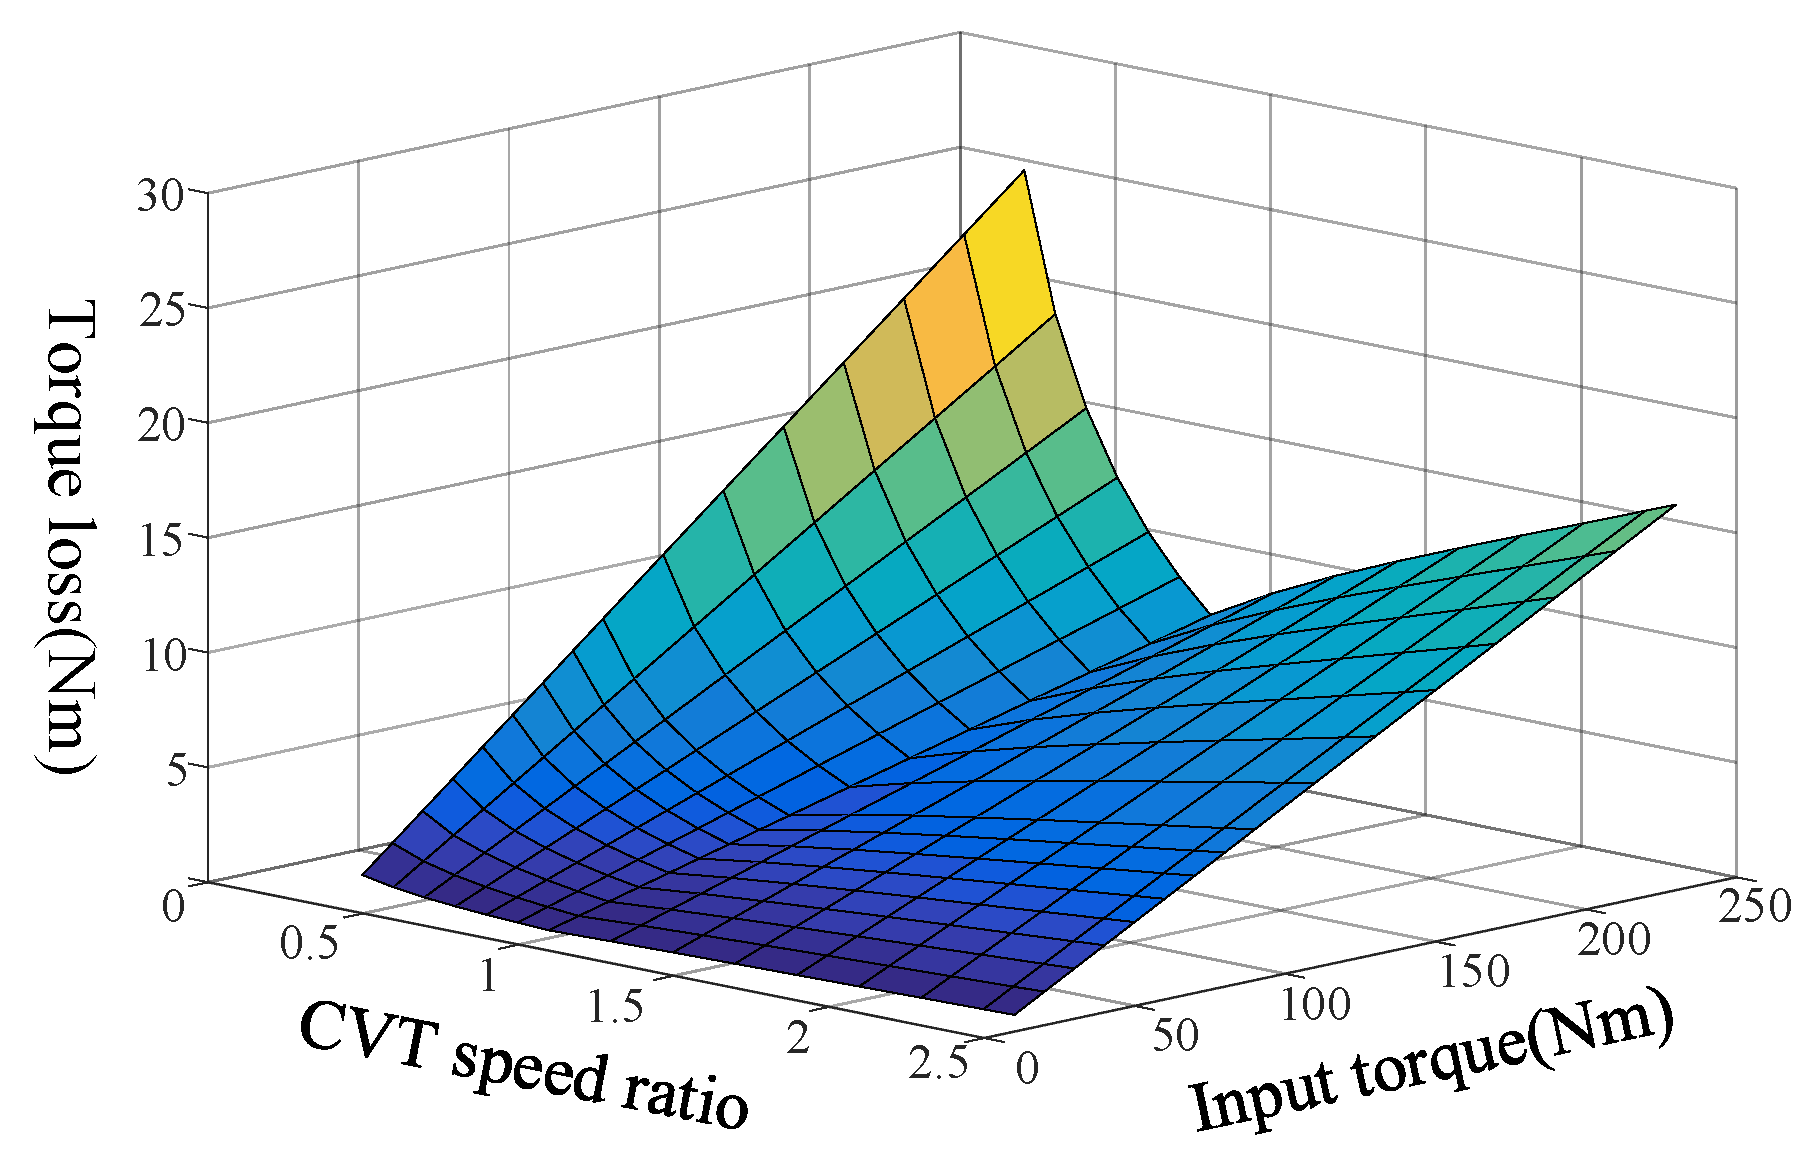
Figure 5.
CVT efficiency map.
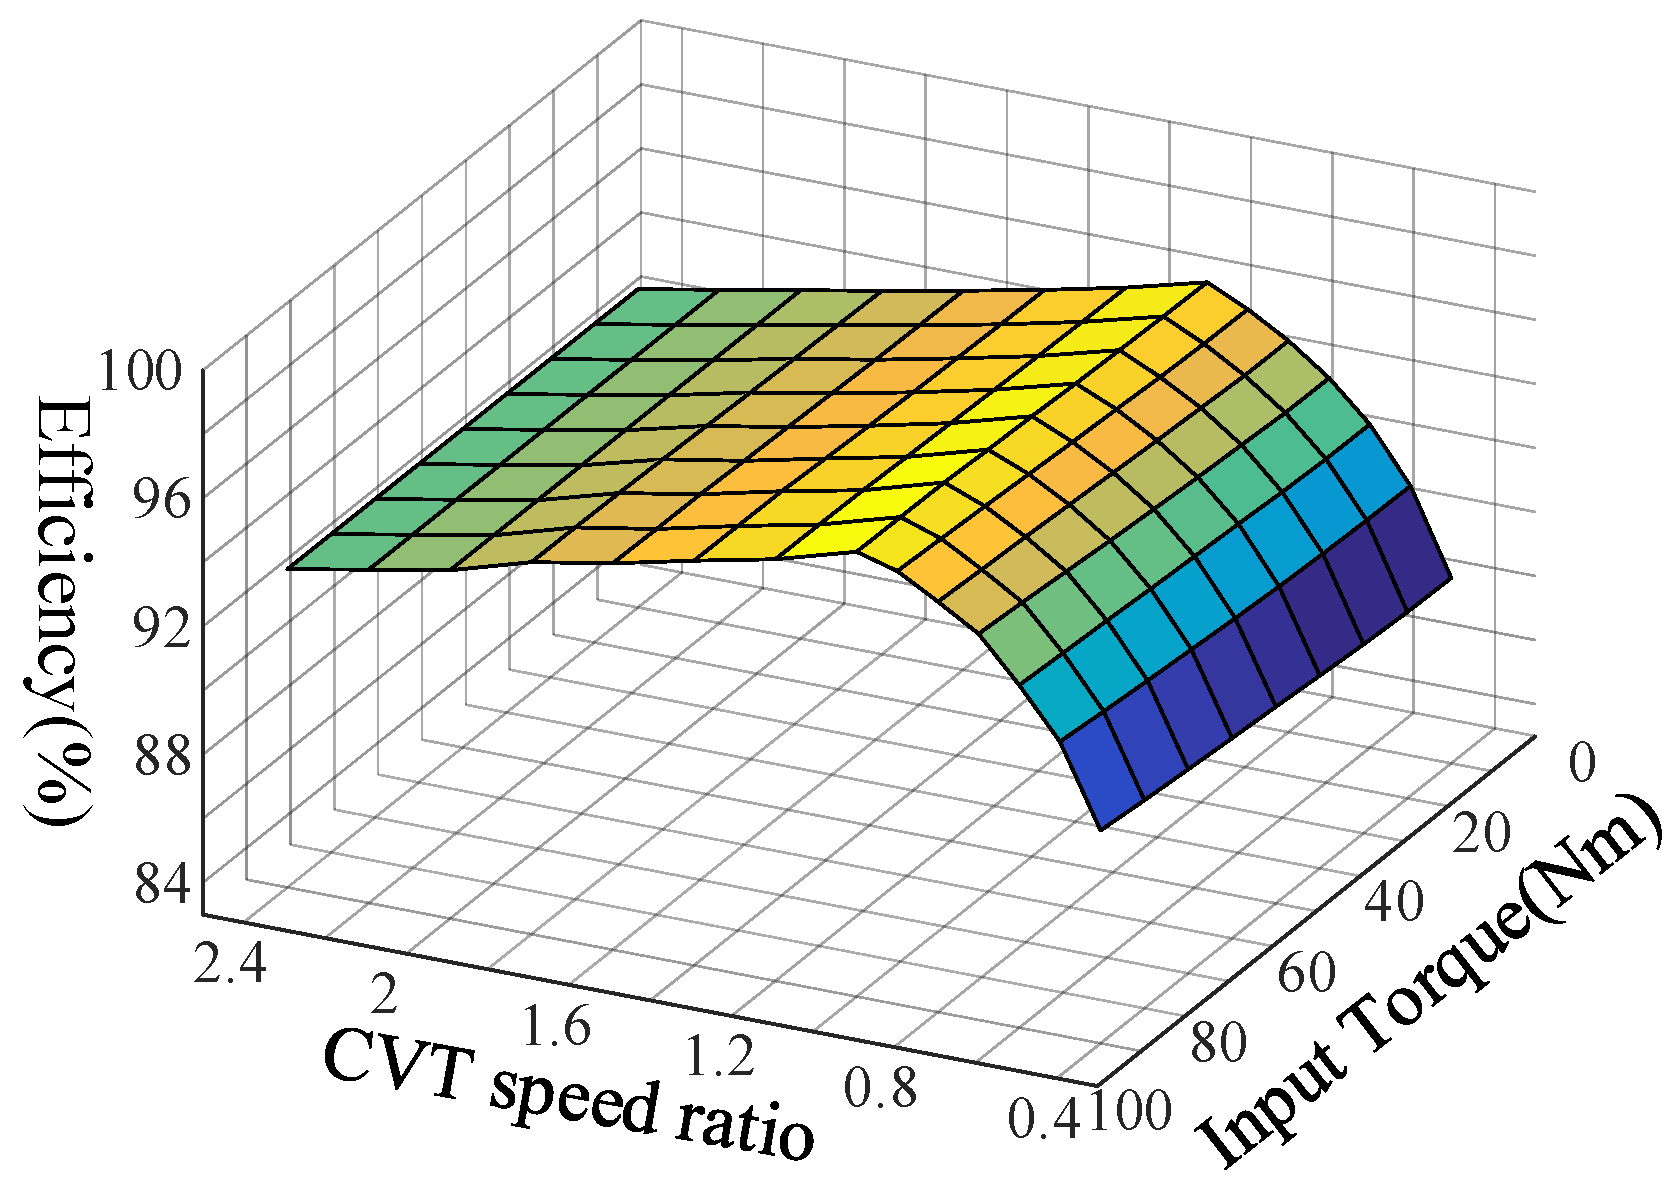
Figure 6.
Motor and battery charging efficiency. (a) Front motor operating efficiency; (b) Rear motor operating efficiency; (c) Battery charging efficiency.
Figure 6.
Motor and battery charging efficiency. (a) Front motor operating efficiency; (b) Rear motor operating efficiency; (c) Battery charging efficiency.
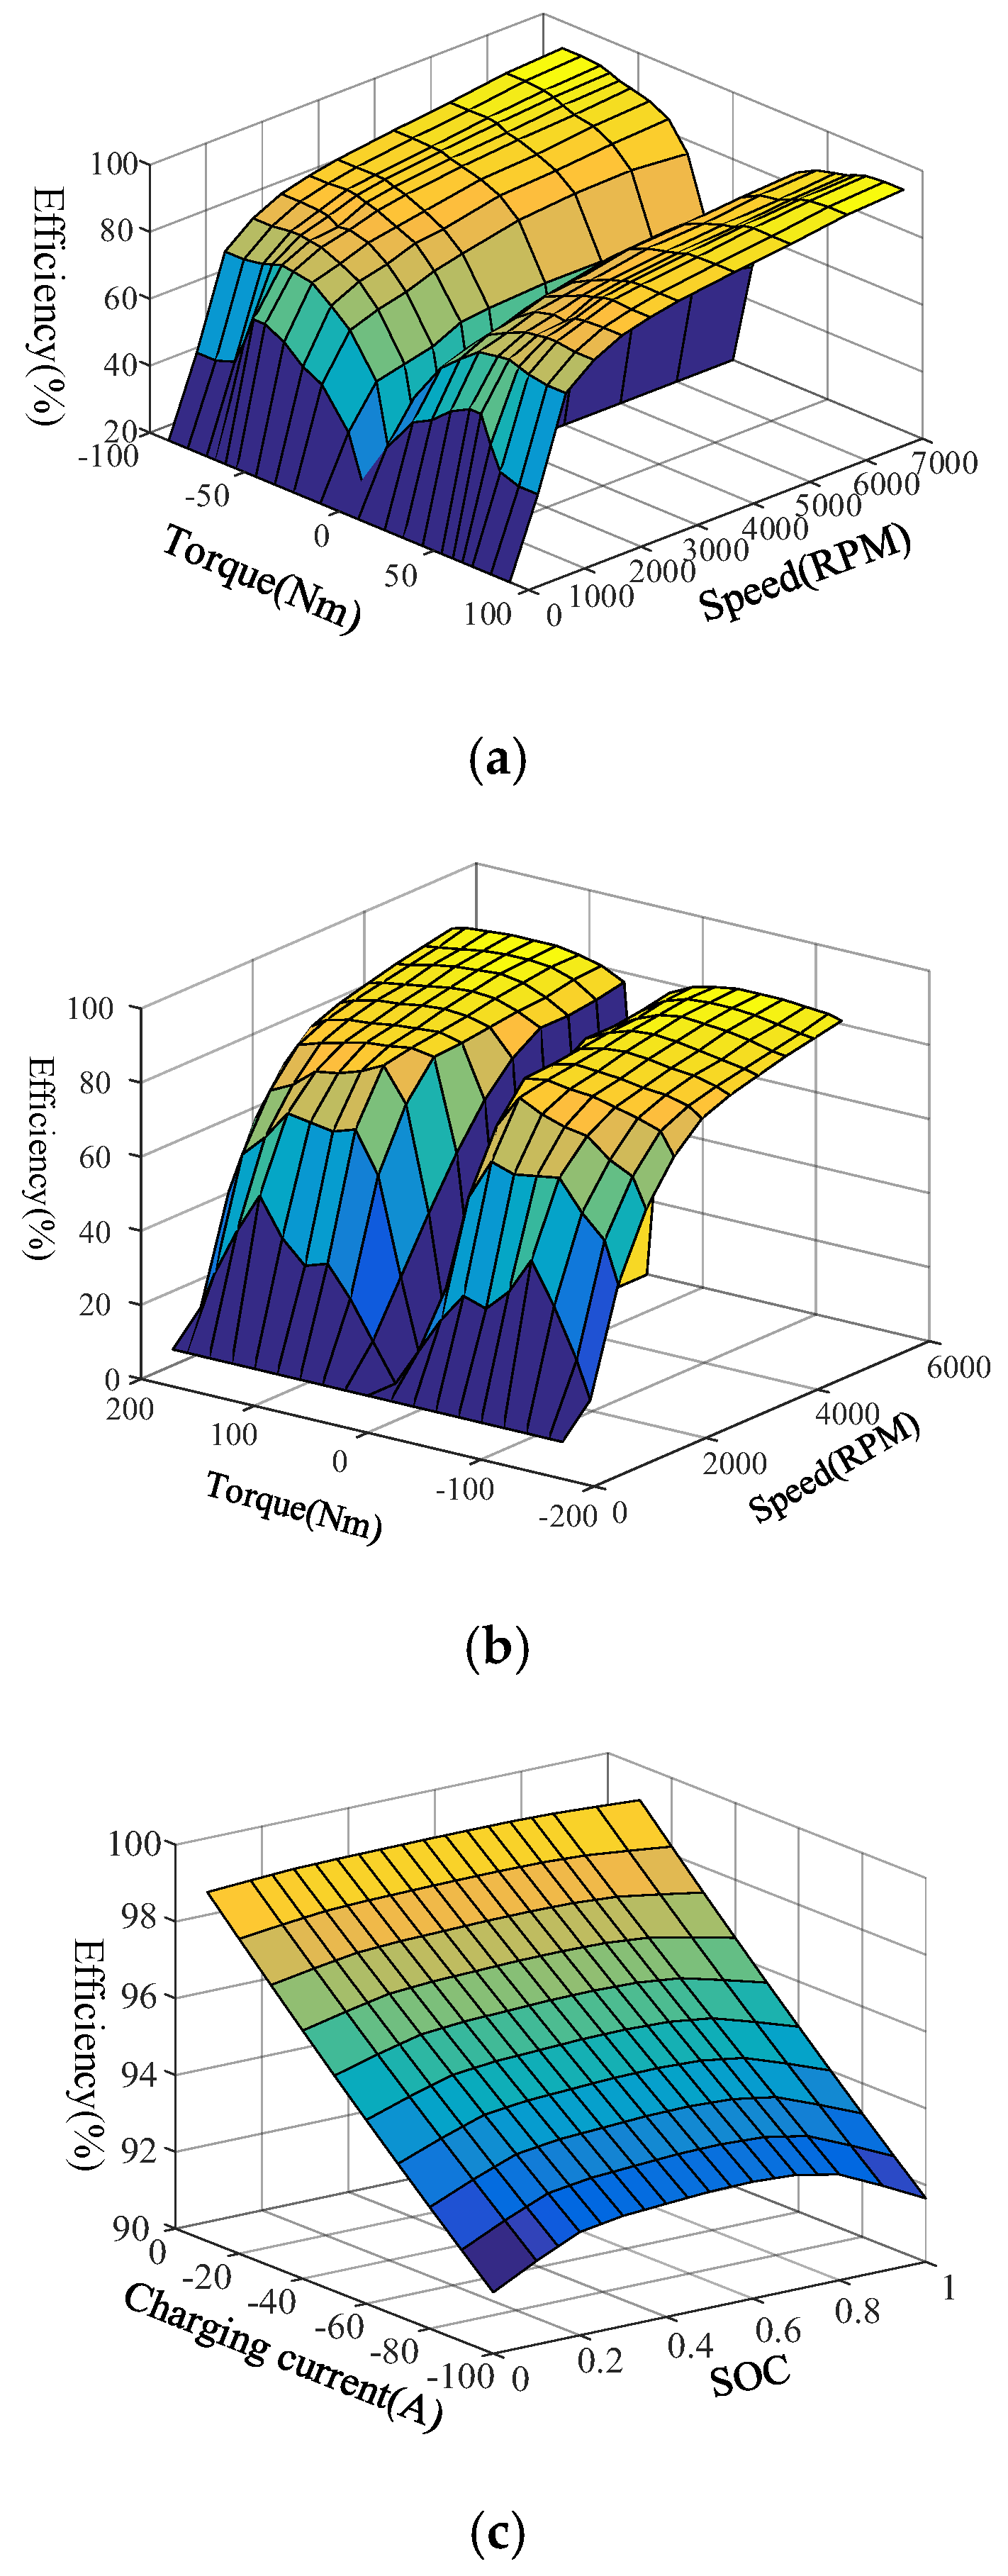
Figure 7.
Battery–front motor–CVT joint efficiency map.
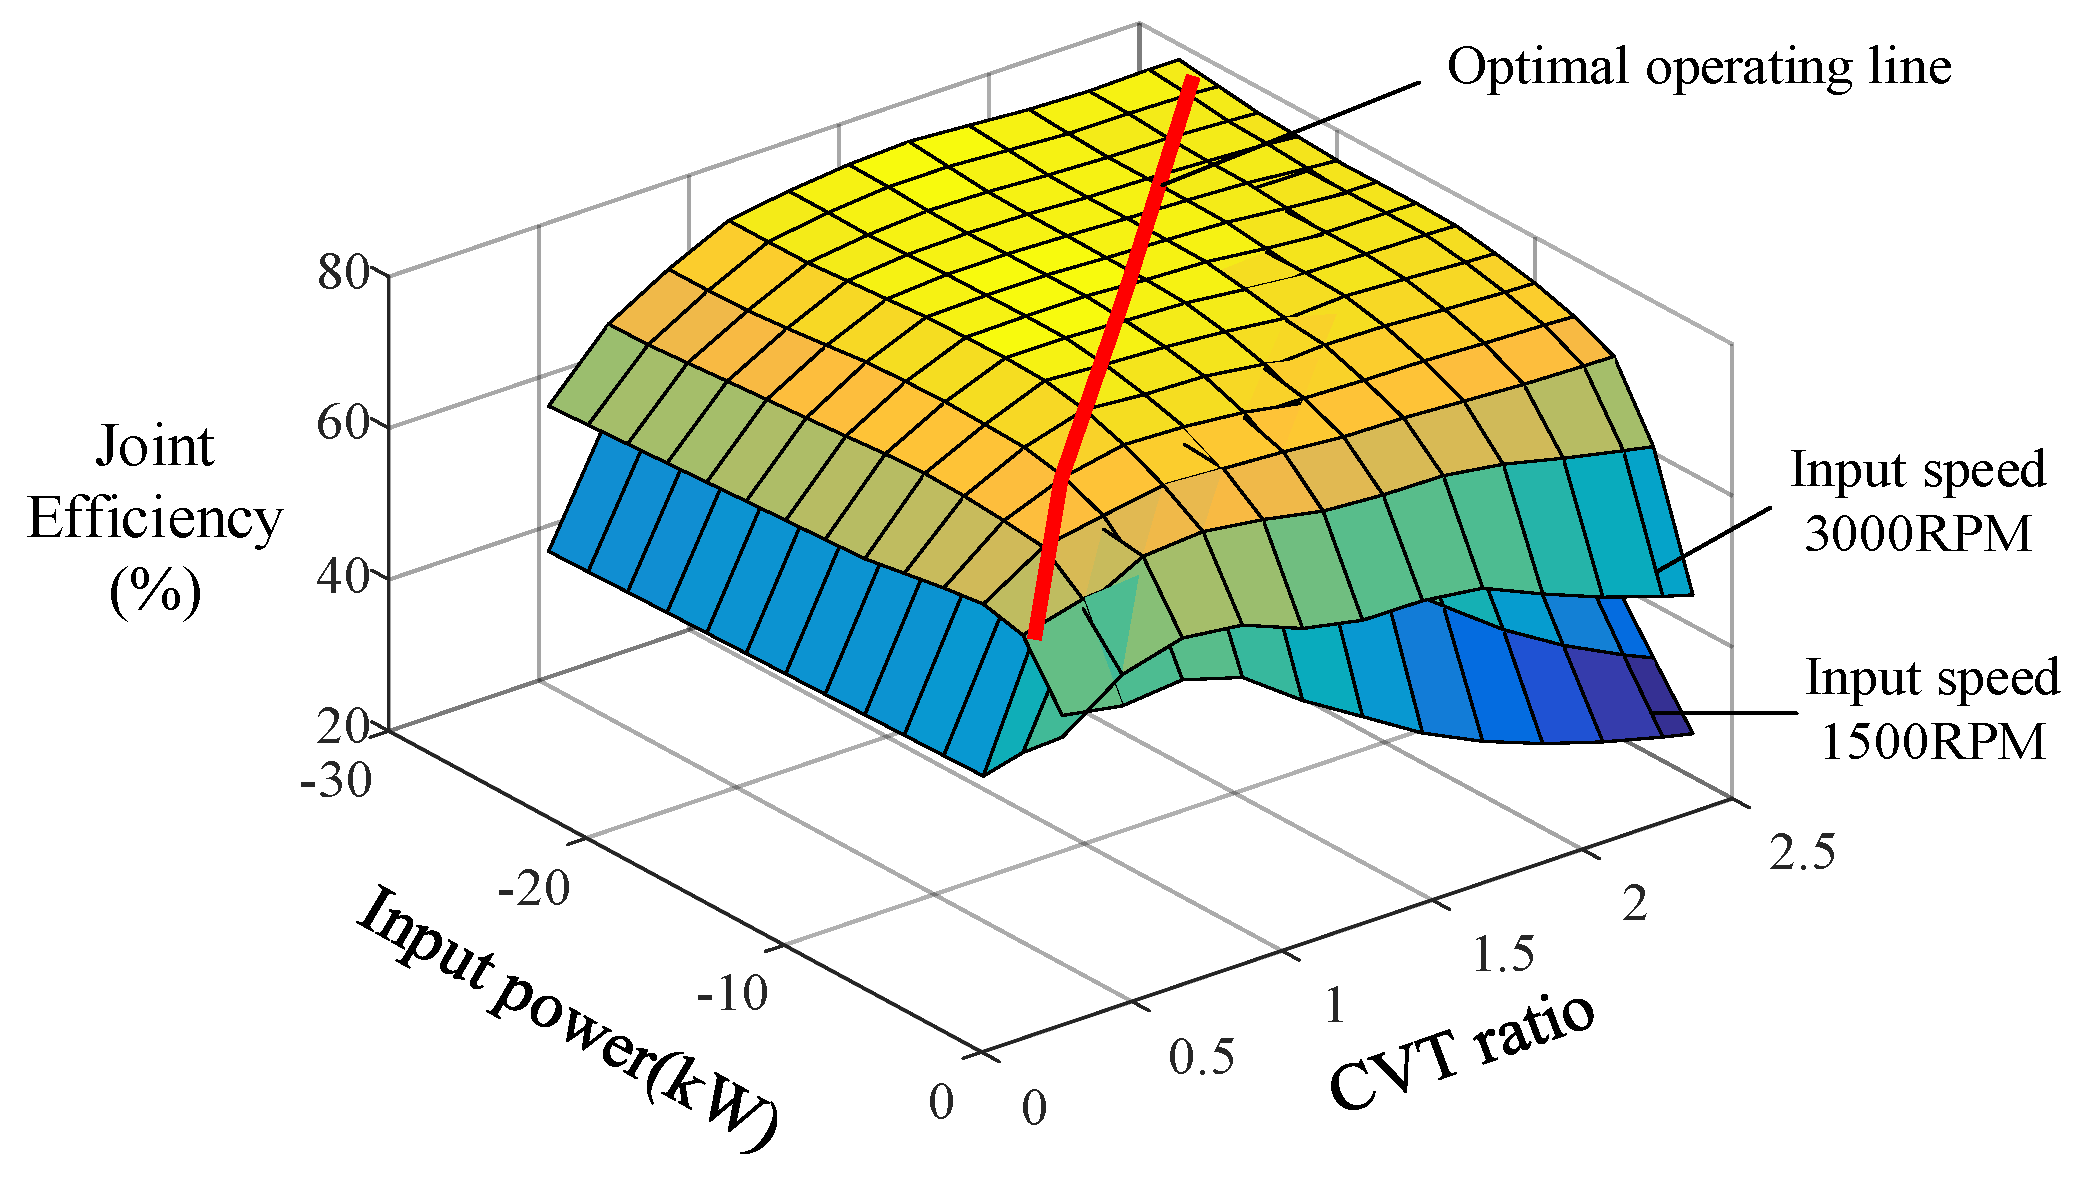
Figure 8.
Front and rear axle braking force distribution curve.
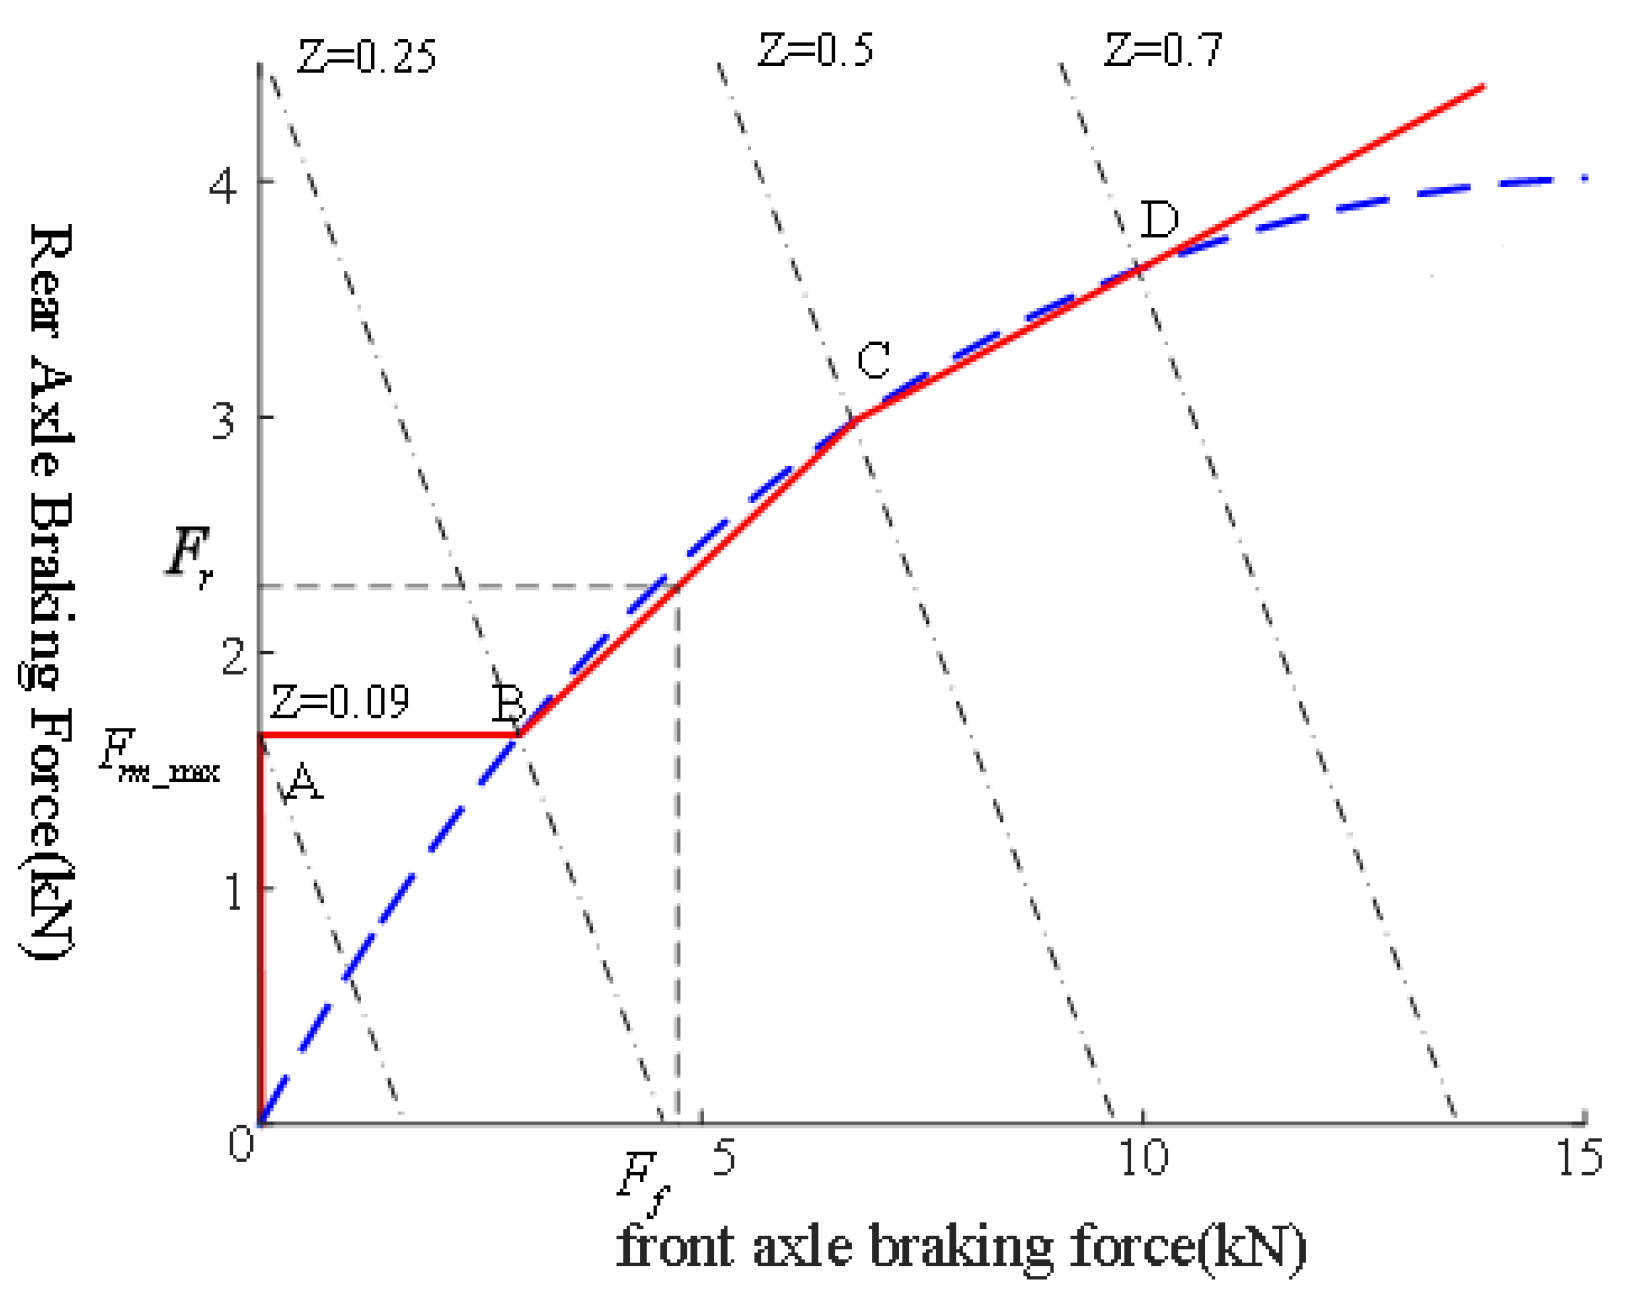
Figure 9.
Target CVT ratio calculation flow chart.

Figure 10.
CVT ratio map before and after modifying.
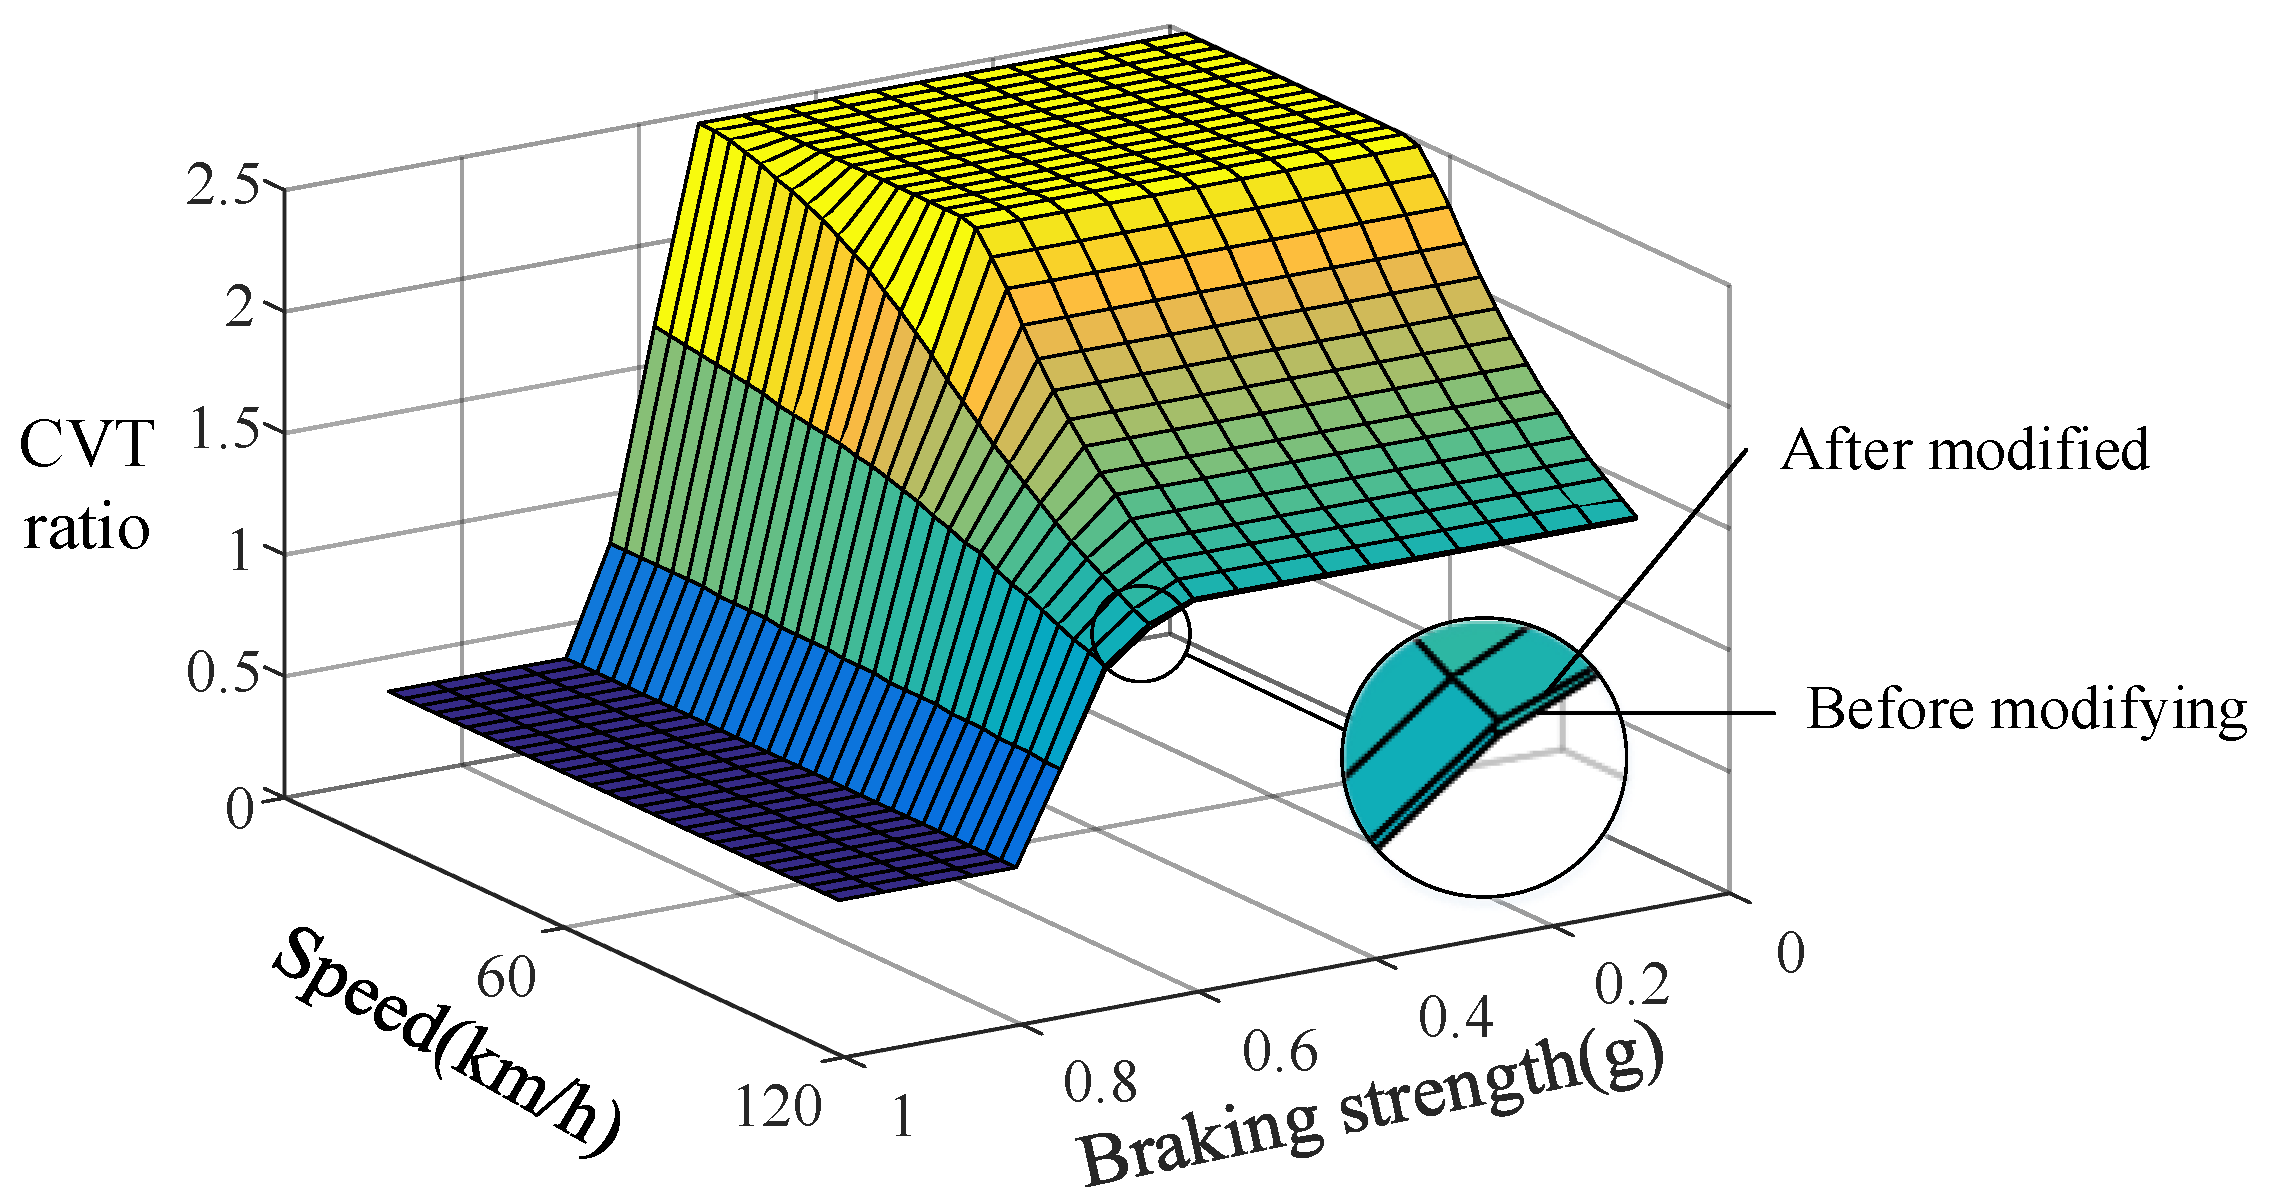
Figure 11.
Power differences before and after compensation.

Figure 12.
Diagram of backward simulation model.

Figure 13.
Simulation results in different braking strength.
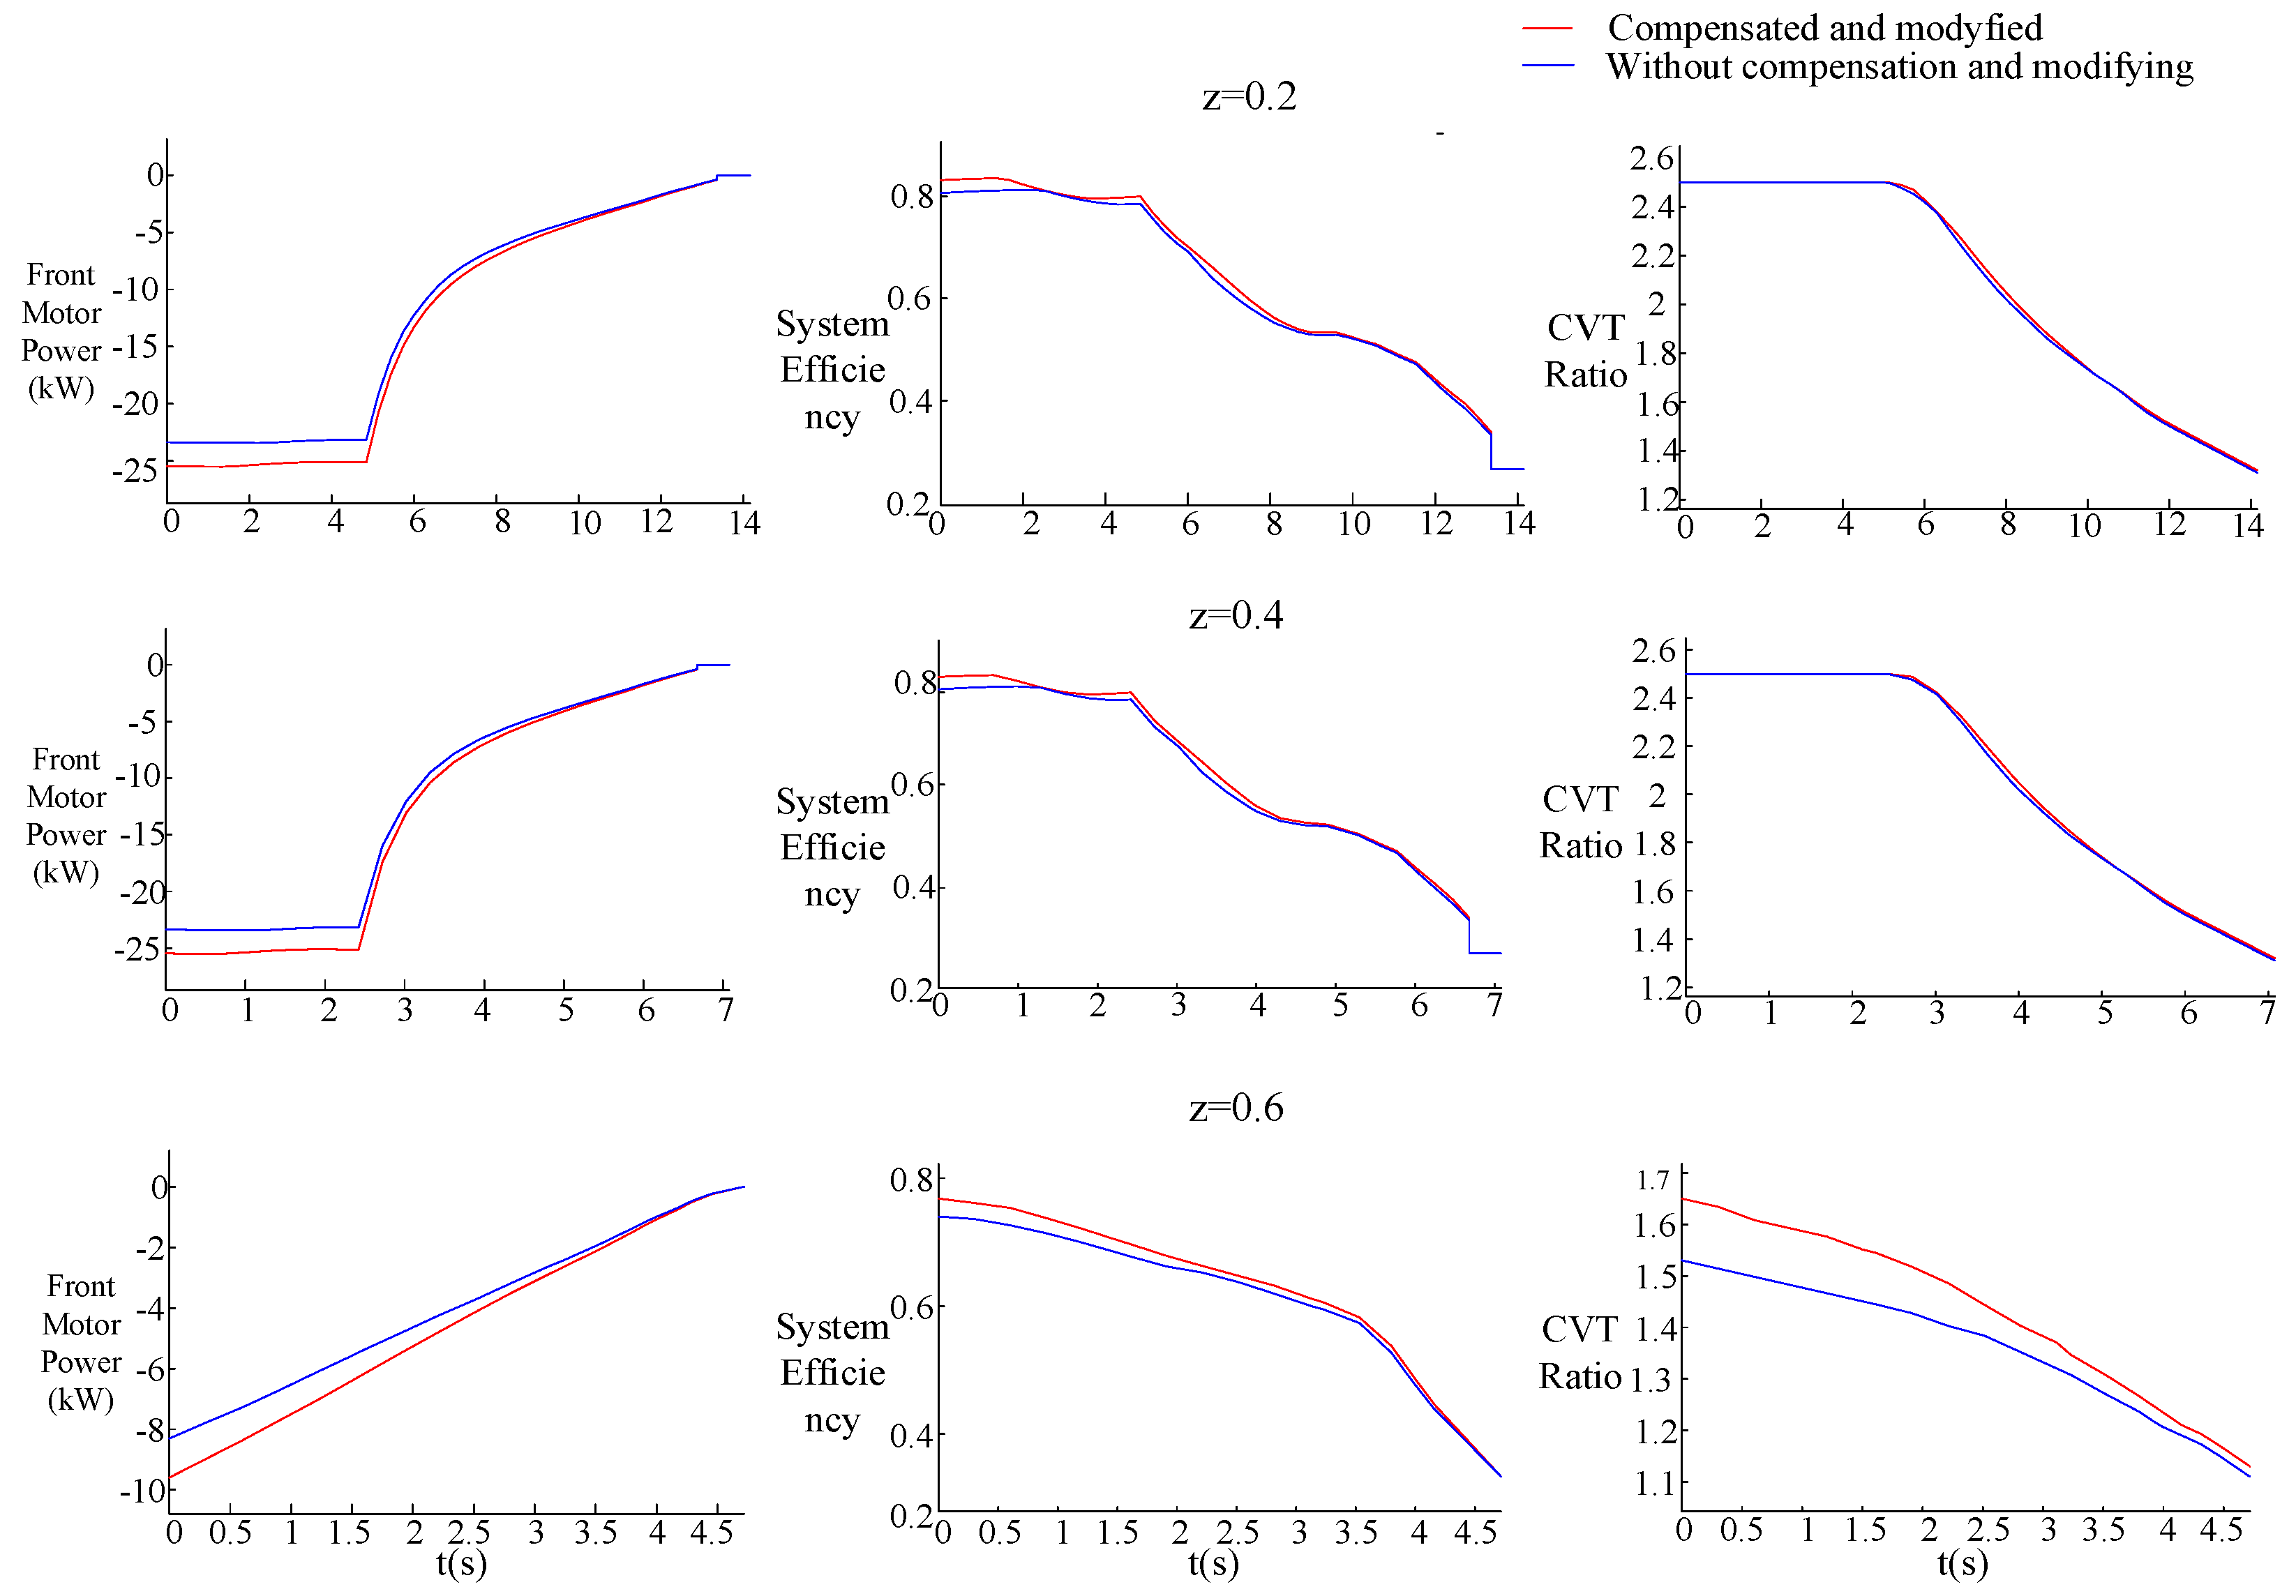
Figure 14.
Simulation results comparison under different braking densities.

Figure 15.
UDDS simulation results. (a) Vehicle speed; (b) Braking strength; (c) Front motor power; (d) Front regenerative braking system efficiency.
Figure 15.
UDDS simulation results. (a) Vehicle speed; (b) Braking strength; (c) Front motor power; (d) Front regenerative braking system efficiency.
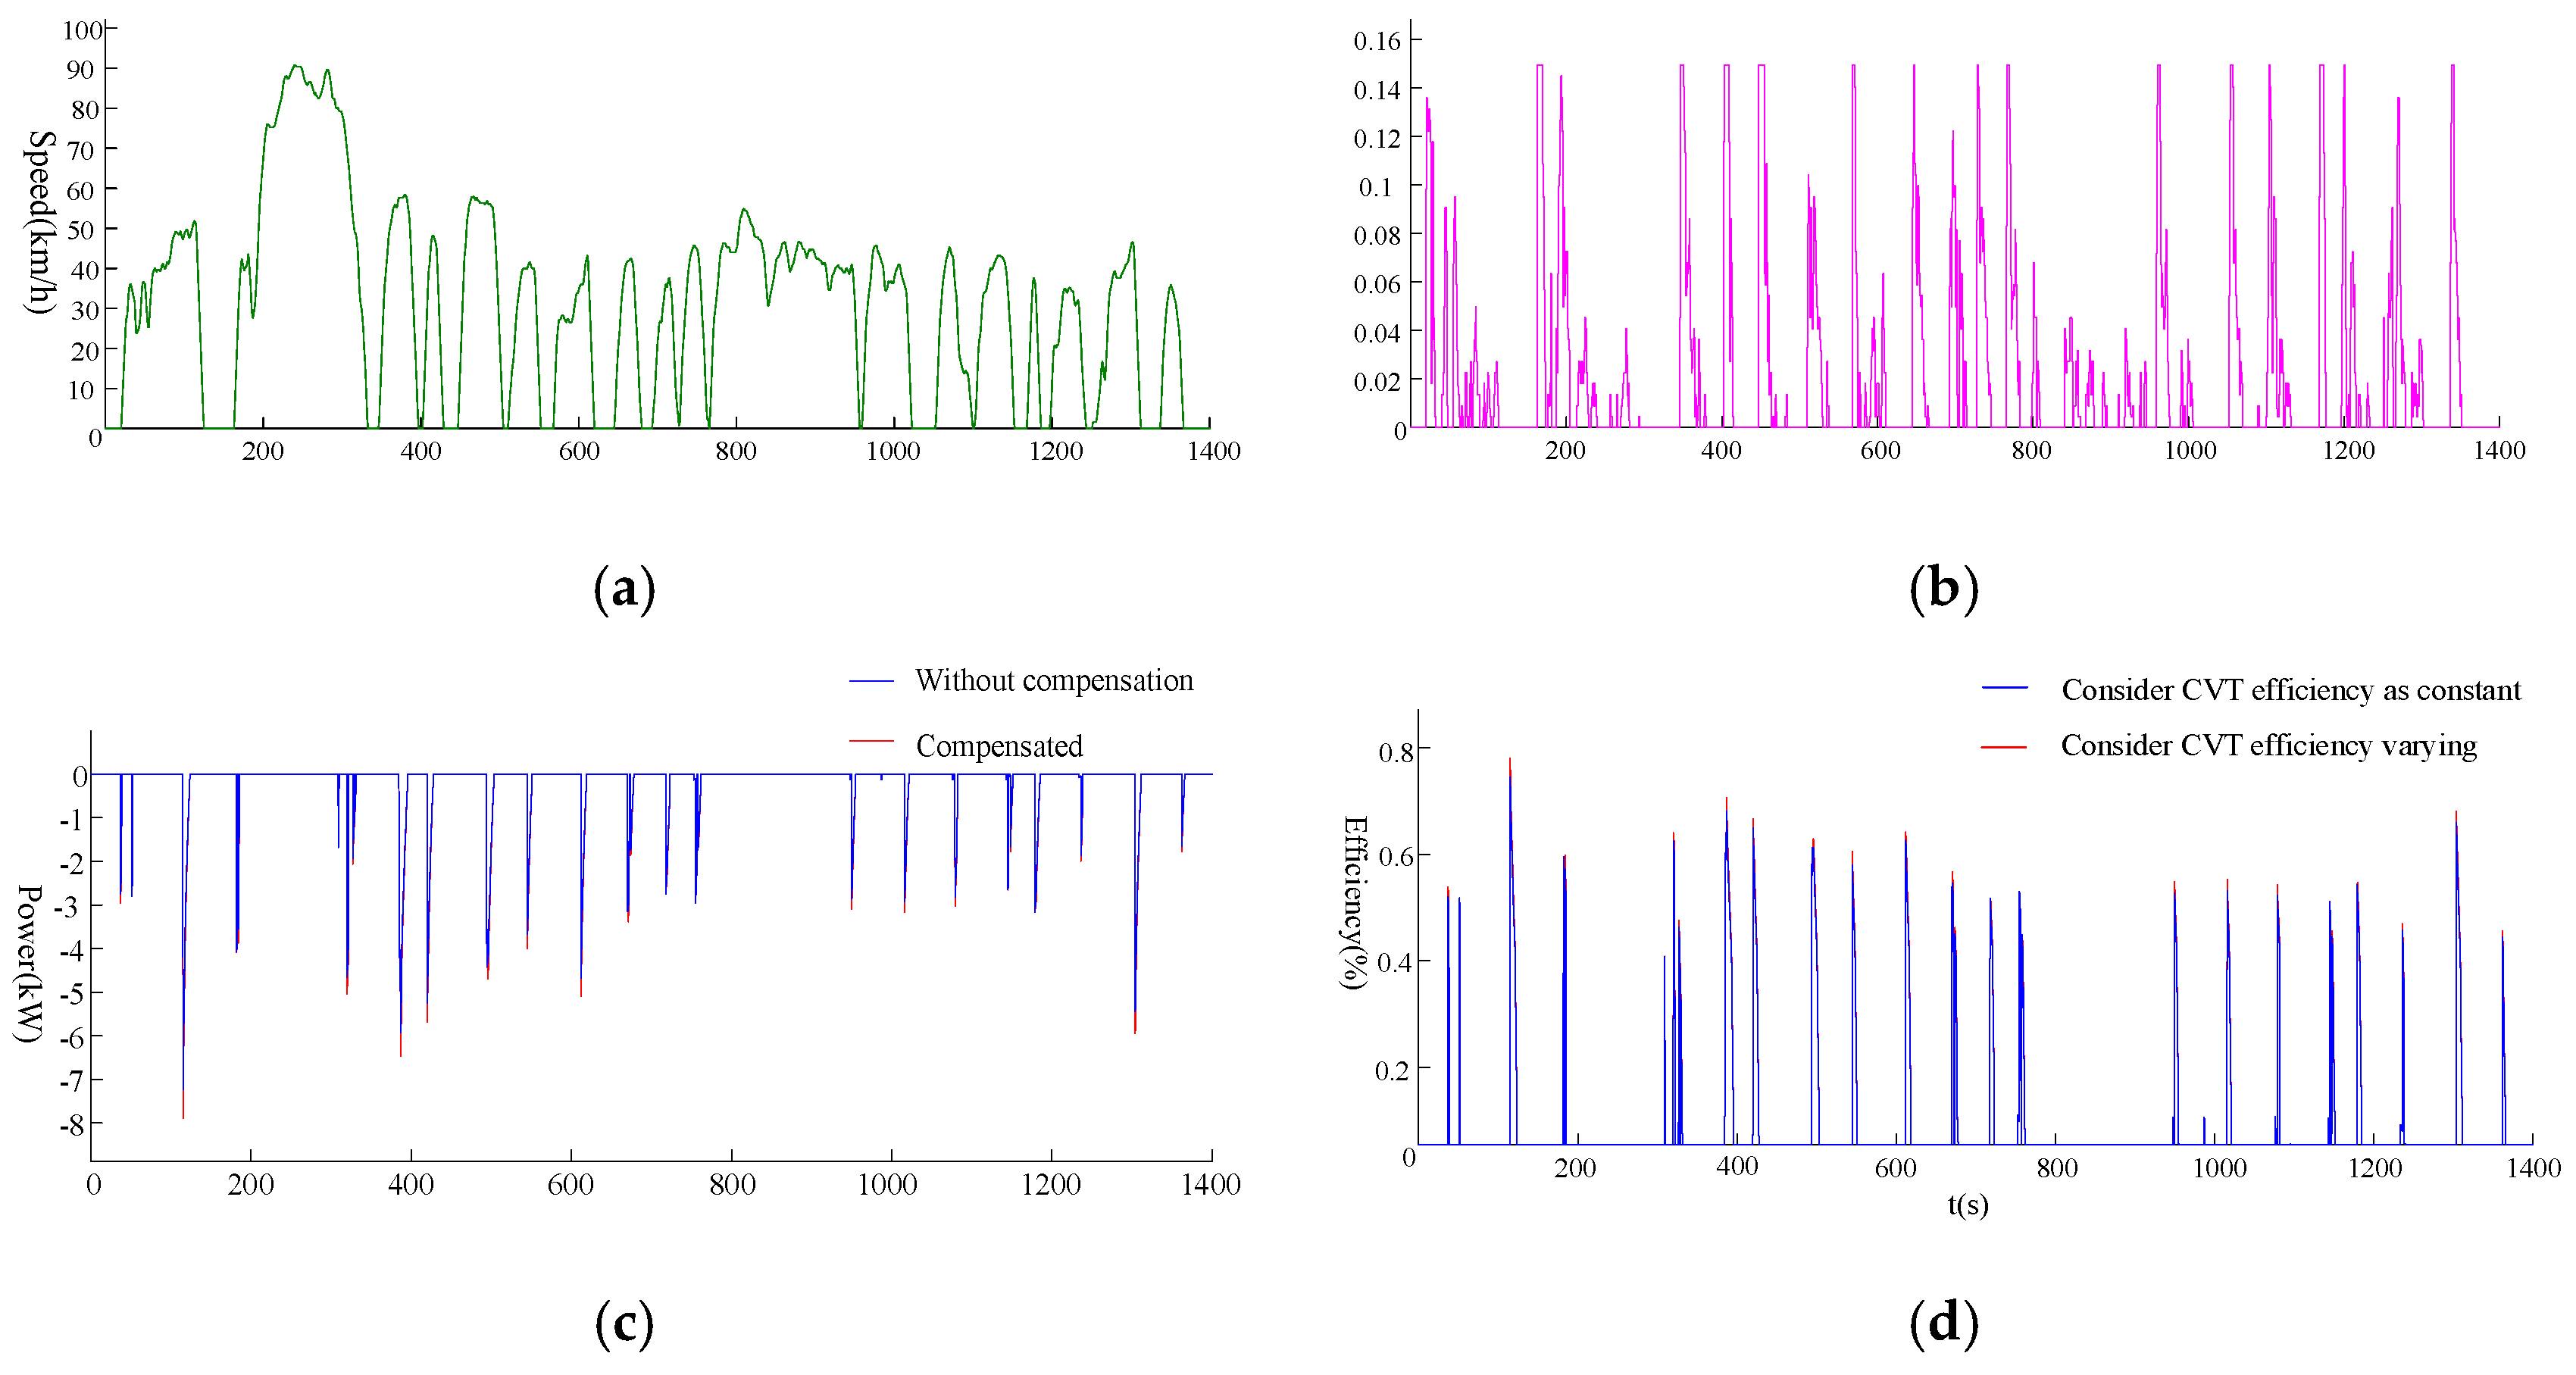
Figure 16.
NYCC simulation results. (a) Vehicle speed; (b) Braking strength; (c) Front motor power; (d) Front regenerative braking system efficiency.
Figure 16.
NYCC simulation results. (a) Vehicle speed; (b) Braking strength; (c) Front motor power; (d) Front regenerative braking system efficiency.

Figure 17.
US06 simulation results. (a) Vehicle speed; (b) Braking strength; (c) Front motor power; (d) Front regenerative braking system efficiency.
Figure 17.
US06 simulation results. (a) Vehicle speed; (b) Braking strength; (c) Front motor power; (d) Front regenerative braking system efficiency.

Figure 18.
Front motor operating points during regenerative braking under UDDS.
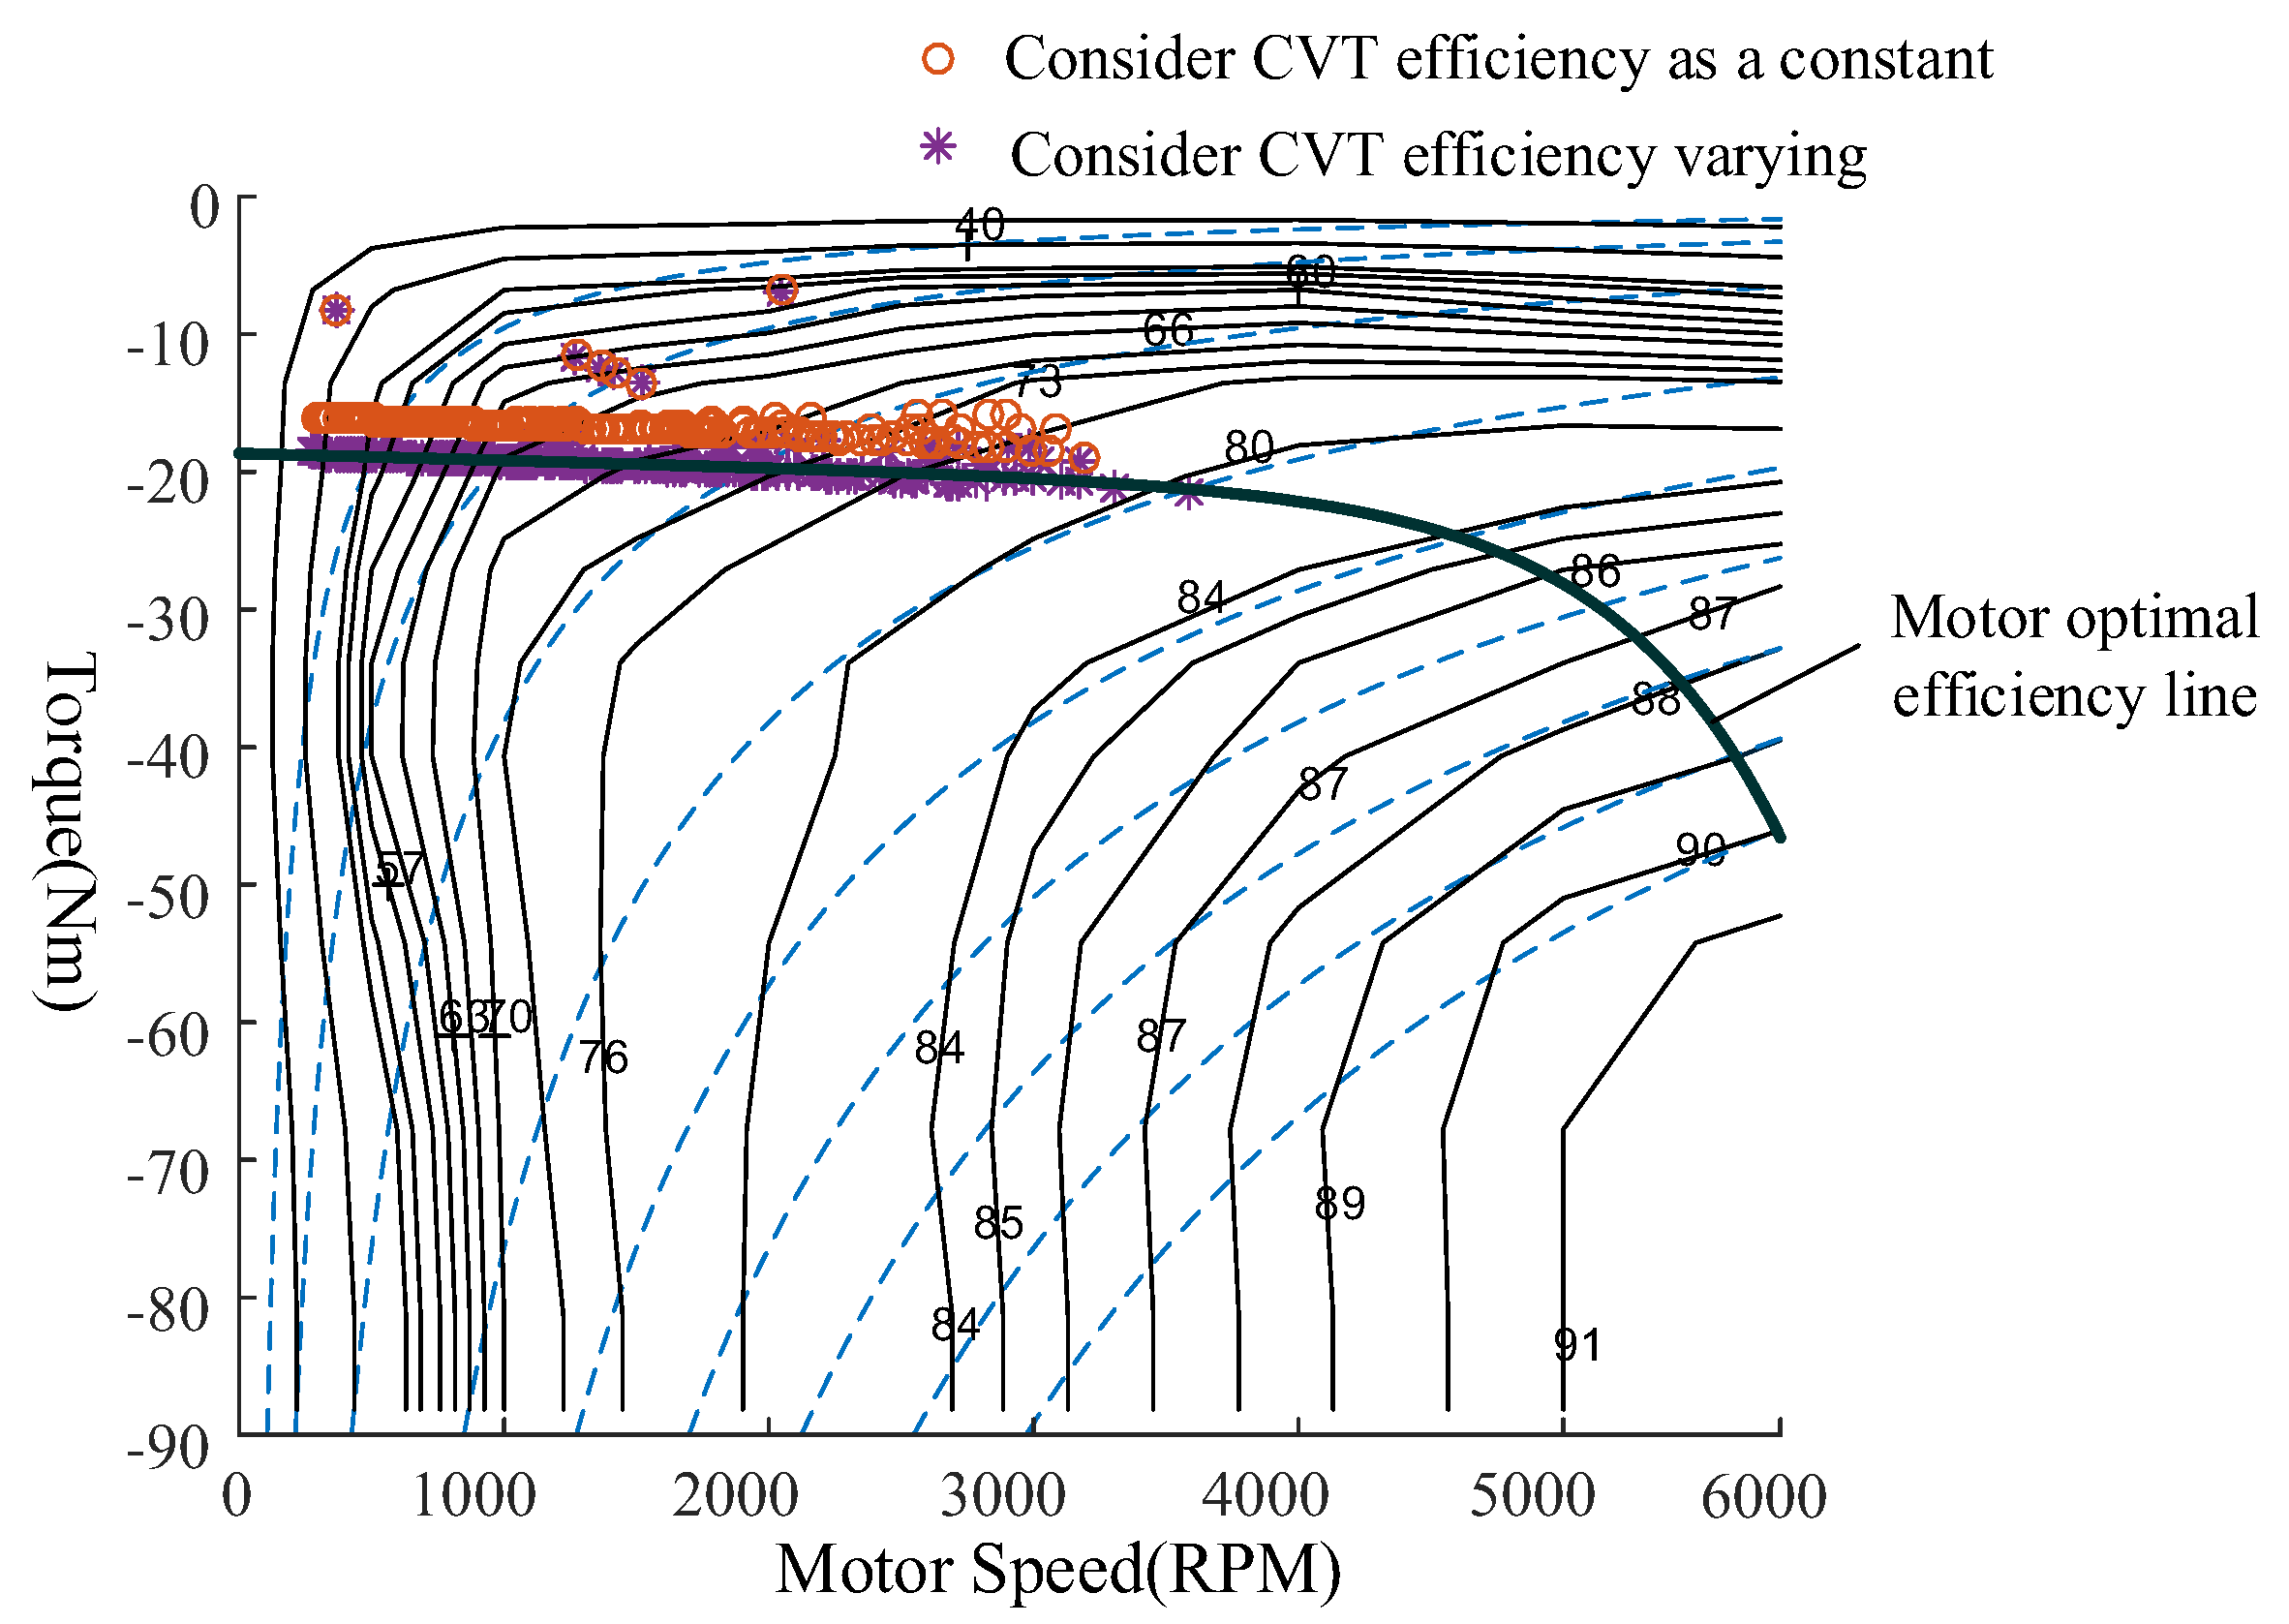
Figure 19.
Energy recovery comparison. (a) UDDS simulation results comparison; (b) NYCC simulation results comparison; (c) US06 simulation results comparison.
Figure 19.
Energy recovery comparison. (a) UDDS simulation results comparison; (b) NYCC simulation results comparison; (c) US06 simulation results comparison.


Table 1.
Vehicle data and main components parameters.
| Vehicle | Vehicle mass | 1800 kg |
| Front projected area | 2.1 m2 | |
| Tire radius | 0.335 m | |
| Distance from the front axle to the center of gravity | 1.08 m | |
| Distance from the rear axle to the center of gravity | 1.62 m | |
| ICE | Displacement | 1.597 L |
| Peak power | 69 kW | |
| CVT | Speed ratio range | 0.45–2.57 |
| Front motor | Peak/rated power | 28/14 k W |
| Base speed | 1500 rpm | |
| Rear motor | Peak/rated power | 27/13.5 k W |
| Base speed | 3000 rpm | |
| Battery | Category | Lithium |
| Capacity | 38.43 Ah |
Table 2.
CVT parameters.
| Radial displacement of inner band from center line to segment side | 2.2 mm |
| Friction coefficient | 0.11 |
| Band thickness tband | 0.2 mm |
| Number of bands in a band pack | 11 |
| Band perimeter | 750 mm |
| Distance of pulley centers | 180 mm |
© 2018 by the authors. Licensee MDPI, Basel, Switzerland. This article is an open access article distributed under the terms and conditions of the Creative Commons Attribution (CC BY) license (http://creativecommons.org/licenses/by/4.0/).
Share and Cite
MDPI and ACS Style
Yang, Y.; He, X.; Zhang, Y.; Qin, D. Regenerative Braking Compensatory Control Strategy Considering CVT Power Loss for Hybrid Electric Vehicles. Energies 2018, 11, 497. https://doi.org/10.3390/en11030497
AMA Style
Yang Y, He X, Zhang Y, Qin D. Regenerative Braking Compensatory Control Strategy Considering CVT Power Loss for Hybrid Electric Vehicles. Energies. 2018; 11(3):497. https://doi.org/10.3390/en11030497
Chicago/Turabian StyleYang, Yang, Xiaolong He, Yi Zhang, and Datong Qin. 2018. "Regenerative Braking Compensatory Control Strategy Considering CVT Power Loss for Hybrid Electric Vehicles" Energies 11, no. 3: 497. https://doi.org/10.3390/en11030497
Note that from the first issue of 2016, this journal uses article numbers instead of page numbers. See further details here.