1. Introduction
Nowadays the uncontrolled growth of the distributed energy resources (DERs) within the context of the smart grid (SG) has triggered new innovative solutions that take into account how consumers assess electricity service. The modern SG and the micro grids, with more power due to distributed generation (DG), requires sophisticated measurement methods not only for adequate power quality (PQ) surveillance but also for targeting the potential causes of the fault and assessing the importance of low-level events, such as solar photovoltaic (PV) energy, solar thermal energy, wind energy, fuel cells, energy storage, demand response (DR), and electric vehicles (EV). These newly perturbations, not characterized yet, have a direct impact on utilities and customers as well; e.g., an increase in nonlinear behavior of loads and equipment.
During the last three decades, instruments are incorporating new functionalities to perform such PQ measurements. For reasons based on the complexity of the electrical network and the considerable increase of the measuring points, it should be added that there is no need to measure a specific type of disturbance among the classical within the norm EN50160 [
1] and that the storage and data processing requirements depend very much on specific needs. Despite the fact that fixed instruments have been spread throughout the entire network thanks to last mile communication systems and that PQ features are being included in smart meters and automation equipment, there is no instrument that meets the needs of every customer. In an attempt to test customers’ needs, it was reported in [
2] that utilities and TSOs (transmission system operators) mainly use fixed PQ monitors, while DSOs (distributed system operators) handle portable analyzers. The selection of the measurement locations depends on the customers’ needs and the sensitivity of the site under test. Indeed, the criteria used to select the instruments are mainly based on the equipment’s performance regarding the specific problem, as opposed to the normative issues and technical support after purchase [
2].
A current challenge in PQ monitoring systems is the detection of low-level perturbations and the isolation of a potentially faulty element that may affect the micro storage systems’ performance. Indeed, one of the major concerns of instrumentation manufacturers is associated with online transient detection and discrimination, as it eventually may lead to an assessment of the cause–effect relationship. Consequently, the research in this branch constitutes a challenging task that involves utilities, researchers, and final users.
This article presents a contribution to the class of instruments considered as “transient detectors,” which is based on the fourth-order spectrogram. The fourth-order spectrum, a higher-order statistics (HOS) approach in the frequency domain, enhances the peakedness of the frequency components enabling the detection of transients. The time-sliding version, the fourth-order spectrogram, is postulated in the present work to measure the length of the transient along with the frequency content of the electrical disturbance. This double information may increase the probability of targeting the malfunctioning element in scenarios with a high degree of DERs.
Along with the higher-order time–frequency duality based on the spectral kurtosis (SK), the computational strategy is settled on two main pillars. The method presents two possible resolution operating modes, within two different frequency ranges, depending on the transient under test: a 5 Hz resolution in the range 0–500 Hz and a 50 Hz resolution in the range of 0–5 kHz, which is currently the focus of the new instrumentation design [
3]. Secondly, the computational strategy, based on the SK, accounts for variability over a 100-register set: the new segment in the analysis window and 99 realizations of noise processes. If the test window comes across a transient that it is not present in the remaining 99 registers, the event is labeled with a probability of 100% in the spectrogram, a color is associated with the probability of the transient occurrence, and this situation does not change until the transient vanishes independently of its amplitude. The 100 noise signals constitute a database used to detect any kind of signal different from noise. According to former experiences in the research team, the SK analysis over 100 signals has enough sensitivity to detect coupled PQ disturbances [
4].
To illustrate the measurement sequence, four real-life measurement registers have been selected and analyzed in this work. From the experimental set of results, a two-fold conclusion is set regarding this methodology. Thanks to the fast Fourier transform (FFT) method, the SK increases the detection speed substantially [
5,
6]. It also has a strong noise rejection capability conferred by the HOS [
5], as the transient frequency is outlined over the noise floor, even for low-level transients. This method may be used as a fine frequency location and afterwards the power spectrum can be used to reformulate new power quality indexes.
The layout of the paper is as follows: The review of the transient nature of the electrical grid is exposed in
Section 2.
Section 3 summarizes the main outcomes regarding transients’ measurements in power systems. Afterwards, the computational strategy is presented in
Section 4, which deals with the advantages of HOS and their introduction into smart meters within the frame of load scheduling. Results are gathered in
Section 5. Conclusions and prospective work are detailed in
Section 6.
2. The Transient Scenario of the SG
The electrical grid is under the direct influence of a variety of transients that similarly affect the electrical grid from its historical origins to the current state of development. Along with the transients, the technology regarding protection devices has evolved with the aim of configuring a shield for the susceptible equipment. The mission of the protection devices consists of deviating the spurious transients to the ground.
There are myriads of transient sources, which range from lightning to different kinds of those produced by equipment (e.g., switches, capacitors banks, and equipment in the consumer’s side). All of them are coupled to the grid’s conductors via different mechanisms, according to their associated physical principles. Most transients have low energy content, but the magnitudes of some, such as lightning-induced transients, are sufficient to damage most electronic equipment.
Along with the mentioned sources of transients, as a consequence of the grid’s development, the DERs are connected to the grid without proper planning and consequently have a deep impact on the quality of the energy; e.g., photovoltaic panels and medium-size wind turbines are connected using conductors with low losses, but with the handicap of the introduction of high frequency transients that spread through the grid. The shapes and duration of these transients are entirely new and unpredictable. In fact, switching the transients’ characteristics depends on the system’s electrical parameters, e.g., resistance, capacitance, and inductance. At the same time, the induced transients, being a DER under the effects of lightning, will also be induced in the SG. Consequently, the final user in a building is directly exposed to the lightning and switching phenomena [
7].
In this frame, most of the electronic equipment is highly susceptible to electrical anomalies. Some industrial equipment subject to such anomalies include programmable logic controllers, uninterruptible power supplies, metering devices, heating, ventilation, and air conditioning systems, and communication units. Additionally, we find susceptible equipment, e.g.,: health-care units and urban measurement and control systems, beyond the industrial world. Finally, control electronic units of the distribution elements that control the flux of electrical power are also the targets of PQ events [
3,
7]. A perturbation in any of this equipment can cause fatal disasters.
Certain factors highly determine the susceptibility of equipment: the unpredictable origin of the transients, the coupling mechanism through which the transient penetrates in the equipment, and the impedance between the source and the equipment. On this basis, protection methods are continuously being deployed and basically pivot around intercepting and attenuating transients at the entrance point of the facility which supplies the electricity. This first modulating action is then complemented via additional protection devices, installed in the distribution panels and the final use location [
3,
8,
9].
3. PQ Monitoring Systems and Transient Meters
Monitoring systems and data analysis from power systems have been in focus over the last twenty years, particularly the design of new architectures and newly added features that have arisen in the class of smart analyzers. Commercial versions are now capable of analyzing trends in power systems and are widely use in energy-efficiency-oriented industrial applications. Most versions have included innovative signal processing modules that extract the necessary features from the signal under test, with the goal of classifying the PQ disturbances, especially the transients [
10].
To establish a reference, the branch of equipment for PQ analysis was treated in depth in [
11]: architectures, installation, and issues regarding capturing tendencies of the monitoring systems were exposed. Wagner et al. [
12,
13]) identified common disturbances in production environments. The first formal guidelines for implementing monitoring systems were presented by Rauch et al. in [
14] and by Liu in [
9]. The global evolution and tendencies according to installation, architecture, and software performance was discussed by Sawyer in [
15]. With regard to specific issues, the pros of using an object-oriented philosophy were elucidated in [
16].
Several industrial-oriented software-based applications for disturbance detection and analysis have been developed. Among them, we remark the design proposed by Shakarijan et al. [
17]. A subsequent version (enhanced in terms of communication and triggering) was conceived in 2004 by the team conducted by Daponte and was called
the TransientMeter, which consisted of a monitoring system oriented to detect and classify transient disturbances based on wavelets transforms. Its performance was acceptable under controlled conditions [
10].
Regarding DSP solutions, three backgrounds have been selected. Bucci et al. [
18] designed a distributed virtual instrument, based on LabVIEW
TM, thought to monitor the steady-state electrical anomalies (mainly sags, swells, and flickers) and to measure precise parameters (amplitude, duration, and rise and fall times). Likewise, it is also worth mentioning the work by Chung-Ping et al. [
19], who deployed a real-time control unit for multiple sources.
With respect to experiences in the public domain, it is well worth citing the research in [
20], which examines PQ in public distribution electricity grids. Additionally, the work by Makinen et al. [
21] is of high interest because it synthesizes the evolution of PQ monitoring systems in a country frame.
Having described the frame, the contribution of our work consists of an HOS-based approach to discriminate transients on an SG. The algorithm uses the fourth-order discrete spectrogram thought to monitor fault transients at nodes of the domestic grid. The combined time–frequency information enhances the transient detection and the subsequent identification of the potential faulty area. The proposed method is evaluated through real power-line signals from the Spanish domestic electrical grid. Thanks to the peakedness enhancement capability of the higher-order spectrum, it is shown that the method is able to detect low-amplitude transients that are likely ignored in traditional detection procedures (not oriented to micro grids), and this, by analyzing the duration and frequency content of the electrical perturbation, may indicate prospective faulty states of elements in a grid.
4. The Computational Strategy
4.1. Higher-Order Statistics and the Spectral Kurtosis
Estimates of higher-order cumulants are being used extensively in measurement systems to infer new statistical characteristics associated with data from a non-Gaussian time-series in a predominant Gaussian background floor, which can be theoretically considered as a result of the summation of different noise processes. Within the transient detection context, the target PQ event is always considered non-Gaussian, while the floor is assumed to be stationary Gaussian signal [
4,
22,
23,
24]. Thus, using HOS would help to locate the transient in a qualitative way, with a rough approximation.
Given an
rth-order real-valued random process (measurement time-series),
, the joint compacted notation for cumulants is expressed in Equation (
1):
where
is the
ith time shift, which is a multiple of the data acquisition sampling period,
, usually expressed as
. Normally, the statistical cumulants given by Equation (
1) are estimated by using a compact formula (
Leonov-Shiryaev), which expresses the compact relationship among the cumulants of stochastic time-series and their associated statistical moments [
24].
HOS data in the frequency domain are arranged multi-dimensionally. Thus, these multi-dimensional structures or tensors (poly-spectra), the
rth-order spectra, notated as
, are defined to be the (
r−1)-
Fourier transforms of the
rth-cumulants, in accordance with Equation (
2):
Looking at computation issues, in general, poly-spectra consist of complex numbers, as can be inferred from Equation (
2). For example, by making
r = 2, 3, 4 in the former Equation (
2), three traditional spectra are obtained: the power, bi- and tri-spectrum, respectively—the first one being real and the other two being complex magnitudes. For this reason, poly-spectra graphics contain a great deal of information, and their computation is unfeasible in the majority of the cases. Thus, one-dimensional slices and dual-frequency surfaces have to be extracted from the big-data tensors structures in order to obtain acute information regarding the phenomena under observation [
24].
Regarding the statistical interpretation, while the bi-spectrum identifies the contributions to the statistical skewness as a function of frequency pairs, the so-called bi-frequencies, the tri-spectrum accounts for the contributions to the signal’s kurtosis as a function of frequency triplets, or tri-frequencies [
24].
A number of HOS estimators have been specifically designed to extract ad hoc information. Our focus is on the SK, which is a quantification of the statistical kurtosis associated with each Fourier component of a process (or time-series from a measurement instrument) and measures data time-series peakedness, which in turn allow for the identification of the transients. For estimation and notation issues, M measurement sweeps of the process are taken into account. Mathematically, each realization consists of an N-point vector; i.e., each time a measurement iteration takes place, and N points (spaced by the sampling period, ) are stored in one of the M vectors.
The novelty of the research consists of using the SK to target the frequencies with which the electrical perturbations are mostly associated. Then, a further FFT analysis may be developed in a subsequent stage to quantify the real effect of these frequencies on the system under test. The biased estimator for the SK for
M sweeps of
N points, and with a frequency index
m, is given by Equation (
3):
where
is the
mth Fourier component of the
ith realization for the
N-data vector
. This estimator sweeps the register (measurement time-series) under test. Its value ranges from zero to
M for each frequency index,
m [
24]. Given a frequency index
m, this maximum is the consequence of having the j-
th sample,
, notably higher than the rest,
with i ≠ j. This fact is outlined in Equation (
4) and denotes its capabilities for transient detection.
The measurement range for the estimator will be considered in the experimental spectrograms.
4.2. The Computational Method and the Analysis Modules
The estimator described in Equation (
3) is computed considering a number of
M = 100
N-point realizations, according to the following strategy. Initially, for calibration issues, 100 white Gaussian noise processes are considered so that the SK value is null for all the frequencies. Then, one of these realizations is replaced by the first
N = 200 data of the time-series under test. Using this strategy, we assure the full benefits of the SK, as it reveals the novelty in the following sense. If the added time-series is completely new in the set, the SK will take a different value and will rise abruptly.
The PQ data acquisition recommendations in IEEE 1159 refer to 512 samples/cycle (25.6 KHz) as the highest sampling frequency, typically used to monitor low-frequency signals, and these recommendations also refer to the voltage usually measured on a cycle-by-cycle basis [
25]. Under these assumptions, the spectral analysis involves the following setup: a maximum frequency of 12.8 KHz, a frequency resolution of 50 Hz, and a temporal resolution of 20 ms. Hereinafter, the data acquisition and processing based on these specifications will be named full surveillance analysis (FSA), and it will be used as a reference to determine the benefits of the proposed methodology. The FSA has two important drawbacks for an implementation in effective low-cost smart meters: firstly, the inability to certify the presence of inter-harmonics as they are separated exactly by 50 Hz, which coincides with the maximum frequency resolution (50 Hz). Thus, any other coupled signal would be indistinguishable from the nearest inter-harmonic. The second handicap is related to the sampling frequency, as it may not be reachable for most basic/low-cost devices. Consequently, this analysis includes the frequencies to survey oscillatory transients and higher harmonics, according to the standards IEC 61000-4-7 [
26] and IEC 61000-4-30 [
27].
The proposed two-stage strategy is thought to overcome former drawbacks. It detects low-frequency transients (<5 kHz, according to IEEE 1159 recommendations), keeps a temporal resolution of 20 ms, and, in this case, achieves a frequency resolution of 5 Hz below 500 Hz. This enables the detection of lower inter-harmonics and other events around the fundamental frequency. Additionally, the optimized specifications of the proposed strategy results in simpler electronic requirements for its implementation on smart meters: a lower sampling frequency, a lower number of processed data, and, consequently, lower memory requirements and less computational time.
This two-fold strategy is based on two computational modules. Thus, assuming a sampling frequency of = 10 kHz, the low frequency module (LFM) works with a sub-sampled signal at = 1 kHz, whereas the high frequency module (HFM) operates with the original record. Both the LFM and the HFM handle M = 100 realizations, each of N = 200 data. Thus, the FFT resolution is 5 Hz (500 Hz/100 data) within the 0–500 Hz range for the LFM, and 50 Hz (5000 Hz/100 data) in the 0–5000 Hz range for the HFM.
Regarding the number of cycles that are considered within the 200-point analysis window, the LFM accounts for 10 cycles (200 points · s = 0.2 s), while the HFM only considers one cycle of the power-line signal (200 points · s = 0.02 s).
Likewise, a complementary hybrid analysis provides high temporal resolution, which provides sensitivity to short events, a high frequency resolution in lower frequencies such that variations in the fundamental frequency and lower harmonics can be checked, and a top frequency of 5 kHz for higher harmonics. All of these features are implemented without a significant increase in computation time.
5. Experimental Results
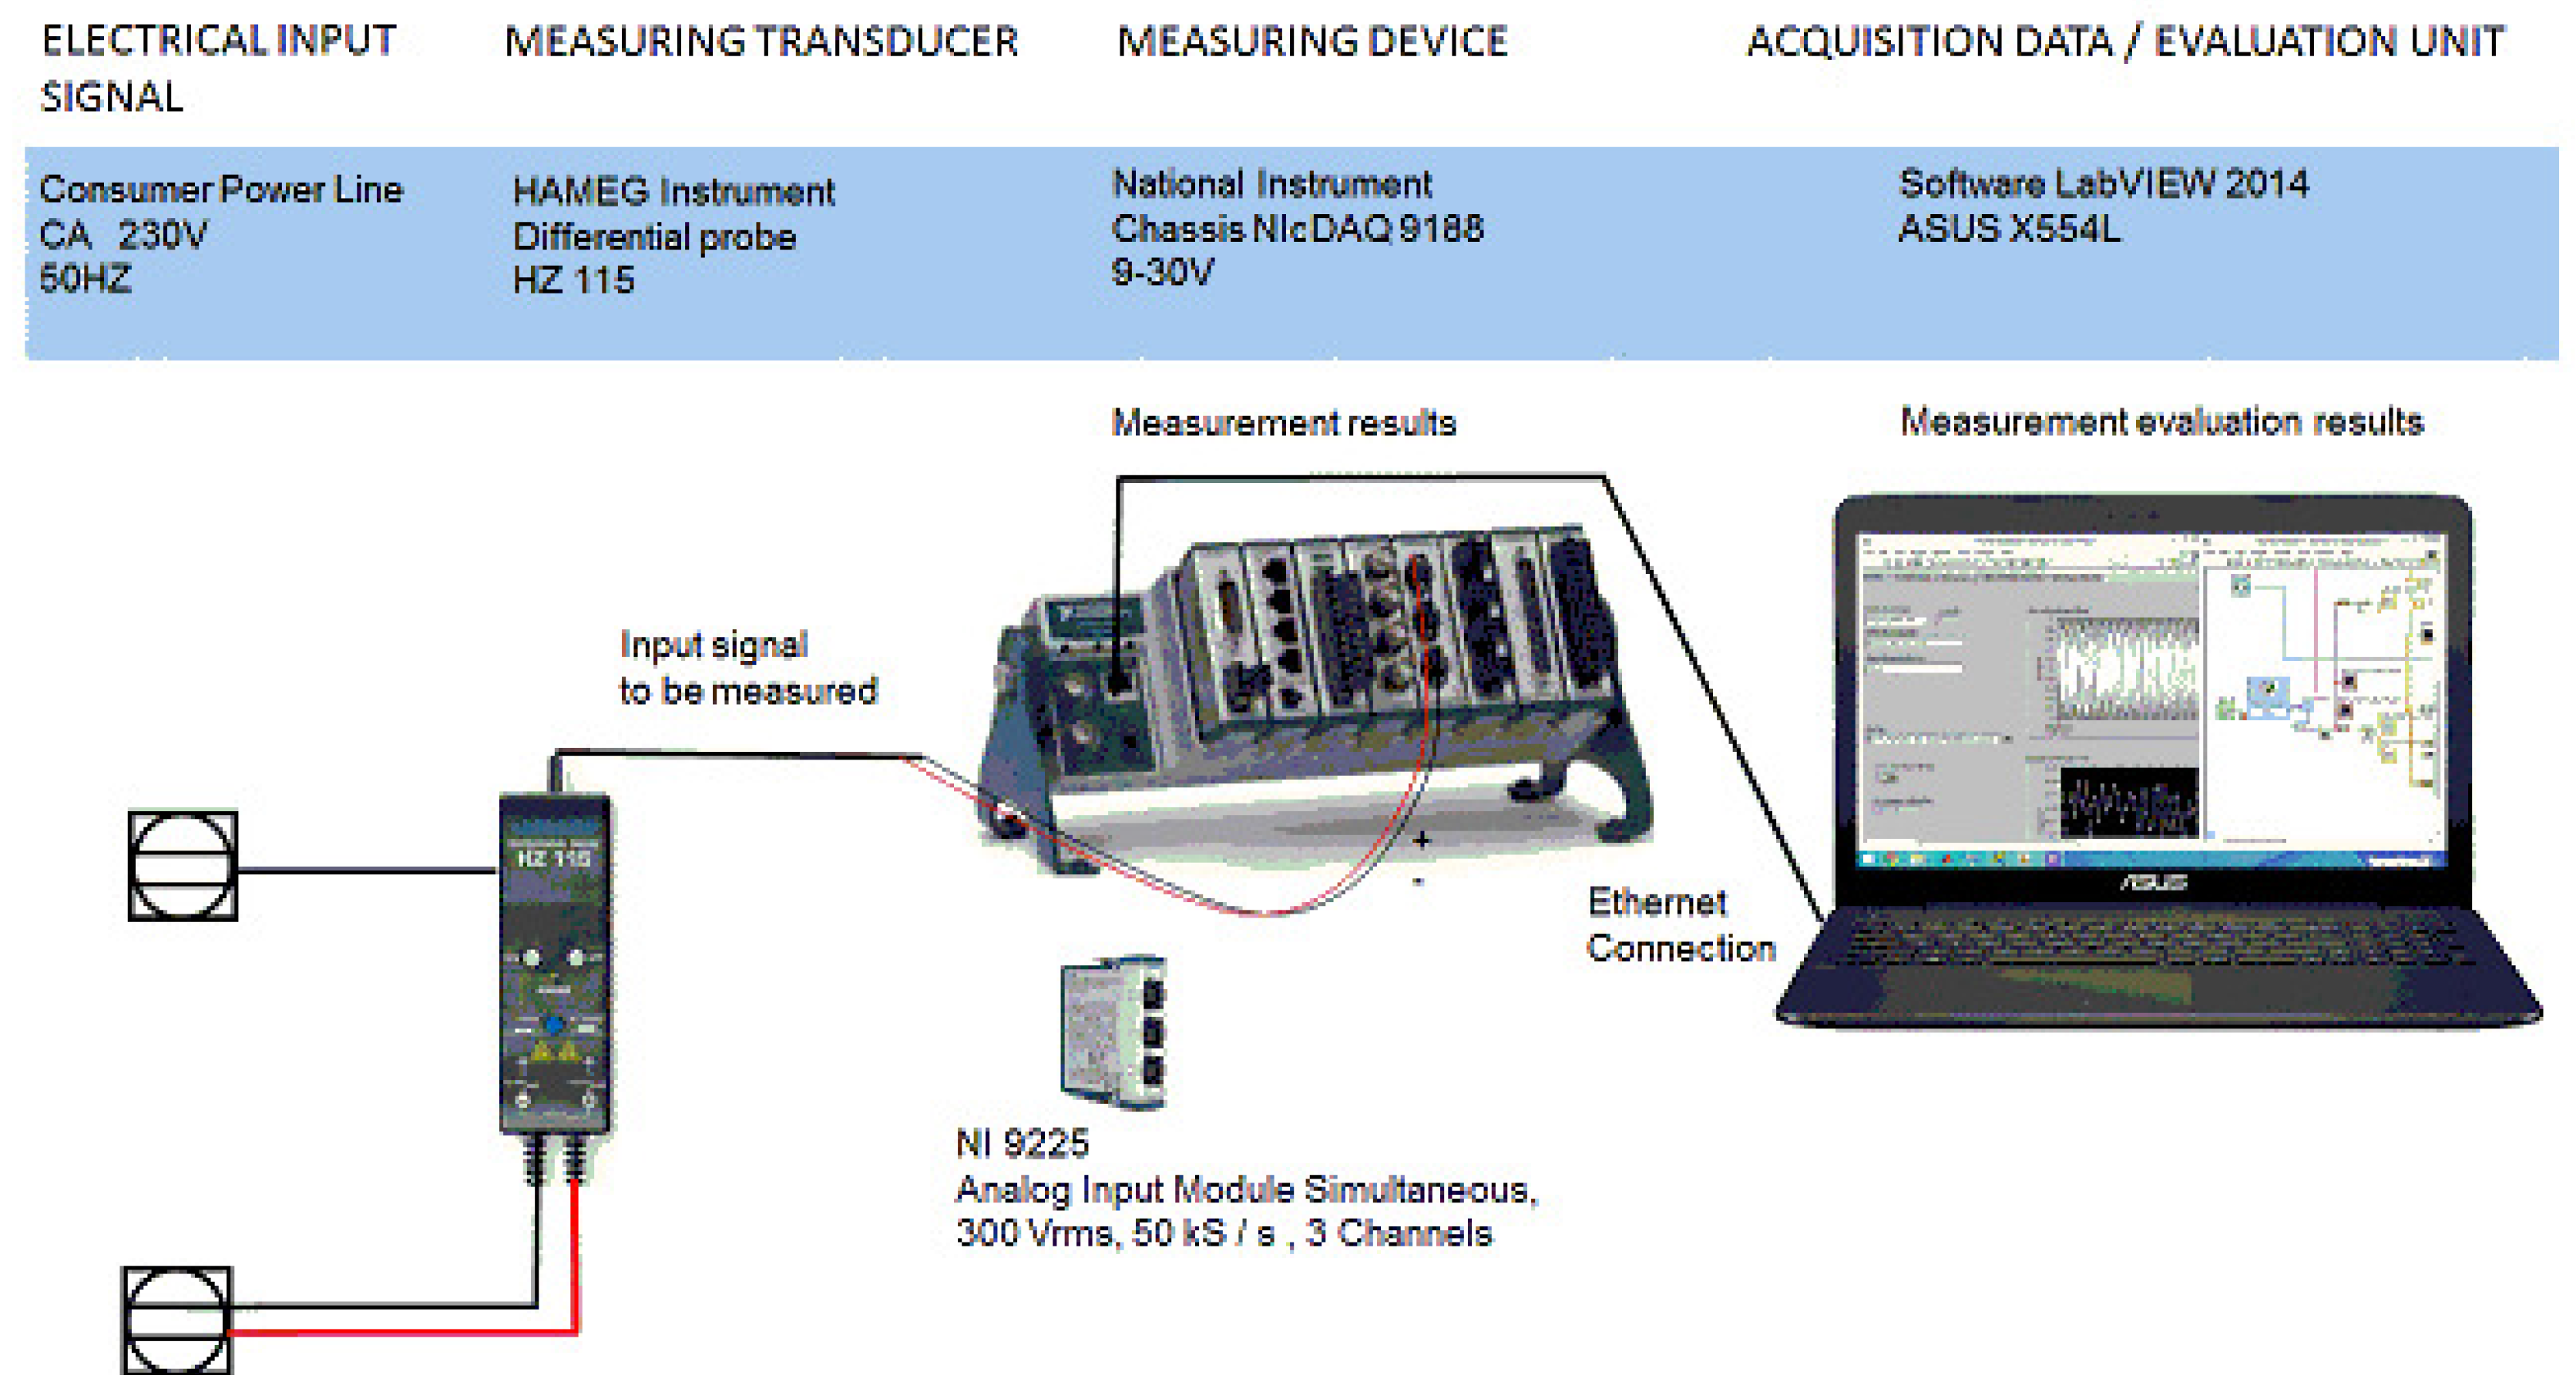
Hereinafter, four case studies are analyzed in order to illustrate the proposed method. The experimental arrangement is shown in
Figure 1. Data acquisition has been performed using a portable unit and a differential probe.
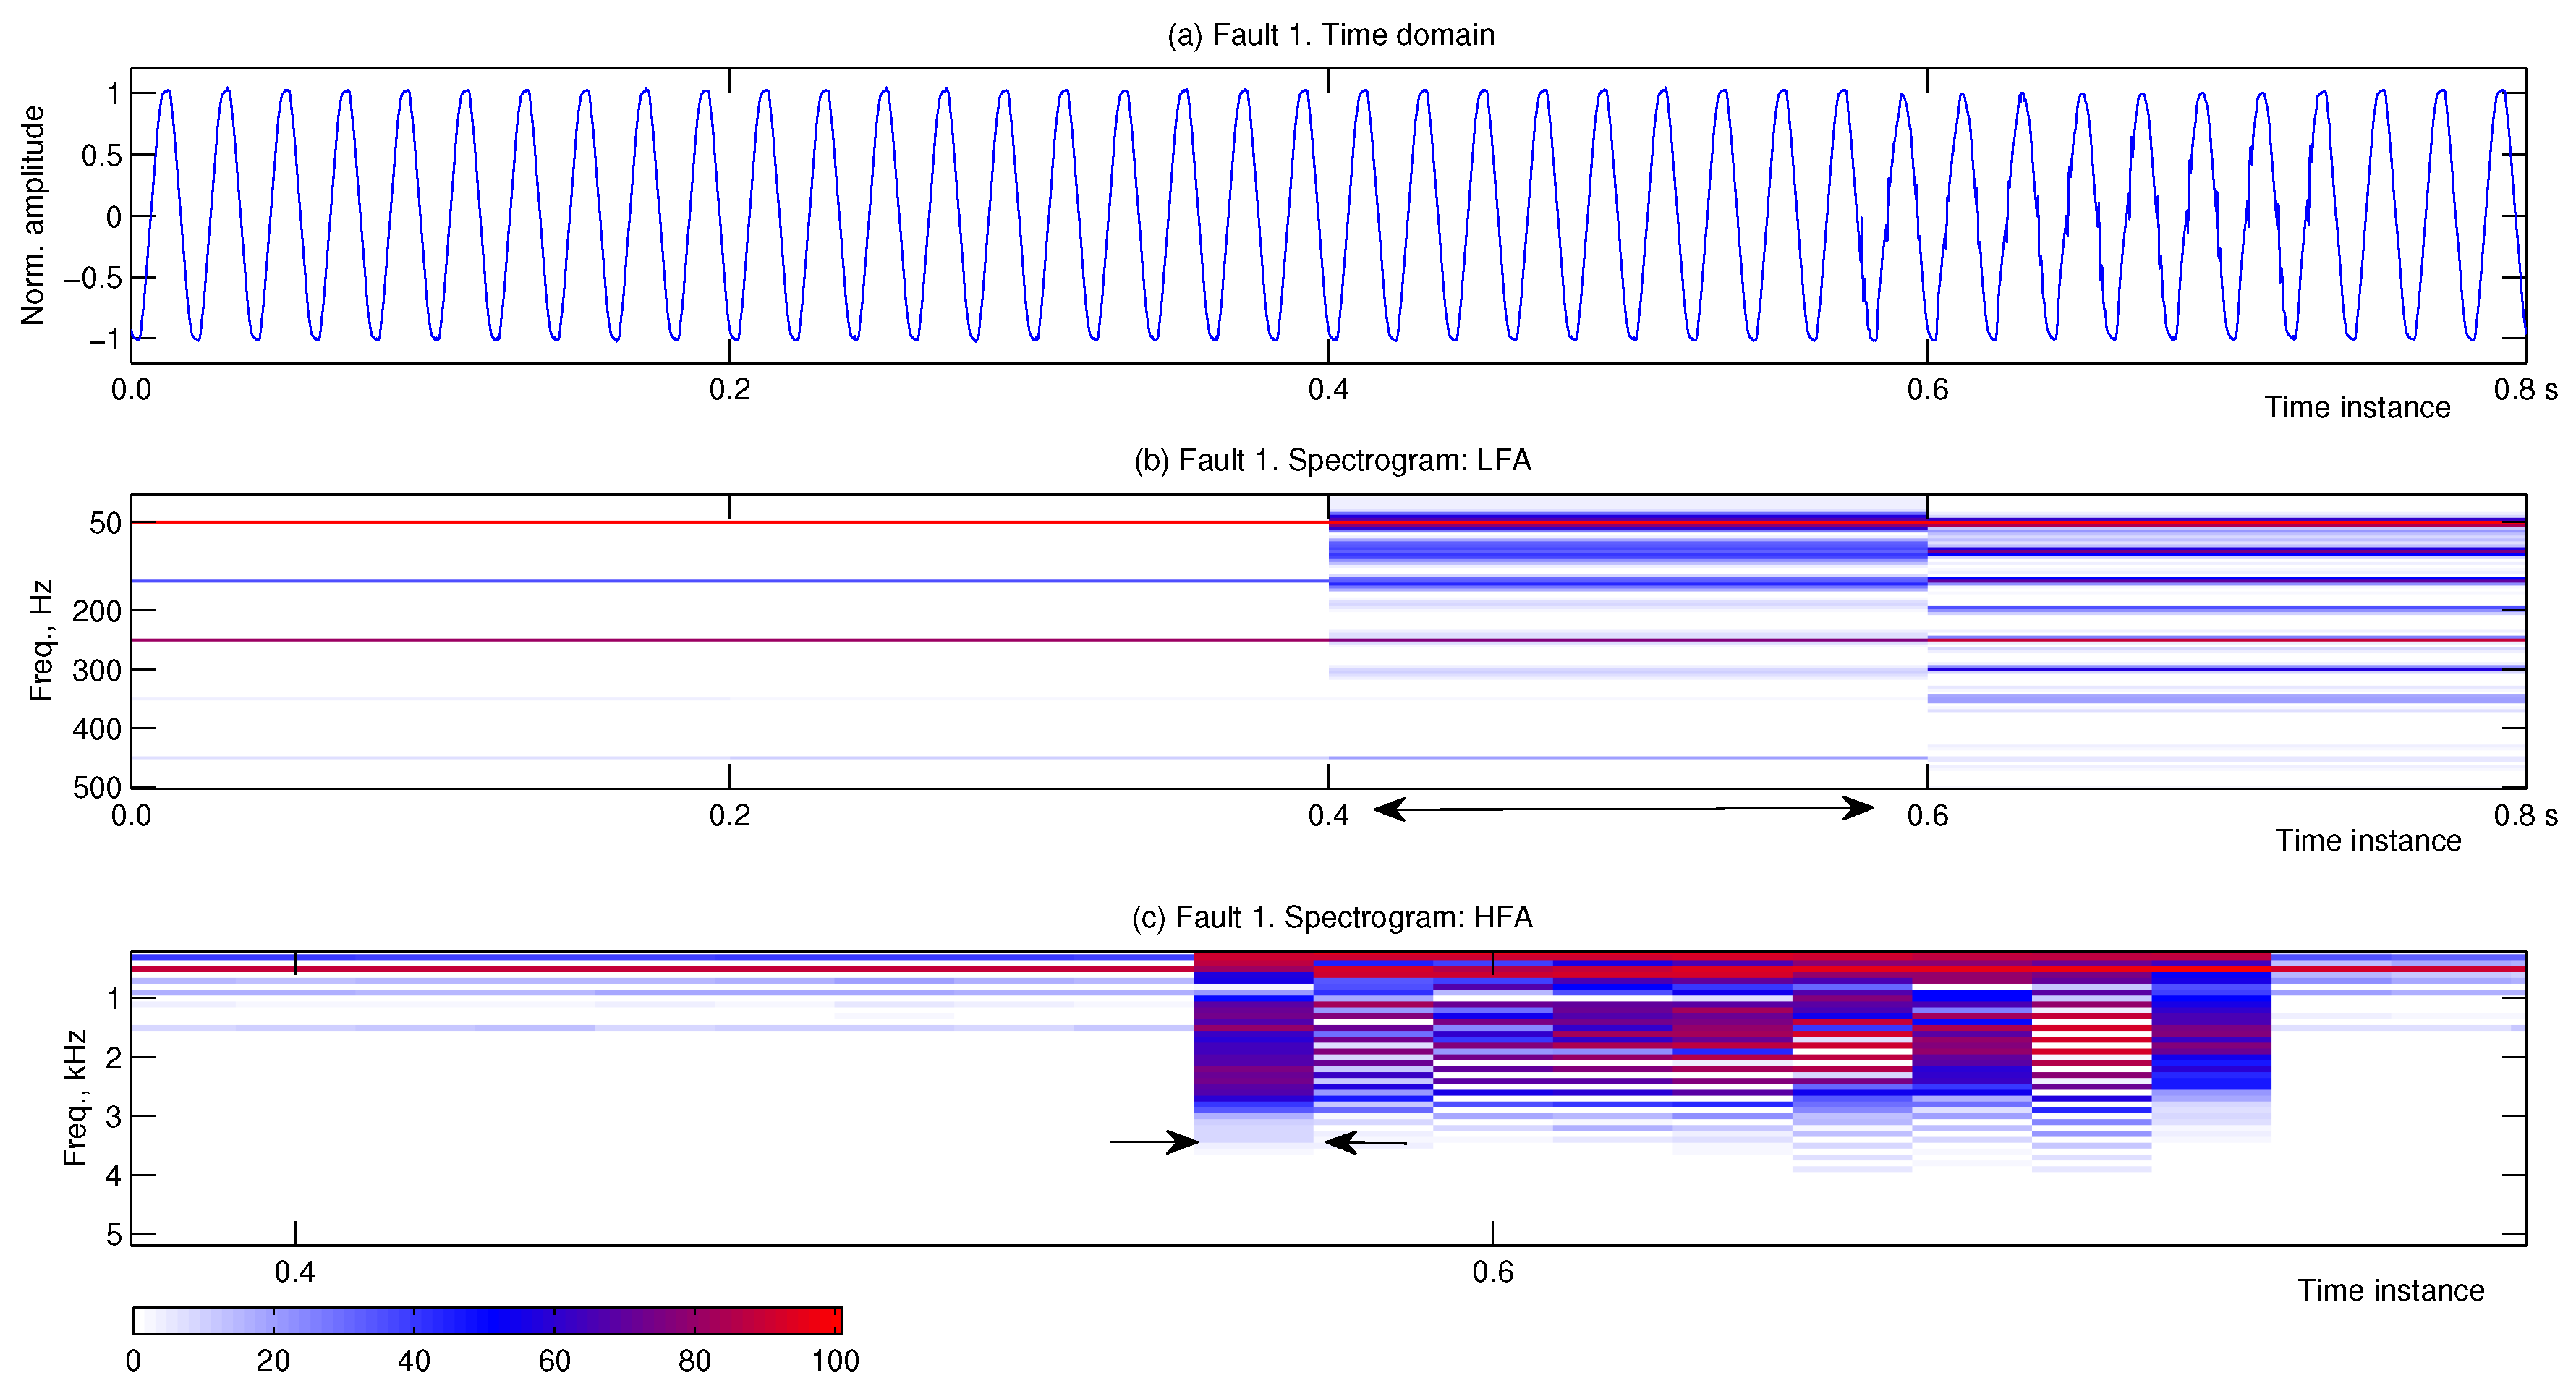
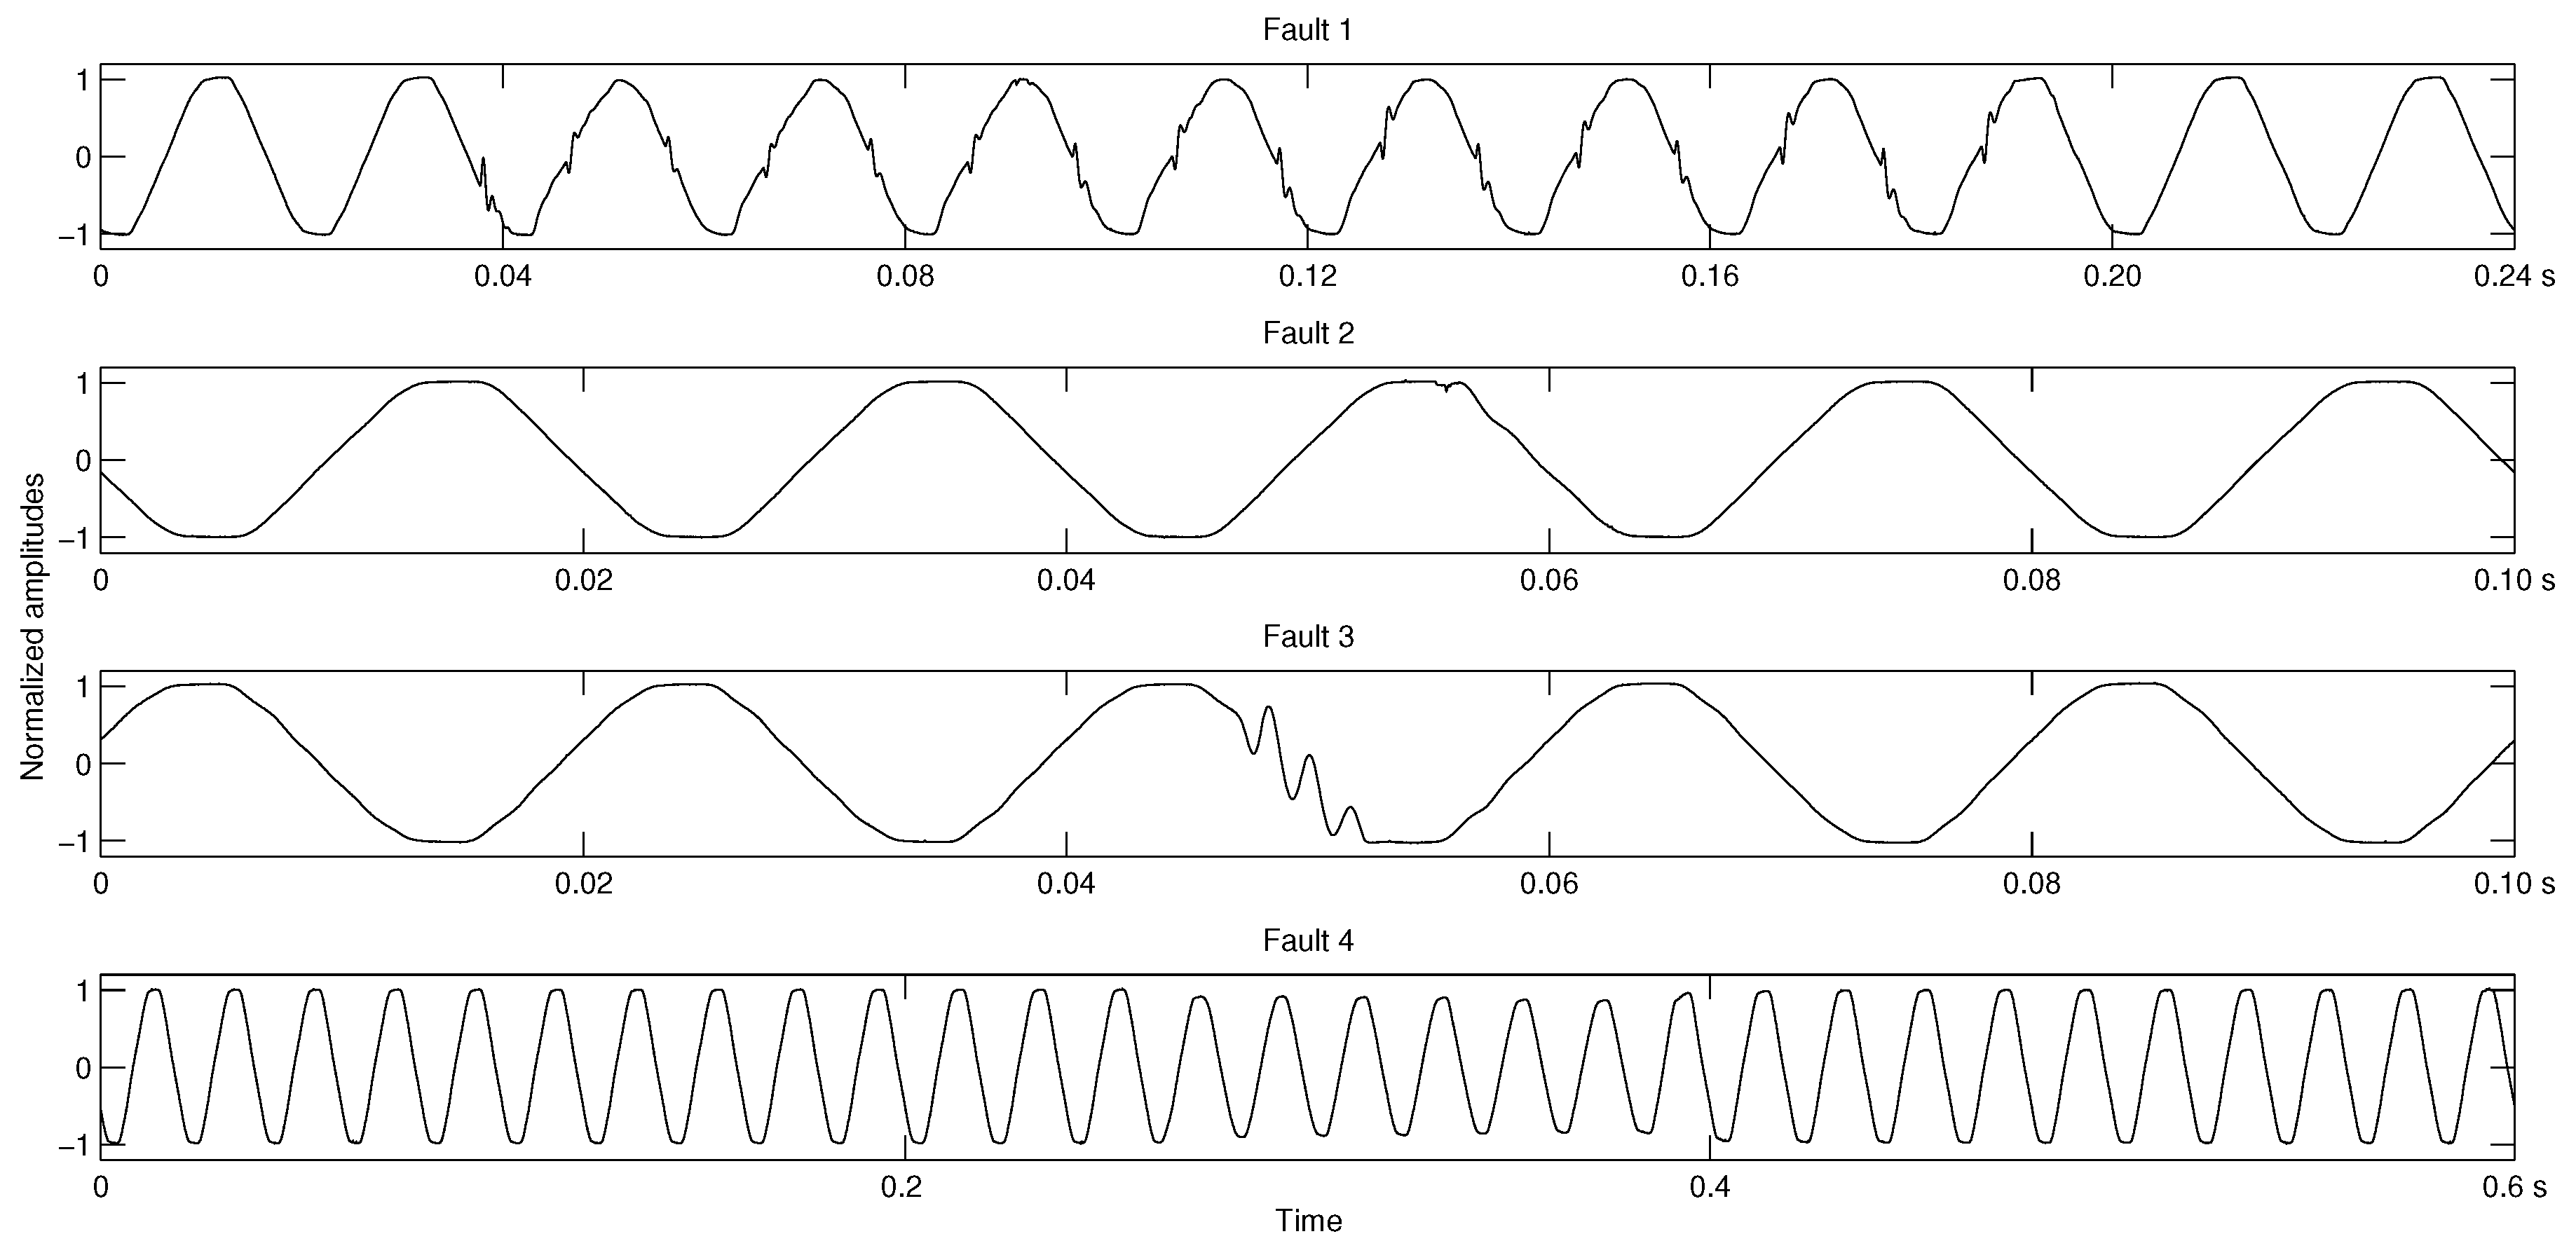
Figure 2 depicts the four types of disturbances to be detected. These have been directly measured at the Polytechnic School’s building, running at a sampling frequency of 10 kHz. The tested faults include a specific (intermittent) harmonic distortion (Fault #1), an impulsive transient (Fault #2,
Dirac Delta), an oscillatory transient (Fault #3), and a voltage sag of 0.15 s approximately (Fault #4). These four cases are representative of the faulty signals that may take place in this location. As a final remark before analyzing each case, it is worth mentioning that the four signals contain harmonics, which are considered to be constant disturbances in the building under study.
Figure 3 shows Fault #1, which illustrates that both significant deformation and long duration of the transients produce important deviations in the HFA and the LFA. The fault takes place within two 10-cycle segments of the LFM computation (between 0.4 and 0.8 s). The LFA shows the beginning of the event and the HFA reveals the harmonic/periodic structure in the 50–400 Hz (2nd, 4th, …, harmonics). The 50 Hz resolution in the HFM cannot be used to determine the harmonic/periodic structure already commented (the result is a continuous red zone in low frequencies since harmonics are 50 Hz equally spaced, which is exactly the resolution of HFM). Additionally, inter-harmonics are targeted in the analysis, as indicated by IEEE 519-2014 [
28] and IEEE 1159-2009 [
25]. On the other hand, this analysis demarcates the limits of the event with a resolution of 1 cycle (between 0.56 s and 0.74 s) and reveals that the frequencies far from the fundamental component have a significant presence during the event. Concretely, the frequencies around 900 Hz are associated with a kurtosis value of 100, revealing the periodic structure.
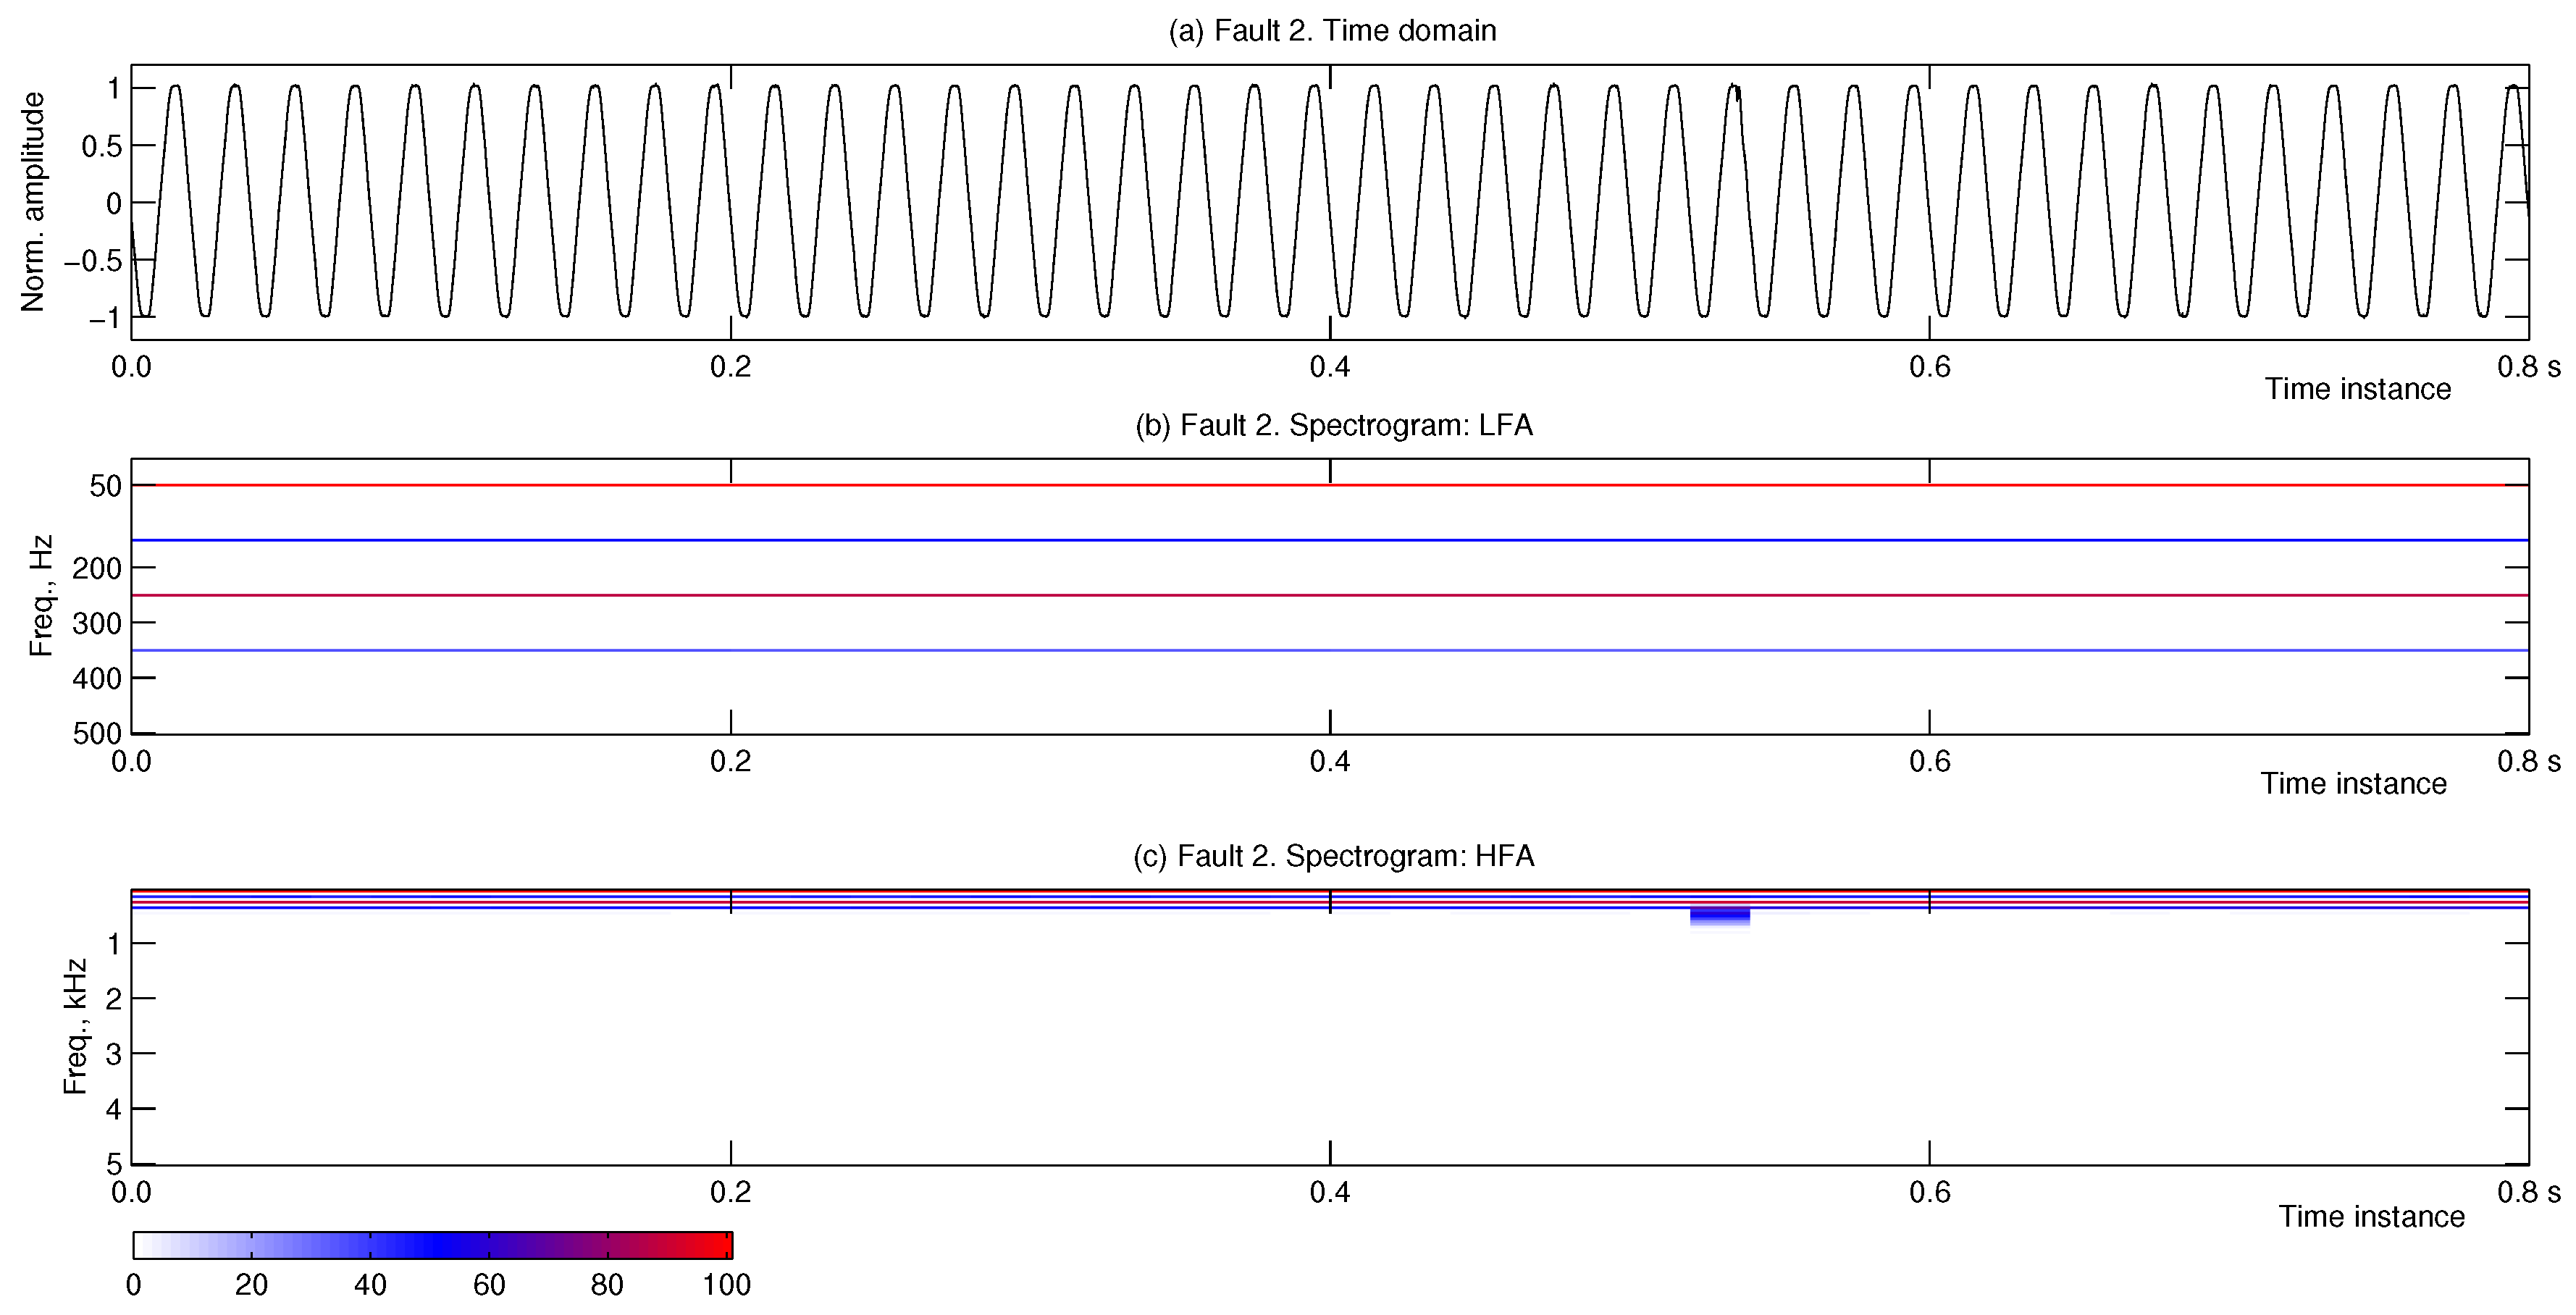
Fault #2, whose analysis is shown in
Figure 4, produces a minor deviation in the 50 Hz line, shown within the LFA; only the commented underlying harmonics are marked during the analyzed period. On the contrary, the event is targeted in the HFA for frequencies lower than 1 kHz.
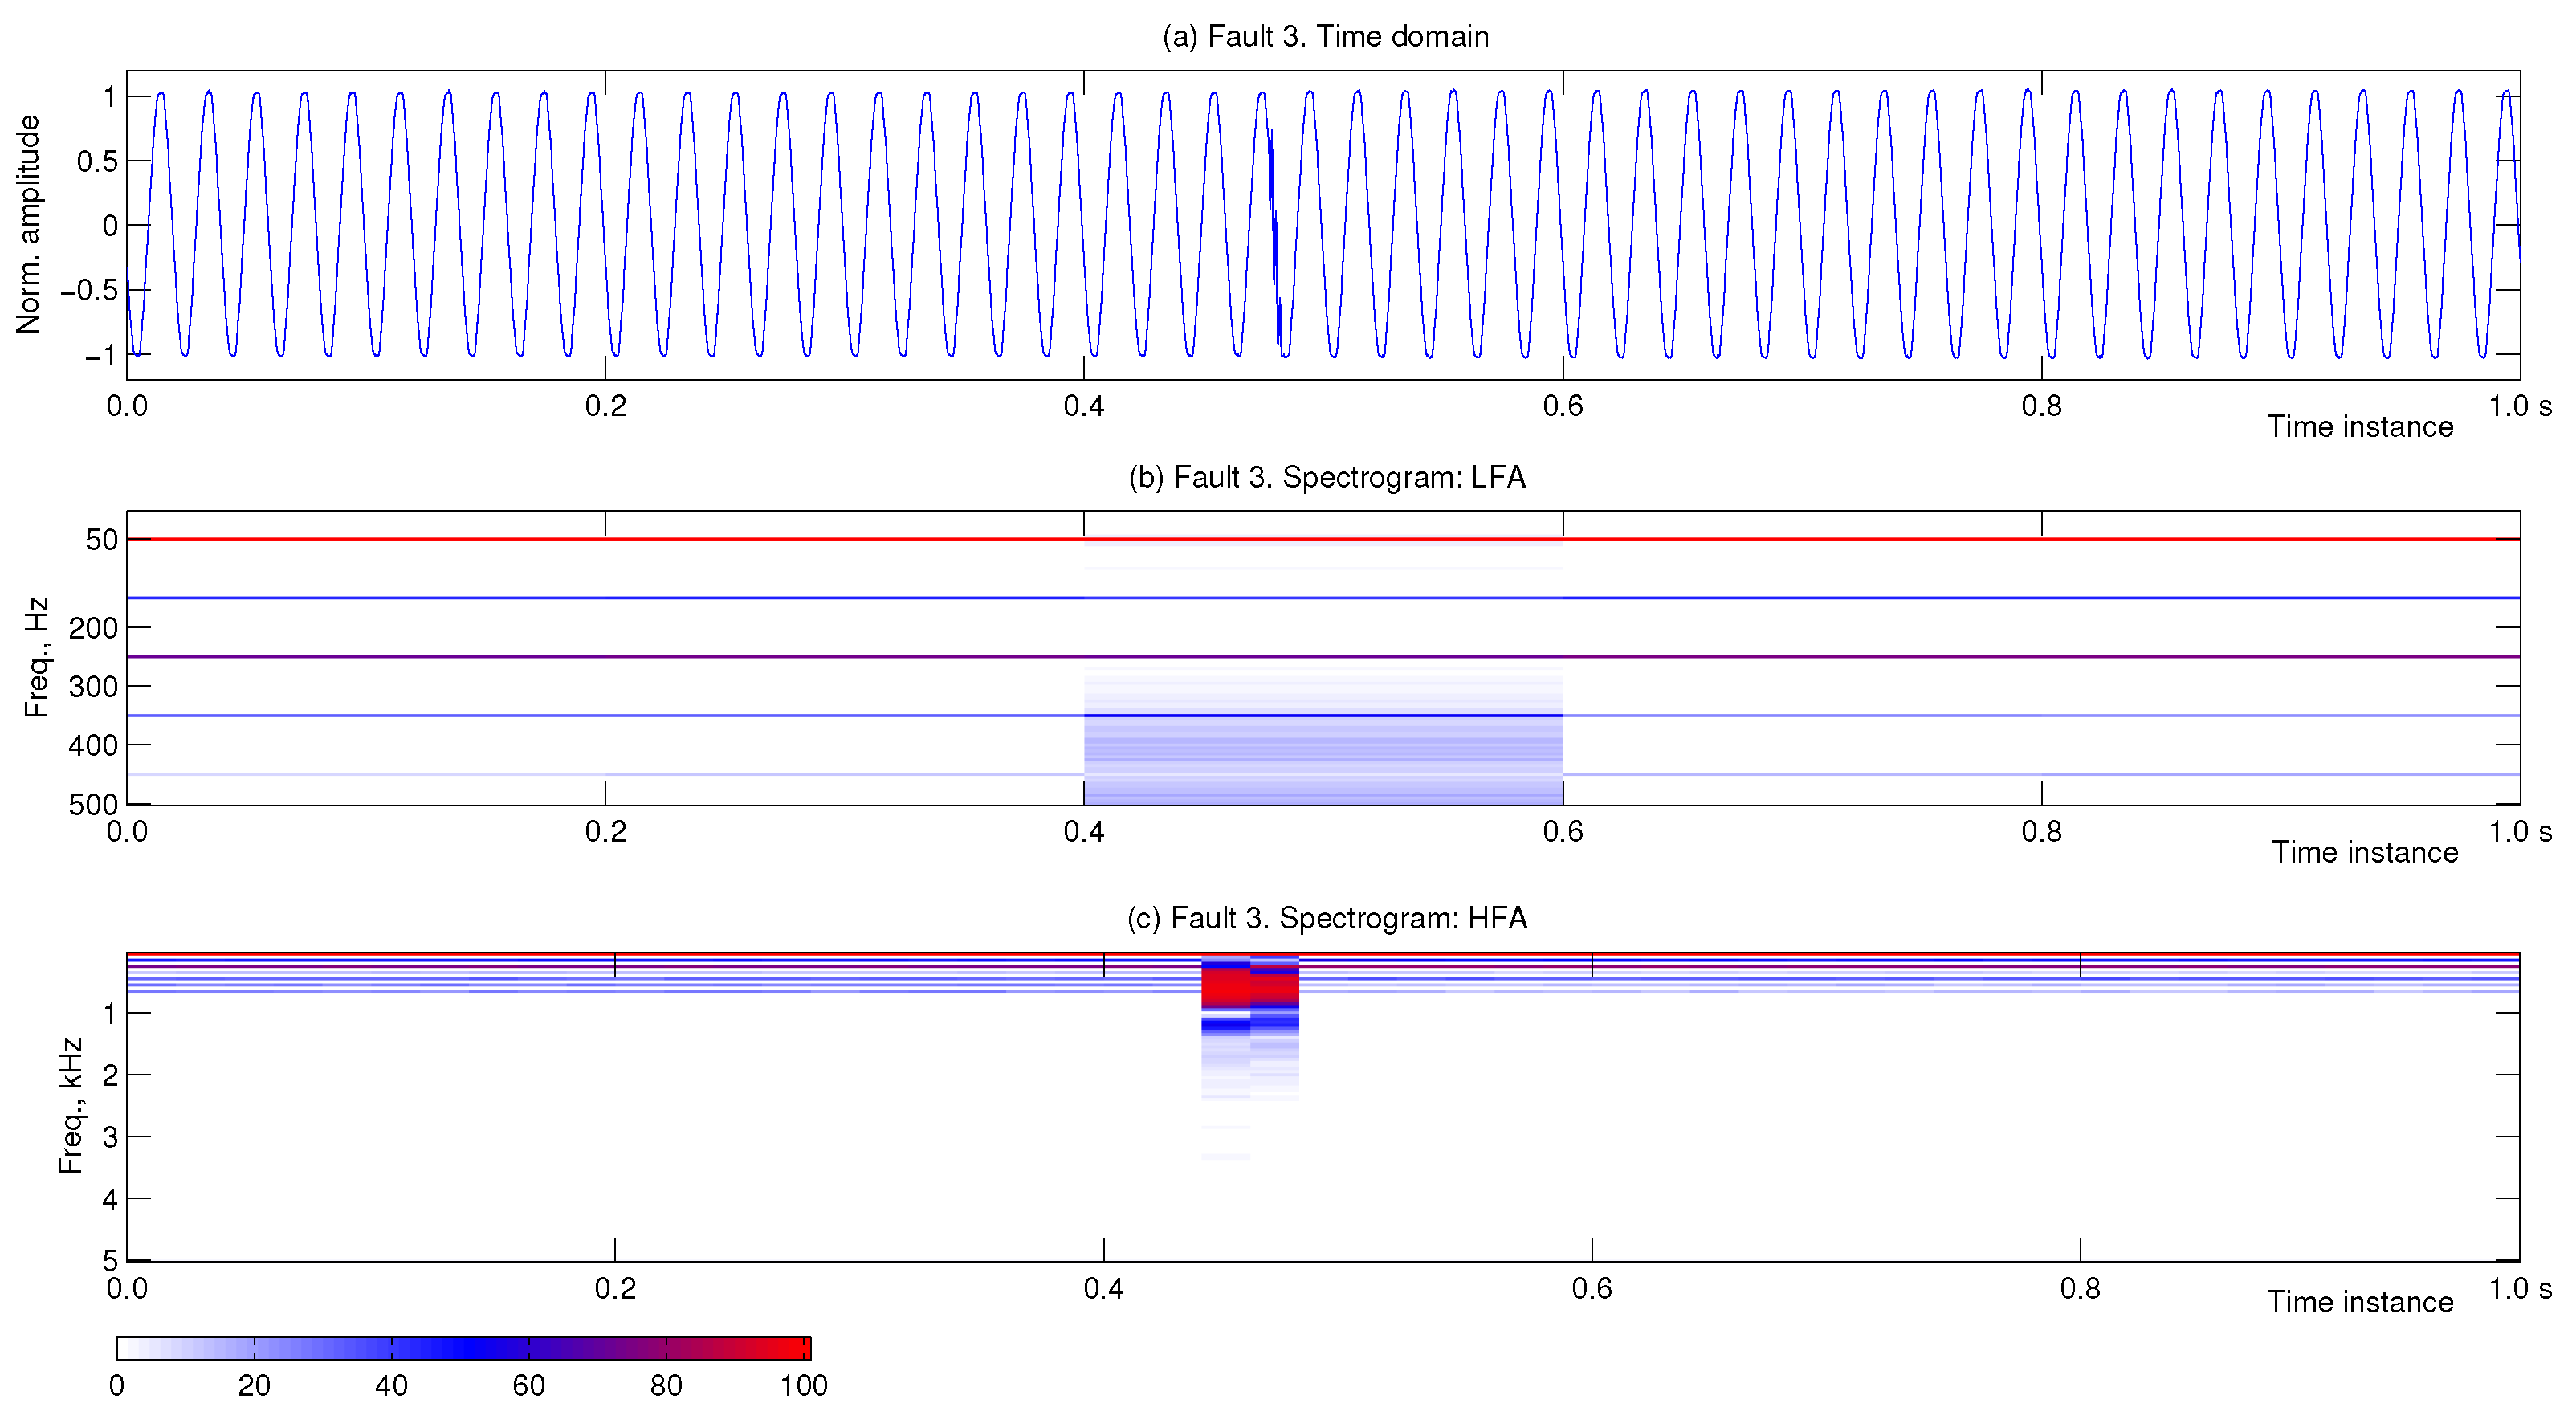
Fault #3 is depicted in
Figure 5 and consists of a 700 Hz oscillatory transient with a duration of 8 ms. Focusing on LFA analysis, the event is short regarding the analyzed 10-cycle segment, but it produces a soft footprint for frequencies higher than 250 Hz. In the HFA, the footprint is clearer and more accurately demarcated, revealing that the most relevant frequencies are centered around 700 Hz.
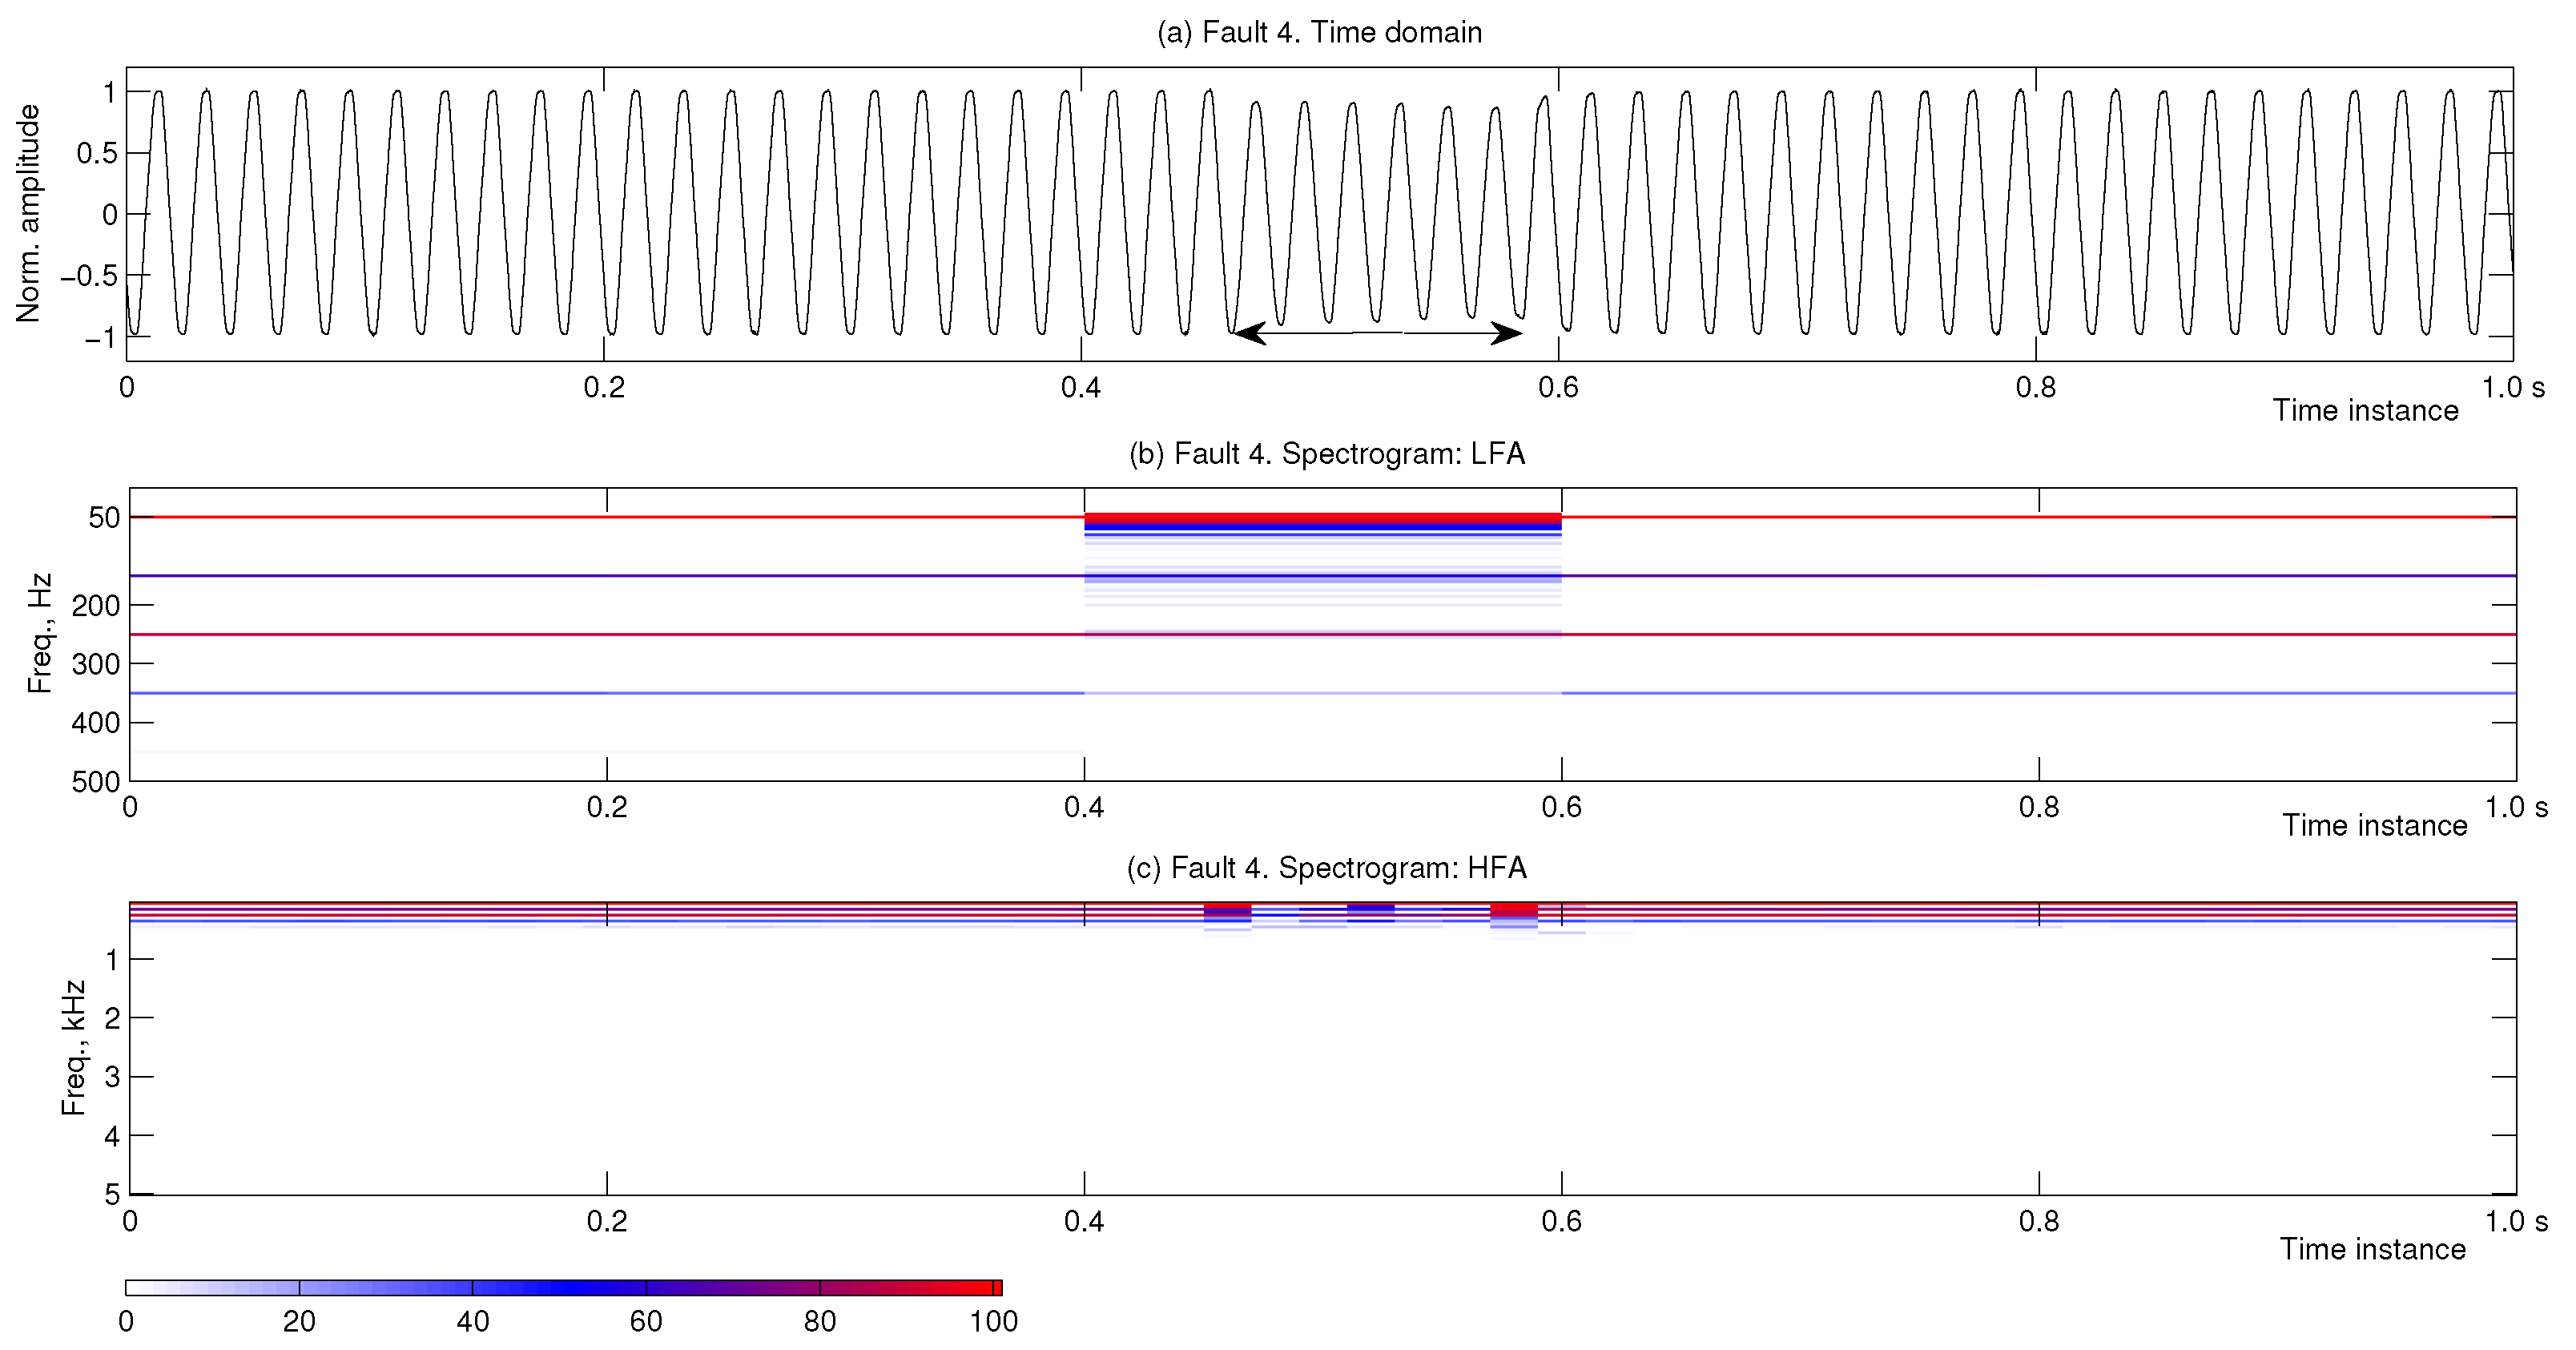
The fourth fault, depicted in
Figure 6, is an 80% sag with a duration of 150 ms. It is entirely included in a 10-cycle segment of the LFM computation (the subgraph in the middle of
Figure 6). In this analysis, the sag seems as it was a dispersion of frequencies around the underlying harmonics, as a result of the sudden change in the edge of the signal (change in the instantaneous frequency) (more intense in the 50 Hz). The HFM output demarcates the beginning and the end of the event, with variations in frequencies below the underlying harmonics. As opposed to the previously seen case studies, effects in the low zone of the frequency range are enclosed.
As has been demonstrated in former case studies, the simultaneous application of the two modules (LFM and HFM) offers highly detailed information in time (thanks to the 0.02 s resolution of the HFM) and frequency domains, especially in the zone of the spectrum of major concern—around the fundamental frequency—thanks to the 5 Hz-resolution offered by the LFM module.
With the aim of quantifying the benefits of this approximation, we gather in
Table 1 the experimental results associated with different strategies. The results are obtained using MATLAB
TM (R2013a, The Math Works Inc., Natick, MA, USA), running under a processor Intel
TM Core i5-2400, 3.1 GHz. (R2013a, The Math Works Inc., Natick, MA, USA). For a proper comparison of these computational strategies, an analysis reference base of 10 cycles of the power-line signal has been adopted. Results in
Table 1 refer to this base. This is due to the fact that the hybrid analysis, whose advantages are to be shown, is completed every 10 cycles of the power-line signal. Indeed, for each of these cycles, an HFM analysis is developed, and, for Cycle 10, a double analysis (HFM and LFM) is performed; the LFA for the last cycle is developed via sub-sampling of the former 10 cycles (initially sampled at 10 kHz) at 1 kHz.
As shown in
Table 1, the temporal resolution for the hybrid and the FSA analysis is the same, but the first one implies a lighter computational and hardware load: a computation time of 0.72 ms vs. 1.63 ms and a sampling frequency of 10 kHz vs. 25.6 kHz. The only disadvantage is related to the top frequency, but this frequency exceeds the analysis conditions (in
Section 4.2).
In comparison with the individual performance of the LFM and HFM, the hybrid model takes the best parts of the two, as it supposes an average increment of approximately 7% of the computation time, in comparison with the individual application of each one.
Regarding the reliability of this computational approach, considering a database of 100 registers recorded from the domestic power supply, the method managed to detect 97% of the electrical disturbances. The two-fold concept (time–frequency) of the spectrogram made the identification more feasible and enabled a double-resolution analysis, features which cannot be addressed by static FFT computation.
6. Conclusions
This work has shown a frequency domain HOS approach to discriminate PQ events that commonly take place in the modern smart grid. The technique uses the fourth-order discrete spectrogram and benefits from mixed time–frequency domain information, which allows the potential area in which the fault takes place to be targeted. The computational strategy enables a 5 Hz resolution in the 0–500 Hz range and a 50 Hz resolution in the 0–5 kHz range to be reached.
The results show that the method detects low-amplitude transients that are likely ignored by traditional detection procedures (not oriented to micro grids), and this, by analyzing the duration and frequency content of the electrical peturbation, may indicate prospective faulty states of elements in a grid.
The computation options (the FSA, LFA, HFA, and hybrid methods) can be implemented in a hand-held instrument. The hybrid approach offers almost the same information as the full surveillance mode but reduces the computation time; this feature postulates the hybrid module as an attractive option.
The proposed two-stage strategy detects low-frequency transients (<5 kHz), offers a temporal resolution of 20 ms, and achieves a frequency resolution of 5 Hz below 500 Hz (not achievable by a one-stage strategy for this temporal resolution). At the same time, the strategy results in simpler electronic specifications: a lower sampling frequency, a lower number of processed points, and, consequently, lower memory necessity and shorter computational time. Moreover, given that the computation time per cycle is 0.72 ms (IntelTM Core i5), there are still more than 19 ms remaining for a low-cost processor solution.
Future work is oriented to implement the measurement procedure in autonomous equipment within the industrial scenario to deal with new kinds of electrical disturbances that appear in the SG as a consequence of the massive introduction of DERs, which also triggers the need for more measurement points along the whole measurement chain.

 ,
, 


