Thermodynamic Performance of Heat Exchangers in a Free Piston Stirling Engine


Offshore Renewable Energy Engineering Centre, School of Water, Energy and Environment, Whittle Building 52, Cranfield University, Cranfield MK43 0AL, UK
*
Authors to whom correspondence should be addressed.
Energies 2018, 11(3), 505; https://doi.org/10.3390/en11030505
Submission received: 10 January 2018
/
Revised: 23 February 2018
/
Accepted: 24 February 2018
/
Published: 27 February 2018
Abstract
:There is an increasing request in energy recovery systems that are more efficient, environmentally friendly and economical. The free piston Stirling engine has been investigated due to its structural simplicity and high efficiency, coupled with its cogeneration ability. This study presents the numerical investigation of quasi-steady model of a gamma type free piston Stirling engine (FPSE), including the thermodynamic analysis of the heat exchangers. Advanced thermodynamic models are employed to derive the initial set of operational parameters of the FPSE due to the coupling of the piston’s (displacer and piston) dynamics and the working process. The proximity effect of the heater and cooler on the regenerator effectiveness in relation to the heat losses, output power, net work and thermal efficiency of the FPSE are also observed and presented in this study. It can be observed that at temperatures of 541.3 °C and 49.8 °C of the heater and cooler, respectively, with heater volume of 0.004 m3, regenerator volume of 0.003 m3 and cooler volume of 0.005 m3, the FPSE produced an output performance of 996.7 W with a thermal efficiency of 23% at a frequency of 30 Hz. This approach can be employed to design effective high performance FPSE due to their complexity and also predict a satisfactory performance.
1. Introduction
A lot of investigations and studies have been conducted on the use of renewable sources of energy due to the growing demand for energy forms that are both less polluting and friendly to the environment. The Stirling engine is an external combustion reciprocating machine that transforms thermal energy to mechanical energy and to electric power. This engine has been considered due to its cogeneration feature and ability to use different types of fuel, such as biomass, geothermal, solar and fossil fuels [1]. The free piston Stirling engine (FPSE) design is configured with the moving elements (piston and displacer) connected to mechanical springs and dampers. The stability of the FPSE is a challenging factor due to the nature of the configuration, although the configuration is simple compared to the Stirling engine. The major advantages of the FPSE over the Stirling engine are: less complex mechanical configuration, high thermal to mechanical energy conversion and high durability [1]. The lack of a rotating shaft is a major disadvantage exhibited by the FPSE in theory due to the complexity in determining the right spring stiffness and damping load for the displacer and pistons, but this is not a major problem in practice [1]. A study has been conducted on the FPSE such as; a dynamic model presented by Riofrio et al. [2] on the application of linear control methods to design the FPSE in relation to the stability of the engine, considering the influence of the parameters such as temperature and damping. The stability analysis of the FPSE was carried out by Bégota et al. [3] by evaluating the eigenvalues of state matrix and the model was validated against the experimental results from NASA. A numerical investigation was conducted by Sowale [4] on the three different models (isothermal, adiabatic and quasi-steady) of the gamma type FPSE, where the thermodynamic and dynamic equations were solved simultaneously to analyse the engine operation, and the output results of the models were compared and the model with the best output performance was highlighted and validated. Formosa and Frechette [5] carried out a study on the scaling effects on FPSE, considering the parametric geometry design of the heat exchangers and masses of the pistons in relation to the losses in the engine. Also the effects of leakage due to the piston’s position during manufacture were considered. The results indicated that the scaling laws could predict the potential output power and efficiency of the miniaturized engine. A dynamic model of the FPSE, with four degrees of freedom combined with a thermodynamic sub model, was developed by Chmielewski et al. [6], considering the isothermal behaviour of the expansion and compression spaces during simulation. The results presented the relationship between the dynamic and thermodynamic characteristics of the FPSE. The linearization of the dynamic equation of a free piston engine generator was carried out by Jia et al. [7] and the equation was simplified to a forced vibration one degree system with viscous damping. The results from the piston displacement at steady state were compared to the experimental results from a prototype and showed a good agreement, with an error of 3%. Optimization was conducted on a dual FPSE designed for use as a micro-CHP (Combined Heat and Power) system for heat and power generation by Boucher et al. [8]; a theoretical study of the dynamic characteristics of the engine connected to a linear alternator was presented, and the working gas non-linear effects and electromagnetic forces were considered in the simulation. Mikalsen and Roskilly [9] presented an investigation into a spark ignited free piston engine generator using computational fluid dynamics (CFD) and compared the output to a conventional engine. No obvious advantage over the conventional engine was recorded and it was concluded that the feasibility of this technology depends on the concept generated and flexibility. A numerical model of the FPSE was presented by Jia et al. [10]; the simulation of heat transfer and leakage of the working gas were taken into consideration and the working process of the work spaces were defined as non-isentropic. The output result was validated against the prototype and showed good agreement in the output performance. A free piston linear alternator was presented in [11]. In order to increase the thermal efficiency of the engine, a scavenging system was developed using CFD. The piston motions were modelled using MATLAB for a time-based numerical simulation, as the piston dynamics could not be modelled accurately using CFD. The results indicated that the system had a high potential to achieve high trapping efficiencies and scavenging. A free piston engine model was developed by Zhang et al. [12] where an active motion control for the engine was presented. The mechanism created the possibility of controlling the temperature, pressure and volumes of the work spaces in real-time. The results presented the effects of the piston’s amplitude on the combustion working gas temperature, indicated output and work done. An experimental investigation into the start-up process of the free piston engine generator was presented by Jia et al. [13]. The results showed the non-linear increment in the cylinder pressure and compression ratio, and steady state was achieved after a number of cycles. Xiao et al. [14] developed a mathematical model of the free piston linear engine. The characteristics of the moving elements and natural frequency were defined. The results indicated that the system was operated by forced excitation with variable stiffness and damping coefficient. The convergence formed from the velocity of the piston and displacer, and their amplitudes, indicated the stable operation of the system. Parametric design for a free piston engine using semi-analytical method was developed by Wu et al. [15] in their study; the stable operation of the piston’s oscillation and the effects on the engine performance were observed and presented. A modified FPSE was developed by Yang et al. [16] where thermodynamic analysis was carried out on the model using a thermoacoustic theory. The analysis was employed on a prototype FPSE with certain input parameters and the parameters were then modified. The results presented a similar thermodynamic performance when compared to the original design. Kim et al. [17] presented a numerical simulation to observe the effect of the combustion phase and pistons motion in an FPSE. The results showed how the best conversion efficiency to work from combustion can be achieved with various spark timings for a given piston initial velocity.
Considering this review, although a number of studies on the FPSE have been conducted, none have really considered an extensive study on the impact of the heat exchangers on the engine’s performance. Hence, a methodical approach is required on the investigation of the second order modelling of the FPSE, especially on the thermodynamic influence of the heat exchangers on the engine’s performance. In this present study, an algorithm on the advanced numerical framework of the quasi-steady state of the FPSE is implemented. The numerical investigation of the FPSE is carried out by solving the dynamic equations of the piston and displacer, including the damping load and spring stiffness, by using the fourth order differential equation solver in MATLAB. This study considered the effect of the thermodynamic equations and the motions of the piston and displacer simultaneously with defined steady state criteria and convergence solutions, including the heat exchanger’s effect on the temperature of working gas and thermal losses, taking into account the effect of the heater and cooler on the regenerator in order to predict the overall performance output of the engine. Sensitivity analysis on design parameters, such as the influence of temperature of the heat exchangers and regenerator porosity on the engine performance, are also observed and presented.
2. Methodology
2.1. Thermodynamic Cycle of the Stirling Engine
The Stirling engine has four phases in its working cycle (Figure 1):
- Isothermal compression (1–2): At the first stage of the cycle, there is compression of the working fluid between the moving elements (piston and displacer) by their oscillatory movements.
- Isochoric heating (2–3): The working fluid flows via the heat exchangers and there is heat transfer from the regenerator to the working fluid as the temperature increases.
- Isothermal expansion (3–4): At this stage, the working fluid exerts pressure on the displacer during the expansion in the hot space.
- Isochoric cooling (4–1): In the last stage of the cycle, there is heat transfer from the working fluid to the regenerator as it moves back via the heat exchanger.
2.2. Principle of FPSE Operation
The FPSE is a thermal-driven harmonic oscillator functioning on a Stirling engine cycle. It possesses no constrained oscillating components, unlike the kinematic Stirling engine. The FPSE consists of major components, such as piston, displacer, springs, dampers and heat exchangers. The design of the engine is configured to allow the expansion space of the working gas volume that exists between the cylinder and displacer, compression space between the piston and the displacer, and the bounce space volume present in between the cylinder and the piston acting as a gas spring. The engine dynamics are determined by three types of forces (the forces acting on the piston and displacer due to their relative displacements: the forces acting on the piston and displacer as a result of their velocity; and the forces on piston masses due to acceleration). For adiabatic expansion and compression, the force due to displacement is proportional to the respective displacement and similar to a linear spring force since the working gas is assumed to be an ideal gas. The pressurized working gas exerts force on the piston and sets the spring in motion. The force due to velocity is equivalent to the relative velocity and similar to the linear damping force. The layout diagram of a typical gamma type FPSE is shown in Figure 2.
2.3. Specifications for the Free Piston Stirling Engine Model
Certain specifications were defined in order to obtain the mathematical model of the FPSE:
- The heat losses are considered in the simulation.
- Under static equilibrium, the pressure of the working gas volume corresponds to the block pressure.
- The engine walls’ temperature encompassing the volume of the working gas varies with time.
- Leakage of working gas is not considered and is not expected to occur in the engine.
- The working gas is an ideal gas.
- The regenerator temperature is required to be corresponding to the average temperature of the cooler and heater.
- The FPSE is in a steady state operation.
Hence, a wider applicability of these specifications can be employed for the design of FPSE of much higher or lower dimensions according to the required scale.
2.4. Equations Used in the Mathematical Model
In this study, the quasi-steady state approach was considered for numerical simulation of the gamma type FPSE. This is an advanced mathematical model employed to predict the performance of the FPSE in real time, considering the displacer and piston’s oscillatory motion and how it is influenced by the pressure, temperature, mass and volume of the working gas including thermal losses, in order to provide better accuracy in the description of the engine’s working process; however, this approach requires significant time for computation. The motions of the displacer and piston are determined in order to predict their amplitudes, velocity and acceleration, and they are derived with respect to the masses of the displacer and piston, the damping force, spring force, surface area and pressure of the working gas.
Equations used in the mathematical model are presented in Table 1. For the motion of the displacer and piston represents the displacer’s mass, displacer’s spring stiffness, displacer’s damping load and displacer’s cross-sectional area. The motion of the piston is defined as a result of the damping force, spring force, area of piston, the bounce space pressure and the pressure of the working gas. represents the piston’s mass, piston’s spring stiffness, piston’s damping load, piston’s cross-sectional area and bounce space pressure in the piston’s compartment. From the equation of ideal gas, the pressure equation in the engine for a closed cycle operation is defined and obtained from [18]. Considering the geometry of the engine, piston and displacer’s positions and including the work space volumes Ve and Vc are determined. The gas temperature derivatives in the expansion and compression spaces are also presented. The working gas temperatures in the parts of the regenerator are determined. Where and represent the working gas temperature of the and parts of the regenerator space. Where is the number of regenerator’s part from one to four. The energy conservation equation applied to each of the control volumes (expansion and compression spaces, the heater, cooler and four parts of the regenerator) are also defined. Where, the mass of working gas in the cooler is denoted by , and is the work done in the compression and expansion spaces, , and are the heat transfer in the cooler, regenerator and heater. The conservation of energy equations for each control volumes are determined using the ideal gas state equation including equation for the work done in the work spaces, and the characteristics of the working gas [4].
Many correlations have been derived from the experimental investigation of the oscillating flow in the regenerator as a result of the considerable effect on the performance of Stirling engines. To determine the heat transfer coefficient and friction factor, the calculation for various correlations presented by Thomas and Pittman [19] are employed. Hence, the friction factor of the regenerator is determined. The coefficient of heat transfer on the surfaces of the heater and cooler and the equation used to determine the heat loss from conduction in the heat exchanger is given. Where, is the thermal conductivity, is the cross-sectional area and is the length. and are used to determine the temperature difference between the heat exchangers. The heat transfer from the first part of the regenerator to the fourth part due to heat conduction in relation to the environment is defined as external conduction heat loss. It also accounts for the heat transfer from the regenerator’s part with a higher temperature to the part with a lower temperature. This is applicable only to the regenerator. Where, is the free surface area, is the effectiveness of the regenerator, are used to determine the temperature of the regenerator matrix and the regenerator part. To calculate the rate of heat transfer in the heat exchangers, is the heat transfer coefficent and is the heat loss due to the heat conduction. The derivative for the total pressure in the engine is obtained by summing all the energy equations and losses and the work done in the cycle is determined. Hence, the power output is derived as a function of work done and frequency.
For accurate description of the working gas flow in the work spaces and heat exchangers, certain boundary conditions were developed to control the temperatures and mass flow rates. The boundary conditions used for the mathematical model are presented in Table 2. The temperature of the working gas across the boundary between the heater and the expansion space is defined and the conditional temperatures of the mass flow rate from the first part of the regenerator to the heater are described. Where is the mass flow rate from the regenerator’s first part to the heater (kg/s). is the temperature of the mass flow rate from the regenerator’s first part to the heater. is the temperature of the regenerator’s space to the heater. The constraints for mass flow rate from the cooler to the regenerator’s fourth part is obtained. Where, is the mass flow rate from the cooler to the regenerator’s fourth part (kg/s). is the temperature from the cooler to the regenerator’s fourth part. is the temperature of the cooler space. is the temperature between the regenerator and the cooler. For the compression space to the cooler the constraints for mass flow rate is determined. Where, is the mass flow rate from the compression space to the cooler. is the temperature from the compression space to the cooler. is the temperature of the compression space. represents mass flow rate from heater to expansion space (kg/s). is the temperature of the mass flow rate from the heater to the expansion space. is the temperature of the heater and is the temperature of the expansion space.
3. Results and Discussion
The mathematical equations developed were used in the numerical simulation to determine the performance of the quasi-steady state model of the FPSE. Initially, input values for the constant and variable parameters were defined and the geometry of the piston and displacer, including characteristics of the heat exchangers, were determined.
3.1. Numerical Simulation Procedure
The motion equations of the displacer and piston are simplified into four first order differential equations and Runge-Kutta (rk4), which solves fourth order differential equations is utilized to solve all required equations concurrently. The rk4 method is employed based on its computing accuracy, efficiency and ability to accommodate various numbers of functional evaluations which is required and applicable to this study. The initial positions of the piston and displacer are defined and the temperature of the work spaces were defined as constant temperatures. In order to obtain accurate description of the regenerator temperature, this was determined from the average of the algebraic sum of the heater and cooler temperatures. The correlations of heat transfer and friction factor are used to determine the heat flow rate and thermal losses in the heat exchangers; the regenerator is divided into four parts to observe the influence of the heater and cooler on the regenerator, which determines the effectiveness and thermal efficiency of the engine. The simulation is computed over 1000 time steps in five cycles until the steady state condition of the engine is resolved. The steady state condition criteria is achieved while the regenerator temperature is computed every cycle, and the indicated work, efficiency and power are determined, once the sum of the heat losses and heat transfer in the regenerator equals to zero. A methodical solution is also developed and applied to the algorithm in the numerical simulation in order to obtain a solution to the stable operation of the FPSE considering the damping load of the piston and displacer. This is computed every iteration at a defined increment for every cycle, and the convergence criteria for calculating the output power and efficiency of the engine is defined at the instance, when the generated values of the damping loads correspond to the instance when the values of the temperature of the work spaces at the beginning of the cycle is the same at the end of the cycle.
The flow chart in Figure 3 shows the procedure for the numerical simulation with the mathematical equations developed to determine the performance of the quasi-steady state model of the FPSE.
3.2. Model Validation
The comparison of the output from the experimental test on the RE-1000 Sunpower (Sunpower Inc., Athens, OH, USA) FPSE developed and evaluated in [18] with the quasi-steady model used in this study is presented. The parameters of the aforementioned FPSE prototype is listed in Table 4, and the output results obtained from the numerical model shows similar results in terms of output power, net work, amplitude ratio and phase angle, particularly in simulation 1. The values shown in the present simulation gives a better agreement with the experimental output of the RE-1000 FPSE. The results are presented in Table 5.
3.3. Numerical Simulation Results
The results obtained from the simulation on the operational performance of the gamma configuration of the engine are discussed below. The engine parameters of the gamma type FPSE is designed to produce an output power of 1000 W [18]. Figure 4, Figure 5, Figure 6, Figure 7, Figure 8 and Figure 9 illustrate the displacements of the piston and displacer, the volumes of the work spaces, the pressure to volume diagram showing the work done in the engine, bounce pressure, the heat losses in the heat exchangers, performance of the heat exchangers on the working gas, and the overall performance of the FPSE.
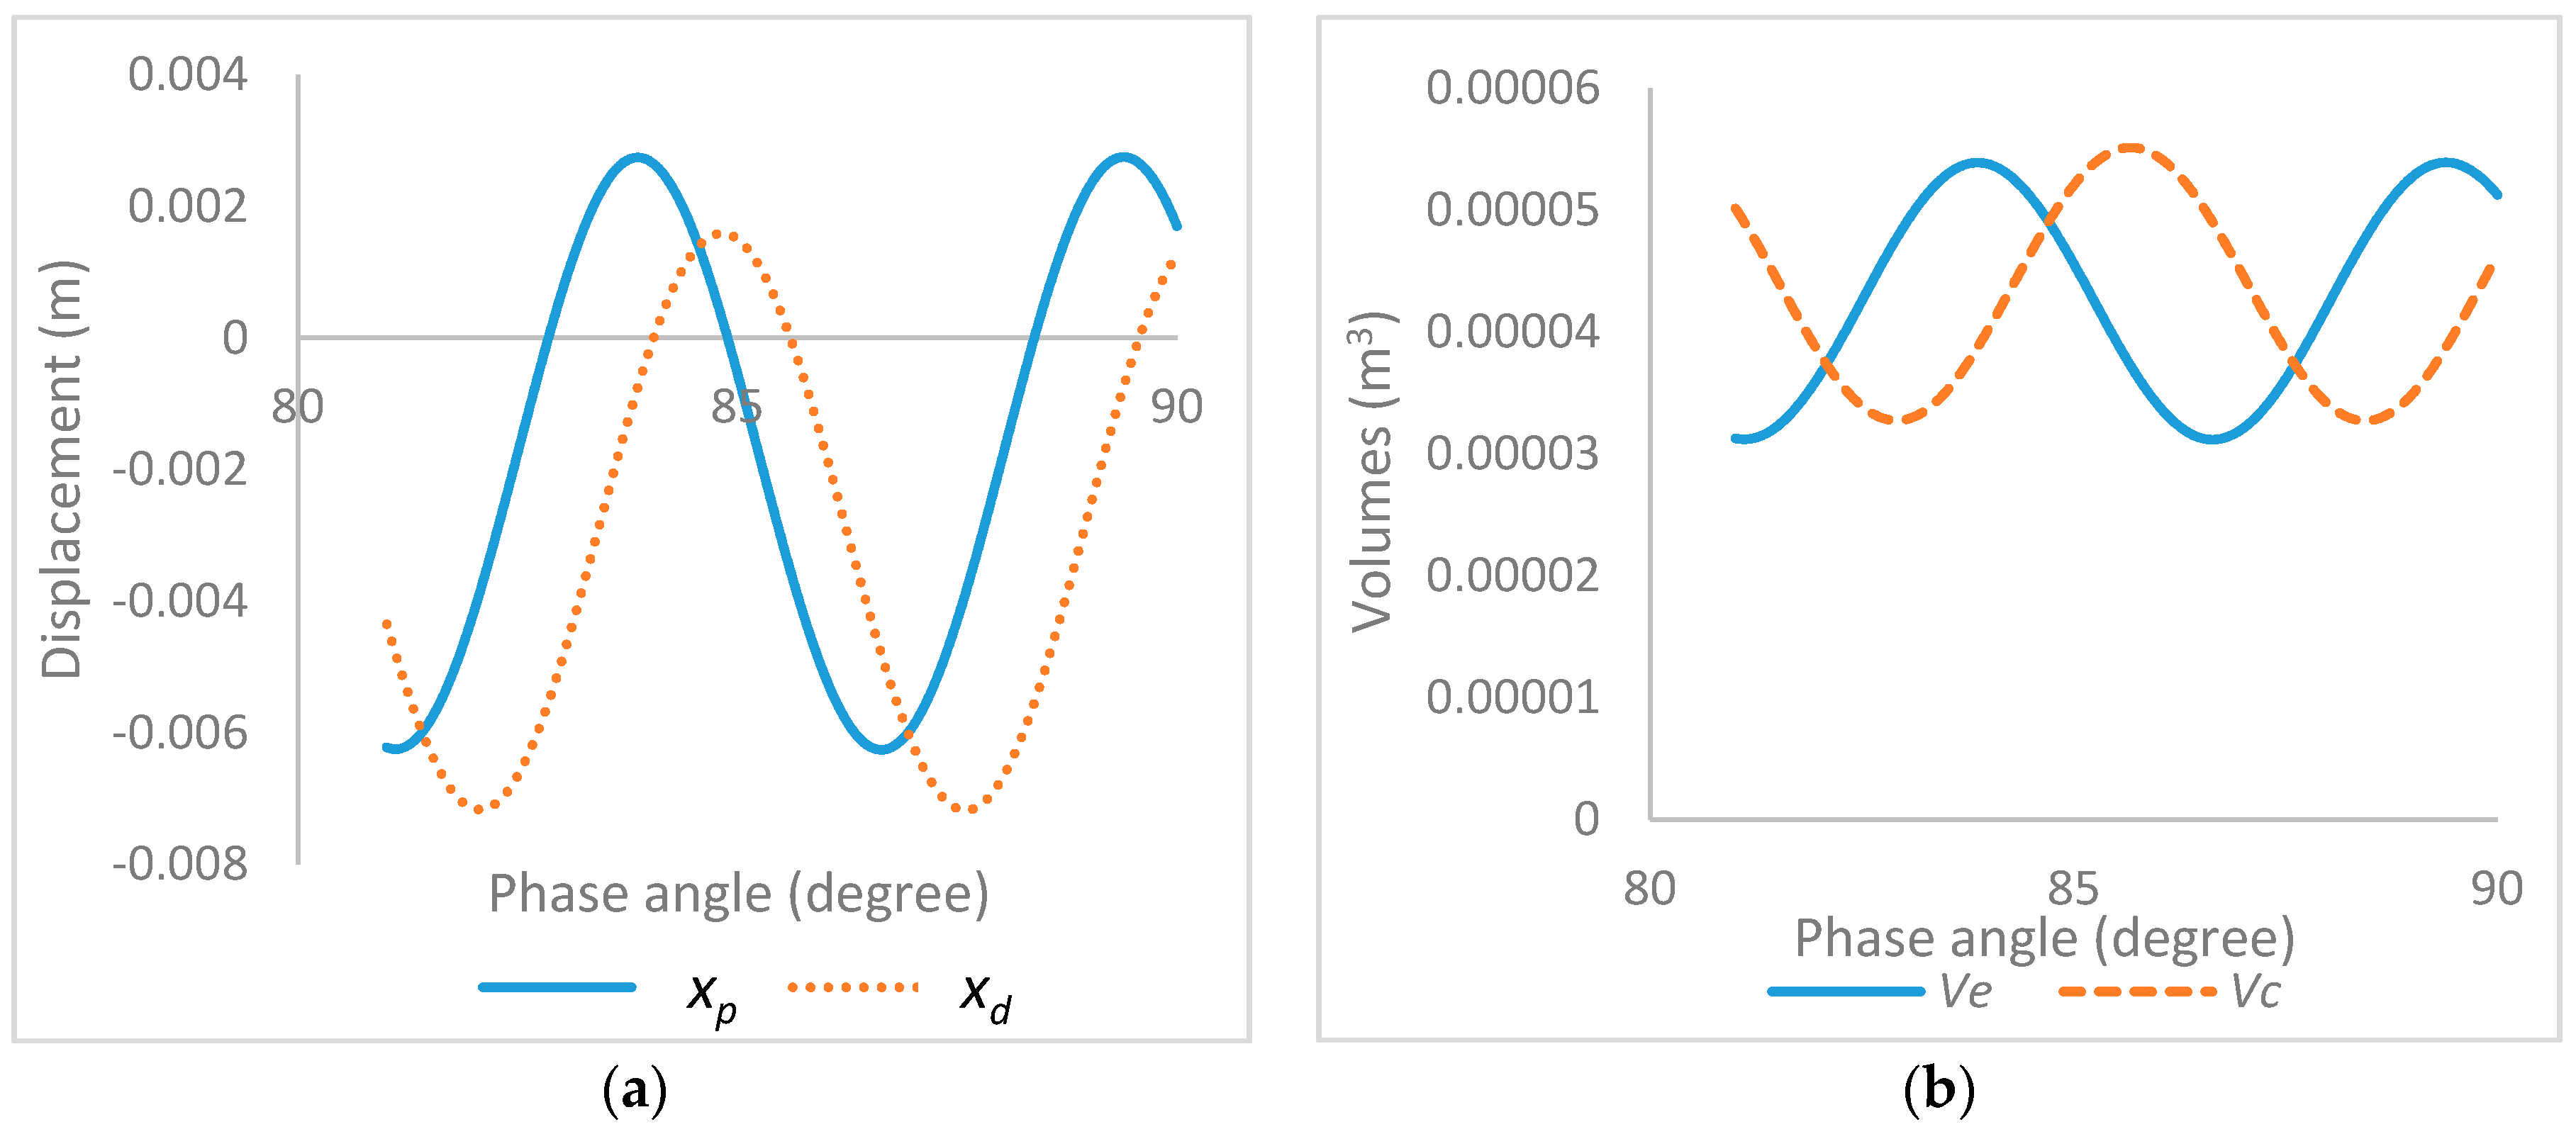
The displacement of the piston (xp) and displacer (xd) is shown in Figure 4a. The displacer has a maximum displacement of 0.0027 m at a phase angle of 84° and minimum displacement of −0.006 m at a phase angle of 87°, while the piston has a maximum of 0.0016 m at 85.1° and a minimum displacement of −0.007 m at 87.6°. This shows the amplitudes of the piston and displacer with respect to the spring stiffness and damper during the oscillatory motion in the engine. These maximum and minimum amplitudes also show the positions of the piston and displacer at the top and bottom dead centre in their respective compartments.
Figure 4b shows the volumes of the work spaces against phase angle. In the expansion space, the maximum volume is 0.00053 m3 at a phase angle of 84° and the minimum volume is 0.00031 m3 at a phase angle of 87°, while in the compression space, the maximum volume is 0.00055 m3 at a phase angle of 85.8° and minimum volume of 0.00032 m3 at a phase angle of 88.5°. The phase angles of the displacer at its maximum and minimum displacement correspond to the phase angles of the maximum and minimum volumes of the expansion space, while the phase angles of the piston at its maximum and minimum displacement vary slightly with the phase angles in the compression space due to the temperature and pressure exerted on the volume of the working gas, which affects the mass flow between the heat exchangers and compression space.
The clearance volumes above the expansion and compression spaces show the volume between the top and bottom dead centre of the piston and displacer in the cylinder. This shows the volume of the working gas converted into useful work in the cylinder and the dead volume not swept by the piston and displacer movement.
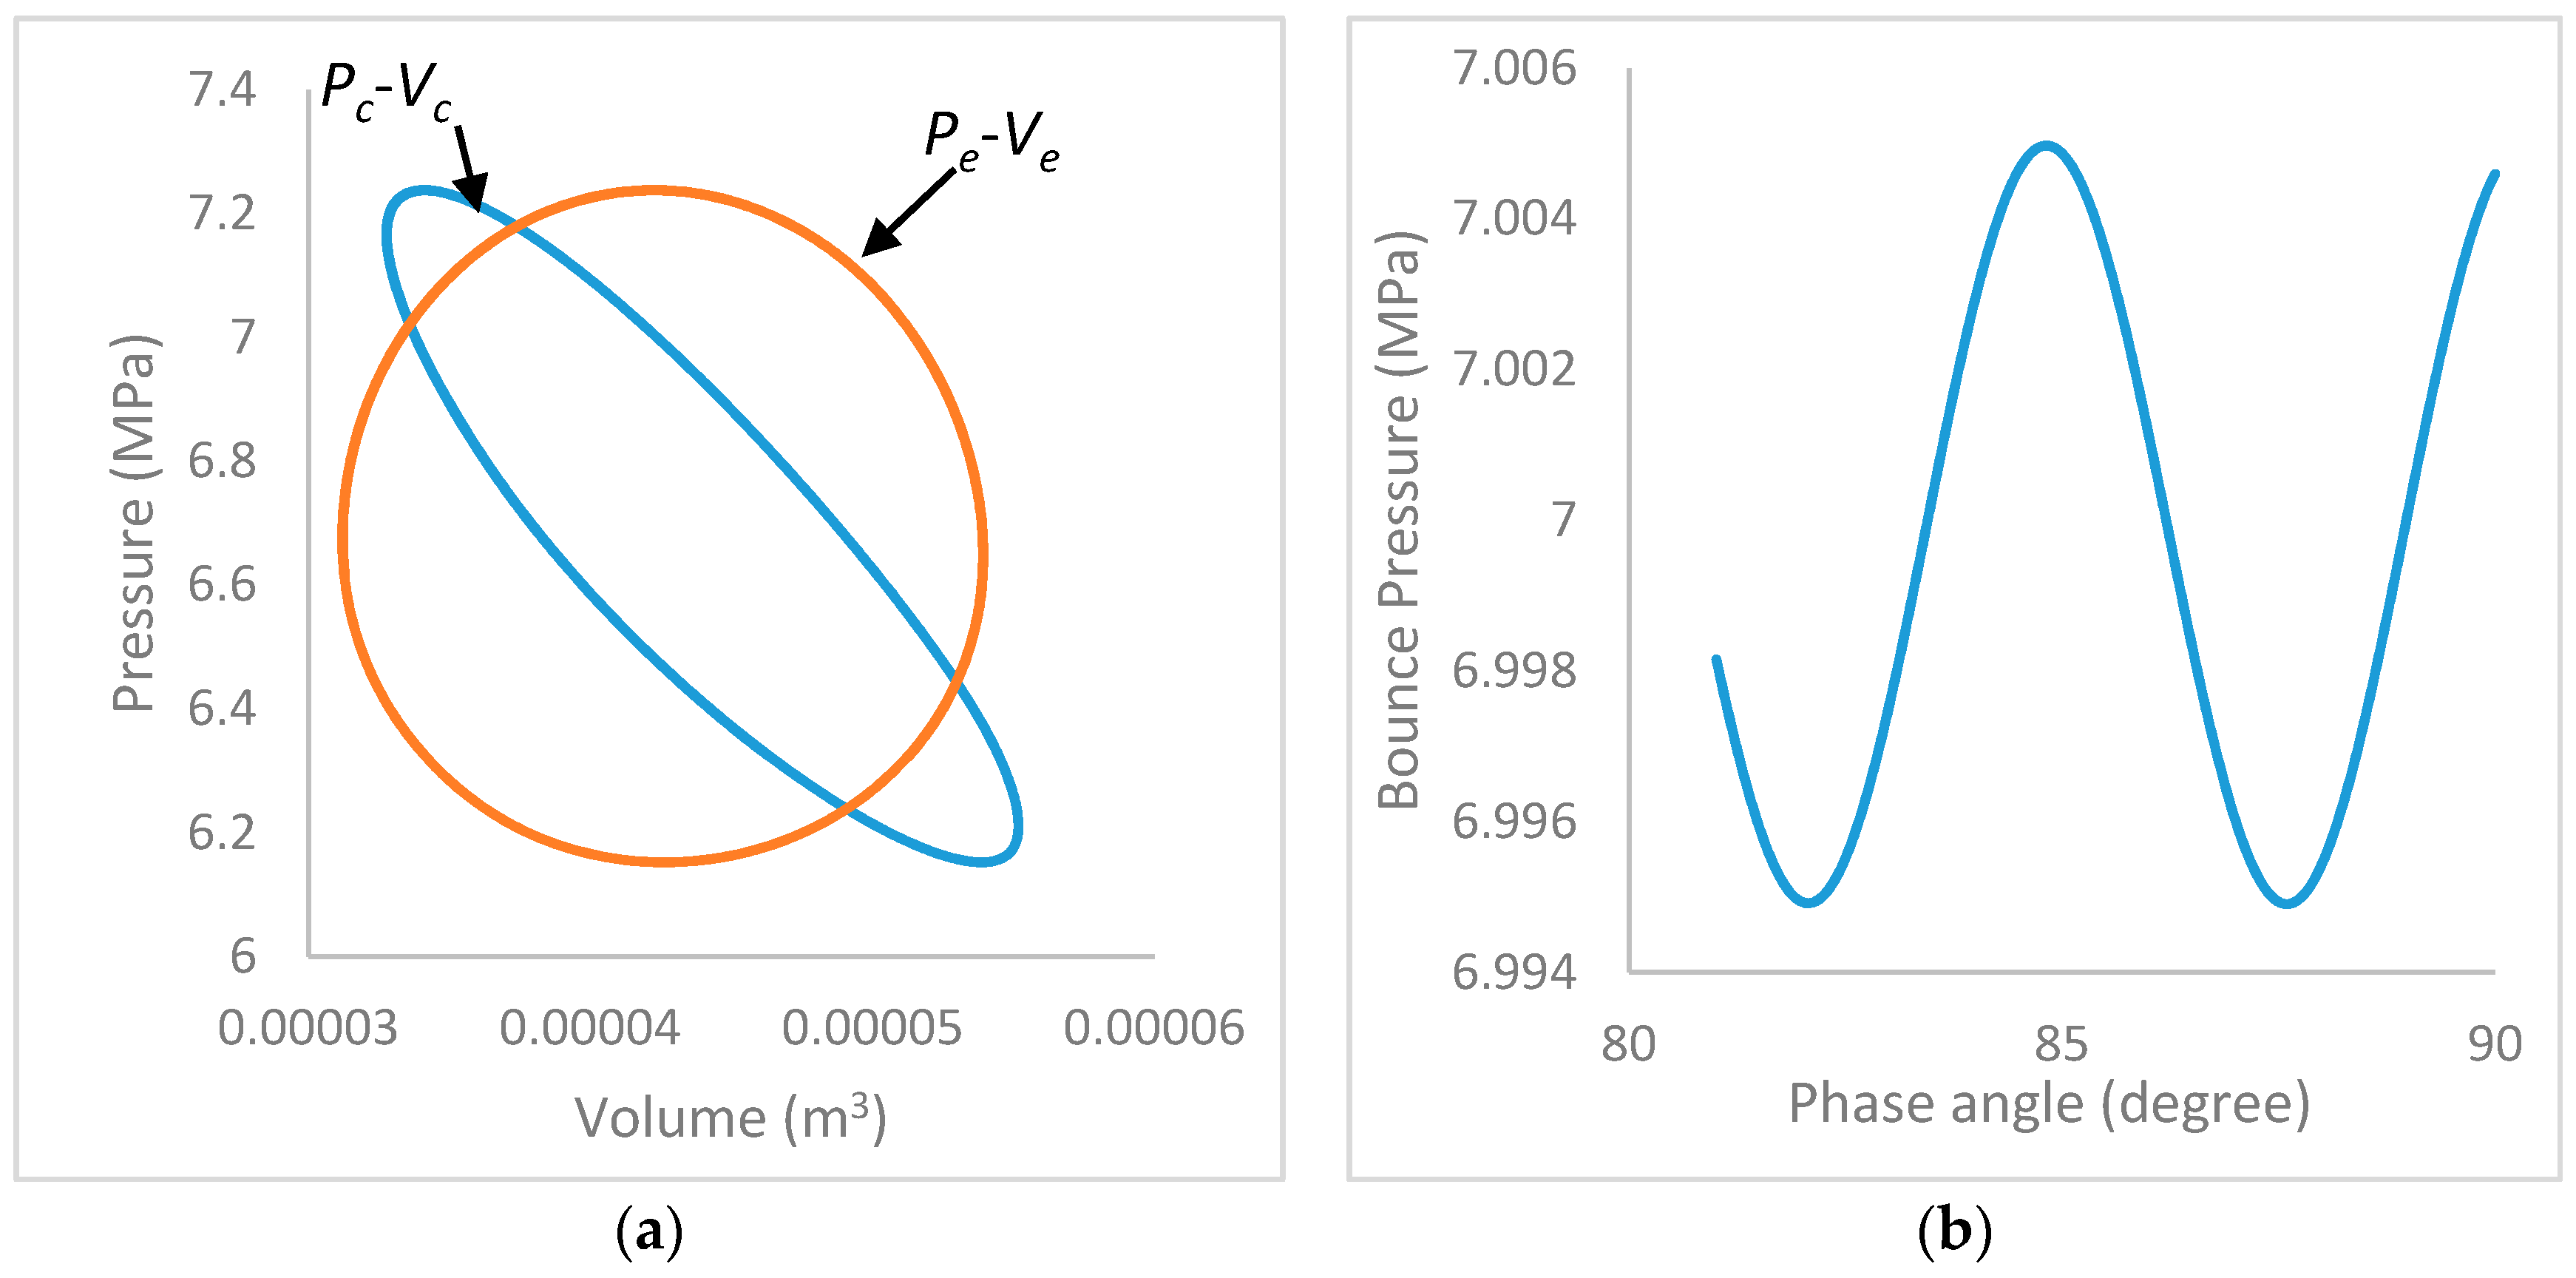
The pressure to volume diagram in the work spaces is shown in Figure 5a. The two diagrams represent the relationship between the pressure and difference in the working gas volume of the FPSE. The area enclosed by the curves illustrates the indicated work done in the work spaces. The oblong shapes formed are due to the dead volume in the work spaces, as the dead volume represents no work done. This is similar to the ideal Stirling cycle but different in the enclosed shape. The pressure variation in the expansion (Pe) and compression space (Pc) is between 7.21 MPa, and 6.12 MPa, with a pressure ratio of 1.18, and the cyclic work volume is between 0.00031 m3 and 0.00055 m3. The indicated work done from the pressure to volume diagram is 33 J.
Figure 5b shows the bounce pressure (Pb) against the phase angle; the bounce pressure has a maximum value of 7.0 MPa at a phase angle of 84.6° and a minimum pressure of 6.9 MPa at a phase angle of 87.6°. This is the pressure below the piston in the cylinder and the average almost corresponds to the mean working pressure in the engine. This shows a good performance of the FPSE.
The variation of temperature in the heat exchangers is presented in Figure 6a. The heater (Th) and cooler (Tk) temperature can be observed to have a maximum temperature of 556 °C and 78 °C respectively. The first part of the regenerator (Tr1), closer to the heater, exhibits a maximum temperature of 493 °C, while the fourth part of the regenerator (Tr4), closer to the cooler, exhibits a temperature of 117 °C. It can be observed that the heater and cooler have a great effect on the temperature distribution in the regenerator. The average of the heater and cooler temperature is almost the same as the average temperature in the first and fourth parts of the regenerator. This satisfies the specifications defined for the numerical simulation. Hence, the need for dividing the regenerator into four parts for accurate calculation and to observe the average temperature difference. Similar observations were presented in [20]. From the steady state condition, the criteria defined in the numerical simulation have been satisfied, which indicates that the value of the expansion and compression temperature at the start and end of the cycle must be the same for the steady state condition to be achieved. This can be observed from Figure 6a. The variation in the heat transfer coefficient between the working gas and the first (HTr1) and fourth (HTr4) part of the regenerator is shown in Figure 6b, and it can be observed that the heat transfer coefficient is constant in the regenerator’s parts. The heat transfer coefficients vary between 1600 W/m2K at a phase angle of 85° and 1793 W/m2K at a phase angle of 82.5° in the cycle at steady state condition. The magnitude of heat transfer coefficients are proportional to the heat flow rate and the minimum rate of heat transfer correlates to the time when the gas velocity is lowest in the cycle.
Figure 7a shows the variation in the internal heat conduction losses in the heater, cooler, and the first, second, third and fourth parts of the regenerator. The heater shows an internal loss (Qhlir) of 4.7 W at a phase angle of 82.1° while the cooler shows a loss (Qklir) of 7.12 W at a phase angle of 84.5°. The first (Qr1lir) and second (Qr2lir) parts of the regenerator are closer to the heater and have internal heat loss of 33 W at a phase angle of 81.9° and 32 W at a phase angle of 81.7° respectively, while both the regenerator’s third (Qr3lir) and fourth (Qr4lir) parts, which are closer to the cooler, have internal heat losses of 31 W at a phase angle of 82°. This indicates consistency in the average internal conduction loss in the regenerator. The heat loss by external conduction in the four parts of the regenerator to the working gas is illustrated in Figure 7b. The regenerator’s first (Qr1ext) and second (Qr2ext) parts, which are closer to the heater, have lower heat losses of 44 W and 43 W at a phase angle of 82.5° than the third (Qr3ext) and fourth (Qr4ext) parts close to the cooler, with heat losses of 45 W and 46 W at a phase angle of 82.6° due to temperature difference and influence of the heater and cooler. It can be observed in the regenerator, when comparing Figure 7a,b, that the external conduction losses are greater than the internal conduction losses.
Figure 8a shows the heat flow rate’s variation in the heat exchangers with respect to the phase angle. The heat flow rate of the working gas varies with the displacement of the working gas volume, the heater exhibits the highest heat flow and the regenerator exhibits a high amount of heat flow in the absorption and rejection of heat from the working gas in the regenerator chamber, as this determines its effectiveness and also depends on the porosity of the regenerator matrix. The heater is shown to have the highest heat flow (Qh) of 4.6 kW at a phase angle of 84.7° while the cooler shows the lowest heat flow rate (Qk) of 1.12 kW at a phase angle of 83.6°. The regenerator’s first part closer to the heater exhibits a heat flow rate (Qr1) of 3.5 kW at a phase angle of 82.4° and the (Qr4) fourth part closer to the cooler shows a value of 3.3 kW at a phase angle of 82.5°. The second (Qr2) and third (Qr3) parts of the regenerator show almost similar heat flow rates to the first and fourth parts of the regenerator. This shows the proximity effect of the heater and cooler to the regenerator and that the total heat flow in the regenerator is much greater than in heat exchangers, which corresponds with the results published in [20]. The Reynolds number of the working gas in the heat exchangers is shown in Figure 8b, this shows the flow pattern of the working gas in the heat exchangers with respect to the phase angle. In the heater the maximum Reynolds number (Reh) of 7363 is exhibited at a phase angle of 82° and the cooler shows a maximum Reynolds number (Rek) of 14,593 at a phase angle of 81°. The Reynolds number in the cooler is greater than the Reynolds number in the heater due to the turbulent flow of the working gas caused by the pressure and temperature effect in the compression space before it is displaced into the cooler in the heat exchanger chambers. The Reynolds numbers in the regenerator’s first and fourth parts (Rer1 and Rer4) are very low and this shows a laminar flow of the working gas in the regenerator. The flow is laminar at a Reynolds number lower than 2000, and turbulent at a Reynolds number greater than 2000. The heater and cooler space exhibits both laminar and high turbulent flow of the working gas due to the expansion and compression of the working gas as it is transferred via the heat exchangers from the work spaces.
The displacer and piston velocity against their amplitudes are exhibited in Figure 9a,b. It can be observed that the diagrams form an ellipse, each as a result of the convergence of the velocities and displacement; this indicates the stable operation of the engine. Similar results were observed in [1,14].
The total internal and external heat conduction losses are 10.1 J and 2.6 J total, giving a total heat loss of 12.7 J. The output power of the FPSE is 996.7 W with a thermal efficiency of 23%. Due to the reduction in mechanical losses as the FPSE requires no mechanical linkage in its configuration, a higher efficiency is expected. The hydraulic resistance in the regenerator has a measurable effect on the output power of the FPSE. Hence, the heat exchangers should be further investigated and optimised for better output performance.
3.4. Sensitivity Analysis of Design Parameters
The influence of the variations in working gas temperature in the heater and cooler is presented and observed in this section, alongside the variations in the regenerator porosity.
3.4.1. Influence of Heater Temperature
The influence of heater temperature on the performance of the FPSE is presented in this section. The temperature varies, from 400 °C to 750 °C at a constant cooler temperature of 49.8 °C and the effects on the engine performance are observed. In Table 6, it can be observed that the increase in heater temperature increases the power output and the thermal efficiency of the FPSE. Similar results were observed in numerical observations carried out by Asnaghi et al. [21] on the SOLO solar Stirling engine. This shows that the power output and thermal efficiency of the FPSE are dependent on the temperature of the heater as there is an increase in the exchanged energy between the working gas and the heater chamber. Therefore, a high quantity of heat supply is required to maximize the thermal efficiency of the FPSE.
The results shown in Table 6 reveal that the increase in temperature increases the net work of the FPSE from 1.23 J to 146 J at steady state. This is because the increase in heater temperature increases the work done in the expansion space, while there is little change in the work done in the compression space. Hence, the net work done increases. It can be observed that the internal conduction heat loss increases from 8.09 J to 12.94 J, and the external heat conduction loss increases from 0.22 J to 13.25 J. This indicates a higher flow of working gas through the regenerator and even though the work done in the engine increases, the external heat loss will have a negative effect on the regenerator effectiveness, which can reduce the thermal efficiency of the FPSE. It can be observed that with the increase in heater temperature from 400 to 600 °C, the regenerator temperature increases from 654 °C to 810 °C in the first part and from 345 °C to 460 °C in the fourth part. The difference in temperature between the first and fourth parts of the regenerator is due to their proximity to the heater and cooler. At a temperature of 650 °C in the heater, it is observed that there was a gradual decrease in the fourth part of the regenerator. This is due to the high mass flow of the working gas through the regenerator and the influence of the hot volume of gas approaching the cooler, while the displacer and piston are at the top dead centre in their cylinders. It can be observed that as the heater temperature increases, the heater, regenerator and cooler exhibit an increase in the mass of the working gas; this is due to the increase in the pressure, temperature and volume of the working gas as it flows across the heat exchangers. The heater and cooler exhibit a higher mass flow compared to the regenerator, due to the pressure exerted in the expansion and compression spaces on the working gas before it flows towards the heater and cooler, respectively. The lower mass flow in the regenerator is due to the hydraulic resistance in the regenerator matrix.
The Reynolds number of the working gas in the heat exchangers increases considerably. The gradual increment in temperature of the heater at every 50 °C shows the transition of the working gas from laminar to turbulent flow, except from the regenerator. The increase in the Reynolds number of the working gas in the heater and cooler is due to the pressure and temperature increase of the working gas in the expansion and compression spaces by the oscillatory movement of the piston and displacer. The Reynolds number of the regenerator shows a slow gradual increase, but it remains laminar due to the hydraulic resistance of the regenerator and pressure drop in the working gas.
3.4.2. Influence of Cooler Temperature
The influence of cooler temperature on the performance of the FPSE is presented in this section. The cooler temperature varies from 55 °C to 90 °C at a constant heater temperature of 541.3 °C and the effects on the engine performance are observed in Table 7.
At a fixed heater temperature, the increase in cooler temperature reduces the power output from 924 W to 292 W. This leads to the reduction in the pressure of the working gas, which reduces the volume and mass flow of the working gas in the work spaces. The increase in cooler temperature decreases the net work done in the work spaces from 30.8 J to 9.8 J. This results to an increase in dead volume and reduction in the pressure and temperature of the working gas in the expansion and compression spaces. Hence, the swept volume of the piston and displacer reduces considerably. Similar results were observed in numerical observations carried out by Asnaghi et al. [21]. It can be also be observed that the increase in cooler temperature reduces the thermal efficiency of the FPSE from 22.4% to 8.11%.
A considerable decrease in the external conduction loss from 2.52 W to 0.52 W in the regenerator and a gradual reduction in the internal conduction loss from 10.33 W to 10.11 W is observed with the increase in cooler temperature. This indicates that with the rise in cooler temperature, more heat is lost into the environment and this inevitably reduces the thermal efficiency of the regenerator, which in turn reduces the performance of the FPSE.
The increment in cooler temperature at every 10 °C reduces the temperature in the first and fourth parts of the regenerator considerably. The regenerator’s part close to the cooler exhibits a reduction in the temperature from 391 °C to 308 °C, whereas the part of the regenerator close to the heater shows a reduction of 782 °C to 701 °C. The increase in cooler temperature, has a considerable effect on the mass flow of the working gas in the heat exchangers which reduces from 0.000057 kg to 0.000049 kg in the regenerator, 0.00012 kg to 0.0001 kg in the cooler, and 0.00022 kg to 0.00019 kg in the heater. This is due to the effect of the temperature of the cooler on the pressure, temperature and volume of the working gas in the expansion and compression spaces, which affects the mass flow of working gas through the heat exchangers. The Reynolds number and the flow pattern of the working gas was also affected as they changed gradually from turbulent to laminar flow, especially in the heater from 13,430 to 3358 and cooler from 6792 to 1782. The regenerator experienced a gradual reduction in the Reynolds number from 291 to 245, which is still within the laminar flow; this very slow gradual reduction in the regenerator is due to the hydraulic resistance to the working gas, influenced by the porosity of the regenerator.
3.4.3. Influence of Regenerator Porosity
The influence of the regenerator porosity on the performance of the FPSE is presented in this section. The regenerator porosity varies from 0.6 to 0.9 at a constant temperature of 541.3 °C in the heater and temperature of 49.8 °C in the cooler, and the effects on the engine performance are presented in Table 8.
From Table 8, it can be observed that the increase in the regenerator porosity from 0.60 to 0.70, increases the power output from 1398 W to 1476 W, but the power output starts to decrease at regenerator porosity of 0.75 to 0.90, from 1462 W to 1076 W, this is due to the decrease in hydraulic resistance in the flow of the working gas across the regenerator. Regenerator porosity has a measurable effect on the net work. The increase in the regenerator porosity from 0.60 to 0.70 increases the net work done from 57.3 J to 61.5 J, and the net work started to decrease at regenerator porosity of 0.75 to 0.90 from 61.3 J to 45.16 J.
The increase in the regenerator porosity reduces the efficiency of the FPSE from 38.4 to 17.7%. This is as a result of the increase in the internal and external conduction heat losses in the regenerator. The increase in porosity of the regenerator increases the external conduction heat loss from −1.25 W to 5.8 W, while the internal conduction loss exhibits an increase in heat loss from 10.4 W to 37 W and then decreases from 37 W to 12.7 W. This is due to the hydraulic resistance of the regenerator, which decreases as the porosity of the regenerator increases, but the internal heat conduction loss in the regenerator increases and reduces due to its effectiveness in the absorption and rejection of heat as the working gas flows across. This shows a considerable effect on heat losses in the FPSE.
Therefore, from the observations on investigations of the influence of the heat exchangers, careful consideration should be given to the selection of parameters of the heat exchangers in the design of the FPSE, as it can have a considerable effect on the overall performance of the engine.
3.5. Design Implications
The analysis of the results of the numerical investigation of the FPSE in this study, especially the sensitivity of the design parameters to the output performance of the engine, has shown that the method can be used in the practical approach for the design of the FPSE. It can be observed, from the variation of heat exchanger’s parameters, that the output power and efficiency of the engine can be determined and improved. The quasi-steady state model which defines the real time characteristics and stable operation of the FPSE can be employed by designers for scaling the engine parameters based on defined inputs and generated outputs, which determine and predict the overall performance of the engine. The careful selection of the damping load and spring stiffness based on the mass of the piston and displacer are also critical parameters required in order to achieve stable operation of the engine. Hence, the characteristics and optimal working conditions of the engine can be predicted. The capability of this numerical method approach to solve complex mathematical algorithms, can now be used to generate new design concepts, and possibly proffer solutions to better performance predictions of new and renewable energy systems such as the FPSE.
4. Conclusions
A novel approach on the numerical examination of the quasi-steady model of the gamma-type FPSE was analysed and presented in this study unlike previous studies, considering the geometry effects of the heat exchangers, including the proximity effect of the heater and cooler on the regenerator. The heat losses in the heat exchangers, especially the regenerator were observed and the influence of the heat exchangers on the overall performance of the FPSE was investigated.
The main conclusions from the study are:
- The second order quasi-steady model of the FPSE is an advanced methodical approach employed to determine the performance of the engine. The thermal losses, hysteresis losses, temperature variation, working fluid properties and the physical and geometrical properties are considered which described accurately the heat and mass transfer processes in the system and provided a better understanding of the engine’s working process. The engine is split into number of control volumes in which the heat transfer between the working gas and chamber walls including the temperature variation of the chambers are taken into account. Especially in the first simulation, the comparison with the experimental output shows the quasi-steady model predicted an error of 0.4% and 0.3% both in the net work and output power, an error of 4.7% in the amplitude ratio and 36% in phase angle. Also the comparison with the evaluation published in literature indicates that the proposed model is suitable for different conditions. Hence, the model revealed a high accuracy of the FPSEs performance.
- The stable operation of the FPSE can be determined with a careful systematic approach to obtaining the accurate damping load of the piston and displacer as employed in this study.
- The geometry and features of the heater and cooler’s temperature influence on the regenerator based on the design parameters indicate considerable effects on the performance characteristics of the regenerator effectiveness in terms of output power, efficiency, thermal losses and temperature variation.
- The temperature distribution in different parts of the regenerator shows that accurate calculation is required to obtain the heat transfer, heat losses and regenerator temperature. It is observed that at the working gas temperature of 514.3 °C in the heater and 49.8 °C in the cooler, the FPSE resulted to a power output of 996.7 W at a thermal efficiency of 23%.
- The performance of the FPSE is particularly sensitive to the geometry and characteristics of heat exchangers. The influence of the heater and cooler on the engine’s performance is of considerable measure. Especially the regenerator porosity, gradual increment from 0.6 to 0.75 increased the power output and net work of the FPSE, then a further increase reduced the performance of the engine due to increase in the hydraulic resistance in the regenerator, while the increase in the regenerator porosity reduced the thermal efficiency due to the increase in the internal and external conduction losses in the regenerator.
Hence, the design of the regenerator should be given a careful consideration as this can have a great effect on the power output and efficiency of the FPSE. Therefore, careful selection of parameters, such as; temperature of the heat exchangers and regenerator porosity, is required for improved thermodynamic performance of the FPSE. This approach can be employed by designers to predict and analyse the operation of the FPSE satisfactorily to obtain a better technical output. The quasi-steady model of the FPSE might give an enhanced insight of the working process and output performance of the engine, although it requires significant time for computations. Therefore, more advanced numerical methods that can reduce the computing time are required to solve the mathematical model of the FPSE. Also to improve the accuracy of the developed quasi-steady model of the FPSE, further investigations is required to employ various correlations on hydraulic resistance, heat transfer and hysteresis losses of the engine.
Author Contributions
Ayodeji Sowale conceived and designed the experiments; Ayodeji Sowale performed the experiments; Ayodeji Sowale and Athanasios J. Kolios analyzed the data; Ayodeji Sowale contributed reagents/materials/analysis tools; Ayodeji Sowale and Athanasios J. Kolios wrote the paper
Conflicts of Interest
The authors declare no conflict of interest.
Nomenclature
| Cross-sectional area of the piston () | |
| Cross-sectional area of the displacer () | |
| Spring stiffness of displacer (N/m) | |
| Spring stiffness of piston (N/m) | |
| Specific heat at constant pressure (J/kgK) | |
| Specific heat at constant volume (J/kgK) | |
| Damping load of displacer (Ns/m) | |
| Damping load of piston (Ns/m) | |
| D | Diameter (m) |
| l | Length (m) |
| 1-4 | Parts of the regenerator |
| Mass flow rate from the first part of the regenerator to the heater (kg/s) | |
| Mass flow from the cooler to the fourth part of the regenerator (kg/s) | |
| Mass flow rate from the compression space to the cooler (kg/s) | |
| Mass flow rate from heater to expansion space (kg/s) | |
| diss | Heat loss due to the flow friction in the regenerator (W) |
| Thermal conductivity (W/mk) | |
| lir | Heat loss by internal conduction (W) |
| ext | Heat loss by external conduction (W) |
| Mass of the displacer | |
| mp | Mass of the piston |
| Cooler temperature (K) | |
| Regenerator temperature (K) | |
| Heater temperature (K) | |
| Temperature of working gas from compression space to cooler (K) | |
| Temperature of working gas from heater to expansion space (K) | |
| Temperature of working gas from regenerator to heater (K) | |
| Temperature of working gas from cooler to regenerator (K) | |
| Bounce space volume ) | |
| Volume of the regenerator ) | |
| Volume of the heater ) | |
| Volume of the cooler ) | |
| Compression space clearance volume ) | |
| Expansion space clearance volume ) | |
| xp | Displacement of piston () |
| Velocity of piston () | |
| Acceleration of piston | |
| Displacement of displacer () | |
| Velocity of displacer () | |
| Acceleration of displacer (m/s2) | |
| R | Gas constant value |
| Re | Reynolds number |
| Q | Heat transfer rate (W) |
| Free surface area () | |
| Pe | Pressure in expansion space (Pa) |
| Pc | Pressure in compression space (Pa) |
| FPSE | Free piston Stirling engine |
| CFD | Computational fluid dynamics |
References
- Rogdakis, E.D.; Bormpilas, N.A.; Koniakos, I.K. A thermodynamic study for the optimization of stable operation of free piston Stirling engines. Energy Convers. Manag. 2004, 45, 575–593. [Google Scholar] [CrossRef]
- Riofrio, J.A.; Al-Dakkan, K.; Hofacker, M.E.; Barth, E.J. Control-based design of free-piston Stirling engines. In Proceedings of the 2008 American Control Conference, Seattle, WA, USA, 11–13 June 2008; pp. 1533–1538. [Google Scholar]
- Bégota, S.; Layes, G.; Lanzetta, F.; Nika, P. Stability analysis of free piston Stirling engines. Eur. Phys. J. Appl. Phys. 2013, 61. [Google Scholar] [CrossRef]
- Sowale, A. Modelling and Optimisation of a Free Piston Stirling Engine for Micro-CHP Applications. Ph.D. Thesis, Northumbria University, Newcastle upon Tyne, UK, 2015. [Google Scholar]
- Formosa, F.; Frechette, L.G. Scaling laws for free piston Stirling engine design: Benefits and challenges of miniaturization. Energy 2013, 57, 796–808. [Google Scholar] [CrossRef]
- Chmielewski, A.; Guminski, R.; Maczak, J. Dynamic model of a free-piston Stirling engine with four degrees of freedom combined with the thermodynamic submodel. In Proceedings of the 2016 21st International Conference on Methods and Models in Automation and Robotics (MMAR), Miedzyzdroje, Poland, 29 August–1 September 2016; pp. 583–588. [Google Scholar]
- Jia, B.; Smallbone, A.; Feng, H.; Tian, G.; Zuo, Z.; Roskilly, A.P. A fast response free-piston engine generator numerical model for control applications. Appl. Energy 2016, 162, 321–329. [Google Scholar] [CrossRef]
- Boucher, J.; Lanzetta, F.; Nika, P. Optimization of a dual free piston Stirling engine. Appl. Therm. Eng. 2007, 27, 802–811. [Google Scholar] [CrossRef]
- Mikalsen, R.; Roskilly, A.P. Performance simulation of a spark ignited free-piston engine generator. Appl. Therm. Eng. 2008, 28, 1726–1733. [Google Scholar] [CrossRef]
- Jia, B.; Zuo, Z.; Tian, G.; Feng, H.; Roskilly, A.P. Development and validation of a free-piston engine generator numerical model. Energy Convers. Manag. 2015, 91, 333–341. [Google Scholar] [CrossRef]
- Mao, J.; Zuo, Z.; Li, W.; Feng, H. Multi-dimensional scavenging analysis of a free-piston linear alternator based on numerical simulation. Appl. Energy 2011, 88, 1140–1152. [Google Scholar] [CrossRef]
- Zhang, C.; Li, K.; Sun, Z. Modeling of piston trajectory-based HCCI combustion enabled by a free piston engine. Appl. Energy 2015, 139, 313–326. [Google Scholar] [CrossRef]
- Jia, B.; Tian, G.; Feng, H.; Zuo, Z.; Roskilly, A.P. An experimental investigation into the starting process of free-piston engine generator. Appl. Energy 2015, 157, 798–804. [Google Scholar] [CrossRef]
- Xiao, J.; Li, Q.; Huang, Z. Motion characteristic of a free piston linear engine. Appl. Energy 2010, 87, 1288–1294. [Google Scholar] [CrossRef]
- Wu, W.; Hu, J.; Yuan, S. Semi-analytical modelling of a hydraulic free-piston engine. Appl. Energy 2014, 120, 75–84. [Google Scholar] [CrossRef]
- Yang, Q.; Luo, E.; Dai, W.; Yu, G. Thermoacoustic model of a modified free piston Stirling engine with a thermal buffer tube. Appl. Energy 2012, 90, 266–270. [Google Scholar] [CrossRef]
- Kim, J.; Bae, C.; Kim, G. Simulation on the effect of the combustion parameters on the piston dynamics and engine performance using the Wiebe function in a free piston engine. Appl. Energy 2013, 107, 446–455. [Google Scholar] [CrossRef]
- Ureli, I. Stirling Cycle Engine Analysis; A. Hilger: Bristol, UK, 1984. [Google Scholar]
- Thomas, B.; Pittman, D. Update on the evaluation of different correlations for the flow friction factor and heat transfer of Stirling engine regenerators. In Proceedings of the 35th Intersociety Energy Conversion Engineering Conference and Exhibit, Las Vegas, NV, USA, 24–28 July 2000; Volume 1, pp. 76–84. [Google Scholar]
- Kraitong, K. Numerical Modelling and Design Optimisation of Stirling Engines for Power Production. Ph.D. Thesis, Northumbria University, Newcastle upon Tyne, UK, 2014. [Google Scholar]
- Asnaghi, A.; Ladjevardi, S.M.; Saleh Izadkhast, P.; Kashani, A.H. Thermodynamics Performance Analysis of Solar Stirling Engines. ISRN Renew. Energy 2012, 2012, 321923. [Google Scholar] [CrossRef]
Figure 1.
Pressure to volume diagram of the ideal Stirling cycle indicating the influence of the heat exchangers.
Figure 1.
Pressure to volume diagram of the ideal Stirling cycle indicating the influence of the heat exchangers.
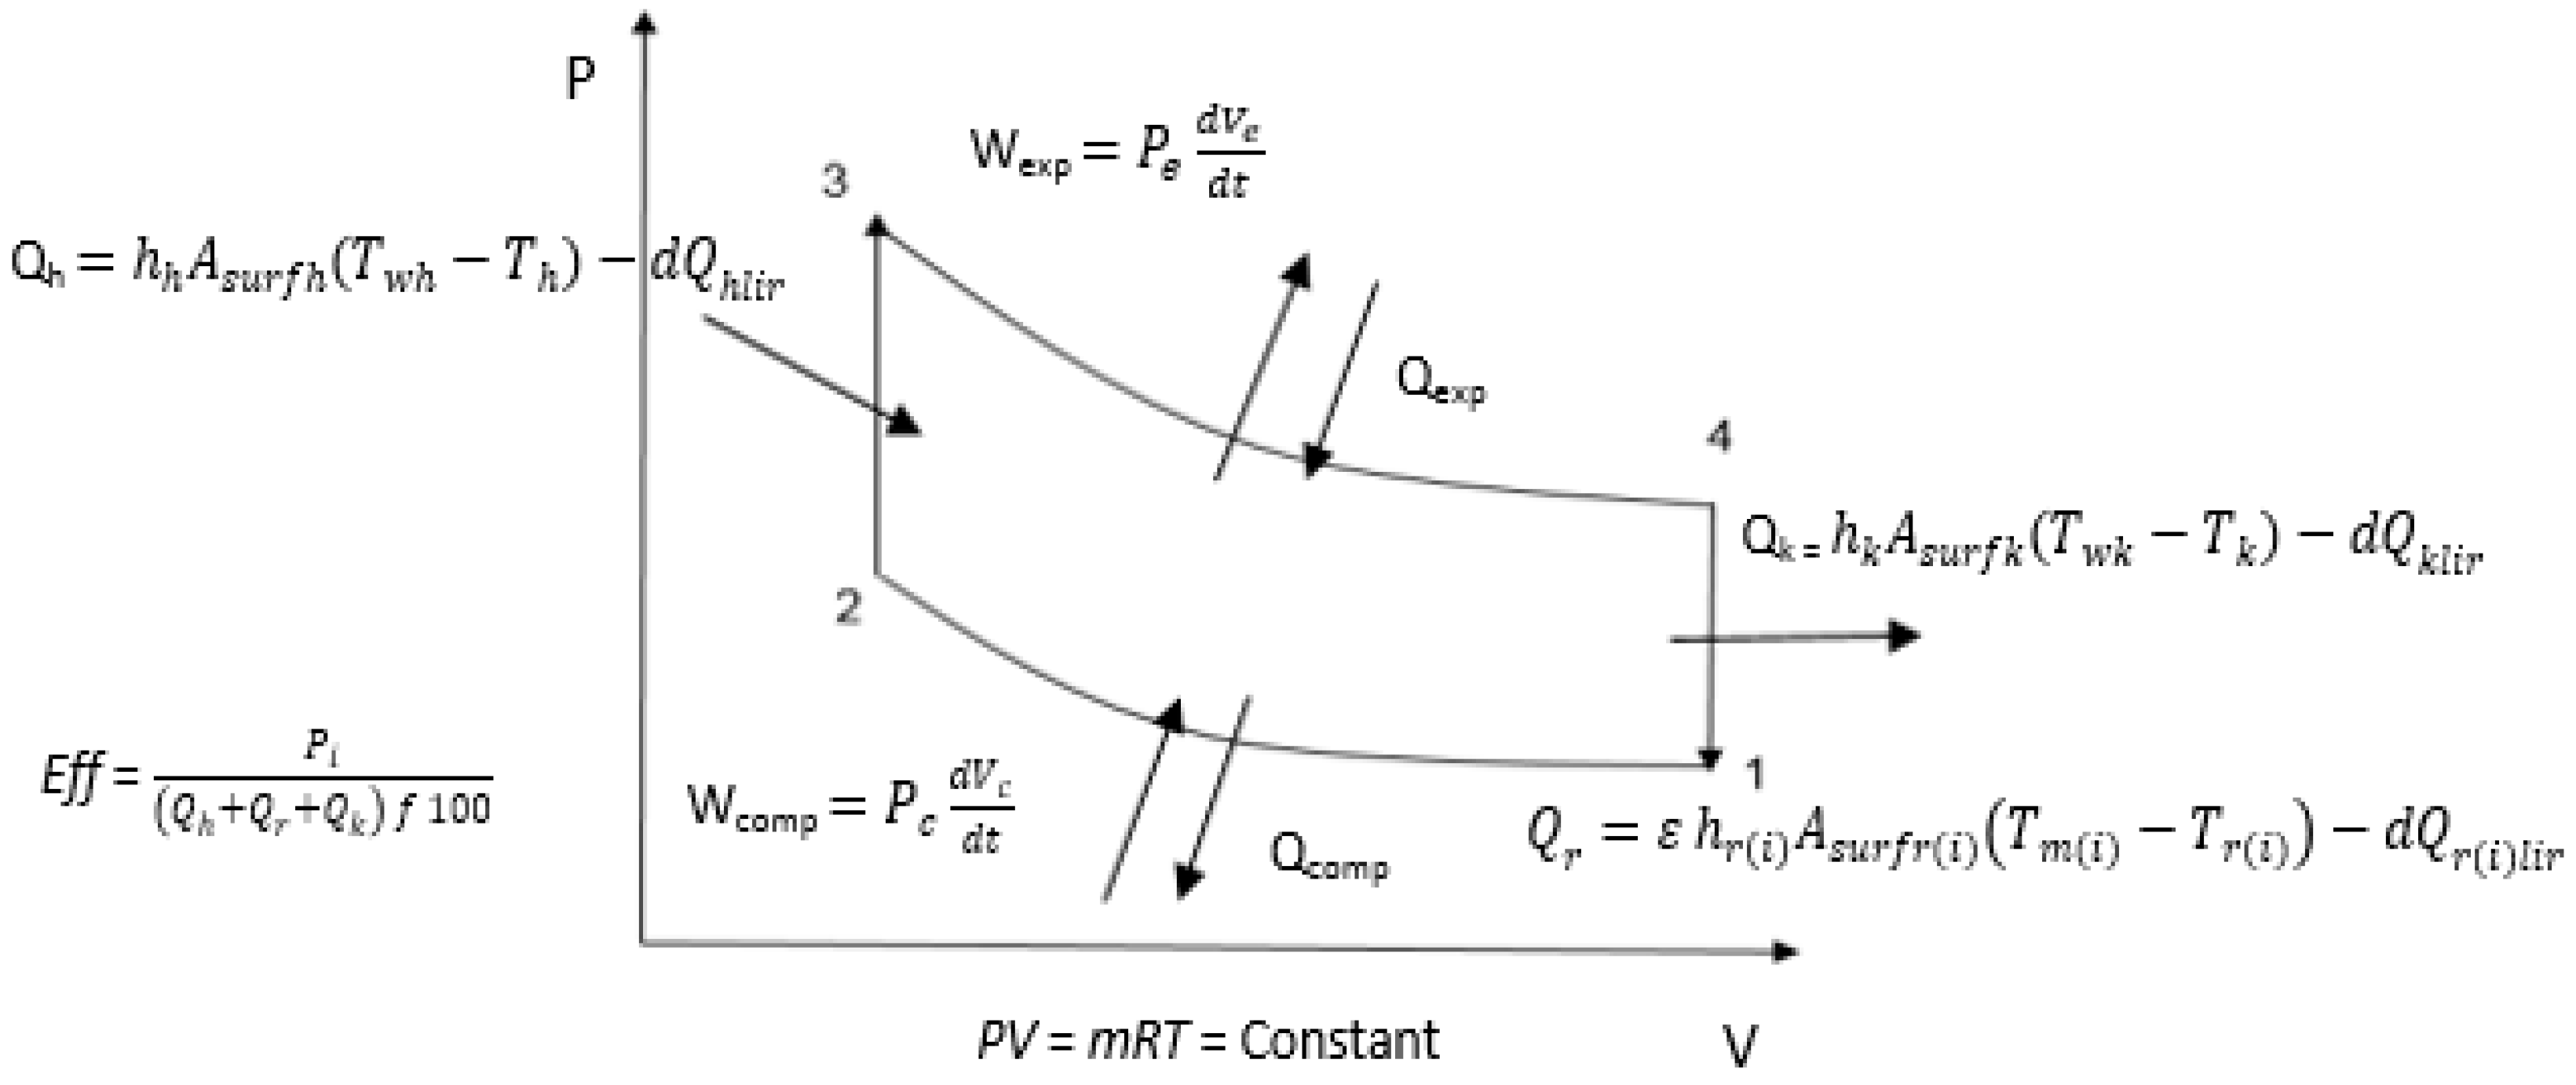
Figure 2.
Schematic diagram of the free piston Stirling engine, including the heat exchangers, and the oscillation of the displacer and piston.
Figure 2.
Schematic diagram of the free piston Stirling engine, including the heat exchangers, and the oscillation of the displacer and piston.
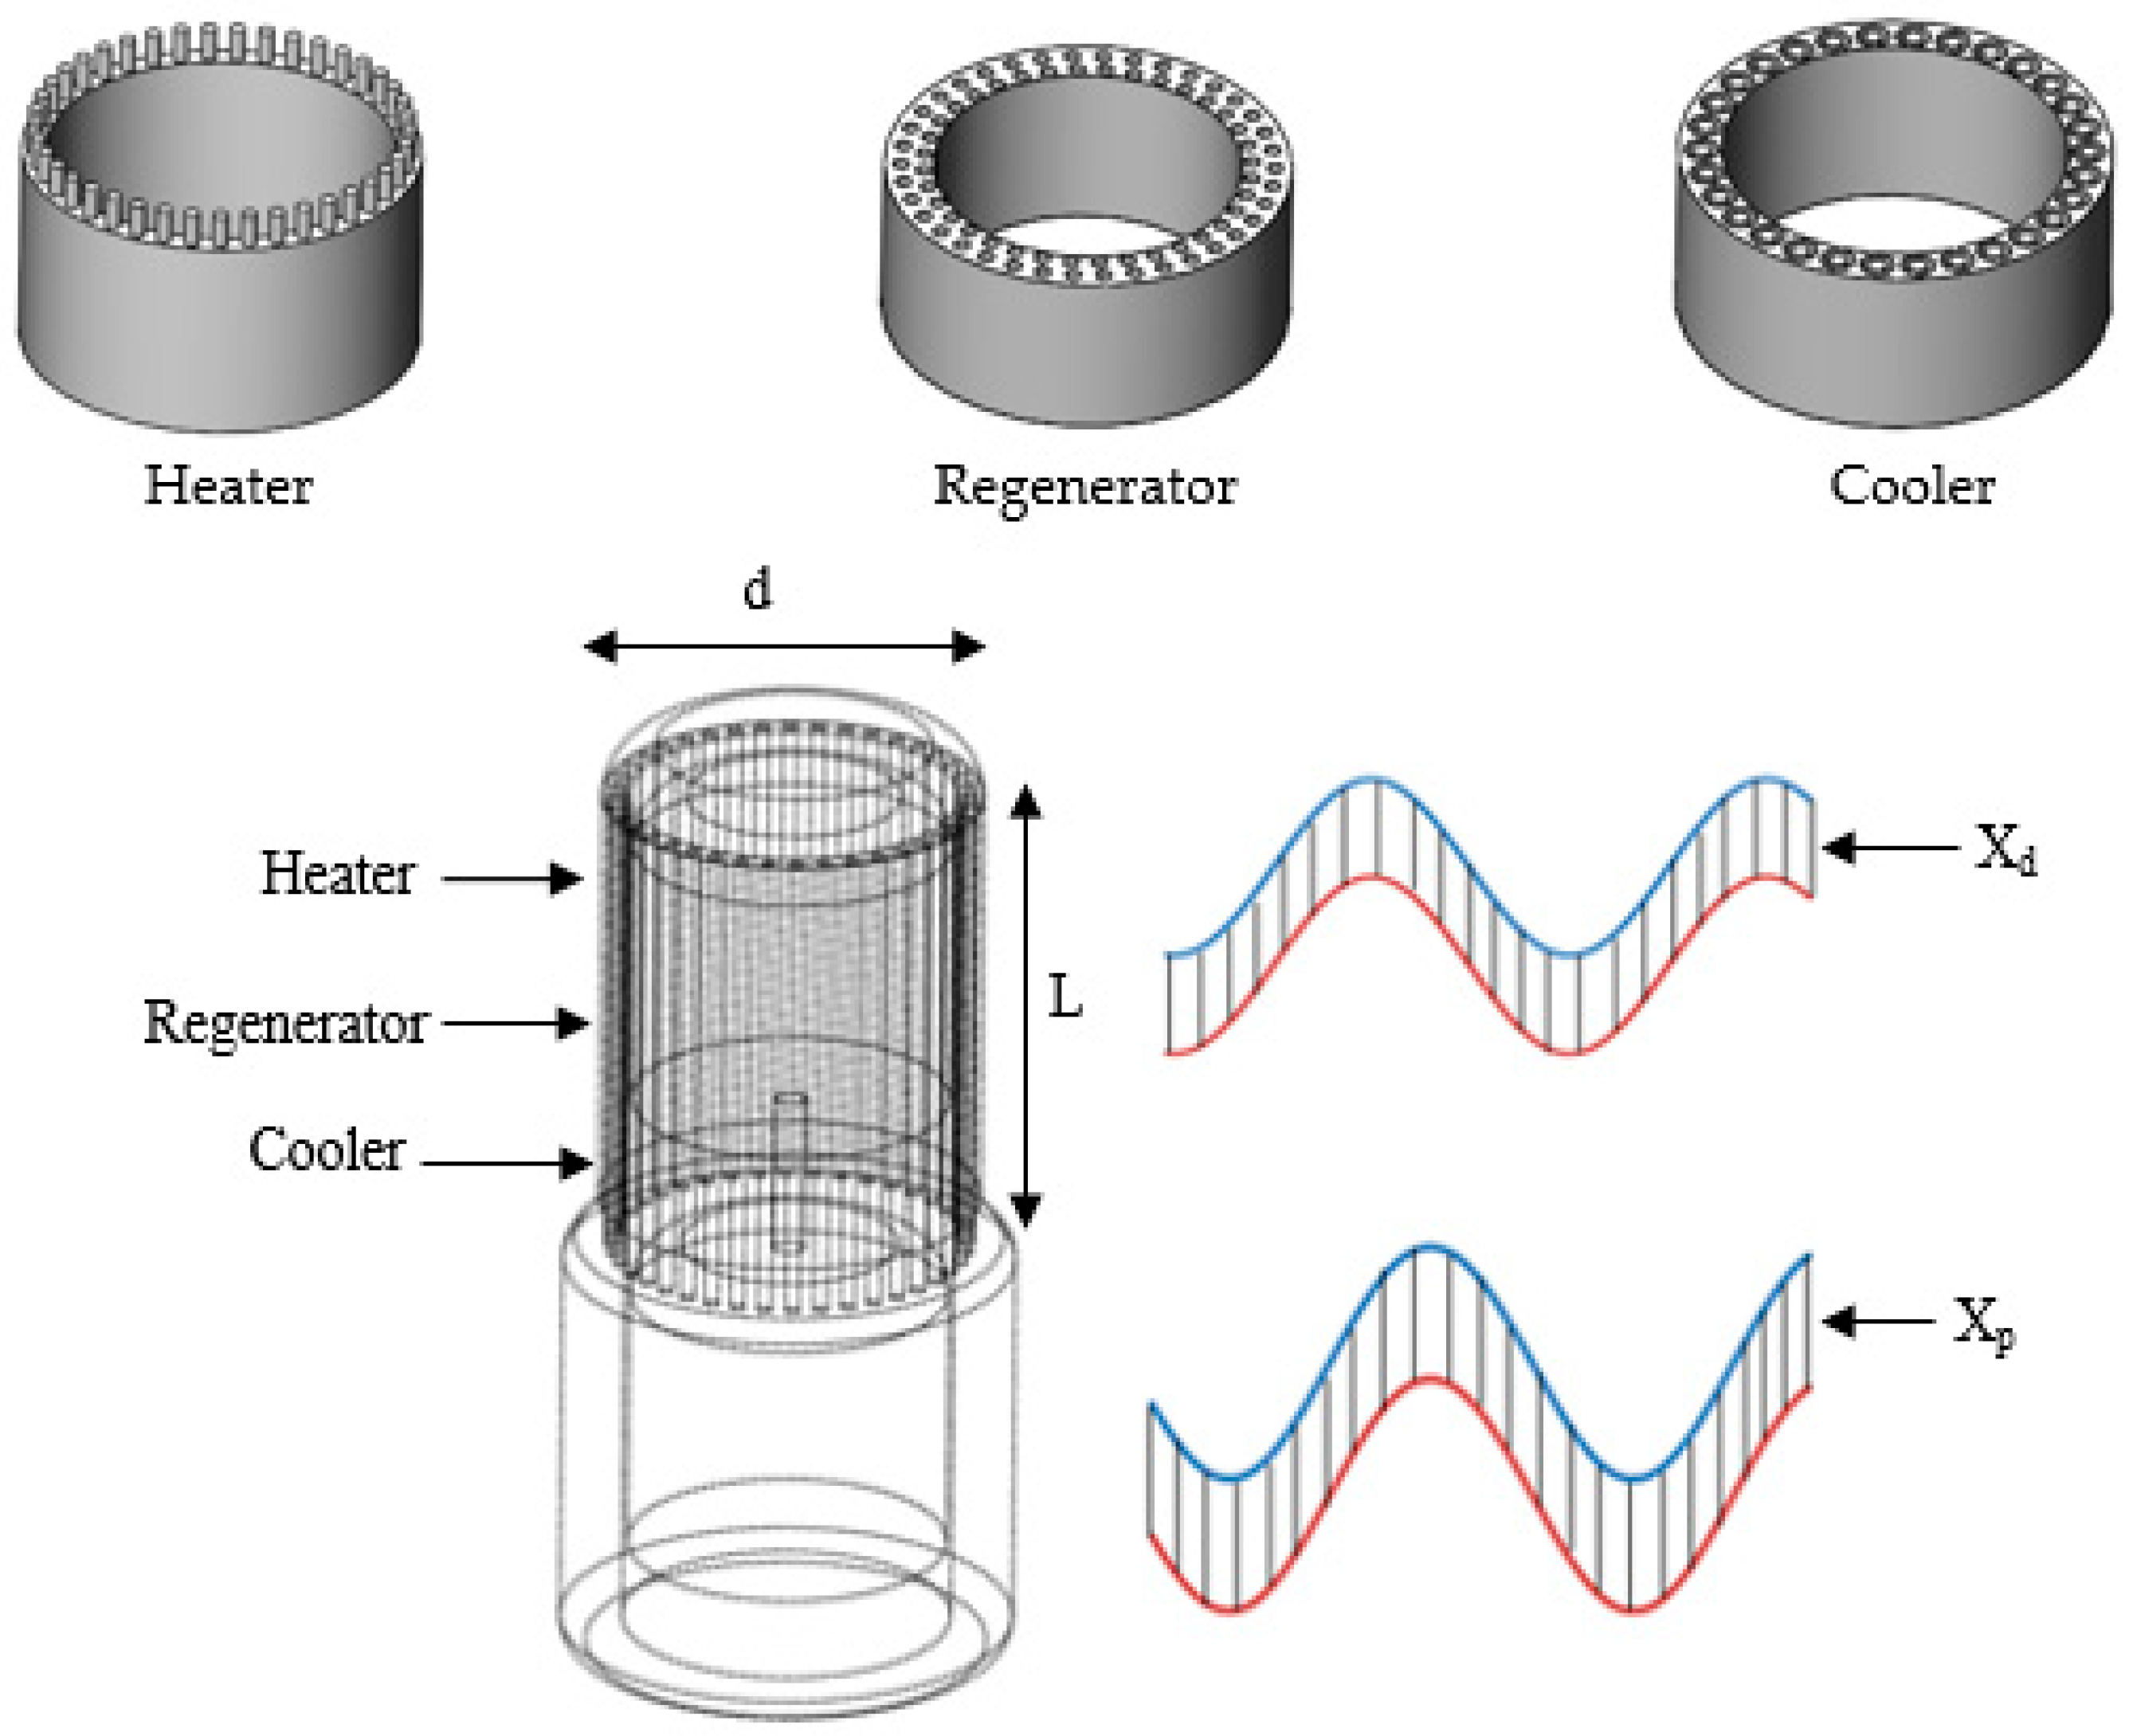
Figure 3.
Flow chart of the quasi-steady state modelling of the free piston Stirling engine.
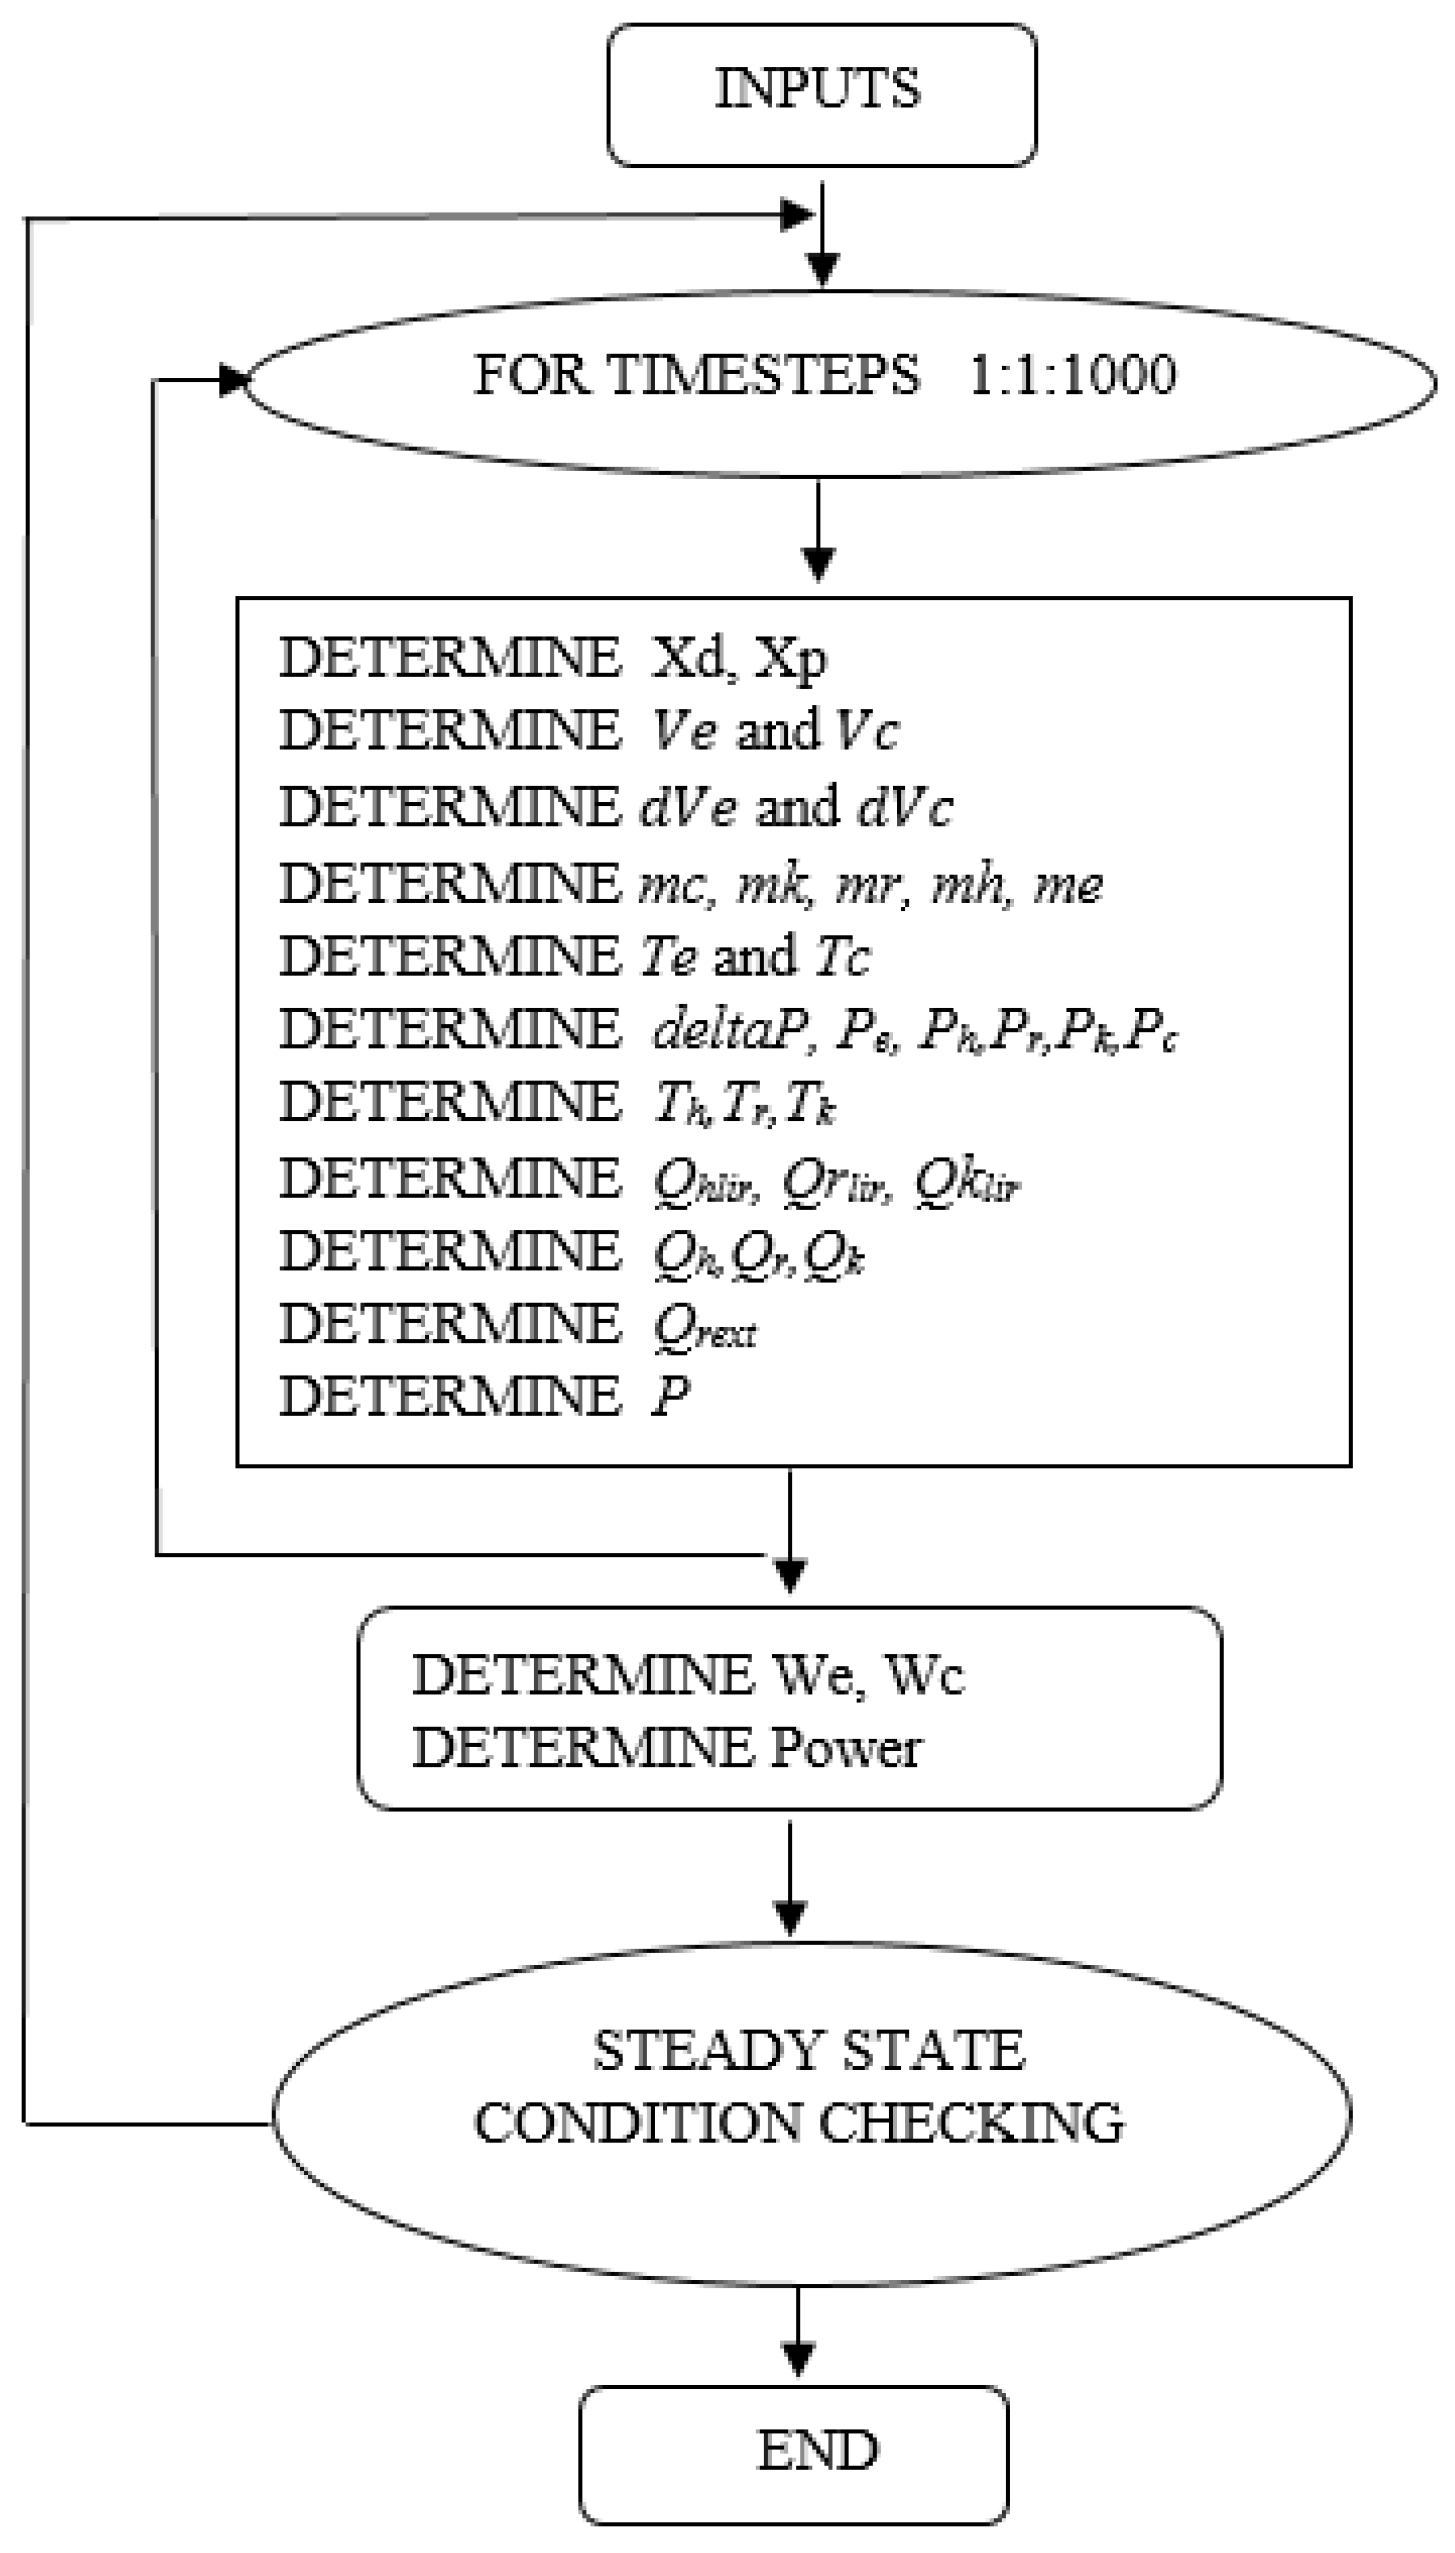
Figure 4.
(a) Displacement of piston and displacer against phase angle; (b) Expansion and compression volumes against phase angle.
Figure 4.
(a) Displacement of piston and displacer against phase angle; (b) Expansion and compression volumes against phase angle.

Figure 5.
(a) Pressure to volume diagram; (b) Bounce pressure against phase angle.

Figure 6.
(a) Temperature distribution in the heat exchangers; (b) Heat transfer coefficient in the regenerator.
Figure 6.
(a) Temperature distribution in the heat exchangers; (b) Heat transfer coefficient in the regenerator.
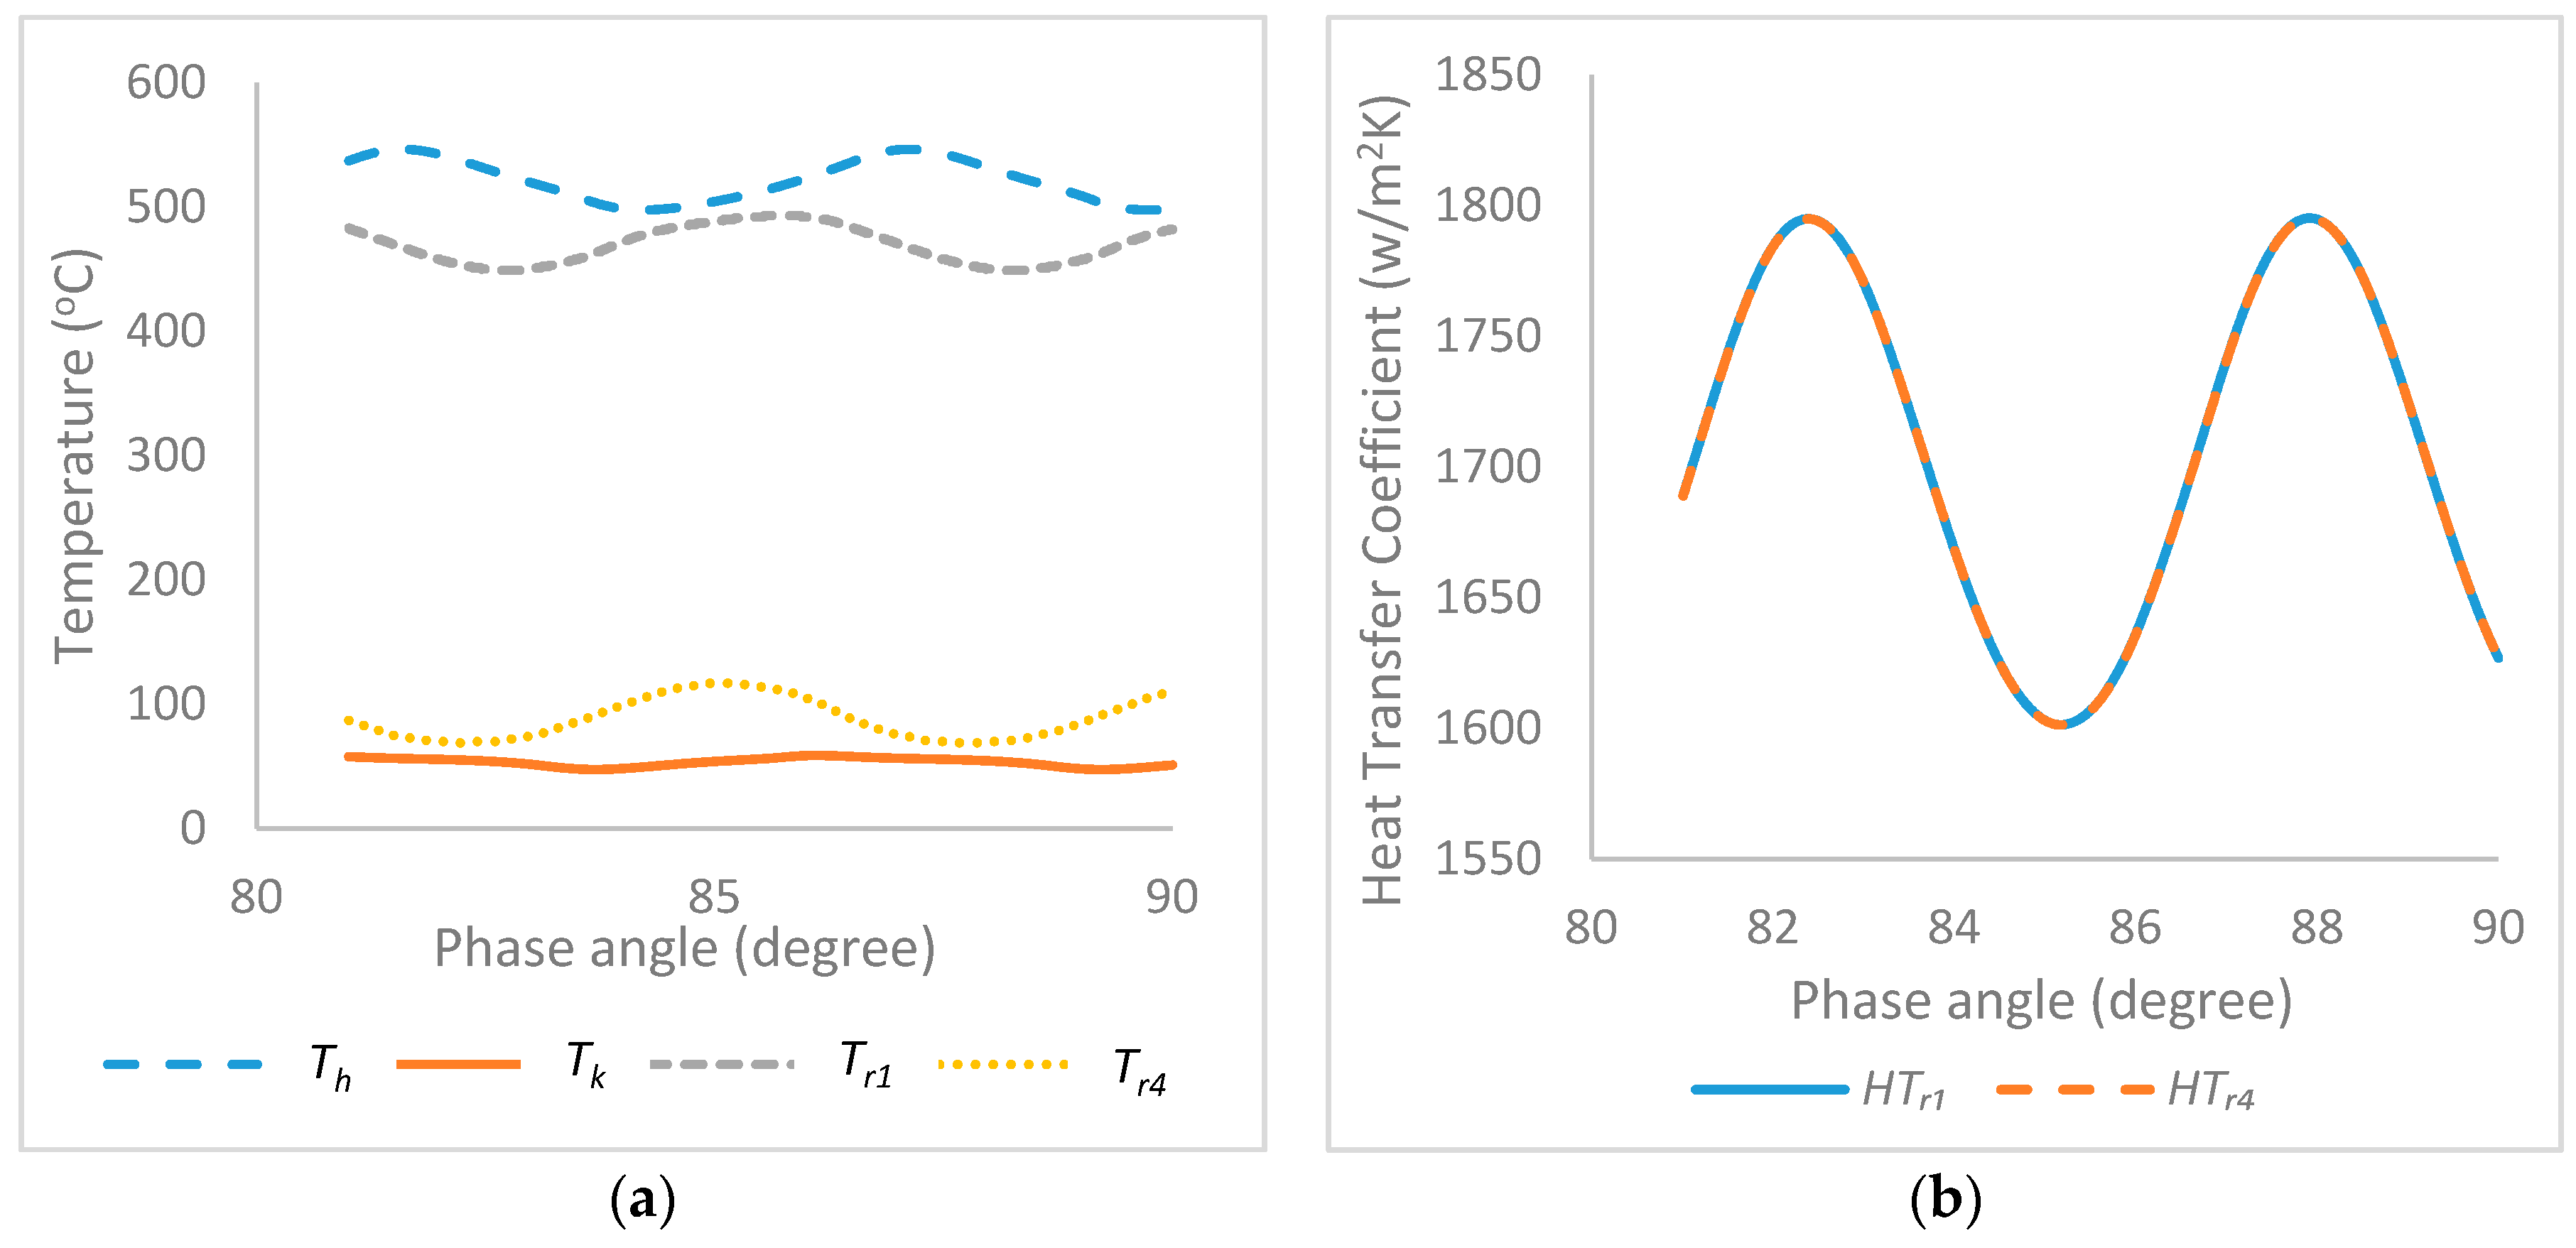
Figure 7.
(a) Internal heat conduction loss in the heat exchangers against phase angle; (b) External heat conduction loss in the regenerator against phase angle.
Figure 7.
(a) Internal heat conduction loss in the heat exchangers against phase angle; (b) External heat conduction loss in the regenerator against phase angle.
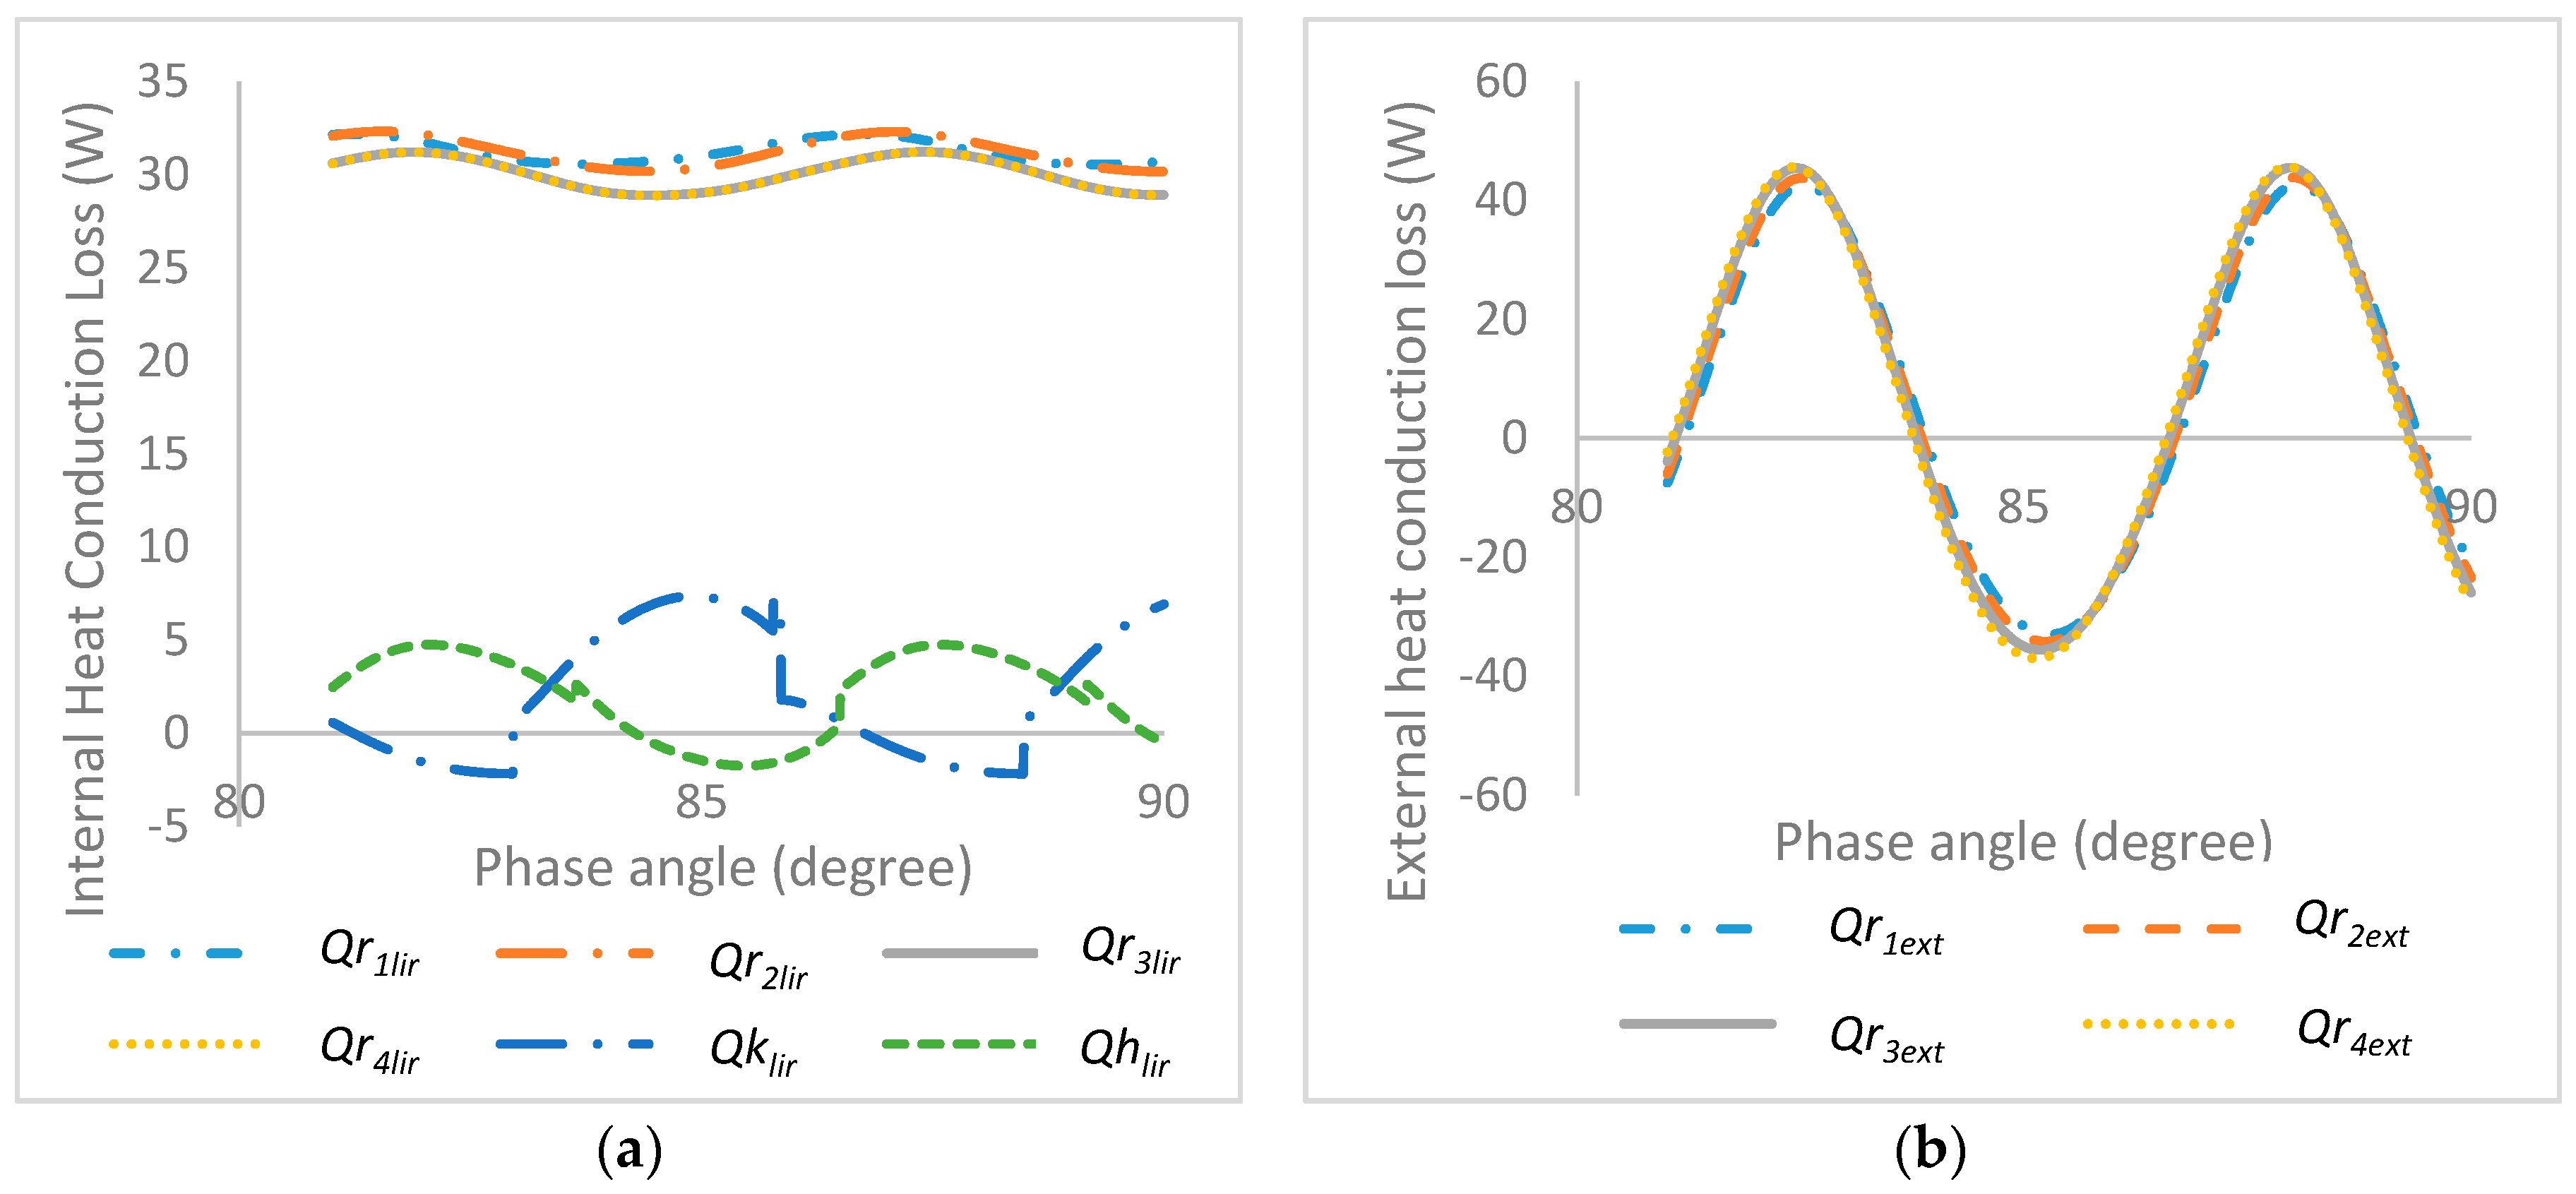
Figure 8.
(a) Heat flow rate in the heat exchangers against phase angle; (b) Reynolds number of working gas flow against phase angle.
Figure 8.
(a) Heat flow rate in the heat exchangers against phase angle; (b) Reynolds number of working gas flow against phase angle.
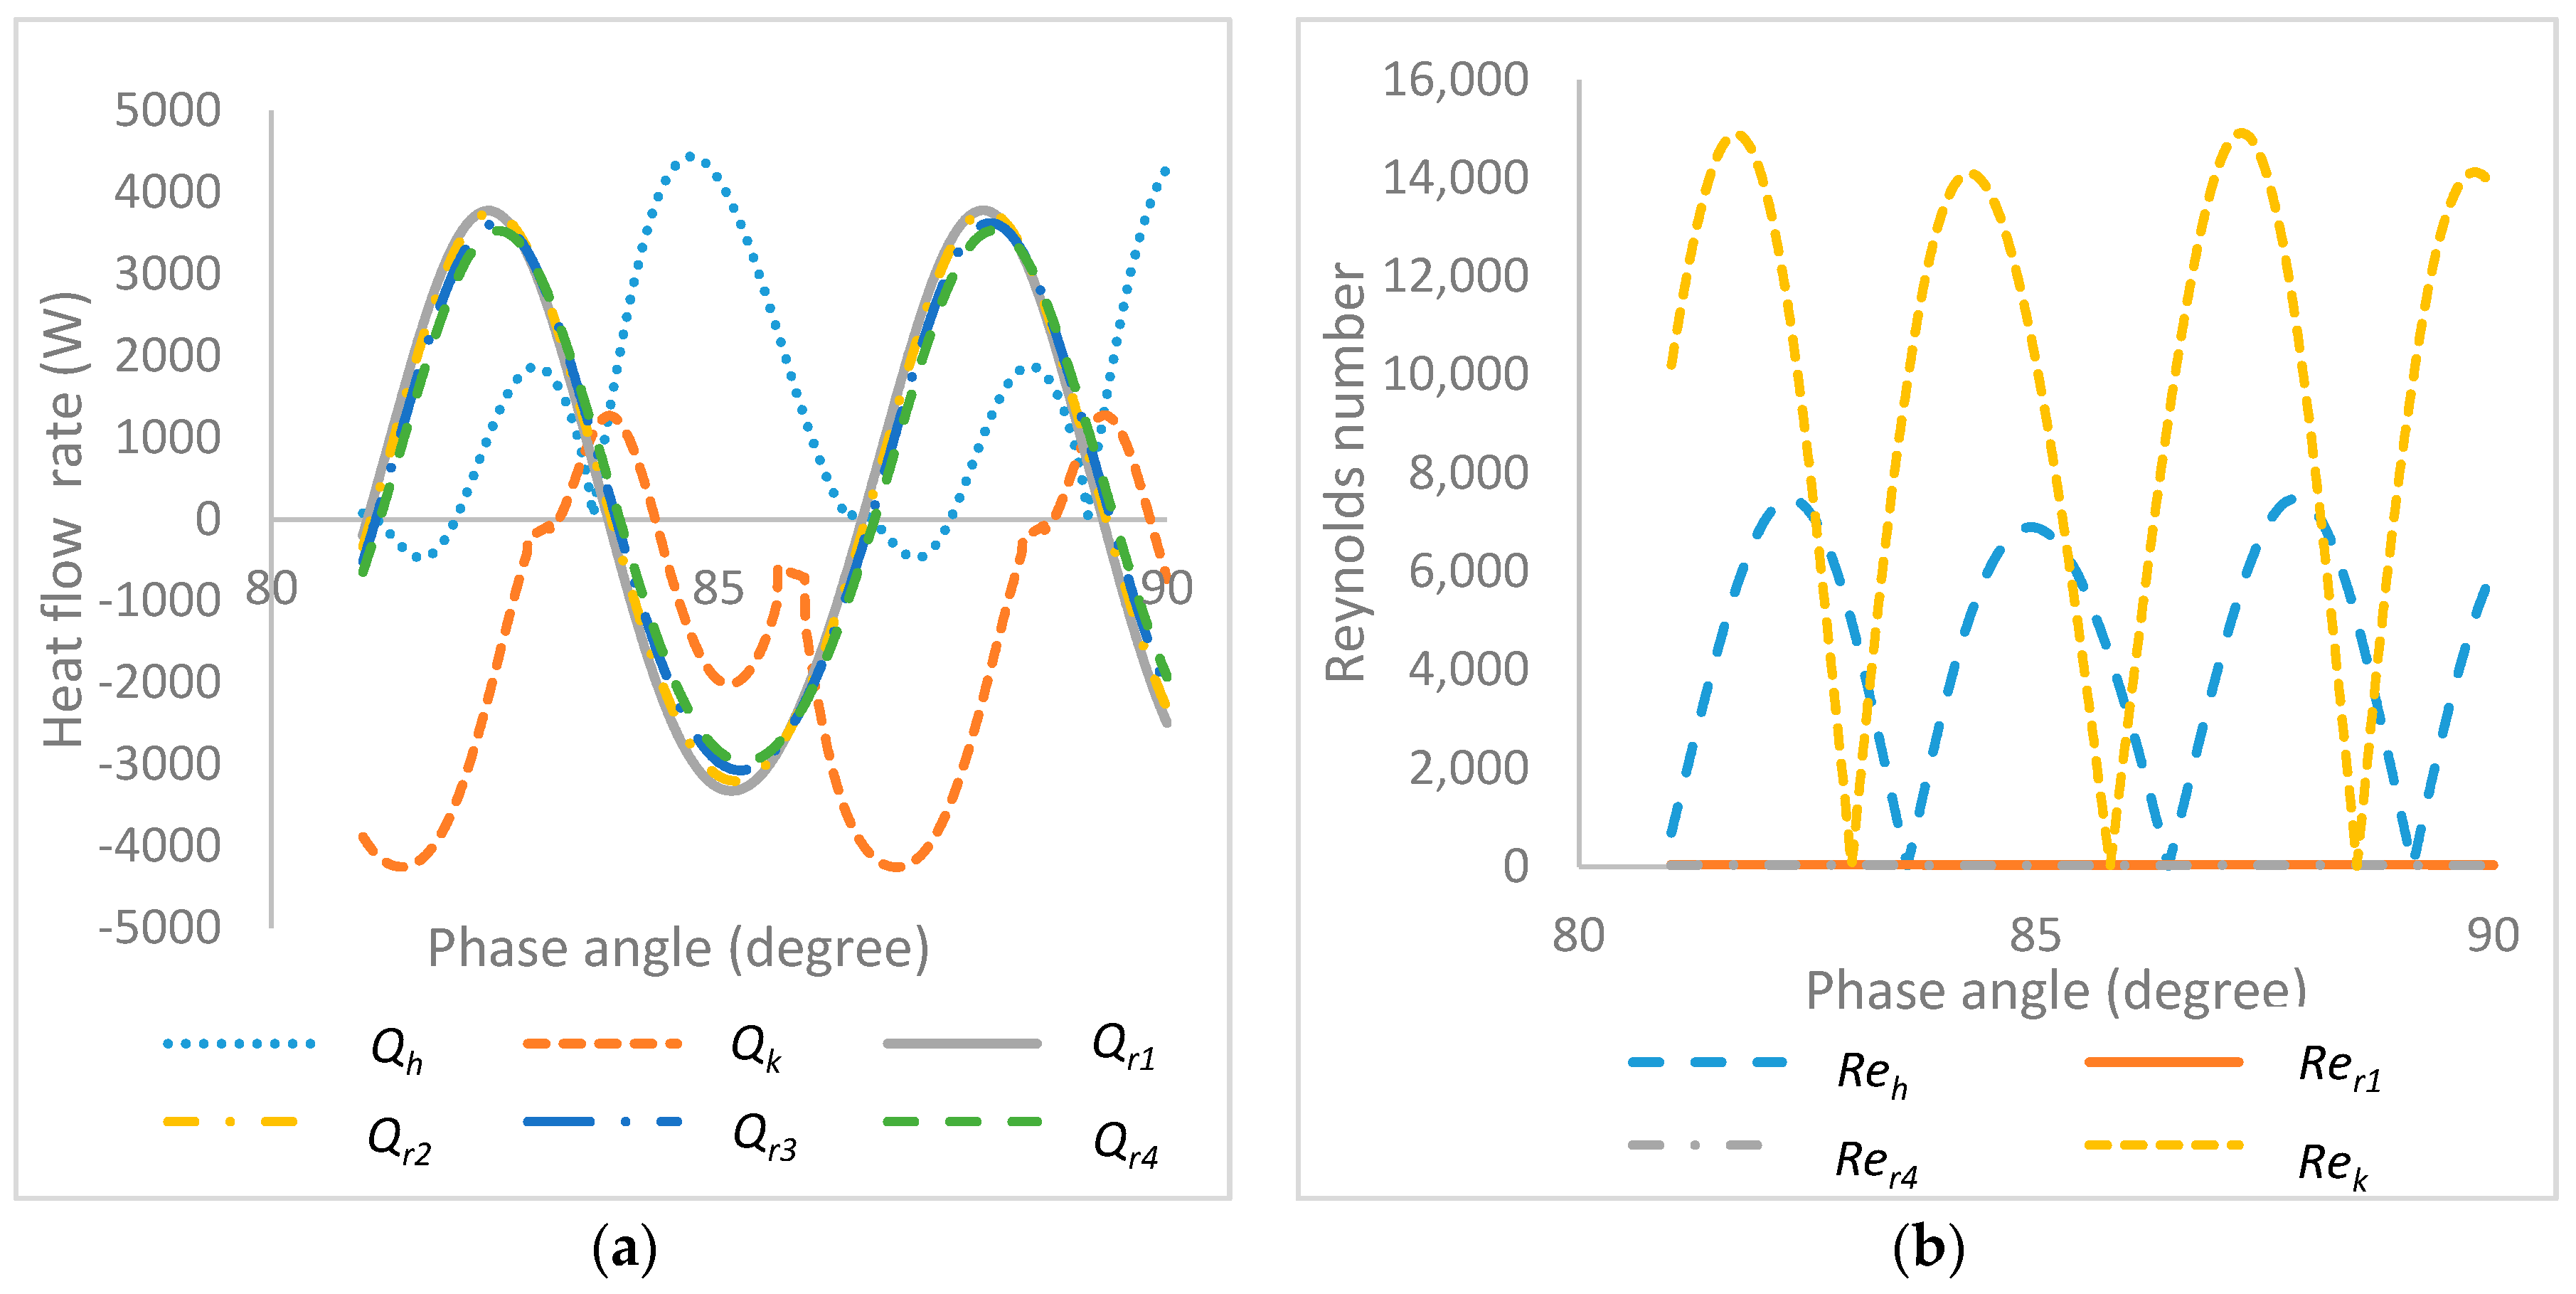
Figure 9.
(a) Displacer velocity against displacer amplitude; (b) Piston velocity against piston amplitude.
Figure 9.
(a) Displacer velocity against displacer amplitude; (b) Piston velocity against piston amplitude.


Table 1.
Equations used in the mathematical model.
| Parameters | Expression |
|---|---|
| Motion of displacer | |
| Motion of piston | ) |
| Pressure | |
| Expansion volume | |
| Compression volume | |
| Expansion space temperature | |
| Compression space temperature | |
| Temperature of regenerator’s parts | |
| Energy conservation equations applied to the control volumes | |
| Friction factor of regenerator | |
| Coefficient of heat transfe | |
| Internal heat conduction loss | |
| External heat conduction loss | |
| Heat transfer in heat exchangers | |
| Derivative of total pressure | |
| Work done | |
| Output power |
Table 2.
Boundary conditions.
| Parameters | Boundary Conditions |
|---|---|
| Temperature | If
mck’ > 0 then Tck = Tc else Tck = Tk If mhe’ > 0 then The = Th else The = Te |
| Mass flow rate from heater to expansion space | If , If |
| Mass flow rate from regenerator to heater | If If |
| Mass flow rate from cooler to regenerator | If If |
| Mass flow rate from compression space to cooler | If If |
Table 3.
Design parameters of the heat exchangers.
| Parameters | Heater | Regenerator | Cooler |
|---|---|---|---|
| Number of tubes | 35 | - | 125 |
| Porosity of Regenerator | - | 0.85 | - |
| Length (m) | 0.0792 | 0.06446 | 0.1834 |
| Diameter (m) | 0.0025 | 0.0025 | 0.0025 |
| Regenerator Matrix | - | 4 | - |
Table 4.
Parameters of the RE-1000 FPSE [18].
Table 4.
Parameters of the RE-1000 FPSE [18].
| Engine Data | Value |
|---|---|
| Mean Pressure (bar) | 71 |
| Heater Temperature (°C) | 541.3 |
| Cooler Temperature (°C) | 49.8 |
| Working gas | Helium |
| Oscillating frequency (Hz) | 30 |
| Piston damping load (Nsm−1) | 461.5 |
| Displacer damping load (Nsm−1) | 35.34 |
| Spring stiffness of piston (N/m) | 296,000 |
| Spring stiffness of displacer (N/m) | 25,000 |
| Mass of piston (kg) | 6.2 |
| Mass of displacer (kg) | 0.426 |
| Regenerator volume (cm3) | 56.37 |
| Heater volume (cm3) | 27.33 |
| Cooler volume (cm3) | 20.43 |
| Expansion space clearance volume (m3) | 0.01861 |
| Compression space clearance volume (m3) | 0.01830 |
Table 5.
Results from the validation of the numerical model of the free piston Stirling engine with the experimental output of the RE-1000 FPSE.
Table 5.
Results from the validation of the numerical model of the free piston Stirling engine with the experimental output of the RE-1000 FPSE.
| Parameters | Experiment RE-1000 | Urieli and Berchowitz | Simulation 1 | Simulation 2 | Error 1 (%) | Error 2 (%) |
|---|---|---|---|---|---|---|
| Frequency (Hz) | 30 | 33.2 | 30 | 33.2 | 0 | 0 |
| Output power (W) | 1000 | 1320 | 996 | 1258 | 0.4 | 4.7 |
| Net work (J) | 33.3 | 39.8 | 33.2 | 37.9 | 0.3 | 4.8 |
| Amplitude ratio | 1.06 | 0.62 | 1.01 | 0.82 | 4.7 | −32 |
| Phase angle (°) | −42.5 | −57.9 | −57.8 | −60.9 | 36 | 5.2 |
Table 6.
Influence of heater temperature.
| Heater Temperature (°C) | Power Output (W) | Efficiency (%) | Net Work (J) | Qlir (W) | Qrextl (W) | Tr1 (°C) | Tr4 (°C) | mh (×10−4) (kg) | mk (×10−4) (kg) | mr (×10−5) (kg) | Reh | Rek | Rer |
|---|---|---|---|---|---|---|---|---|---|---|---|---|---|
| 400 | 36.94 | 10.06 | 1.23 | 8.09 | 0.22 | 654 | 345 | 2.08 | 1.34 | 5.45 | 3278 | 623 | 259 |
| 450 | 187 | 16.59 | 6.24 | 9.05 | 0.51 | 699 | 352 | 2.09 | 1.36 | 5.50 | 3013 | 1640 | 268 |
| 500 | 464 | 19.50 | 15.50 | 9.72 | 1.23 | 735 | 368 | 2.10 | 1.39 | 5.59 | 7183 | 3797 | 296 |
| 550 | 1010 | 22.13 | 33.70 | 10.15 | 2.84 | 760 | 390 | 2.20 | 1.48 | 5.76 | 10,003 | 8001 | 315 |
| 600 | 2006 | 24.27 | 66.90 | 10.36 | 4.52 | 810 | 420 | 2.40 | 1.53 | 6.02 | 12,141 | 11,056 | 352 |
| 650 | 2726 | 28.01 | 90.90 | 11.70 | 6.02 | 819 | 460 | 2.60 | 1.67 | 6.88 | 13,750 | 17,520 | 390 |
| 700 | 3205 | 31.67 | 118.2 | 12.07 | 8.70 | 850 | 417 | 2.90 | 1.74 | 7.72 | 14,274 | 19,241 | 413 |
| 750 | 3871 | 32.98 | 146.0 | 12.94 | 13.25 | 875 | 425 | 3.30 | 1.89 | 8.68 | 14,900 | 24,720 | 457 |
Table 7.
Influence of cooler temperature.
| Cooler Temperature (°C) | Power Output (W) | Efficiency (%) | Net Work (J) | Qlir (W) | Qrextl (W) | Tr1 (°C) | Tr4 (°C) | mh (×10−4) (kg) | mk (×10−4) (kg) | mr (×10−5) (kg) | Reh | Rek | Rer |
|---|---|---|---|---|---|---|---|---|---|---|---|---|---|
| 55 | 924 | 22.4 | 30.8 | 10.33 | 2.52 | 782 | 391 | 2.16 | 1.18 | 5.73 | 13,430 | 6792 | 291 |
| 60 | 711 | 21.2 | 23.7 | 10.25 | 1.67 | 767 | 388 | 2.08 | 1.17 | 5.40 | 11,254 | 5114 | 290 |
| 65 | 618 | 19.1 | 20.6 | 10.21 | 1.42 | 750 | 382 | 2.03 | 1.16 | 5.32 | 8954 | 4578 | 279 |
| 70 | 567 | 15.5 | 18.9 | 10.17 | 1.18 | 744 | 374 | 1.99 | 1.14 | 5.15 | 6947 | 3670 | 272 |
| 75 | 489 | 13.3 | 16.3 | 10.15 | 0.93 | 736 | 352 | 1.96 | 1.13 | 5.13 | 5214 | 3216 | 268 |
| 80 | 417 | 11.6 | 13.9 | 10.13 | 0.75 | 718 | 334 | 1.93 | 1.12 | 5.06 | 4958 | 2751 | 261 |
| 85 | 348 | 10.4 | 11.3 | 10.12 | 0.61 | 709 | 327 | 1.89 | 1.11 | 4.97 | 3821 | 2103 | 254 |
| 90 | 292 | 8.11 | 9.8 | 10.11 | 0.52 | 701 | 308 | 1.88 | 1.10 | 4.91 | 3358 | 1782 | 245 |
Table 8.
Influence of regenerator porosity.
| Regenerator Porosity | Power Output (W) | Efficiency (%) | Net Work (J) | Qlir (W) | Qrextl (W) |
|---|---|---|---|---|---|
| 0.6 | 1389 | 38.4 | 57.3 | 10.4 | −1.25 |
| 0.65 | 1433 | 37.0 | 60.0 | 13.0 | −1.19 |
| 0.7 | 1476 | 36.0 | 61.5 | 37.0 | 1.5 |
| 0.75 | 1462 | 34.3 | 61.3 | 34.1 | 1.9 |
| 0.8 | 1417 | 30.7 | 58.7 | 25.0 | 2.5 |
| 0.85 | 1313 | 25.2 | 55.0 | 18.0 | 3.6 |
| 0.9 | 1076 | 17.7 | 45.2 | 12.7 | 5.8 |
© 2018 by the authors. Licensee MDPI, Basel, Switzerland. This article is an open access article distributed under the terms and conditions of the Creative Commons Attribution (CC BY) license (http://creativecommons.org/licenses/by/4.0/).
Share and Cite
MDPI and ACS Style
Sowale, A.; Kolios, A.J. Thermodynamic Performance of Heat Exchangers in a Free Piston Stirling Engine. Energies 2018, 11, 505. https://doi.org/10.3390/en11030505
AMA Style
Sowale A, Kolios AJ. Thermodynamic Performance of Heat Exchangers in a Free Piston Stirling Engine. Energies. 2018; 11(3):505. https://doi.org/10.3390/en11030505
Chicago/Turabian StyleSowale, Ayodeji, and Athanasios J. Kolios. 2018. "Thermodynamic Performance of Heat Exchangers in a Free Piston Stirling Engine" Energies 11, no. 3: 505. https://doi.org/10.3390/en11030505
Note that from the first issue of 2016, this journal uses article numbers instead of page numbers. See further details here.