Article

Power Flow Distribution Strategy for Improved Power Electronics Energy Efficiency in Battery Storage Systems: Development and Implementation in a Utility-Scale System

1
Department of Electrical and Computer Engineering, Institute for Electrical Energy Storage Technology, Technical University of Munich, Arcisstr. 21, 80333 Munich, Germany
2
The Mobility House GmbH, St.-Cajetan-Str. 43, 81669 Munich, Germany
*
Author to whom correspondence should be addressed.
Energies 2018, 11(3), 533; https://doi.org/10.3390/en11030533
Submission received: 21 January 2018 / Revised: 8 February 2018 / Accepted: 27 February 2018 / Published: 1 March 2018
(This article belongs to the Section D: Energy Storage and Application)

Abstract

:
Utility-scale battery storage systems typically consist of multiple smaller units contributing to the overall power dispatch of the system. Herein, the power distribution among these units is analyzed and optimized to operate the system with increased energy efficiency. To improve the real-life storage operation, a holistic system model for battery storage systems has been developed that enables a calculation of the energy efficiency. A utility-scale Second-Life battery storage system with a capacity of 3.3 MWh/3 MW is operated and evaluated in this work. The system is in operation for the provision of primary control reserve in combination with intraday trading for controlling the battery state of charge. The simulation model is parameterized with the system data. Results show that losses in power electronics dominate. An operational strategy improving the energy efficiency through an optimized power flow distribution within the storage system is developed. The power flow distribution strategy is based on the reduction of the power electronics losses at no-load/partial-load by minimizing their in-operation time. The simulation derived power flow distribution strategy is implemented in the real-life storage system. Field-test measurements and analysis prove the functionality of the power flow distribution strategy and reveal the reduction of the energy throughput of the units by 7%, as well as a significant reduction of energy losses in the units by 24%. The cost savings for electricity over the system’s lifetime are approximated to 4.4% of its investment cost.

1. Introduction

Energy storage systems are a promising option to provide flexibility and grid services in future electric grids [1,2]. Today, lithium-ion battery systems are being built in increasing number of installations as well as increasing power and energy capacities [3]. Such utility-scale battery systems typically consist of multiple units which together comprise the total nominal system power and energy [4].
In this work, we focus on systems consisting of multiple units, which each feature a battery and a dedicated power electronics (PE) and can thus be operated independently. In contrast, topologies that connect battery packs of multiple units in parallel may lead to heterogeneous current flows between parallel-connected battery packs due to variances for the battery impedance and capacity, which cannot be controlled [5,6]. This is of particular importance for systems which feature battery packs of varying State of Health or different battery chemistries, such as the battery packs in the Second-Life battery systems of this work. Dedicated PE for each battery pack is thus widely used, as in the battery storage system of this work.
The actual power for each unit is calculated based on the power flow distribution strategy (PFDS) of the system. The total system power is the sum of the power of all units. Typically, battery systems distribute the system power flow equally among the units comprising the system (Equal PFDS). The Equal PFDS is a technically stable and simple approach, as it ideally leads to identical levels of the battery state of charge (SOC) in all units. Between units of varying nominal energy, e.g., a unit of 50 kWh and a unit of 100 kWh, the total system power is scaled for the units according to their nominal energy to 1/3 for the 50 kWh unit and 2/3 for the 100 kWh unit. It is noted that the power capacity of the units has also to be taken into consideration.
However, the equal division of the total system power among all units also leads to low-power operating points for the units. PE show low efficiencies at partial load, and consequently relatively high conversion losses occur. Figure 1a shows the typical power loss curve of a bidirectional inverter applicable to battery storage systems. Losses at no-load/partial load are relatively high, and at no load, the losses amount to approximately 0.75% of the nominal unit power or 28.40% of the unit losses at nominal power. Figure 1b shows the resulting conversion energy efficiency, which is consequently low at partial load.
As the energy efficiency is a key performance indicator for battery storage systems and recent investigations showed that overall system efficiencies for real-world grid applications are indeed lower than typical literature values, especially due to the PE, options on how to reduce these losses require investigation [7].
The studied system is a Second-Life battery storage system, operated by The Mobility House in Lünen, Germany [8]. The system is set up from used battery packs from electric cars and has a nominal capacity/power of 3.3 MWh/3 MW. It should be noted that the system is part of a larger system with a total capacity of 13 MWh, but this study focusses on the 3.3 MWh sub-system only. The system is in operation for the provision of Primary Control Reserve (PCR) in combination with intraday trading (ID) for controlling the battery SOC. Further details on the system and its application follow in the subsequent Section (Section 2).
Thus far, only a few studies investigated power flow distribution strategies for battery systems. A PFDS for improving energy efficiency was proposed by Choi et al. in [9]. The focus was put on the system availability in their proposed method. Lee et al. discussed and tested the provision of frequency control through multiple energy storage systems based on hierarchical cluster structures, but with a focus on system availability and reliability and no consideration of energy efficiency [10]. Cho and Yun proposed an optimized PFDS for improved energy efficiency based on genetic algorithms which aim for the optimal operating point of the power electronics as well as balanced energy throughput [4]. In contrast to the reviewed studies, this work features an analysis of a utility-scale Second-Life battery system in detail for its energy efficiency and consequently the development of an optimized PFDS and its implementation. Field-test measurements are evaluated and show the feasibility of the PFDS as well as the successfully improved operation metrics.
A holistic system model for battery storage systems that enables a realistic calculation of the energy efficiency is parameterized with the system structure, the component data, and the application load profiles. The system so far operates on equal PFDS. After validating the system model with the measurement data from the system, a detailed energy loss analysis is conducted. Results confirm the high conversion losses in the PE at the low operating point of the system.
Consequently, an optimized PFDS is proposed. The optimized PFDS is based on the reduction of the operation time of the PE. Only the currently required inverters are in operation. The mechanism for the improvement of the overall system efficiency is thus the reduction of the PE losses occurring at low load and at no load. Simulation results suggest significant potential for the improvement of energy efficiency. The optimized PFDS is implemented in the battery system. Measurements show the functionality of the operational strategy, the reduction of the energy throughput as well as the significant reduction of energy losses.
The paper is structured as follows. Section 2 introduces the Second-Life battery system and its grid application in detail. Section 3 describes the system model used for the energy loss analysis and presents the results. Section 4 presents the optimized PFDS and the results of the implementation in the storage system. Section 5 concludes the study and their results. Finally, future work is suggested in Section 6.

2. Second-Life Battery System

The system in this work is a Second-Life battery storage system. Second-Life here refers to the second application of automotive batteries that were first used in battery electric vehicles. The stationary application for the battery packs extends their usage beyond their initial mobile application. The concept is a promising approach to reduce the high costs associated with the battery packs for a battery system [11,12], and thus improve the economic viability of battery storage systems and their applications [13,14,15]. As Second-Life is still a relatively new concept, economic and battery lifetime evaluations are still under investigation today [16,17,18]. As one of the first systems and at time of the installation the largest Second-Life system in the world, the system in this work also shows the technical feasibility of Second-Life concepts.
The system in this work is based on battery packs of electric vehicles sold under brand name Smart electric drive by Daimler and is operated by The Mobility House in cooperation with GETEC and REMONDIS in Lünen, Germany [8]. The system setup and measurements, as well as the system model and its parameters, are provided by The Mobility House and are unpublished and company-internal data. The model parameters cited [19] and system measurements used/presented in the following are thus not available for publication as raw data.
The system is in operation for the provision of PCR, a grid ancillary service for frequency control. PCR is the stabilization of the grid frequency by providing positive or negative power to the grid in case of frequency deviations from the nominal frequency. For systems providing PCR, the actually required power to be provided is determined by the measured frequency deviation [20]. The ancillary service is remunerated and coordinated by the Transmission System Operators (TSO) [21]. As battery systems have limited storage capacity, they need to charge/discharge power additionally to the frequency control power to maintain their SOC. This additional power can be flexibly bought/sold through power contracts, such as intraday trading. Specific protocols and regulations have been set by the TSO for the PCR operation and market participation of battery systems [22]. Model-based studies on battery systems providing PCR already evaluated battery lifetime [23,24], sensitivity studies on the energy management strategies and regulations [25], as well as economic implications for the battery system operation [24].
Figure 2 shows a schematic overview of the system under investigation. The system consists of six Technical Units (TU), the auxiliary system components, and the grid connection.
The TU each consist of batteries with dedicated PE. The auxiliary components are required for the operation of the overall system (Battery Thermal Management, System Thermal Management, and Control and Monitoring). A transformer connects the system-internal 400 V AC low-voltage to the 10 kV medium-voltage grid [26]. The TU, as well as the auxiliary components, are connected to the low voltage level within the system.
The calculation boundaries of the round-trip technical unit energy efficiency η TU , which includes the battery and the power electronics, as well as for the overall round-trip system energy efficiency η System , which further includes the transformer and the auxiliary system consumption, are also indicated in Figure 2.
Figure 3 shows a detailed overview of the TU with their varying specifications and setups. TU 2–5 each consist of two identical power strings. Both power strings each provide half of the nominal power/energy of the TU. TU 3–5 are identical and shown only once.
TU 1 serves as a backup unit for the other units and is used rarely for system-internal load balancing. It is therefore typically not providing PCR. TU 2–6 provide PCR to the electrical grid. Each TU providing PCR is acting as an independent unit. The PFDS is thus only considered within the specific TU. For the units featuring only a single power string (TU 1, TU 6) no PFDS is relevant. Within the units that consist of two power strings (TU 2–5), the equal PFDS distributes the power equally to both power strings that have identical nominal power for the ideal case, in which no SOC difference between the batteries of the two power strings is measured. If a SOC difference arises, a correction factor is applied to achieve an equal SOC between the power strings again.

3. System Simulation

Section 3.1 introduces the system model structure, the component models, and parameterization. Section 3.2 then presents the model validation against measured data as well as the results and implications of the energy loss analysis of the system.

3.1. Model Development

The model developed for the system analysis is based on an existing system model by Schimpe et al. [7]. The model is developed for holistic energy efficiency evaluations of container-size to utility-scale battery storage systems. Separate component models are implemented and coupled to an overall system model.
The existing model is adapted to the specific system structure and parameters for all components of the specific system are implemented.
Table 1 shows the grouped components of the system, their respective component model type as well as the main parameters used for the model parameterization.
The battery-pack, part of the TU, is modeled based on a single-cell model. The cell is simulated through an equivalent circuit model featuring an open circuit voltage U Cell , OCV as well as a resistance R Cell , which accounts for the overvoltages within the cell. The resistance parameters are derived from pulse parameterization for both directions of current I , charge (positive) and discharge (negative). The battery packs are water-cooled and stored at approximately 20 °C ambient temperature, and operate at a low average load as will be discussed in Section 3.2. The cell temperatures are thus expected to not increase in temperature strongly. As thermal parameters of the cell and pack are not available, the cell parameters, open circuit voltage and resistance values, are taken and implemented at a temperature of 25 °C versus the State of Charge SOC. Mismatching losses in the series-connection and increases in battery cell resistances due to cell degradation are not implemented, as no information is available, but in general, are both expected to increase losses.
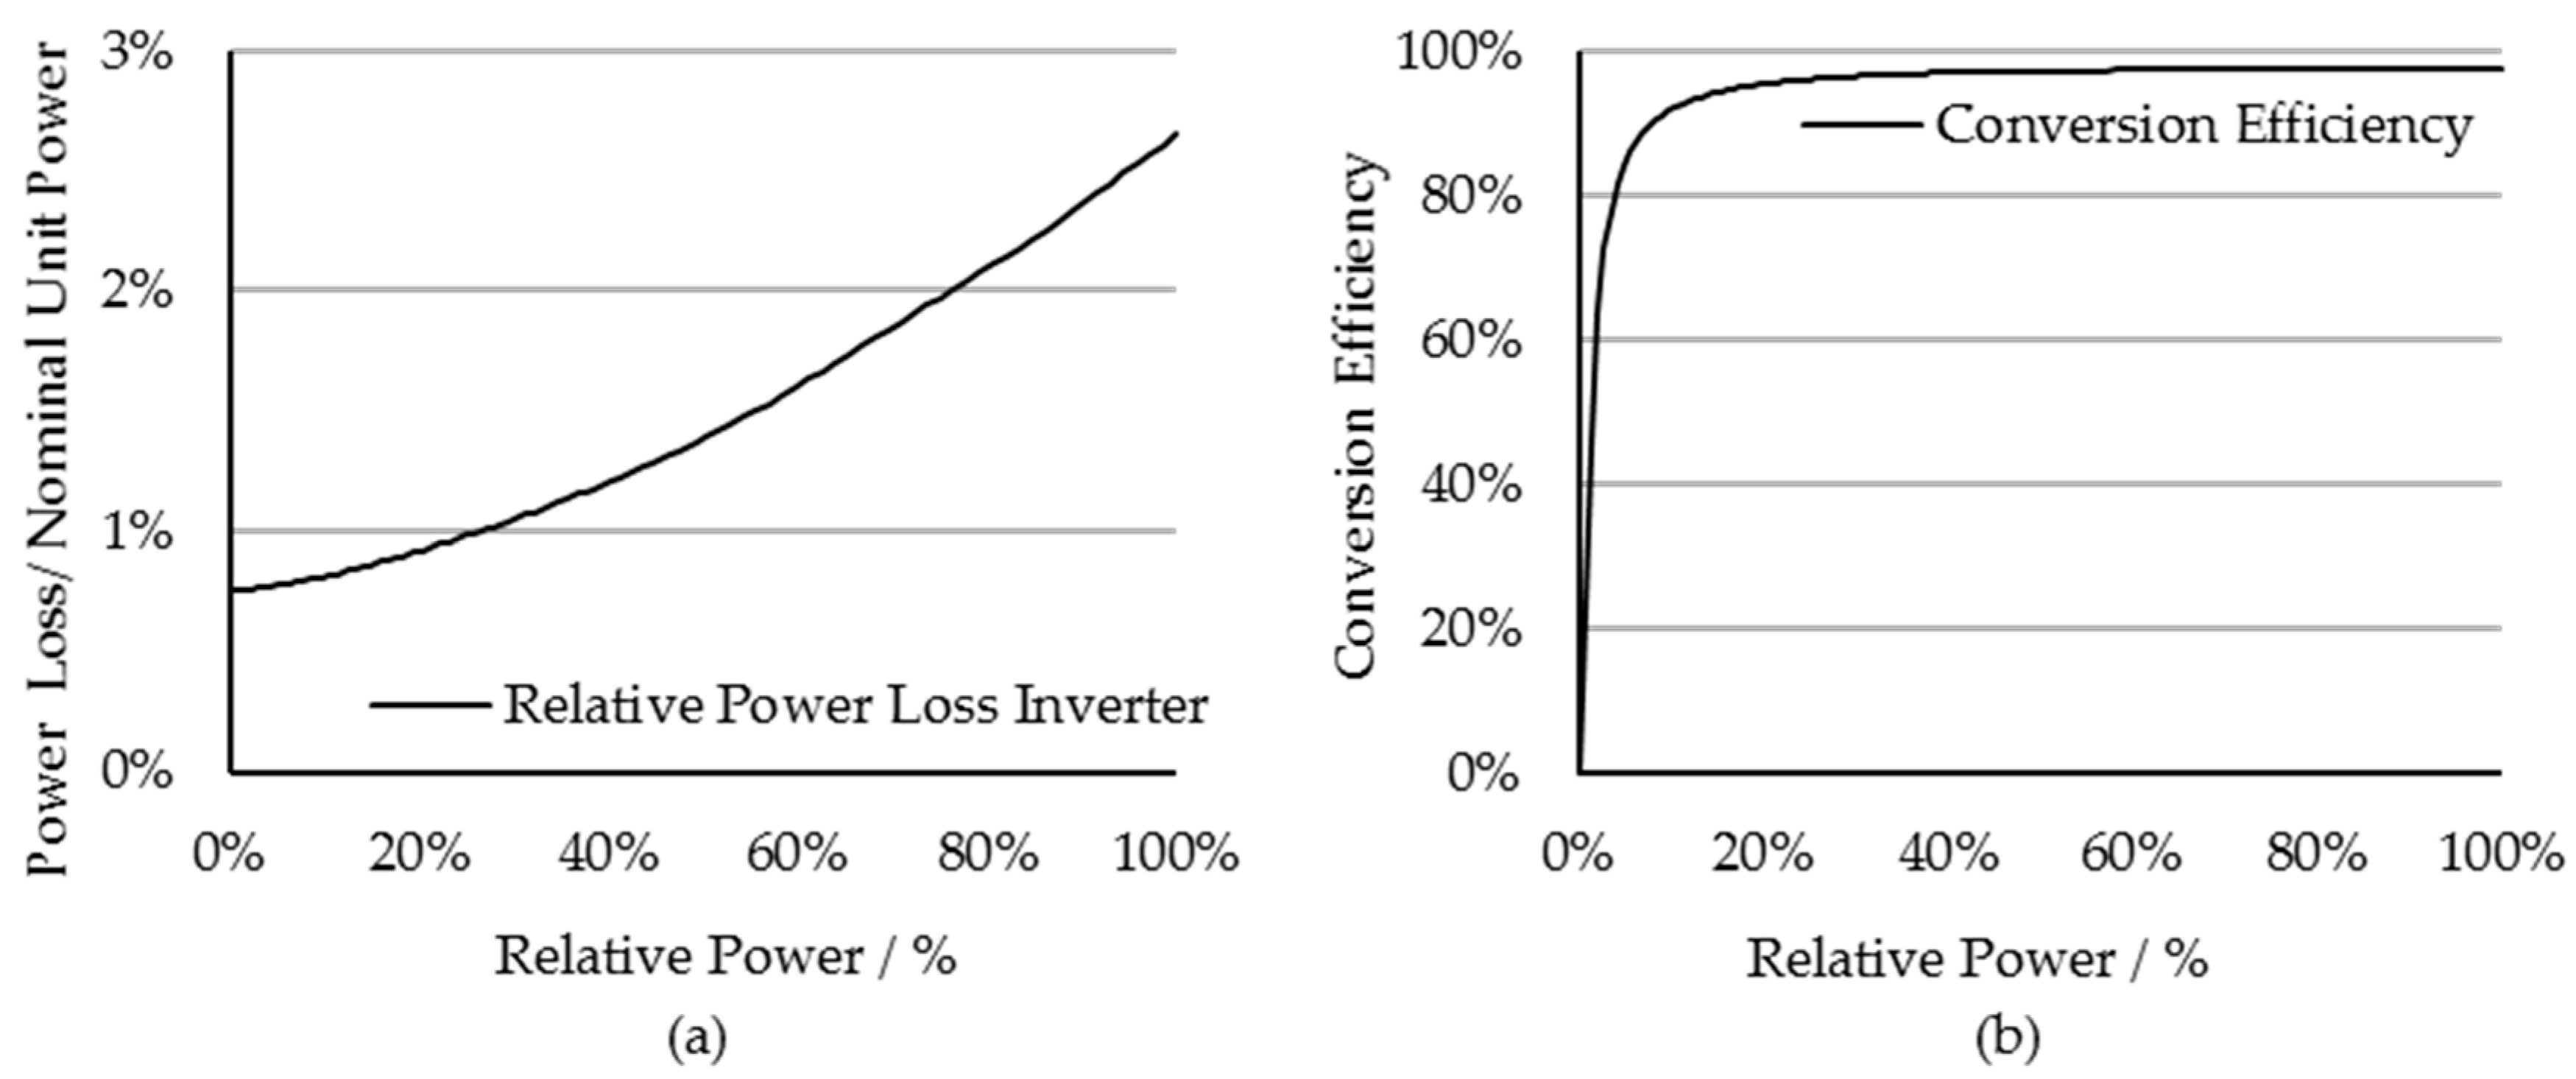
The second component model of the TU, the PE model, is implemented through look-up data of the power losses P PE , Loss as function of the power, P PE . The data, which is provided for each PE type by the PE manufacturer, is implemented with separate data for both power flow directions, charge, as well as discharge. Power factor is set to 1 for both system operation providing PCR as well as in the measurements of the power loss curves.
The transformer connecting the overall system to the grid is modeled based on measured data for the power loss at both no-load and full-load, which is provided by the transformer manufacturer. The transformer losses P TF , Loss are then calculated with a square-power function for the load-dependent losses, which feature Ohmic loss behavior, as function of the secondary-side power P TF , Sec .
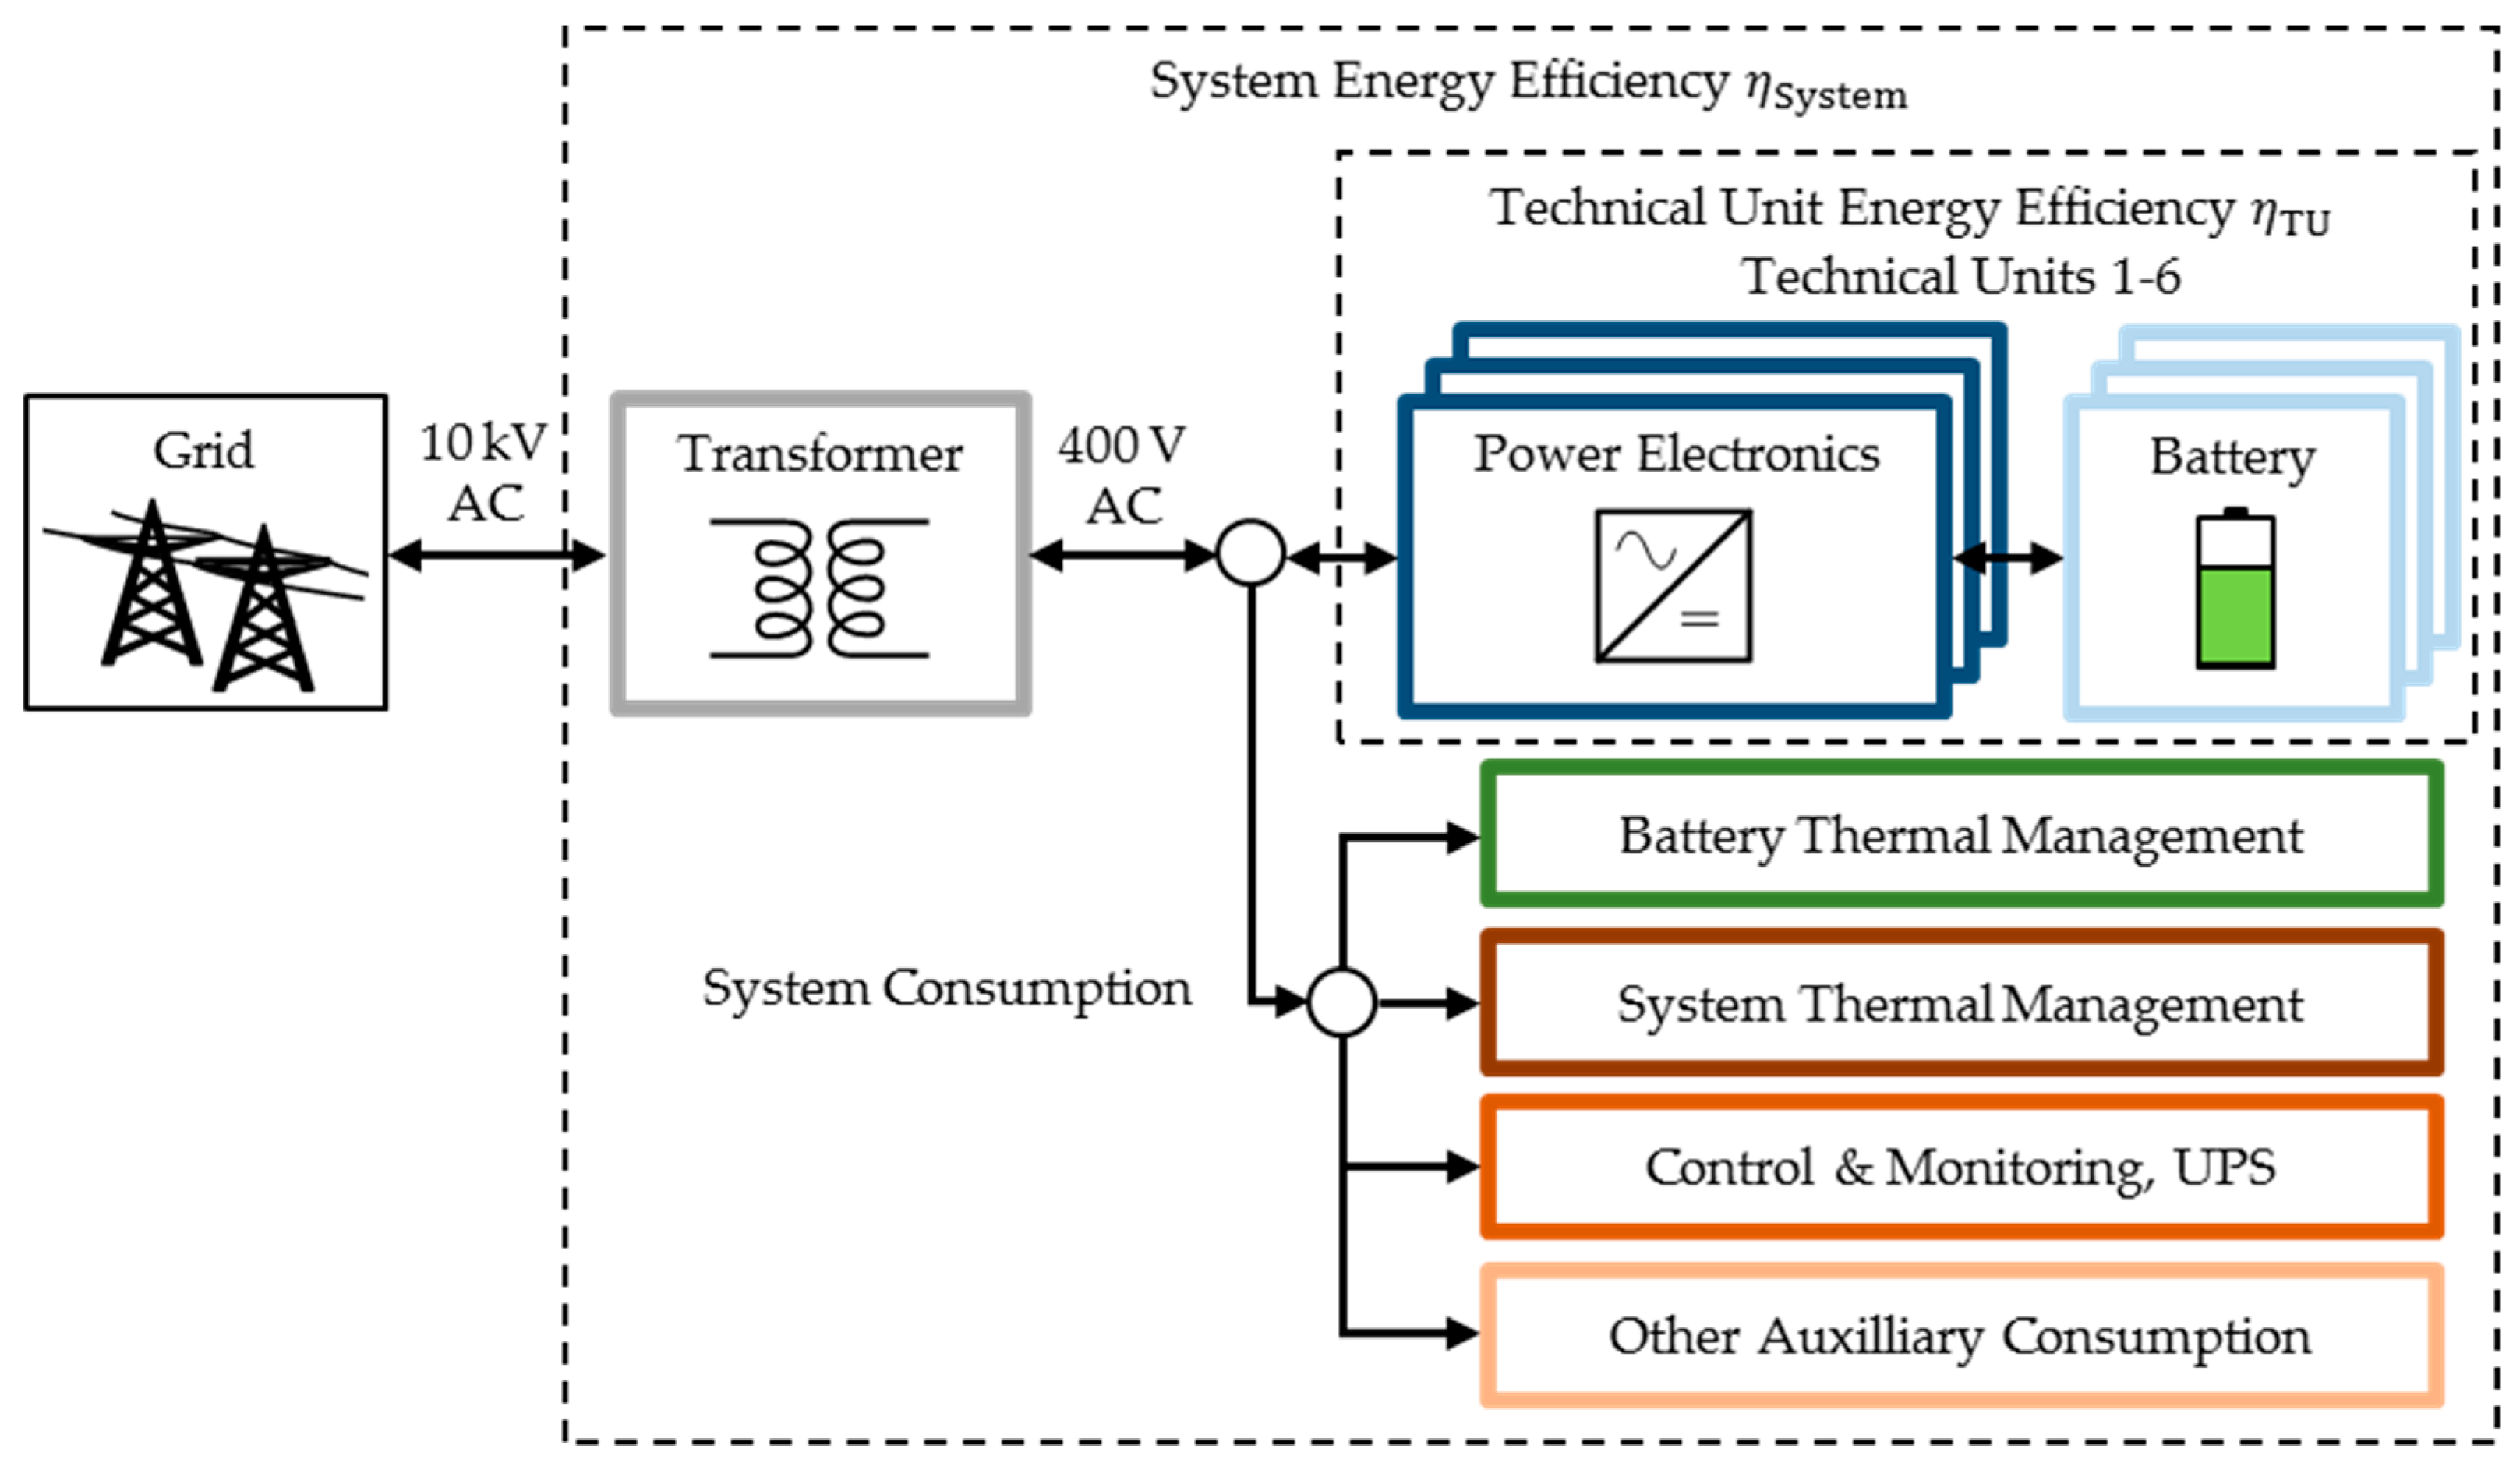
The auxiliary components are not modeled but implemented through measured data for their power consumption. Four groups are defined: (I) Battery Thermal Management System (B-TMS); (II) System Thermal Management System (S-TMS); (III) Control and Monitoring components that include the Uninterruptible Power Supply (C&M); and (IV) the remaining consumption for various components. Detailed measurements of the remaining various components are not available; however, a large share of consumption is assumed to be attributed to ambient air filter components. For each auxiliary component group, the measured power consumption P Aux is implemented as function of time t .
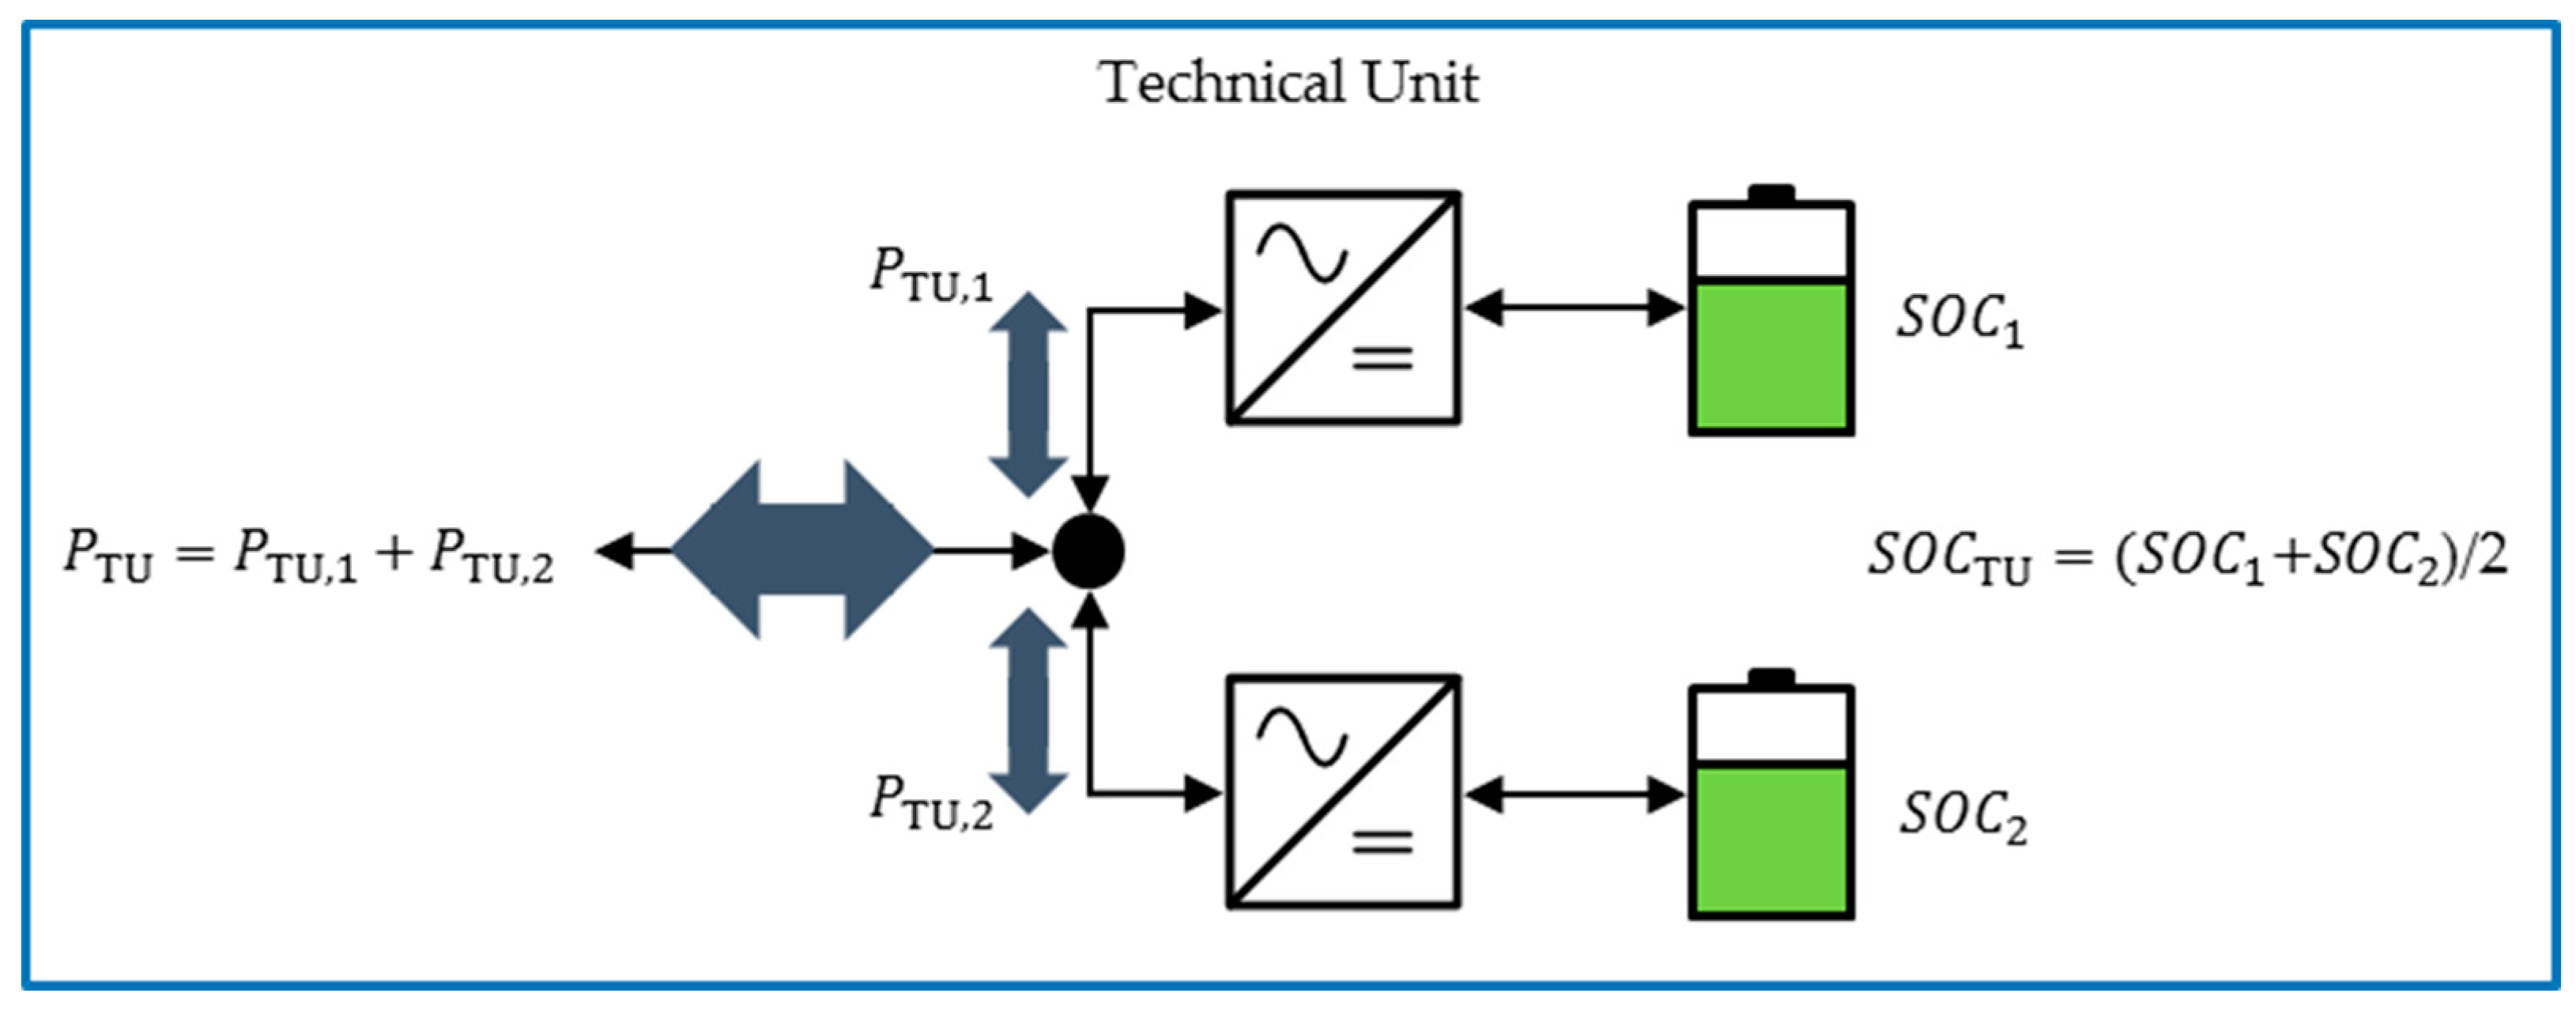
The power control of the system is implemented as the load profile for each TU, based on the measured data over time, P TU , AC . The SOC measured in each TU (average SOC for a TU with two power strings), S O C TU , is set as initial value for the simulation after every 24 h to remove SOC drift between the model and the system due to small deviations for the battery current, which add up over long simulation durations. The changes in SOC through the reset are included in the loss calculation.

3.2. Simulation Results

Before analyzing the energy losses of the complete system, the TU model is validated against measured data. The measured efficiency values here and in the following include the differences of stored energy through the changed battery SOC between the beginning and the end of the considered period.
Table 2 shows the charged/discharged energy of the TU, and the simulated/measured round-trip energy efficiency and their deviation for the month of March 2017.
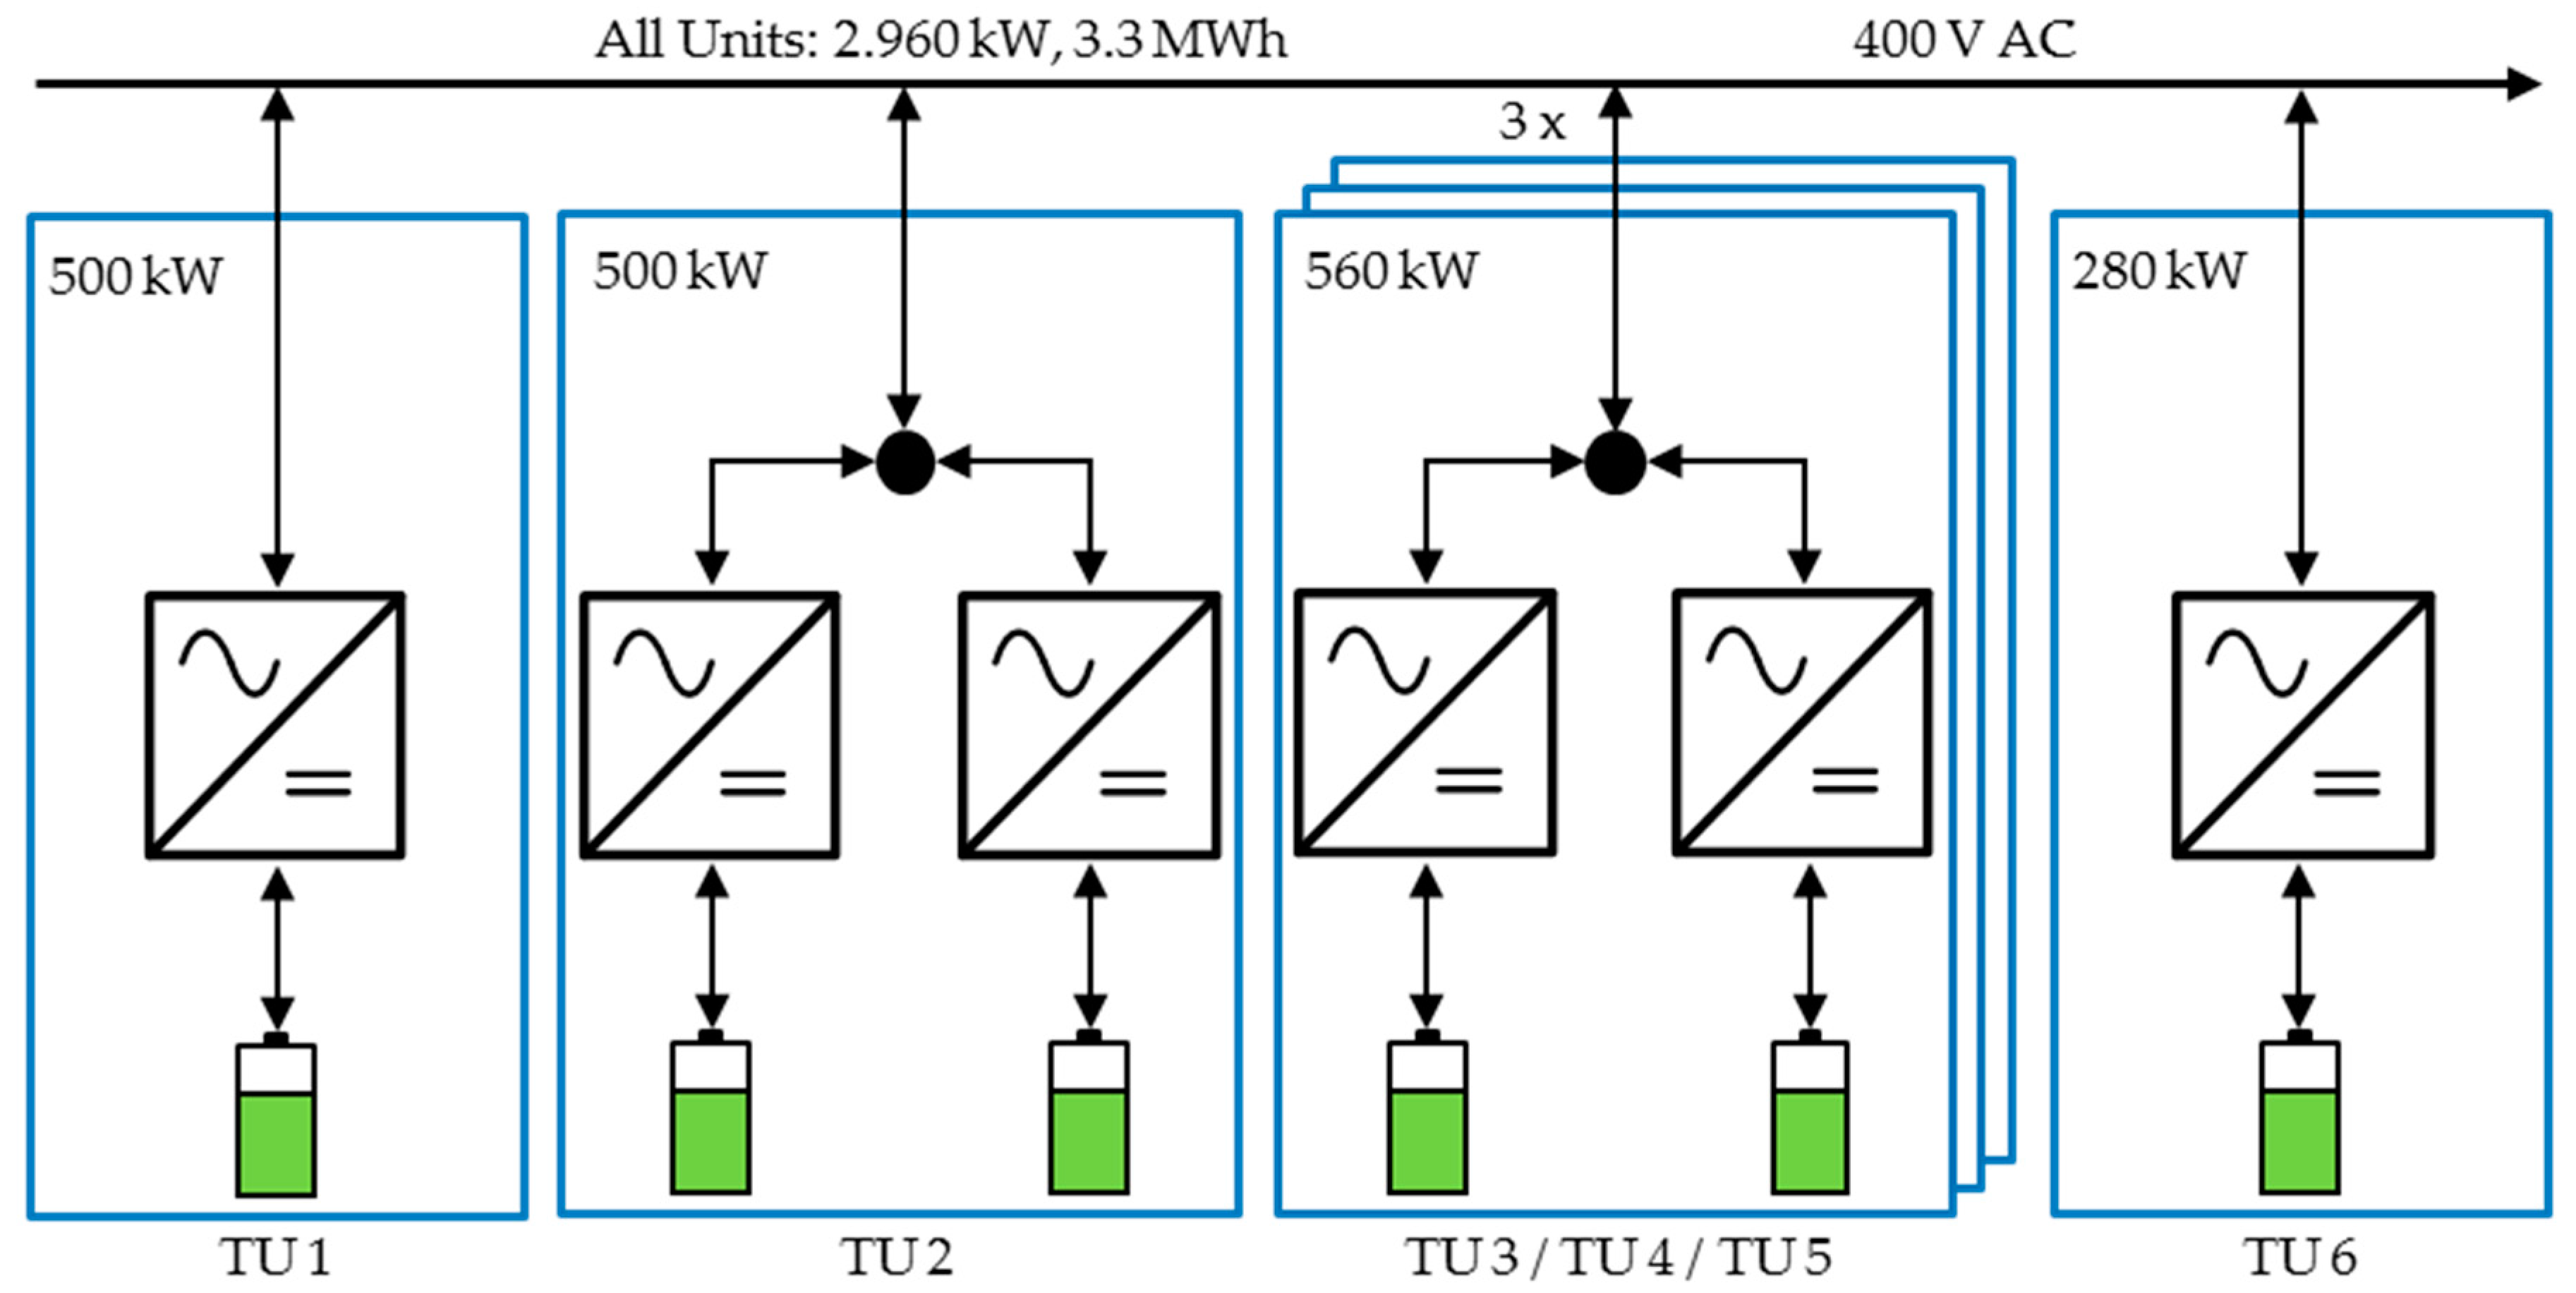
Energy throughput for TU 2–6 varies with the respective unit power. TU 1, the backup unit, is rarely active for inter-system balancing operation. TU 2–6 providing PCR show similarly measured efficiencies between 72.88% and 76.65%. The different efficiencies are caused by technical setup variations, such as varying battery types, which are each implemented with specific parameters, and different inverter sizes (see Figure 3). TU 1, the backup unit, is active at only low relative power and thus has a relatively low efficiency.
The simulation results for the energy efficiency of the various TU are between 0.16% and 2.37% higher than the measured values. This trend in the deviation results possibly from the battery model. In the implemented type of equivalent circuit model, all battery overvoltages under load are calculated based on the single resistor in the model. Battery overvoltages are, however, dynamic, increasing with longer durations of load [27]. A battery operating under fluctuating load thus operates with decreased overvoltages compared to a battery model using a non-dynamic resistor only. Finally, the accuracy of the power electronics parameters for the power loss curve can significantly influence the model result.
All units in total have a measured efficiency of 73.25% for which the simulation predicts an efficiency of 71.77%, equating to a deviation of −1.48%. Summarized, the model is in good agreement with the measured data for the system.
When considering the complete system, the round-trip energy efficiency η System is found significantly lower at 56.06%, again for March 2017. The reduction is due to the additional energy losses in the transformer (1.79 MWh) as well as due to the auxiliary energy consumption (B-TMS 1.47 MWh, S-TMS 2.57 MWh, C&M 7.88 MWh, Other 1.18 MWh).
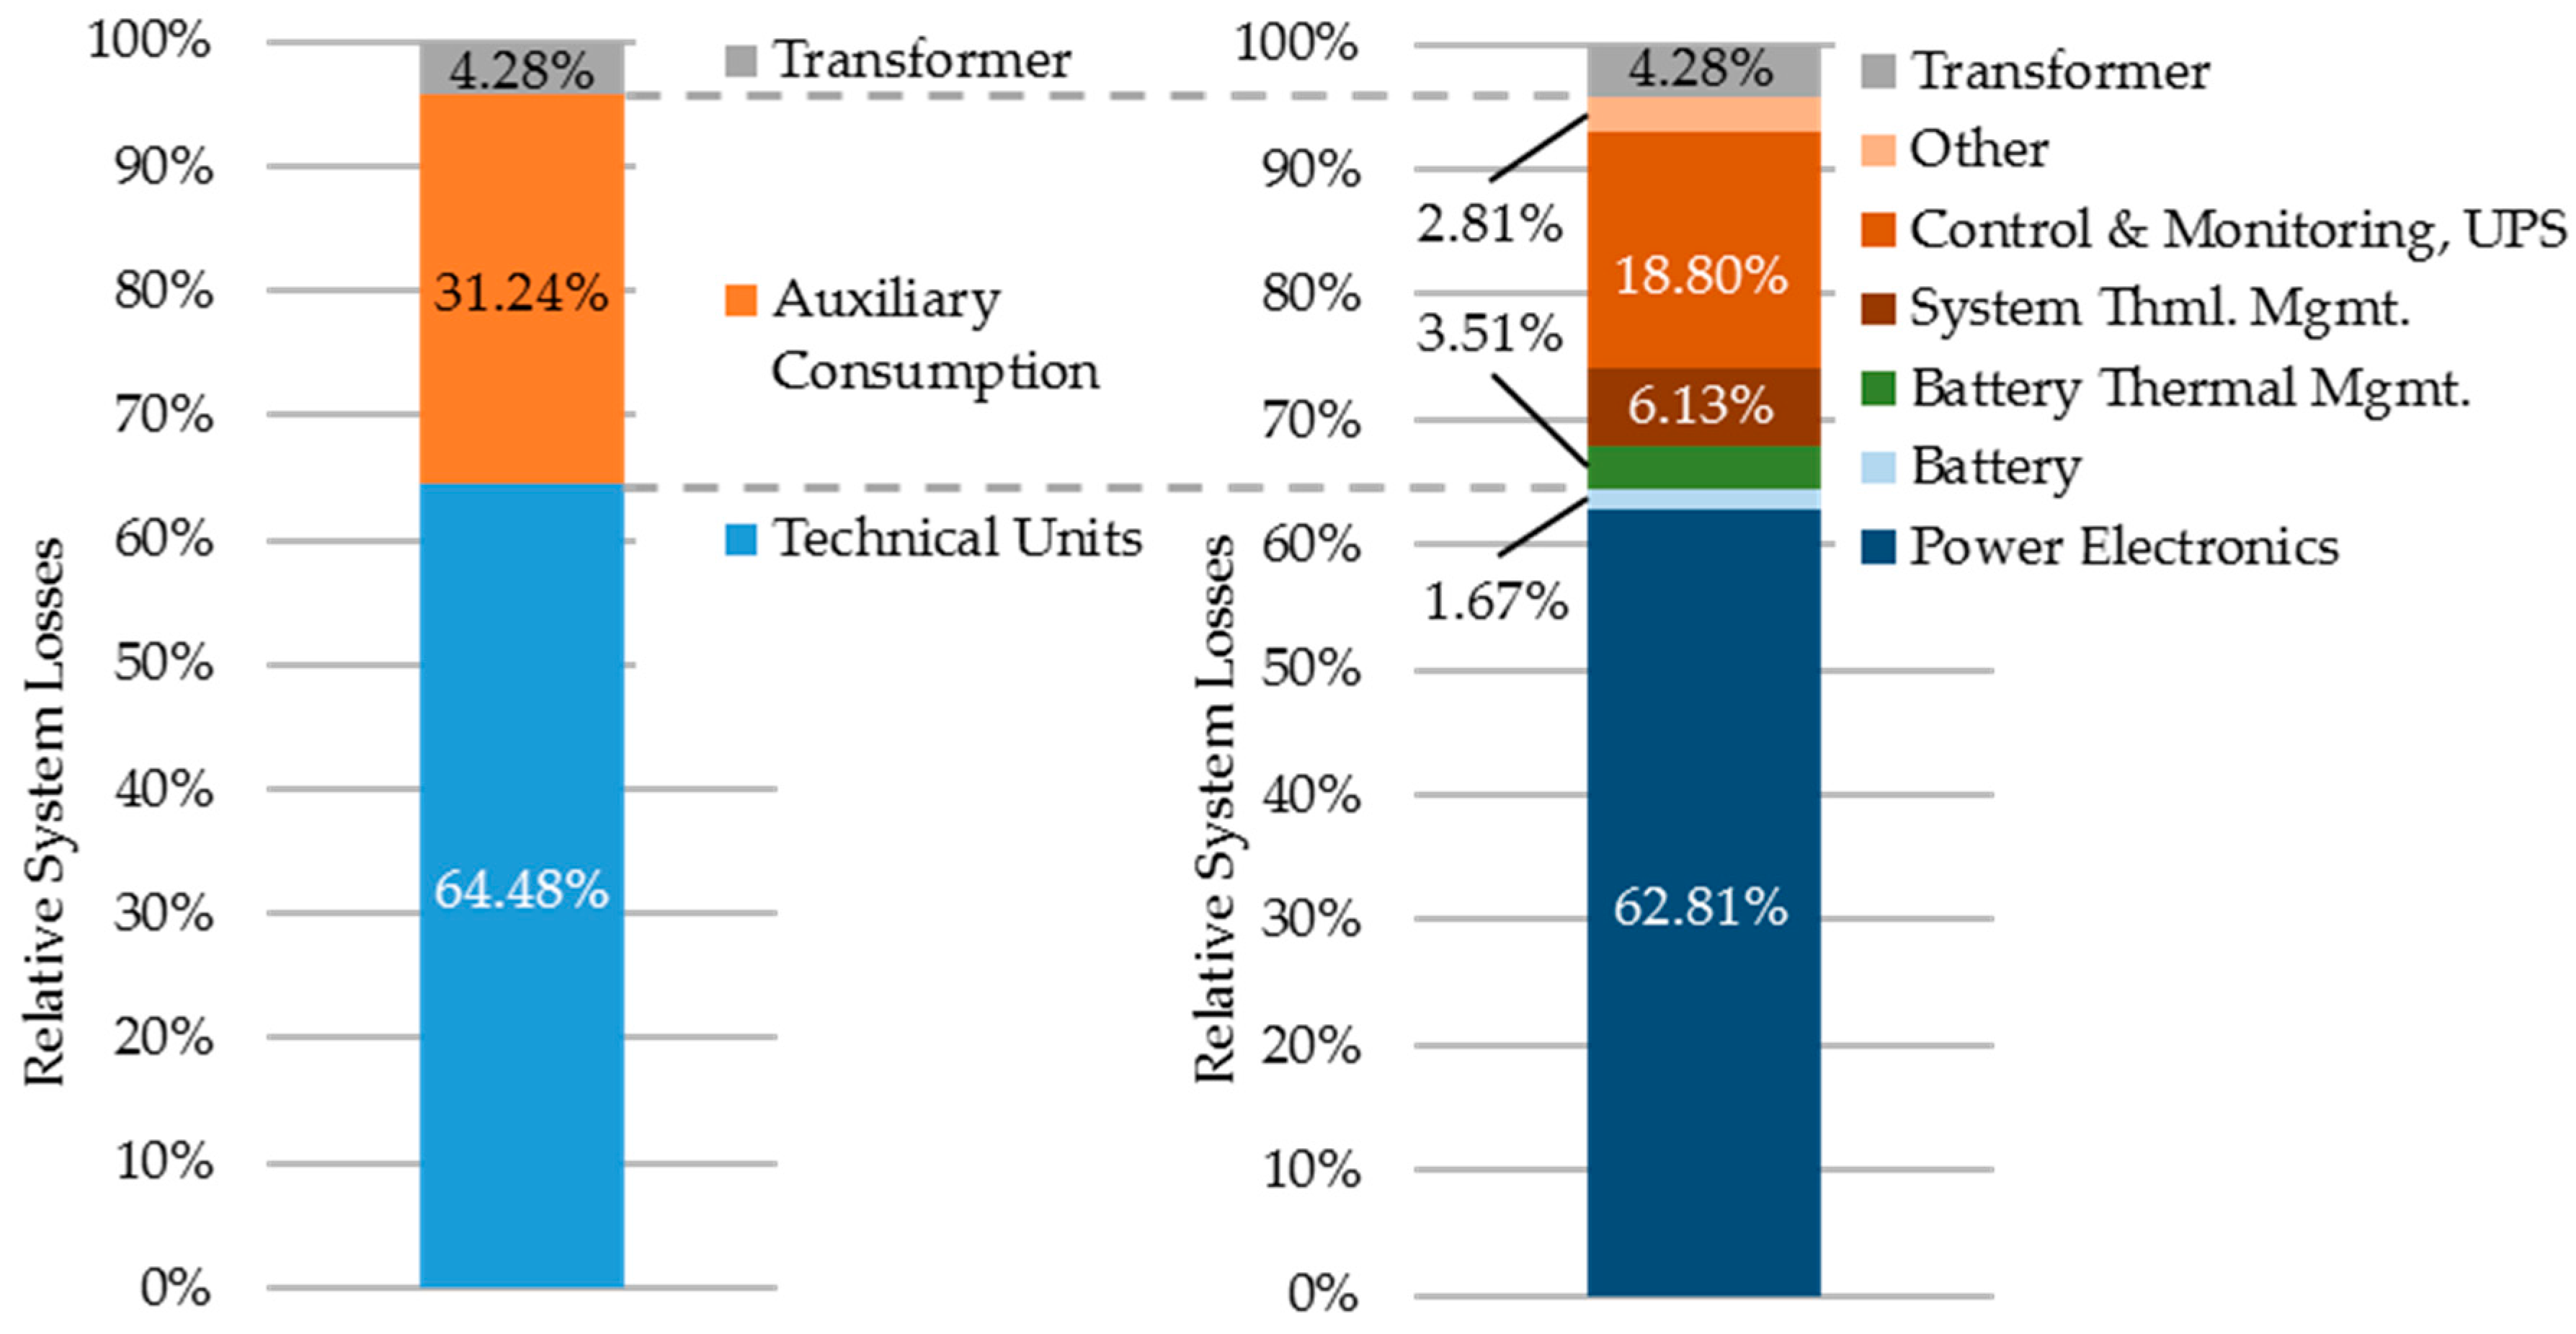
To identify the exact mechanism, the loss distribution analysis for the complete system is conducted and shown in Figure 4 for the operation presented in Table 2. The left side shows the distribution grouped by transformer losses, auxiliary consumption and the losses occurring in the TU.
With 64.48% of the overall losses, the TU are responsible for most losses. Second is the auxiliary consumption, which leads to 31.24% of all losses. The transformer’s share of losses at 4.28% is here the smallest contributor.
The right side shows the analysis with a more detailed breakdown. Within the TU, the PE is identified as the largest contributor, whereas the batteries are the smallest contributor of all loss mechanisms. The breakdown of the auxiliary consumption shows that all components are relevant contributors. The Control and Monitoring of the overall system, which also includes the power consumption of the uninterruptible power supply, is the biggest contributor to the auxiliary consumption and the second-largest in overall. It is noted that the energy consumption of the thermal management is subject to changes with varying outdoor temperatures and that this analysis specifically covers March 2017 only.
As the model represents the auxiliary consumption only as measured data, no improvement strategies for the auxiliary consumption of the given system through improved operation can be evaluated. The transformer is a passive component and thus also offers no improvement potential through operational strategies. Consequently, an improved operational strategy derived from the analysis in this work will focus on the TU operation, which is the largest contributor to the system losses as the previous analysis has shown.
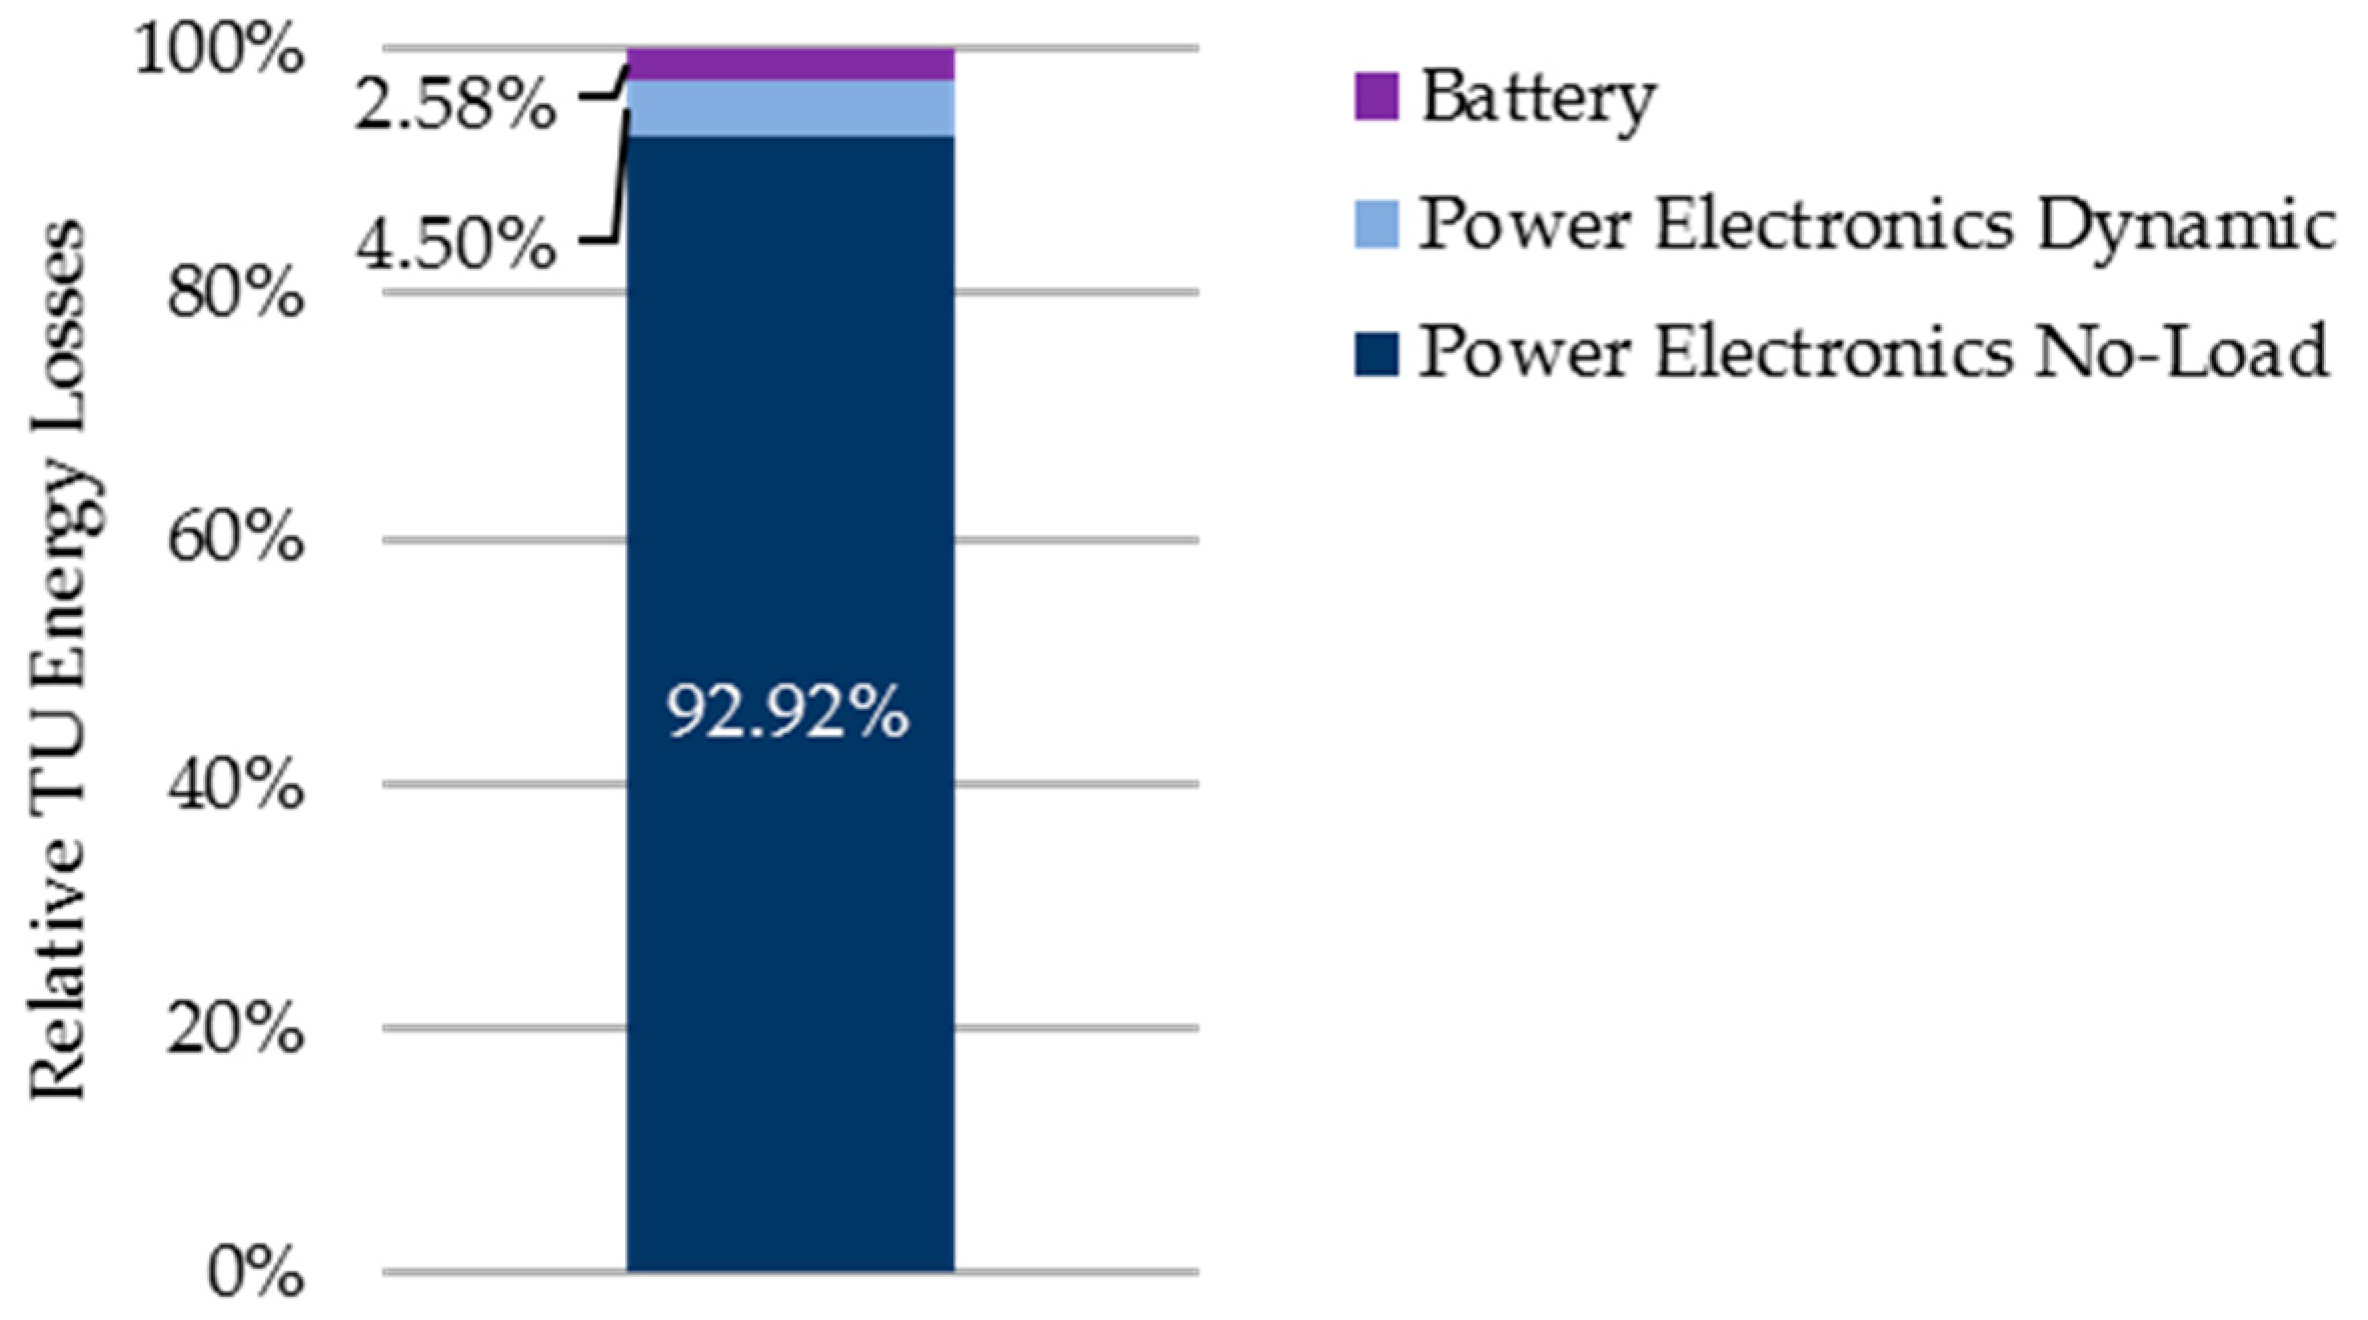
Figure 5 shows the loss distribution for all TU. Here the differentiation between no-load losses and dynamic losses for the PE is made. Losses within the PE are the sum of switching and conduction losses within the semiconductors, magnetic losses in filter components, and Ohmic losses in general. As no detailed PE model is available, the losses are grouped into no-load losses and dynamic losses. No-load losses are defined as the power losses occurring at no output power, but with the PE unit in operation, fully connected to its AC and DC sources, and with the switching control active. Dynamic losses are defined as the losses that occur additionally to the no-load loss value when the unit increases its output power.
The analysis shows that in total the no-load losses lead to 92.92% of the overall losses of the TU. The battery losses and the dynamic PE losses are in comparison much smaller.
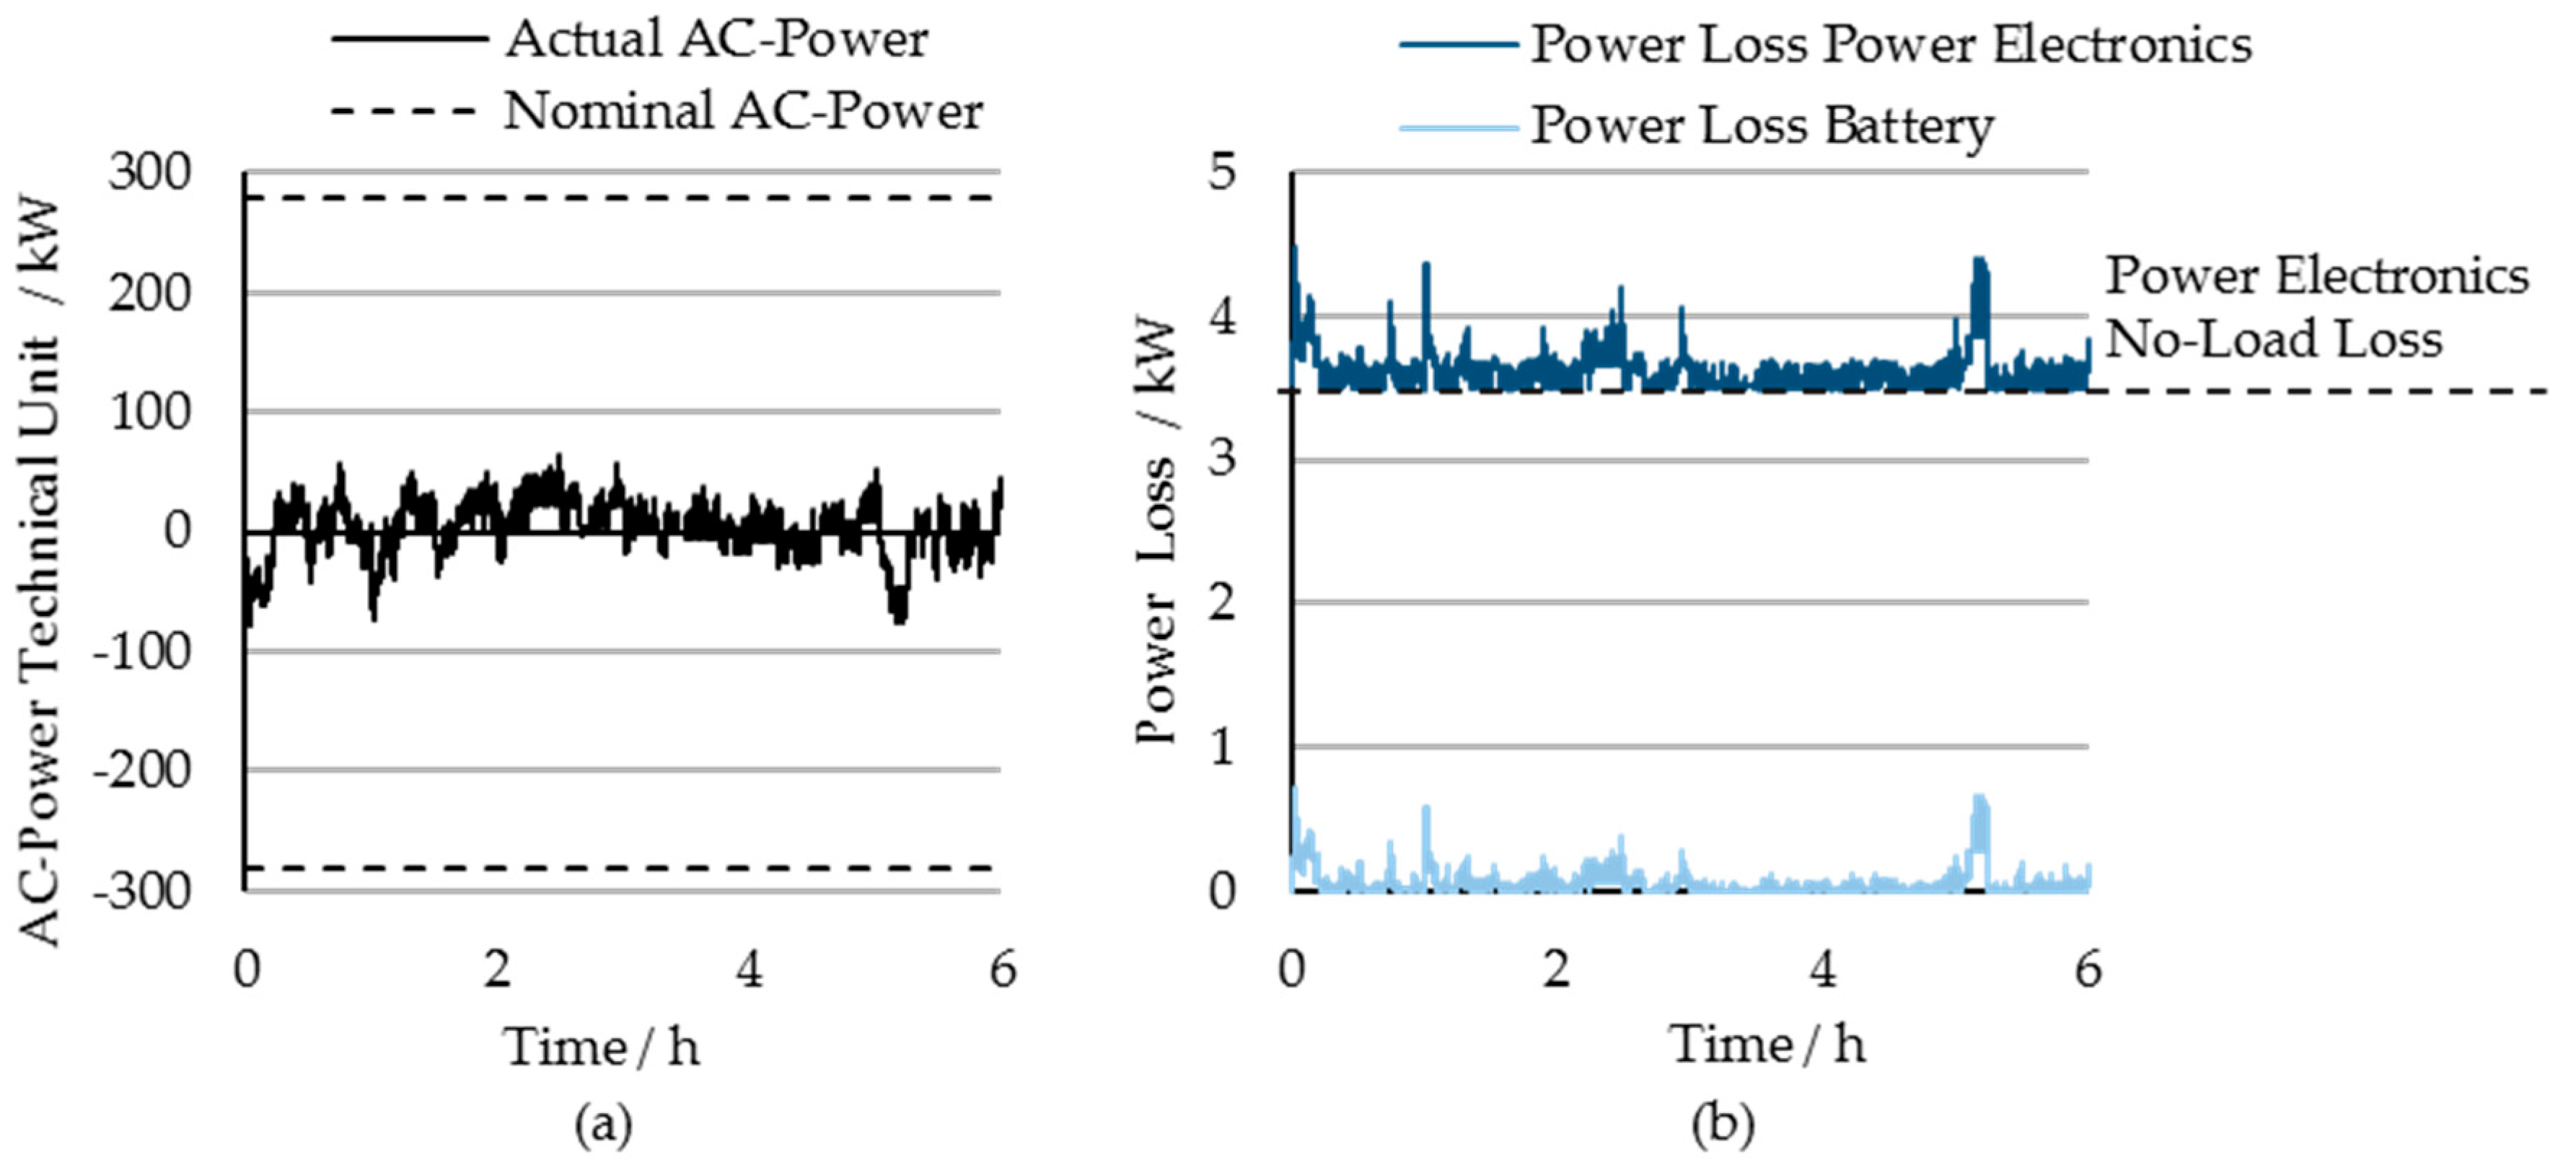
For further evaluation of the origin of losses in the TU, the profile of the application is analyzed. Figure 6a shows the measured AC-side power of TU 6 ( P > 0 : Charge, P < 0 : Discharge) over time. Within the representative duration of six arbitrary hours, the maximum absolute power is 78.92 kW, and the average of the absolute power is only 16.52 kW. Both values are relatively small in comparison to the nominal PE power of 280 kW. The selected duration is representative of the available data in terms of two aspects: (I) grid frequency fluctuations constantly require the operation of the TU; and (II) TU power is on average low.
The resulting power losses (simulated data) are shown in Figure 6b. The PE losses here constantly show a high offset value as the PE is in operation at all times. The offset value is also high in comparison to additional dynamic losses or to the battery losses, which confirms the previous findings of the TU loss analysis (see Figure 5).
The conclusion from the loss analysis is that the PE no-load losses are the largest contributor to the system losses. As the losses can only be avoided when the PE unit is turned off, an analysis of the actual power demand is conducted to evaluate if this is an option considering the load profile. 
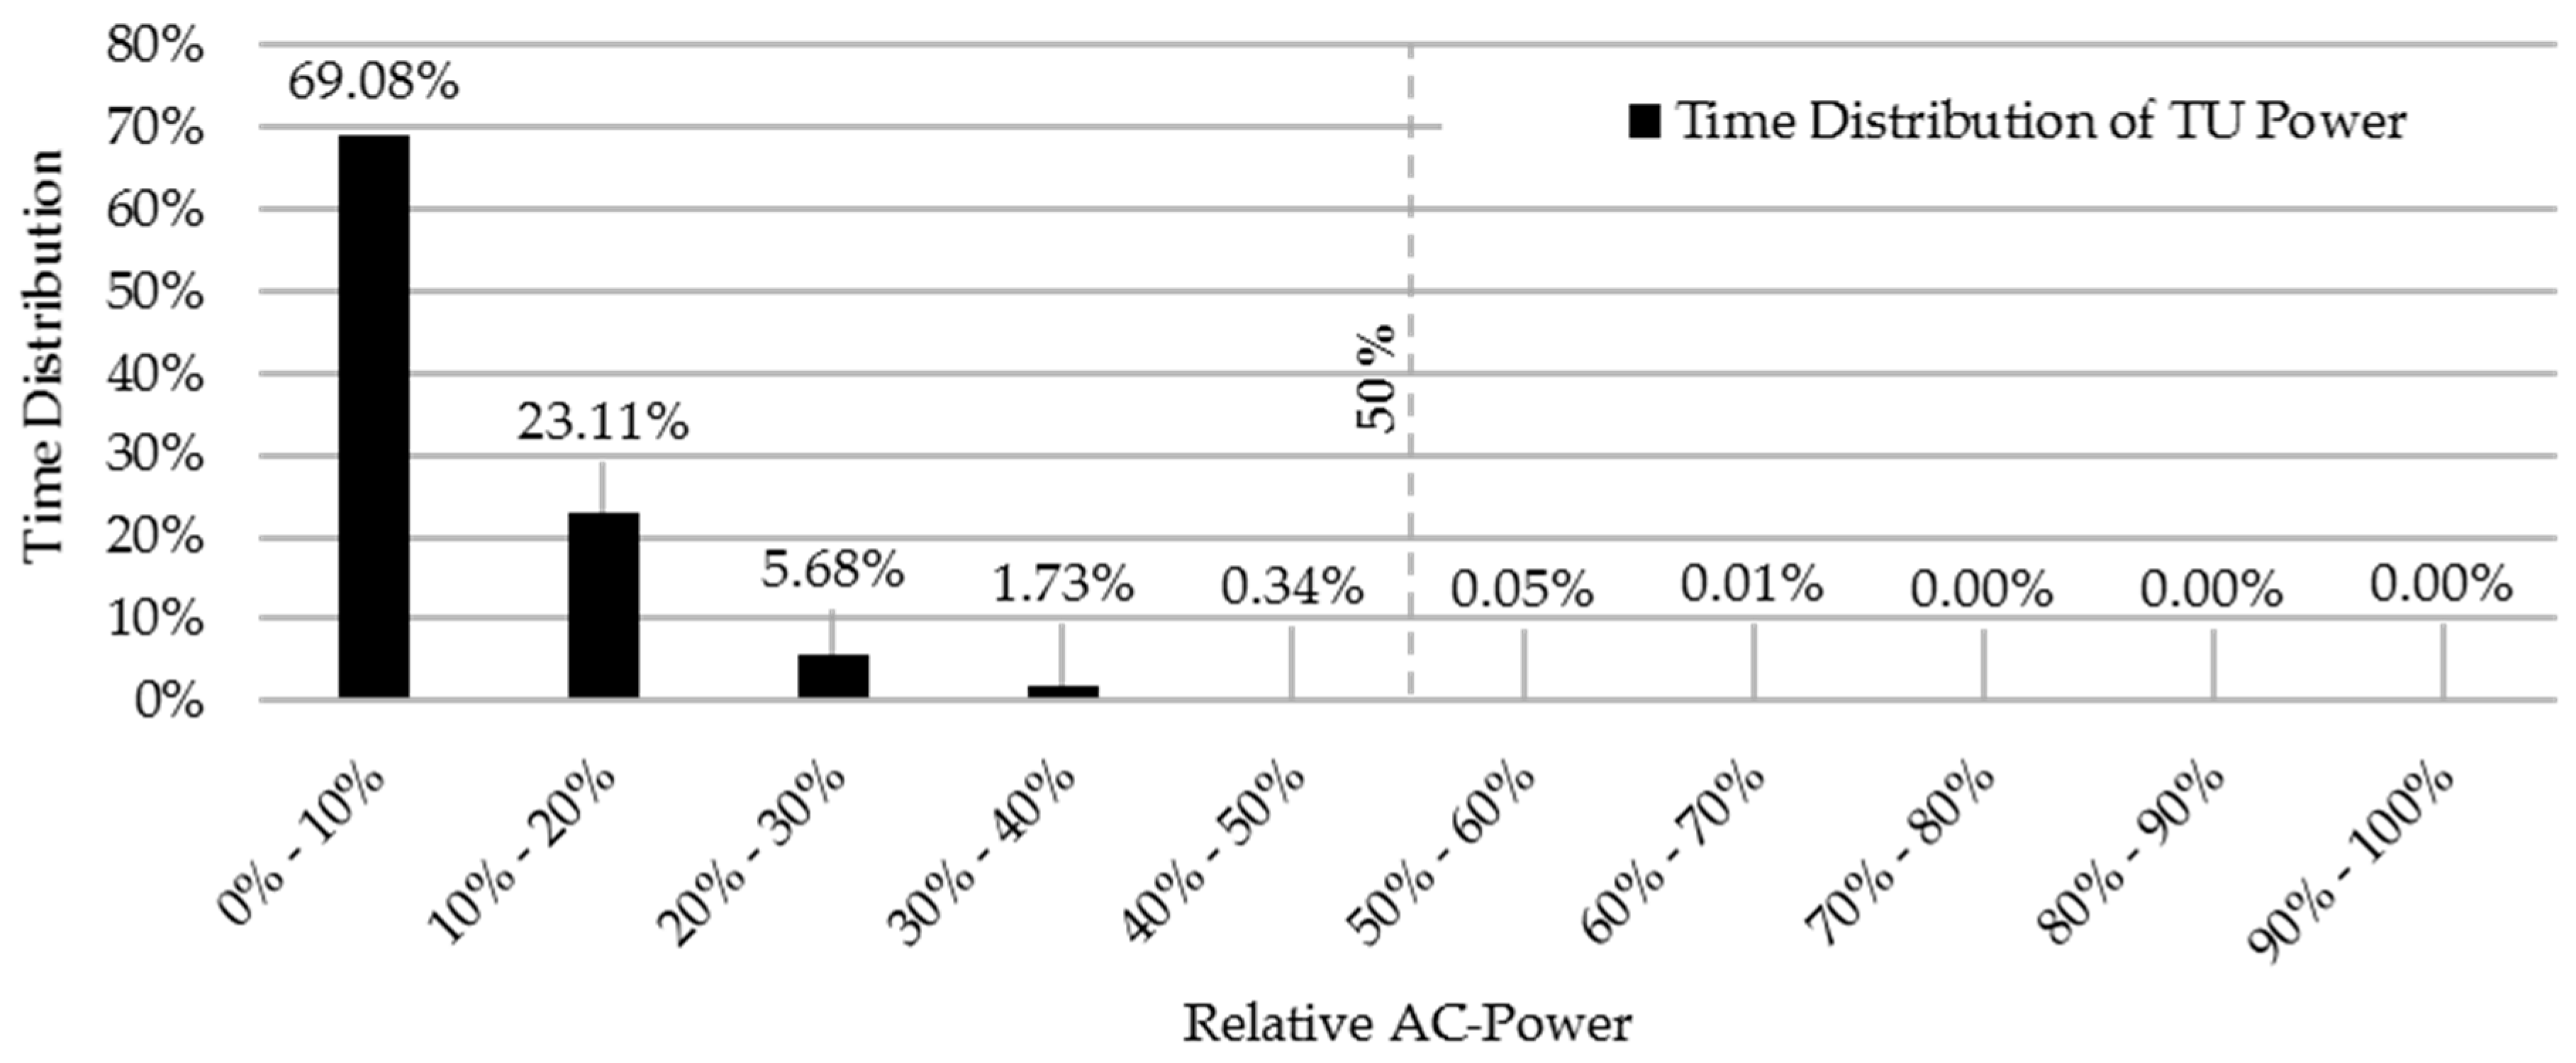
Figure 7 shows the temporal distribution of the relative power of TU 5 in March 2017.
Most of the time, the power is low: 99.95% of the time, the relative power is under 50%. As TU 3–5 consist of two power strings of identical setup, during this time, theoretically, only a single power string would be sufficient for providing the output power. This result motivates the development of an optimized PFDS that uses this optimization potential.

4. Optimized Power Flow Distribution Strategy

Section 4.1 describes the proposed optimized PFDS based on the previously discussed results. The procedure and results of the implementation in the storage system are presented in Section 4.2.

4.1. Proposal and Development

The energy loss analysis showed that the biggest contributor to the system losses are the no-load PE losses and that they are responsible for 92.92% of the losses occurring in the TU. The profile analysis showed that most of the time, less than 50% of the TU power is required in the PCR application.
As the no-load losses can be reduced through deactivation of PE units, a PFDS that uses only the minimum number of required power strings within the TU is expected to have significant potential to improve the energy efficiency. The PFDS is applicable for the TU consisting of two power strings.
This proposed optimized PFDS is a non-equal PFDS that consequently leads to a variation of the SOC between the batteries in the power strings. The total TU power for both charge and discharge has to be kept available at all times. E.g., if one string is at the maximum SOC due to insufficient SOC management, the string cannot provide power for the charge direction, which results in a reduction of the TU charge power availability by 50%. The SOC difference between the two strings should thus be as small as possible so the TU power availability does not differ from an equal PFDS. The PFDS thus also has to respect the varying SOC values in terms of the energy management for the provision of PCR.
Figure 8 shows the schematic overview for a TU with two power strings. The unit power P TU is distributed to the power strings P TU , 1 and P TU , 2 :
P TU = P TU , 1 + P TU , 2
The two battery SOC values, S O C 1 and S O C 2 , and the corresponding average SOC for the unit S O C TU , are also shown.
For the provision of PCR, the average SOC of the TU S O C TU is aimed to be held around the goal value S O C Goal of approximately 50% with approximately 10% allowed variation resulting in the minimum/maximum SOC limits S O C min and S O C max . The intraday power P TU , Intraday for the TU is accordingly controlled to maintain the average SOC of the TU. The total unit power P TU ( P TU > 0 : Charge, P TU < 0 : Discharge) is therefore defined as the sum of the required power for PCR, P TU , PCR , and the Intraday power P TU , Intraday :
P TU = P TU , PCR + P TU , Intraday
Both individual power string SOC values are additionally required to be maintained within the range of S O C min to S O C max . The distribution of the unit power P TU to the power of both strings P TU , 1 and P TU , 2 therefore has to fulfill the SOC management as well as the reduction of the no-load/low-load losses in the PE through a distribution of the unit power to a single string when possible. Equation (3) defines the SOC difference within a TU Δ S O C TU .
Δ S O C TU = S O C 2 S O C 1
The conditions and PFDS settings shown in Table 3 define the operation when both power strings are active. The SOC imbalance between both power strings is minimized with a droop control based on the SOC difference Δ S O C TU . At a SOC difference of 10%, a value chosen based on practical results, the droop control is fully activated.
The set-point values can be overridden when the set-point value for a power string would exceed its current maximum power. This can be the case, e.g., when both power strings are required for the provision of the power, such as at a TU power of 75% at the same time as an absolute SOC deviation Δ S O C TU higher than 10%. The power is then provided by the power strings as much as technically possible. The power, which then cannot be provided by a power string, is distributed to the other power string—overriding the set-point value here.
The conditions and PFDS settings shown in Table 4 define the operation for operating points that can theoretically be provided with a single power string: | P TU | P TU , String , max .
The standard operation is Mode 1 when both power string SOC levels are within the limits. Every full six hours of in-operation time of a power string, the operation is switched to the other power string to balance operation time equally. In Modes 2–3, one power string is at or below the lower SOC limit and thus deactivated for discharge operation. Similarly, in Modes 4–5, a power string is at or above the upper SOC limit and consequently deactivated for charge operation. For Modes 6–7, both power strings are activated as the SOC is violating the same lower or upper SOC limit. The operation of the two strings consequently follows the distribution according to Table 3. Finally, Modes 8–9 are specified for the unlikely case that a power string violates the upper limit at the same time when the other power string violates the lower limit. In the case one of the Modes 2–9 is activated, Mode 1 is only reactivated when the value of S O C 1 and/or S O C 2 has/have reached S O C Goal again.
It is here noted that the PE in the system have a time-limit for their start-up process, meaning that five minutes have to be passed between two start-up procedures. Thus, if a unit is turned on, it is not deactivated for five minutes to ensure it is still available for turn-on even right after its turn-off.

4.2. Field-Test Results

The proposed optimized PFDS is implemented on TU 4. TU 3 and TU 5, which feature the identical technical setup as TU 4 and operate unmodified on equal PFDS, are used as a reference. The three units are put in operation for the provision of PCR. Values for TU 3 and TU 5 are averaged for relative comparisons to TU 4.
Table 5 shows the results of the evaluated period. Energy efficiency is evaluated for 12 full days, 3–14 August 2017. The in-operation time of the power electronics is evaluated for a slightly increased duration of ≈14 days. The evaluation timeframe varies due to the procedure of data collection in the different components. As the operation of the TU, in general, does not change significantly and the timeframe of the 12 days is included in the 14 days, the data can be compared with the note that the timeframes differ slightly.
TU 4 with the optimized PFDS shows an energy efficiency of 71.72%, which is significantly increased from 62.81% in TU 3, respectively 63.22% in TU 3. This increase in the energy efficiency by 8.71 percentage points shows the success in the reduction of losses in the TU. The averaged in-operation time of the PE units in each TU, which is the optimization approach for the optimized PFDS, is reduced from 100% for TU 3 and TU 5 to 62.52% for TU 4.
The analysis of the charge/discharge energy throughput is shown in Figure 9 for TU 3–5 for the period 3–14 August 2017. The overall discharged energy is identical across all units. However, the charged energy shows a reduction from 5.50/5.51 MWh (TU 3/TU 5) to 4.88 MWh, concluding that the increased energy efficiency is a consequence of a reduced energy input. The reduction of the total energy throughput from 8.95/8.98 MWh (TU 3/TU 5) by 6.72% to 8.36 MWh (TU 4) consequently also leads to a reduced charge throughput for the battery pack in TU 4, resulting in fewer battery cycles.
The optimized PFDS also influences the intraday trading. Figure 10 shows the intraday charge/discharge energy as well as their sum for TU 3–5 for the period 3–14 August 2017.
The energy charged through intraday trading is reduced in TU 4 from 2.73/2.72 MWh (TU 3/TU 5) by 25.03% to 2.04 MWh (TU 4). The energy discharged through intraday is slightly less reduced from 1.25/1.30 MWh (TU 3/TU 5) by 14.56% to 1.09 MWh. The sum of intraday energy is consequently significantly reduced from 1.48/1.42 MWh by 34.19% to 0.95 MWh. This large reduction for the sum of intraday energy exchange indicates a strong reduction of the energy lost during operation.
To put the improvement of the optimized PFDS into an economic context through a rough estimate: Scaling the reduction of the sum of intraday energy for the single TU to a full year gives the potential for electricity savings in a single TU of approximately 15.21 MWh per year and 304.17 MWh over an assumed operation time of 20 years. As no aging model is available, the battery lifetime cannot be accurately predicted. Scaling the energy throughput of the TU to 20 years of operation results in the relatively high number of approximately 5250 equivalent cycles. It is noted that the lifetime of 20 years, therefore, is not guaranteed and requires further evaluation.
Using an energy price of 29.13 €/MWh (Intraday 15-min call auction base period average price in Germany in 2016 [28]), these savings of bought energy equate to a cost reduction over the full operation time of 8860 €.
The saving can be put into comparison with the investment costs of a battery system. Based on the nominal energy of ≈600 kWh of the TU and literature-based specific system costs of 340 €/kWh (398 $/kWh for Tesla Powerpack 2 in 2016 [29]), the system costs can be approximated to ≈200,000 €. The cost reduction through the optimized PFDS of 8860 € over the assumed operation time of 20 years, therefore, equates to ≈4.43% of the battery system investment cost. If the operation time is less, the improvement is reduced linearly, i.e., for 10 years of operation time accordingly to 2.21%.
Figure 11 continues the technical analysis through an evaluation of the reduction of energy losses through the optimized PFDS.
The relative reduction of the energy losses by 23.54% equates to a reduction of 8.71 percentage points, which can also be expressed as an increased round-trip energy efficiency by 8.71 percentage points.
The temporal distribution of the SOC control modes of the optimized PFDS (see Table 4) in TU 4 is shown in Table 6.
The analysis reveals that mostly Mode 1, in which both power string SOC levels are in the desired range, is in operation, i.e., 68.93% of the time. Modes 2–3, in which one of the power string is at the lower SOC limit, are in total active for 20.78% of the time. In comparison, Modes 4–5, in which a power string is at the upper limit, are in total active for only 7.26%. This is expected, as the TU tend to lower SOC values due to the conversion losses. Modes 6–7, in which both power strings are in conflict with the same SOC limit, are rarely active, only 3.02% of the time. Modes 8–9 are not in operation, as their activation is expected only for erroneous operation or start-up of the system.
Finally, the evaluation of the measured SOC in the TU in the field-test, given as the average value between the two power strings in each TU, is shown in Table 7 for TU 3–5. The minimum, time-average and maximum SOC in the evaluated timeframe are given.
The values for the min/time-average/max. SOC levels are similar for all TU, operating on either equal PFDS or optimized PFDS. The TU operate in general between 40% and 60% with a time-average SOC of 50%. This confirms the stable operation for both PFDS in accordance with the desired SOC limits.

5. Conclusions

A utility-scale second-life system providing PCR is analyzed and optimized regarding its energy efficiency. First, a detailed system analysis is conducted, revealing the overall system energy efficiency at 56%. The majority of losses occur in the TU, which consist of the PE and the battery: The energy efficiencies of the five TUs providing PCR are between 73% and 77%. Simulation of the system reveals, that the main loss mechanism of the TU as well as of the overall system is identified as the no-load losses of the PE. The no-load losses have significant importance as dynamic losses of the PE and those of the battery are small for the application PCR, which features a low average load. The PE are however in constant operation, leading to the high amount of energy losses.
A temporal distribution analysis of the load profile shows that the PCR load is for 99.95% of the time, and thus almost entirely, under 50% of the nominal power of the TU. As some TU in the system consist of two identical power strings, an optimized PFDS for the power flow of the TU onto the two power strings is proposed. The goal is to reduce the no-load and partial-load losses by providing PCR with a single power string when possible. This consequently reduces the no-load losses of the second power string. The optimized PFDS thus controls the power flow for each power string independently. As this requires a dedicated management of the battery SOC in each power string, a new battery SOC management strategy is also developed.
The optimized PFDS is implemented in a TU of the system and put into operation for PCR. The comparison of the analysis based on measured data shows that the energy efficiency is improved by 9 percentage points, which equates to a reduction of the energy losses by 24%. The reduction also leads to a reduced energy balance for the intraday trading by 34%. The overall energy throughput of the TU is reduced by 7%. The optimized PFDS also successfully manages the battery SOC of the individual batteries.
In summary, the proposed optimized PFDS can improve energy efficiency in battery systems consisting of multiple units. A rough approximation of the economic value of the optimized PFDS in terms of the reduction of intraday energy trading balance shows that the improvement equates to 4.4% of the battery system investment costs.

6. Outlook

For an accurate evaluation of the PFDS, a full year of operation data can be collected.
The optimized PFDS so far only includes optimization through rule-based reduction of the operation time of a second power string. Future optimized PFDS can include dynamic PE losses, as well as battery losses, to optimize system operation for an overall optimal operating point. As the distribution of the power to a single power string leads to higher currents in the battery, a battery-degradation model can be used to predict the impact on the battery lifetime. Combining the energy losses calculation with a battery-degradation model can provide a holistically optimized PFDS.
The here proposed PFDS controls the power flow in a single TU between two identical power strings. The PFDS can be developed to operate for non-identical power strings in a TU, as well as to optimize PFDS between several TUs and between several complete storage systems. Future simulations could reveal the technical potential of such topologies in detail. However, regulations for the fail-safe provision of PCR have to be considered, which may require n-1 redundancy that could contradict a single large aggregated unit.

Acknowledgments

This work was supported by the German Research Foundation (DFG) and the Technical University of Munich (TUM) in the framework of the Open Access Publishing Program. The research project IHEM is funded by the Federal Ministry for Economic Affairs and Energy within the “Funding initiative Electrical Storages” (grant number 03ET1205G) and managed by Project Management Jülich. The responsibility for the content of this publication lies with the author.

Author Contributions

Michael Schimpe developed the battery system model for energy efficiency evaluations, initiated as well as coordinated the study, and wrote the paper draft. Christian Piesch adapted the system model, parameterized and evaluated the data from simulation and the field test, and developed the optimized distribution strategy. Julian Paß provided model parameters and field-test data, and coordinated the implementation of the new control strategies in the system. Holger C. Hesse, Stefan Ritter and Andreas Jossen provided overall guidance for the study and contributed to many fruitful discussions on the methodology. All authors have read and approved the final manuscript. Julian Paß and Stefan Ritter are employees of the company The Mobility House, which operates the analyzed system commercially.

Conflicts of Interest

The authors declare no further conflict of interest.

References

  1. Hesse, H.; Schimpe, M.; Kucevic, D.; Jossen, A. Lithium-Ion Battery Storage for the Grid—A Review of Stationary Battery Storage System Design Tailored for Applications in Modern Power Grids. Energies 2017, 10, 2107. [Google Scholar] [CrossRef]
  2. Aneke, M.; Wang, M. Energy storage technologies and real life applications—A state of the art review. Appl. Energy 2016, 179, 350–377. [Google Scholar] [CrossRef]
  3. Munsell, M. In Shift to Longer-Duration Applications, US Energy Storage Installations Grow 100% in 2016. Greentech Media [Online], 7 March 2017. Available online: https://www.greentechmedia.com/articles/read/in-shift-to-longer-duration-applications-us-energy-storage-installations-gr (accessed on 2 November 2017).
  4. Cho, S.-M.; Yun, S.-Y. Optimal Power Assignment of Energy Storage Systems to Improve the Energy Storage Efficiency for Frequency Regulation. Energies 2017, 10, 2092. [Google Scholar] [CrossRef]
  5. Brand, M.J.; Hofmann, M.H.; Steinhardt, M.; Schuster, S.F.; Jossen, A. Current distribution within parallel-connected battery cells. J. Power Sources 2016, 334, 202–212. [Google Scholar] [CrossRef]
  6. Klein, M.P.; Park, J.W. Current Distribution Measurements in Parallel-Connected Lithium-Ion Cylindrical Cells under Non-Uniform Temperature Conditions. J. Electrochem. Soc. 2017, 164, A1893–A1906. [Google Scholar] [CrossRef]
  7. Schimpe, M.; Naumann, M.; Truong, N.; Hesse, H.C.; Santhanagopalan, S.; Saxon, A.; Jossen, A. Energy efficiency evaluation of a stationary lithium-ion battery container storage system via electro-thermal modeling and detailed component analysis. Appl. Energy 2018, 210, 211–229. [Google Scholar] [CrossRef]
  8. The Mobility House GmbH. World’s Largest 2nd-Use Battery Storage Is Starting Up. Available online: http://www.mobilityhouse.com/en/worlds-largest-2nd-use-battery-storage-is-starting-up/ (accessed on 2 November 2017).
  9. Choi, J.; Choi, I.; An, G.; Won, D.J. Advanced Power Sharing Method for Energy Efficiency Improvement of Multiple Battery Energy Storages System. IEEE Trans. Smart Grid 2016, 1, 1292–1300. [Google Scholar] [CrossRef]
  10. Lee, S.-J.; Choi, J.-Y.; Won, D.-J.; Choi, I.-S.; An, G.-H.; Choi, Y.-J. Frequency control of energy storage system based on hierarchical cluster structure. In Proceedings of the 2015 IEEE Eindhoven PowerTech, Eindhoven, The Netherlands, 29 June–2 July 2015; IEEE: Eindhoven, The Netherlands, 2015; pp. 1–5. [Google Scholar]
  11. Truong, C.N.; Naumann, M.; Karl, R.C.; Müller, M.; Jossen, A.; Hesse, H.C. Economics of Residential Photovoltaic Battery Systems in Germany: The Case of Teslas Powerwall. Batteries 2016, 2, 14. [Google Scholar] [CrossRef]
  12. Naumann, M.; Karl, R.C.; Truong, C.N.; Jossen, A.; Hesse, H.C. Lithium-ion Battery Cost Analysis in PV-household Application. Energy Procedia 2015, 73, 37–47. [Google Scholar] [CrossRef]
  13. Neubauer, J.; Pesaran, A. The ability of battery second use strategies to impact plug-in electric vehicle prices and serve utility energy storage applications. J. Power Sources 2011, 196, 10351–10358. [Google Scholar] [CrossRef]
  14. Neubauer, J.S.; Pesaran, A.; Williams, B.; Ferry, M.; Eyer, J. A Techno-Economic Analysis of PEV Battery Second Use: Repurposed-Battery Selling Price and Commercial and Industrial End-User Value. In Proceedings of the 2012 SAE World Congress & Exhibition, Detroit, MI, USA, 24–26 April 2012; SAE International400 Commonwealth Drive: Warrendale, PA, USA, 2012. [Google Scholar]
  15. Neubauer, J.S.; Wood, E.; Pesaran, A. A Second Life for Electric Vehicle Batteries: Answering Questions on Battery Degradation and Value. SAE Int. J. Mater. Manf. 2015, 8, 544–553. [Google Scholar] [CrossRef]
  16. Heymans, C.; Walker, S.B.; Young, S.B.; Fowler, M. Economic analysis of second use electric vehicle batteries for residential energy storage and load-levelling. Energy Policy 2014, 71, 22–30. [Google Scholar] [CrossRef]
  17. Gladwin, D.T.; Gould, C.R.; Stone, D.A.; Foster, M.P. Viability of “second-life” use of electric and hybridelectric vehicle battery packs. In Proceedings of the IECON 2013-39th Annual Conference of the IEEE Industrial Electronics Society, Vienna, Austria, 10–13 November 2013; IEEE: Vienna, Austria, 2013; pp. 1922–1927. [Google Scholar]
  18. Viswanathan, V.V.; Kintner-Meyer, M. Second Use of Transportation Batteries: Maximizing the Value of Batteries for Transportation and Grid Services. IEEE Trans. Veh. Technol. 2011, 60, 2963–2970. [Google Scholar] [CrossRef]
  19. The Mobility House GmbH. Unpublished Company-Internal Measurement Data/Model Parameters. Not available for publishing. 2017. [Google Scholar]
  20. European Network of Transmission System Operators for Electricity (ENTSOE). Operation Handbook. Policy 1: Load-Frequency Control and Performance. 2009. Available online: https://www.entsoe.eu/publications/system-operations-reports/operation-handbook/Pages/default.aspx (accessed on 2 November 2017).
  21. German Transmission System Operators. REGELLEISTUNG.NET Internet Platform for the Allocation of Control Reserve. Available online: https://www.regelleistung.net/ext/?lang=en (accessed on 1 December 2017).
  22. German Transmission System Operators. Key Points and Degrees of Freedom for the Provision of Primary Control Reserve. Guidelines for Providers of Primary Control Reserve. (German Title: Eckpunkte und Freiheitsgrade bei Erbringung von Primärregelleistung. Leitfaden für Anbieter von Primärregelleistung). 2014. Available online: https://www.regelleistung.net/ext/download/eckpunktePRL (accessed on 1 December 2017).
  23. Gatta, F.; Geri, A.; Lamedica, R.; Lauria, S.; Maccioni, M.; Palone, F.; Rebolini, M.; Ruvio, A. Application of a LiFePO4 Battery Energy Storage System to Primary Frequency Control: Simulations and Experimental Results. Energies 2016, 9, 887. [Google Scholar] [CrossRef]
  24. Zeh, A.; Müller, M.; Naumann, M.; Hesse, H.; Jossen, A.; Witzmann, R. Fundamentals of Using Battery Energy Storage Systems to Provide Primary Control Reserves in Germany. Batteries 2016, 2, 29. [Google Scholar] [CrossRef]
  25. Thien, T.; Schweer, D.; Vom Stein, D.; Moser, A.; Sauer, D.U. Real-world operating strategy and sensitivity analysis of frequency containment reserve provision with battery energy storage systems in the german market. J. Energy Storage 2017, 13, 143–163. [Google Scholar] [CrossRef]
  26. Swissgrid Ltd. Grid-Transmission System-Grid Levels: Various Grid Levels Transport Electricity. Available online: https://www.swissgrid.ch/swissgrid/en/home/grid/transmission_system/grid_levels.html (accessed on 1 December 2017).
  27. Jossen, A. Fundamentals of battery dynamics. J. Power Sources 2006, 154, 530–538. [Google Scholar] [CrossRef]
  28. European Power Exchange. EPEX SPOT INTRADAY MARKETS REACH ALL-TIME HIGH IN 2016. Available online: https://www.epexspot.com/de/presse/press-archive/details/press/EPEX_SPOT_Intraday_markets_reach_all-time_high_in_2016 (accessed on 2 November 2017).
  29. Lambert, F. Tesla Slashes Price of the Powerpack System by Another 10% with New Generation. Available online: https://electrek.co/2016/11/14/tesla-powerpack-2-price/ (accessed on 2 November 2017).
Figure 1. Power losses in a bidirectional inverter: (a) power losses over relative power; and (b) conversion energy efficiency over relative power. Data from [7].
Energies 11 00533 g001
Figure 2. Storage system overview with grid connection and auxiliary components.
Energies 11 00533 g002
Figure 3. Overview of all Technical Units.
Energies 11 00533 g003
Figure 4. Overall system energy loss analysis based on model data for March 2017 for all units in operation for Primary Control Reserve/Intraday trading/Back-Up power.
Energies 11 00533 g004
Figure 5. Technical Unit energy loss analysis based on model data for March 2017.
Energies 11 00533 g005
Figure 6. Time series analysis for load profile and power loss for a single Technical Unit (TU 6) during an arbitrary six-hour timeframe: (a) measured AC-power ( P > 0 : Charge, P < 0 : Discharge); and (b) simulated power losses in power electronics and battery.
Energies 11 00533 g006
Figure 7. Temporal distribution of the relative power of a single Technical Unit (TU 5) in March 2017.
Energies 11 00533 g007
Figure 8. Schematic overview of a Technical Unit consisting of two power strings.
Energies 11 00533 g008
Figure 9. Field-test results for energy throughput (AC-measurement, charge/discharge) of Technical Units (TUs) 3–5 for 3–14 August 2017. TU 3 and TU 5 operate on equal Power Flow Distribution Strategy (PFDS); TU 4 operates on optimized PFDS.
Energies 11 00533 g009
Figure 10. Field-test results for intraday energy charge/discharge/sum of TUs 3–5 for 3–14 August 2017. TU 3 and TU 5 operate on equal Power Flow Distribution Strategy (PFDS); TU 4 operates on optimized PFDS.
Energies 11 00533 g010
Figure 11. Field-test results for energy losses in TUs 3–5 for 3–14 August 2017. TU 3 and TU 5 operate on equal Power Flow Distribution Strategy (PFDS); TU 4 operates on optimized PFDS.
Energies 11 00533 g011
Table 1. Component model overview.
Component GroupComponentTypeParameter Overview (All: Data from [19])
Technical UnitBatteryEquivalent
Circuit Model
U Cell , OCV ( S O C , T = 25   ° C ) ,
R Cell ( S O C , sgn ( I ) , T = 25   ° C )
Power ElectronicsLoss-Curve Look-Up Data P PE , Loss ( sgn ( P PE ) , P PE )
Grid ConnectionTransformerLoss-Curve Look-Up Data P TF , Loss ( P TF , Sec )
Auxiliary ComponentsBattery Thermal Management System (B-TMS)Measured Data over Time (No Model) P Aux , B - TMS ( t )
System Thermal Management System (S-TMS) P Aux , S - TMS ( t )
Control & Monitoring incl. Uninterruptible Power Supply (C&M) P Aux , C & M ( t )
Other P Aux , Other ( t )
System ControlLoad ProfileMeasured Data over Time (Model Input) P TU , AC ( t )
Initial/End State of Charge S O C TU ( t )
Table 2. Charged/discharged energy and simulated/measured round-trip energy efficiency for Technical Units 1–6 for March 2017.
TUApplicationCharged Energy in MWhDischarged Energy in MWhSimulation Efficiency η TU , S i m Measured Efficiency η T U , M e a s Simulation Deviation η T U , S i m η T U , M e a s
TU 1Back-Up + ID7.755.0464.79%64.95% 0.16 %
TU 2PCR + ID18.7914.3876.01%76.65% 0.64 %
TU 3PCR + ID19.0113.8871.11%73.14% 2.03 %
TU 4PCR + ID19.3414.0871.36%72.88% 1.52 %
TU 5PCR + ID19.3814.1971.52%73.34% 1.82 %
TU 6PCR + ID9.697.1871.74%74.11% 2.37 %
All TUvarious93.9668.7671.77%73.25% 1.48 %
Table 3. State of Charge droop control for operation with both power strings active.
PowerCondition Δ S O C T U Set-Point for P T U , 1 / P T U Set-Point for P T U , 2 / P T U
P TU 0 Δ S O C TU 10 % 0 % 100 %
10 % < Δ S O C TU + 10 % 50 % + 1 / 20 % × Δ S O C TU 50 % 1 / 20 % × Δ S O C TU
Δ S O C TU + 10 % 100 % 0 %
P TU < 0 Δ S O C TU 10 % 100 % 0 %
10 % < Δ S O C TU + 10 % 50 % 1 / 20 % × Δ S O C TU 50 % + 1 / 20 % × Δ S O C TU
Δ S O C TU + 10 % 0 % 100 %
Table 4. Operation modes for optimized Power Flow Distribution Strategy for operating points theoretically requiring only a single power string ( | P TU | P TU , String , max ).
ModeCondition S O C 1 Condition S O C 2 Charge P T U 0 Discharge P T U < 0
P T U , 1 / P T U P T U , 2 / P T U P T U , 1 / P T U P T U , 2 / P T U
Mode 1 S O C min < S O C 1 < S O C max S O C min < S O C 2 < S O C max 100 % 0 % 100 % 0 %
switching every 6 h of in-operation time to
0 % 100 % 0 % 100 %
Mode 2 S O C 1 S O C min S O C min < S O C 2 < S O C max 100 % 0 % 0 % 100 %
Mode 3 S O C min < S O C 1 < S O C max S O C 2 S O C min 0 % 100 % 0 % 100 %
Mode 4 S O C 1 S O C max S O C min < S O C 2 < S O C max 0 % 100 % 0 % 100 %
Mode 5 S O C min < S O C 1 < S O C max S O C 2 S O C max 100 % 0 % 0 % 100 %
Mode 6 S O C 1 S O C min S O C 2 S O C min Both power strings active, see Table 3
Mode 7 S O C 1 S O C max S O C 2 S O C max Both power strings active, see Table 3
Mode 8 S O C 1 S O C min S O C 2 S O C max 100 % 0 % 0 % 100 %
Mode 9 S O C 1 S O C max S O C 2 S O C min 0 % 100 % 100 % 0 %
Table 5. Field-test results for Technical Unit (TU) energy efficiency and in-operation time of Power Electronics (PE) with equal Power Flow Distribution Strategy (PFDS) (TU 3, TU 5) and optimized PFDS (TU 4). Data for energy efficiency are for 3–14 August 2017. Data for PE in-operation time are for the extended testing timeframe of 14 days in August 2017.
ParameterTU 3TU 4TU 5
Power Flow Distribution StrategyEqualOptimizedEqual
Measured TU Energy Efficiency62.81%71.72%63.22%
Measured PE In-Operation Time100.00%62.52%100.00%
Table 6. Field-test results for the State of Charge control mode in optimized Power Flow Distribution Strategy (Technical Unit 4) from the extended testing timeframe of 14 days in August 2017.
Mode123456789
Temporal Share68.93%10.00%10.79%3.26%4.00%2.99%0.03%0.00%0.00%
Table 7. Field-test results for the State of Charge (SOC) in the Technical Unit (TU) with equal Power Flow Distribution Strategy (PFDS) (TU 3 and TU 5) and optimized PFDS (TU 4) for the extended testing timeframe of 14 days in August 2017.
ParameterTU 3TU 4TU 5
Power Flow Distribution StrategyEqualOptimizedEqual
Minimum SOC of TU40.09%39.56%39.73%
Time-Average SOC of TU49.34%50.39%49.52%
Maximum SOC of TU60.62%60.99%60.41%

