Sucrose Is a Promising Feedstock for the Synthesis of the Platform Chemical Hydroxymethylfurfural


1
Institute for Catalysis Research and Technology, Karlsruhe Institute of Technology (KIT), Hermann-von-Helmholtz-Platz 1, 76344 Eggenstein-Leopoldshafen, Germany
2
Institute of Agricultural Engineering, University of Hohenheim, Garbenstrasse 9, 70599 Stuttgart, Germany
*
Author to whom correspondence should be addressed.
Energies 2018, 11(3), 645; https://doi.org/10.3390/en11030645
Submission received: 16 February 2018
/
Revised: 9 March 2018
/
Accepted: 12 March 2018
/
Published: 14 March 2018
(This article belongs to the Special Issue BioEnergy and BioChemicals Production from Biomass and Residual Resources)
Abstract
:Hydroxymethylfurfural (HMF) has an outstanding position among bio-based platform chemicals, because high-value polymer precursors and fuel additives can be derived from HMF. Unfortunately, the large-scale industrial production of HMF is not yet realized. An open research question is the choice of hexose feedstock material. In this study, we used the highly available disaccharide sucrose for HMF synthesis. The conversion of sucrose was catalyzed by sulfuric acid in water media. Experiments were conducted at temperatures of 180, 200, and 220 °C with reaction times of 2–24 min. A carbon balance showed that the yield of unwanted side products rose strongly with temperature. We also developed a kinetic model for the conversion of sucrose, involving nine first-order reactions, to uncover the kinetics of the main reaction pathways. Within this model, HMF is produced exclusively via the dehydration of fructose. Glucose isomerizes slowly to fructose. Side products arise simultaneously from glucose, fructose, and HMF. A pathway from hexoses to xylose via reverse aldol reaction was also included in the model. We believe that sucrose is the ideal feedstock for large-scale production of HMF because it is more abundant than fructose, and easier to process than sugars obtained from lignocellulosic biomass.
Keywords:
kinetics; glucose; fructose; sugar dehydration; HMF; hydrothermal; hydrolysis; acid-catalysed
1. Introduction
The production of platform chemicals from renewable biomass is experiencing enormous interest as a result of (1) the latest developments in research, and (2) government funding for sustainable production processes and CO2 reductions [1,2]. The platform chemical hydroxymethylfurfural (HMF) has an outstanding position among bio-based platform chemicals because it has two different functional groups, and therefore offers a wide range of applications [3]. It is able to be a substitute for fossil-based products in various new materials and products, such as biopolymers, resins, coatings, paints, varnishes, and fuel additives [4]. For example, HMF can be oxidized to furandicarboxylic acid (FDCA), which can be a substitute for fossil-based terephthalic acid in the production of polyesters. HMF has been named as one of the top ten value-added bio-based chemicals by the U.S. Department of Energy [5]. It can be produced exclusively by thermochemical conversion routes, and is highly carbon-efficient during its synthesis [6]. In principle, HMF is available from all hexoses and their polymers.
The dehydration of hexoses to form HMF has been performed in different solvent systems, which can be categorized as aqueous, organic, or biphasic. In addition, a great variety of acid catalysts have been investigated [7,8], which can be distinguished into homogeneous and heterogeneous catalysts. A well-known and established synthetic strategy for HMF is the homogeneous catalyzed dehydration of hexoses in aqueous solutions. Sulfuric acid is a homogeneous catalyst which is comparatively cheap, and thus an expensive acid-recycling step is unnecessary. The capital cost of processes based on diluted sulfuric acid as a catalyst is, therefore, relatively low [9]. The advantages of HMF synthesis in aqueous media are as follows: (1) water is a cheap and environmentally friendly solvent; (2) the process is simple and easy to scale up; (3) water dissolves polar sugars and HMF in high concentrations; and (4) the water elimination of fructose to form HMF is supported by the high level of the ionic product in hot compressed water and the higher thermodynamic stability of double bonds in these conditions [10,11]. Unfortunately, HMF rehydrates in a water-based medium under acidic conditions to form the consecutive products levulinic acid and formic acid. Furthermore, the self-condensation of HMF and condensation with other compounds lead to the formation of high-molecular-weight polymeric substances (humins) [6]. The maximum yields of HMF in water are reported to be around 50–60 mol% when fructose is used as the feedstock [3].
Unfortunately, the large-scale industrial production of HMF has not yet been realized, due to unfavorable reaction kinetics and the lack of progress in process development [6]. Feedstock costs are a key parameter in improving the economics of future processes. Ketoses (e.g., fructose) are much more efficiently dehydrated to form HMF than aldoses (e.g., glucose) [12]. Therefore, fructose is the ideal feedstock from a reaction-engineering point of view. However, fructose feedstock costs are higher as compared with glucose. Generally, when glucose is the feedstock, significantly lower HMF yields have been obtained.
Lignocellulosic biomass is another feedstock containing hexoses. Cellulose consists of glucose building blocks, and hemicelluloses can also contain glucose [13]. A previous isomerization of glucose to fructose is a strategy to overcome low yields from the direct conversion of lignocellulose-derived glucose to HMF [6]. By using isomerase enzymes, the fructose yield can reach the thermodynamic equilibrium (about 50 wt % [14]). However, the yields of fructose are consistently lower when using heterogeneous catalysts [15,16]. Thus, a mixture of glucose and fructose is always obtained after isomerization.
A mixture of fructose and glucose is also obtained when sucrose is subjected to hot water. This is because the glycosidic linkage, which connects a glucose and fructose unit, can be easily hydrolyzed. Sucrose is an available and cheap feedstock; about 171 million tons were produced worldwide in 2016–2017 [17]. However, only a few studies deal with the conversion of sucrose to hexoses and HMF in hot water [18,19,20,21,22]. Khajavi et al. [19] and Gao et al. [21] investigated the decomposition of sucrose in hot water without the addition of a catalyst. They determined the kinetics of the sucrose decomposition, but not the kinetics of HMF formation [19,21]. Bower and coworkers [20] converted sucrose catalyzed by sulfuric acid. They investigated the decomposition kinetics of formed fructose and glucose, but not the HMF formation [20]. A recent work by Tan-Soetedjo and coworkers [22] deals with the acid-catalysed conversion of sucrose to levulinic acid. They developed a detailed kinetic model which includes HMF formation as well as the rehydration of HMF to form levulinic acid [22].
In general, the scope of kinetic studies is to understand the reaction mechanism or to identify the optimal reaction conditions for maximum product yields. Many such studies converting either glucose or fructose to HMF have been performed, and have been reviewed intensively by van Putten et al. [3]. The group led by Heeres, for example, used modified Arrhenius equations with (1) power law dependence of acid catalyst concentration, and (2) power law dependence of reaction order. They investigated the kinetics of the acid-catalyzed conversion of fructose to HMF [23], HMF to levulinic acid [24], and glucose to levulinic acid [25]. However, kinetic parameters which are determined experimentally depend to a great extent on the setup and the procedure of the experiments themselves [26]. Attention must be paid to the following issues for the direct comparison of kinetic data obtained by different studies: (1) which reactor system is applied, (2) modifications to the Arrhenius equation, (3) modifications to reaction order, (4) the parameter range of reaction conditions, (5) anion effects of the acid utilized, and (6) which reaction scheme is applied.
- The reactor type can influence the determination of kinetic data. Smith et al. [27], for example, investigated glucose decomposition in a batch and tubular reactor using sulfuric acid. Glucose decomposed 4.4 times faster in the continuous system. The activation energy was much lower (88 kJ/mol) compared with that of the continuous reactor (129 kJ/mol) [27].
- Either a linear or a power law dependence of acid concentration is included in the Arrhenius equation in some models. Depending on the study, the mass percentage of acid [27,28], hydronium concentration at ambient conditions [20], hydronium concentration at reaction conditions [23,25], an activity term [29], or multiple factors [30] may be used in modified Arrhenius equations.
- Kinetic rate constants are normally determined within small ranges for substrate concentration, catalyst concentration, or temperature [25]. An extrapolation to other reaction conditions is problematic.
- Only one reaction is assumed for hexose conversion in some studies. Other studies use networks of more than seven individual reactions [3].
In this work, we converted a 2 wt % sucrose solution in a tubular reactor. Experiments were conducted at temperatures of 180, 200, and 220 °C with reaction times of 2–24 min. Sulfuric acid was used as a catalyst at a concentration of 0.005 mol/L. Furthermore, we compared sucrose, glucose, and fructose concerning their product distribution at 220 °C and 10 min. A detailed kinetic network for the acid-catalyzed conversion of sucrose to HMF was developed. Thereby, the kinetics of main reaction pathways were uncovered.
2. Materials and Methods
2.1. Feedstock
Experiments were performed with a feedstock solution of 2 wt % sucrose in deionized water and 0.005 mol/L sulfuric acid (pH = 2.0). Sucrose, sulfuric acid, and water were mixed together directly before each experiment to minimize degradation reactions of the saccharides. A relatively small concentration of sulfuric acid catalyst was chosen in this study, to minimize the potential demand of a neutralization agent in the wastewater stream. Moreover, under less acidic conditions, unwanted rehydration of HMF to form levulinic acid and formic acid is decreased [31]. For economic reasons, the feedstock concentration should be as high as possible to reduce costs in downstream separation steps. On the other hand, higher hexose feedstock concentrations decrease HMF yield [31], because side reactions forming high-molecular-weight polymeric substances are accelerated at higher concentrations.
Additional experiments were performed with a feedstock containing either glucose or fructose. In this case, a 1.05 wt % glucose or fructose solution was used (corresponding to glucose or fructose in a 2.0 wt % sucrose solution). The sulfuric acid concentration was kept constant at 0.005 mol/L (pH = 2.0).
All feedstock chemicals were purchased (sucrose grade Reag. Ph. Eur. from Merck (Darmstadt, Germany), d(+)-glucose grade normapur from VWR (Radnor, PA, USA), d(−)-fructose ≥ 99% from Sigma Aldrich (St. Louis, MO, USA), 72 wt % sulfuric acid from Alfa Aesar (Haverhill, MA, USA)).
2.2. Acid-Catalyzed Conversion
The conversion of saccharide feedstock was performed in a self-constructed test rig (see Figure 1). This test rig consisted of a 170 mL tubular reactor made of stainless steel 1.4571. The reactor dimensions were 0.30 m in length and 0.0027 m in inner diameter. The reactor was surrounded by a brass block heated by cartridges. The feedstock solution was pumped via a PrepStar SD-1 from Agilent (Santa Clara, CA, USA) into the reactor. The product was cooled to room temperature in a heat exchanger before the system pressure was released with a back pressure valve.
All experiments were performed at 2.5 MPa reactor pressure to prevent the evaporation of water. The reactor pressure has no effect on the decomposition reactions of hexoses in acidic water media [32]. Reaction temperatures (measured at the reactor exit) of 180, 200, and 220 °C were investigated. The hydrodynamic residence time was varied between 2 and 24 min at 180 °C, and between 2 and 18 min at 200 and 220 °C. Product samples were taken after the twofold residence time was passed to ensure steady state conditions. Samples were stored at 4 °C prior to their analysis. The experiments at 220 °C and 10 min residence time were performed in quadruplicate, and in all other cases as single runs.
2.3. Analytics
Characterization of the liquid samples was performed with several HPLC methods. Preliminary filtration with 0.45 µm GHP syringe filters (Pall, New York, NY, USA) was performed to remove high-molecular-weight products.
The furan compounds HMF, furfural, and methylfurfural were separated at 20 °C in a Lichrospher 100 RP-18 column (Merck, Darmstadt, Germany). Therefore, a water–acetonitrile eluent (9:1 v/v) at a flow rate of 1.4 mL/min was used. Furan compounds were quantified by a UV detector at 290 nm. Methylfurfural was only detected in the samples in trace amounts at experimental conditions with higher residence times. Therefore, methylfurfural was not considered further in this article.
The saccharide compounds sucrose, glucose, fructose, and xylose were separated at 35 °C in a Metrosep Carb 2 column (Metrohm, Filderstadt, Germany). An eluent with 0.1 mol/L sodium hydroxide and 0.01 mol/L sodium acetate was used with a flow rate of 0.5 mL/min. Sugars were quantified by an amperometric detector.
Formic acid and levulinic acid were analyzed with an Aminex HPX-87H column (Biorad, Hercules, CA, USA). The column temperature was 25 °C for formic acid separation and 60 °C for levulinic acid. The eluent was 0.004 mol/L sulfuric acid at a flow rate of 0.65 mL/min in both cases. Detection was performed by RI and DAD (210 nm for formic acid, 280 nm for levulinic acid).
2.4. Reaction Model
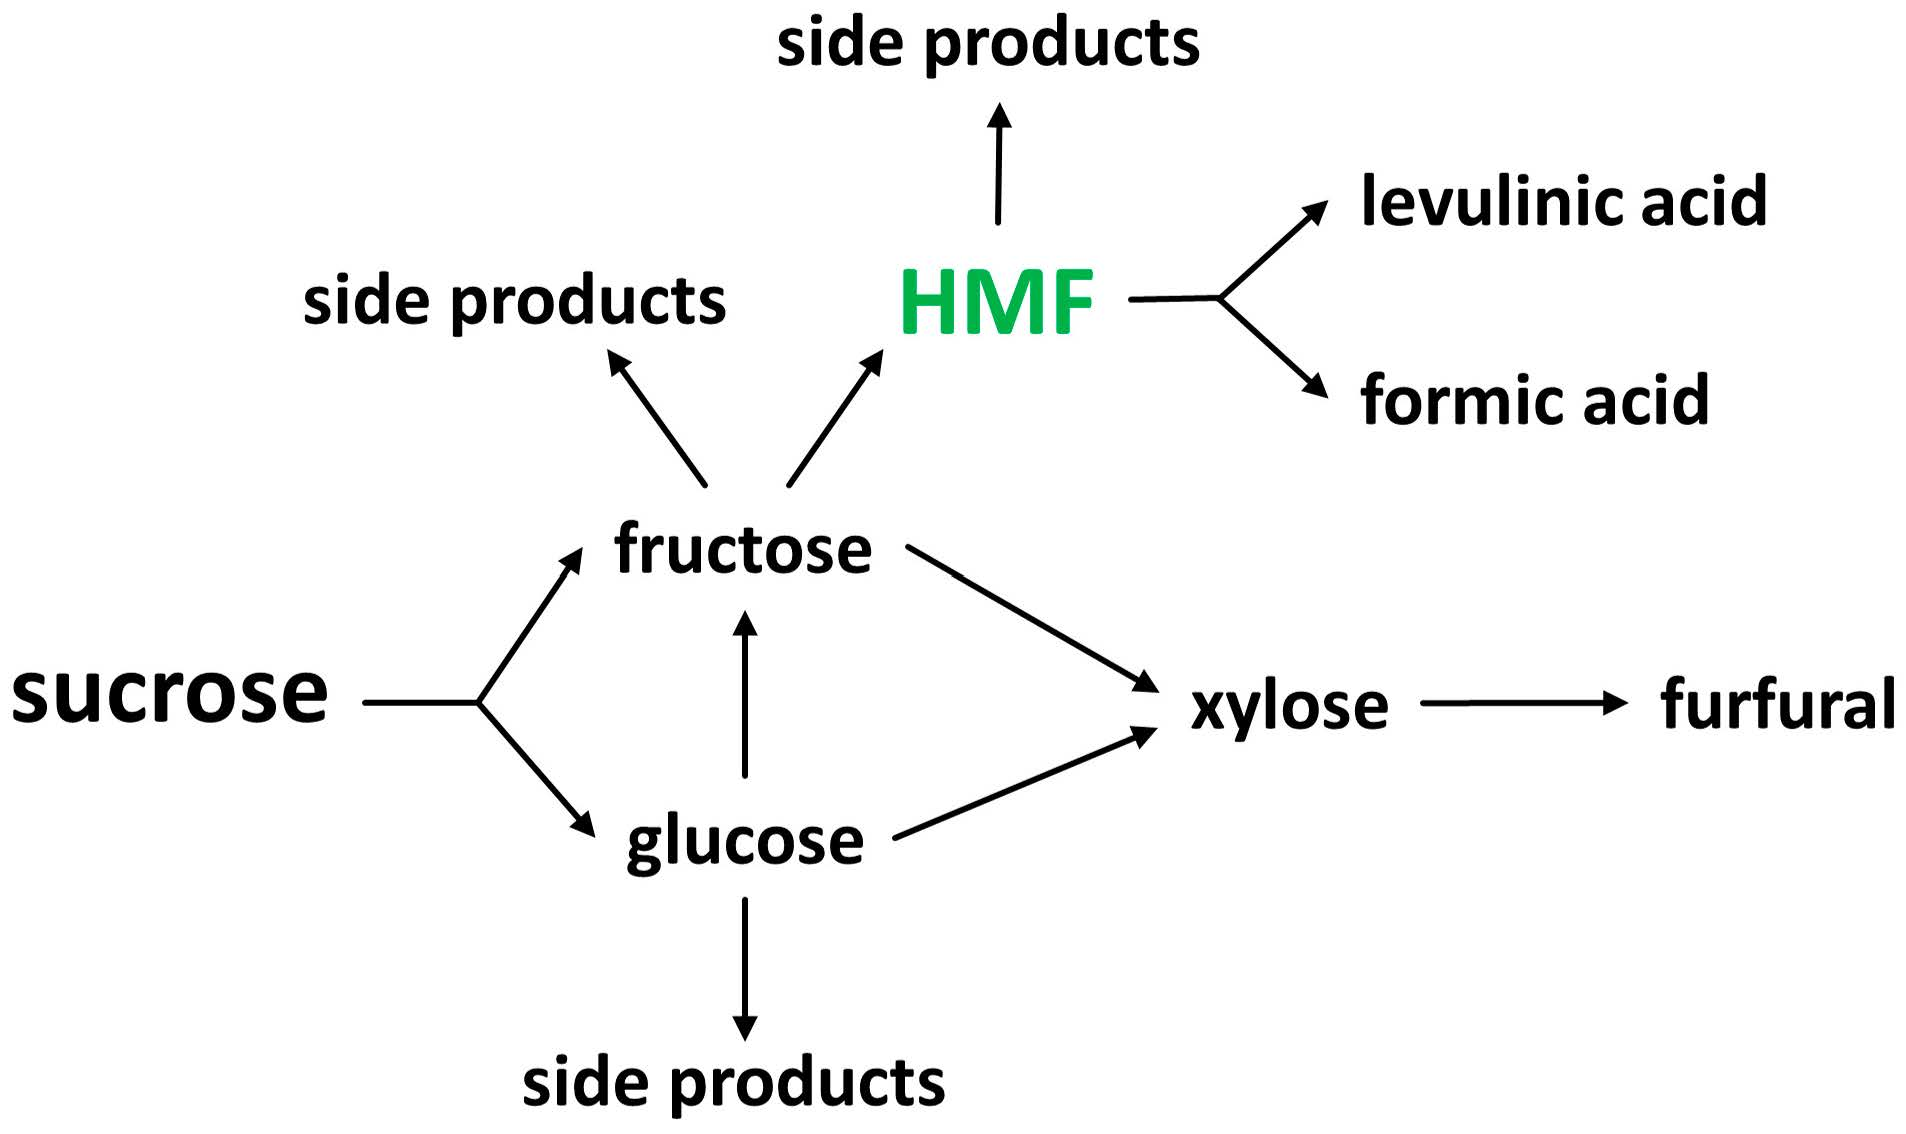
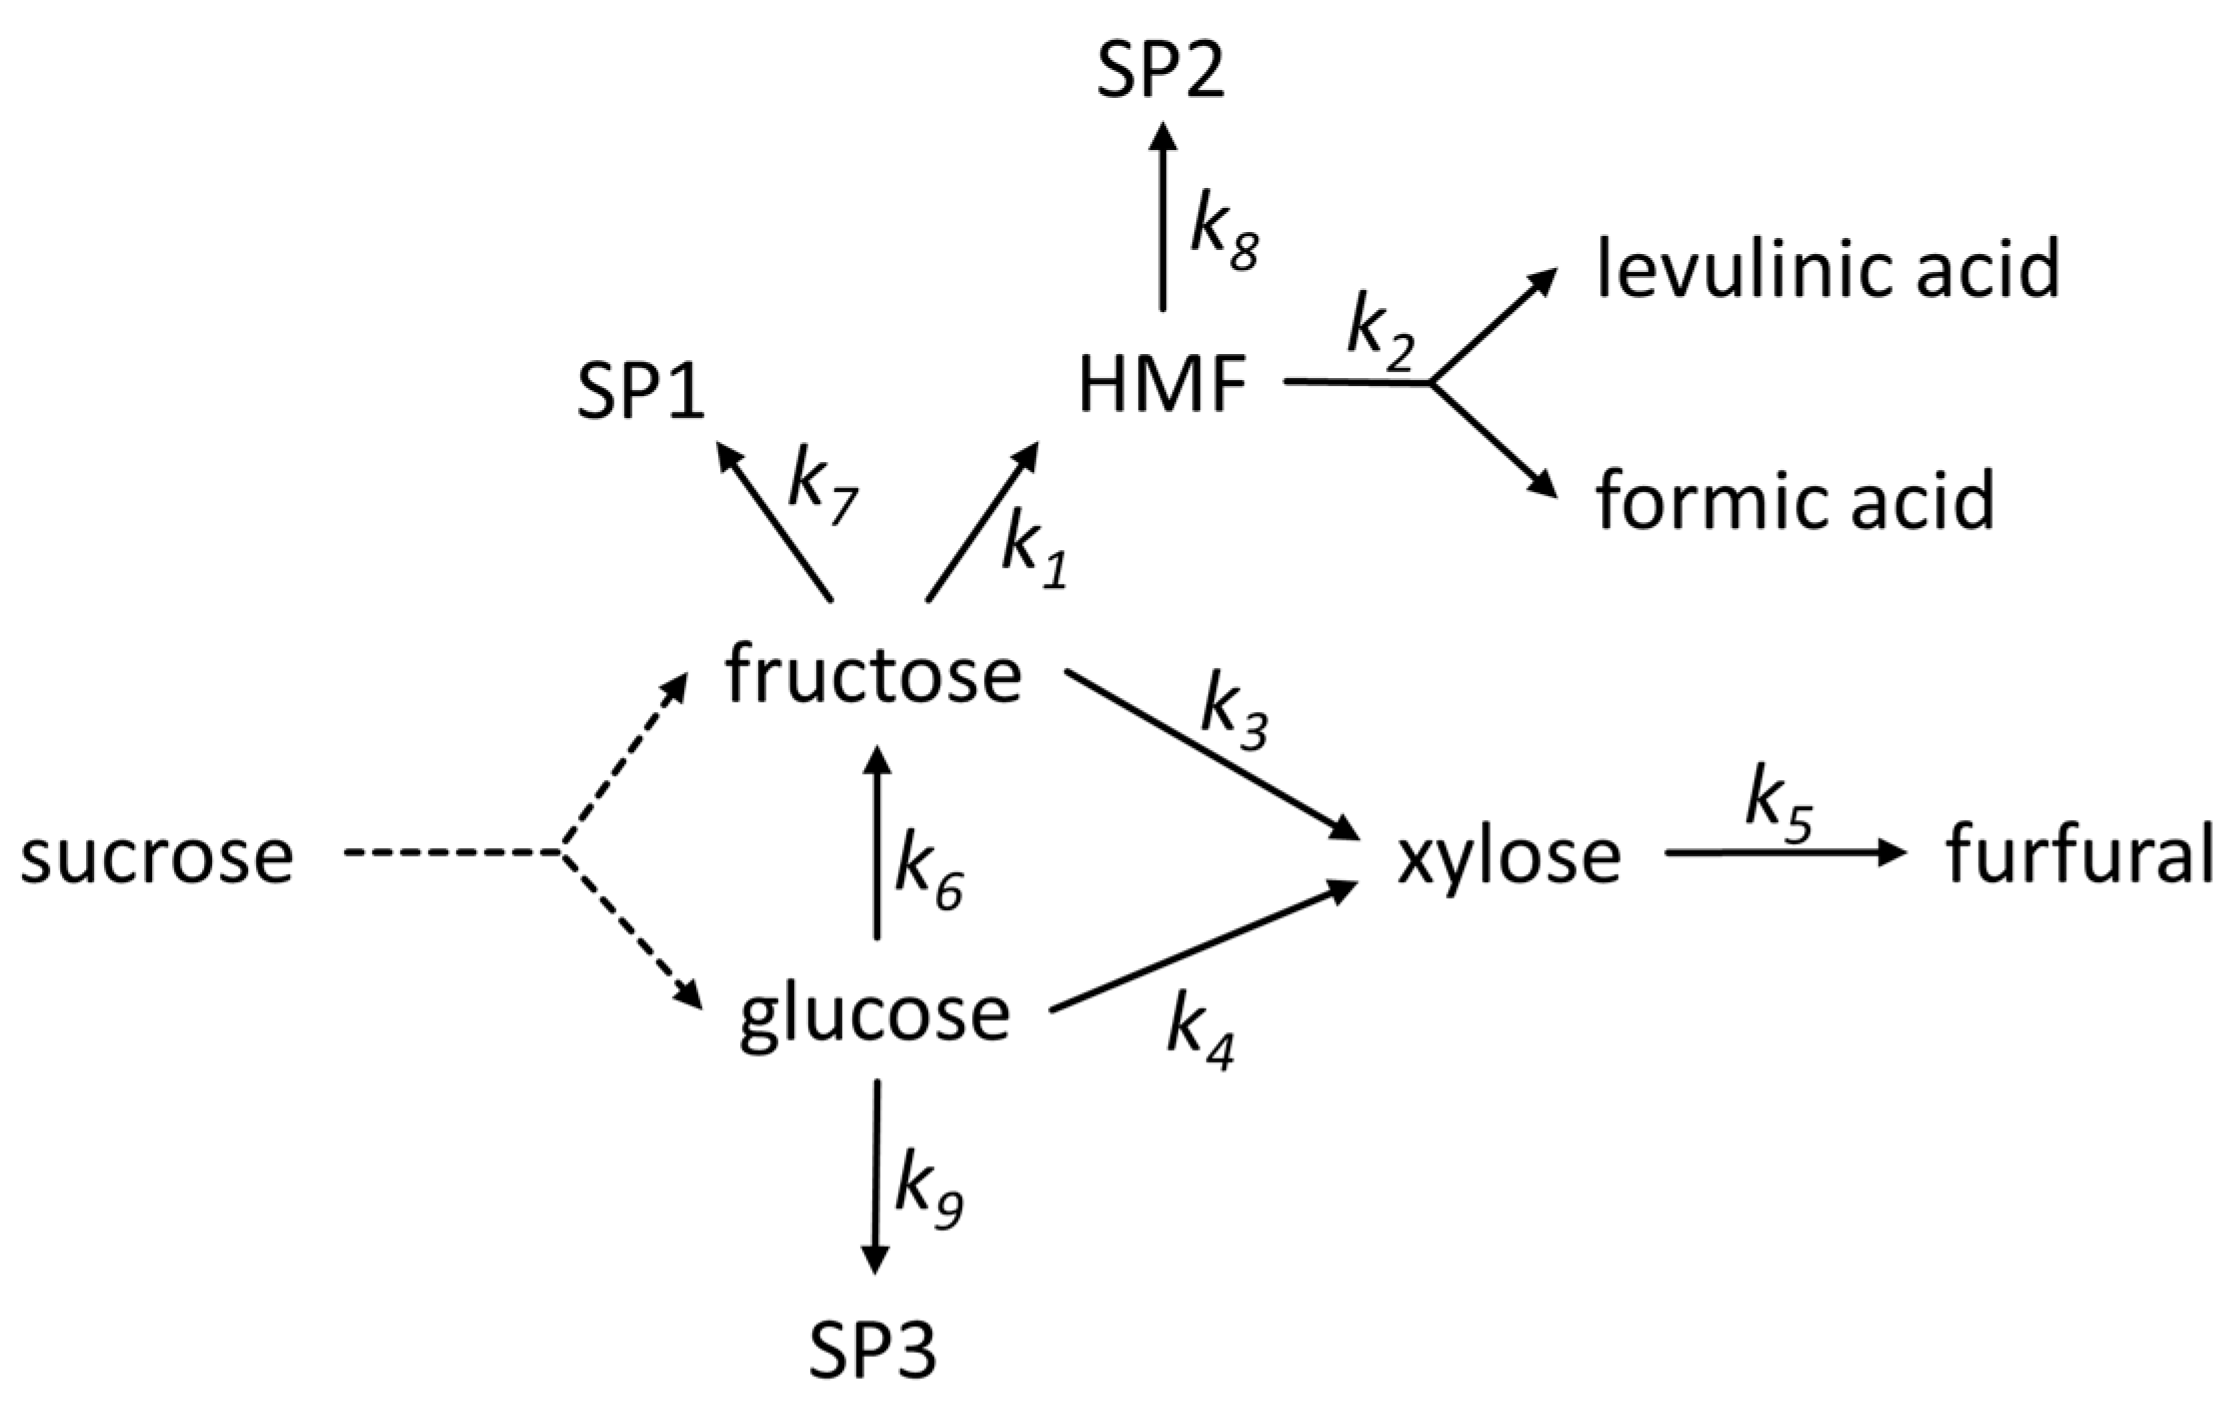
A chemical reaction model only describes the experimental data correctly if all the relevant reaction pathways are contained in the model [33,34]. However, a formal kinetic reaction model does not show insights into the elemental reactions involved. The formal kinetic reaction model we used in this work is shown in Figure 2. A rate coefficient kn was defined for each reaction pathway. The reaction order for all reactions was set to one. Different variations of the model shown in Figure 2 were considered, either including additional or omitting reaction pathways. After evaluating the different modeling results, the reaction model presented in Figure 2 described the data most appropriately.
The hydrolysis reaction of sucrose to equimolar amounts of fructose and glucose was not included in the kinetic model, because sucrose was never detected in the samples in the reaction conditions investigated. Sucrose glycosidic bonds hydrolyze rapidly under acidic conditions at temperatures higher than 160 °C [19,20]. For modelling, it is assumed that sucrose hydrolyzes spontaneously in quantitative yields when entering the reactor.
In our model, glucose is either isomerized to fructose or converted to noncharacterized side products. Even if acids are far less effective catalysts than bases, enolization and isomerization of sugars occurs [30,31,35,36]. We simply implemented the isomerization of glucose to fructose in our model because in other works [37,38,39], the reverse reaction from fructose to glucose was reported negligible. A pathway from glucose to xylose is also included in the model.
Fructose can undergo dehydration to form HMF or react to form other side products. A pathway from fructose to xylose is also included in the model. Antal et al. [18] assumed that pentoses could be formed together with formaldehyde out of fructose by a reverse aldol reaction, but they did not detect xylose in their studies. Xylose dehydrates to furfural in our model. HMF can react to form other side products, or is rehydrated to form equimolar amounts of levulinic acid and formic acid. Asghari and Yoshida [32] reported in a similar study on fructose decomposition that side products (e.g., soluble polymers) were produced not only from fructose, but also from HMF.
2.5. Kinetic Modelling
A molar ratio yi,meas was calculated from all concentrations ci experimentally determined (see Equation (1)).
A set of ordinary differential equations was formulated to describe all rates of change, according to the reaction model (see Equations (2)–(10)).
Experiments were carried out at three different temperatures. The temperature-dependence of the formal kinetic rate coefficients kn is considered by the Arrhenius equation (see Equation (11)). The activation energy EAn and the Arrhenius factor An are the parameters which were adjusted during optimization.
Modelling was conducted in Matlab V 8.4. using the function fminsearch for optimization, which uses the Nelder–Mead simplex search method. The function fminsearch finds a minimum of the scalar function given in Equation (12). The difference between the molar ratio calculated yi using the kinetic model and the molar ratio measured yi,meas was minimized. The optimization included data of the components l of all experiments z. The maximum molar ratio of each component yl,max was used in Equation (12) for data normalization.
3. Results and Discussion
3.1. Maximum Mass Yield of HMF
The HMF yield at reaction temperatures of 200 and 220 °C shows a maximum within the residence time spectra investigated (see Figure 3). At 180 °C, the lowest temperature considered, however, the HMF yields increased continuously with reaction time. The highest yields of HMF recorded, based on input sucrose mass, were 0.25 g/g (at 180 °C, 22 min), 0.25 g/g (at 200 °C, 14 min), and 0.23 g/g (at 220 °C, 10 min). We expect that temperatures above 220 °C would result in a lower HMF maximum at shorter residence times.
Bowler et al. [20] investigated sucrose hydrolysis at similar reaction conditions (160–200 °C and 3–12 min), but used sulfuric acid in higher concentrations (0.01–0.2 mol/L). They reported a lower maximum HMF yield of 0.18 g/g (25% of the theoretical yield [20]). In addition, Tan-Soetedjo et al. [22] obtained a lower maximum HMF yield of 0.17 g/g at 140 °C and 0.05 mol/L sulfuric acid. Thus, higher sulfuric acid concentrations are not favorable in obtaining high HMF yields.
3.2. Carbon Balance of Sucrose Conversion
A carbon balance is an easy means for evaluating the reactions of organic molecules in water. In that regard, a mass balance often provides not significant results, because most of the mass flow is water. Water is also a reaction partner in the reaction network considered, thus a water-free mass balance is inadvisable.
Figure 4 shows the carbon balance of the sucrose conversion at 180, 200, and 220 °C. A carbon balance of over 100% results from measurement errors of the individual components via HPLC. The carbon from sucrose input was mostly transferred during the reaction to glucose, fructose, or HMF for all residence times considered (see Figure 4). Carbon conversion to xylose and furfural was minor, even at the harshest reaction conditions of 220 °C and 18 min. The hydration products of HMF, levulinic acid and formic acid, become more important at higher reaction temperatures. Sucrose was not detected in the samples, and so was completely hydrolyzed even at the lowest residence times. This is in accordance with Bowler et al. [20], who performed sucrose hydrolysis at similar reaction conditions.
The difference between the sum of all carbon detected and 100% can be assigned to nonquantified side products. This could be either small organic molecules from fragmentation reactions of sugars (such as aldehydes, ketones, and organic acids [31]), sugar reversion products [25], or high-molecular-weight condensation products (humins). The carbon percentage of side products increases strongly with reaction temperature and accounts for 14.6% (180 °C), 22.8% (200 °C), and 38.1% (220 °C) of total carbon at a residence time of 18 min, respectively. We recommend reaction conditions with lower side product formation for a technical process. Firstly, all carbon that is transferred to side products is a waste of feedstock, and must be removed cost-intensively from HMF. Secondly, high-molecular-weight condensation products are poorly soluble in water, and can cause the plugging of pipes and apparatuses [6].
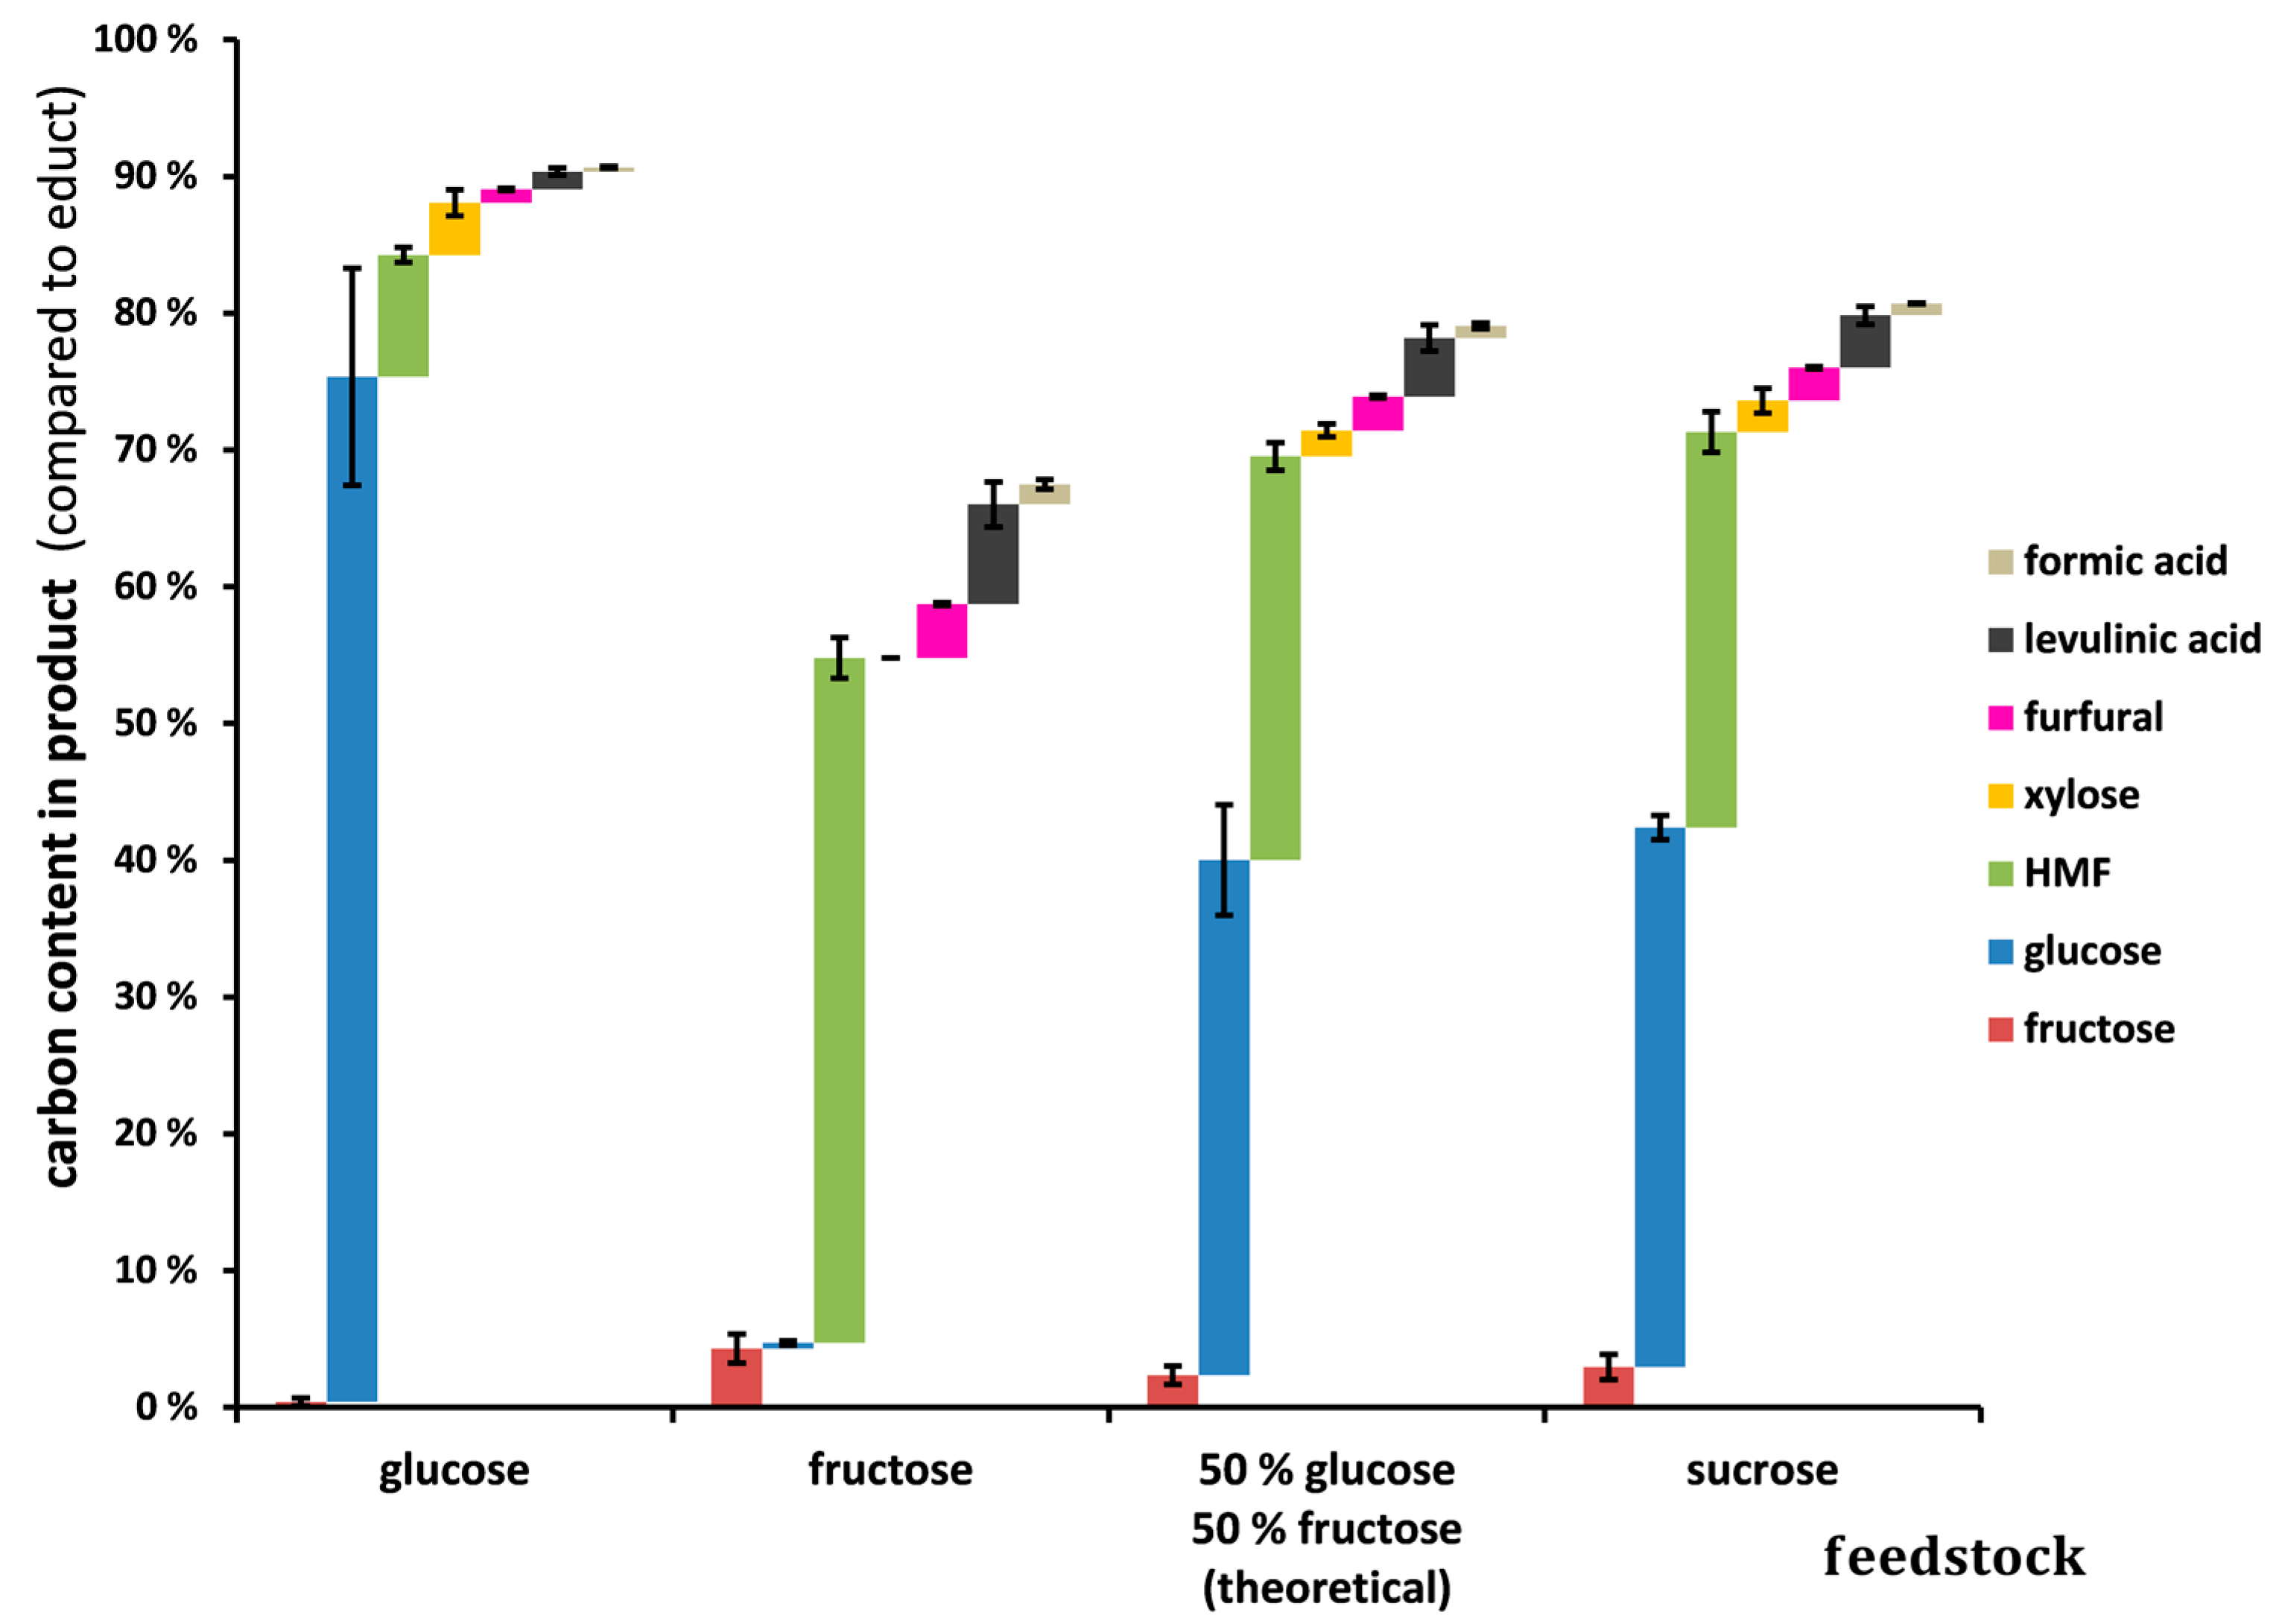
3.3. Carbon Balance of Glucose and Fructose Conversion
The carbon balances of experiments with a feedstock containing either glucose or fructose are shown in Figure 5. Amounts of 1.05 wt % monosaccharide solution were used, corresponding to glucose or fructose in a 2.0 wt % sucrose solution. At 220 °C and 10 min residence time, the conversion of glucose (25%) was much lower than that of fructose (96%). The HMF mass yields accounted for 0.062 gHMF/gglucose and 0.351 gHMF/gfructose at 220 °C and 10 min.
When a glucose feedstock was used, we found traces of the isomerization product fructose in the product samples, and vice versa (see Figure 5). Xylose was only detected after the conversion of glucose, and not in the case of fructose. However, furfural was present in both cases, which is a dehydration product of pentoses. Therefore, we assume that the pathway from fructose to furfural might proceed via another intermediate pentose.
A calculated mixture of glucose and fructose is also depicted in Figure 5, and was compared with experimental data from sucrose feedstock. The conversion of sucrose was well-described by combining the experimental results from fructose and glucose conversion. We used unpaired two-sample Student’s t-tests to evaluate whether there was a significant difference in the carbon composition. Student’s t-tests resulted in p > 0.34 for all individual components shown in Figure 5, and thus no significant difference could be found in sucrose experiments compared with a calculated mixture of the two hexoses. This implied that the results of glucose and fructose conversion could be used to estimate the yields from sucrose conversion. As a consequence, cross-reactions of glucose products with fructose products were of minor importance in the investigated conditions. This finding is in accordance with Tan-Soetedjo et al. [22], who also observed that individual sugars are not affected in the presence of other sugars.
The side products can be determined by the difference to 100%, as shown in Figure 5. Regarding the literature, the probability of forming high-molecular-weight side products generally increases with the concentrations of HMF, sugars, and intermediates [6], because these condensation reactions are of a higher reaction order [40,41]. The sucrose experiments were conducted with double the carbon input as compared with fructose or glucose experiments (compare Figure 5). However, we do not observe a significant higher side product formation using sucrose as compared with a calculated mixture of glucose and fructose. However, if the sucrose content were to be increased much more, we believe that the formation of high-molecular-weight side products would accelerate. These high-molecular-weight side products can form solid particles at longer reaction times. Velebil et al. [42] reported yields of solid particles increasing with sucrose content.
3.4. Modeling Results
We avoided modeling on a molar yield base, because defining the maximal theoretical yield of each component in the sucrose reaction network is not obvious (compare Figure 2). The modeling is, therefore, performed on a molar ratio base (see Equation (1)). The experimentally determined molar ratios of fructose, glucose, HMF, xylose, furfural, levulinic acid, formic acid, and the sum of the side products can be found in Tables S1 and S2 of the Supplementary Material to this article.
The molar ratio of the noncharacterized side products is not directly measurable. For a rough estimation, we determined the sum of the side products (SP1, SP2, and SP3) via the carbon balance shown in Figure 4. The difference between the sum of all carbon detected and 100% can be assigned to nonquantified side products. An average molar mass of 180.2 g/mol is postulated to calculate the molar ratio of the sum of the side products. However, in reality, the side products can be divided into smaller molecules from defragmentation reactions, such as short-chain aldehydes and organic acids, and high-molecular-weight condensation products.
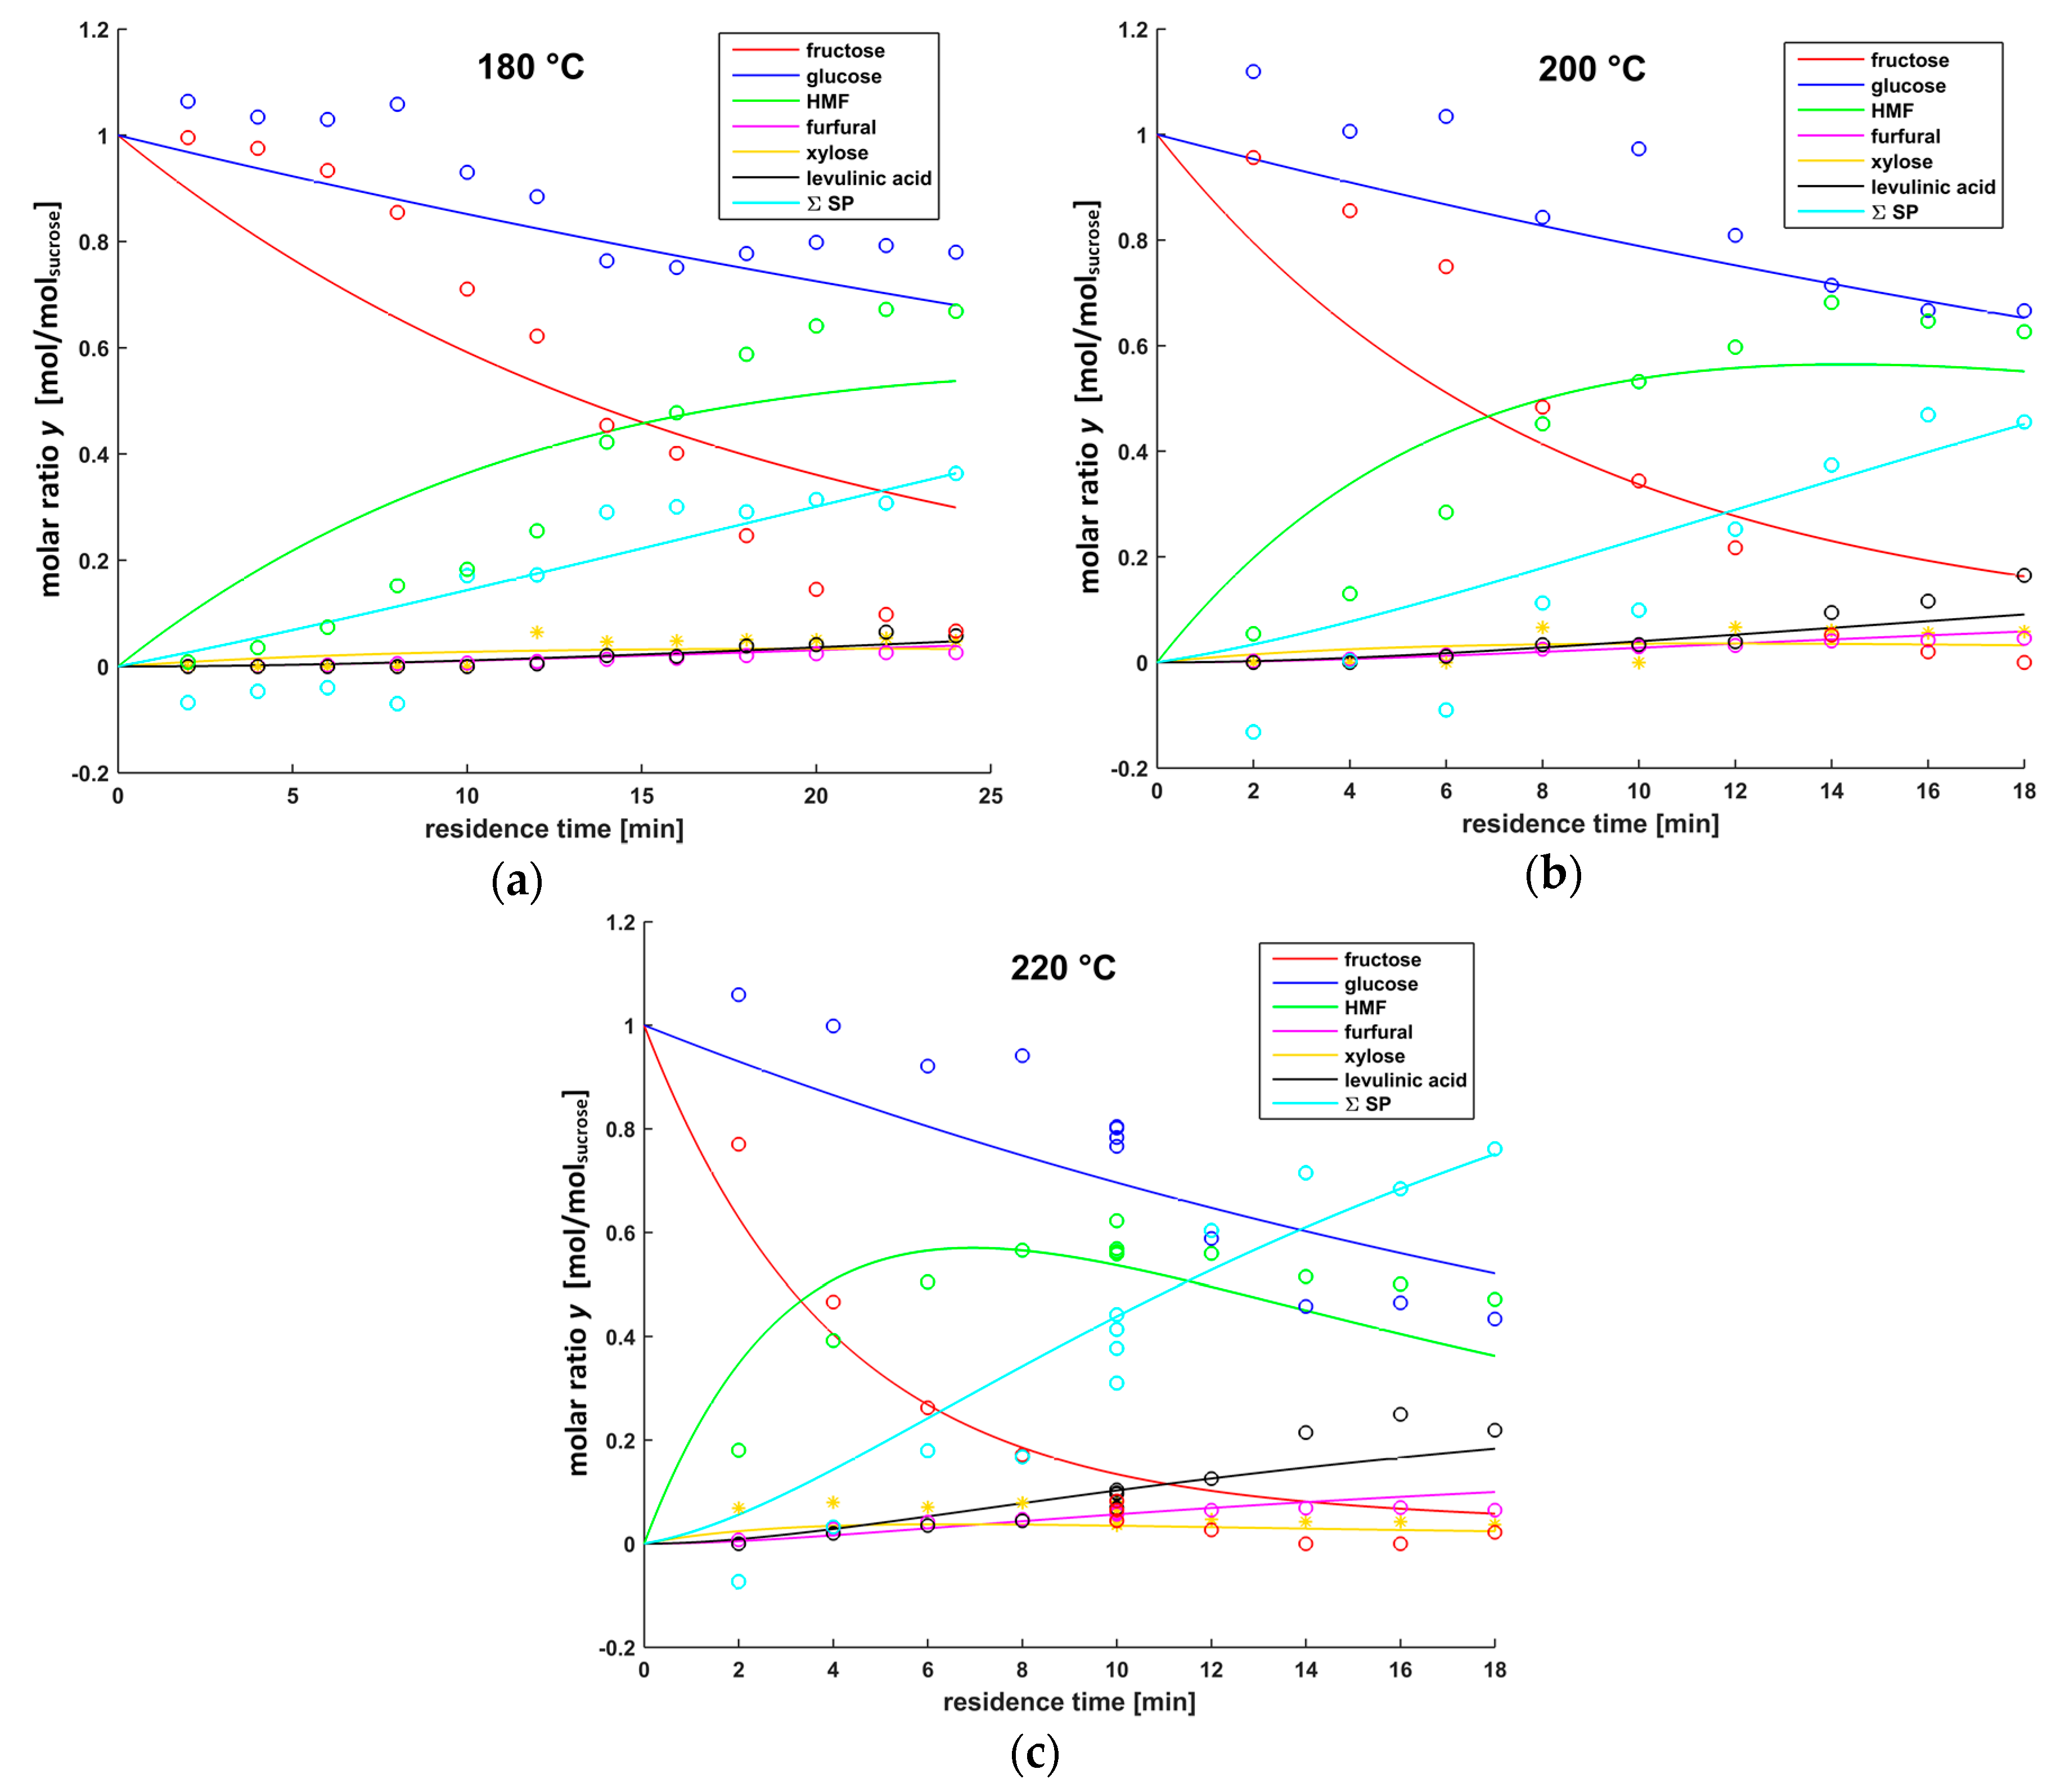
The experimental results of sucrose conversion are compared with the kinetic model in Figure 6. Since HMF rehydrates to form equimolar amounts of levulinic acid and formic acid, only the data of levulinic acid is displayed in the following diagrams. Within the scope of measuring inaccuracy, the molar ratios of levulinic acid and formic acid are equal within each sample in this study. Glucose molar ratios of greater than one at low residence times in Figure 6 result from measuring inaccuracies; this also leads to negative values for the sum of the side products.
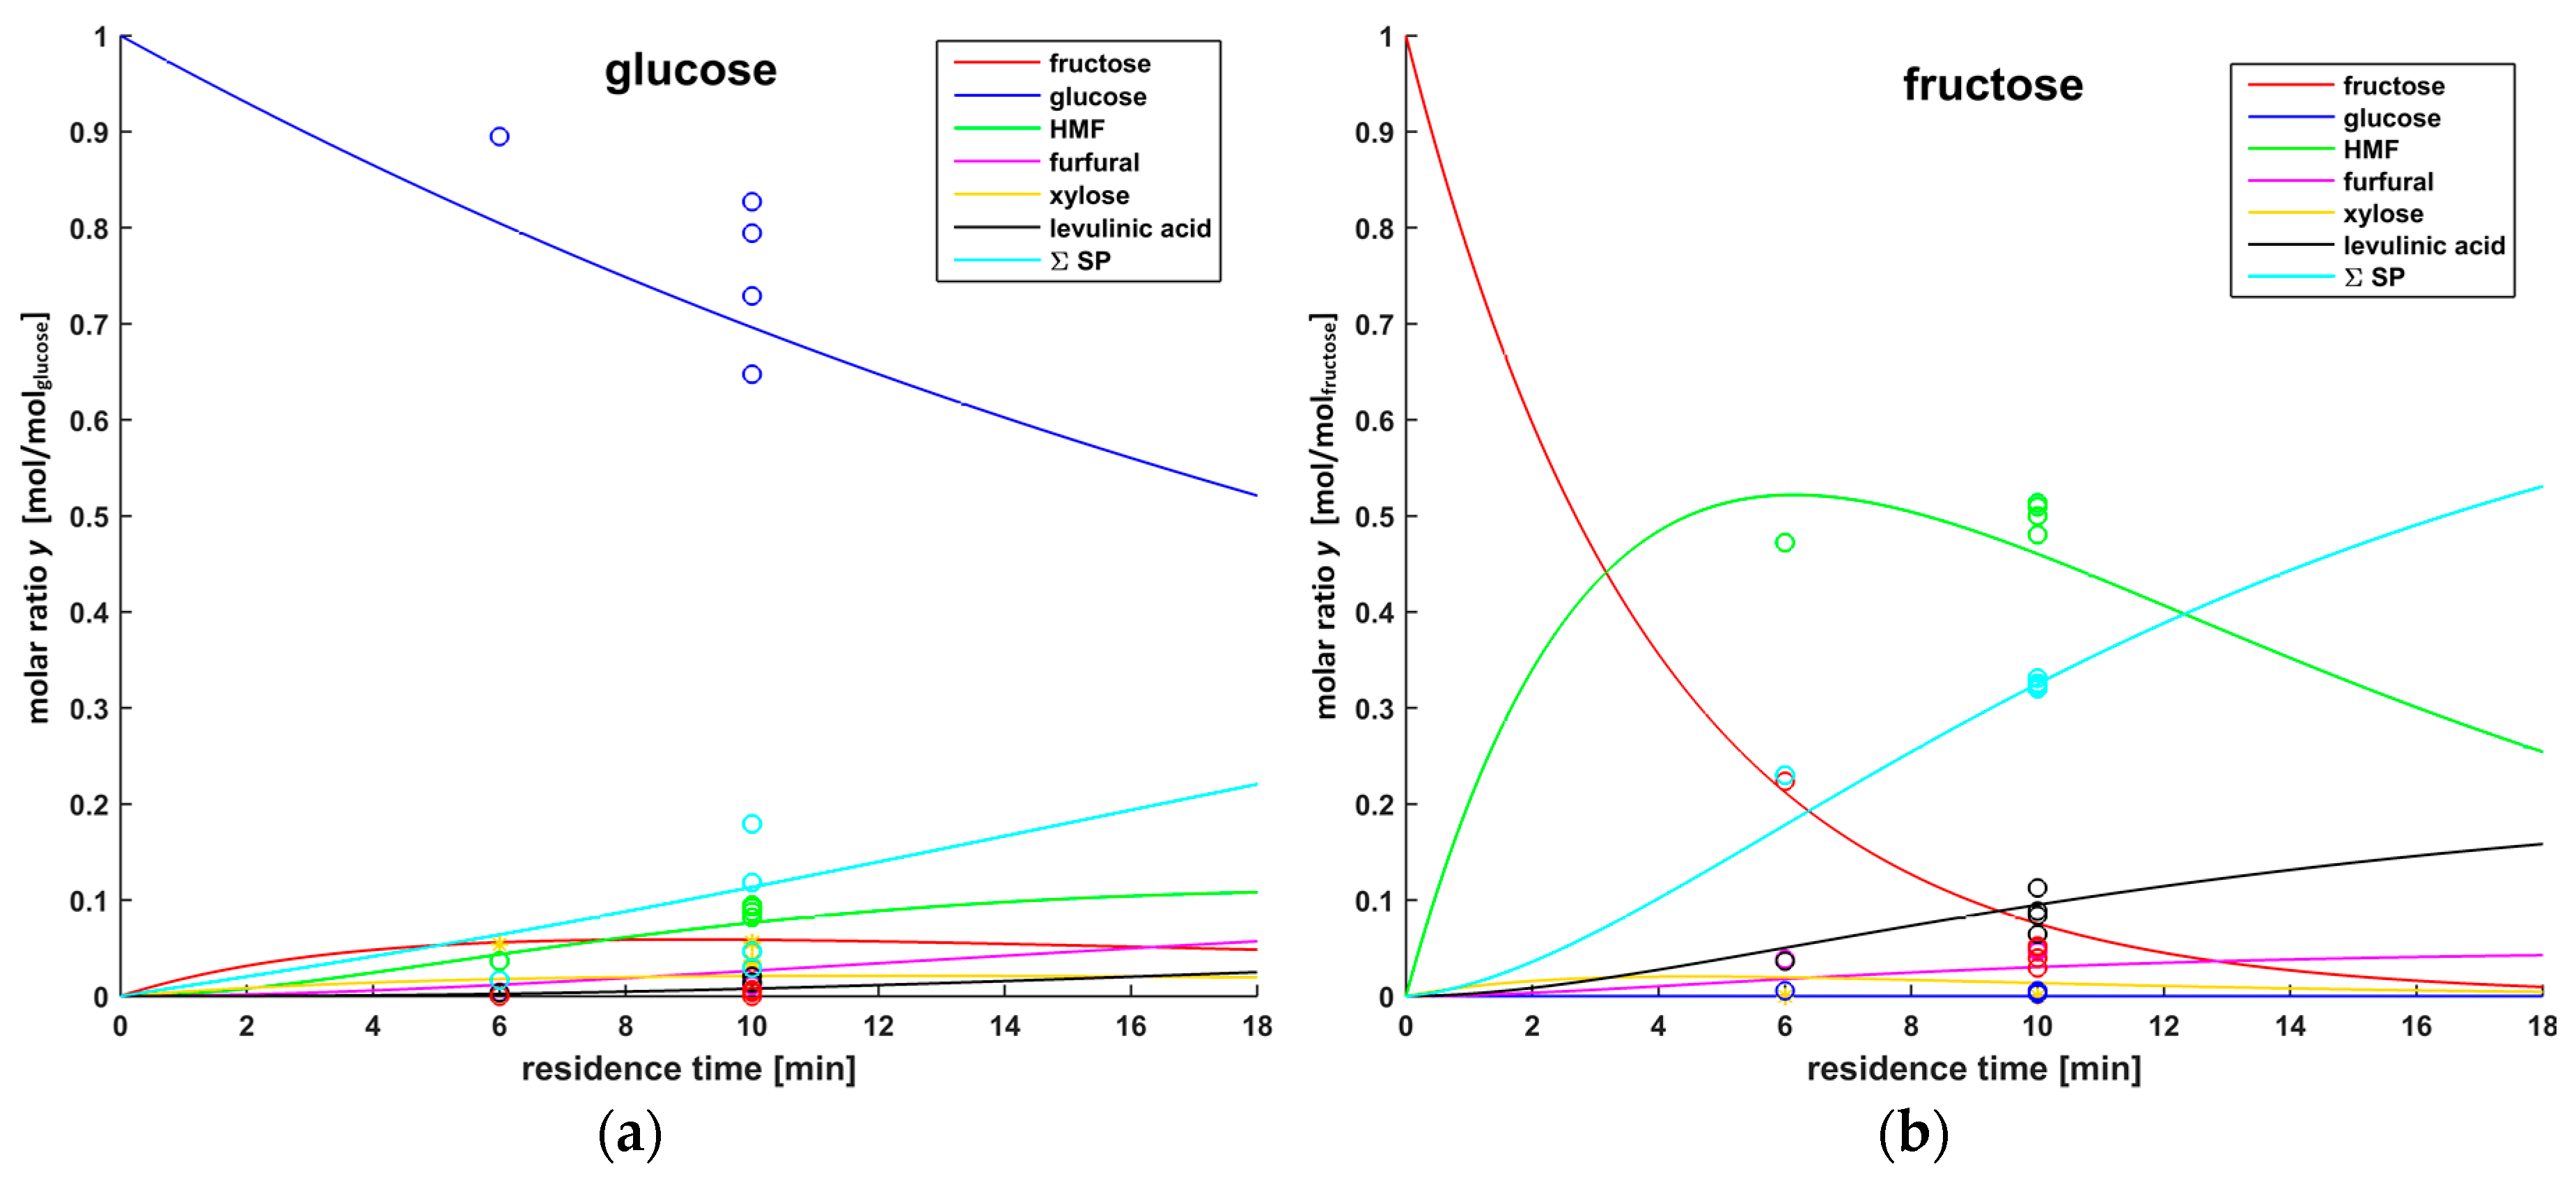
The results of the experiments using glucose or fructose as the feedstock were compared with the results from the kinetic model in Figure 7. These experimental results are also included in the optimization of the kinetic parameters, according to Equation (12).
The model proposed is generally able to describe the experimental data. However, the fructose consumption is overrated at low residence times (2–6 min) by the model, especially at the lowest reaction temperature examined (180 °C). By contrast, the fructose consumption is underrated by the model at higher residence times (14–24 min) (see Figure 6). We are sure that this effect cannot be a result of an insufficient reaction model, but rather arises from experimental conditions in the tubular reactor. Especially at low residence times, which are related to high flow rates, the reactor is not completely isothermal.
The rate coefficients kn of the kinetic model are summarized in Table 1. The activation energy EAn and the Arrhenius factor An are shown in Table S3 of the Supplementary Material to this article. The rate constant for fructose conversion to HMF (k1) is roughly an order of magnitude higher than the isomerization of glucose to fructose (k6). Side-product formation from HMF (k8) dominates among the reactions that produce noncharacterized side products. The side-product formation from fructose and glucose (k7, k9) shows only a small rise with temperature (see Table 1), and the corresponding activation energies EA7 and EA9 are the lowest in the reaction network (see Table S3 of the Supplementary Material). We assume this effect occurs because a variety of different elementary reactions are lumped together in k7 and k9.
According to the proposed model, xylose is produced from fructose as well as from glucose. However, when pure fructose was used as the feedstock, we found no xylose in the product samples (see Figure 5). However, furfural was present, which is a dehydration product of pentoses. Therefore, the pathway from fructose to furfural might proceed via another intermediate pentose, which is not included in the model.
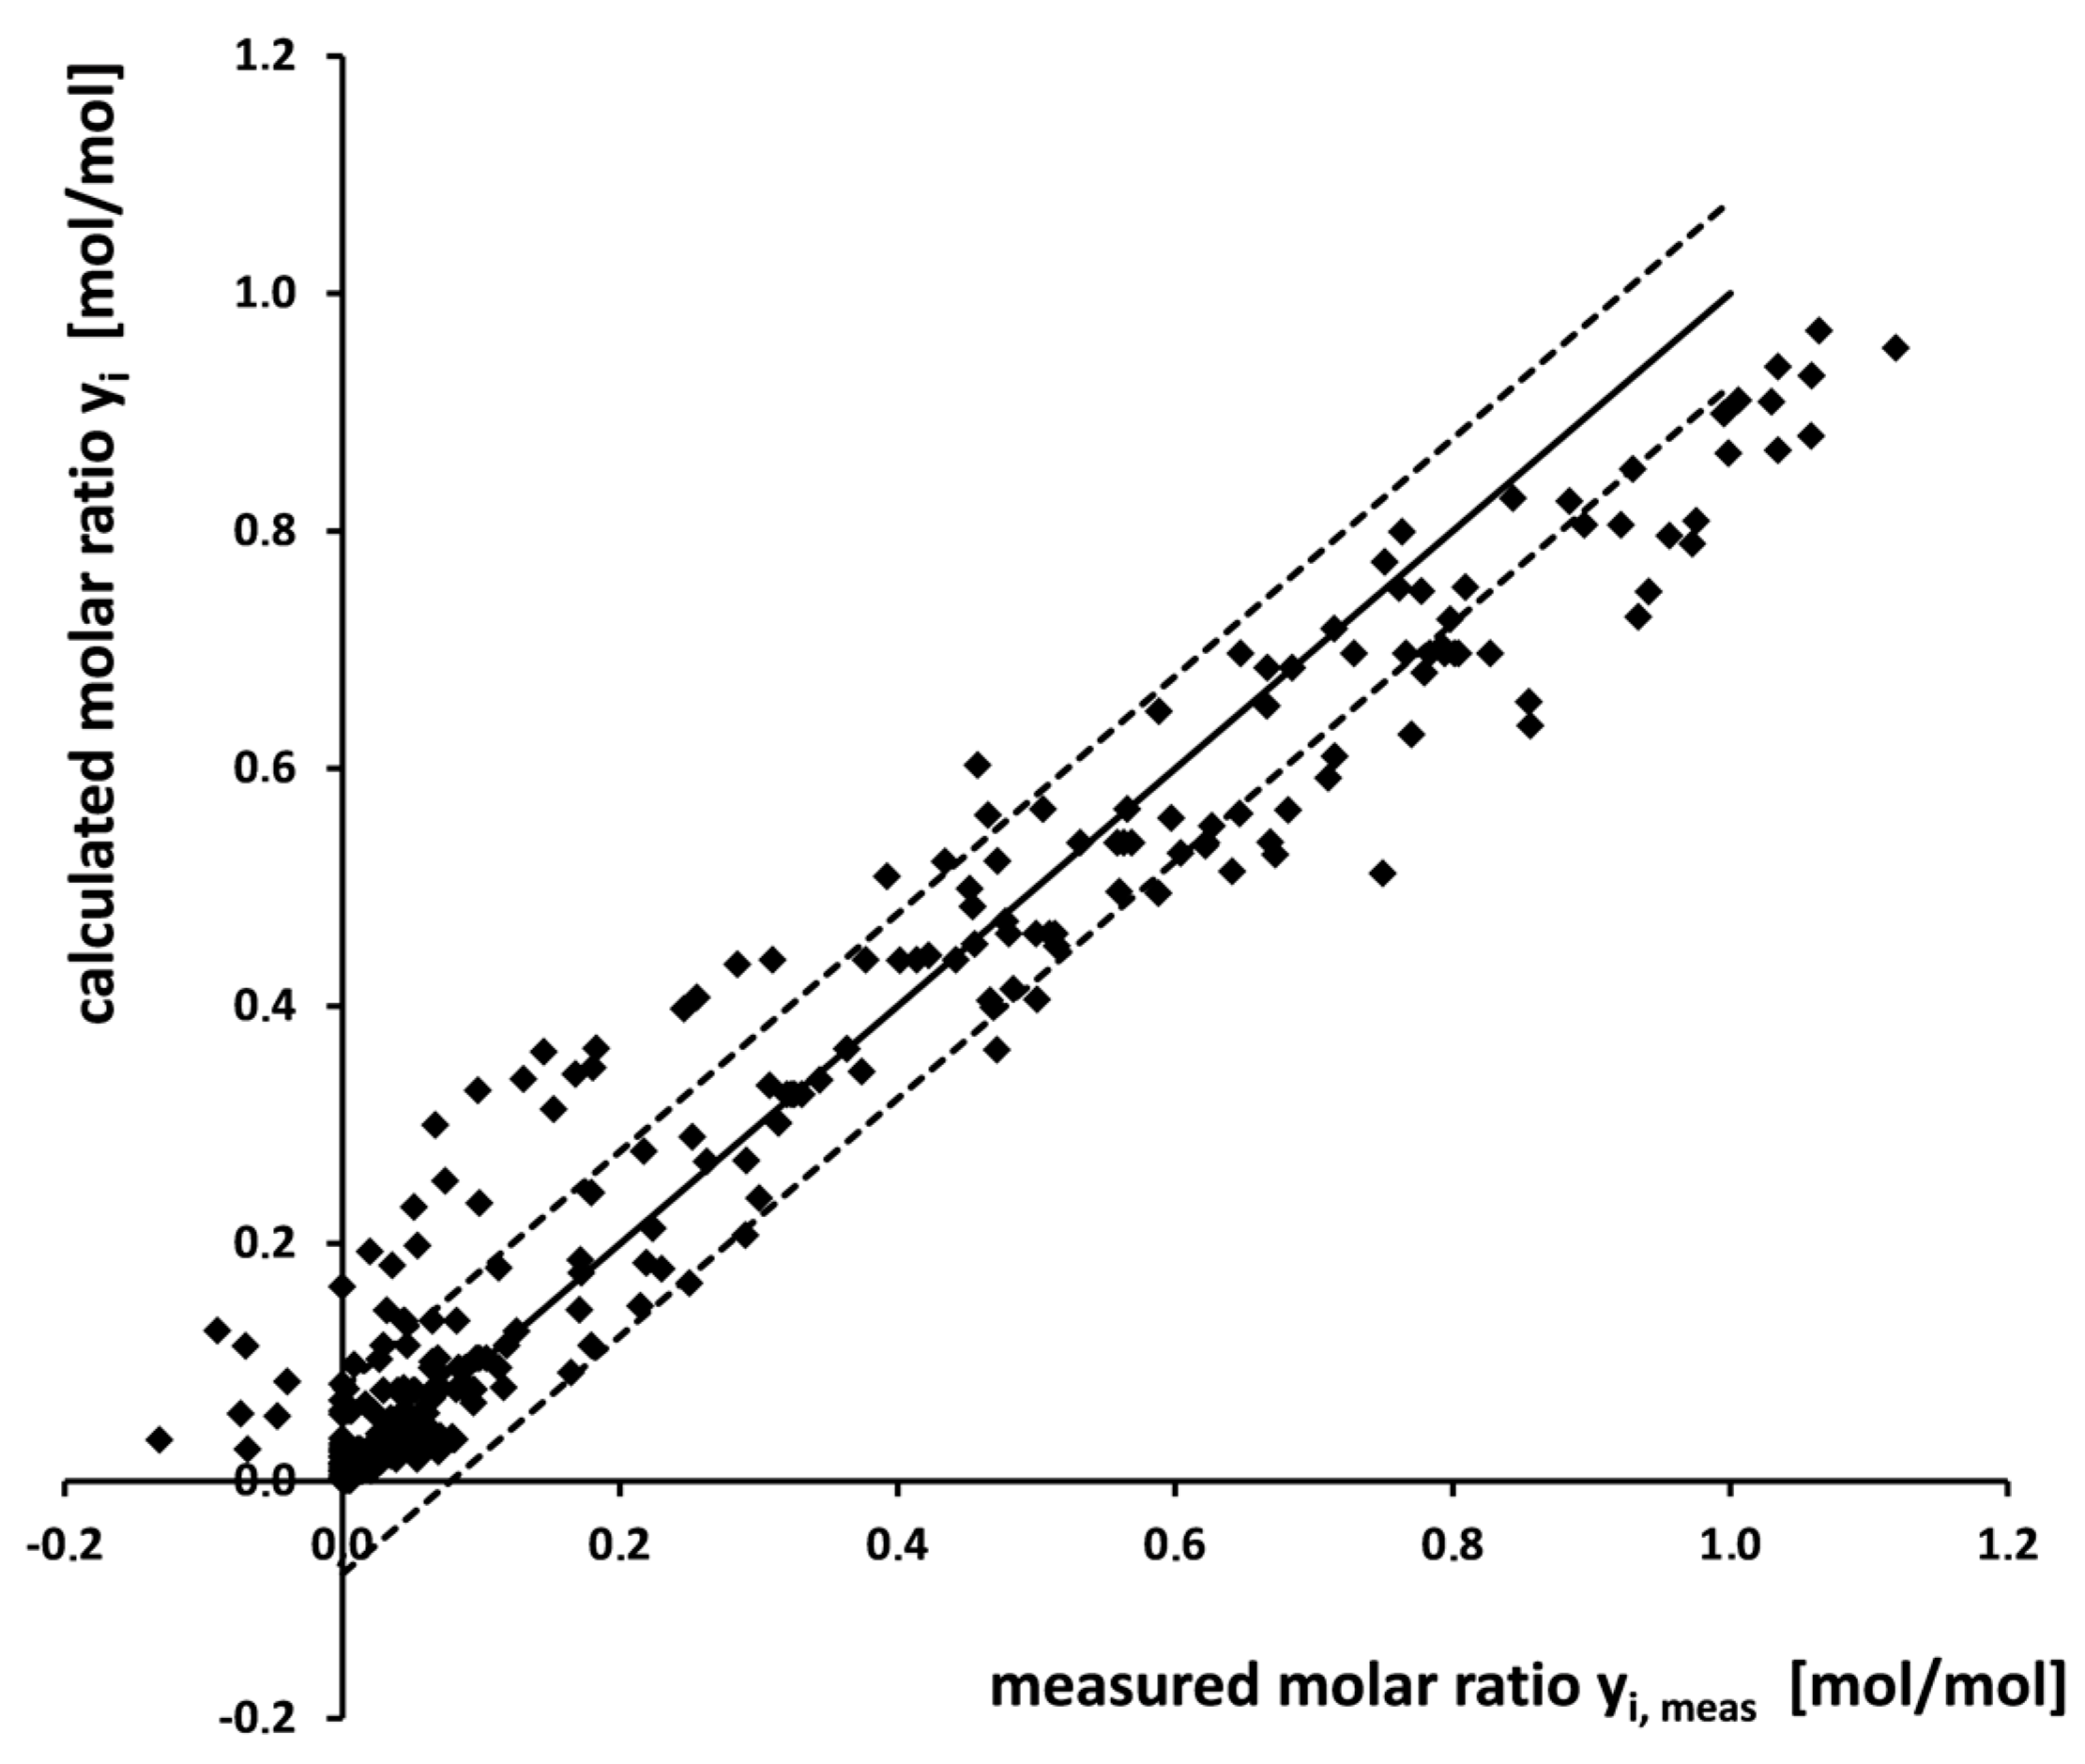
Figure 8 shows the difference between all molar ratios measured and calculated. When the calculation describes the experimental result perfectly, the data point is on the line through the origin with a slope of one. A standard derivation δ of a linear regression function is calculated to evaluate the error (see Equation (13)). Parameters (a = 1, b = 0) are used to describe the linear equation. The standard deviation δ of the values calculated is about 7.8%. The Pearson correlation coefficient is 0.974.
Asghari and Yohsida [32] investigated the HCl-catalyzed decomposition of fructose and formulated a kinetic model. They assumed that fructose and HMF could react to form different side products. The formation of side products from fructose was much higher than from HMF [32]. This contrasts to our work, where the side product formation from HMF was dominant (k8 > k7, see Table 1). The main differences between the study of Asghari and Yohsida [32] and our work are more acidic conditions (pH = 1.8), a smaller feedstock concentration (0.5 wt % fructose), and the use of HCl as the homogeneous catalyst.
Van Putten et al. [12] suggested that the rate-determining step in glucose dehydration to form HMF under acidic conditions is the isomerization to fructose. This is in accordance with our calculations, because the rate constant for the isomerization of glucose to fructose (k6) is roughly an order of magnitude smaller than the subsequent fructose dehydration to form HMF (k1) (see Table 1).
4. Conclusions
Sucrose decomposition in water catalyzed by 0.005 mol/L sulfuric acid was studied in a tubular reactor at 180–220 °C. Sucrose hydrolyzed rapidly to fructose and glucose at all the reaction conditions investigated. The formed fructose showed much faster conversion than glucose. The maximum HMF yield was surpassed within the residence time spectra investigated at 200 °C (0.25 g/g based on input sucrose) and at 220 °C (0.23 g/g). A carbon balance showed that the yield of unwanted side products rose strongly with temperature. Therefore, we recommend a mild reaction temperature for industrial HMF production. Nonconverted glucose could be isomerized catalytically to fructose, which is recycled for HMF production. In this regard, efficient purification strategies of HMF from the product mixture are of high interest.
Furthermore, we compared the feedstocks of sucrose, glucose, and fructose concerning their product distribution at 220 °C. The results of glucose and fructose conversion can be used to predict the yields from sucrose conversion.
A reaction network with nine first-order reactions was proposed. Within our network, HMF is only produced via the dehydration of fructose. Glucose isomerizes slowly to fructose. Side products arise simultaneously from glucose, fructose, and HMF, whereby side product formation from HMF is dominant at the conditions investigated. A small part of HMF rehydrates to form levulinic acid and formic acid. A pathway from hexoses to xylose via reverse aldol reaction is also included in the model. However, this postulated pathway needs further experimental investigation.
Supplementary Materials
The following are available online at https://www.mdpi.com/1996-1073/11/3/645/s1, Table S1: Experimentally determined molar ratios yi,meas of the acid-catalyzed conversion of sucrose. Feedstock contained 2 wt % sucrose and 0.005 mol/L sulfuric acid. Table S2: Experimentally determined molar ratios yi,meas of the acid-catalyzed conversion of glucose or fructose, at 10 min residence times and 220 °C. Feedstock contained 0.005 mol/L sulfuric acid and either 1.05 wt % glucose or 1.05 wt % fructose. Table S3: Activation energy EAn and Arrhenius factor An of the n first-order reactions as defined according to the model.
Acknowledgments
We thank Xavier Sampietro Vallverdú for his experimental work. We acknowledge Nicolaus Dahmen for thesis supervision and Robert Grandl for Matlab support. Matthias Pagel and Thomas Tietz built the reactor. The HPLC measurements were performed by Sonja Habicht and Armin Lautenbach. This work was financially supported by the German Federal Ministry of Food, Agriculture and Consumer Protection (FNR project number 22027811), based on a decision of the German Bundestag. We acknowledge support by Deutsche Forschungsgemeinschaft and Open Access Publishing Fund of Karlsruhe Institute of Technology.
Author Contributions
David Steinbach and Philipp Vetter designed and performed the experiments; David Steinbach, Andrea Kruse and Philipp Vetter analyzed the data; David Steinbach, Andrea Kruse and Jörg Sauer wrote the article.
Conflicts of Interest
The authors declare no conflict of interest. The founding sponsors had no role in the design of the study; in the collection, analyses, or interpretation of data; in the writing of the manuscript, and in the decision to publish the results.
References
- Harmsen, P.; Hackmann, M.; Bos, H. Green building blocks for bio-based plastics. Biofuel Bioprod. Biorefin. 2014, 8, 306–324. [Google Scholar] [CrossRef]
- Aeschelmann, F.; Carus, M. Biobased building blocks and polymers in the world: Capacities, production, and applications—Status quo and trends towards 2020. Ind. Biotechnol. 2015, 11, 154–159. [Google Scholar] [CrossRef]
- Van Putten, R.J.; van der Waal, J.C.; de Jong, E.; Rasrendra, C.B.; Heeres, H.J.; de Vries, J.G. Hydroxymethylfurfural, a versatile platform chemical made from renewable resources. Chem. Rev. 2013, 113, 1499–1597. [Google Scholar] [CrossRef] [PubMed]
- Kläusli, T. AVA Biochem: Commercialising renewable platform chemical 5-HMF. Green Process. Synth. 2014, 3. [Google Scholar] [CrossRef]
- Bozell, J.J.; Petersen, G.R. Technology development for the production of biobased products from biorefinery carbohydrates—The US Department of Energy’s “Top 10” revisited. Green Chem. 2010, 12, 539–554. [Google Scholar] [CrossRef]
- Steinbach, D.; Kruse, A.; Sauer, J. Pretreatment technologies of lignocellulosic biomass in water in view of furfural and 5-hydroxymethylfurfural production—A review. Biomass Convers. Bior. 2017, 7, 247–274. [Google Scholar] [CrossRef]
- Cottier, L.; Descotes, G. 5-Hydroxymethylfurfural syntheses and chemical transformations. Trends Heterocycl. Chem. 1991, 2, 233–248. [Google Scholar]
- Corma, A.; Iborra, S.; Velty, A. Chemical routes for the transformation of biomass into chemicals. Chem. Rev. 2007, 107, 2411–2502. [Google Scholar] [CrossRef] [PubMed]
- Fan, L.; Gharpuray, M.M.; Lee, Y.H. Cellulose Hydrolysis; Springer: Berlin, Germany, 1987. [Google Scholar]
- Kruse, A.; Dinjus, E. Hot compressed water as reaction medium and reactant—Properties and synthesis reactions. J. Supercrit. Fluid 2007, 39, 362–380. [Google Scholar] [CrossRef]
- Kruse, A.; Dinjus, E. Hot compressed water as reaction medium and reactant—2. Degradation reactions. J. Supercrit. Fluid 2007, 41, 361–379. [Google Scholar] [CrossRef]
- Van Putten, R.J.; Soetedjo, J.N.M.; Pidko, E.A.; van der Waal, J.C.; Hensen, E.J.M.; de Jong, E.; Heeres, H.J. Dehydration of different ketoses and aldoses to 5-hydroxymethylfurfural. Chemsuschem 2013, 6, 1681–1687. [Google Scholar] [CrossRef] [PubMed]
- Ramos, L.P. The chemistry involved in the steam treatment of lignocellulosic materials. Quim. Nova 2003, 26, 863–871. [Google Scholar] [CrossRef]
- Scallet, B.L.; Shieh, K.; Ehrenthal, I.; Slapshak, L. Studies in the isomerization of d-glucose. Starch Stärke 1974, 26, 405–408. [Google Scholar] [CrossRef]
- Yan, K.; Liu, Y.; Lu, Y.; Chai, J.; Sun, L. Catalytic application of layered double hydroxide-derived catalysts for the conversion of biomass-derived molecules. Catal. Sci. Technol. 2017, 7, 1622–1645. [Google Scholar] [CrossRef]
- Delidovich, I.; Palkovits, R. Catalytic Isomerization of Biomass-Derived Aldoses: A Review. Chemsuschem 2016, 9, 547–561. [Google Scholar] [CrossRef] [PubMed]
- Sugar: World Markets and Trade. (2016) United States Department of Agriculture. Available online: https://apps.fas.usda.gov/psdonline/circulars/sugar.pdf (accessed on 13 March 2018).
- Antal, M.J.; Mok, W.S.L.; Richards, G.N. Mechanism of formation of 5-(hydroxymethyl)-2-furaldehyde from d-fructose and sucrose. Carbohyd. Res. 1990, 199, 91–109. [Google Scholar] [CrossRef]
- Khajavi, S.H.; Kimura, Y.; Oomori, T.; Matsuno, R.; Adachi, S. Kinetics on sucrose decomposition in subcritical water. Lwt-Food Sci. Technol. 2005, 38, 297–302. [Google Scholar] [CrossRef]
- Bower, S.; Wickramasinghe, R.; Nagle, N.J.; Schell, D.J. Modeling sucrose hydrolysis in dilute sulfuric acid solutions at pretreatment conditions for lignocellulosic biomass. Bioresour. Technol. 2008, 99, 7354–7362. [Google Scholar] [CrossRef] [PubMed]
- Gao, D.; Kobayashi, T.; Adachi, S. Kinetics of Sucrose Hydrolysis in a Subcritical Water-ethanol Mixture. J. Appl. Glycosci. 2014, 61, 9–13. [Google Scholar] [CrossRef]
- Tan-Soetedjo, J.N.M.; van de Bovenkamp, H.H.; Abdilla, R.M.; Rasrendra, C.B.; van Ginkel, J.; Heeres, H.J. Experimental and Kinetic Modeling Studies on the Conversion of Sucrose to Levulinic Acid and 5-Hydroxymethylfurfural Using Sulfuric Acid in Water. Ind. Eng. Chem. Res. 2017, 56, 13229–13240. [Google Scholar] [CrossRef] [PubMed]
- Fachri, B.A.; Abdilla, R.M.; van de Bovenkamp, H.H.; Rasrendra, C.B.; Heeres, H.J. Experimental and kinetic modeling studies on the sulfuric acid catalyzed conversion of d-fructose to 5-hydroxymethylfurfural and levulinic acid in water. ACS Sustain. Chem. Eng. 2015, 3, 3024–3034. [Google Scholar] [CrossRef]
- Girisuta, B.; Janssen, L.P.B.M.; Heeres, H.J. A kinetic study on the decomposition of 5-hydroxymethylfurfural into levulinic acid. Green Chem. 2006, 8, 701–709. [Google Scholar] [CrossRef]
- Girisuta, B.; Janssen, L.P.B.M.; Heeres, H.J. A kinetic study on the conversion of glucose to levulinic acid. Chem. Eng. Res. Des. 2006, 84, 339–349. [Google Scholar] [CrossRef]
- Torres, A.P.; Oliveira, F.A.R. Application of the acid hydrolysis of sucrose as a temperature indicator in continuous thermal processes. J. Food Eng. 1999, 40, 181–188. [Google Scholar] [CrossRef]
- Smith, P.C.; Grethlein, H.E.; Converse, A.O. Glucose decomposition at high-temperature, mild acid, and short residence times. Sol. Energy 1982, 28, 41–48. [Google Scholar] [CrossRef]
- Saeman, J.F. Kinetics of wood saccharification—Hydrolysis of cellulose and decomposition of sugars in dilute acid at high temperature. Ind. Eng. Chem. 1945, 37, 43–52. [Google Scholar] [CrossRef]
- McKibbins, S.W.; Harris, J.F.; Saeman, J.F.; Neill, W.K. Kinetics of the acid catalyzed conversion of glucose to 5-hydroxymethyl-2-furaldehyde and levulinic acid. For. Prod. J. 1962, 12, 17–23. [Google Scholar]
- Xiang, Q.; Lee, Y.Y.; Torget, R.W. Kinetics of glucose decomposition during dilute-acid hydrolysis of lignocellulosic biomass. Appl. Biochem. Biotechnol. 2004, 113, 1127–1138. [Google Scholar] [CrossRef]
- Asghari, F.S.; Yoshida, H. Acid-catalyzed production of 5-hydroxymethyl furfural from d-fructose in subcritical water. Ind. Eng. Chem. Res. 2006, 45, 2163–2173. [Google Scholar] [CrossRef]
- Asghari, F.S.; Yoshida, H. Kinetics of the decomposition of fructose catalyzed by hydrochloric acid in subcritical water: Formation of 5-hydroxymethylfurfural, levulinic, and formic acids. Ind. Eng. Chem. Res. 2007, 46, 7703–7710. [Google Scholar] [CrossRef]
- Forchheim, D.; Hornung, U.; Kruse, A.; Sutter, T. Kinetic modelling of hydrothermal lignin depolymerisation. Waste Biomass Valori. 2014, 5, 985–994. [Google Scholar] [CrossRef]
- Gasson, J.R.; Forchheim, D.; Sutter, T.; Hornung, U.; Kruse, A.; Barth, T. Modeling the lignin degradation kinetics in an ethanol/formic acid solvolysis approach. Part 1. Kinetic model development. Ind. Eng. Chem. Res. 2012, 51, 10595–10606. [Google Scholar] [CrossRef]
- Clarke, M.A.; Edye, L.A.; Eggleston, G. Sucrose decomposition in aqueous solution, and losses in sugar manufacture and refining. Adv. Carbohyd. Chem. Biochem. 1997, 52, 441–470. [Google Scholar] [CrossRef]
- Usuki, C.; Kimura, Y.; Adachi, S. Isomerization of Hexoses in Subcritical Water. Food Sci. Technol. Res. 2007, 13, 205–209. [Google Scholar] [CrossRef]
- Kabyemela, B.M.; Adschiri, T.; Malaluan, R.M.; Arai, K. Kinetics of glucose epimerization and decomposition in subcritical and supercritical water. Ind. Eng. Chem. Res. 1997, 36, 1552–1558. [Google Scholar] [CrossRef]
- Bonn, G.; Bobleter, O. Determination of the hydrothermal degradation products of d-(U-C14) glucose and d-(U-C-14) fructose by tlc. J. Radioanal. Chem. 1983, 79, 171–177. [Google Scholar] [CrossRef]
- Kabyemela, B.M.; Adschiri, T.; Malaluan, R.M.; Arai, K. Glucose and fructose decomposition in subcritical and supercritical water: Detailed reaction pathway, mechanisms, and kinetics. Ind. Eng. Chem. Res. 1999, 38, 2888–2895. [Google Scholar] [CrossRef]
- Chuntanapum, A.; Matsumura, Y. Formation of tarry material from 5-HMF in subcritical and supercritical water. Ind. Eng. Chem. Res. 2009, 48, 9837–9846. [Google Scholar] [CrossRef]
- Kruse, A.; Grandl, R. Hydrothermal carbonization: 3. Kinetic model. Chem. Ing. Tech. 2015, 87, 449–456. [Google Scholar] [CrossRef]
- Velebil, J.; Malaťák, J.; Bradna, J. Mass yield of biochar from hydrothermal carbonization of sucrose. Res. Agric. Eng. 2016, 62, 179–184. [Google Scholar] [CrossRef]
Figure 1.
Piping and instrumentationdiagram of test rig. T-1: feedstock tank, P-1: pump, R-1: tubular reactor with surrounding heating block, HE-1: cooler, T-2: small tank.
Figure 1.
Piping and instrumentationdiagram of test rig. T-1: feedstock tank, P-1: pump, R-1: tubular reactor with surrounding heating block, HE-1: cooler, T-2: small tank.
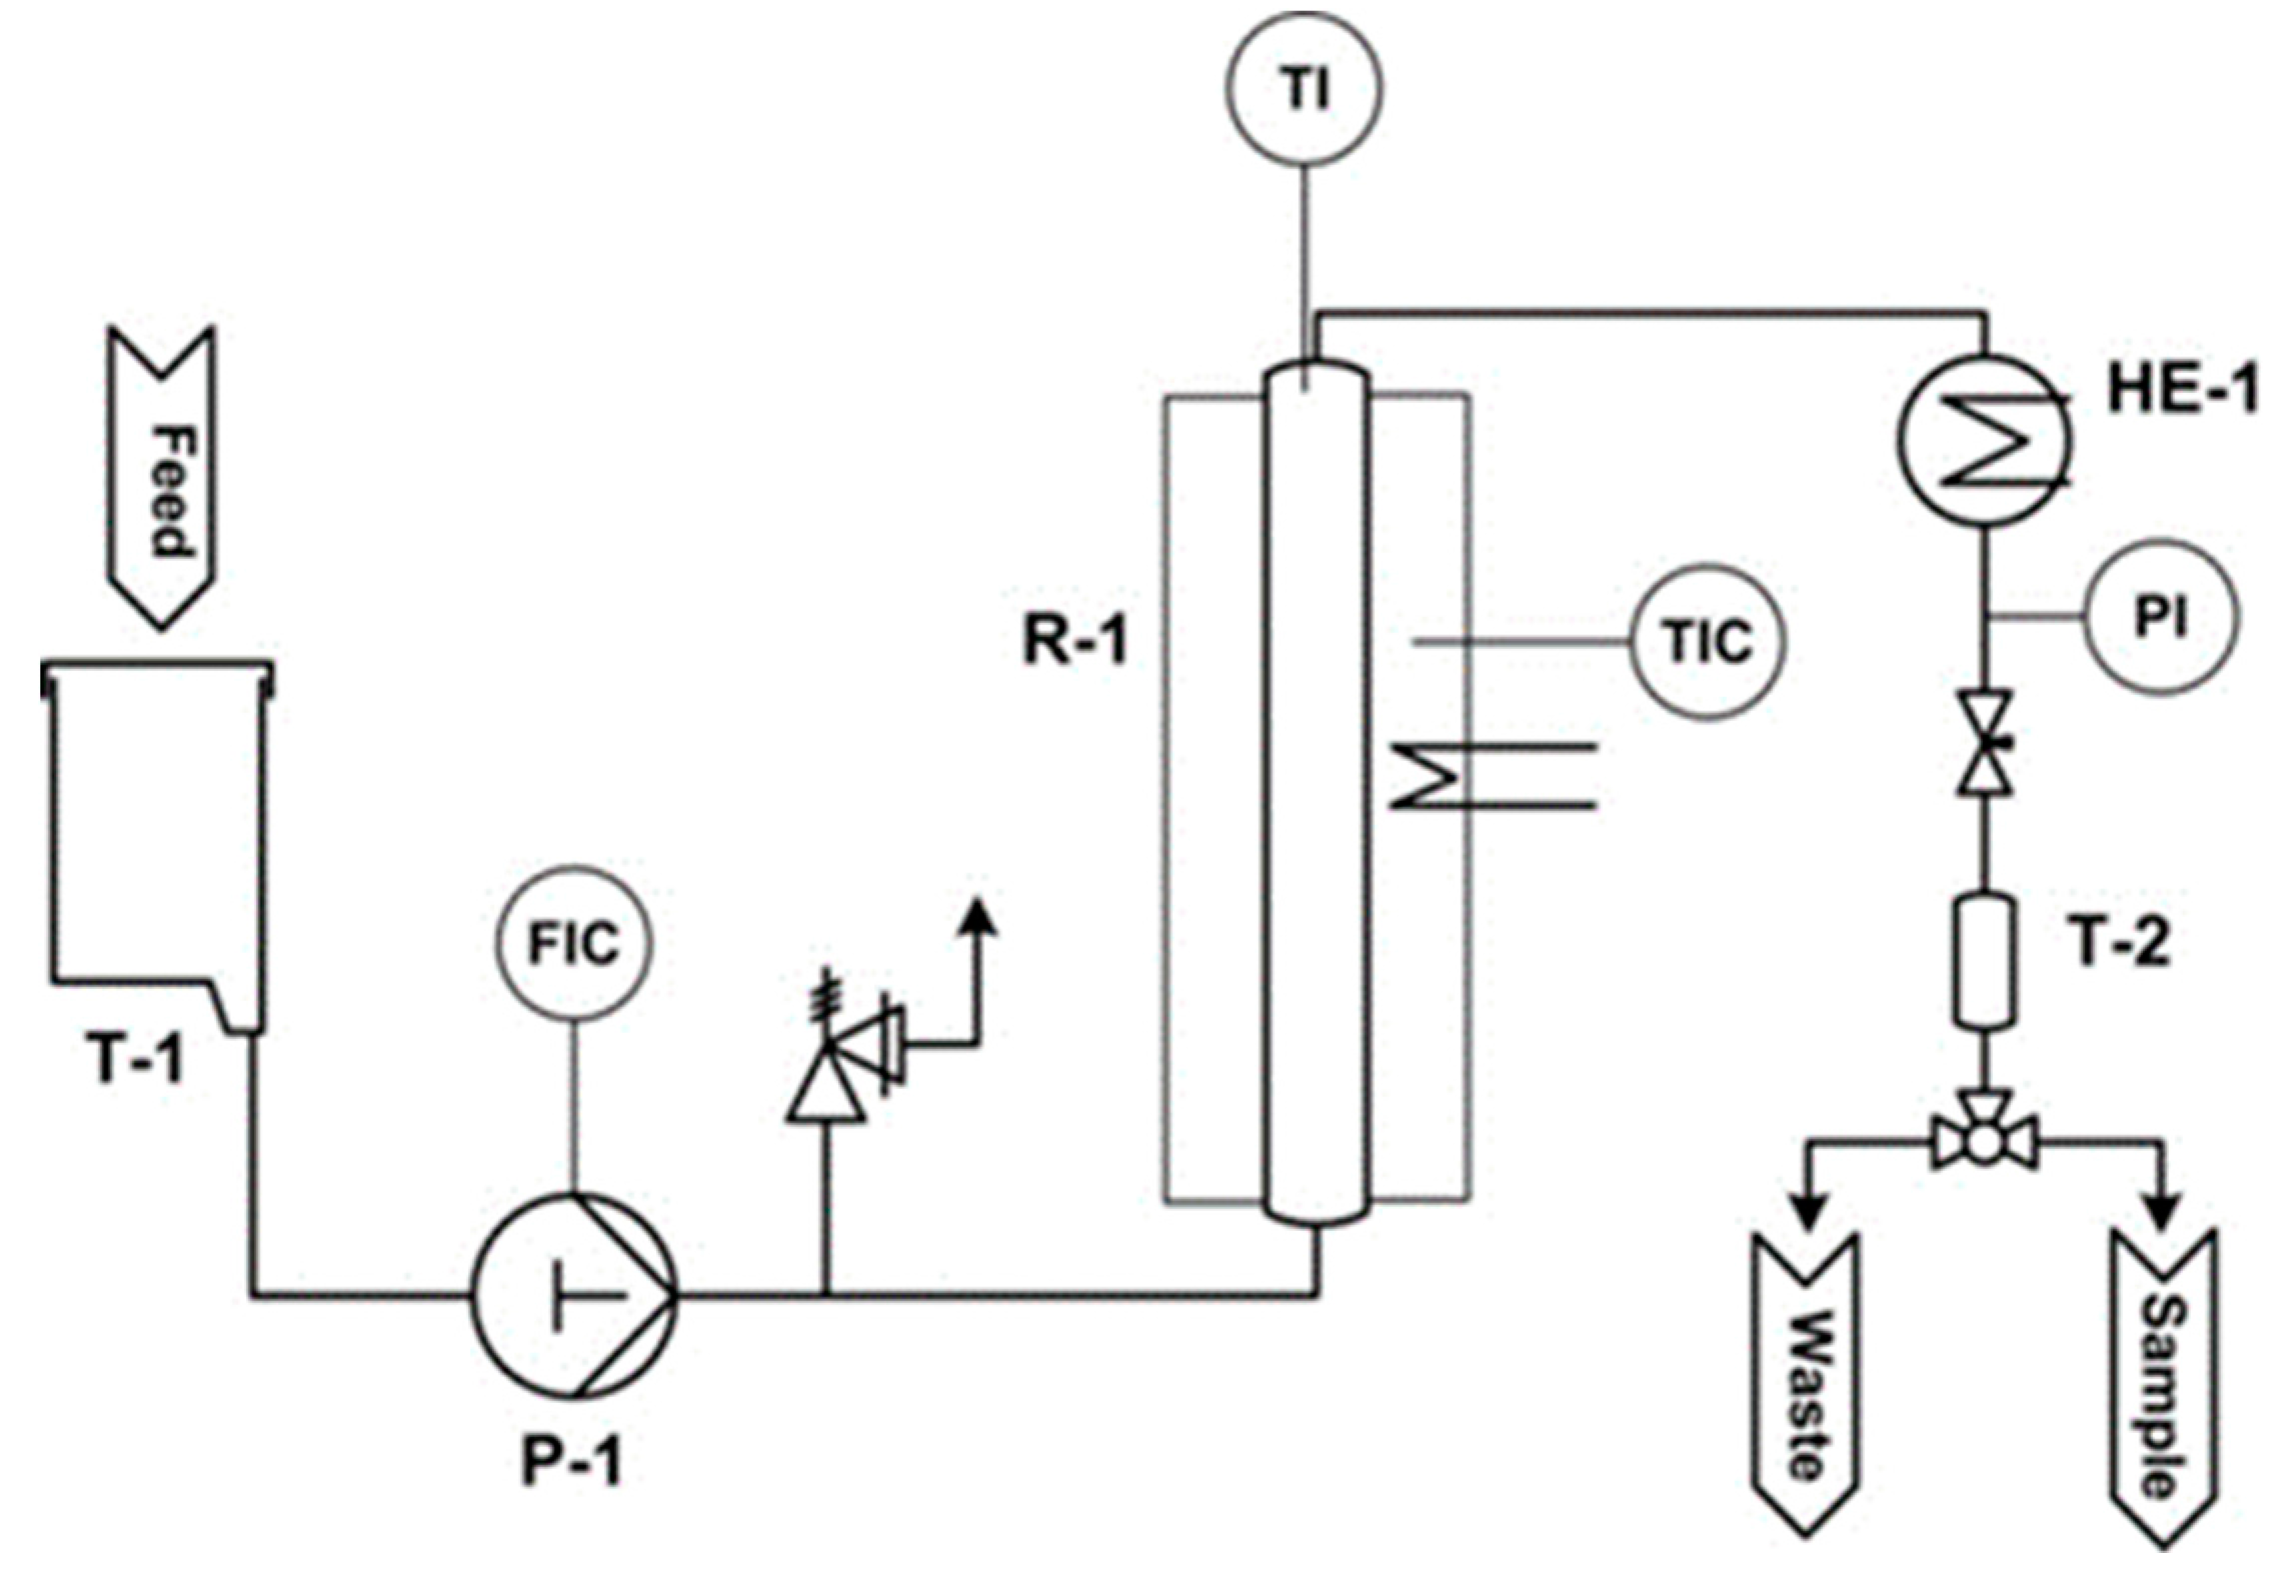
Figure 2.
Reaction model to determine the kinetic rate coefficients kn of the acid-catalyzed conversion of sucrose. HMF = hydroxymethylfurfural; SP = side products.
Figure 2.
Reaction model to determine the kinetic rate coefficients kn of the acid-catalyzed conversion of sucrose. HMF = hydroxymethylfurfural; SP = side products.

Figure 3.
HMF mass yield after acid-catalyzed conversion of sucrose at different residence times and reaction temperatures (T). Feedstock contained 2 wt % sucrose and 0.005 mol/L sulfuric acid.
Figure 3.
HMF mass yield after acid-catalyzed conversion of sucrose at different residence times and reaction temperatures (T). Feedstock contained 2 wt % sucrose and 0.005 mol/L sulfuric acid.
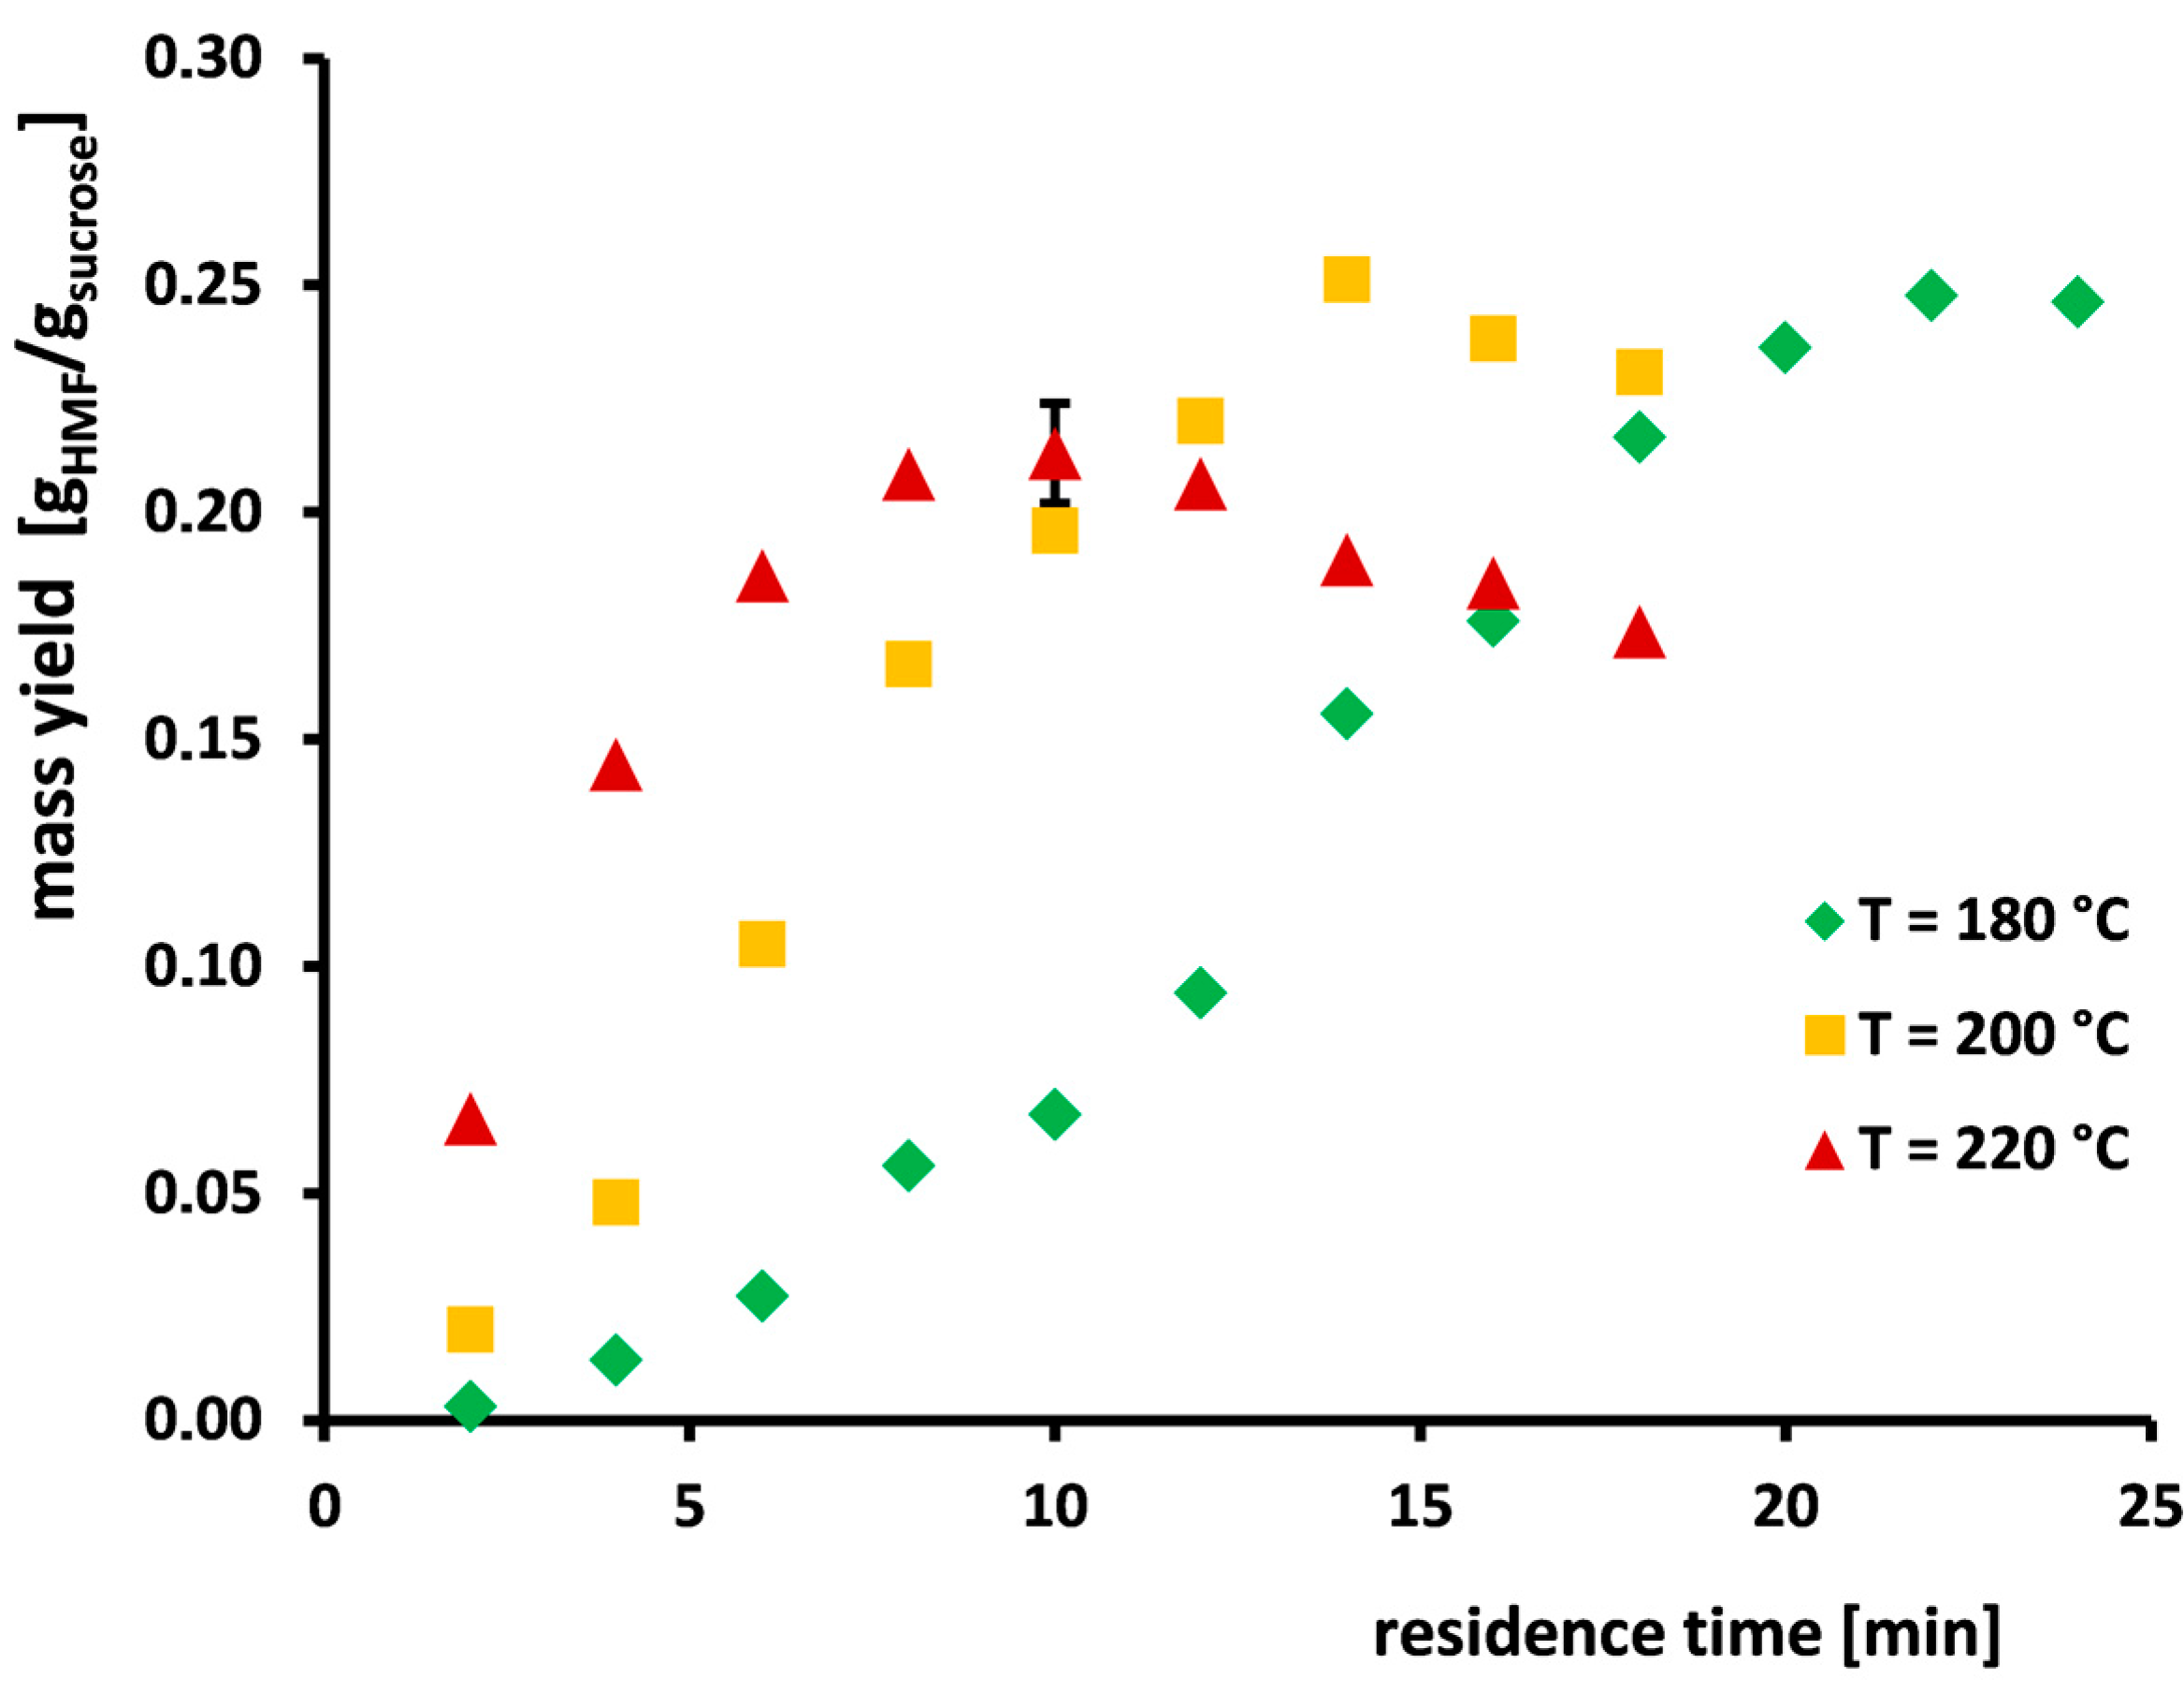
Figure 4.
Carbon composition after acid-catalyzed conversion of sucrose at different residence times and reaction temperatures (T). The carbon input of sucrose is represented by 100%. Feedstock contained 2 wt % sucrose and 0.005 mol/L sulfuric acid.
Figure 4.
Carbon composition after acid-catalyzed conversion of sucrose at different residence times and reaction temperatures (T). The carbon input of sucrose is represented by 100%. Feedstock contained 2 wt % sucrose and 0.005 mol/L sulfuric acid.
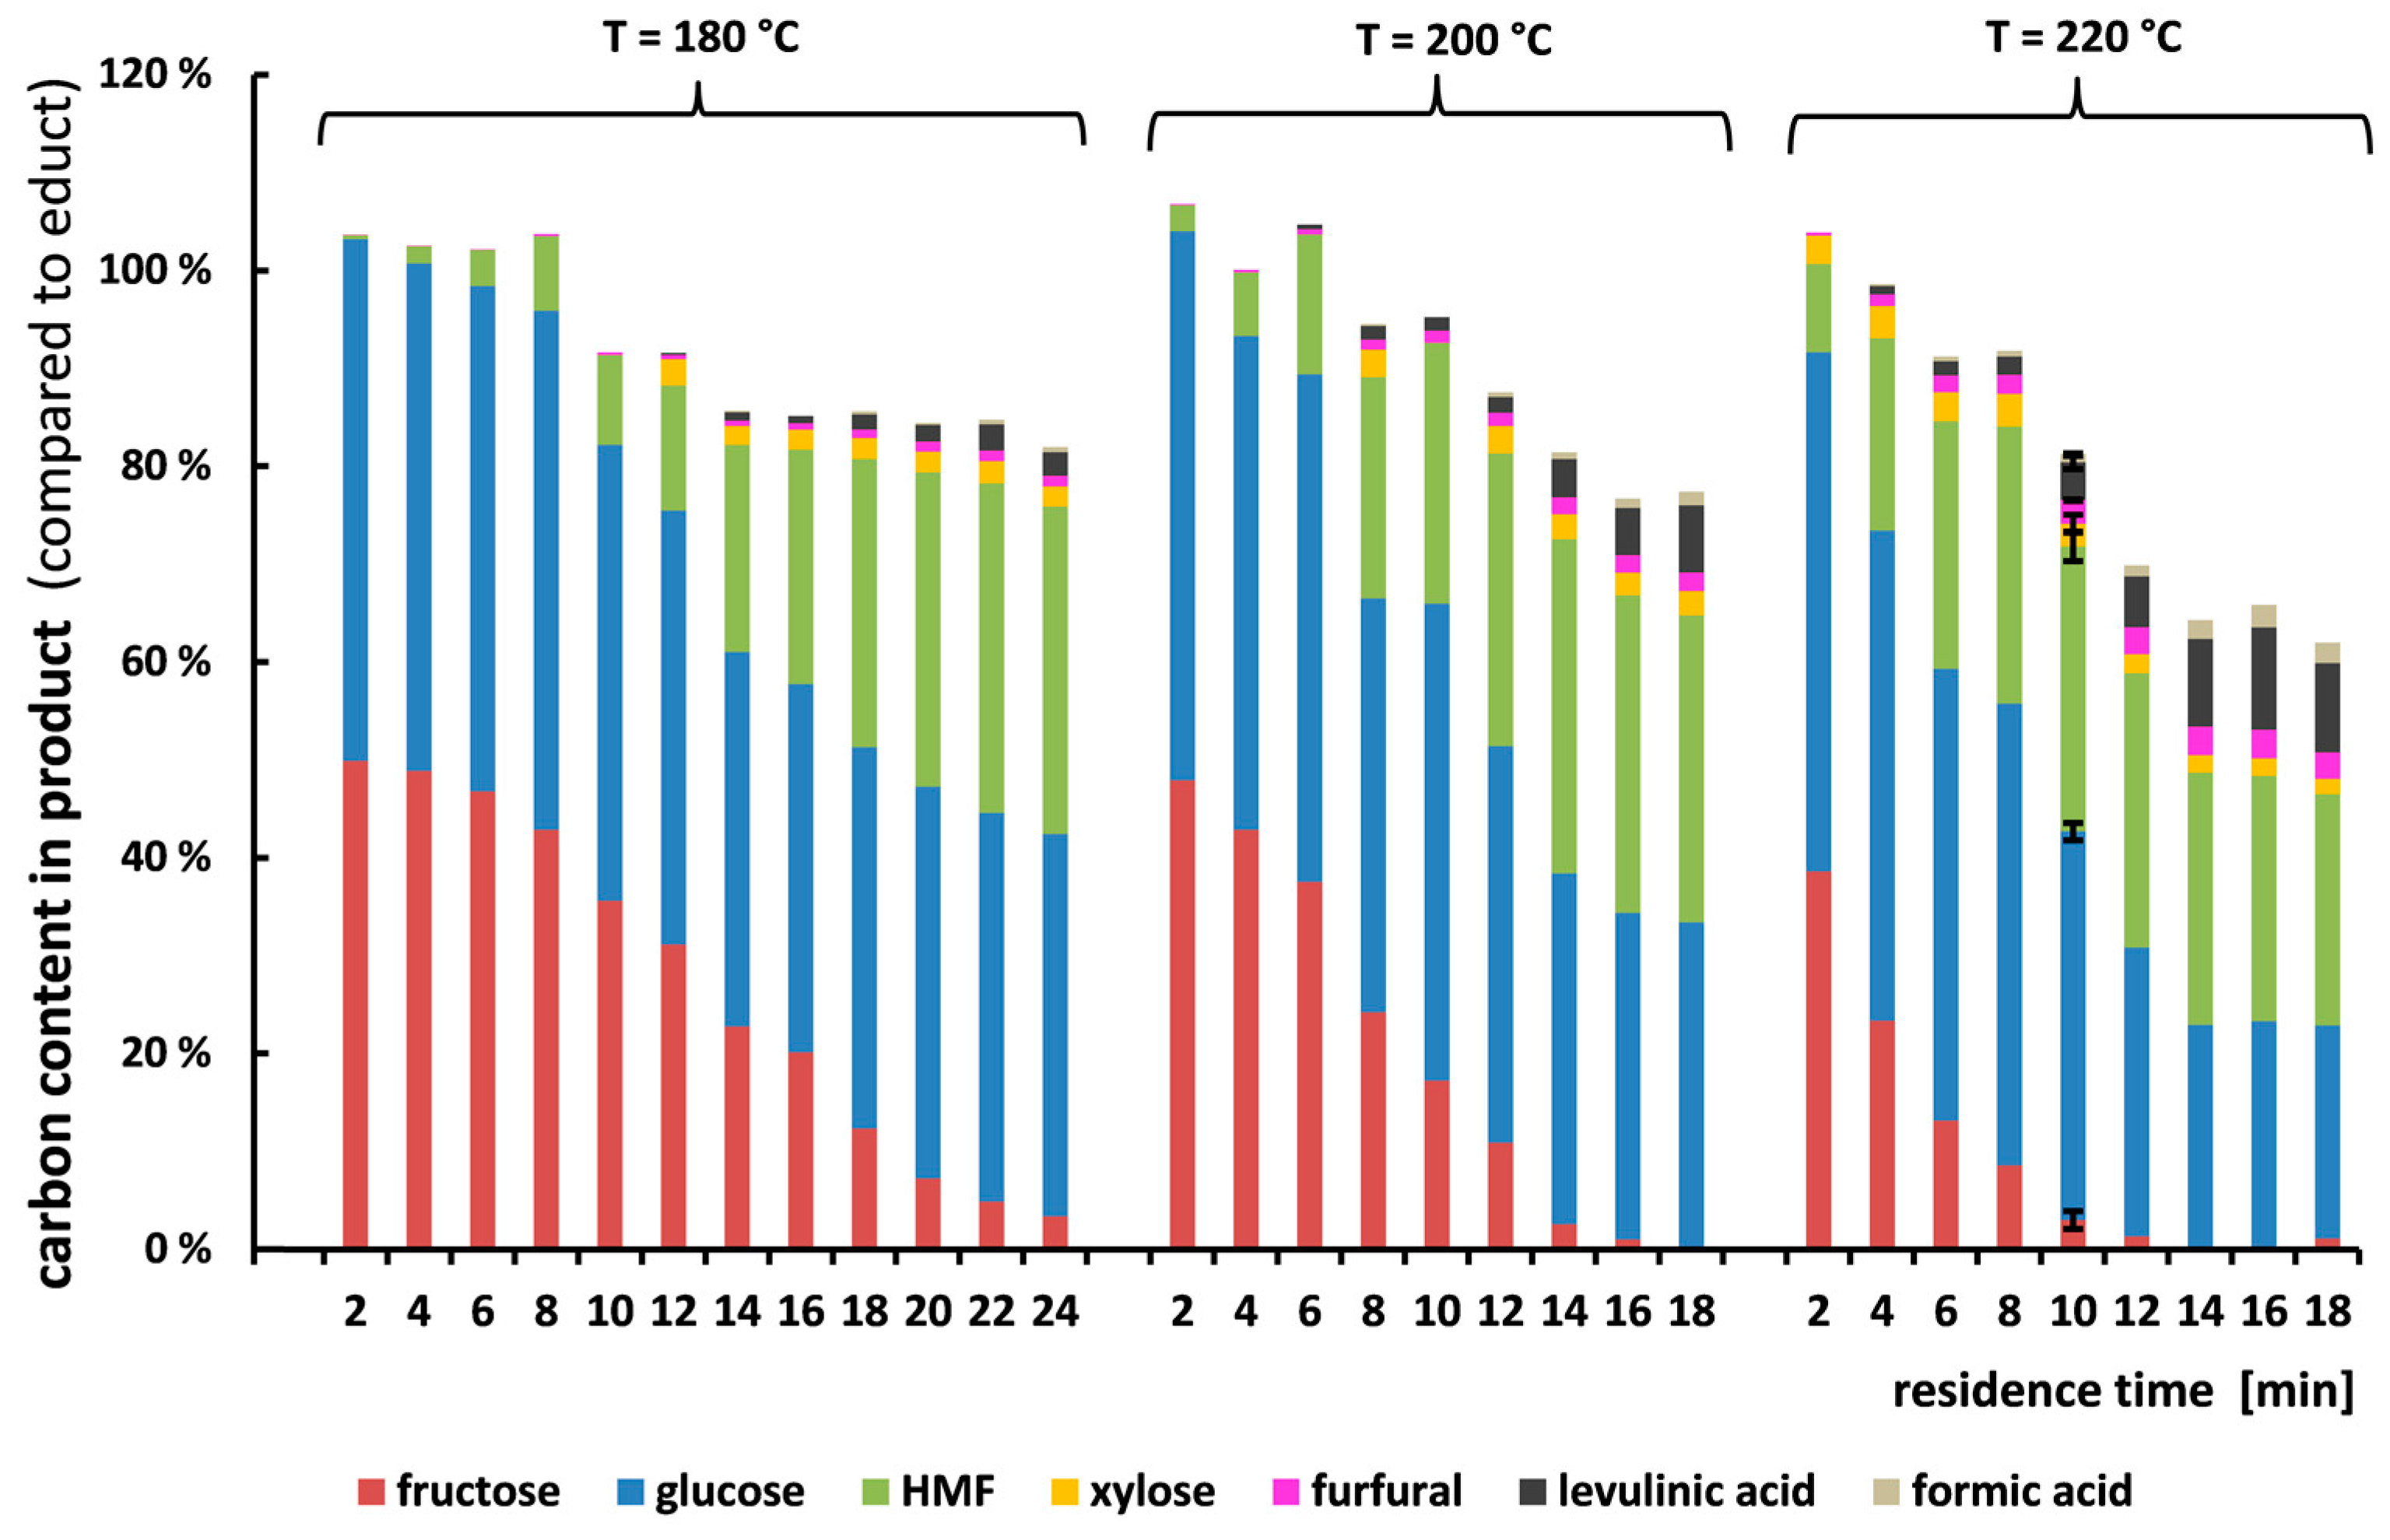
Figure 5.
Carbon composition after acid-catalyzed conversion of glucose, fructose, and sucrose at a residence time of 10 min and temperature of 220 °C. The column “50% glucose 50% fructose (theoretical)” shows a calculated 1:1 mixture of glucose and fructose. Feedstock contained 0.005 mol/L sulfuric acid and either 2 wt % sucrose, 1.05 wt % glucose, or 1.05 wt % fructose.

Figure 6.
Kinetic plots of the acid-catalyzed conversion of sucrose at different residence times and temperatures of (a) 180 °C, (b) 200 °C, and (c) 220 °C. The molar ratios measured yi,meas are shown as data points and molar ratios calculated yi as lines. ∑ SP accounts for the sum of SP1, SP2, and SP3, as defined in Figure 2. Feedstock contained 2 wt % sucrose and 0.005 mol/L sulfuric acid.

Figure 7.
Kinetic plots of the acid-catalyzed conversion of (a) glucose and (b) fructose at 10 min residence time at 220 °C. The molar ratios measured yi,meas are shown as data points, and molar ratios calculated yi as lines. ∑ SP accounts for the sum of SP1, SP2, and SP3, as defined in Figure 2. Feedstock contained 0.005 mol/L sulfuric acid and either 1.05 wt % glucose or 1.05 wt % fructose.

Figure 8.
Parity plot of the molar ratio measured yi,meas and the molar ratio calculated yi. The solid line though the origin has a slope of one. The dashed lines have a slope of one and are shifted by the standard derivation.
Figure 8.
Parity plot of the molar ratio measured yi,meas and the molar ratio calculated yi. The solid line though the origin has a slope of one. The dashed lines have a slope of one and are shifted by the standard derivation.


Table 1.
First-order reactions according to the model (see Figure 2), with their rate coefficients kn at different reaction temperatures.
Table 1.
First-order reactions according to the model (see Figure 2), with their rate coefficients kn at different reaction temperatures.
| Reaction | Rate Coefficient kn | at 180 °C [min−1] | at 200 °C [min−1] | at 220 °C [min−1] |
|---|---|---|---|---|
| fructose => HMF | k1 | 0.0525 | 0.116 | 0.241 |
| HMF => levulinic acid + formic acid | k2 | 0.0055 | 0.0114 | 0.0224 |
| fructose => xylose | k3 | 0.0033 | 0.0065 | 0.0123 |
| glucose => xylose | k4 | 0.0014 | 0.0027 | 0.0050 |
| xylose => furfural | k5 | 0.0642 | 0.111 | 0.185 |
| glucose => fructose | k6 | 0.0061 | 0.0116 | 0.0210 |
| fructose => SP1 | k7 | 0.0042 | 0.0047 | 0.0052 |
| HMF => SP2 | k8 | 0.0156 | 0.0347 | 0.0721 |
| glucose => SP3 | k9 | 0.0086 | 0.0094 | 0.0102 |
© 2018 by the authors. Licensee MDPI, Basel, Switzerland. This article is an open access article distributed under the terms and conditions of the Creative Commons Attribution (CC BY) license (http://creativecommons.org/licenses/by/4.0/).
Share and Cite
MDPI and ACS Style
Steinbach, D.; Kruse, A.; Sauer, J.; Vetter, P. Sucrose Is a Promising Feedstock for the Synthesis of the Platform Chemical Hydroxymethylfurfural. Energies 2018, 11, 645. https://doi.org/10.3390/en11030645
AMA Style
Steinbach D, Kruse A, Sauer J, Vetter P. Sucrose Is a Promising Feedstock for the Synthesis of the Platform Chemical Hydroxymethylfurfural. Energies. 2018; 11(3):645. https://doi.org/10.3390/en11030645
Chicago/Turabian StyleSteinbach, David, Andrea Kruse, Jörg Sauer, and Philipp Vetter. 2018. "Sucrose Is a Promising Feedstock for the Synthesis of the Platform Chemical Hydroxymethylfurfural" Energies 11, no. 3: 645. https://doi.org/10.3390/en11030645
Note that from the first issue of 2016, this journal uses article numbers instead of page numbers. See further details here.