Experimental Study of Matrix Permeability of Gas Shale: An Application to CO2-Based Shale Fracturing


Deep Earth Energy Laboratory, Department of Civil Engineering, Monash University, Building 60, Melbourne, VIC 3800, Australia
*
Author to whom correspondence should be addressed.
Energies 2018, 11(4), 702; https://doi.org/10.3390/en11040702
Submission received: 15 January 2018
/
Revised: 5 March 2018
/
Accepted: 16 March 2018
/
Published: 21 March 2018
(This article belongs to the Special Issue Unconventional Natural Gas (UNG) Recoveries 2018)
Abstract
:Because the limitations of water-based fracturing fluids restrict their fracturing efficiency and scope of application, liquid CO2 is regarded as a promising substitute, owing to its unique characteristics, including its greater environmental friendliness, shorter clean-up time, greater adsorption capacity than CH4 and less formation damage. Conversely, the disadvantage of high leak-off rate of CO2 fracturing due to its very low viscosity determines its applicability in gas shales with ultra-low permeability, accurate measurement of shale permeability to CO2 is therefore crucial to evaluate the appropriate injection rate and total consumption of CO2. The main purpose of this study is to accurately measure shale permeability to CO2 flow during hydraulic fracturing, and to compare the leak-off of CO2 and water fracturing. A series of permeability tests was conducted on cylindrical shale samples 38 mm in diameter and 19 mm long using water, CO2 in different phases and N2 considering multiple influencing factors. According to the experimental results, the apparent permeability of shale matrix to gaseous CO2 or N2 is greatly over-estimated compared with intrinsic permeability or that of liquid CO2 due to the Klinkenberg effect. This phenomenon explains that the permeability values measured under steady-state conditions are much higher than those under transient conditions. Supercritical CO2 with higher molecular kinetic energy has slightly higher permeability than liquid CO2. The leak-off rate of CO2 is an order of magnitude higher than that of water under the same injection conditions due to its lower viscosity. The significant decrease of shale permeability to gas after water flooding is due to the water block effect, and much longer clean-up time and deep water imbibition depth greatly impede the gas transport from the shale matrix to the created fractures. Therefore, it is necessary to substitute water-based fracturing fluids with liquid or super-critical CO2 in clay-abundant shale formations.
1. Introduction
Extensive shale gas extraction has greatly eased the pressure on the global energy supply [1], and hydraulic fracturing plays an indispensable and irreplaceable role in the commercial production of shale gas, because the ultra-low permeability of shale seriously hinders gas transport from the shale matrix to the production well, and the created fracture network, as a bridge between them, can greatly increase shale formation permeability [2,3]. Water-based fracturing fluids are currently used, but the combination of water and shale matrix with strong water imbibition results in severe formation damage. The softening effect caused by the imbibition of water can lead to strength reduction of fracture surfaces, and large deformation of fracture surfaces greatly reduces its self-propping potential and increases the embedment depth of proppants, which greatly compress the fracture width and may even close the fracture completely [4,5]. The imbibition of water into the shale matrix easily causes a blocking effect in tiny pore throats, which closes the channels for gas transport from the shale matrix to the created fractures [6]. The formation damage caused by injected water is more serious in clay-abundant shale formations, because the interaction between water and clay minerals can induce the swelling of clay minerals, which further reduces the porosity of pores and fractures [7]. In the light of other environmental concerns caused by water-based fracturing fluids, such as large water consumption and wastewater generation [8], hydraulic fracturing have been banned legislatively in some countries [9]. Therefore, a more suitable fracturing fluid should be considered for shale gas production, and the mixture of sand and liquid CO2 with its many unique advantages has been successfully applied in hydraulic fracturing [10,11,12]. Except of proppant effect of sand, the strong self-propping potential of the reservoir rock is also crucial to the success of CO2 fracturing, because the unfavorable proppant placement, due to the low proppant carrying capacity of CO2 caused by its low viscosity, restricts the fracture conductivity, while more complex and extensive fracture networks created by CO2 fracturing can counteract this disadvantage in shale formations with ultra-low permeability. Viscosity-modified CO2 can also be used to deliver proppants after the CO2 fracturing [13]. The advantages of CO2 mainly include its greater environmental friendliness and better fracturing efficiency.
In relation to environmental aspects, firstly, as a kind of non-aqueous fracturing fluid, the use of CO2 can greatly reduce the water consumption in shale gas production, especially for shale gas formations located in drought regions [14,15]. Consequently, no wastewater flows back after fracturing, which can mitigate the risk that underground water and surface water are contaminated, because fracturing wastewater contains hazardous substances, including high levels of salinity, toxic elements and radioactivity [16,17]. Secondly, due to the much greater adsorption capacity of CO2 than CH4 [18], injection of CO2 into shale formations can significantly promote the desorption process of CH4, and the substitution process provides a scientific basis for effective geological sequestration of CO2 in shale gas formations [19].
In terms of better fracturing efficiency, after the fracturing process, most of the injected CO2, in the injection well and the created fractures, will flow back to the surface, and this process takes only several hours or days instead of several years for water-based fracturing fluids [20]. The fast flow-back process with high recovery not only saves time and costs for gas production, but also makes it a reality to collect and recycle CO2 to the next fracturing stage, which can greatly reduce the cost of CO2 fracturing [21]. Another significant advantage of CO2 is that its low combination with the shale matrix leads to less formation damage which is common for water-based fracturing fluids.
The potential drawbacks of CO2 as fracturing fluid which limit its popularity include security concerns, high costs and high leak-off rates [22]. The higher cost than water is mainly associated with the difficulties in the capture and transport of CO2, but the market demand for CO2 storage and the shorter distance of power plants to shale gas formations greatly alleviate the cost pressures. The risk of CO2 leakage to operational staff requires much more strict operating standards and more secure fracturing equipment. In terms of the feasibility of fracturing using liquid CO2, the high leak-off rate of injected CO2 with ultra-low viscosity may threaten the development of fracturing pressure. Drawing lessons from the application of hydraulic proppant fracturing with highly viscosity in high permeable formations (10−12–10−14 m2) and slick water fracturing in low permeable formations (<10−15 m2) [23], the permeability of suitable shale formations for CO2 fracturing should be much lower than 10−15 m2. Considering that the permeability of shale gas formation is usually less than 10−17 m2 [24], the ultra-low permeability significantly reduces the leak-off rate of injected CO2 into the shale matrix, otherwise, the huge leak-off rate poses challenges to the fracturing equipment for a fast injection rate and sufficient injection volume. An accurate estimation of the leak-off of injected CO2 is crucial for fracturing design using CO2, and an understanding of the flow behavior of injected CO2 through the shale matrix is therefore a precondition for CO2 fracturing. The complicated thermodynamic properties of CO2 increase the difficulty of evaluating the apparent permeability to CO2 [25], and many other media, such as N2, water and He, have been used to measure the permeability of shale samples. The difference of flow behavior among different injected fluids may lead to the mis-estimation of the leak-off rate of injected CO2, especially for the permeability value measured using gas, where the Klinkenberg effect cannot be ignored [26,27]. The aim of this study is therefore to distinguish the difference between permeability values using different measure media and to find the most appropriate method for the estimation of CO2 leak-off, following a comprehensive set of permeability tests on shale samples.
2. Experimental Methodology
2.1. Samples Description
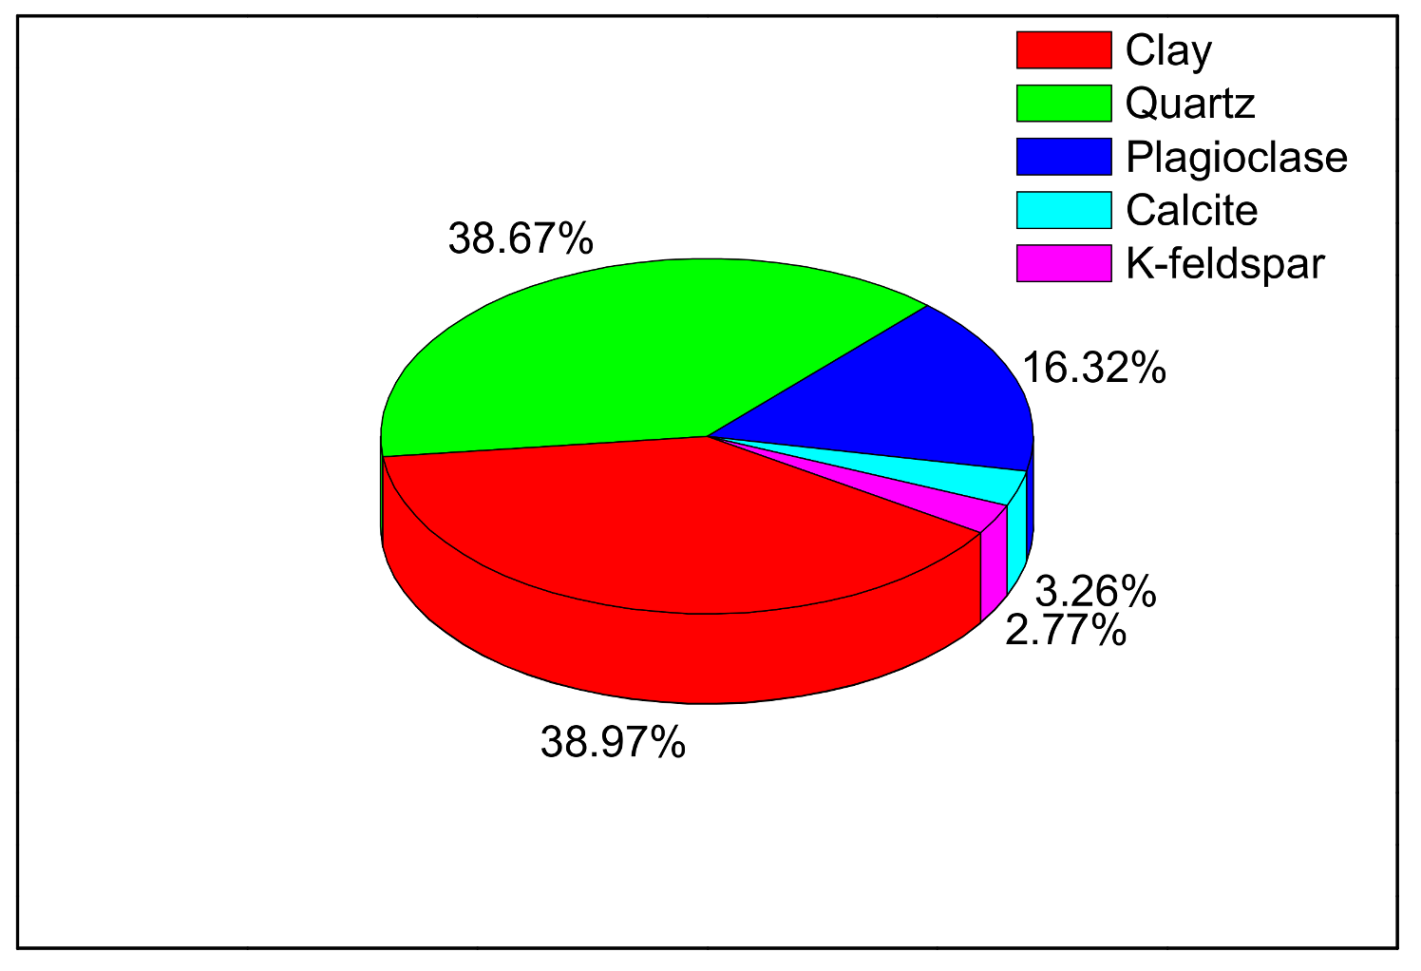
Shale outcrop samples were obtained from the Lower Cambrian Niutitang Formation, which is located in north-western Hunan Province, China [28,29]. According to X-ray diffraction analysis, the mineral composition of the tested samples mainly included quartz and clay minerals (see Figure 1). The density of sample was 2.20 g/cm3 and their porosity ranged from 0.3–1.3% with an average value of 0.65% [29]. There were none natural fractures in the tested samples, and only matrix permeability was investigated in this study. The pores encircled by mineral particles are of infinitesimally tiny size, because shale is mainly composed of fine-grained particles, and clogging and plugging of pore throats by tiny particles lead to many isolated holes and greatly reduce the connectivity of the pore structure. The low porosity and tiny pores are responsible for the ultra-low permeability of the shale samples.
2.2. Experimental Set-Up
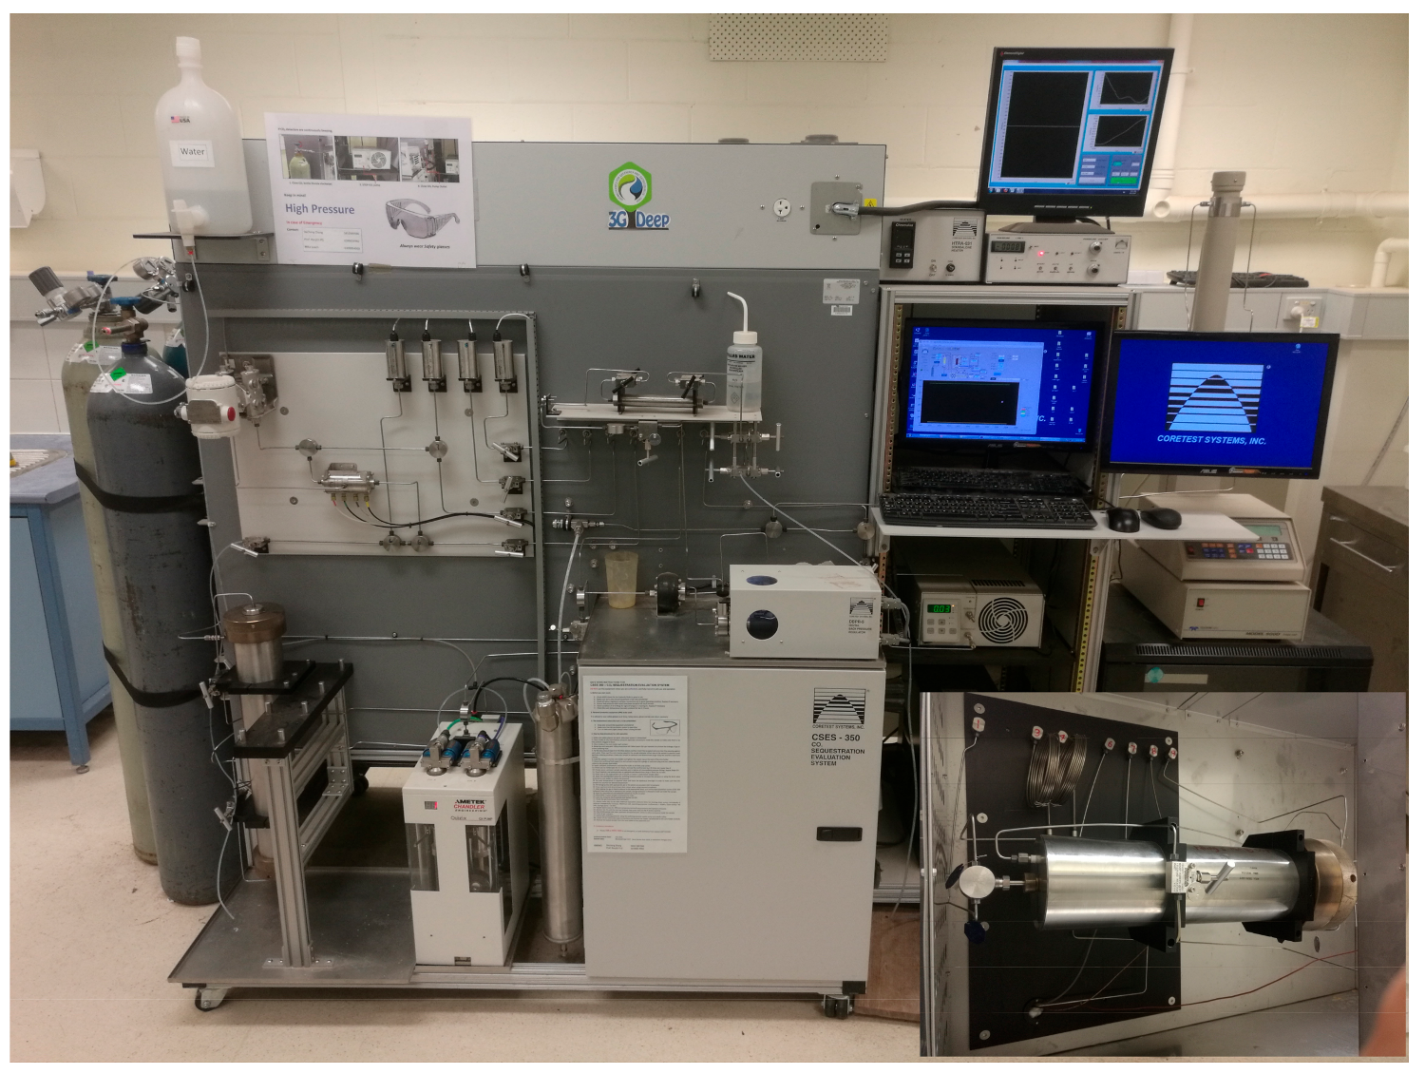
Due to the ultra-low permeability of the shale samples, a high precision core flooding set-up was used (see Figure 2). In order to reduce the measurement time, the length of shale samples is usually shorter than that of standard samples [30,31], in this study, the length is 19 mm, which is half the samples’ diameter. The cylindrical cores were placed into flexible Viton sleeves with the same diameter, both ends were covered by a pedestal and steel cap, respectively, and two clamps were used to tighten the pedestal and steel cap with the Viton sleeve to prevent any leakage of confining fluid into samples. The assembly was then inserted in the core holder and fixed, fluid was injected from one end of samples to the other. In order to simulate the shale samples under complicated geological conditions, the effects of confining pressure, temperature, injection pressure were considered [32]. The related sub-systems are explained in detail in the following section.
(1) Confining pressure. After installing the sample into the cell, distilled water was injected into the enclosed core holder using compressed air. Once the core holder was fully filled with water, the outlet was closed and a pump was used to provide the required confining manually. During the test, the confining fluid was reserved in the enclosed core holder to maintain the confining pressure. Although the confining pressure value was sensitive to the change of temperature of the core holder and sample deformation, the maximum variation of around 50 Psi recorded during tests was much lower than the confining pressure and can therefore be ignored. For the tests considering the effect of temperature, in order to avoid the effect of temperature variation on the confining pressure, the confining fluid remained in the core holder for at least 1 day before being heated to the oven temperature before applying confining pressure.
(2) Injection system. Different injection pump systems were used for water and gas injection. For water injection cases, a QX-6000 metering pump (Quizix, Broken Arrow, OK, USA) was used, controlled by the Quizix Pump Works Version 6.15 software, and the water injection rate was automatically recorded by the data acquisition system with an accuracy of 0.001 mL/min. For CO2 or N2 injection cases, a 500D syringe pump was used (Teledyne Isco, Lincoln, NE, USA), full scale of 25.86 MPa, with an accuracy of 0.1% FS for the pressure transducer and 0.01 mL/min for flow rate). In this study, both pumps were controlled to maintain a constant injection pressure.
(3) Temperature control. Because water, CO2 and N2 are sensitive to temperature variation, it is extremely important to maintain a stable temperature environment, including the room temperature and core holder temperature. The room temperature was maintained by high-powered central air conditioning at 22 °C, and the core holder temperature was controlled by a temperature-controlled electric oven. Two temperature transducers were placed in the core holder and oven to monitor the temperature change, and the recorded data showed that the temperature variation was less than 0.1 °C. In order to alleviate the influence of room temperature on the pressure transducers, most of the pressure tubing was located in the oven, and much longer injection tubes were rolled to guarantee that injected fluids were heated to the required temperature before being injected into shale samples.
(4) Flow meter. In the steady-state tests, a flowmeter (MilliGascounter®, MGC-1 V3.0, Ritter, Bochum, Germany) with a measuring accuracy of 3% and a measurement range between 1 mL/h–1 L/h was used to measure the extremely low flow rates of CO2 and N2 at downstream.
(5) Pressure transducers. For permeability tests, especially under transient conditions, the accurate recording of upstream and downstream pressures is crucial to the permeability calculation. Therefore, pressure transducers with an accuracy of 0.01% of reading were used to measure the gas pressure and confining pressure, and pressure values were recorded on Microsoft Excel spreadsheets.
2.3. Experimental Procedure
In this study, permeability tests under steady-state conditions and transient conditions were conducted, and the influences of effective stress, the Klinkenberg effect and the temperature effect were also considered. Moreover, since hydraulic fracturing using CO2 is currently used as a remedial method for unsuccessful fractured shale formations using water-based fracturing fluids, the influence of water flooding on the permeability of the shale matrix to gas is vital, not only for the leak-off of injected CO2 but also for shale gas production after fracturing.
2.3.1. Steady-State Conditions and Transient Conditions
Accurate quantitative determination of the permeability of fine-grained reservoir rock is quite difficult, and multiple laboratory methods based on different sample scales result in a wide range of permeability estimates [24]. Steady-state tests using water or gas are widely used to measure rock permeability due to their simplicity, while for samples from tight oil/gas reservoirs, especially for shale samples with permeability less than 0.01 mD, the extremely low flow rate through the sample challenges the measurement accuracy, non-steady-state tests are therefore commonly used for shale samples. While the investigation of the difference between steady-state tests and non-steady-state tests is seldom for shale samples. Therefore, the influence of different methodologies on permeability measurement was also investigated in this study.
In the steady-state tests with atmosphere pressure (0.1 MPa) at downstream, the influence of stress condition on shale permeability to CO2 was investigated under a series for a series of confining pressures (Pc = 10, 20, 30 and 40 MPa) and injection pressures (1–7 MPa at Pc = 10 MPa, and 2–16 MPa at Pc = 20–40 MPa). For each injection case, the development of flow rate with time was recorded and the injection pressure was increased to the next value when the flow rate reached steady-state condition. Similarly, the confining pressure was increased from 10 MPa to 40 MPa. The permeability testing using N2 was conducted as a contrast test only at Pc = 40 MPa after CO2 injection in order to avoid the influence of stress fatigue.
Under the transient conditions, permeability testing under the same stress conditions as steady-state conditions was conducted. In real shale formations, the injected CO2 is in supercritical state due to the high temperature in deep shale formations. The effect of temperature on the flow behavior of CO2 is therefore crucial to the leak-off rate of injected CO2 and this was investigated under transient conditions, because supercritical CO2 cannot be present at low pressure around downstream under steady-state conditions. The temperatures considered were at room temperature (22 °C), 35 °C and 45 °C, and the temperature effect was also only investigated at confining pressure of 40 MPa. For transient methods, the accuracy of calculated permeability depends on two prerequisites: the quantification and leakproofness of the downstream volume. Preventing leakage from the downstream volume is crucial, because even a very small leak can seriously influence the pressure development at downstream. A trial test was therefore done by checking the pressure change after closing all valves at upstream and downstream when the downstream pressure reached equilibrium under transient conditions. The downstream volume was calculated by analyzing the development of downstream pressure after closing the downstream valve at a stable flow rate under steady-state conditions.
2.3.2. Effect of Water Flooding
In the light of the blocking effect of water flooding on matrix permeability and the dominant application of water-based fracturing fluids in shale gas enhancement, the investigation of the flow behavior of water through the shale matrix and the flow behavior of gas after water flooding are therefore significant to compare the feasibility of water- and CO2-based fracturing fluids. After the last N2 injection case in the steady-state tests, water was injected into the sample at the same injection pressure of 16 MPa. During the water flooding process, the downstream was open to the atmosphere, and the sample was regarded as fully saturated when water appeared at downstream after nearly 3 days, and the entire process of water flooding lasted for 7 days. Shale’s permeability to water can be regarded as its intrinsic permeability and was used in contrast to the flow behavior of gas. After the water flooding process, N2 was injected again to check its flow capacity through the shale matrix at 16 MPa. During the fracturing and production processes, the pore pressure in the shale matrix evolves within a wide range, and a series of injection pressures of water and N2 ought therefore to be conducted. However, due to the extremely long time required for shale samples, only the injection pressure of 16 MPa was considered in this study.
3. Comparison of Permeability between Steady-State and Transient Conditions
The main objective of this study was to estimate the leak-off rate of injected CO2 into shale formations, which depends on the permeability values of reservoir rock. Steady-state and transient methods are currently used to measure matrix permeability, and distinct difference in results between the two methods increase the difficulty of evaluating the CO2 consumption and injection rates. An accurate calculation of permeability to CO2 is therefore crucial for CO2 fracturing by analyzing the difference between steady-state and transient methods.
3.1. Permeability Testing under Steady-State Conditions
Due to the ultra-low permeability of the shale matrix, the downstream flow rates reached steady-state condition slowly, and the development of flow rates of CO2 and N2 with time at the confining pressure 40 MPa is shown in Figure 3. The time to steady state for each CO2 injection case is in the magnitude of hours, and with the increase of injection pressure, the higher pressure gradient along the sample leads to a higher flow velocity. Meanwhile the lower compressibility of CO2 at higher pressure results in quicker pressure evolution and higher flow velocity accelerates this process, and the time for each injection case with the same increasing range of 2 MPa therefore decreased. For example, the time decreased from 7 h at injection pressure of 4 MPa to 3.7 h at 6 MPa, while the time decreased significantly when the injection pressure was in liquid state with much lower compressibility, and the time further decreased to 1.8 h at 14 MPa. For N2 injection cases, its lower viscosity can speed up to a steady state when the injection pressure is higher than 6 MPa, the time required for the pressure equilibrium state of N2 is much shorter than CO2. Interestingly, when the injection pressure is lower than 6 MPa, the viscosity of N2 is slightly higher than that of gaseous CO2, but the pressure equilibrium time for N2 is still much shorter than CO2. This is possibly due to the higher adsorption capacity of CO2, because the flow channels for CO2 are squeezed by the thin adsorption layer [33], which can reduce the flow capacity for CO2 in the shale matrix with many of tiny pore throats. For example, the flow rates for CO2 at 2 MPa and 4 MPa were 0.018 L/h and 0.0649 L/h, respectively, which are lower than the 0.0226 L/h and 0.0807 L/h for N2. Overall, the average time for N2 injection cases was around 15–30% of that for CO2, and the permeability value calculated using N2 may exaggerate the leak-off of injected CO2.
The steady-state flow rates for CO2 and N2 are shown in Figure 4, which indicates that the variation trend of flow rates with injection pressure is different for the two gases. For CO2 injection cases, there is a quadratic growth with injection pressure when the injection pressure is lower than 6 MPa, because CO2 is in the gaseous state with nearly constant viscosity, and according to Darcy’s law for gas, its flow rates are not only directly proportional to the pressure gradient along the sample but also to the gas density, which is proportional to the gas pressure. The quadratic increment with injection pressure testifies that the flow behavior of gaseous CO2 through the shale matrix belongs to laminar flow (see Equation (1)). The same phenomenon also appears for gas N2 injection cases when the injection pressure is between 2 and 16 MPa. However, the variation trend for CO2 injection cases changes when the CO2 injection pressure is higher than 6 MPa, and according to Figure 4, there is a nearly linear relationship between flow rate and injection pressure instead of a quadratic relationship when CO2 is injected in liquid state at upstream. This is because the nearly linear relationship between CO2 density and pressure is invalid for liquid CO2, which has a relatively stable density, and according to Darcy’s law, the CO2 flow rate in the liquid state is proportional to the pressure gradient, and the presence of liquid CO2 is therefore responsible for the linear increase of flow rate instead of the quadratic increase for N2. Due to the phase transition of CO2, the leak-off rate of injected CO2 at higher pressure mainly depends on its flow behavior in the liquid phase, which is much lower than the value calculated for the gaseous phase. For example, at a confining pressure 40 MPa, the flow rate of N2 is slightly higher than that of CO2 when the injection pressure is between 2 MPa to 6 MPa. With the increase of injection pressure to 8 MPa and 10 MPa, the flow rates of CO2 overtake that of N2, because a portion of the sample around upstream is filled by liquid CO2 with higher density, which enhances the flow rate of CO2. When the injection pressures are higher than 12 MPa, the length of existence of liquid CO2 along sample increases, the higher density of CO2 should endow it with higher flow rate than N2. However, strangely, the flow rates of N2 overtake that of CO2 again and the difference between their flow rates further increases with the increase of injection pressure. This indicates that the permeability to liquid CO2 is much lower than that of gaseous CO2 and the linear increase of leak-off of CO2 with injection pressure is within a controllable range and acceptable for fracturing operations.
Besides the effect of injection pressure on the flow rates of CO2, the effect of confining pressure is also obvious. According to Figure 4, with the increase of confining pressure, the flow rate decreases due to the compression of flow channels under higher confining pressure, while the deformation resistance of flow channels is also enhanced, which leads to the slowing of the decrease of flow rate with confining pressure. For example, at an injection pressure of 4 MPa, the flow rate at 10 MPa confining pressure is 0.1643 L/h, and decreases by 33.0%, 53.1% and 60.5% at 20 MPa, 30 MPa and 40 MPa.
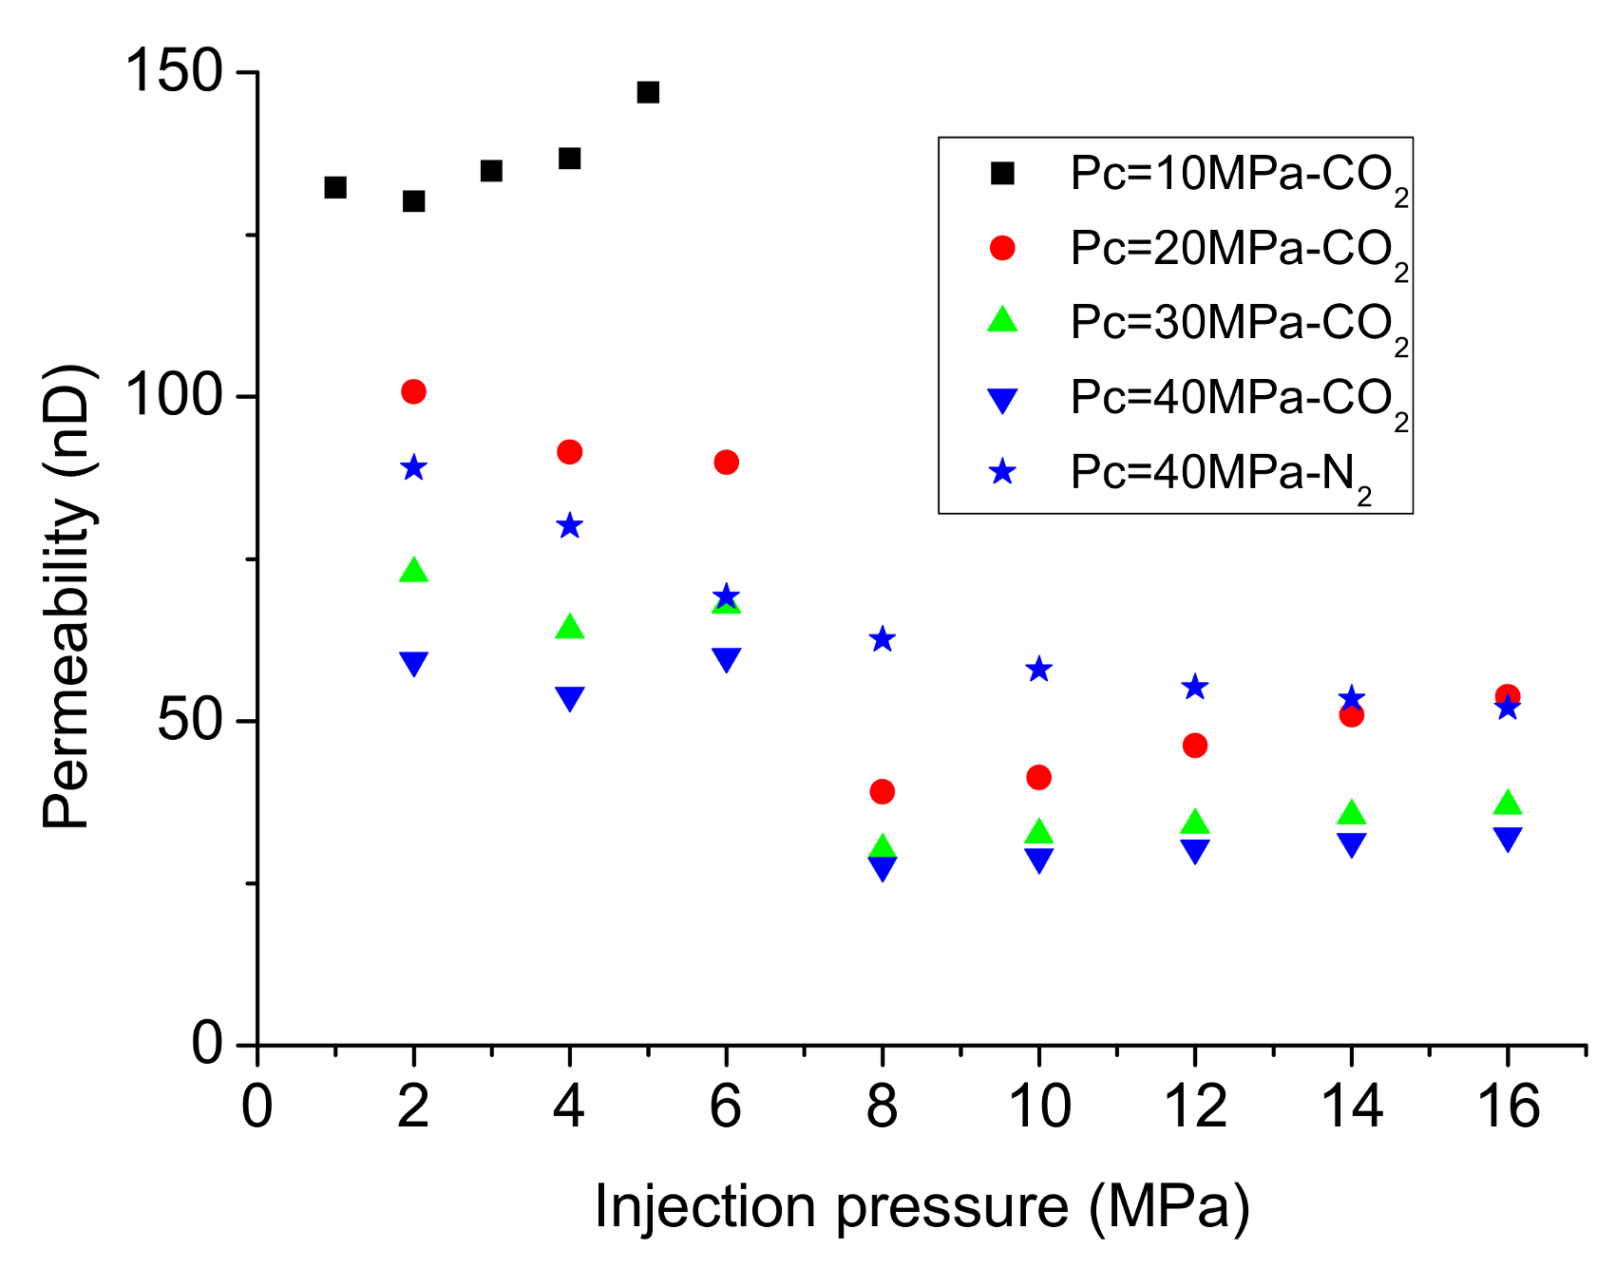
The permeability of the shale matrix to gaseous CO2 and N2 was calculated using Poiseuille’s equation based on Darcy’s law for laminar flow of a compressible gas through a porous material (see Equation (1)) [34]. Due to the co-existence of gaseous and liquid CO2 along the sample when the injection pressure is higher than the liquefaction point at 6 MPa, Darcy’s law is only suitable for gaseous CO2 injection cases less than 6 MPa, and the permeability for liquid CO2 was calculated using the method proposed by Zhang et al. [25] (see Equations (2) and (3)). Figure 5 shows the calculated permeability to CO2 and N2, and that the permeability of N2 decreases with the increase of injection pressure due to the Klinkenberg effect [26]. Based on the fitting formula of Klinkenberg effect in Equation (4), it is speculated that the Klinkenberg parameter b for N2 injection is around 1.67 MPa, and the permeability to liquid kl is 47 nD. The great difference in permeability between gas and liquid in Equation (4) explains the suddenly decrease of permeability to CO2 from 59.92 nD at 6 MPa to 27.70 nD at 8 MPa injection pressure under 40 MPa confinement. The opposite trend of permeability with injection pressure indicates the dominant influence of the Klinkenberg effect and effective stress in gaseous and liquid sections, respectively. Interestingly, unlike the continuous decrease of permeability to N2 with the increase of injection pressure, the variation of permeability to gaseous CO2 is much more complicated (see Figure 5). The density of gaseous CO2 under high pressures is higher than the predicted value for ideal gas, which is responsible for the higher apparent permeability to CO2 at 6 MPa injection pressure than that at 4 MPa injection pressure. The much lower effective stress at 10 MPa confining pressure can accelerate the increase of permeability to CO2 at the injection pressure between 2 MPa and 6MPa. The permeability value for liquid CO2 at 16 MPa injection pressure is 32.25 nD is slightly lower than the intrinsic permeability of N2, because all the permeability results calculated under steady state conditions for N2 injection cases are over-estimated due to the Klinkenberg effect around downstream:
where, kg is the permeability for gas (m2), Qo is flow rate at downstream (m3/s), μ is gas viscosity (ΜPa·s), L and A are the length (m) and cross-sectional area of specimen (m2), and Po and Pi are downstream pressure and upstream pressure (MPa):
where, Ll is the length of liquid CO2 in the sample (m), Lg is the length of gas CO2 in the sample (m), Q6 is the flow rate at 6 MPa injection pressure (m3/s), kl is the permeability for liquid CO2 at a certain injection pressure (>6 MPa) (m2), Ql is the liquid CO2 flow rate at liquefaction point (m3/s), μl is the viscosity of liquid CO2 at room temperature (ΜPa·s), Pt is pressure at liquefaction point and here it equals 6 MPa (MPa), and Pi is upstream pressure (MPa):
where, kg and kl are the permeability to gas and liquid (m2), c is a constant, r is pore radius (m), l is mean free path of CO2 molecules (m), κ is Boltzmann’s constant (MJ·K−1), T is gas temperature (K), P is gas pressure (MPa) and b is the Klinkenberg slip factor (MPa).
3.2. Permeability Testing under Transient Conditions
Due to the lack of consideration of the Klinkenberg effect in the traditional Darcy’s law for steady-state tests in Equation (1), the accuracy of permeability results is unconvincing. Therefore, in order to obtain the accurate evolution of permeability with pore pressure, the pressure difference between upstream and downstream should be controlled to within a small range, which can be realized under transient conditions or by controlling the back-pressure at downstream. In this study, transient tests were conducted to measure the permeability to CO2 at different pressures. The permeability values were calculated using Equations (5) and (6) [35], where a pressure difference between upstream and downstream less than 0.2 MPa is adopted to reduce the influence of pore pressure on permeability:
where, α is the decay exponent (s−1), ΔP0 is the initial pressure difference between upstream and downstream (MPa), which equals 0.2MPa, ΔP(t) is the pressure difference between upstream and downstream with time (MPa), k is the permeability to CO2 (m2), β is the CO2 compressibility(MPa−1), Vdown is the volume of the downstream reservoir (m3), μ is the CO2 viscosity (ΜPa·s), and L and A are the length (m) and cross-section area (m2) of the sample, respectively.
Figure 6 shows the development of downstream pressure with time at the injection pressure of 2 MPa. Unlike the stable pressure gradient under each steady-state condition, the pressure gradient under transient conditions decreases with time. Much slower flow rates under transient conditions significantly extended the time for pressure equilibrium to be reached. It took around 80 h and 16 h to reach pressure equilibrium at 2 MPa and 16 MPa injection pressure respectively at 40 MPa confining pressure, which are much longer than 12.5 h and 1.8 h under steady-state conditions, and the faster pressure equilibrium process at higher injection pressure is because of lower compressibility.
The permeability under transient conditions is shown in Figure 7, which demonstrates the opposite trend of permeability evolution with injection pressure at different phases, which is similar to that under steady-state conditions. At 40 MPa confining pressure, the permeability decreased from 54.79 nD at 2 MPa injection pressure to 15.47 nD at 6 MPa injection pressure, while it started to increase from 12.77 nD at 8 MPa injection pressure to 27.24 nD at 16 MPa. The slightly upward trend of permeability with injection pressure for liquid CO2 is related to the decrease of effective stress, and the permeability at 8 MPa is around 12.77 nD, which can be considered as the intrinsic permeability of the shale matrix at confining pressure of 40 MPa because the influence of pore pressure is minimal at 8 MPa injection pressure for liquid CO2. In the gaseous phase, the significant decrease of permeability is due to the Klinkenberg effect. According to Equation (4), the Klinkenberg parameter is around 6.75 MPa when the liquid permeability is assumed to be 12.77 nD, and the parameter is much higher than that under steady-state conditions, which indicates the Klinkenberg effect is severely under-estimated under steady-state conditions, because the permeability for each injection case is over-estimated due to the presence of the Klinkenberg effect at low pore pressure. During the hydraulic fracturing process in target shale formations, the leak-off rate of CO2 mainly occurs under the pressure difference between the injection pressure and the pore pressure, and the pressure gradient decreases with the increase of leak-off distance. The circumstances of CO2 leak-off are similar to those of the permeability test under transient conditions where the CO2 is in liquid phase, and the Klinkenberg effect is non-existent in this process, and the higher leak-off rate based on the flow behavior of gaseous CO2 under steady-state conditions can exaggerate CO2 consumption and the injection rate during the fracturing process.
4. Effect of Temperature
The temperature in shale formations increases with depth from the surface, and the average geothermal gradient is about 25–30 °C/km [36]. Assuming the surface temperature is 15 °C, the temperature of gas shale located 1 km deep equals around 40 °C and reaches 65 °C at 2 km deep. During the fracturing process, the heat exchange between liquid CO2 and the rock matrix can quickly increase the temperature of CO2 and exceeds its critical temperature at 31.1 °C, and the phase of CO2 therefore converts to super-critical state from sub-critical state in the target shale reservoirs [37]. The properties of super-critical CO2 are between gas and liquid state, and it behaves likes gas with low viscosity while it has a density like that of the liquid state [38]. Since the lower viscosity of super-critical CO2 indicates higher penetrability compared with sub-critical CO2, but also a higher leak-off rate, the investigation of the flow behavior of super-critical CO2 is therefore crucial for fracturing operations.
A comparison of the flow behavior of CO2 in the shale matrix among different phases was investigated under different injection pressures and test temperatures. Three temperatures were considered: room temperature (22 °C), 35 °C and 45 °C. CO2 transfers into supercritical state when its pressure and temperature exceed 8.31 MPa and 31.1 °C, respectively. According to Figure 8, when the CO2 is in the gaseous state with injection pressure less than 8MPa, the effect of temperature on permeability is very slight and the permeability at 35 °C and 45 °C is almost the same as that at room temperature. With the increase of injection pressure, the phase of CO2 transfers from gaseous to liquid or supercritical state, and the permeability slightly increases with the temperature. For example, with the increase of temperature from 22 °C to 35 °C and 45 °C, the permeability at 16 MPa injection pressure increases from 27.24 nD to 35.01 nD and 33.17 nD, respectively. The reason for the increase of permeability with temperature is possibly due to the greater molecular kinetic energy of CO2 at higher temperatures. According to Klinkenberg [39], the slip flow effect between gas molecules and solid walls increases the matrix permeability to gas, because a relatively higher frequency of collisions between gas molecules and solid walls results in an additional flux around the wall surface. Theoretically, the slip flow effect only happens in the gaseous state and not the liquid state. However, the basic behaviors of super-critical CO2 are similar to those of gaseous CO2, the collisions between the CO2 molecules in super-critical state and the pore walls are stronger than those in sub-critical state, and the possibly slight slip flow effect takes place around the wall surface. Therefore, super-critical CO2 has greater penetration capacity through shale matrix than sub-critical CO2 [40]. Another reason for the greater permeability to super-critical CO2 may be that its lower viscosity endows it with higher penetration capacity even through tiny pore channels which are not available for liquid CO2.
The much lower viscosity and the higher permeability to CO2 than water can lead to serious leak-off into the shale formation, which means that much higher pump rate is needed to maintain and increase the injection pressure. Therefore, an understanding of the total fracturing fluid leak-off rate is one of the most important indices in fracturing design using CO2, especially in relation to the total volume or weight of fracturing fluids. The permeability of shale matrix to water is valued 22.10 nD which is measured in Section 5 at 16 MPa injection pressure, and the permeability to liquid CO2 is valued at the same injection pressure at room temperature, according to Equations (7) and (8), the ratio of the leak-off rate in volume of CO2 and water is around 14.03, and the ratio in weight is around 12.62. With the increase of penetration distance, the penetration distance of CO2 is much higher than that of water due to lower viscosity, and a lower pressure gradient for CO2 injection can reduce its leak-off rate, which indicates that the ratio of the leak-off rate between CO2 and water is over-valued. Considering the much higher leak-off of injection CO2 into shale formations, fracturing equipment with higher injection rates and carrying capacities are therefore necessary.
Due to the slightly higher permeability to super-critical CO2, the ratio of the leak-off rate in the volume of CO2 and water increases from 14.03 to 23.19. While the lower density of super-critical CO2 can restrain the leak-off rate in mass, the ratio only slightly increases from 12.62 to 17.62:
where, Qc and Qw are leak-off rate in volume of CO2 and water under the same conditions (m3/s), respectively, RQ is their ratio, and μw and μc are the viscosity of CO2 and water (ΜPa·s), respectively.
where, RW is the ratio of leak-off rate in weight of CO2 and water under the same conditions, ρc and ρw are the density of CO2 and water (kg/m3), respectively.
5. Effect of Water Flooding
Water-based fracturing fluids are currently used to enhance shale gas productivity, but the low recovery of fracturing water results in large volumes of residual water in shale reservoirs [41], which leads to serious formation damage to the flow capacity of both the shale matrix and the created fractures. In a shale matrix with ultra-low permeability, the effect of water blocking dominates the decrease of flow capacity to gas [6,42]. Since the decreased permeability in the damaged zone can decrease the gas transport between the shale matrix and fractures, understanding of the gas flow behavior considering water flooding is therefore crucial in order to appraise fracturing efficiency.
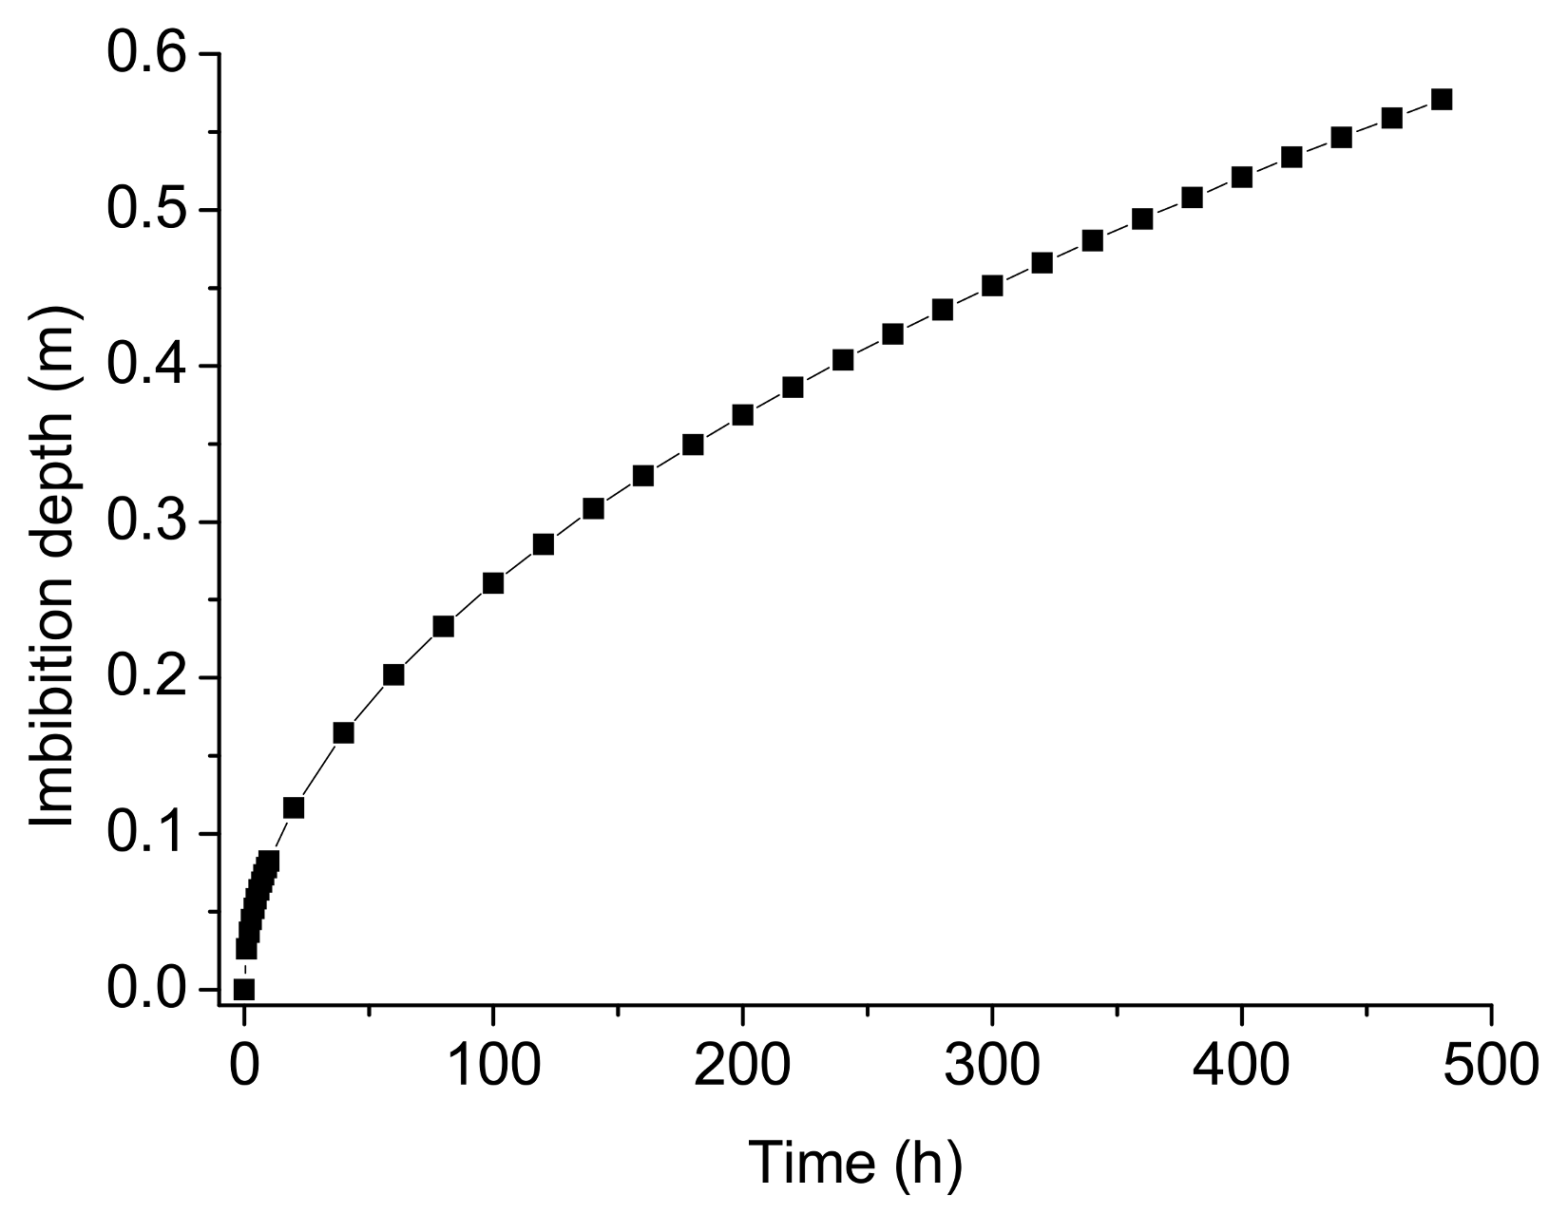
The intrinsic permeability of the shale matrix can be approximately measured by fluid water, which can avoid the presence of the slip flow effect for gas. After the flow behavior through shale matrix settled down and the calculated apparent permeability to water flow was 22.10 nD at 16 MPa injection pressure, the permeability was much lower than that for CO2 or N2, which indicates that the influence of the slip flow effect of gas in shale cannot be ignored. During the hydraulic fracturing process, high-pressure water at up to 100 MPa is injected into the shale formation, and an amount of residual water is imbibed into shale matrix. In order to investigate the effect of water flooding on the flow capacity of the matrix to gas, N2 was injected into the saturated sample again at 16 MPa injection pressure. The flow rate is shown in Figure 9, after injection lasting 20 mins, the first flow rate data were recorded, and the flow rate slowly increased with time. The flow rates equaled 0.0469 L/h, 0.0819 L/h and 0.1336 L/h after 24, 72 and 240 h, which are much lower than the flow rate of around 0.7830 L/h before water flooding. The effect of water blocking greatly decreases the flow capacity of gas from the shale matrix to fractures, and although after a long clean-up time of several years in shale formations, the flow capacity can be recovered to some extent, the long-term recovery process greatly reduces shale gas production efficiency. Based on the permeability data, the depth of the formation damage zone can be calculated by Equations (9)–(11), where the imbibition rate decreases with the increase of imbibition distance, due to the decreased pressure gradient, and the ratio between nominal water velocity through the whole transverse section and through pore channels in the shale matrix is assumed to be the shale porosity (the porosity of the tested shale samples was assumed to be 1.3% [29]), because water flows only through the pore system instead of the whole cross-section. According to Equation (11), there is a linear relationship between imbibition distance and the square root of the time, if the pressure difference is assumed at 50 MPa which is roughly equal to the breakdown pressures in an Eagle Ford horizontal well [43], the advance of imbibition distance with time is shown in Figure 10. The imbibition distance can reach 26.1 mm in the first hour and 127.6 mm in the first day, and up to 570.1 mm after 20 days. Even after the fracturing process, a substantial volume of residual fracturing water is left in the created fractures and the imbibition distance can be further advanced due to the high capillary pressure in the shale matrix. Considering the much longer imbibition distance and lower pressure gradient of gas in the formation damaged zone than the tested samples, the cleaning process must be significantly slower than that of the tested sample. The depth of the formation damage zone is around 570 mm, which is 30 times that of the tested sample, and the pressure difference is assumed to be around 1 MPa, which is only 1/16 that of the tested sample. According to Equation (11), for the stored gas in the undamaged zone to flow through the damaged zone to the created fractures, it takes at least 200 days, without considering any permeability change in the damaged zone. Conservatively assuming the condition that the cleaning time is inversely proportional to the pressure gradient and is proportional to the imbibition distance, the recovery rate of permeability in the formation damaged zone is only 1/480 of that in the tested sample. The permeability in the formation damaged zone only recovers to only 7.74% and 11.69% after gas production of 2 years and 5 years, respectively. Years of clean-up period greatly reduce the hydraulic fracturing efficiency and inhibit gas production [20]. This indicates the necessity of the application of non-water fracturing fluids in fracturing, especially for shale formations with ultra-low permeability and abundant clay content, as liquid CO2 with ultra-low viscosity has stronger penetrability through the shale matrix and the effect of water blocking may be negligible.
After the fracturing work using liquid CO2, most CO2 flows back to the surface, and the flow-back process can also push the residual water towards the surface and further reduce the formation damage [44]. However a considerable portion of CO2 leaks-off to the shale matrix and is absorbed in tiny pores, and its greater adsorption capacity can easily replace adsorbent methane and promote natural gas production [19,45]. In addition, the significant reduction of permeability in the damaged zone greatly restricts gas transport between the shale matrix and the created fractures, suggesting that fluids with higher viscosity can also be considered to be injected into the formation after CO2 injection for the CO2 sequestration projects in depleted shale gas formations. This would improve the feasibility of geological storage in these formations and ease misgivings that injected CO2 in the shale matrix can leak-off through created fractures:
where, u(t) is the nominal water velocity through the whole transverse section (m/s), k is the apparent permeability for water (m3), ΔP is the pressure difference between the fracture and the advancing edge of water flow (MPa), μ is the viscosity of water (1 × 10⁻⁹ ΜPa·s) and L(t) is the distance of water imbibition through the shale matrix (m):
where, ν(t) is the water velocity through the pore structure in the shale matrix (m/s), which is the differential coefficient of the distance of water imbibition, and φ is the shale porosity:
6. Conclusions
Considering the various unfavorable features of water-based fracturing fluids, CO2 with its many advantages has been considered as an alternative. However, the high leak-off of CO2 into the shale formation during hydraulic fracturing hinders its large-scale application in unconventional gas exploitation. The flow behavior of injected CO2 through the shale matrix was therefore investigated in this study. A series of permeability tests was conducted on shale samples using water, CO2 and N2 considering the influencing factors, confining pressure, injection pressure, temperature, water flooding and different drained conditions. Based on the experimental results, several conclusions can be drawn as follows:
- (1)
- Although the viscosity of N2 is slightly higher than that of gaseous CO2 when the injection pressure is lower than 6 MPa, the flow rates for N2 are higher than that for CO2 and the pressure equilibrium time for N2 is much shorter than CO2. This is possibly due to the higher adsorption capacity of CO2, because the flow channels for CO2 are squeezed by the thin adsorption layer, the shale permeability to gaseous CO2 measured using N2 is therefore over-valued.
- (2)
- In permeability tests using CO2 under steady-state conditions, phase transition can greatly influence the flow behavior of CO2, and the linear relationship between flow rate and injection pressure under high injection pressures indicates that the permeability to liquid CO2 is much lower than that to gaseous CO2. Permeability tests under transient conditions can successfully avoid the influence of the Klinkenberg effect at low pressure on higher injection pressures, and are more suitable for the hydraulic fracturing. The permeability for liquid CO2 under transient conditions is close to that for water, which can be regarded as the intrinsic permeability of the shale matrix.
- (3)
- The high temperatures of shale formations transform the injected CO2 into super-critical state, possibly due to the higher molecular energy, and the collisions between CO2 molecules and pore walls promote its flow rate, leading to a slightly higher permeability at higher temperatures. The lower density of super-critical CO2 can reduce the leak-off rate in terms of mass, while in contrast, its lower viscosity and higher permeability promote the leak-off rate in volume and dominate the effect of temperature on its leak-off. For example, leak-off in terms of mass increases around 40% at 16 MPa with the increase of temperature from 22 °C to 45 °C.
- (4)
- Due to the blocking effect of water, the much lower permeability of shale saturated by water can seriously reduce the gas production rate, and the very long time for recovery reduces the economic benefits of shale gas, which highlights the advantage of liquid CO2 as fracturing fluid. According to the Darcy’s law, the leak-off rate in mass of CO2 is around an order of magnitude higher than that of water, which indicates higher requirements for injection rate and total consumption. In contrast, the damaged zone formed by the injection of high viscosity fluid after CO2 injection in CO2 sequestration projects can significantly reduce the risk of CO2 leakage through the created fracture system.
Acknowledgments
Chengpeng Zhang thanks for the financial support from China Scholarship Council (CSC) and Monash University.
Author Contributions
Chengpeng Zhang designed and performed the experiments, and wrote the draft paper with support from Pathegama Gamage Ranjith; Chengpeng Zhang revised the paper according to reviewers’ comments.
Conflicts of Interest
The authors declare no conflict of interest.
References
- Conti, J.; Holtberg, P.D.; Beamon, J.A.; Schaal, A.M.; Ayoub, J.C.; Turnure, J.T. Annual Energy Outlook 2014 with Projections to 2040; US Energy Information Administration: Washington, DC, USA, 2014.
- Rivard, C.; Lavoie, D.; Lefebvre, R.; Séjourné, S.; Lamontagne, C.; Duchesne, M. An overview of canadian shale gas production and environmental concerns. Int. J. Coal Geol. 2014, 126, 64–76. [Google Scholar] [CrossRef]
- Wanniarachchi, W.A.M.; Gamage, R.P.; Perera, M.S.A.; Rathnaweera, T.D.; Gao, M.; Padmanabhan, E. Investigation of depth and injection pressure effects on breakdown pressure and fracture permeability of shale reservoirs: An experimental study. Appl. Sci. 2017, 7, 664. [Google Scholar] [CrossRef]
- Zhang, C.; Ranjith, P.; Perera, M. Investigation of Flow Behavior through Hydraulic Fractures in Unconventional Gas Reservoirs Under Tri-Axial Drained Conditions. In Proceedings of the 51st US Rock Mechanics/Geomechanics Symposium, San Francisco, CA, USA, 25–28 June 2017; American Rock Mechanics Association (ARMA): Alexandria, VA, USA, 2017; pp. 17–99. [Google Scholar]
- Zhang, J.; Kamenov, A.; Zhu, D.; Hill, A. Development of new testing procedures to measure propped fracture conductivity considering water damage in clay-rich shale reservoirs: An example of the barnett shale. J. Pet. Sci. Eng. 2015, 135, 352–359. [Google Scholar] [CrossRef]
- Bostrom, N.; Chertov, M.; Pagels, M.; Willberg, D.; Chertova, A.; Davis, M.; Zagorski, W. The Time-Dependent Permeability Damage Caused by Fracture Fluid. In Proceedings of the SPE International Symposium and Exhibition on Formation Damage Control, Lafayette, LA, USA, 26–28 February 2014; Society of Petroleum Engineers (SPE): Denver, CO, USA, 2014. [Google Scholar]
- Zhang, C.; Pathegama Gamage, R.; Perera, M.; Zhao, J. Characteristics of clay-abundant shale formations: Use of CO2 for production enhancement. Energies 2017, 10, 1887. [Google Scholar] [CrossRef]
- Johnson, E.G.; Johnson, L.A. Hydraulic fracture water usage in northeast british columbia: Locations, volumes and trends. Geosci. Rep. 2012, 41–63. [Google Scholar]
- Scholtens, B. Testing the Impact of the Anti-Fracking Movement in Changing Public Policy. Bachelor’s Thesis, Leiden University, Leiden, The Netherlands, 2017. [Google Scholar]
- Lillies, A.T.; King, S.R. Sand Fracturing with Liquid Carbon Dioxide. In Proceedings of the SPE Production Technology Symposium, Hobbs, NM, USA, 8–9 November 1982; Society of Petroleum Engineers (SPE): Denver, CO, USA, 1982. [Google Scholar]
- Bennour, Z.; Watanabe, S.; Chen, Y.; Ishida, T.; Akai, T. Evaluation of stimulated reservoir volume in laboratory hydraulic fracturing with oil, water and liquid carbon dioxide under microscopy using the fluorescence method. Geomech. Geophys. Geo-Energy Geo-Resour. 2017, 4, 39–50. [Google Scholar] [CrossRef]
- Li, X.; Feng, Z.; Han, G.; Elsworth, D.; Marone, C.; Saffer, D.; Cheon, D.-S. Breakdown pressure and fracture surface morphology of hydraulic fracturing in shale with H2O, CO2 and N2. Geomech. Geophys. Geo-Energy Geo-Resour. 2016, 2, 63–76. [Google Scholar] [CrossRef]
- Middleton, R.S.; Carey, J.W.; Currier, R.P.; Hyman, J.D.; Kang, Q.; Karra, S.; Jiménez-Martínez, J.; Porter, M.L.; Viswanathan, H.S. Shale gas and non-aqueous fracturing fluids: Opportunities and challenges for supercritical CO2. Appl. Energy 2015, 147, 500–509. [Google Scholar] [CrossRef]
- Nicot, J.-P.; Scanlon, B.R. Water use for shale-gas production in Texas, US. Environ. Sci. Technol. 2012, 46, 3580–3586. [Google Scholar] [CrossRef] [PubMed]
- Kang, D.; Lee, H.; Li, J. Modeling of Land Movement Due to Groundwater Pumping from an Aquifer System with Stress-Dependent Storage. In Proceedings of the Shale Energy Engineering 2014: Technical Challenges, Environmental Issues, and Public Policy, Pittsburgh, PA, USA, 21–23 July 2014; pp. 1–10. [Google Scholar]
- Vengosh, A.; Warner, N.; Jackson, R.; Darrah, T. The effects of shale gas exploration and hydraulic fracturing on the quality of water resources in the United States. Procedia Earth Planet. Sci. 2013, 7, 863–866. [Google Scholar] [CrossRef]
- Ziemkiewicz, P.F.; He, Y.; Quaranta, J.D. Characterization of Waste Waters from Hydraulic Fracturing. In Proceedings of the Shale Energy Engineering 2014: Technical Challenges, Environmental Issues, and Public Policy, Pittsburgh, PA, USA, 21–23 July 2014; pp. 63–73. [Google Scholar]
- Chareonsuppanimit, P.; Mohammad, S.A.; Robinson, R.L., Jr.; Gasem, K.A. High-pressure adsorption of gases on shales: Measurements and modeling. Int.J. Coal Geol. 2012, 95, 34–46. [Google Scholar] [CrossRef]
- Godec, M.; Koperna, G.; Petrusak, R.; Oudinot, A. Potential for enhanced gas recovery and CO2 storage in the Marcellus Shale in the Eastern United States. Int. J. Coal Geol. 2013, 118, 95–104. [Google Scholar] [CrossRef]
- Arnold, D. Liquid CO2 and sand: An alternative to water-based stimulation fluids. Pet. Eng. Int. 1998, 71, 89–92. [Google Scholar]
- Fathi, E.; Akkutlu, I.Y. Multi-component gas transport and adsorption effects during CO2 injection and enhanced shale gas recovery. Int. J. Coal Geol. 2014, 123, 52–61. [Google Scholar] [CrossRef]
- Leung, D.Y.; Caramanna, G.; Maroto-Valer, M.M. An overview of current status of carbon dioxide capture and storage technologies. Renew. Sustain. Energy Rev. 2014, 39, 426–443. [Google Scholar] [CrossRef] [Green Version]
- Reinicke, A.; Rybacki, E.; Stanchits, S.; Huenges, E.; Dresen, G. Hydraulic fracturing stimulation techniques and formation damage mechanisms—Implications from laboratory testing of tight sandstone–proppant systems. Chem. der Erde-Geochem. 2010, 70, 107–117. [Google Scholar] [CrossRef]
- Ghanizadeh, A.; Bhowmik, S.; Haeri-Ardakani, O.; Sanei, H.; Clarkson, C.R. A comparison of shale permeability coefficients derived using multiple non-steady-state measurement techniques: Examples from the Duvernay Formation, Alberta (Canada). Fuel 2015, 140, 371–387. [Google Scholar] [CrossRef]
- Zhang, C.; Ranjith, P.; Perera, M.; Zhao, J.; Zhang, D.; Wanniarachchi, W. A novel approach to precise evaluation of carbon dioxide flow behaviour in siltstone under tri-axial drained conditions. J. Nat. Gas Sci. Eng. 2016, 34, 331–340. [Google Scholar] [CrossRef]
- Tanikawa, W.; Shimamoto, T. Klinkenberg effect for gas permeability and its comparison to water permeability for porous sedimentary rocks. Hydrol. Earth Syst. Sci. Discuss. 2006, 3, 1315–1338. [Google Scholar] [CrossRef]
- Sander, R.; Pan, Z.; Connell, L.D. Laboratory measurement of low permeability unconventional gas reservoir rocks: A review of experimental methods. J. Nat. Gas Sci. Eng. 2017, 37, 248–279. [Google Scholar] [CrossRef]
- Xiao, Z.; Yang, R.; Feng, T.; Cao, Y.; Wang, Q.; Yang, T.; Wang, Z.; Deng, Y. Reservoir-forming conditions and exploration potential of shale gas in Lower Cambrian Niutitang Formation, Northwestern Hunan. J. Hunan Univ. Sci. Technol. 2012, 27, 50–54. [Google Scholar]
- Xing, L.; Xi, Y.; Jiehui, Z.; Honglin, S. Reservoir forming conditions and favorable exploration zones of shale gas in the Weixin sag, Dianqianbei Depression. Pet. Explor. Dev. 2011, 38, 693–699. [Google Scholar] [CrossRef]
- Bhandari, A.R.; Flemings, P.B.; Polito, P.J.; Cronin, M.B.; Bryant, S.L. Anisotropy and stress dependence of permeability in the Barnett shale. Transp. Porous Media 2015, 108, 393–411. [Google Scholar] [CrossRef]
- Zhou, Z.; Abass, H.; Li, X.; Teklu, T. Experimental investigation of the effect of imbibition on shale permeability during hydraulic fracturing. J. Nat. Gas Sci. Eng. 2016, 29, 413–430. [Google Scholar] [CrossRef]
- De Silva, G.; Ranjith, P.; Perera, M.; Chen, B. Effect of bedding planes, their orientation and clay depositions on effective re-injection of produced brine into clay rich deep sandstone formations: Implications for deep earth energy extraction. Appl. Energy 2016, 161, 24–40. [Google Scholar] [CrossRef]
- Kang, S.M.; Fathi, E.; Ambrose, R.J.; Akkutlu, I.Y.; Sigal, R.F. Carbon dioxide storage capacity of organic-rich shales. SPE J. 2011, 16, 842–855. [Google Scholar] [CrossRef]
- Kollek, J. The determination of the permeability of concrete to oxygen by the Cembureau method—A recommendation. Mater. Struct. 1989, 22, 225–230. [Google Scholar] [CrossRef]
- Heller, R.; Vermylen, J.; Zoback, M. Experimental investigation of matrix permeability of gas shales. AAPG Bull. 2014, 98, 975–995. [Google Scholar] [CrossRef]
- Fridleifsson, I.B.; Bertani, R.; Huenges, E.; Lund, J.W.; Ragnarsson, A.; Rybach, L. The Possible Role and Contribution of Geothermal Energy to the Mitigation of Climate Change. In Proceedings of the IPCC Scoping Meeting on Renewable Energy Sources, Luebeck, Germany, 20–25 January 2008; pp. 59–80. [Google Scholar]
- Niezgoda, T.; Miedzińska, D.; Małek, E.; Kędzierski, P.; Sławiński, G. Study on carbon dioxide thermodynamic behavior for the purpose of shale rock fracturing. Bull. Pol. Acad. Sci. 2013, 61, 605–612. [Google Scholar] [CrossRef]
- Lemmon, E.; Huber, M.; McLinden, M. NIST Standard Reference Database 23, NIST Reference Fluid Thermodynamic and Transport Properties, REFPROP, Version 9.0, Standard Reference Data Program; National Institute of Standards and Technology: Gaithersburg, MD, USA, 2010.
- Klinkenberg, L. The Permeability of Porous Media to Liquids and Gases; Drilling and Production Practice; American Petroleum Institute: Tulsa, OK, USA, 1941; pp. 200–213. [Google Scholar]
- Javadpour, F.; Fisher, D.; Unsworth, M. Nanoscale gas flow in shale gas sediments. J. Can. Pet. Technol. 2007, 46, 55–61. [Google Scholar] [CrossRef]
- Kondash, A.J.; Albright, E.; Vengosh, A. Quantity of flowback and produced waters from unconventional oil and gas exploration. Sci. Total Environ. 2017, 574, 314–321. [Google Scholar] [CrossRef] [PubMed]
- Clarkson, C.R.; Jensen, J.L.; Pedersen, P.K.; Freeman, M. Innovative methods for flow-unit and pore-structure analyses in a tight siltstone and shale gas reservoir. AAPG Bull. 2012, 96, 355–374. [Google Scholar] [CrossRef]
- Gu, H.; Lecerf, B.; Weng, X.; Kresse, O. Effect of Fracture Breakdown Pressure on Multicluster Hydraulic Fracturing Treatments. In Proceedings of the 49th US Rock Mechanics/Geomechanics Symposium, San Francisco, CA, USA, 28 June–1 July 2015; American Rock Mechanics Association (ARMA): Alexandria, VA, USA, 2015. [Google Scholar]
- Campbell, S.; Fairchild, N., Jr.; Arnold, D. Liquid CO2 and Sand Stimulations in the Lewis Shale San Juan Basin New Mexico: A Case Study. In Proceedings of the SPE Rocky Mountain Regional/Low-Permeability Reservoirs Symposium and Exhibition, Denver, CO, USA, 12–15 March 2000; Society of Petroleum Engineers: Denver, CO, USA, 2000. [Google Scholar]
- Nuttall, B.C.; Eble, C.F.; Drahovzal, J.A.; Bustin, R.M. Analysis of Devonian Black Shales in Kentucky for Potential Carbon Dioxide Sequestration and Enhanced Natural Gas Production; Kentucky Geological Survey Report DE-FC26-02NT41442; University of Kentucky: Lexington, KY, USA, 2005. [Google Scholar]
Figure 1.
Mineral composition of shale samples [29].
Figure 1.
Mineral composition of shale samples [29].

Figure 2.
Core flooding set-up for permeability tests.

Figure 3.
Development of downstream flow rates with time under steady-state conditions at confining pressure of 40 MPa.
Figure 3.
Development of downstream flow rates with time under steady-state conditions at confining pressure of 40 MPa.
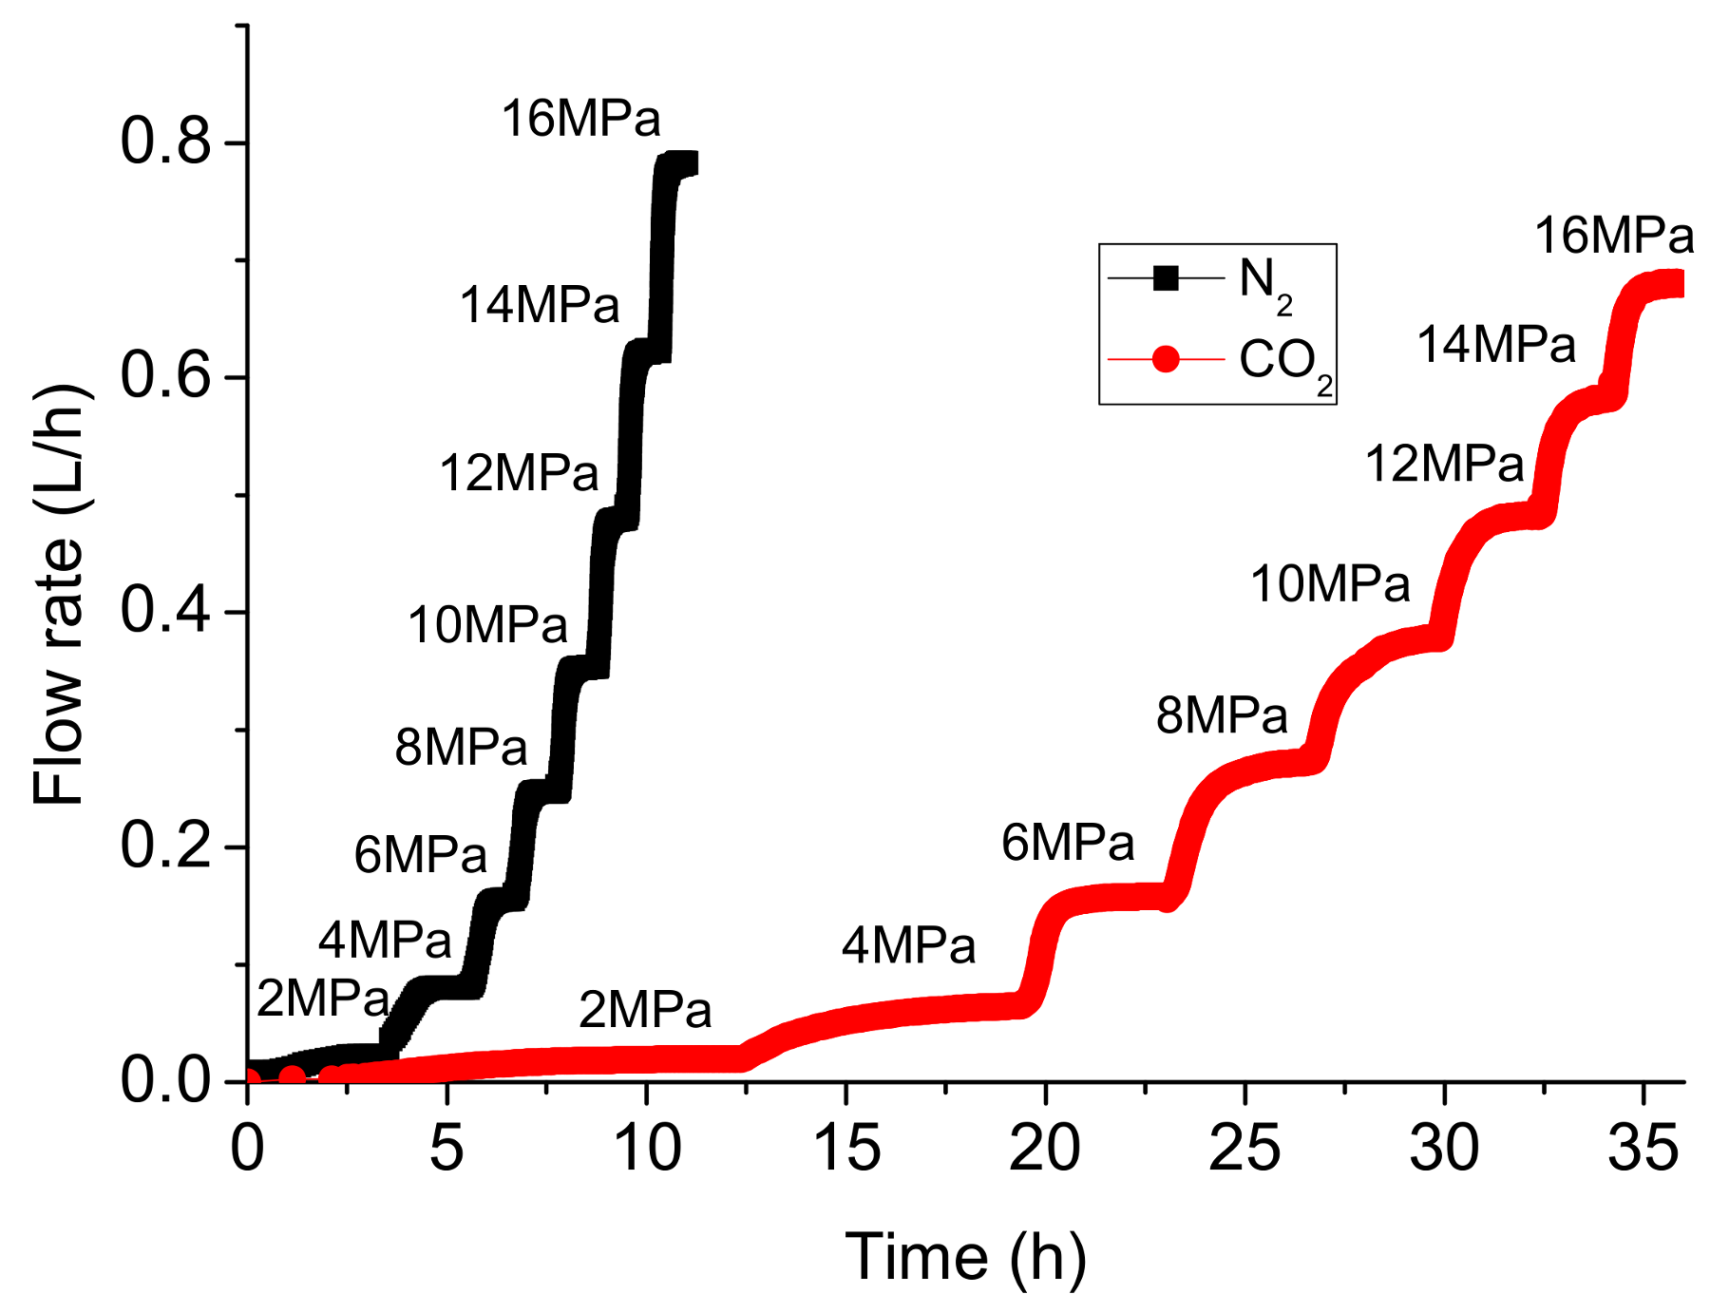
Figure 4.
Variation of downstream flow rates with injection pressure under steady-state conditions.
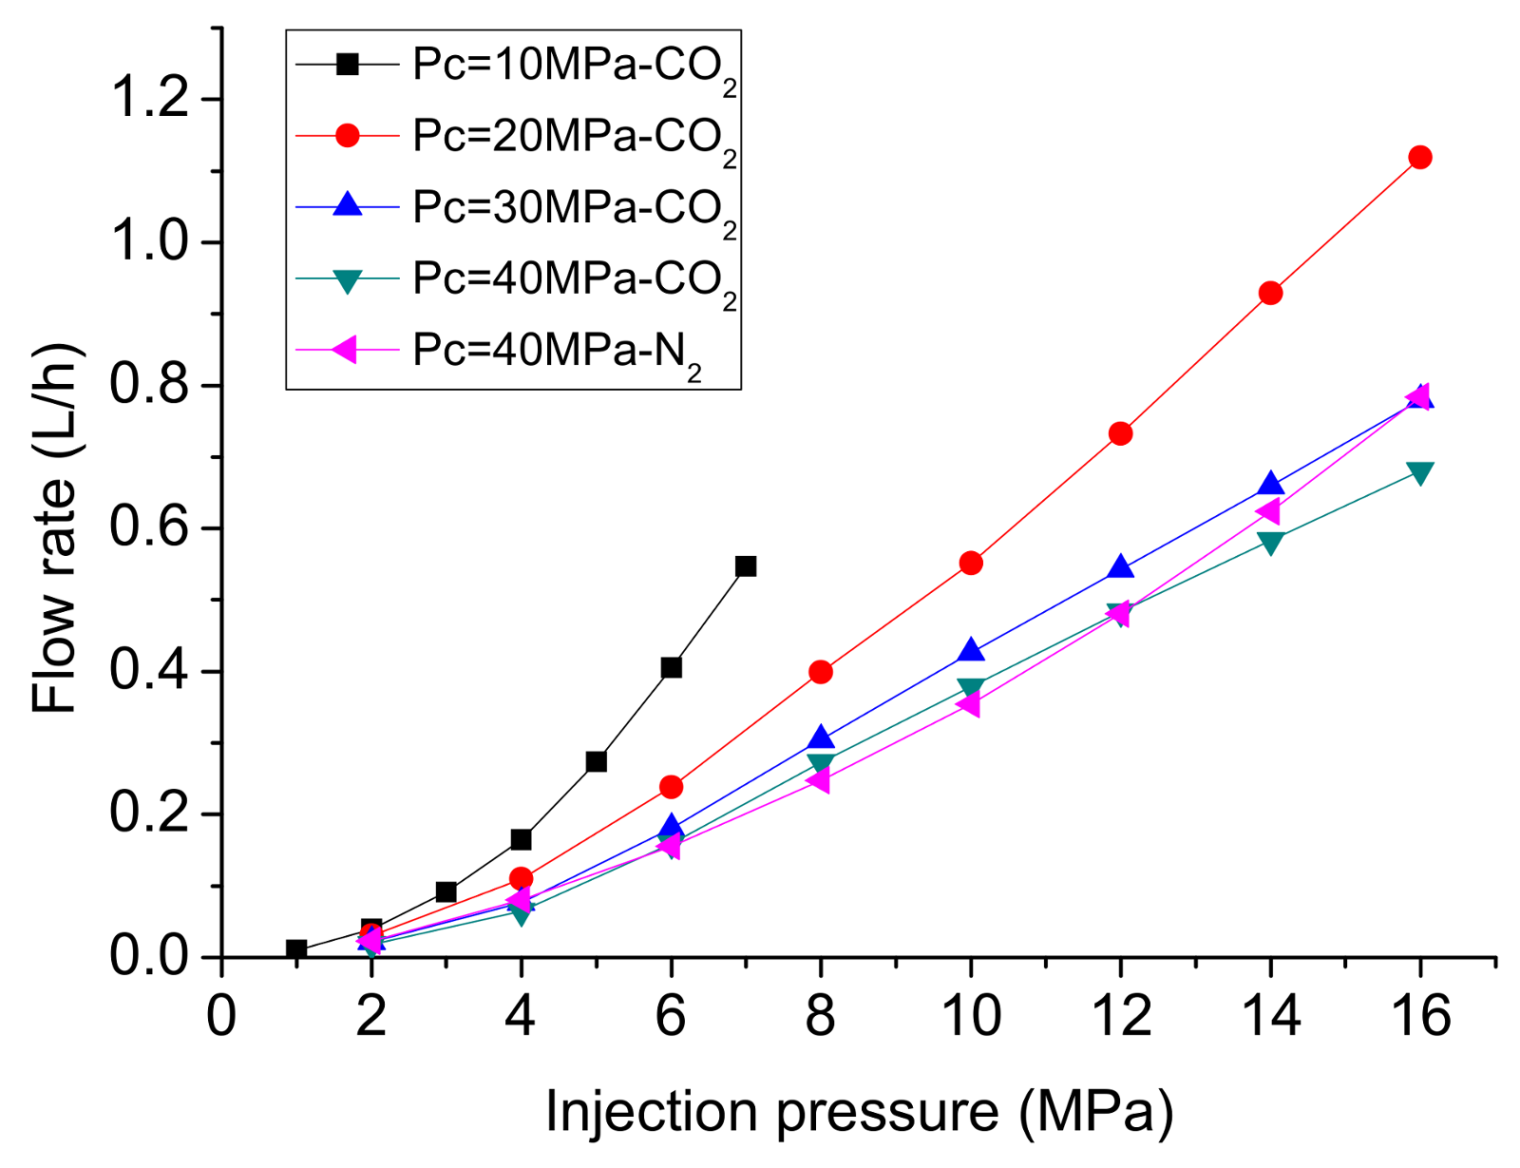
Figure 5.
Relationship between the calculated permeability to CO2 and N2 and injection pressure under steady-state conditions.
Figure 5.
Relationship between the calculated permeability to CO2 and N2 and injection pressure under steady-state conditions.

Figure 6.
Development of downstream pressure with time under transient conditions at injection pressure of 2 MPa.
Figure 6.
Development of downstream pressure with time under transient conditions at injection pressure of 2 MPa.
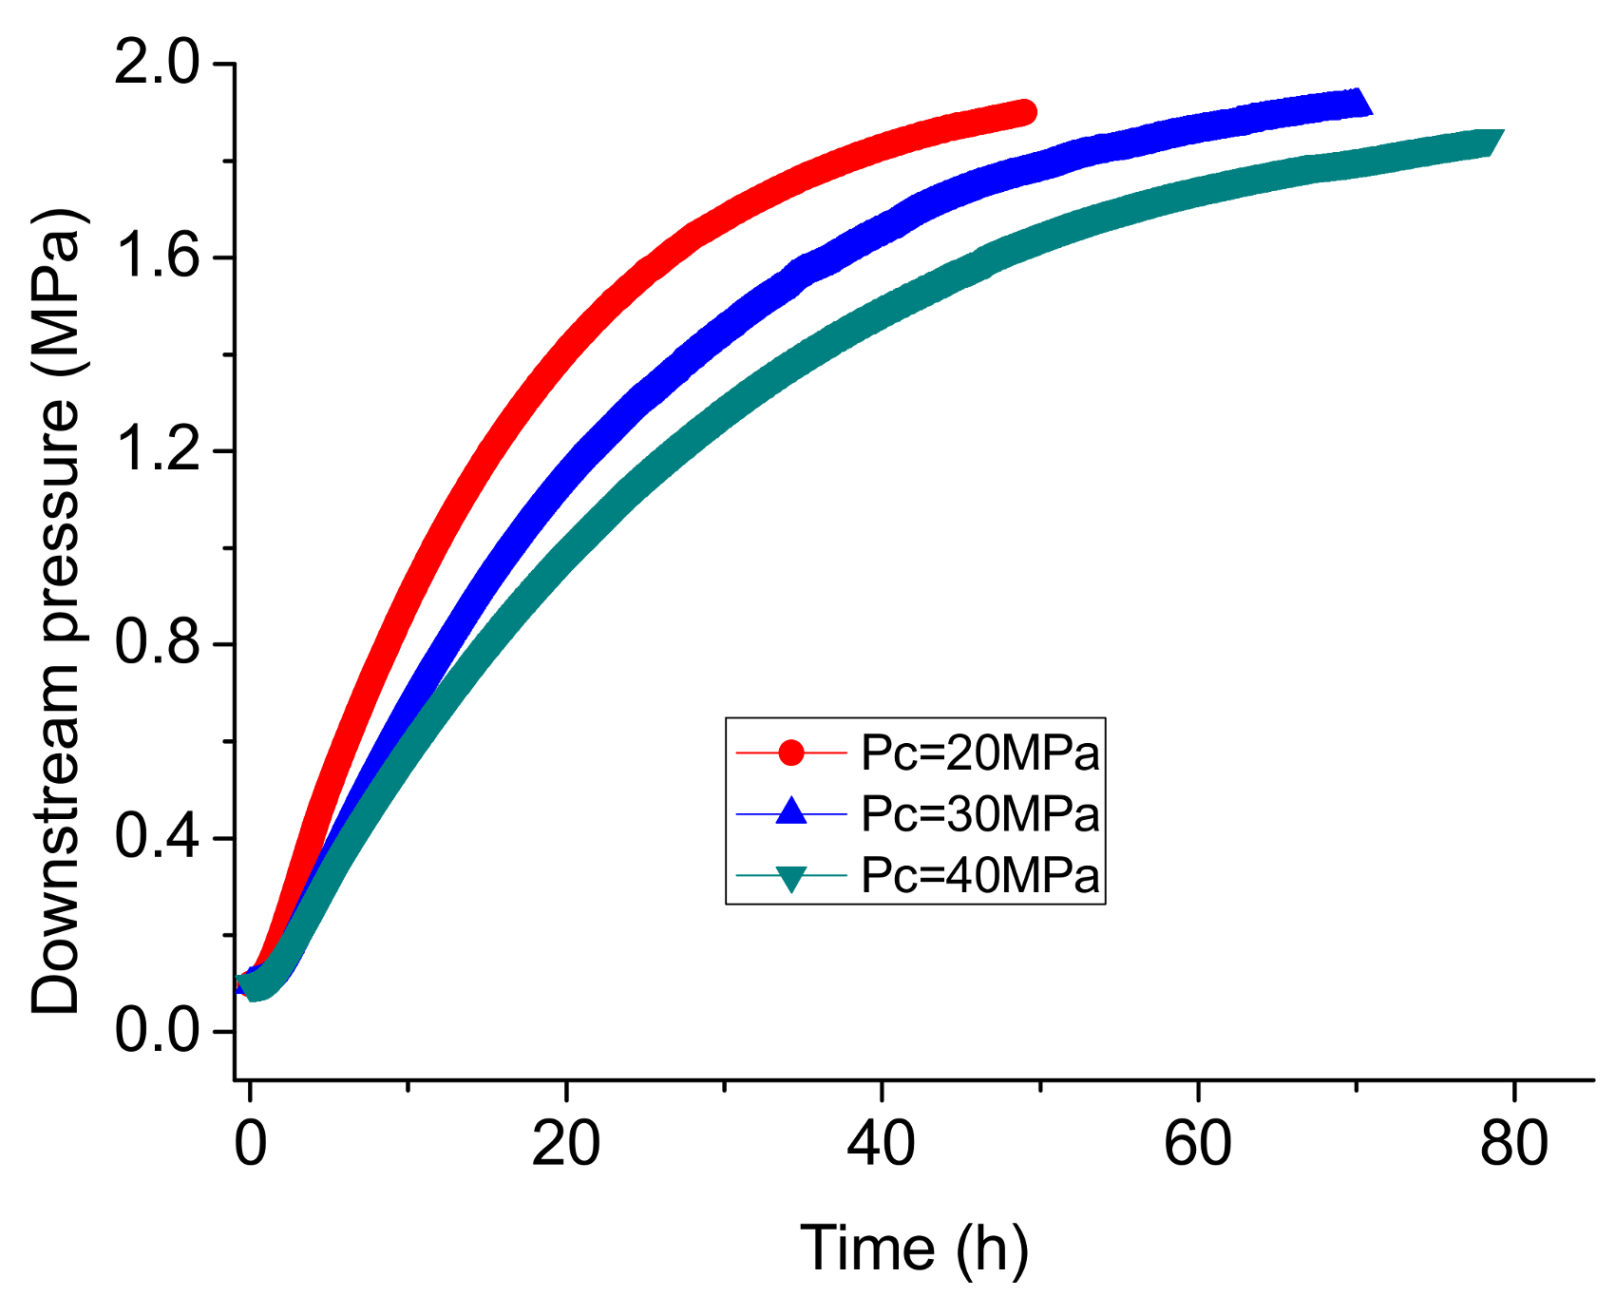
Figure 7.
Relationship between the calculated permeability to CO2 and injection pressures under transient conditions.
Figure 7.
Relationship between the calculated permeability to CO2 and injection pressures under transient conditions.
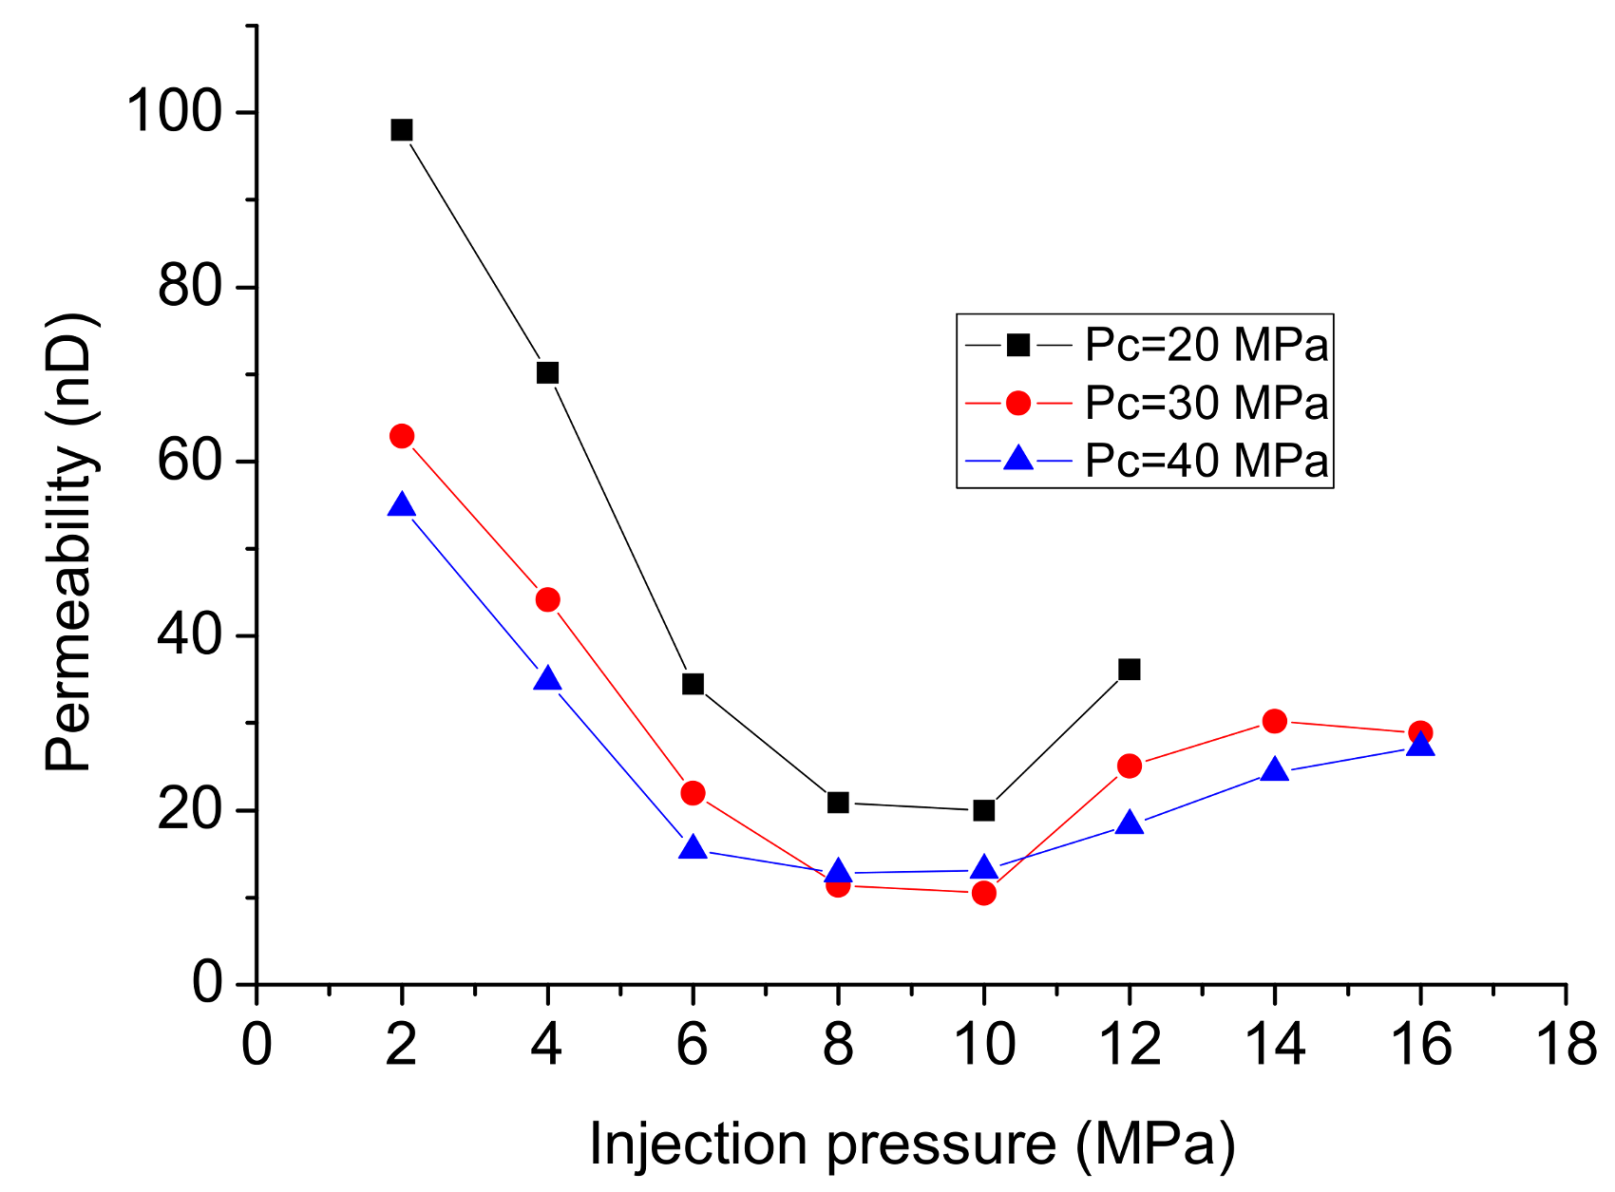
Figure 8.
Relationship between the calculated permeability to CO2 and injection pressure at different temperature.
Figure 8.
Relationship between the calculated permeability to CO2 and injection pressure at different temperature.
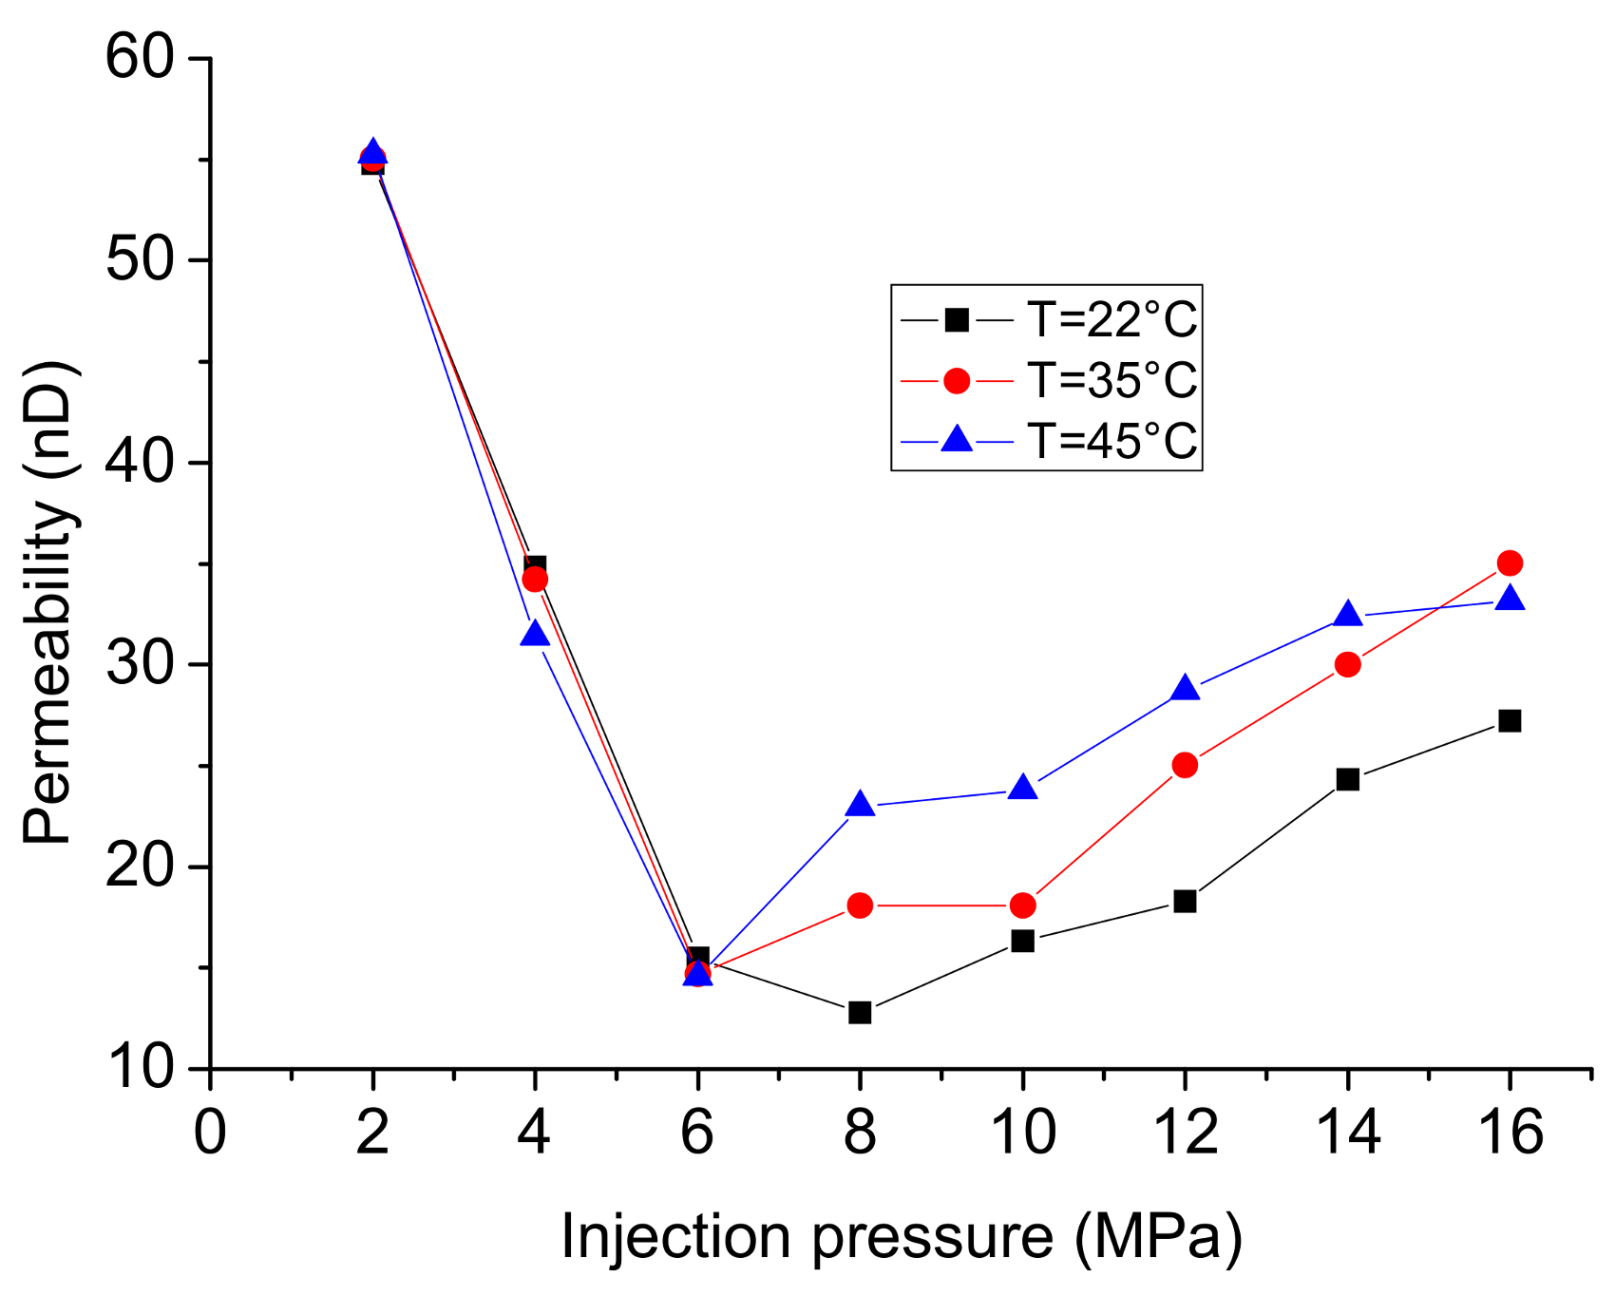
Figure 9.
Evolution of calculated permeability to N2 with time after water flooding.
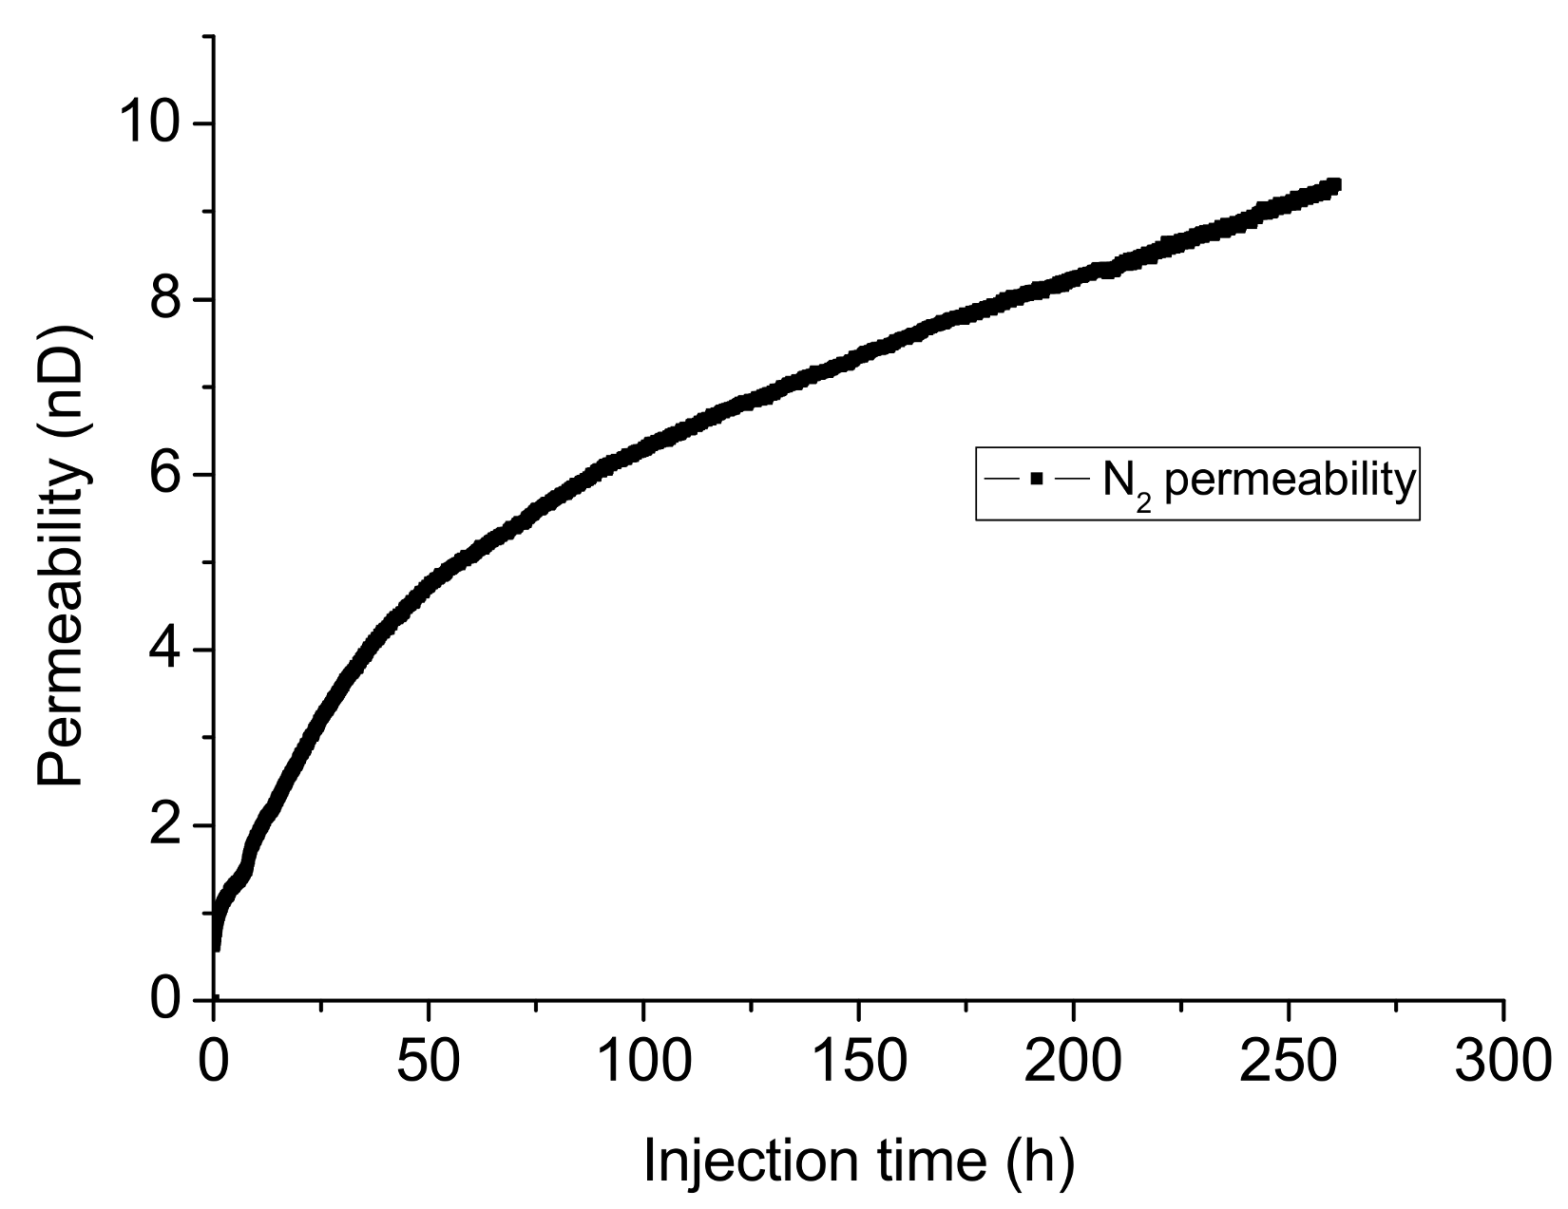
Figure 10.
Imbibition depth vs. time during fracturing process with injection pressure of 50 MPa.
© 2018 by the authors. Licensee MDPI, Basel, Switzerland. This article is an open access article distributed under the terms and conditions of the Creative Commons Attribution (CC BY) license (http://creativecommons.org/licenses/by/4.0/).
Share and Cite
MDPI and ACS Style
Zhang, C.; Ranjith, P.G. Experimental Study of Matrix Permeability of Gas Shale: An Application to CO2-Based Shale Fracturing. Energies 2018, 11, 702. https://doi.org/10.3390/en11040702
AMA Style
Zhang C, Ranjith PG. Experimental Study of Matrix Permeability of Gas Shale: An Application to CO2-Based Shale Fracturing. Energies. 2018; 11(4):702. https://doi.org/10.3390/en11040702
Chicago/Turabian StyleZhang, Chengpeng, and Pathegama Gamage Ranjith. 2018. "Experimental Study of Matrix Permeability of Gas Shale: An Application to CO2-Based Shale Fracturing" Energies 11, no. 4: 702. https://doi.org/10.3390/en11040702
Note that from the first issue of 2016, this journal uses article numbers instead of page numbers. See further details here.