Transformers Health Index Assessment Based on Neural-Fuzzy Network
by
 and
and
Emran Jawad Kadim
1, 
Norhafiz Azis
1,2,*,
Jasronita Jasni
1,
Siti Anom Ahmad
3 and
Mohd Aizam Talib
4 1
Centre for Electromagnetic & Lightning Protection, Universiti Putra Malaysia, Serdang 43400, Selangor, Malaysia
2
Institute of Advanced Technology, Universiti Putra Malaysia, Serdang 43400, Selangor, Malaysia
3
Department of Electrical and Electronic Engineering, Universiti Putra Malaysia, Serdang 43400, Selangor, Malaysia
4
TNB Research Sdn Bhd, Kajang 43000, Selangor, Malaysia
*
Author to whom correspondence should be addressed.
Energies 2018, 11(4), 710; https://doi.org/10.3390/en11040710
Submission received: 21 January 2018
/
Revised: 20 February 2018
/
Accepted: 23 February 2018
/
Published: 22 March 2018
Abstract
:In this paper, an assessment on the health index (HI) of transformers is carried out based on Neural-Fuzzy (NF) method. In-service condition assessment data, such as dissolved gases, furans, AC breakdown voltage (ACBDV), moisture, acidity, dissipation factor (DF), color, interfacial tension (IFT), and age were fed as input parameters to the NF network. The NF network were trained individually based on two sets of data, known as in-service condition assessment and Monte Carlo Simulation (MCS) data. HI was also obtained from the scoring method for comparison with the NF method. It is found that the HI of transformers that was obtained by NF trained by MCS method is closer to scoring method than NF trained by in-service condition assessment method. Based on the total of 15 testing transformers, NF trained by MCS data method gives 10 transformers with the same assessments as scoring method as compared to eight transformers given by NF trained by in-service condition data method. Analysis based on all 73 transformers reveals that 62% of transformers have the same assessments between NF trained by MCS data and scoring methods.
1. Introduction
Transformers asset management is one of the crucial aspects for utilities. With the current economic challenges nowadays, there is an urge to carry out comprehensive condition assessment of transformers in order to avoid early stage failures, which could be costly. With good management strategies, it enables the utilities to plan the maintenance or replacement of their assets, which subsequently can reduce the risk of failures and power outages [1]. Nowadays, most of the utilities have migrated from the conventional time-based to condition-based managements [2]. A number of new diagnostic techniques have had been developed and implemented in order to support this effort [3].
Conventionally, the primary areas under concern for transformers under normal in-service ageing are the oil and paper insulations. For oil, there are several parameters that are normally monitored such as AC breakdown voltage (ACBDV), dielectric properties, acidity, moisture, color, and interfacial tension (IFT) [4]. Dielectric failures related to oil can be avoided if the ACBDV and dielectric properties are properly monitored [5]. Meanwhile, moisture and acidity are commonly monitored in the condition assessment scheme of transformers since these parameters are among the main ageing accelerators and by-products for oil and paper in transformers [6]. These parameters could also affect the dielectric strength of oil and could cause deterioration to the metal parts in transformers [7]. Color and IFT serve as additional information to determine the state of oil degradation [8].
Furans are among the common parameter used to determine the condition of insulation paper due to its unique relationship with degree of polymerization [9]. The concentration of furans slowly increases under normal ageing and will accelerate under extreme conditions, for example, if a local overheating occurs on the insulation paper. Recently, methanol has been proposed as a potential diagnostic tool for paper condition [10,11]. This finding is promising since it can serve as additional parameter to evaluate the health of paper. Both oil and paper conditions are important to be assessed in order to ensure reliable operation of transformers.
In addition, under normal practice, unusual events, such as incipient faults are also considered in the overall condition assessment scheme of transformers. These events can be monitored through dissolved gases in oil. Gases such as hydrogen (H2), methane (CH4), ethane (C2H4), ethylene (C2H6), acetylene (C2H2), carbon monoxide (CO), and carbon dioxide (CO2) are normally analysed in order to determine the types and severities of the faults [12]. Based on the analysis, recommendations can be made to carry out the necessary mitigation actions [13]. Other techniques that are commonly used to evaluate faults in transformers include frequency response, partial discharge and recovery voltage methods [14,15]. As part of transformers management practices, external conditions of transformers are also monitored that include information, such as oil leak as well as the state of the oil seals, foundations, and tanks [16,17].
Condition assessment of transformers based on the individual parameter is quite complex and difficult in some cases. Therefore, health index (HI) is proposed, which can assist the utilities to determine the overall condition of transformers. HI consists of multiple in-service condition assessment data that is computed based on a set of algorithms. Coupled with the historical information of transformers and probability failure assessment, HI can be used for maintenance scheduling and replacement strategies [18]. The conventional computation of HI is known as the scoring method where it is based on the ranking and scoring approaches where each condition assessment parameter is given a distinctive weighting factor. These factors are normally determined based on either expert judgment or utility requirement [19].
In recent years, artificial intelligence (AI) has been introduced as an alternative approach to determine the HI of transformers. AI can help to overcome previous issues on the existing scoring method approach such as lack of data and high dependency on expert judgment [1]. In one of the study in [20], a fuzzy logic (FL) was implemented to determine the HI of transformers with voltage levels less than 69 kV. The HI of transformers were determined based on 6 inputs parameters that included ACBDV, acidity, moisture, dissipation factor (DF), dissolved gases and furans [20]. It was found that the HI of transformers computed based on the FL were in a good agreement with utility’s HI. Other study using artificial neural network (ANN) also showed the same finding [21]. For the ANN study, additional input parameters, such as loss angle and total solids, were included in the network topology where the in-service condition assessment data from 59 transformers were used for training and 29 transformers for testing. Fuzzy support vector machine (FSVM) was implemented in [19] in order to solve imbalanced data issues for determining the HI of transformers. Several techniques were integrated in this study, such as support vector machine, fuzzy C-means, and synthetic minority over-sampling technique (SMOTE). The study showed that the FSVM with SMOTE was able to determine the HI of transformers with 88% of accuracy. Other AI study used orthogonal wavelet network that was based on combination between the wavelet transform and ANN for determining the HI of transformers [22]. It was found that the HI of transformers obtained by this method were in line with scoring method. Overall, most of the AI methods reviewed are able to be used as generic approaches to obtain HI of transformers. However, further advancement can be carried out to implement Neural-Fuzzy (NF) where its advantages include reducing the dependency on the pre-determined expert rules and minimizing the uncertainties of the HI computation. The NF can optimize the fuzzy inference system (FIS) based on the training of the condition assessment and HI data.
Currently, majority of utilities are using the scoring method since it can provide sufficient assessment on the condition of transformers. However, this approach is unique for each utility in terms of its algorithm and weighting factors. In this study, an alternative generic approach to determine HI of transformers based on NF is presented. The in-service condition assessment data from 73 transformers with voltage levels of 33 kV are used for training and testing of the NF network. In addition, an alternative training approach is carried out based on Monte Carlo Simulation (MCS) data. Finally, the HI of transformers that are obtained from the NF method are compared with the scoring method and analysed.
2. Research Work Flow
The workflow of the current study can be seen in Figure 1. Two approaches were implemented to obtain the HI of transformers. The first approach was based on conventional scoring method where the HI of transformers was computed through scoring and weighting algorithms. The second approach was based on NF method. NF network requires a given set of input and output data for training purpose which is needed for the construction of the FIS. For this approach, 2 training schemes were implemented to obtain the HI of transformers. The first scheme used the in-service condition assessment data from the transformers to train the NF network (NF-IS) while the second scheme utilized the training data obtained from the Monte Carlo Simulation (NF-MCS). Once the FIS was obtained, the input data were fed and the outputs were compared with HI of transformers obtained by scoring method.
3. Health Index Assessment Based on Scoring Method
In this study, the HI of transformers was first computed based on the scoring method for comparison with the HI obtained by NF method. The HI of transformers was computed based on scoring method algorithm proposed in [4,16]. Due to the limitation of the data, only four main parameters were considered, which were oil quality, dissolved gases in oil, furans and age. Under the oil quality, parameters such as ACBDV, DF, acidity, moisture, color, and IFT were included. Meanwhile, seven gases (H2, CH4, C2H4, C2H6, C2H2, CO, and CO2) were considered in the HI computation.
For oil quality and dissolved gases in oil, two steps of procedure were carried out before it can be included in the final HI computation. The first step was to obtain the score and weighting factors for individual parameters according to the corresponding ranges in [4,16]. The weighting factor varies according to the importance of each parameter. For example, the weighting factors given to (CO,CO2), H2, (CH4,C2H6,C2H4) and C2H2 were 1, 2, 3, and 5, respectively. For oil quality, the weighting factors given to acidity, color/IFT, ACBDV/DF, and moisture were 1, 2, 3, and 4 [4,16]. Once the scores and weighting factors for all of the parameters were determined, the factors of oil quality or dissolved gases were computed according to Equation (1) [4,16].
where is the weighting factor for individual condition parameter, is the number of parameter in each factor and is the score for each parameter. The second step was to determine the rating codes for oil quality and dissolved gases in oil according to ranges in [4]. There are five rating codes of A, B, C, D and E which correspond to values of 4, 3, 2, 1, and 0, respectively. For other parameters such as furans and age, the rating codes were determined directly from [4,16]. Based on the rating codes of all the parameters, the final HI was computed according to Equation (2). Equation (2) was obtained based on [4,16] where a few modifications were carried out that included the removal of tap changer section and the percentage ratios of transformers and tap changers since the focus of this study was only on transformers.
where is the rating code for each parameter and is the weighting factor for transformers condition parameter. can be different for each parameter and different utilities [4,16,23].
4. Health Index Assessment Based on Neural Fuzzy Method
4.1. Architecture of the Neural Fuzzy Network
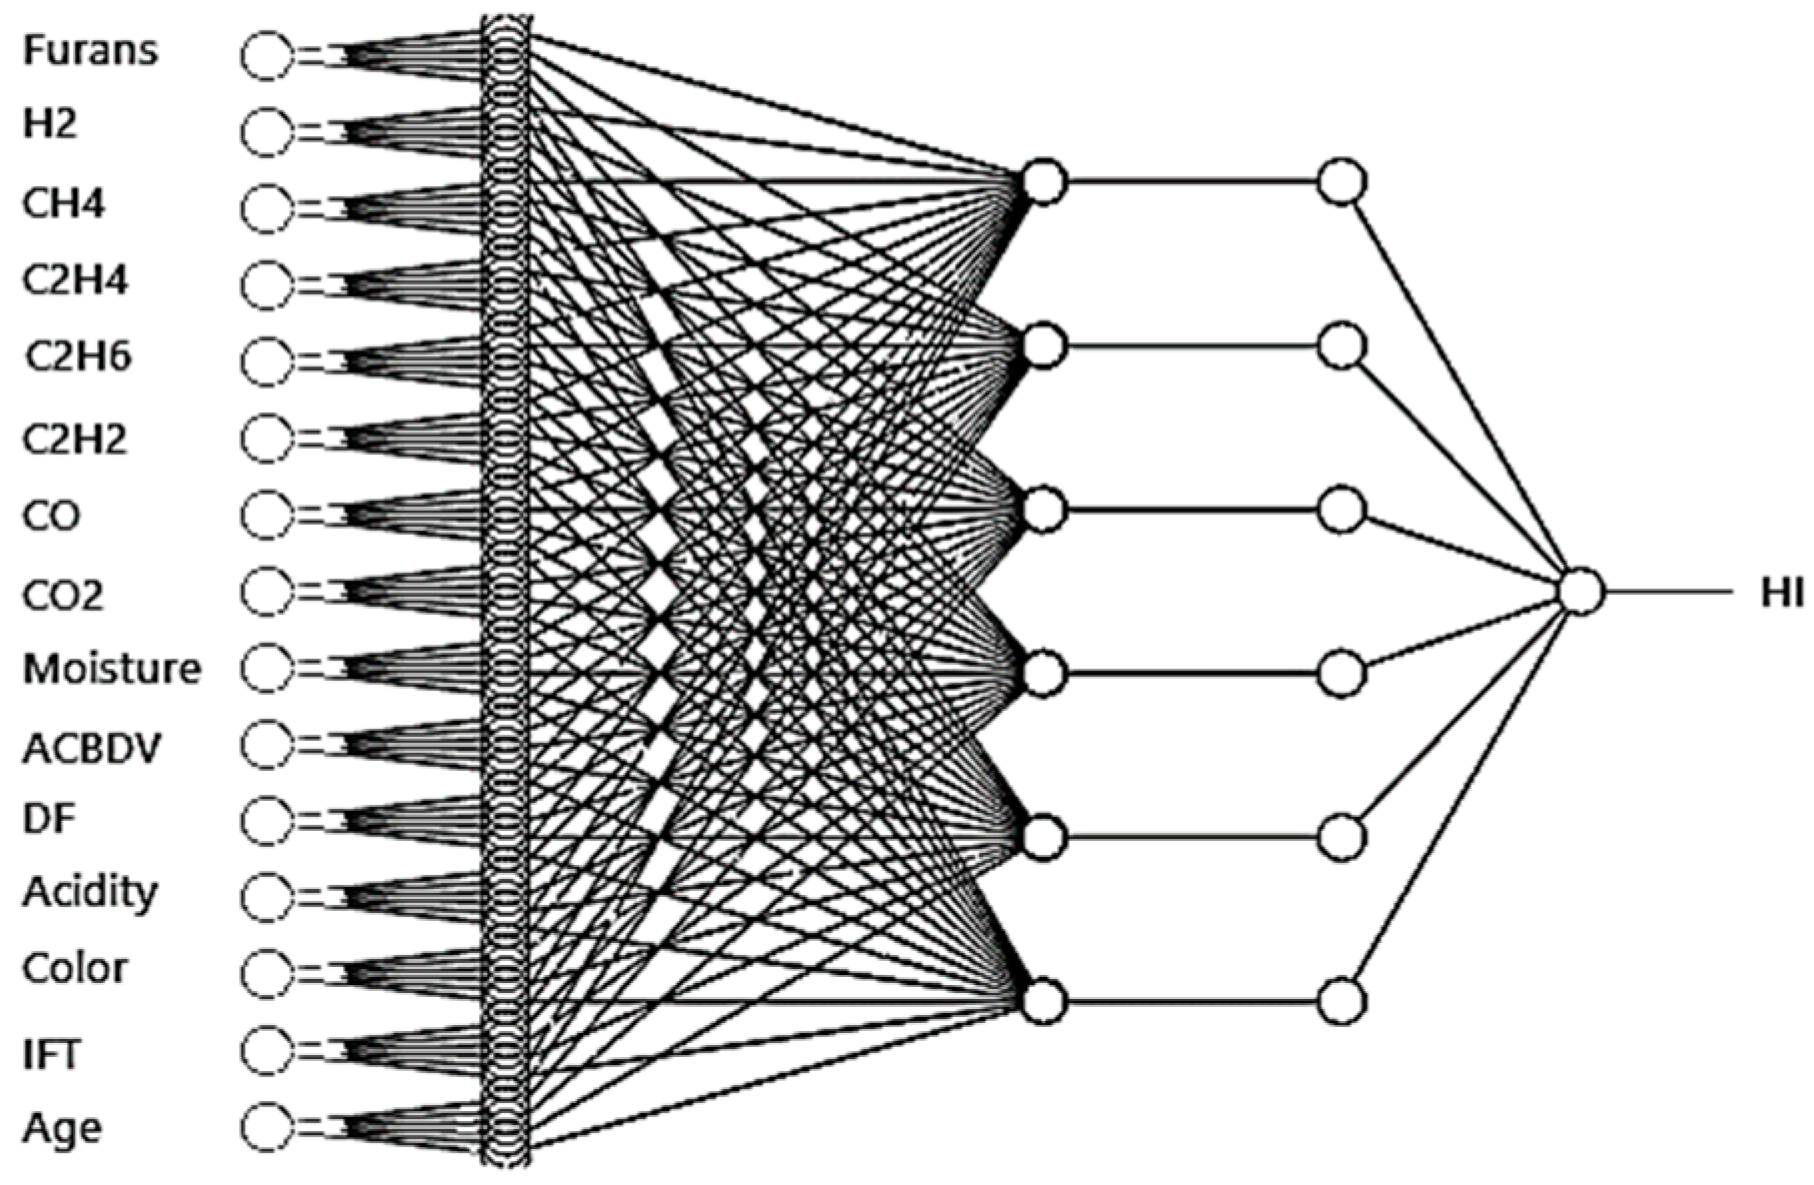
The architecture of the NF network used in this study consisted of five layers, which included the input, input membership, average nodes, output membership and output layers as shown in Figure 2. There were three hidden layers for both NF-MCS and NF-IS, represented by the input membership, average nodes and output membership layers. In each of the hidden layer, there were six and ten nodes for NF-MCS and NF-IS, respectively. In the inputs layer, 15 inputs were considered which included furans, H2, CH4, C2H4, C2H6, C2H2, CO, CO2, moisture, ACBDV, DF, acidity, IFT, color, and age. These parameters were commonly considered to determine HI of transformers. The nodes represent the antecedents of fuzzy sets rules (If-part). Gaussian membership function was chosen in this study, as seen in Equation (3) [24].
where is the output of first layer nodes, is the parameter set in the consequent, is the linguistic labels characterized by appropriate membership functions, is the type of membership function, which is Gaussian in this study, is the centre of the Gaussian function, is the crisp inputs to node, and is the spread of the membership function. The outputs of this layer were used as inputs for the antecedent membership functions corresponding to the fuzzified inputs of the system. In this study, the linguistic labels was defined into five categories known as “very good”, “good”, “moderate”, “bad”, and “very bad” based on criteria given in [4,16].
In the input membership layer, the degree of activation (firing strength) of particular fuzzy rules was computed. The AND operator was applied to obtain the output. The output of the layer can be determined by Equation (4).
where is the output of second layer nodes, is the furans, is the H2, is the CH4, is the C2H4, is the C2H6, is the C2H2, is the CO, is the CO2, is the moisture, is the ACBDV, is the DF, is the acidity, is the IFT, is the color, and is the age. In the average nodes layer, the firing strength of the rules was normalized based on the ratio of each ith rules to the sum of all rules that can be obtained by Equation (5) [24].
where is the output of third layer nodes, is the normalized degrees of activation (firing strength), and is the degrees of activation (firing strength) of ith rules. The function of output membership layer is to optimize the consequent parameters of the rules (Then-part) by computing each ith rules contribution in term of the total output, as shown in Equation (6).
where is the output of the fourth layer nodes, is the ith nodes output from the previous layer. The final output layer has a single node where each node belongs to one output in the case of multiple outputs. The single node evaluates the overall output by summation of all the inputs from the previous layers. The output of the defuzzification process of FIS was determined based on Equation (7) [24].
where is the output of the network and is the node function.
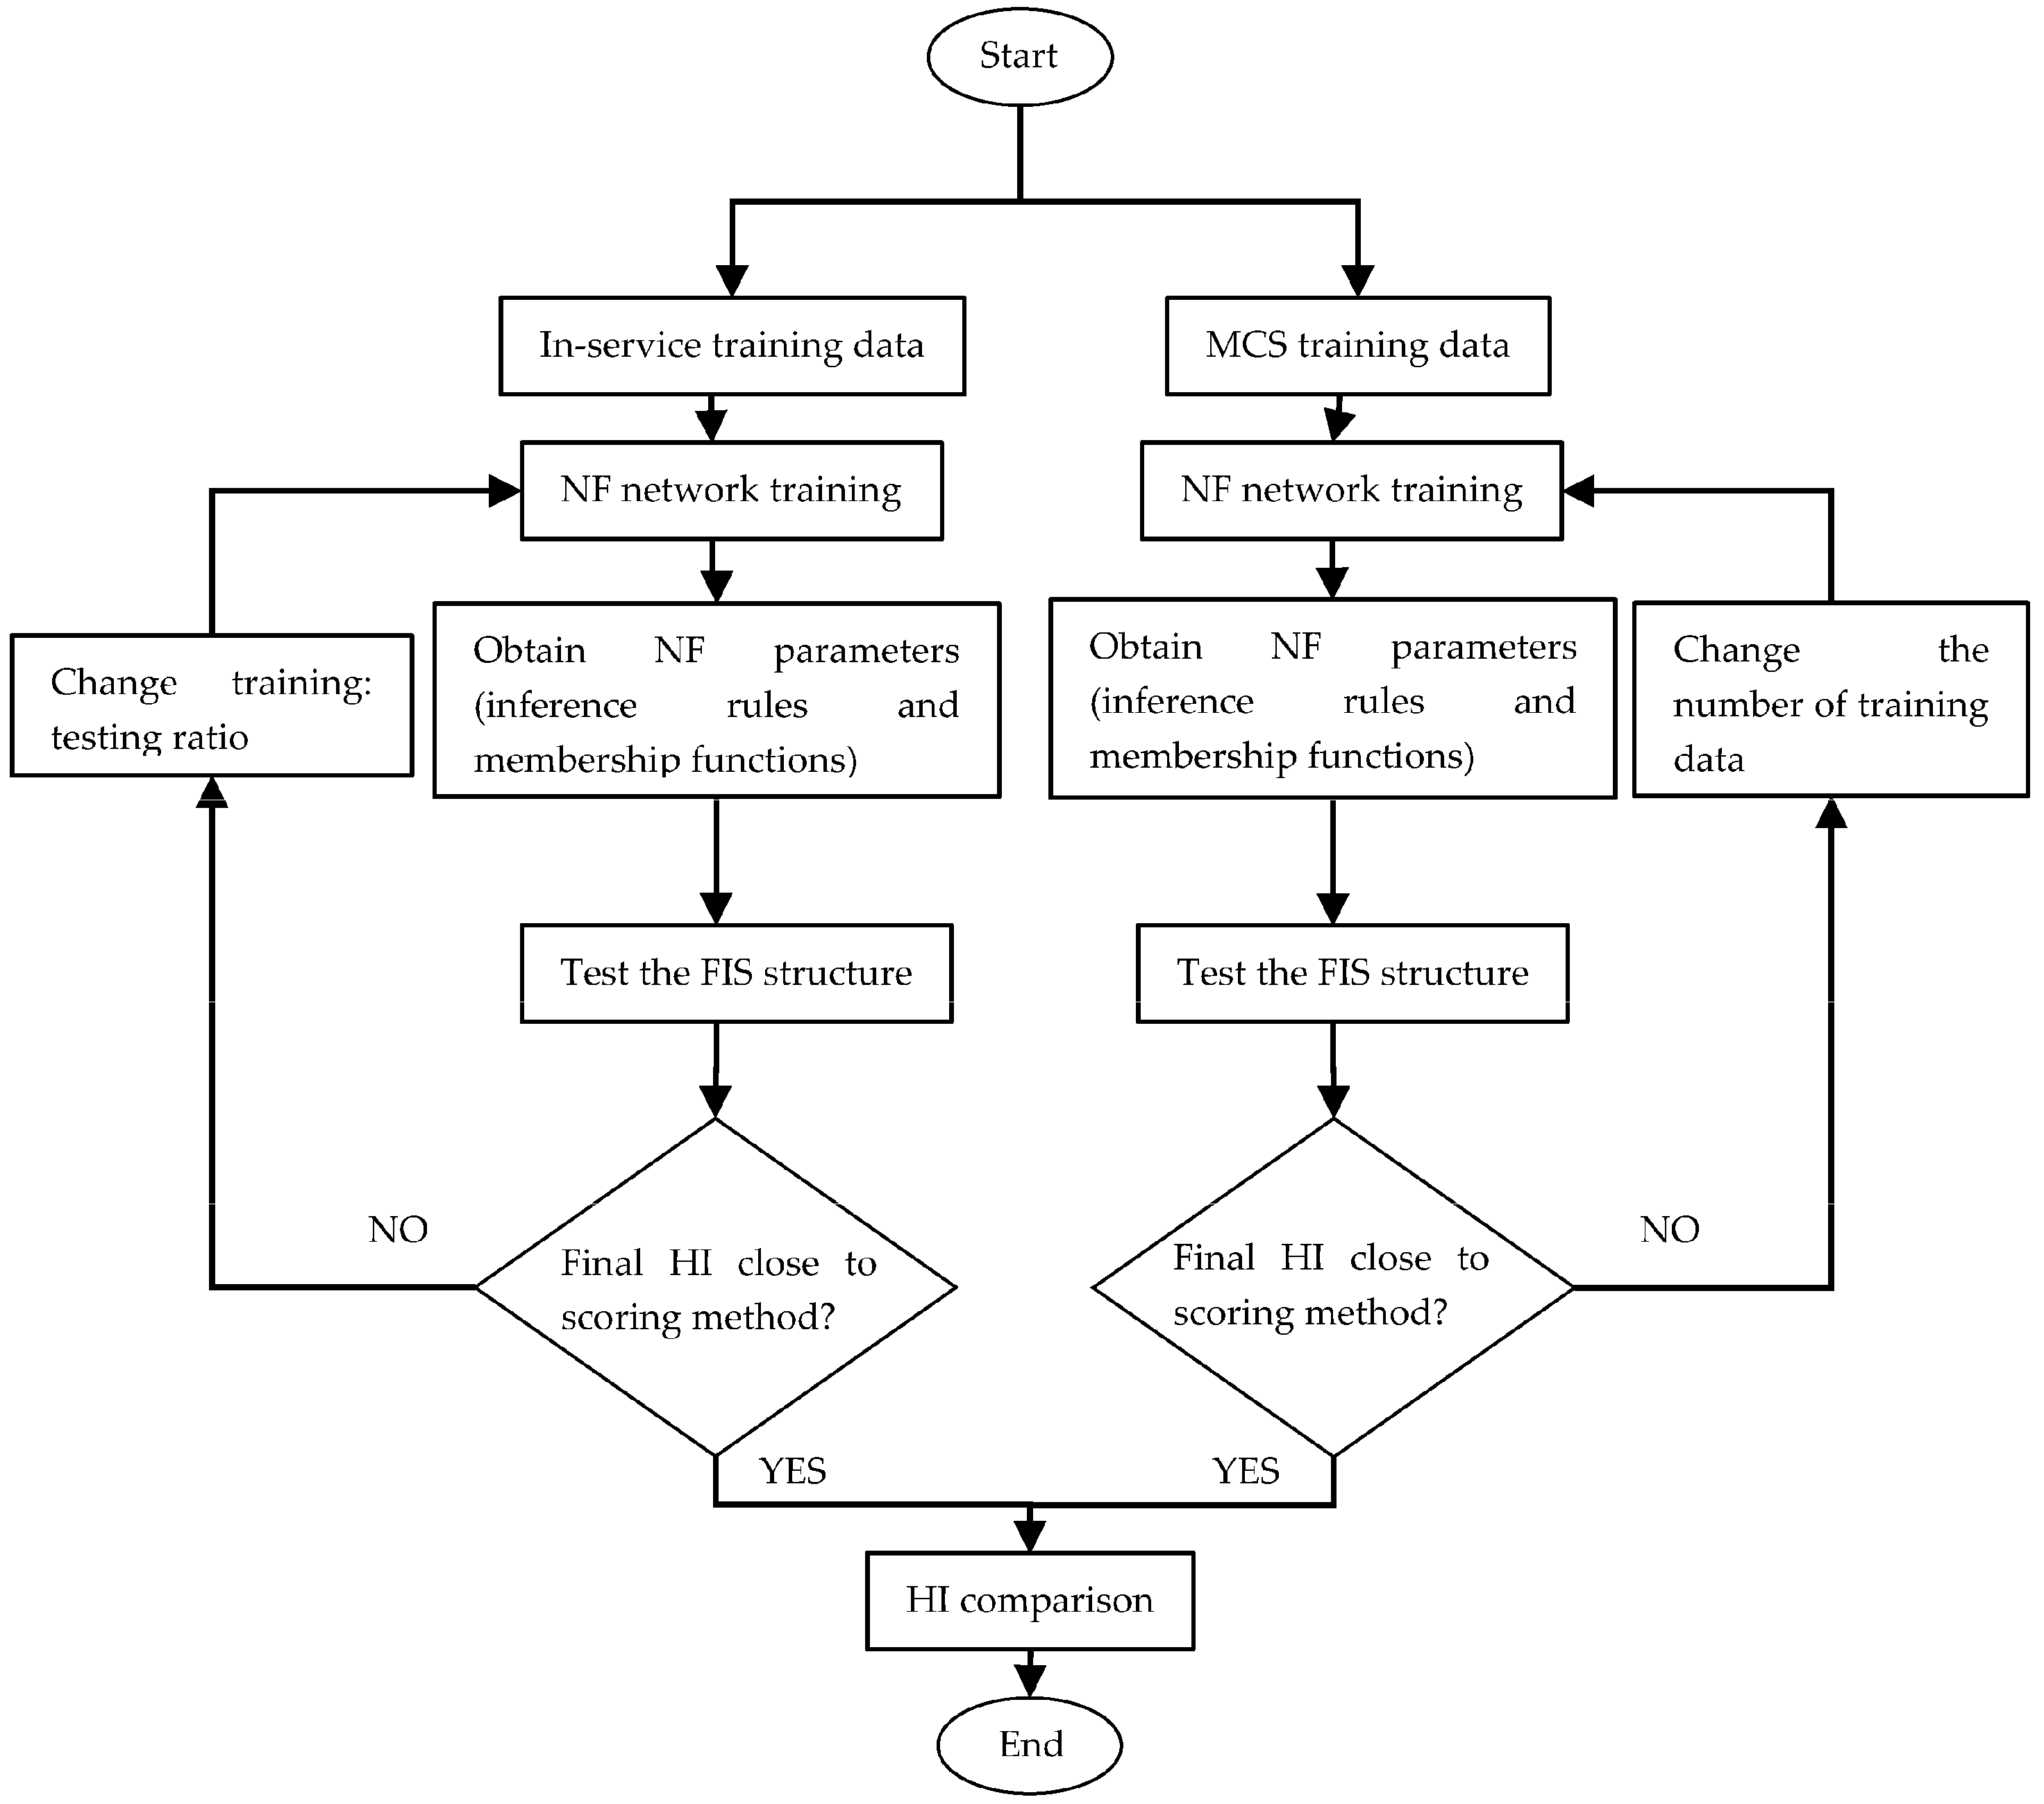
4.2. Data Training
The flowchart for the training process of the NF network can be seen in Figure 3. The ratio of training and testing data was varied in order to optimize the NF network trained based on in-service condition assessment data. On the other hand, the NF network trained based on MCS data was optimized by varying the number of training data.
4.2.1. Training Based on In-Service Condition Assessment Data
In order to optimize the NF network parameters, the training data chosen should be higher than the testing data. In total, 58 in-service condition assessment data from 73 transformers were randomly chosen for training the NF network. For testing, 15 in-service condition transformers data were selected from 73 transformers. The time period of the data was between October 2014 and September 2015. The HI was first computed using the scoring method since the training of the NF network required the information of both condition assessment data and its corresponding HI.
4.2.2. Training Based on Monte Carlo Simulation
A set of data was generated based on MCS to train the NF network. MCS is based on iterated random samplings and it is widely used to evaluate difficult mathematical problems, such as complex integration [25]. In this study, the generation of training data was carried out through bivariate normal distribution function as shown in Equation (8) with two-step transformation. The first step was to generate random pair of data based on bivariate normal distribution function. An assumption was made of which there was a statistical dependency between these data and each has normal marginal distribution. The mean vectors were set to 0 while the diagonal and off-diagonal covariance matrices were set to 1 and 0.72 based on trial and error which gave the closest final data to the in-service condition assessment and HI data ranges.
where and are 1-by-d variables, d = 1, 2, 3 …, while is a d-by-d symmetric positive definite matrix that contains the variances for each variables.
Once the random pair of data were generated, the normal cumulative distribution function in Equation (9) was applied as the first transformation step to convert each of data having the normal marginal distribution into normal distribution. Next, the second transformation step of the generated pairs of data was applied individually to each of the data based on inverse normal cumulative distribution function in order to get a complete set of data for training the NF network. The mean and standard deviation for each type of the in-service condition assessment data and computed HI obtained based on scoring method from the transformers population under study were used in the inverse normal cumulative distribution function. This procedure is carried out to create the statistical correlation between the random generated pair of data and the in-service condition assessment data obtained from the utility. This distribution was chosen since it produced data close to the condition assessment and HI data ranges after trial and error as compared to other types of distributions. The final step before training the NF network was to filter the outliers of the generated condition assessment and HI data. For condition assessment data, the ranges of outliers were obtained from the transformer population under study, while the HI was bounded between 0 and 100. Figure 4 shows the simulated MCS data based on the normal distribution for all parameters.
where is the data, is the mean and is the standard deviation.
4.3. Membership Function
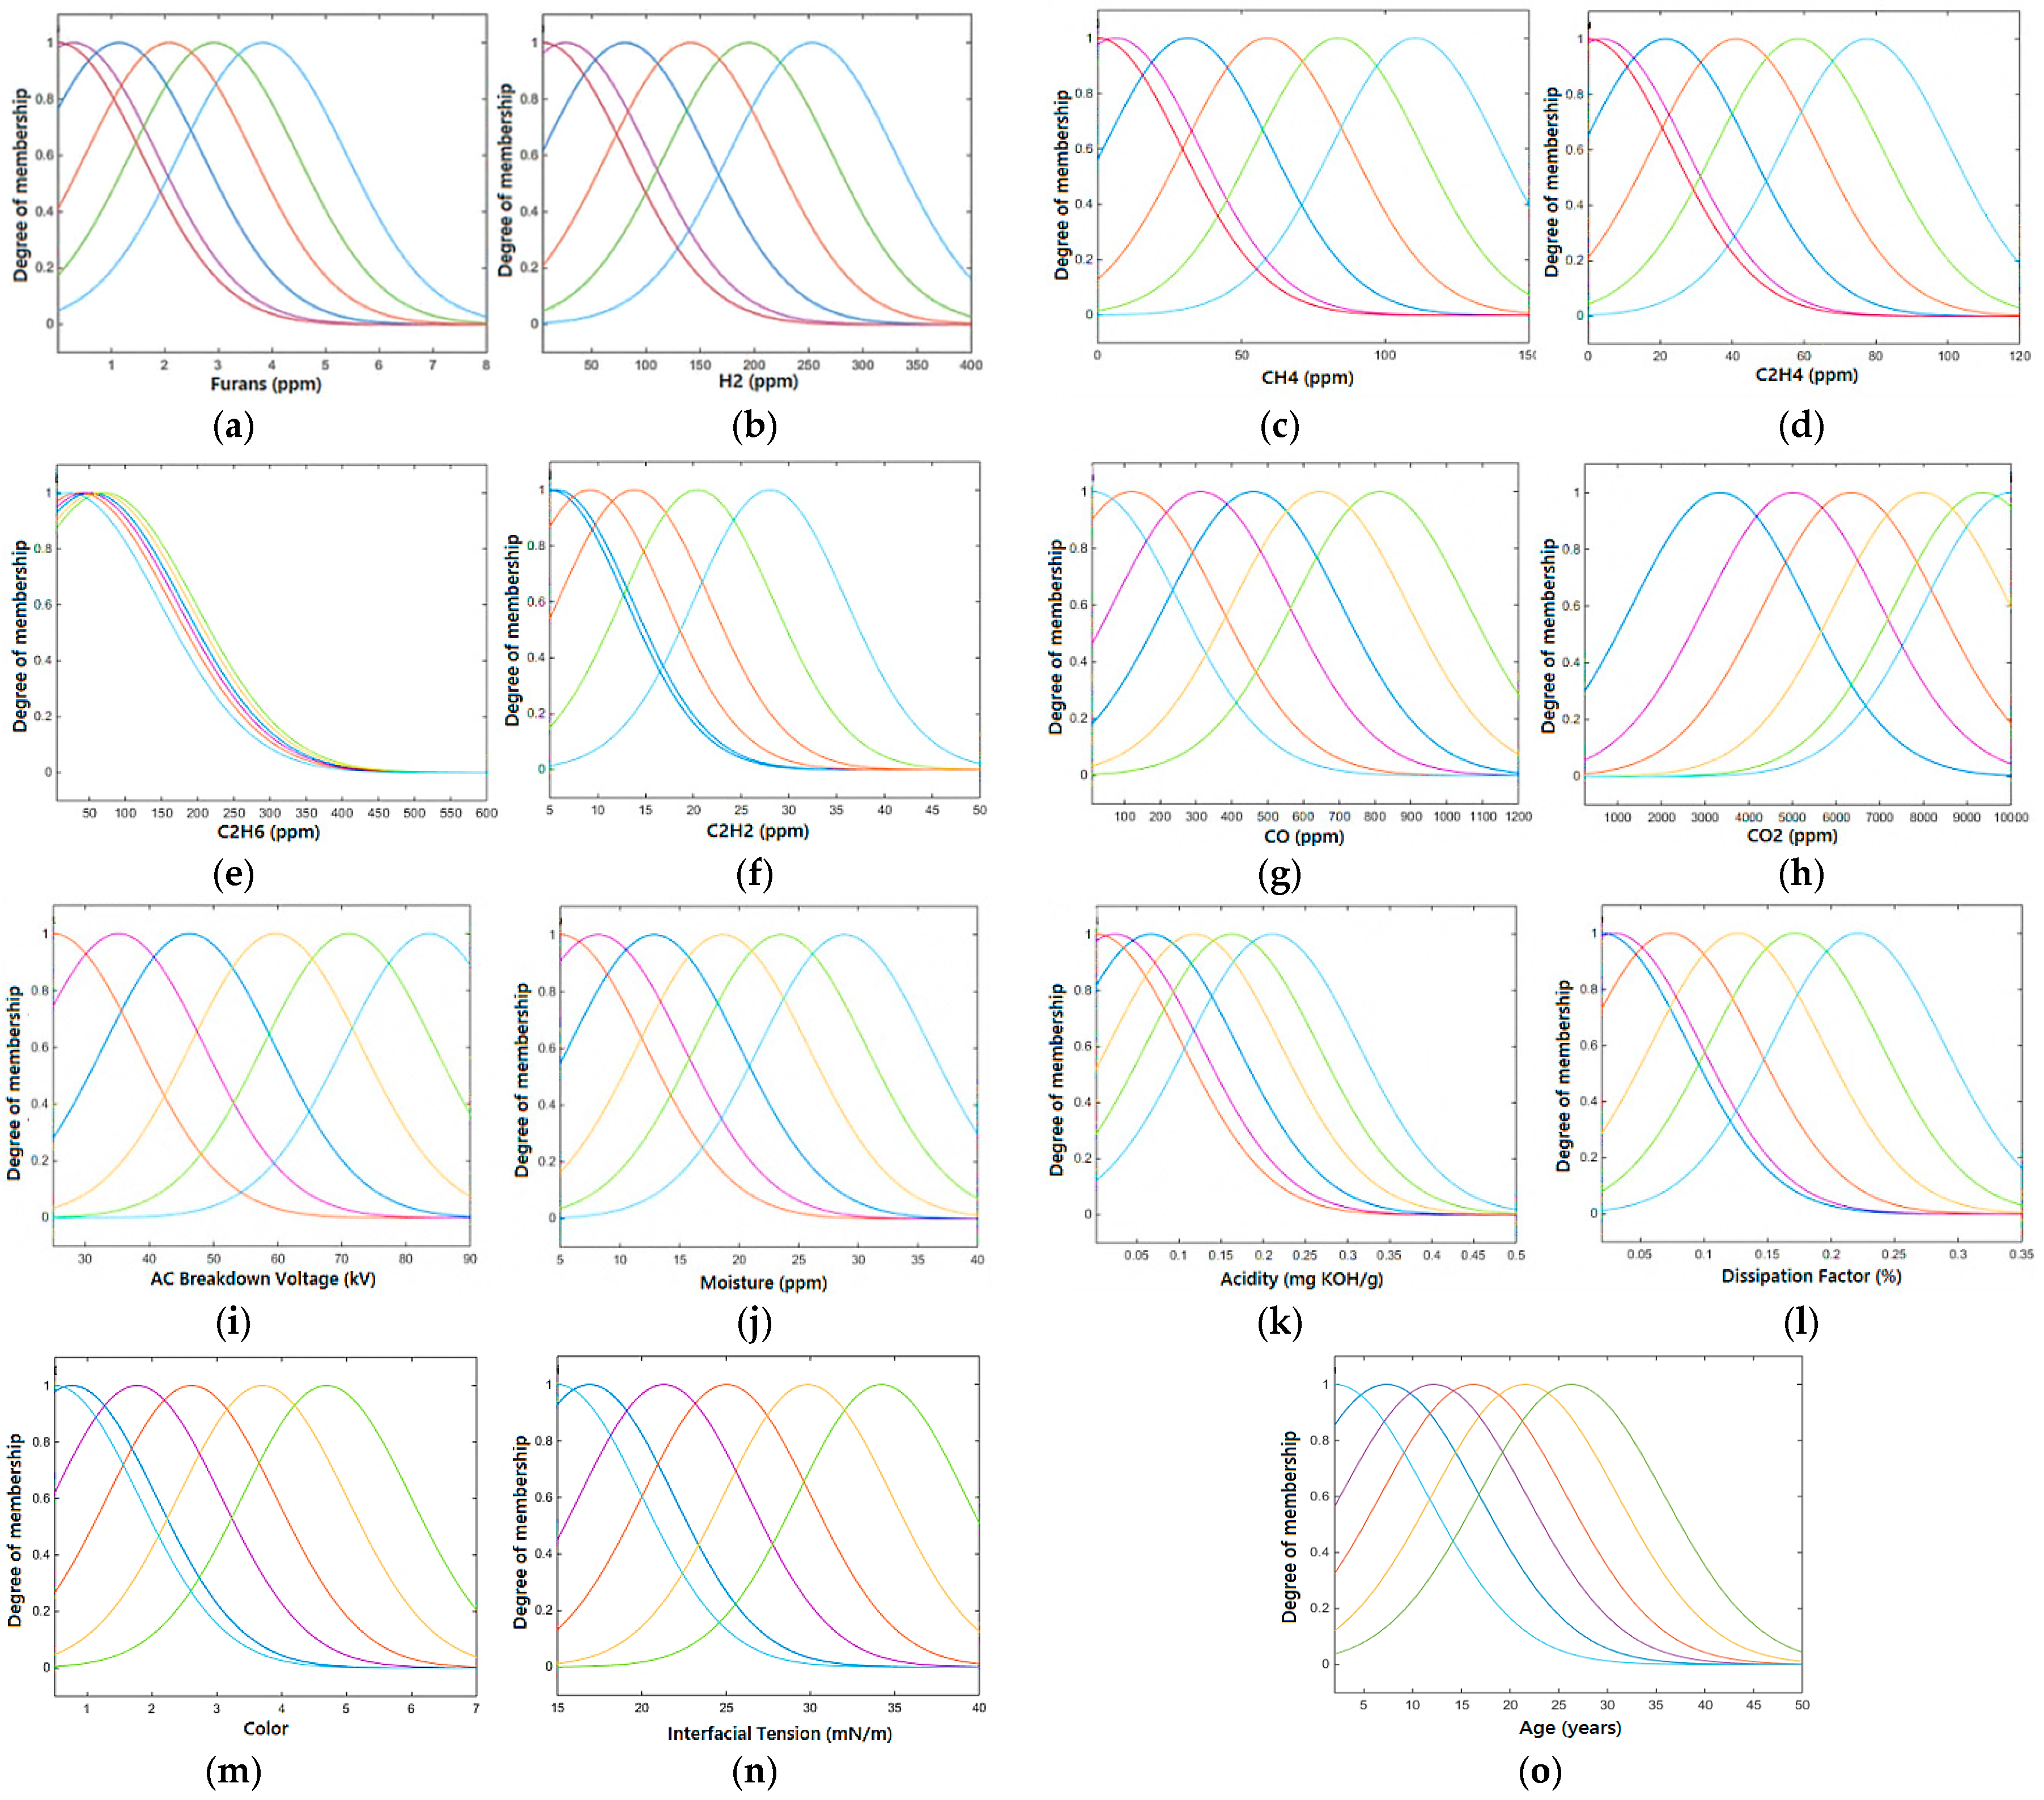
Tagaki-Sugeno FIS based on subtractive clustering with Gaussian memberships for each input was used in this study for both training based on in-service condition assessment and MCS data. The MF parameters were adjusted based on the back-propagation algorithm through training process. The inputs of HI were mapped based on Tagaki-Sugeno FIS using the set of input MF through fuzzification process. Next, it used the fuzzified inputs to compute the firing strength of the rule using AND operator. The AND operator used the minimum MF values and the crisp value of the output was obtained by defuzzification process by aggregating the output of the rules. Tagaki-Sugeno FIS had no output MF and in its place, the output was a crisp number (linear or constant) computed each through summation of the products between the input and constant. Through the training process, the errors can be reduced to produce the optimal model of FIS. An example of the optimal models of FIS used in Table 1 for training based on MCS data which had 6 MF can be seen in Figure 5. On the other hand, 10 MF were obtained through training based on in-service condition assessment data. The membership functions and its rules were utilized by Tagaki-Sugeno FIS to find the output of HI. All of the consequent membership functions were represented by singleton spike. The final output of the system was the weighted average of all rule outputs, according to Equation (7).
5. Result and Discussion
For T1, the HI obtained by NF-MCS and NF-IS methods are lower than the scoring method, which can be seen in Table 1. The HI and assessments based on NF-MCS in Table 1 and Table 2 have been obtained after multiple simulations which give the closest results to scoring method. Multiple simulations have been carried out for NF-MCS due to fact that MCS will generate a new set of training data for each of the simulation. The percentage of difference between HI obtained by scoring and NF-MCS methods for T1 is 27.14% which is slightly lower than NF-IS with percentage of 29.3%. The same pattern is observed for T2 and T3 with higher percentages of differences between scoring and NF-MCS/NF-IS methods. It is observed that T1 and T2 are given “very bad” assessments by NF-MCS and NF-IS, which are reasonable since these transformers have high furans, dissolved gases, moisture and acidity as well as low IFT and ACBDV. Even though T3 has a good level of moisture, DF, and ACBDV, the concentration of furans is reasonably high with value of 1.43 ppm. The NF-MCS and NF-IS methods give “bad” assessment for T3 as compared to “moderate” assessment by scoring method.
For T4, the HI obtained by NF-MCS and NF-IS are higher than scoring method. The percentage of difference between HI obtained by scoring and NF-MCS methods is much lower than NF-IS, with values of 8.2% and 56.3%, respectively. NF-MCS gives “bad” assessment for T4 which is in line with the scoring method mainly due to the high furans, CO, CO2, and DF. For T5, the HI obtained from scoring method is closer to NF-IS method than NF-MCS method with percentage of difference of 22.7% as compared to 25.6%. The scoring and NF-IS methods give “good” and “very good” assessments for T5. However, NF-MCS gives “moderate” assessment for T5 due to consideration on the furans concentration of 0.6 ppm and age of 18 years.
The HI obtained by NF-IS method is closer to scoring method than NF-MCS method for T6–T10. In addition, the HI of T6, T9, and T10 obtained by NF-IS are exactly the same as the scoring method. Both NF-MCS and NF-IS give “good” assessments to T6–T10. Meanwhile, for scoring method, T7 and T8 are given “moderate” assessments due to the dissolved gases are is higher than normal condition as suggested in [26]. Due to the nature of scoring method algorithm, individual parameter, such as dissolved gases, has high weighting factor that could influence the final computation of the HI. As compared to T6–T10, the HI of T11–T15 obtained by the NF-MCS method are closer to scoring method. The NF-MCS gives “very good” assessments for T11–T15 which are in line with the scoring method. This is expected since the in-service condition data of these transformers are in a “very good” condition. The same assessments are given by NF-IS, except for T11.
There are a few deviations between HI obtained by NF and scoring methods. These deviations could be contributed by the lack of the training data for the NF-IS method and the differences on the concept of the computation for both NF and scoring methods. Based on NF-IS method, eight transformers have the same assessments as scoring method. On the other hand, the assessments by NF-MCS method are closer to scoring method with 10 transformers having the same assessments.
Further analysis was carried out to determine the HI and assessments of the remaining 58 transformers based on NF-MCS method as shown in Table 2. The analysis based on NF-IS method could not be carried out due to the fact that the in-service condition assessment data of the 58 transformers are used to train the NF network. It is found that NF-MCS method gives 35 transformers with the same assessments as scoring method. The deviations of transformers assessments between NF-MCS and the scoring methods are due to the differences on the computation approaches. Scoring method mainly relies on the weighting factors whereby NF-MCS method utilizes the MCS training data to compute the HI. The NF-MCS method has better flexibility than NF-IS method since the in-service condition assessment data is not used for training the NF network. In addition, the NF-MCS can provide larger training data set than NF-IS to cover the range of the testing data.
6. Conclusions
In this paper, the HI of transformers based on NF network is presented. In-service condition data, such as ACBDV, DF, moisture, IFT, acidity, total dissolved gases in oil, furans, and age are used to determine HI of transformers. Based on the case study, it is found that the percentage of difference between HI of transformers obtained by scoring and NF-IS methods can be as high as 56.3%, while for NF-MCS, it is 31.5%. In addition, the condition assessment of transformers obtained by NF-MCS method is closer to scoring method. Based on 15 testing transformers, 10 transformers have the same assessments for both scoring and NF-MCS methods, while only eight transformers for NF-IS method. Additional analysis based on NF-MCS method reveals that 45 out of 73 transformers have the same assessments with scoring method.
Acknowledgments
The authors would like to thank the Ministry of Education and Universiti Putra Malaysia for the funding provided for this study under the FRGS scheme (03-02-13-1280FR) and PUTRA Berimpak and IPS schemes (GPB/2017/9570300), (GP-IPS/2016/9498800).
Author Contributions
The research study was carried out successfully with contribution from all authors. The main research idea, simulation works and manuscript preparation were contributed by Emran Jawad Kadim. Norhafiz Azis contributed on the manuscript preparation and research idea. Jasronita Jasni and Siti Anom Ahmad assisted on finalizing the research work and manuscript. Mohd Aizam Talib gave several suggestions from the industrial perspectives. All authors revised and approved the publication of the paper.
Conflicts of Interest
The authors declare no conflicts of interest.
Nomenclature
| Score for each parameter. | |
| Weighting factor for individual condition parameter. | |
| Number of parameter in each factor. | |
| Weighting factor for transformers condition parameter. | |
| Rating code for each parameter. | |
| Output layer. | |
| Linguistic label. | |
| Centre of the Gaussian function. | |
| Parameter set in the consequent. | |
| Spread of the membership function. | |
| Type of membership function. | |
| The crisp inputs to node. | |
| Normalized degrees of activation (firing strength) | |
| Degrees of activation (firing strength) of ith rules | |
| ith nodes output from the previous layer | |
| The node function. | |
| Data | |
| Mean | |
| Standard deviation |
References
- Wu, Q.H.; Tang, W.H. Condition Monitoring and Assessment of Power Transformers Using Computational Intelligence; Springer: London, UK, 2011. [Google Scholar]
- CIGRE Working Group A2.18. Guide for Life Management Techniques for Power Transformer; International Council on Large Electric Systems: Paris, France, 2003; Volume 227. [Google Scholar]
- Chakravorti, S.; Dey, D.; Chatterjee, B. Recent Trends in the Condition Monitoring of Transformers: Theory, Implementation and Analysis; Power Systems; Springer: London, UK, 2013; Volume 67. [Google Scholar]
- Jahromi, A.; Piercy, R.; Cress, S.; Service, J.; Fan, W. An approach to power transformer asset management using health index. IEEE Electr. Insul. Mag. 2009, 25, 20–34. [Google Scholar] [CrossRef]
- Waugh, N.T.; Muir, D.D. Improving the life cycle management of power transformers transforming data to life. In Proceedings of the SoutheastCon, Fort Lauderdale, FL, USA, 9–12 April 2015; pp. 1–7. [Google Scholar]
- Taengko, K.; Damrongkulkamjorn, P. Risk assessment for power transformers in PEA substations using health index. In Proceedings of the 10th International Conference on Electrical Engineering/Electronics, Computer, Telecommunications and Information Technology (ECTI-CON), Krabi, Thailand, 15–17 May 2013; pp. 1–6. [Google Scholar]
- Zhang, X.; Gockenbach, E. Asset-Management of Transformers Based on Condition Monitoring and Standard Diagnosis [Feature Article]. IEEE Electr. Insul. Mag. 2008, 24, 26–40. [Google Scholar] [CrossRef]
- Wang, M.; Vandermaar, A.J.; Srivastava, K.D. Review of condition assessment of power transformers in service. IEEE Electr. Insul. Mag. 2002, 18, 12–25. [Google Scholar] [CrossRef]
- De Pablo, A. Furfural and ageing: How are they related. In Proceedings of the IEEE Colloquium on Insulating Liquids (Ref. No. 1999/119), Leatherhead, UK, 27–27 May 1999. [Google Scholar]
- Schaut, A.; Autru, S.; Eeckhoudt, S. Applicability of methanol as new marker for paper degradation in power transformers. IEEE Trans. Dielectr. Electr. Insul. 2011, 18, 533–540. [Google Scholar] [CrossRef]
- Matharage, S.Y.; Liu, Q.; Wang, Z.D.; Mavrommatis, P.; Wilson, G.; Jarman, P. Ageing assessment of transformer paper insulation through detection of methanol in oil. In Proceedings of the IEEE 11th International Conference on the Properties and Applications of Dielectric Materials (ICPADM), Sydney, Australia, 19–22 July 2015; pp. 392–395. [Google Scholar]
- Bakar, N.A.; Abu-Siada, A.; Islam, S. A review of dissolved gas analysis measurement and interpretation techniques. IEEE Electr. Insul. Mag. 2014, 30, 39–49. [Google Scholar] [CrossRef]
- Abu-Siada, A.; Islam, S. A new approach to identify power transformer criticality and asset management decision based on dissolved gas-in-oil analysis. IEEE Trans. Dielectr. Electr. Insul. 2012, 19, 1007–1012. [Google Scholar] [CrossRef]
- Nemeth, B.; Laboncz, S.; Kiss, I. Condition monitoring of power transformers using DGA and Fuzzy logic. In Proceedings of the IEEE Electrical Insulation Conference (EIC), Montreal, QC, Canada, 31 May–3 June 2009; pp. 373–376. [Google Scholar]
- Montanari, G.C.; Morshuis, P.; Cervi, A. Monitoring HV transformer conditions: The strength of combining various diagnostic property observations. In Proceedings of the IEEE Electrical Insulation Conference (EIC), Seattle, WA, USA, 7–10 June 2015; pp. 141–144. [Google Scholar]
- Naderian, A.; Cress, S.; Piercy, R.; Wang, F.; Service, J. An Approach to Determine the Health Index of Power Transformers. In Proceedings of the IEEE International Symposium on Electrical Insulation (ISEI), Vancouver, BC, Canada, 9–12 June 2008; pp. 192–196. [Google Scholar]
- Phadungthin, R.; Haema, J. Risk optimization of power transformer tank and accessories: Practical experiences in Thailand. In Proceedings of the 2015 50th International Universities Power Engineering Conference (UPEC), Stoke on Trent, UK, 1–4 September 2015; pp. 1–6. [Google Scholar]
- Singh, J.; Sood, Y.R.; Jarial, R.K. Condition Monitoring of Power Transformers—Bibliography Survey. IEEE Electr. Insul. Mag. 2008, 24, 11–25. [Google Scholar] [CrossRef]
- Ashkezari, A.D.; Hui, M.; Saha, T.K.; Ekanayake, C. Application of fuzzy support vector machine for determining the health index of the insulation system of in-service power transformers. IEEE Trans. Dielectr. Electr. Insul. 2013, 20, 965–973. [Google Scholar] [CrossRef]
- Abu-Elanien, A.E.B.; Salama, M.M.A.; Ibrahim, M. Calculation of a Health Index for Oil-Immersed Transformers Rated Under 69 kV Using Fuzzy Logic. IEEE Trans. Power Deliv. 2012, 27, 2029–2036. [Google Scholar] [CrossRef]
- Abu-Elanien, A.E.B.; Salama, M.M.A.; Ibrahim, M. Determination of transformer health condition using artificial neural networks. In Proceedings of the International Symposium on Innovations in Intelligent Systems and Applications (INISTA), Istanbul, Turkey, 15–18 June 2011; pp. 1–5. [Google Scholar]
- Ahmed, M.; Elkhatib, M.; Salama, M.; Shaban, K.B. Transformer Health Index estimation using Orthogonal Wavelet Network. In Proceedings of the IEEE Electrical Power and Energy Conference (EPEC), London, ON, Canada, 26–28 October 2015; pp. 120–124. [Google Scholar]
- Haema, J.; Phadungthin, R. Condition assessment of the health index for power transformer. In Proceedings of the IEEE Power Engineering and Automation Conference (PEAM), Wuhan, China, 18–20 September 2012; pp. 1–4. [Google Scholar]
- Jang, J.S.R. ANFIS: Adaptive-network-based fuzzy inference system. IEEE Trans. Syst. Man Cybern. 1993, 23, 665–685. [Google Scholar] [CrossRef]
- Sediva, S.; Uher, M.; Havlikova, M. Application of the Monte Carlo method to estimate the uncertainty of air flow measurement. In Proceedings of the 16th International Carpathian Control Conference (ICCC), Szilvasvarad, Hungary, 27–30 May 2015; pp. 465–469. [Google Scholar]
- IEEE Guide for the Interpretation of Gases Generated in Oil-Immersed Transformers; IEEE Std C57.104-2008 (Revision of IEEE Std C57.104-1991); IEEE: New York, NY, USA, 2009; pp. 1–36.
Figure 1.
Workflow of the study. HI: health index; NF: Neural-Fuzzy.
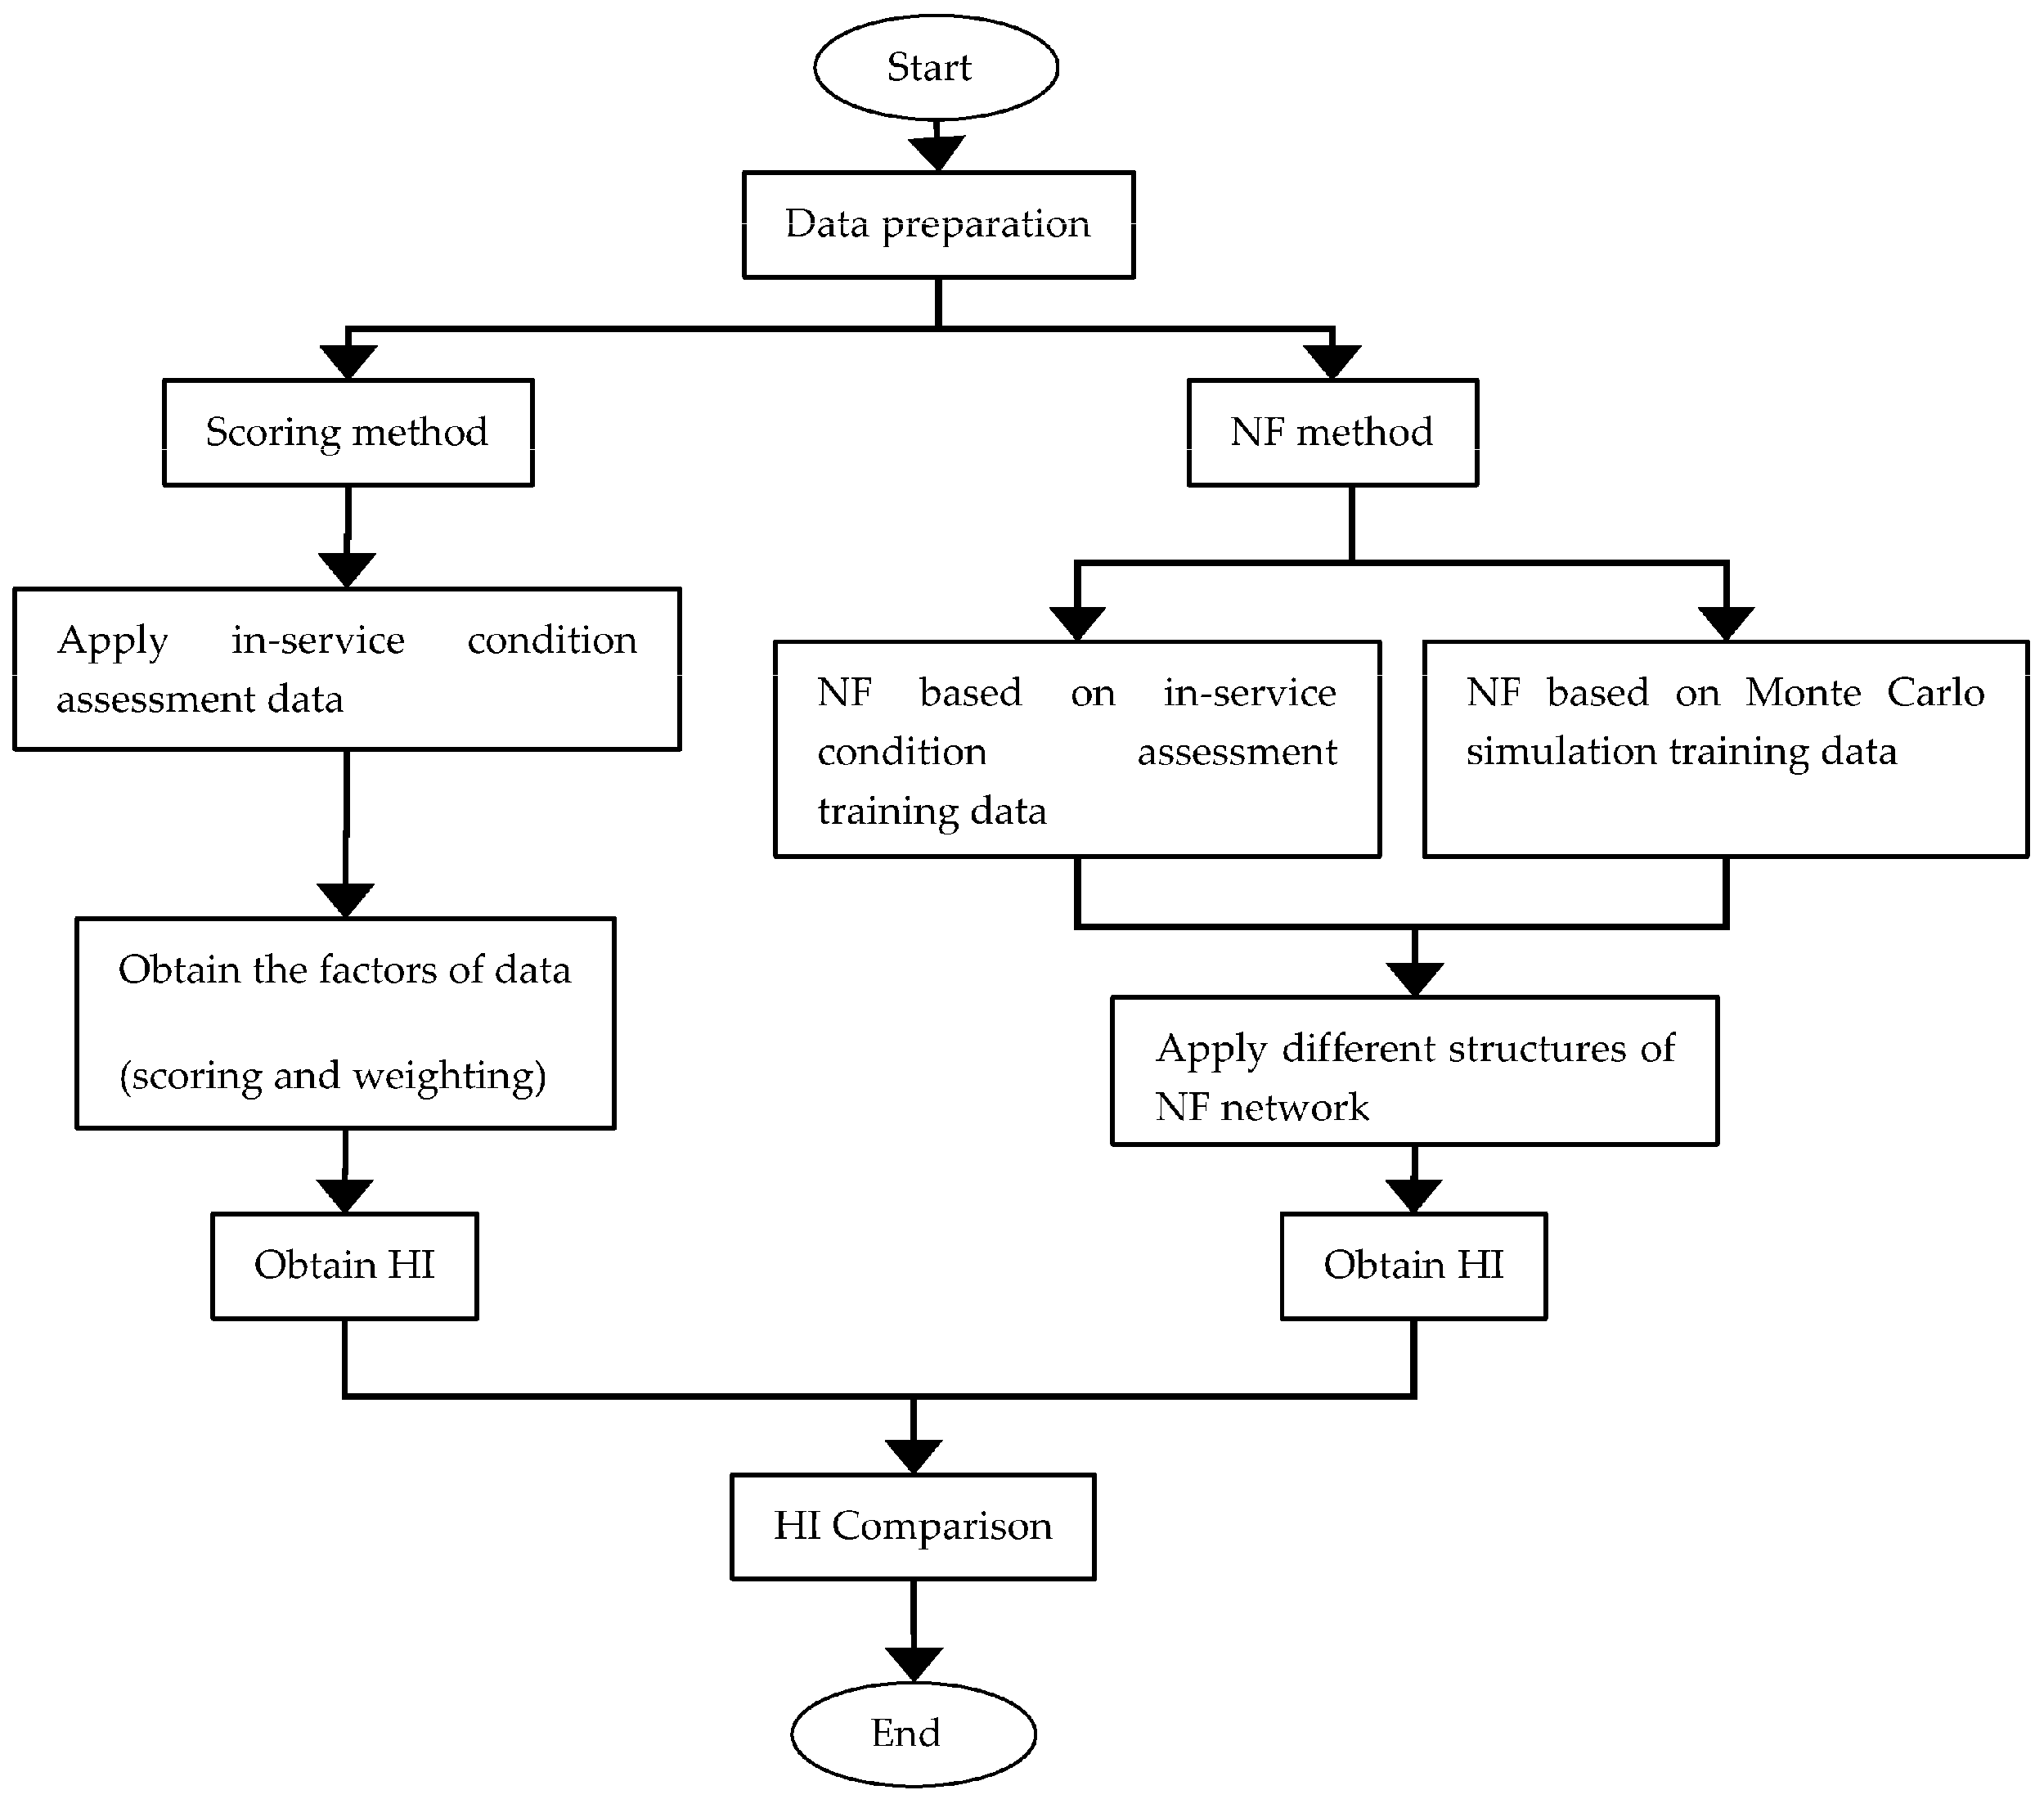
Figure 2.
Neural-Fuzzy (NF) network architecture. ACBDV: AC breakdown voltage; DF: dissipation factor; IFT: interfacial tension.
Figure 2.
Neural-Fuzzy (NF) network architecture. ACBDV: AC breakdown voltage; DF: dissipation factor; IFT: interfacial tension.

Figure 3.
Flowchart for training the NF network. MCS: Monte Carlo Simulation.

Figure 4.
Simulated MCS data of (a) furans; (b) hydrogen (H2); (c) methane (CH4); (d) ethane (C2H4); (e) ethylene (C2H6); (f) acetylene (C2H2); (g) carbon monoxide (CO); (h) carbon dioxide (CO2); (i) ACBDV; (j) moisture; (k) acidity; (l) DF; (m) color; (n) IFT and (o) age versus HI.
Figure 4.
Simulated MCS data of (a) furans; (b) hydrogen (H2); (c) methane (CH4); (d) ethane (C2H4); (e) ethylene (C2H6); (f) acetylene (C2H2); (g) carbon monoxide (CO); (h) carbon dioxide (CO2); (i) ACBDV; (j) moisture; (k) acidity; (l) DF; (m) color; (n) IFT and (o) age versus HI.
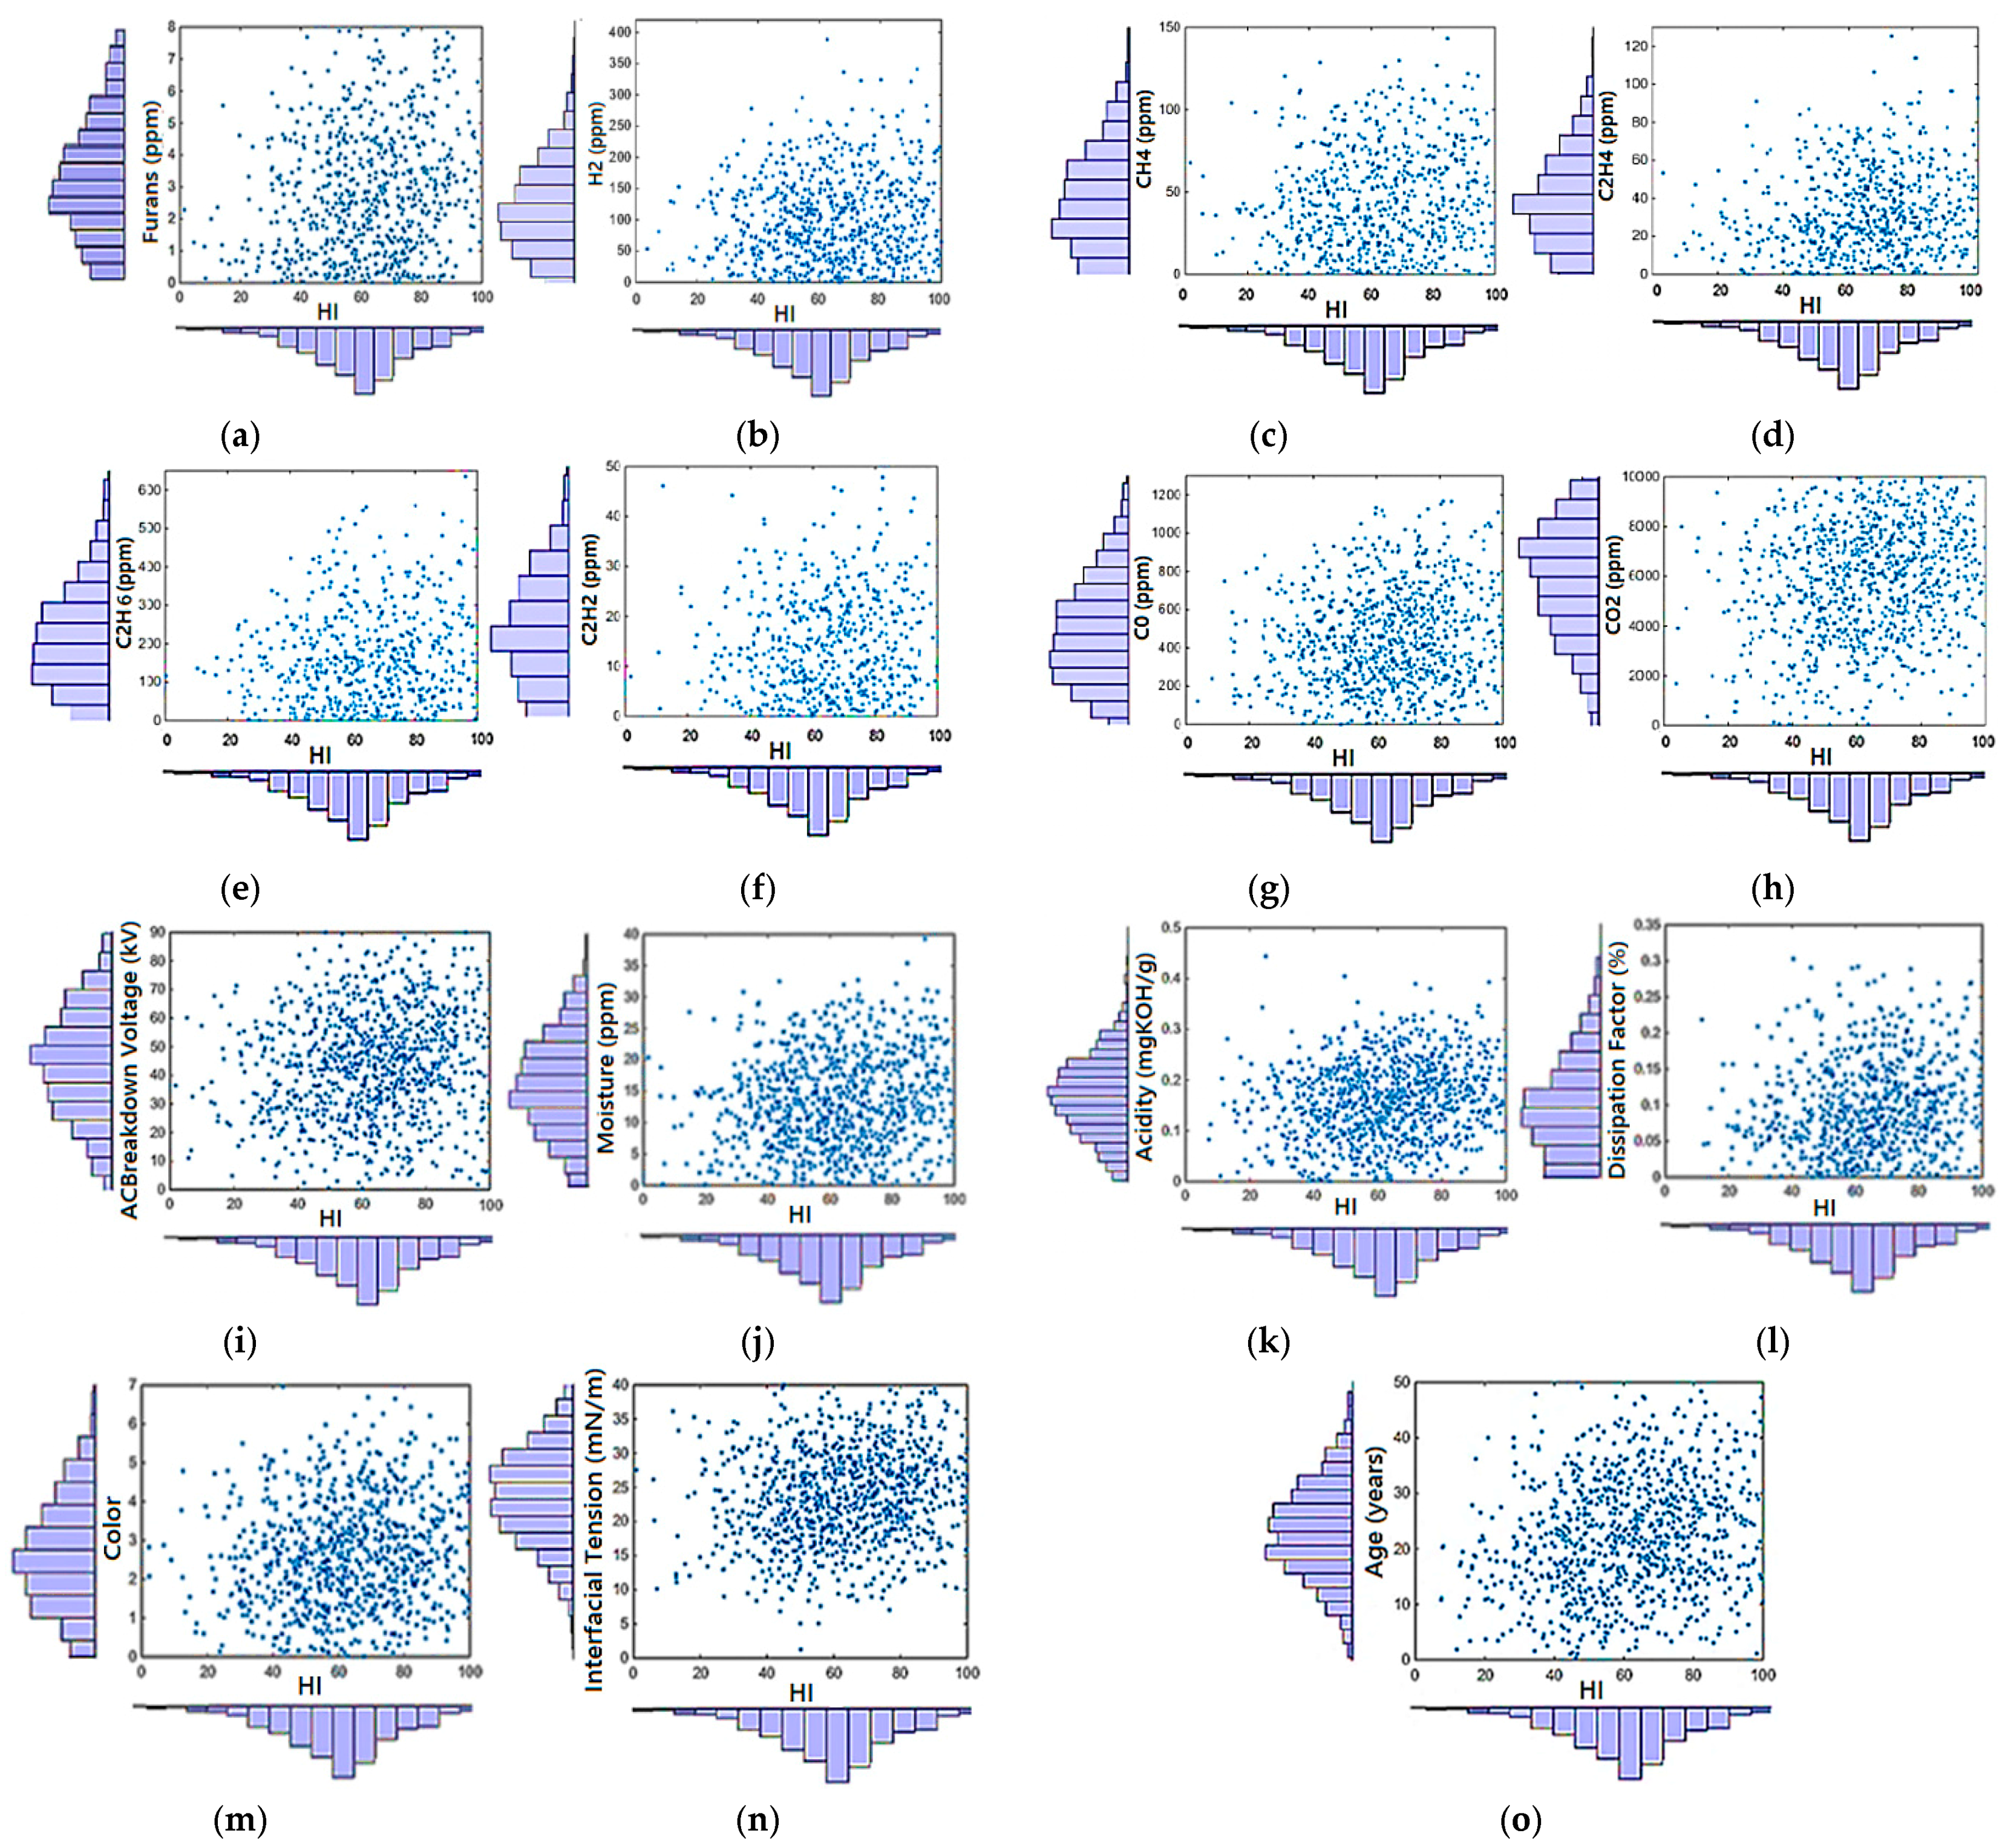
Figure 5.
Membership functions of (a) furans; (b) H2; (c) CH4; (d) C2H4; (e) C2H6; (f) C2H2; (g) CO; (h) CO2; (i) ACBDV; (j) moisture; (k) acidity; (l) DF; (m) color; (n) IFT and (o) age for training based on MCS data.
Figure 5.
Membership functions of (a) furans; (b) H2; (c) CH4; (d) C2H4; (e) C2H6; (f) C2H2; (g) CO; (h) CO2; (i) ACBDV; (j) moisture; (k) acidity; (l) DF; (m) color; (n) IFT and (o) age for training based on MCS data.

Table 1.
HI and assessments of testing transformers based on scoring and NF methods (15 transformers). HI: health index; NF: Neural-Fuzzy; BDV: breakdown voltage; DF: dissipation factor; IFT: interfacial tension; IS: inference system; MCS: Monte Carlo Simulation.
Table 1.
HI and assessments of testing transformers based on scoring and NF methods (15 transformers). HI: health index; NF: Neural-Fuzzy; BDV: breakdown voltage; DF: dissipation factor; IFT: interfacial tension; IS: inference system; MCS: Monte Carlo Simulation.
| Transformer | T1 | T2 | T3 | T4 | T5 | T6 | T7 | T8 | T9 | T10 | T11 | T12 | T13 | T14 | T15 |
|---|---|---|---|---|---|---|---|---|---|---|---|---|---|---|---|
| Furans (ppm) | 3.34 | 1.68 | 1.43 | 1.4 | 0.6 | 0.1 | 0.1 | 0.13 | 0.32 | 0.401 | 0 | 0.12 | 0.08 | 0.08 | 0.05 |
| H2 (ppm) | 22 | 98 | 70 | 8 | 12 | 8 | 88 | 180 | 503 | 277 | 11 | 13 | 12 | 14 | 134 |
| CH4 (ppm) | 103 | 122 | 6 | 4 | 1 | 2 | 168 | 126 | 7 | 20 | 4 | 2 | 2 | 2 | 32 |
| CO (ppm) | 783 | 781 | 578 | 631 | 17 | 172 | 356 | 473 | 305 | 335 | 395 | 206 | 146 | 127 | 245 |
| CO2 (ppm) | 3501 | 4784 | 8551 | 6535 | 286 | 3382 | 6080 | 7821 | 6561 | 2416 | 2700 | 2764 | 2123 | 1766 | 3086 |
| C2H4 (ppm) | 18 | 46 | 2 | 116 | 0 | 15 | 24 | 16 | 2 | 1 | 4 | 14 | 6 | 4 | 3 |
| C2H6 (ppm) | 93 | 105 | 3 | 1 | 0 | 0 | 615 | 373 | 15 | 35 | 1 | 0 | 0 | 0 | 44 |
| C2H2 (ppm) | 0 | 5 | 0 | 0 | 2 | 0 | 0 | 0 | 0 | 0 | 0 | 0 | 0 | 0 | 0 |
| Moisture (ppm) | 35 | 23 | 9 | 10 | 12 | 12 | 4 | 4 | 7 | 7 | 3 | 11 | 10 | 8 | 3 |
| BDV (kV) | 27 | 25 | 57 | 48 | 48 | 26 | 49 | 49 | 55 | 69 | 97 | 57 | 27 | 31 | 94 |
| DF (%) | 0.26 | 0.034 | 0.008 | 0.12 | 0.03 | 0.004 | 0.03 | 0.03 | 0.02 | 0.033 | 0.002 | 0.008 | 0.003 | 0.003 | 0.003 |
| Acidity (mg KOH/g) | 0.43 | 0.23 | 0.15 | 0.085 | 0.086 | 0.03 | 0.02 | 0.01 | 0.03 | 0.045 | 0.02 | 0.031 | 0.017 | 0.015 | 0.014 |
| IFT (mN/m) | 16 | 15 | 17 | 22 | 18 | 32 | 25 | 25 | 24 | 23 | 30 | 30 | 32 | 35 | 30 |
| Color | 7 | 4 | 3 | 5 | 3 | 2 | 1.5 | 1.5 | 1 | 2 | 1 | 2 | 1.5 | 1 | 0.5 |
| Age (years) | 23 | 21 | 11 | 29 | 18 | 16 | 7 | 7 | 4 | 8 | 14 | 16 | 16 | 16 | 4 |
| Scoring method HI | VB | B | M | B | G | G | M | M | G | G | VG | VG | VG | VG | VG |
| 28 | 34.6 | 55 | 41.6 | 76.6 | 70 | 66.6 | 61.6 | 73 | 80 | 100 | 88.3 | 86.6 | 93.3 | 91.6 | |
| NF-IS HI | VB | VB | B | M | VG | G | G | G | G | G | G | VG | VG | VG | VG |
| 19.8 | 18 | 30 | 65 | 94 | 70 | 71 | 73 | 73 | 80 | 78 | 90 | 88 | 87 | 87 | |
| NF-MCS HI | VB | VB | B | B | M | G | G | G | G | G | VG | VG | VG | VG | VG |
| 20.4 | 22.6 | 35.5 | 45 | 57 | 80 | 78 | 81 | 71 | 73 | 88 | 85 | 85.6 | 91 | 86 |
Where: VG = Very Good; G = Good; M = Moderate; B = bad; VB = Very Bad.
Table 2.
HI and assessments of transformers based on scoring and NF-MCS methods (58 transformers).
| Transformer | T16 | T17 | T18 | T19 | T20 | T21 | T22 | T23 | T24 | T25 | T26 | T27 | T28 | T29 | T30 |
| Scoring method HI | M | B | G | G | G | G | VG | G | VG | G | B | VB | M | M | G |
| 54.8 | 45.2 | 71.2 | 71.2 | 80.8 | 80.8 | 85.6 | 84.6 | 85.6 | 70.2 | 44.2 | 29.8 | 60.6 | 66.3 | 79.8 | |
| NF-MCS HI | B | VB | VG | G | G | VG | VG | M | VG | VG | M | VB | M | VG | G |
| 36 | 29 | 85.2 | 74.1 | 83.1 | 85 | 89.4 | 59 | 100 | 87.8 | 62 | 19 | 51 | 86 | 83 | |
| Transformer | T31 | T32 | T33 | T34 | T35 | T36 | T37 | T38 | T39 | T40 | T41 | T42 | T43 | T44 | T45 |
| Scoring method HI | G | VG | VG | G | B | G | B | G | B | VG | VG | M | M | M | M |
| 84.6 | 85.6 | 85.6 | 80.8 | 49 | 71.2 | 39.4 | 71.2 | 45.2 | 100 | 94.2 | 59.6 | 53.8 | 66.3 | 56.7 | |
| NF-MCS HI | G | G | VG | G | B | G | B | VB | VG | VG | VG | M | M | M | M |
| 82 | 80 | 98 | 70 | 39.1 | 83.8 | 49.6 | 23 | 88.2 | 90 | 97.6 | 56.9 | 55.5 | 67.2 | 54.5 | |
| Transformer | T46 | T47 | T48 | T49 | T50 | T51 | T52 | T53 | T54 | T55 | T56 | T57 | T58 | T59 | T60 |
| Scoring method HI | B | M | M | M | G | G | VG | VG | VG | VG | B | B | G | G | VG |
| 44.2 | 59.6 | 64.4 | 64.4 | 74 | 74 | 100 | 88.5 | 100 | 100 | 38.5 | 44.2 | 76 | 79.8 | 95.2 | |
| NF-MCS HI | G | M | M | M | G | G | VG | VB | M | G | VB | M | G | VB | VG |
| 80.5 | 60.5 | 66 | 69 | 76 | 75.6 | 96 | 12.1 | 51 | 80.2 | 18.3 | 50 | 84.3 | 24.9 | 85.1 | |
| Transformer | T61 | T62 | T63 | T64 | T65 | T66 | T67 | T68 | T69 | T70 | T71 | T72 | T73 | ||
| Scoring method HI | VG | B | B | G | G | M | G | M | M | M | M | M | M | ||
| 85.6 | 34.6 | 44.2 | 83.7 | 83.7 | 61.5 | 71.2 | 66.3 | 61.5 | 54.8 | 59.6 | 59.6 | 50 | |||
| NF-MCS HI | M | B | VB | M | G | M | G | M | VG | M | M | M | VG | ||
| 58.5 | 31 | 22 | 60 | 78.8 | 50.3 | 70 | 62.8 | 96 | 50.6 | 55.7 | 55.8 | 95.5 |
Where: VG = Very Good; G = Good; M = Moderate; B = bad; VB = Very Bad.
© 2018 by the authors. Licensee MDPI, Basel, Switzerland. This article is an open access article distributed under the terms and conditions of the Creative Commons Attribution (CC BY) license (http://creativecommons.org/licenses/by/4.0/).
Share and Cite
MDPI and ACS Style
Kadim, E.J.; Azis, N.; Jasni, J.; Ahmad, S.A.; Talib, M.A. Transformers Health Index Assessment Based on Neural-Fuzzy Network. Energies 2018, 11, 710. https://doi.org/10.3390/en11040710
AMA Style
Kadim EJ, Azis N, Jasni J, Ahmad SA, Talib MA. Transformers Health Index Assessment Based on Neural-Fuzzy Network. Energies. 2018; 11(4):710. https://doi.org/10.3390/en11040710
Chicago/Turabian StyleKadim, Emran Jawad, Norhafiz Azis, Jasronita Jasni, Siti Anom Ahmad, and Mohd Aizam Talib. 2018. "Transformers Health Index Assessment Based on Neural-Fuzzy Network" Energies 11, no. 4: 710. https://doi.org/10.3390/en11040710
Note that from the first issue of 2016, this journal uses article numbers instead of page numbers. See further details here.