Mitigation of Hot-Spots in Photovoltaic Systems Using Distributed Power Electronics


1
Department of Electrical, Electronic, and Automatic Control Engineering, Universitat Rovira i Virgili, 43007 Tarragona, Spain
2
National Renewable Energy Laboratory, Golden, CO 80401, USA
3
Department of Electrical, Computer, and Energy Engineering, University of Colorado, Boulder, CO 80309, USA
*
Author to whom correspondence should be addressed.
Energies 2018, 11(4), 726; https://doi.org/10.3390/en11040726
Submission received: 6 February 2018
/
Revised: 13 March 2018
/
Accepted: 14 March 2018
/
Published: 23 March 2018
(This article belongs to the Section I: Energy Fundamentals and Conversion)
Abstract
:In the presence of partial shading and other mismatch factors, bypass diodes may not offer complete elimination of excessive power dissipation due to cell reverse biasing, commonly referred to as hot-spotting in photovoltaic (PV) systems. As a result, PV systems may experience higher failure rates and accelerated ageing. In this paper, a cell-level simulation model is used to assess occurrence of hot-spotting events in a representative residential rooftop system scenario featuring a moderate shading environment. The approach is further used to examine how well distributed power electronics converters mitigate the effects of partial shading and other sources of mismatch by preventing activation of bypass diodes and thereby reducing the chances of heavy power dissipation and hot-spotting in mismatched cells. The simulation results confirm that the occurrence of heavy power dissipation is reduced in all distributed power electronics architectures, and that submodule-level converters offer nearly 100% mitigation of hot-spotting. In addition, the paper further elaborates on the possibility of hot-spot-induced permanent damage, predicting a lifetime energy loss above 15%. This energy loss is fully recoverable with submodule-level power converters that mitigate hot-spotting and prevent the damage.
1. Introduction
It is well known that mismatch due to partial shading, soiling, or ageing causes significant losses in the energy yield of photovoltaic (PV) systems [1,2]. Furthermore, mismatches may hinder operation of maximum power point (MPP) tracking algorithms, especially if the power versus output voltage characteristic becomes nonconvex [3]. It has also been shown that, even with commonly used bypass diodes, mismatched cells may become reverse-biased and dissipate power, producing an undesired cell temperature rise or hot spot [4,5]. This may lead to accelerated ageing and reduced reliability of the PV system.
Although one of the main advantages of distributed power electronics in PV systems is the ability to mitigate the mismatch effects and increase the energy yield of the system [6,7,8,9], distributed converters can also improve the system reliability by reducing the occurrence of hot spots. This is because converters distributed at various granularity levels can maintain a sufficiently large positive bias across a mismatched PV region. Preliminary results showing how some distributed power electronics architecture can prevent reverse-biasing of cells have recently been reported [10]. The objective of this paper is to quantify the potential of various distributed power electronics architectures to mitigate hot-spotting in PV systems exposed to partial shading conditions commonly observed in typical rooftop residential PV systems. Specifically, two questions remain open in the area: (i) To what extent can a distributed power electronics architecture prevent hot-spot occurrence? (ii) What is the impact on the reliability of the PV system? In this paper, these questions are addressed using the cell-level simulation tool developed in [11,12]. The tool has been modified and employed to perform a set of long-term simulations of a representative PV scenario.
Specifically, the three main contributions of the paper are as follows. First, the frequency of hot-spotting in a moderate shading representative scenario is assessed. Secondly, the hot-spotting mitigation capabilities of different module and submodule-level power electronics architectures are quantified and compared with the conventional approach without power converters. Finally, the possible effects of accelerated ageing due to hot-spotting and the corresponding lifetime shortening and energy-yield loss are evaluated.
The paper is organized as follows. Section 2 describes the simulation scenario and discusses the causes and effects of partial-shading, hot-spotting, and ageing. Section 3 provides a brief description of the main PV architectures reported in literature and how distributed power electronics converters can act to mitigate mismatch and hot-spotting. Section 4 presents the main results of the paper, quantifying the occurrence of hot-spotting caused by partial shading and ageing. The results are used to assess mitigation abilities of the different architectures and to elaborate on various system design trade-offs and possible outcomes. Some conclusions are presented in Section 5. Finally, the appendix at the end of the paper shows a brief experimental verification.
2. Hot-Spotting and Ageing in PV Systems
This section introduces the sources and the effects of partial shading, hot-spotting, and ageing in PV systems. A representative case based on a rooftop PV system affected by partial shading is introduced in Section 2.1. Modeling and simulation of such a system over its lifetime is summarized in Section 2.2. Section 2.3 discusses how a correlation between hot-spotting and ageing can be taken into account in long-term system simulations.
2.1. Representative Rooftop System
A residential rooftop system (Figure 1a) affected by partial shading is considered as a representative scenario. The system consists of two series strings of seven conventional poly-crystalline silicon (Poly-Si) modules, as reported in Table 1. The modules are rated at 210 W peak power and consist of three 20-cell submodules, each submodule having a bypass diode in parallel. The two strings are connected to a conventional central inverter, such that the system is operated at its maximum power point. In order to evaluate the influence of the PV module realization in system simulations, characteristics of a comparable mono-crystalline (Mono-Si) module are also reported in Table 1.
As shown in the fisheye lens picture of Figure 1b, the site is affected by partial shading due to nearby trees and other architectural elements. Shading affects a large fraction of the array, mostly in the morning and during winter, causing an estimated annual irradiance loss of about 20% and an estimated energy loss of around 22%. The figure is only illustrative, since a ray-tracing simulation of this environment (as shown in [13]) was used to generate the exact shade data in each cell of the PV system throughout one year.
Although this scenario is considered as a typical moderate shading case in the literature [14], there are times when bypass diodes in partially shaded submodules are forward biased. In these cases, depending on intensity of shade and the number of affected cells, a hot spot may occur.
2.2. Cell-Level Modeling and Simulation
The likelihood of hot-spotting in the reported scenario has been analyzed by means of a series of long-term simulations featuring cell-level granularity. As mentioned above, the simulation tool has been reported previously in [11,12]. Only the novel aspects of hot-spotting detection and accelerated ageing are detailed here. Figure 2a shows the standard five-parameter model of PV cells [15], as employed in the simulations. The simulation model assumes the same diode reverse saturation current , shunt resistance , series resistance , and diode quality factor for all cells, whereas the photogenerated current is a function of the short-circuit current and the irradiance. The reverse bias characteristic of the PV cells is modeled with an additional term , as in [16]. A standard breakdown voltage of −20 V is assumed, providing results consistent with the approach reported in [17,18].
It is worth noting that the reverse-bias characteristic is heavily influenced by the shunt resistance , as shown in Figure 2b. This influence has been taken into account by employing the Mono-Si or Poly-Si parameters shown in Table 1. One of the main differences among these modules is the greater shunt resistance of the Mono-Si cells. These reverse-bias trends are also described as“Type A” and “Type B” cells, respectively [19].
The effects of ageing and shading are taken into account in the photogenerated current, which changes according to the age of the system and the irradiance of each cell. First, the influence of shading is taken into account in the irradiance term as follows:
where is the direct irradiance, is the diffuse light, is the global irradiance under standard test conditions (STCs) and is the ratio of shaded area of the cell. In this case, is a constant accounting for the short circuit current under STCs. According to data reported in previous works [20], the main effect of ageing is the decrease in the value of over time.
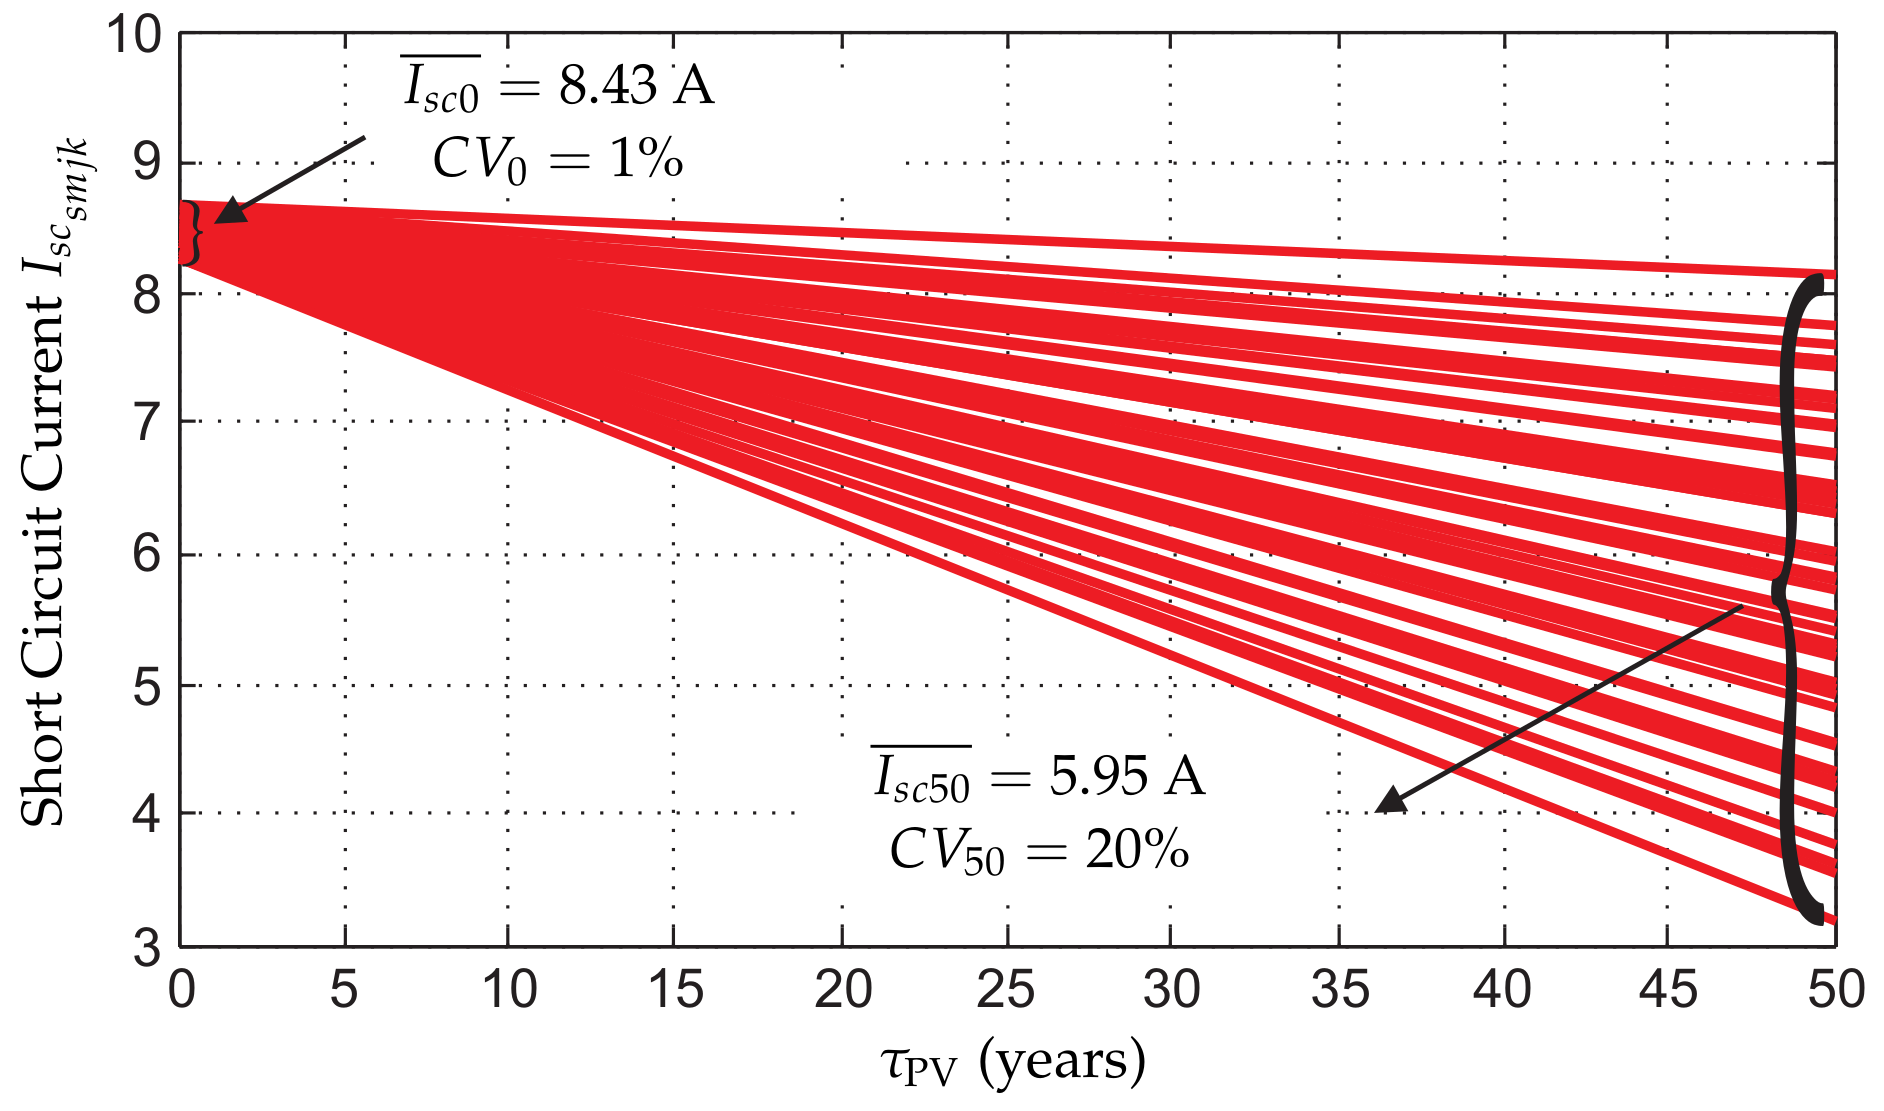
Figure 3 shows an example of the ageing-based decrease of the short-circuit current under STCs over 50 years, following statistical data given in [20]. The ageing model considers that the average photogenerated current of the cells decreases with time, while its coefficient of variation (CV) increases. The figure shows a population of 48 Mono-Si submodules for a simulation over 50 years. The average value of the short circuit current at Year 0 is A and the CV is 1%. Considering a degradation rate of −0.6% per year, the average short circuit current at Year 50 is A and the coefficient of variation is 20%.
Although it has been discussed that ageing nonlinearities may affect the beginning-of-life or the end-of-life of PV modules [20], the proposed model can be seen as a 50-year equivalent assuming linear wear-out. It is worth pointing out that other factors such as fill factor degradation may be significant after long periods of outdoor exposure [21]. In this case, fill factor degradation can result in greater series resistances and lower shunt resistances of the cells, and the influence of this aspect has been considered by comparing the results of the “Type A” and “Type B” cells.
In order to implement the proposed model of ageing in the simulations, the photogenerated current (Equation (1)) is modified as follows:
In the above, is now the short-circuit current at Year 0, which can be different for each submodule in the system. Ageing is modeled by adding the derating term (also different for each submodule) multiplied by the age of the system, represented by a scalar . The simulation can be carried out sequentially, so that is initially zero and increases through 50 years of operation. In this context, the derating term can be derived as follows:
where and are normally distributed populations at time 0 and time n respectively, and n is the time granularity of the simulation in time steps of .
2.3. Hot-Spotting and Accelerated Ageing
As reported above, hot spots typically appear in the presence of heavy mismatch such as partial shading. It has been shown that standard bypass diodes do not completely eliminate hot-spotting [5]. This is in part due to the fact that an active bypass diode imposes a low voltage across the affected substring, and forward voltages generated by positively biased PV cells induce a reverse voltage in the remaining part of the submodule. In the case of cells receiving diffuse irradiance, such as under partial shading conditions, a significant amount of current is still generated and large power dissipation may occur, even in the case when the shunt resistances are relatively large. An example of this situation can be seen in Figure 4, and a more detailed description can be found in [5].
Reverse-biased PV cells dissipate power and consequently heat up. If the temperature rise becomes sufficiently large, PV cells can be affected by accelerated ageing and permanent cell damage [22,23,24]. Nonetheless, it is difficult to establish relationships between PV cell power dissipation, temperature rise, and accelerated ageing. Cell current may be distributed uniformly along the affected PV cell (generating uniform heating) or it can be concentrated at one or a few specific regions of the PV cell (resulting in non-uniform localized heating) [25]. Furthermore, reverse characteristics of PV cells can have very large deviations [26]. In consequence, it is very difficult to accurately model the temperature rise and its effects in reverse-biased cells. As an alternative, a threshold of 2 multiplied by the cell rated power has been proposed as an indicator of hot-spotting [4]. The approach of simply evaluating the power dissipation in reverse-biased cells and comparing this value to the threshold is adopted in simulations reported in this paper, as follows:
Hot-spotting cells can be affected by accelerated ageing or even permanent damage. The simulation tool allows considering such a possibility. If accelerated ageing is taken into account, then the effective age of each cell may be different, and it must be stored in a vector . In such a case, Equation (2) can be rewritten as follows
Each time a hot spot is detected, the corresponding value of is increased by a time step (e.g., 1 h) multiplied by an accelerating factor. Acceleration factors specify how faster stressed PV cells age with respect to the normally operating cells. Although there are some results reporting acceleration factors in the range of [×10, ×50] in cases of high temperature operation and for testing purposes [23,24], these factors may not be applicable in general due to the intermittent nature of hot spots and the possibility of localized heating.
Finally, it is worth pointing out that other thermal effects may play a role in the presence of hot spots. As mentioned above, heating due to hot spots is not easy to model [25,27,28]. Although the simulations account for temperature variations due to changing irradiance, they do not consider the effects of power dissipation. This has an important implication. Given that the high temperatures in hot spots would typically further decrease the energy yield of the affected cells, the simulations may be underestimating the impact of hot spots on the energy yield of the PV system.
3. Distributed Power Conversion Architectures
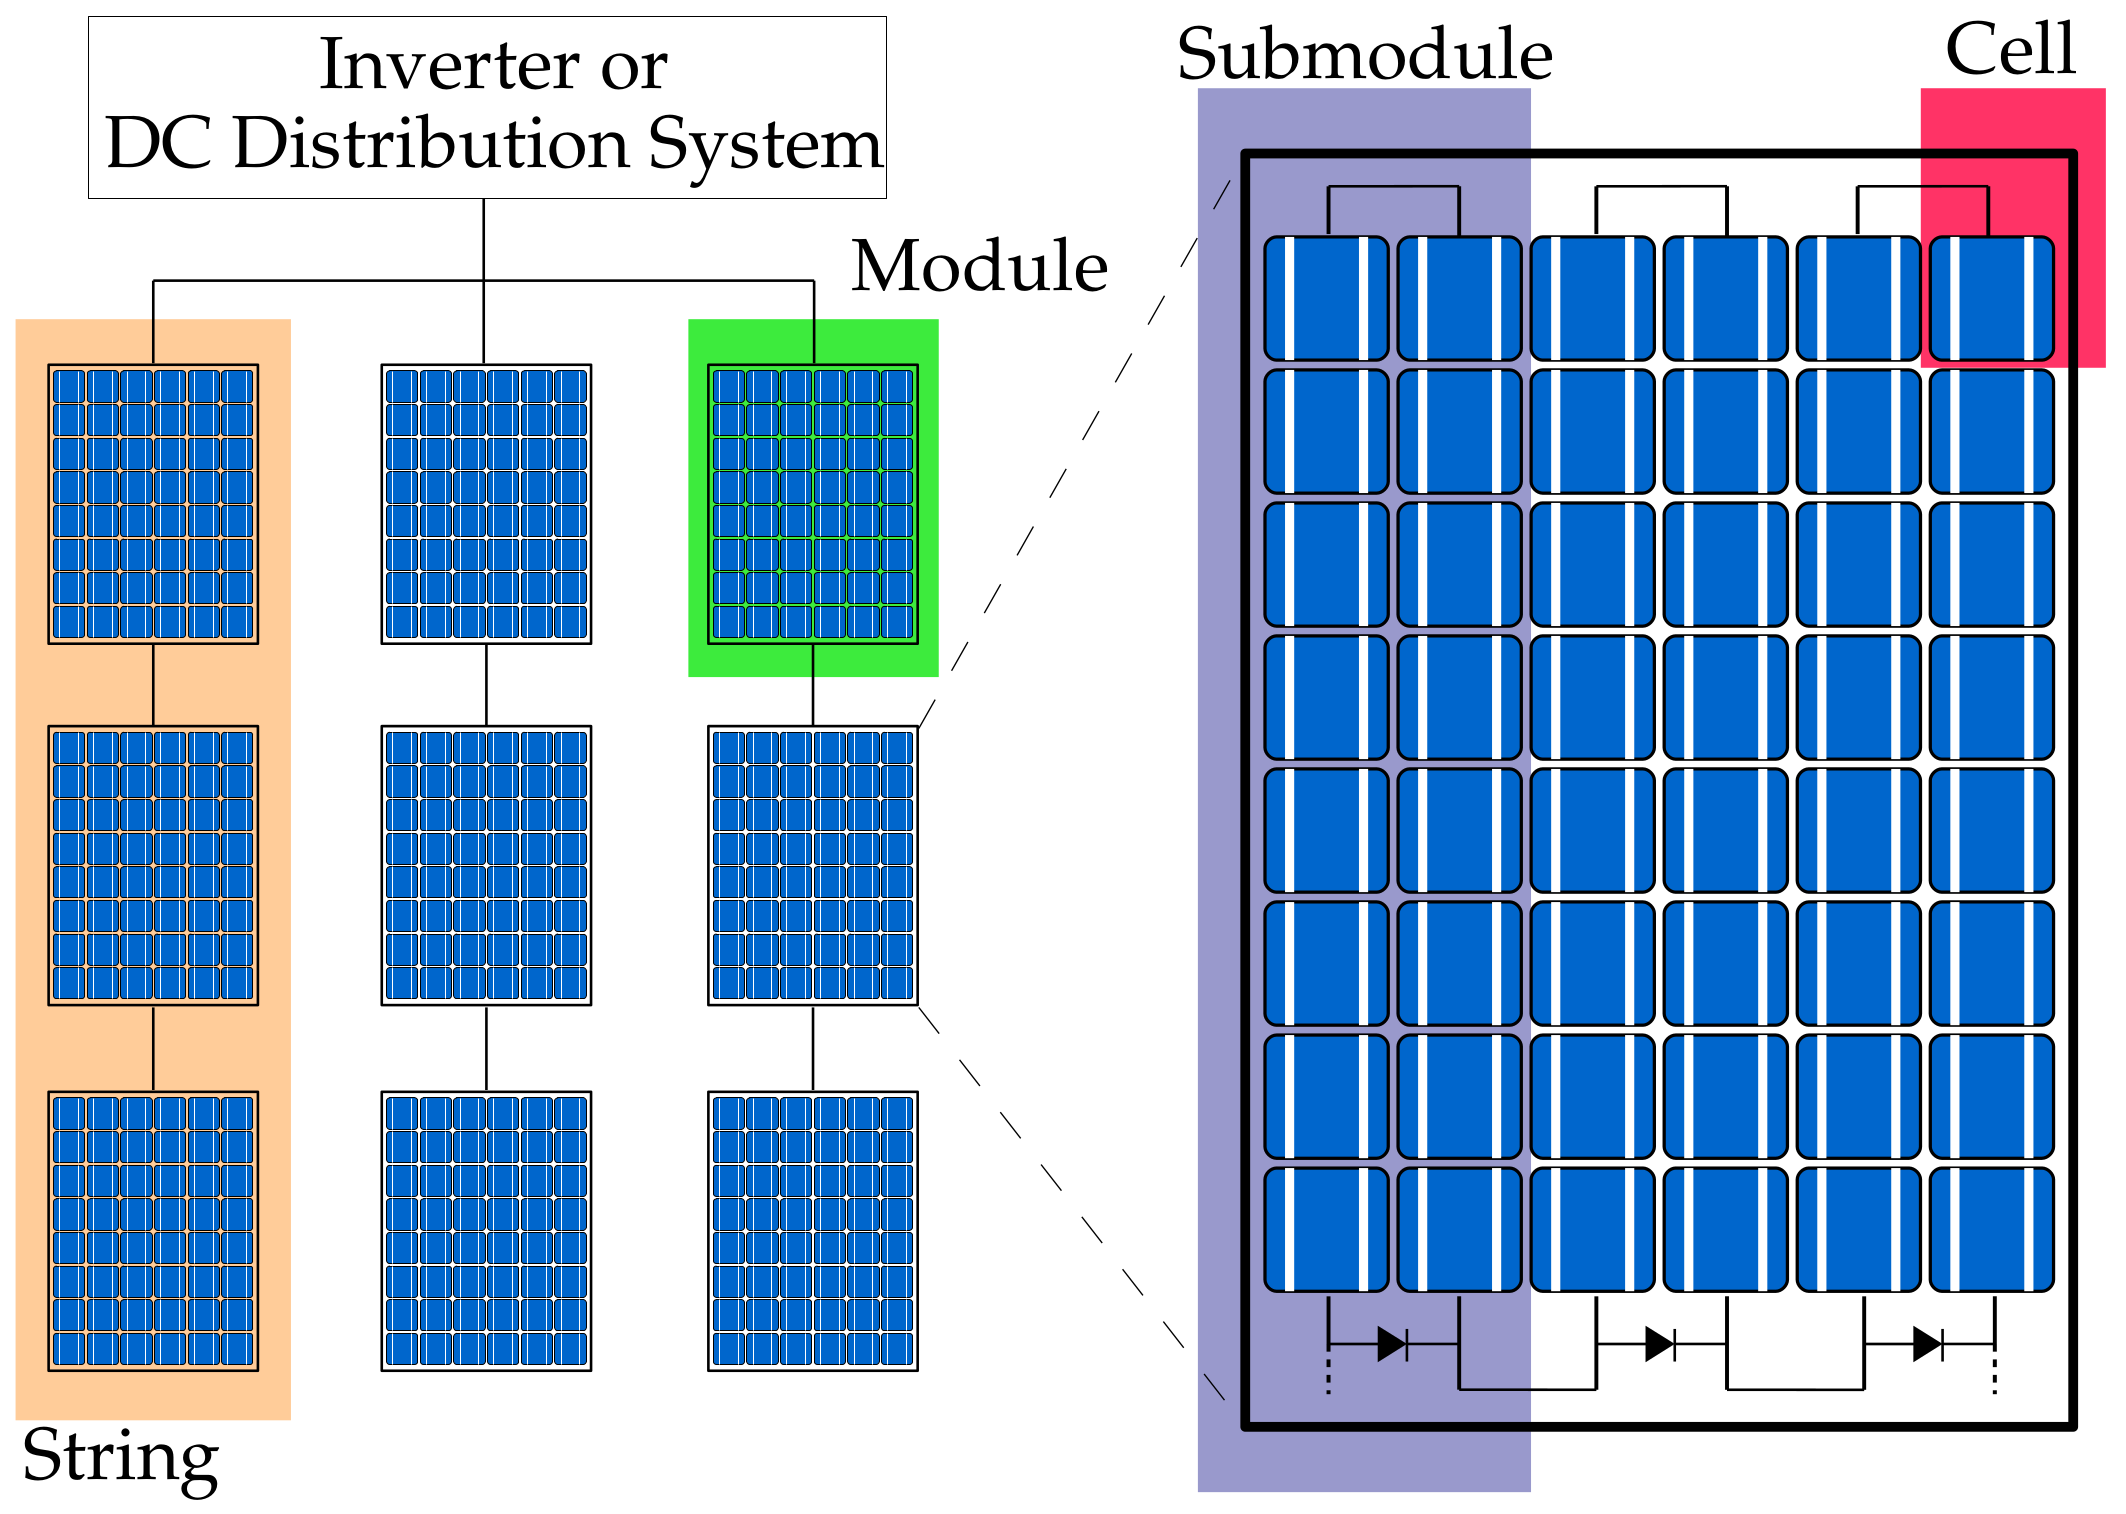
The levels of granularity in PV systems are illustrated in Figure 5. From inverters at string- or system-level down to cell-level integrated power converters, each of these approaches exhibits different performances in terms of mitigating mismatches and enabling appropriate tracking of the maximum power point.
Figure 6 shows the main PV power electronics architectures reported in the literature. The system- or string-level inverter in Figure 6a is considered the conventional approach and is used as a reference. In this sytem, in the case of partial shading, bypass diodes may short the affected submodules and hot spots may appear.
As an alternative, full power processing (FPP) DC optimizers and microinverters are shown in Figure 6b,c, respectively. These approaches have been considered mainly at the module level (FPP MICs) [29,30], limiting the effects of mismatch, but not always preventing activation of bypass diodes. Submodule level realizations of FPP converters (denoted FPP subMICs) have also been proposed [31,32]. These converters effectivley replace bypass diodes and maintain the submodules at their respective maximum power points, reducing the probability of hot-spot occurrence. However, in order to accomplish this, FPP converters need to process the full power of the PV system.
Differential power processing (DPP) approaches overcome this limitation by simply diverting mismatched power from one submodule to another, providing mismatch mitigation with power converters of reduced power rating, which results in cost and size savings. DPP has been mainly considered at the submodule level, effectively replacing bypass diodes and preventing the appearance of hot spots. DPP approaches include the PV-to-bus subMICs (Figure 6d) and the PV-to-PV subMICs (Figure 6e) [33,34,35,36]. In case of limited power ratings, PV-to-PV subMICs have been shown to exhibit worse performance [37], so only PV-to-bus subMICs are considered in this paper. Specifically, Figure 6d shows the isolated-port version of the PV-to-bus architecture, which offers significant implementation advantages. In order to evaluate the influence of the converter power rating, two different power ratings are considered for the DPP PV-to-bus subMICs: full submodule power and one-third of the submodule power (following the results described in [8]).
Finally, Figure 6f shows a combination of PV-to-bus subMICs and microinverters, known as subMIC-enhanced microinverters [38], in which bypass diodes are replaced by DPP power converters. Similar to the previous case, the ability to prevent hot-spotting depends again on the power rating of the converters.
4. Simulation Results
In this section, we present the results of the simulations according to the setup described above, for the different distributed power conversion architectures described in Section 3. The objectives of the simulations are (i) to quantify the probability of hot-spot occurrence in the presence of partial shading, (ii) to quantify how well the different power electronics architectures can mitigate hot-spotting, and (iii) to evaluate the influence of hot-spotting on the system reliability and lifetime.
The simulations consider operation of the PV system over 50 years, using the long-term ageing model described in Section 2.3. Although the model considers cell-level granularity, no cell or submodule level ageing data has been reported in the literature. Consequently, module level data [20,21,39,40,41] has been employed at submodule level to avoid conservativeness, following the justification provided in [12]. Hence, in the absence of other sources of mismatch all the cells within a submodule are assumed equal. As expected, preliminary simulations accounting for 50 years of operation considering only ageing confirm that large power dissipation does not occur when there are no cell-level mismatches. Reverse-bias only appears due to non-uniform cell-level mismatch caused by, for example, partial shading.
All simulations consider partial shading in the scenario described in Section 2.1, as well as the expected ageing of the cells. In order to account for shading effects, 4230 samples are obtained in a year, which provides roughly 12 data points per day during irradiance hours with a granularity of one hour. The same 2011 weather data from NREL measurement site [42] is used in all years, leaving out uncertainties due to any changes in atmospheric conditions.
Given that the simulations depend on randomly generated distributions of ageing, several instances (or populations) of the same normal distribution are typically employed, as in a Monte Carlo method. Unless otherwise noted, 72 instances of randomly generated populations are used in all simulations. In order to obtain consistent results, instances of the populations are generated once and stored for reuse in the simulations of the PV systems with different power electronics architectures.
The results are presented for three cases. Simulations reported in Section 4.1 consider the effects of partial shading and uniform ageing. Section 4.2 reports the results accounting for partial shading and accelerated ageing. Finally, the influence of accelerated ageing and the characteristics of the cells in hot-spotting is reported in Section 4.3, by evaluating the residential system of Section 2.1 with Mono-Si instead of Poly-Si modules.
4.1. Hot-Spotting in PV Systems Affected by Partial Shading
The first set of simulations considers operation of the residential system over a period of 50 years with different power electronics architectures, taking into account partial shading due to nearby objects and the ageing of the cells, using Equation (2).
Considering all cells (840 cells in the system) and all years (more than 200,000 h of operation), an average of 34,077 hot spots have been detected in the simulation of the conventional system with a central inverter. This corresponds to a probability of hot-spotting of 0.02%, which can be considered a low likelihood. Nonetheless, up to 143 cells are affected at least once by heavy power dissipation, which corresponds to 17% of the cells in the system. The most affected cells are exposed to heavy power dissipation between 1600 and 1070 h in the total lifetime, which corresponds to 4.5 and 3 months of operation, respectively.
Figure 7 shows the histogram of the distribution of power dissipation for the conventional system with a central inverter and for the different distributed power electronics architectures. The first column shows cases where power dissipation is below the threshold (conservatively assumed to be 2.5 multiplied by ), while the remaining columns (above this threshold) show successively higher rates corresponding to what are assumed to be hot spots. It can be seen that all the distributed power electronics architectures decrease the chance of power dissipation and hot-spotting, with submodule power converters offering the best hot-spot mitigation. Table 2 shows the total number of hot spots in each configuration, starting with the conventional approach, which endures the aforementioned 34,000 hot-spot events. In the table, it can be observed that module-level FPP MICs reduce hot-spotting cases by only 14.6%, because the submodules may still be bypassed. SubMIC power converters achieve much higher reduction rates, with FPP subMICs completely eliminating hot-spotting events. The differential power processing PV-to-bus subMICs achieve a very high reduction rate of 97% with a much smaller power rating of only 33%. The reduced power rating affects more severely the architecture with subMIC-enhanced microinverters, given that their conventional wiring does not allow balancing of the power requirements across the entire string. Nonetheless, it is worth emphasizing that full-power rated differential power processing subMICs would also completely eliminate hot-spotting.
Figure 8 shows the yearly occurrence of hot spots. The results point to a reduced number of hot spots with time, due to the effects of ageing in reducing the average current delivered by the PV modules. These results may seem counterintuitive, given that hot spots are typically associated with older PV systems where mismatch across cells becomes larger. Nonetheless, increased power dissipation is detected in the simulation, but it assumed that it does not cause an accelerated degradation of the affected cell, which could eventually lead to a permanent cell-level mismatch, large enough to cause hot-spotting even in the absence of partial shading. In order to investigate this possibility, the next subsection presents the results considering an accelerated ageing factor of 50× in the conventional and the PV-to-bus subMICs systems.
4.2. Hot-Spotting in PV Systems Affected by Partial Shading Considering Accelerated Degradation
This section reports the simulation results of over 50 years, considering partial shading, ageing, and accelerated degradation due to hot-spotting, using Equation (5). In this case, a high acceleration factor is applied to represent the ageing affect of persistent high operating temperature in shaded cells. Thus, the time vector has been updated as follows:
The results show that the most aged cells now naturally correspond to the most frequently shaded cells reported above. In the conventional system configuration with a central inverter, those cells present an average age shift of approximately 80,000 and 54,000 h of operation, which corresponds to 19 and 13 years of additional ageing, respectively. However, accounting for accelerated degradation induces a very slight increase in hot-spotting cases: the worst cells show an average of 1620 and 1100 incidents, while previously we had 1600 and 1070 hit-spotting events. Those few new hot spots typically correspond to cases where power dissipation due to partial shading is intensified by ageing degradation. The real magnitude of this accelerated aging effect is of course open to debate. However, even with this level of acceleration, no permanent hot spots have been found in the results. In the absence of partial shading, the results point to a reduced voltage of aged-shifted cells, but no extra power is dissipated. One of the reasons for this behavior is the low shunt resistance in the poly-crystalline modules used in the simulation, which allows for a relatively large current mismatch with a relatively low voltage difference within cells in the same submodule.
4.3. Hot-Spotting in Mono-Si PV Systems Affected by Partial Shading Considering Accelerated Degradation
In order to validate the previous line of reasoning, the same simulations have been carried out using parameters taken from Mono-Si cells, which feature a greater fill factor and greater shunt resistance. The new simulations show that the two worst case cells are affected more by hot-spotting, showing a total of 6260 and 6150 h of heavy power dissipation, respectively. Due to the different shape of the IV curve, the additional ageing produces a sufficiently large difference between these cells and the rest of the cells. This results in permanently increased power dissipation even in the absence of partial shading in 66% of the instances. In the affected cases, this occurs (on average) after 26 years of operation and 2700 h of hot-spotting. As a result, the total number of hot spots detected in all cases increases up to an average of 99,500 (0.05%), compared with the 34,000 cases (0.02%) reported for the Poly-Si cell characteristics.
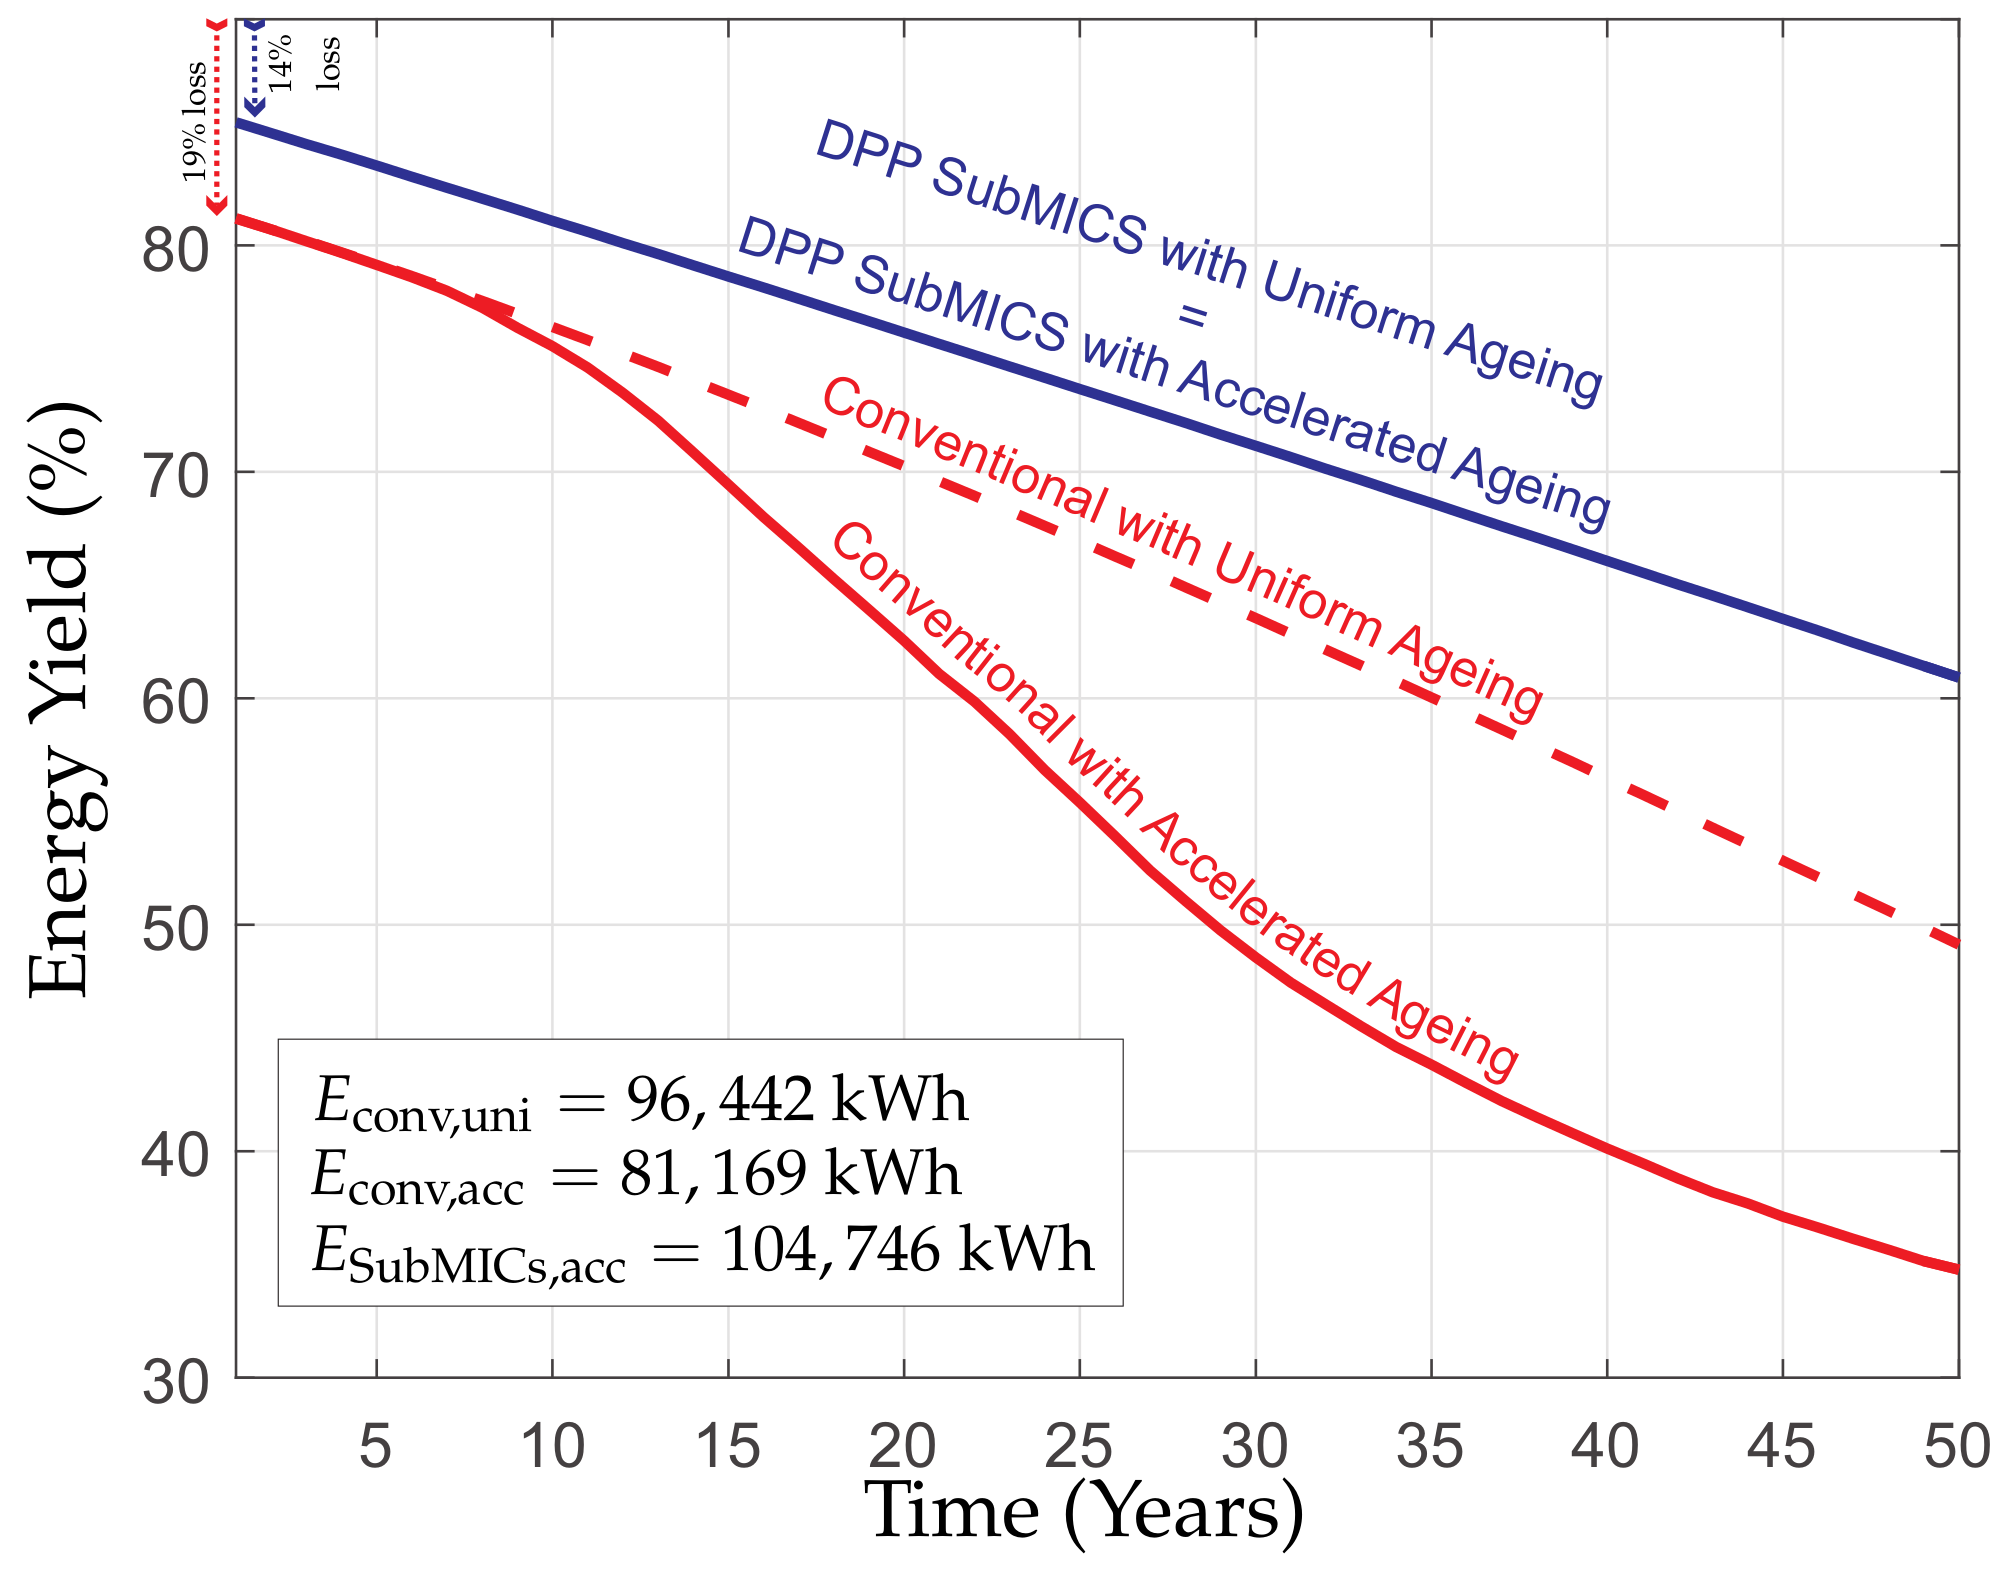
Figure 9 depicts the same histogram of hot-spot occurrence shown in Figure 8, but only for the conventional and DPP subMIC architectures. Again, subMICs avoid 97% of hot-spotting cases, whereas the number of hot spots grows exponentially with time until Year 25 in the conventional architecture. After Year 25, the decrease of hot spots with time can again be explained by the reduced average current of aged PV modules. More importantly, accelerated ageing due to hot spots decreases the energy yield of the system during its entire lifetime, while the original simulation with no accelerated ageing produced a total average of 96,442 kWh after 50 years, accounting for accelerated ageing results in 81,169 kWh, a decrease of 15,273 kWh (15.8%). It is worth noting that these values are an average of all cases. Thus, power loss may be larger in those instances where permanent hot-spotting is detected. This result is illustrated in Figure 10, where the average energy yield of the PV system is depicted for three different cases: (i) the conventional central inverter-based system with uniform ageing, (ii) the conventional central inverter-based system with accelerated ageing in the case of hot-spotting, and (iii) the DPP PV-to-bus subMIC-enhanced system with accelerated ageing, the latter being identical to the case of uniform ageing. The results are scaled with respect to the ideal yearly energy yield in the case of no partial shading. DPP subMICs reduce the effects of shading and increase the reliability of the PV system by avoiding hot spots. Assuming shading losses and the 50× ageing factor in cells experiencing hot spots, a subMIC-enhanced system yields about 75% of the nameplate power after 25 years and more than 60% in Year 50. In contrast, the conventional approach with no distributed power electronics suffers an increasing degradation that reduces energy capture to approximately 50% after 25 years, and to only 35% after 50 years. The overall energy yield penalty of the conventional system with respect to DPP subMICs is greater than 20%.
5. Conclusions
This paper investigates the effects of mismatch causing increased power dissipation and cell hot spots in photovoltaic (PV) systems, and how well distributed power electronics can mitigate these effects. Long-term cell-level simulations of a representative residential rooftop PV system with moderate partial shading are used to quantify the occurrence of hot spots in the conventional system with a central inverter compared to different distributed power electronics architectures. Cell-level simulations including reverse-bias conduction and ageing models, are carried out over a 50 year system lifetime. It is shown that module level converters offer limited improvements because localized mismatches may activate internal bypass diodes and still produce large power dissipation on cells within shaded portions of a module. All submodule-level power conversion approaches provide substantial reductions of hot-spot events. Sub-module level converters rated at full power completely eliminate hot-spotting. SubMIC-enhanced microinverters, which include sub-module level converters and differential power processing (DPP) subMICs, offer 88.5% and 97.1% reductions in hot-spot events, respectively, when the converters are rated at only one-third of the submodule power. Taking into account hot-spot accelerated ageing does not result in significant increases in hot-spot occurrence or permanent hot-spotting if the shunt resistance of the PV cells is sufficiently low, as is typically the case in polycrystalline Si modules. However, simulations considering monocrystalline Si modules with a higher fill factor and greater shunt resistance show developments of permanent hot-spotting in mismatched cells after an average of 26 years of operation in the considered scenario. In this case, permanent hot-spotting causes an average lifetime power loss of 15.8%, compared to the case when accelerated ageing is not considered.
In conclusion, distributed power electronics may not only provide an increase in energy yield in PV systems affected by partial shading, but also prevention of hot-spotting. In the reported representative residential rooftop system scenario, while mismatch-associated energy losses can be reduced by about 5%, hot-spot-related losses can be greater than 15%, which results in greater than 20% overall energy yield increase offered by distributed power electronics, together with improved system reliability and an increase in the effective system lifetime.
Acknowledgments
The authors would like to thank Sara M. MacAlpine for providing shading data. The research leading to these results has received funding from the Spanish Ministry of Economy and Competitiveness under grant DPI2017-84572-C2-1-R.
Author Contributions
Carlos Olalla wrote the paper and carried out the simulations, which were conceived with the help of Chris Deline and Dragan Maksimović; Md. Nazmul Hasan performed the experiments.
Conflicts of Interest
The authors declare no conflict of interest. The founding sponsors had no role in the design of the study; in the collection, analyses, or interpretation of data; in the writing of the manuscript; or in the decision to publish the results.
Abbreviations
The following abbreviations are used in this manuscript:
| PV | Photovoltaics |
| MPP | Maximum power point |
| STC | Standard test conditions |
| CV | Coefficient of variation |
| DC | Direct current |
| FPP | Full power processing |
| DPP | Differential power processing |
| MIC | Module integrated converter |
| SubMIC | Submodule integrated converter |
Appendix A. Experimental Results
This section shows a brief verification of concepts exposed in the paper. Rather than accurately observing the temperature increase or the power dissipation in shaded cells, which to a large extent depends on the reverse bias characteristics of the cells, the experiment shown here demonstrates the accuracy of the simulation tool and the presence of power dissipation when bypass diodes are active.
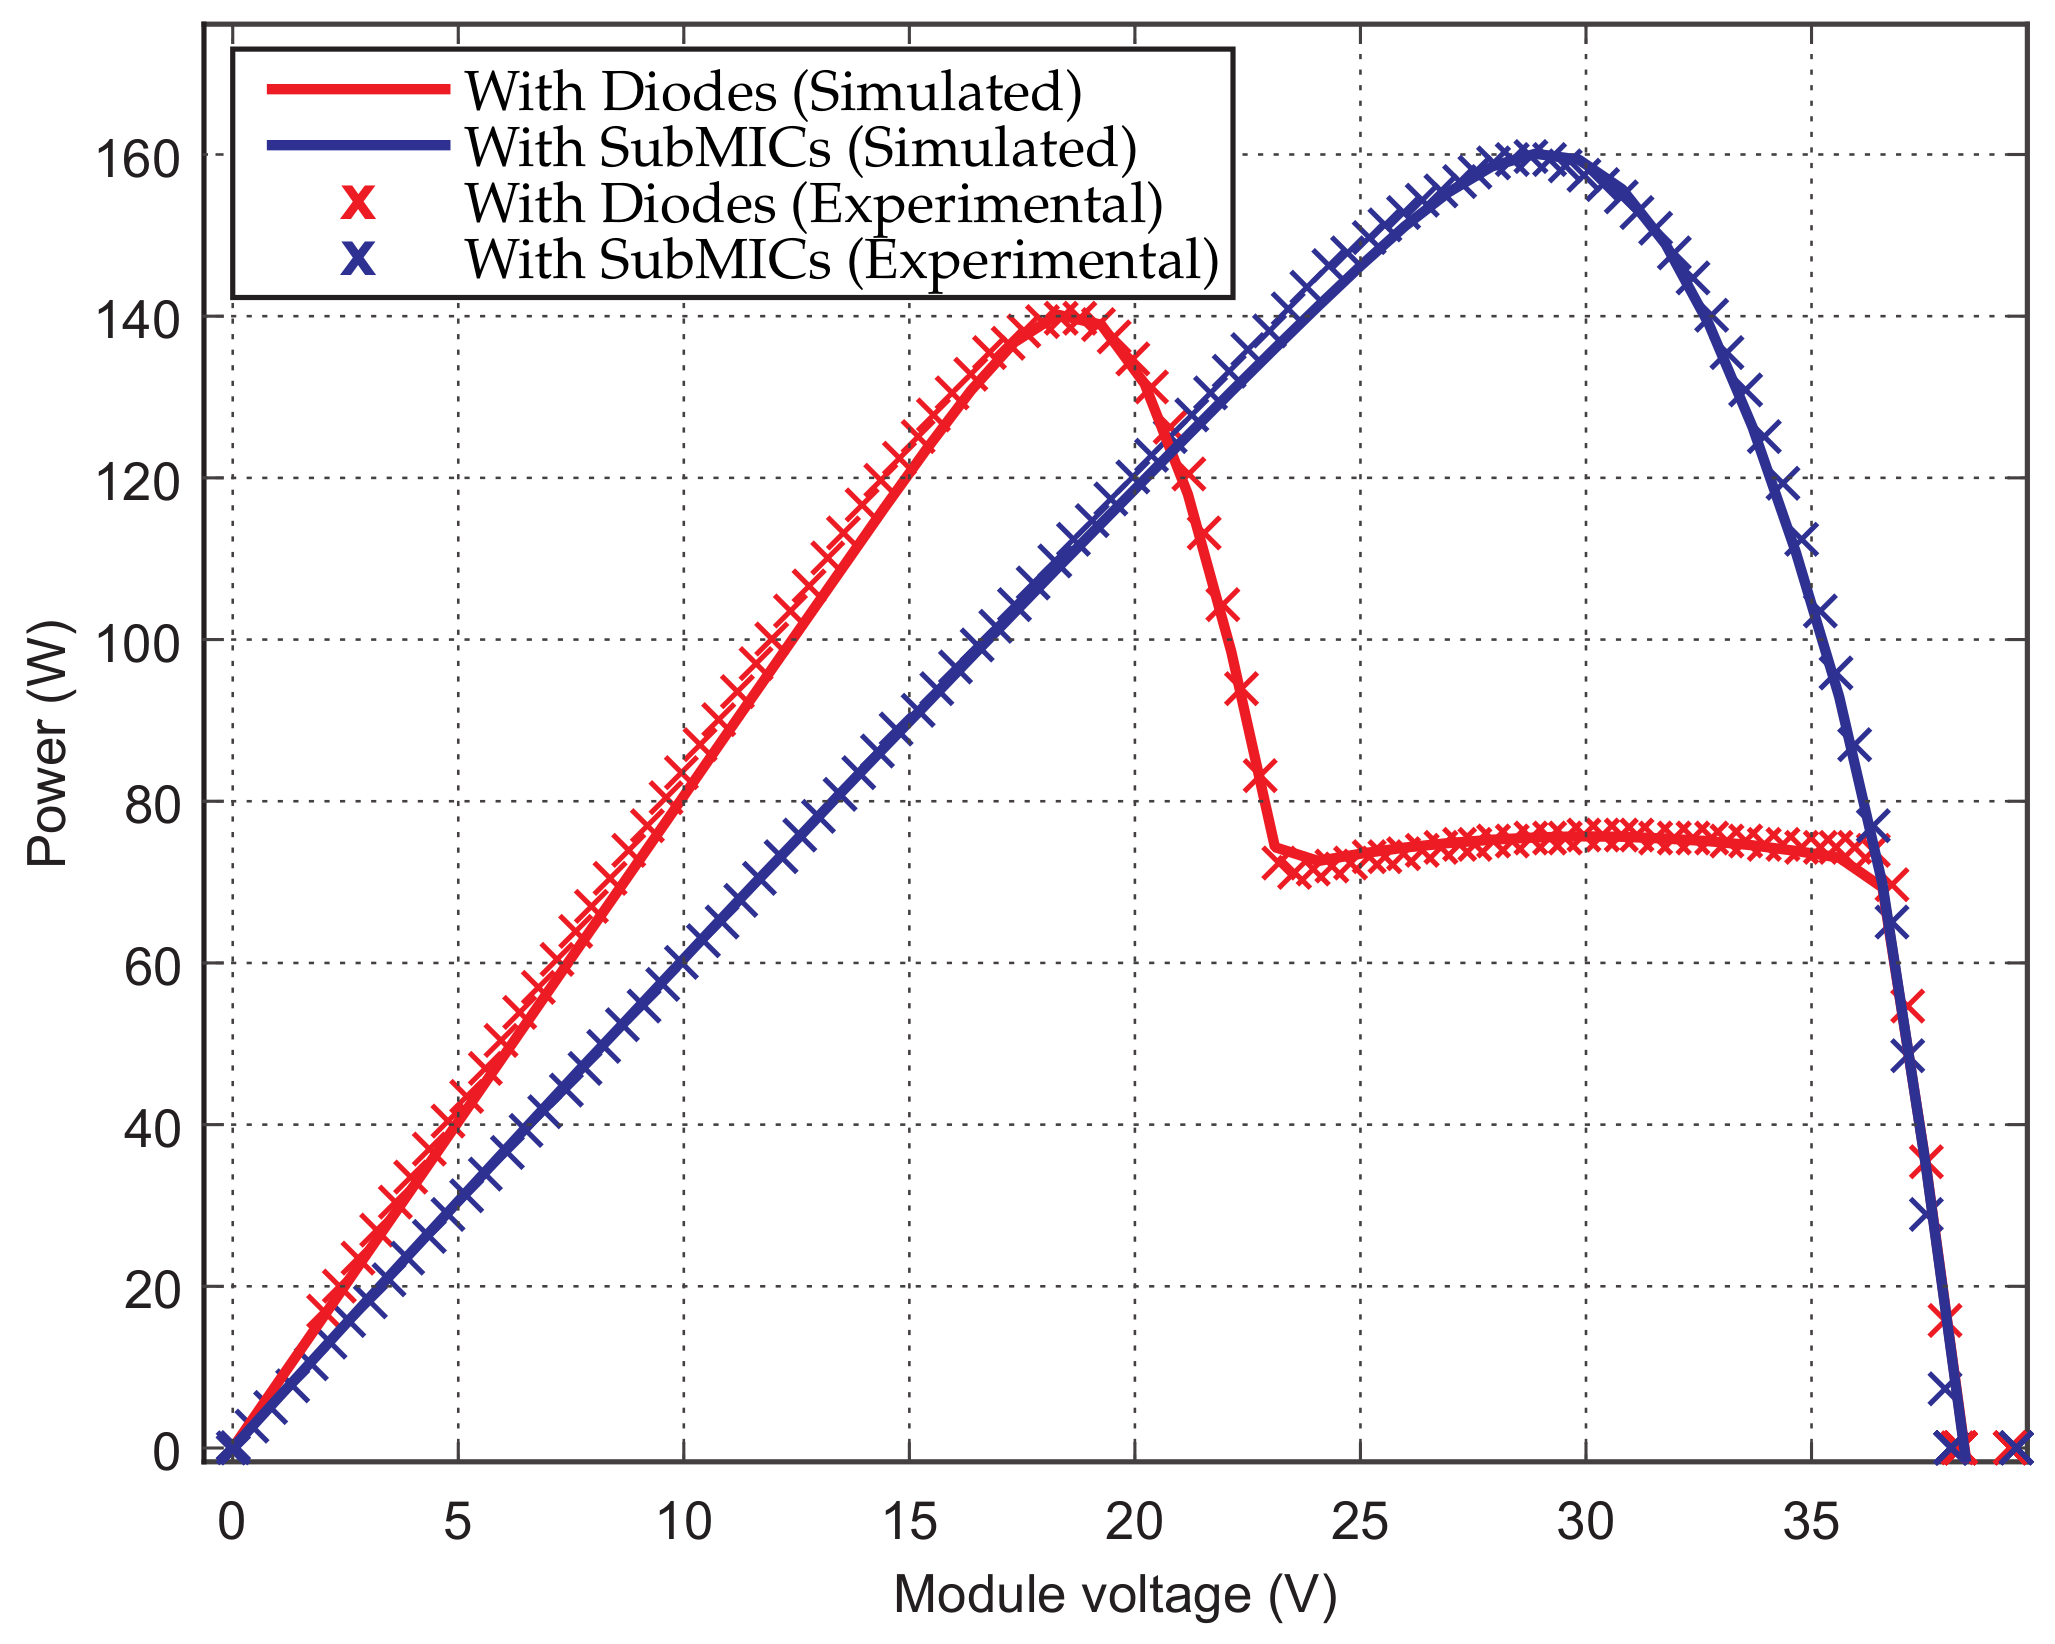
Previously, the simulation tool was experimentally verified in [11], where the effects of shading were observed in the voltage-power curve of a submodule. In order to complement these results, Figure A1 shows the experimental and simulated curves of a partially shaded PV module with conventional bypass diodes and with submodule level power converters. The experiment was carried out by shading one of the cells in a Trina TSM-230 PC Poly-Si module. Global irradiance at the plane of the PV was roughly 900 W/m2, whereas diffuse irradiance was 225 W/m2. In the figure, the simulations match the experimental results very well, and only minor differences can be observed.
Figure A1.
Simulated and experimental voltage-power characteristic of a PV module in the case of one shaded cell, with conventional bypass diodes and with submodule level power electronics.
Figure A1.
Simulated and experimental voltage-power characteristic of a PV module in the case of one shaded cell, with conventional bypass diodes and with submodule level power electronics.

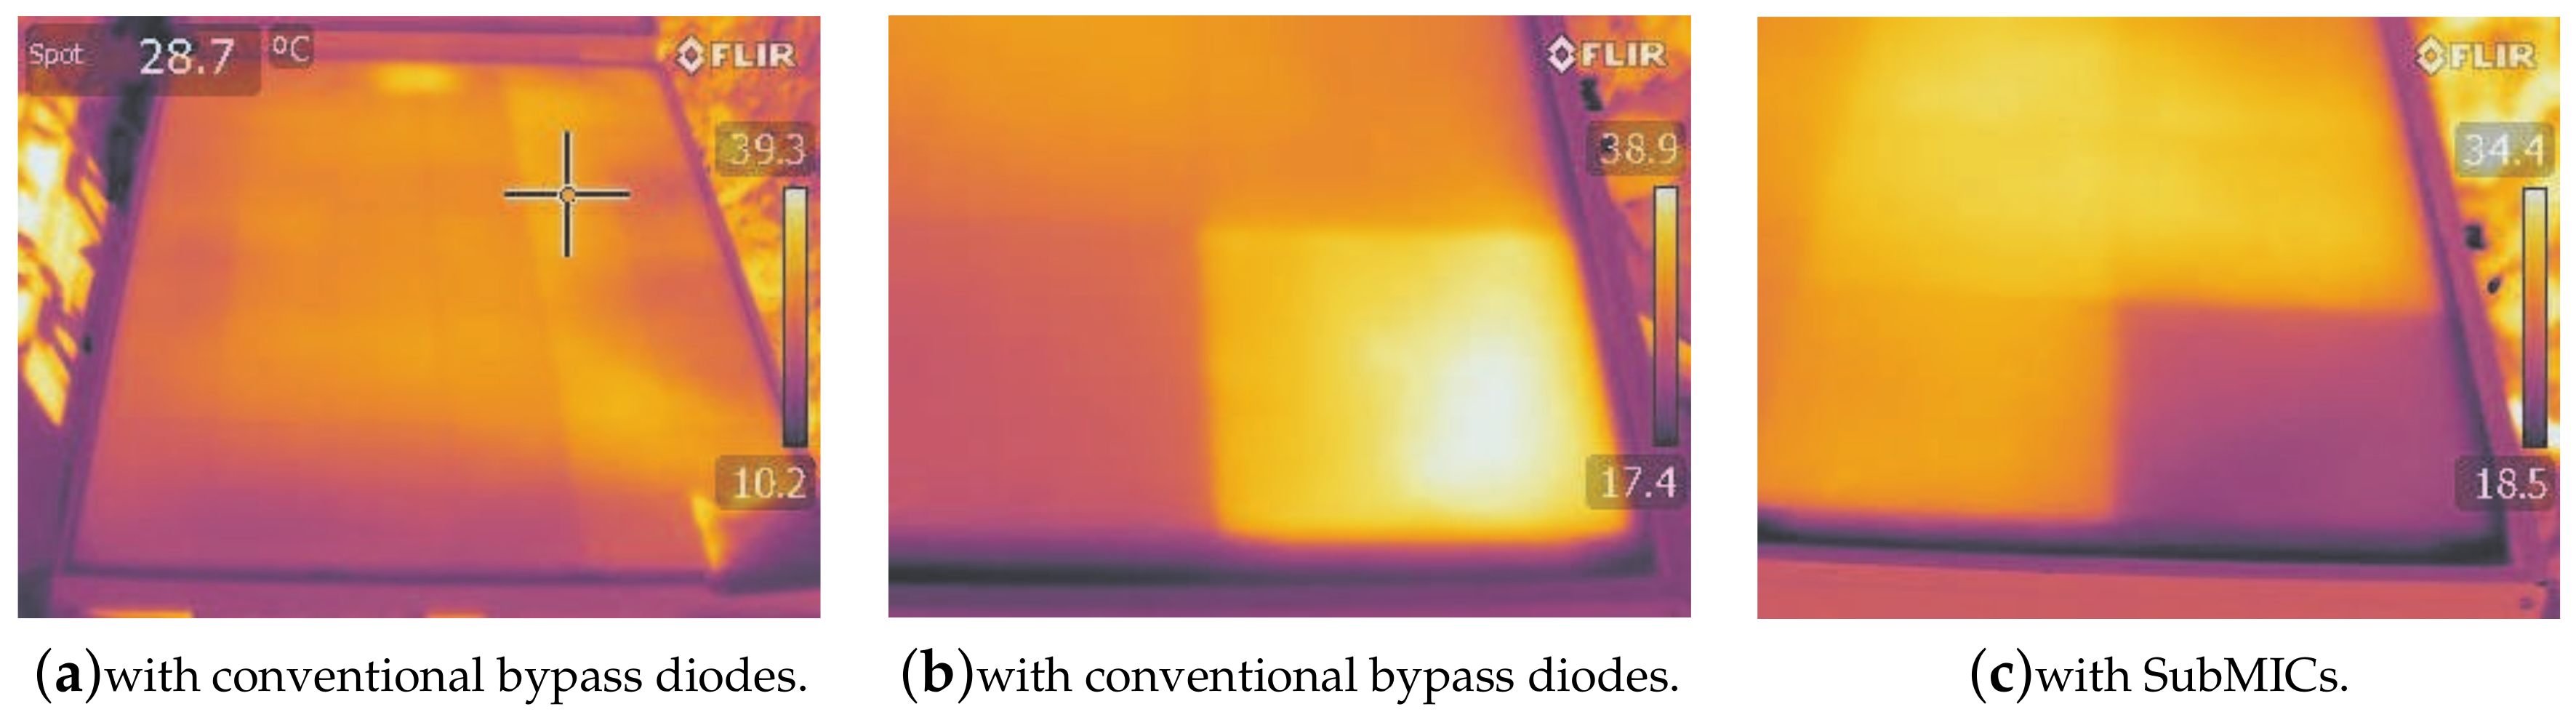
In the same experiment, and in order to observe the power dissipation of the shaded cell with and without submodule level power converters, the PV module was operated at the MPP for a short period of 5 minutes in both cases. An infrared camera (FLIR T420) was then used to verify the temperature increase of the affected cell. The fabric covered the cell, so its temperature could not actually be observed (see Figure A2a), so it was moved away right before the pictures were taken (Figure A2b,c). Figure A2b shows the infrared image in the case of conventional bypass diodes. Although the PV module glass does not allow for accurate measurement of the actual temperatures of the cells, it can be seen that, with bypass diodes, the shaded cell is clearly dissipating power. In contrast, Figure A2c shows the results of the same experiment in the case of subMICs balancing the PV module. In this case, the MPP voltage of the module remains close to its nominal value and the bypass diodes are reverse-biased. It can be seen that not only is the cell not dissipating power, but its temperature is lower than that of adjacent cells, due to the reduced irradiance.
Figure A2.
Infrared pictures of the experiment: (a) a general view of the PV module where the fabric is covering one cell; (b) detail of the shaded cell in the case of operation with bypass diodes; (c) detail of the shaded cell in the case of operation with subMICs.
Figure A2.
Infrared pictures of the experiment: (a) a general view of the PV module where the fabric is covering one cell; (b) detail of the shaded cell in the case of operation with bypass diodes; (c) detail of the shaded cell in the case of operation with subMICs.

References
- Deline, C. Partially shaded operation of multi-string photovoltaic systems. In Proceedings of the IEEE Photovoltaic Specialists Conference (PVSC), Honolulu, HI, USA, 20–25 June 2010; pp. 394–399. [Google Scholar]
- Olalla, C.; Deline, C.; Maksimovic, D. Performance of Mismatched PV Systems with Submodule Integrated Converters. IEEE J. Photovolt. 2014, 4, 396–404. [Google Scholar] [CrossRef]
- Islam, H.; Mekhilef, S.; Shah, N.; Soon, T.; Seyedmahmousian, M.; Horan, B.; Stojcevski, A. Performance Evaluation of Maximum Power Point Tracking Approaches and Photovoltaic Systems. Energies 2018, 11, 365. [Google Scholar] [CrossRef]
- Kim, K.A.; Krein, P.T. Hot Spotting and Second Breakdown Effects on Reverse I-V Characteristics for Mono-Crystalline Si Photovoltaics. In Proceedings of the IEEE Energy Conversion Congress and Exposition, ECCE’13, Denver, CO, USA, 15–19 September 2013; pp. 1007–1014. [Google Scholar]
- Kim, K.A.; Krein, P.T. Reexamination of Photovoltaic Hot Spotting to Show Inadequacy of the Bypass Diode. IEEE J. Photovolt. 2015, 5, 1435–1441. [Google Scholar] [CrossRef]
- Sun, K.; Zhang, L.; Xing, Y.; Guerrero, J.M. A Distributed Control Strategy Based on DC Bus Signaling for Modular Photovoltaic Generation Systems with Battery Energy Storage. IEEE Trans. Power Electron. 2011, 26, 3032–3045. [Google Scholar] [CrossRef]
- Deline, C.; Meydbray, J.; Donovan, M. Photovoltaic Shading Testbed for Module-Level Power Electronics: 2014 Update; Technical Report Report No. TP-5J00-62471; National Renewable Energy Laboratory: Golden, CO, USA, 2014.
- Olalla, C.; Deline, C.; Clement, D.; Levron, Y.; Rodriguez, M.; Maksimovic, D. Performance of Power Limited Differential Power Processing Architectures in Mismatched PV Systems. IEEE Trans. Power Electron. 2015, 30, 618–631. [Google Scholar] [CrossRef]
- Carbone, R. PV Plants with Distributed MPPT founded on batteries. Sol. Energy 2015, 112, 910–923. [Google Scholar] [CrossRef]
- Olalla, C.; Deline, C.; Maksimovic, D. Modeling and simulation of conventionally wired photovoltaic systems based on differential power processing SubMIC-enhanced PV modules. In Proceedings of the IEEE Workshop on Control and Modeling for Power Electronics, Santander, Spain, 22–25 June 2014. [Google Scholar]
- Olalla, C.; Clement, D.; Maksimovic, D.; Deline, C. A Cell-Level Photovoltaic Model for High-Granularity Simulations. In Proceedings of the IEEE European Conference on Power Electronics and Applications (EPE-ECCE), Lille, France, 2–6 September 2013. [Google Scholar]
- Olalla, C.; Maksimovic, D.; Deline, C.; Martinez-Salamero, L. Impact of Distributed Power Electronics on the Lifetime and Reliability of PV Systems. Prog. Photovolt. Res. Appl. 2017, 25, 821–835. [Google Scholar] [CrossRef]
- MacAlpine, S.M.; Erickson, R.W.; Brandemuehl, M.J. Characterization of Power Optimizer Potential to Increase Energy Capture in Photovoltaic Systems Operating Under Nonuniform Conditions. IEEE Trans. Power Electron. 2013, 28, 2936–2945. [Google Scholar] [CrossRef]
- Deline, C.; Meydbray, J.; Donovan, M.; Forrest, J. Photovoltaic Shading Testbed for Module-Level Power Electronics; NREL Technical Report, NREL/TP-5200-54876; National Renewable Energy Laboratory: Golden, CO, USA, 2012.
- Duffie, J.A.; Beckman, W.A. Solar Engineering of Thermal Processes, 3rd ed.; Wiley: New York, NY, USA, 2006; Volume 13. [Google Scholar]
- Kim, K.A.; Chenyang, X.; Lei, J.; Krein, P.T. A Dynamic Photovoltaic Model Incorporating Capacitive and Reverse-Bias Characteristics. IEEE J. Photovolt. 2013, 3, 1334–1341. [Google Scholar] [CrossRef]
- Bishop, J.W. Computer simulation of the effects of electrical mismatches in photovoltaic cell interconnection circuits. Sol. Cells 1988, 25, 73–89. [Google Scholar] [CrossRef]
- Quaschning, V.; Hanitsch, R. Numerical simulation of current-voltage characteristics of photovoltaic systems with shaded solar cells. Sol. Energy 1996, 56, 513–520. [Google Scholar] [CrossRef]
- IEC-61215. Terrestrial Photovoltaic (PV) Modules—Design Qualification and Type Approval; IEC: Geneva, Switzerland, 2016. [Google Scholar]
- Jordan, D.C.; Kurtz, S.R.; VanSant, K.; Newmiller, J. Compendium of photovoltaic degradation rates. Prog. Photovolt. Res. Appl. 2016, 24, 978–989. [Google Scholar] [CrossRef]
- Jordan, D.; Wohlgemuth, J.; Kurtz, S. Technology and Climate Trends in PV Module Degradation. In Proceedings of the 27th European Photovoltaic Solar Energy Conference and Exhibition, PVSEC, Frankfurt, Germany, 24–28 September 2012; pp. 3118–3124. [Google Scholar]
- Desombre, A. Methodology for a reliability study on photovoltaic modules. In Proceedings of the Photovoltaic Solar Energy Conference, Cannes, France, 27–31 October 1980; Springer: New York, NY, USA, 1981; pp. 741–745. [Google Scholar]
- Wohlgemuth, J.H.; Cunningham, D.W.; Monus, P.; Miller, J.; Nguyen, A. Long Term Reliability of Photovoltaic Modules. In Proceedings of the IEEE World Conference on Photovoltaic Energy Conversion, Waikoloa, HI, USA, 7–12 May 2006; Volume 2, pp. 2050–2053. [Google Scholar]
- Kurtz, S.; Whitfield, K.; TamizhMani, G.; Koehl, M.; Miller, D.; Joyce, J.; Wohlgemuth, J.; Bosco, N.; Kempe, M.; Zgonena, T. Evaluation of high-temperature exposure of photovoltaic modules. Prog. Photovolt. Res. Appl. 2011, 19, 954–965. [Google Scholar] [CrossRef]
- Bishop, J.W. Microplasma breakdown and hot-spots in silicon solar cells. Sol. Cells 1989, 26, 335–349. [Google Scholar] [CrossRef]
- Alonso-Garcia, M.C.; Ruiz, J.M.; Chenlo, F. Experimental study of mismatch and shading effects in the I-V characteristic of a photovoltaic module. Sol. Energy Mater. Sol. Cells 2006, 90, 329–340. [Google Scholar] [CrossRef]
- Breitenstein, O.; Rakotoniaina, J.P.; Al Rifai, M.H.; Werner, M. Shunt types in crystalline silicon solar cells. Prog. Photovolt. Res. Appl. 2004, 12, 529–538. [Google Scholar] [CrossRef]
- Breitenstein, O.; Bauer, J.; Bothe, K.; Kwapil, W.; Lausch, D.; Rau, U.; Schmidt, J.; Schneemann, M.; Schubert, M.C.; Wagner, J.M.; et al. Understanding junction breakdown in multicrystalline solar cells. J. Appl. Phys. 2011, 109, 071101. [Google Scholar] [CrossRef] [Green Version]
- Walker, G.; Sernia, P. Cascaded DC-DC converter connection of photovoltaic modules. IEEE Trans. Power Electron. 2004, 19, 1130–1139. [Google Scholar] [CrossRef]
- Wills, R.; Krauthamer, S.; Bulawka, A.; Posbic, J. The AC photovoltaic module concept. In Proceedings of the Intersociety Energy Conversion Engineering Conference, Honolulu, HI, USA, 27 July–1 August 1997; Volume 3, pp. 1562–1563. [Google Scholar]
- Pilawa-Podgurski, R.C.N.; Perreault, D.J. Submodule Integrated Distributed Maximum Power Point Tracking for Solar Photovoltaic Applications. IEEE Trans. Power Electron. 2013, 28, 2957–2967. [Google Scholar] [CrossRef]
- Deline, C.; Sekulic, B.; Stein, J.; Barkaszi, S.; Yang, J.; Kahn, S. Evaluation of Maxim module-Integrated electronics at the DOE Regional Test Centers. In Proceedings of the IEEE 40th Photovoltaic Specialist Conference (PVSC), Denver, CO, USA, 8–13 June 2014; pp. 0986–0991. [Google Scholar]
- Olalla, C.; Rodriguez, M.; Clement, D.; Maksimovic, D. Architectures and Control of Submodule Integrated DC-DC Converters for Photovoltaic Applications. IEEE Trans. Power Electron. 2012, 28, 2980–2997. [Google Scholar] [CrossRef]
- Giral, R.; Ramos-Paja, C.; Gonzalez, D.; Calvente, J.; Cid-Pastor, A.; Martinez-Salamero, L. Minimizing the effects of shadowing in a PV module by means of active voltage sharing. In Proceedings of the IEEE International Conference on Industrial Technology, Vina del Mar, Chile, 14–17 March 2010; pp. 943–948. [Google Scholar]
- Stauth, J.T.; Seeman, M.D.; Kesarwani, K. Resonant Switched-Capacitor Converters for Sub-module Distributed Photovoltaic Power Management. IEEE Trans. Power Electron. 2013, 28, 1189–1198. [Google Scholar] [CrossRef]
- Blumenfeld, A.; Cervera, A.; Peretz, M.M. Enhanced Differential Power Processor for PV Systems: Resonant Switched-Capacitor Gyrator Converter With Local MPPT. IEEE J. Emerg. Sel. Top. Power Electron. 2014, 2, 883–892. [Google Scholar] [CrossRef]
- Kim, K.A.; Shenoy, P.S.; Krein, P.T. Converter Rating Analysis for Photovoltaic Differential Power Processing Systems. IEEE Trans. Power Electron. 2015, 30, 1987–1997. [Google Scholar] [CrossRef]
- Shibin, Q.; Barth, C.B.; Pilawa-Podgurski, R.C.N. Enhancing Microinverter Energy Capture With Submodule Differential Power Processing. IEEE Trans. Power Electron. 2016, 31, 3575–3585. [Google Scholar]
- Vázquez, M.; Rey-Stolle, I. Photovoltaic module reliability model based on field degradation studies. Prog. Photovolt. Res. Appl. 2008, 16, 419–433. [Google Scholar] [CrossRef] [Green Version]
- Chamberlin, C.E.; Rocheleau, M.A.; Marshall, M.W.; Reis, A.M.; Coleman, N.T.; Lehman, P.A. Comparison of PV module performance before and after 11 and 20 years of field exposure. In Proceedings of the IEEE Photovoltaic Specialists Conference (PVSC), Seattle, WA, USA, 19–24 June 2011; pp. 101–105. [Google Scholar]
- Makrides, G.; Zinsser, B.; Schubert, M.; Georghiou, G.E. Performance loss rate of twelve photovoltaic technologies under field conditions using statistical techniques. Sol. Energy 2014, 103, 28–42. [Google Scholar] [CrossRef]
- National Renewable Energy Laboratory. Measurement and Instrumentation Data Center. 2012. Available online: http://www.nrel.gov/midc/ (accessed on 1 March 2017).
Figure 1.
(a) Photograph of a representative partially shaded rooftop photovoltaic (PV) system, and (b) a fisheye lens view used for shading evaluation.
Figure 1.
(a) Photograph of a representative partially shaded rooftop photovoltaic (PV) system, and (b) a fisheye lens view used for shading evaluation.
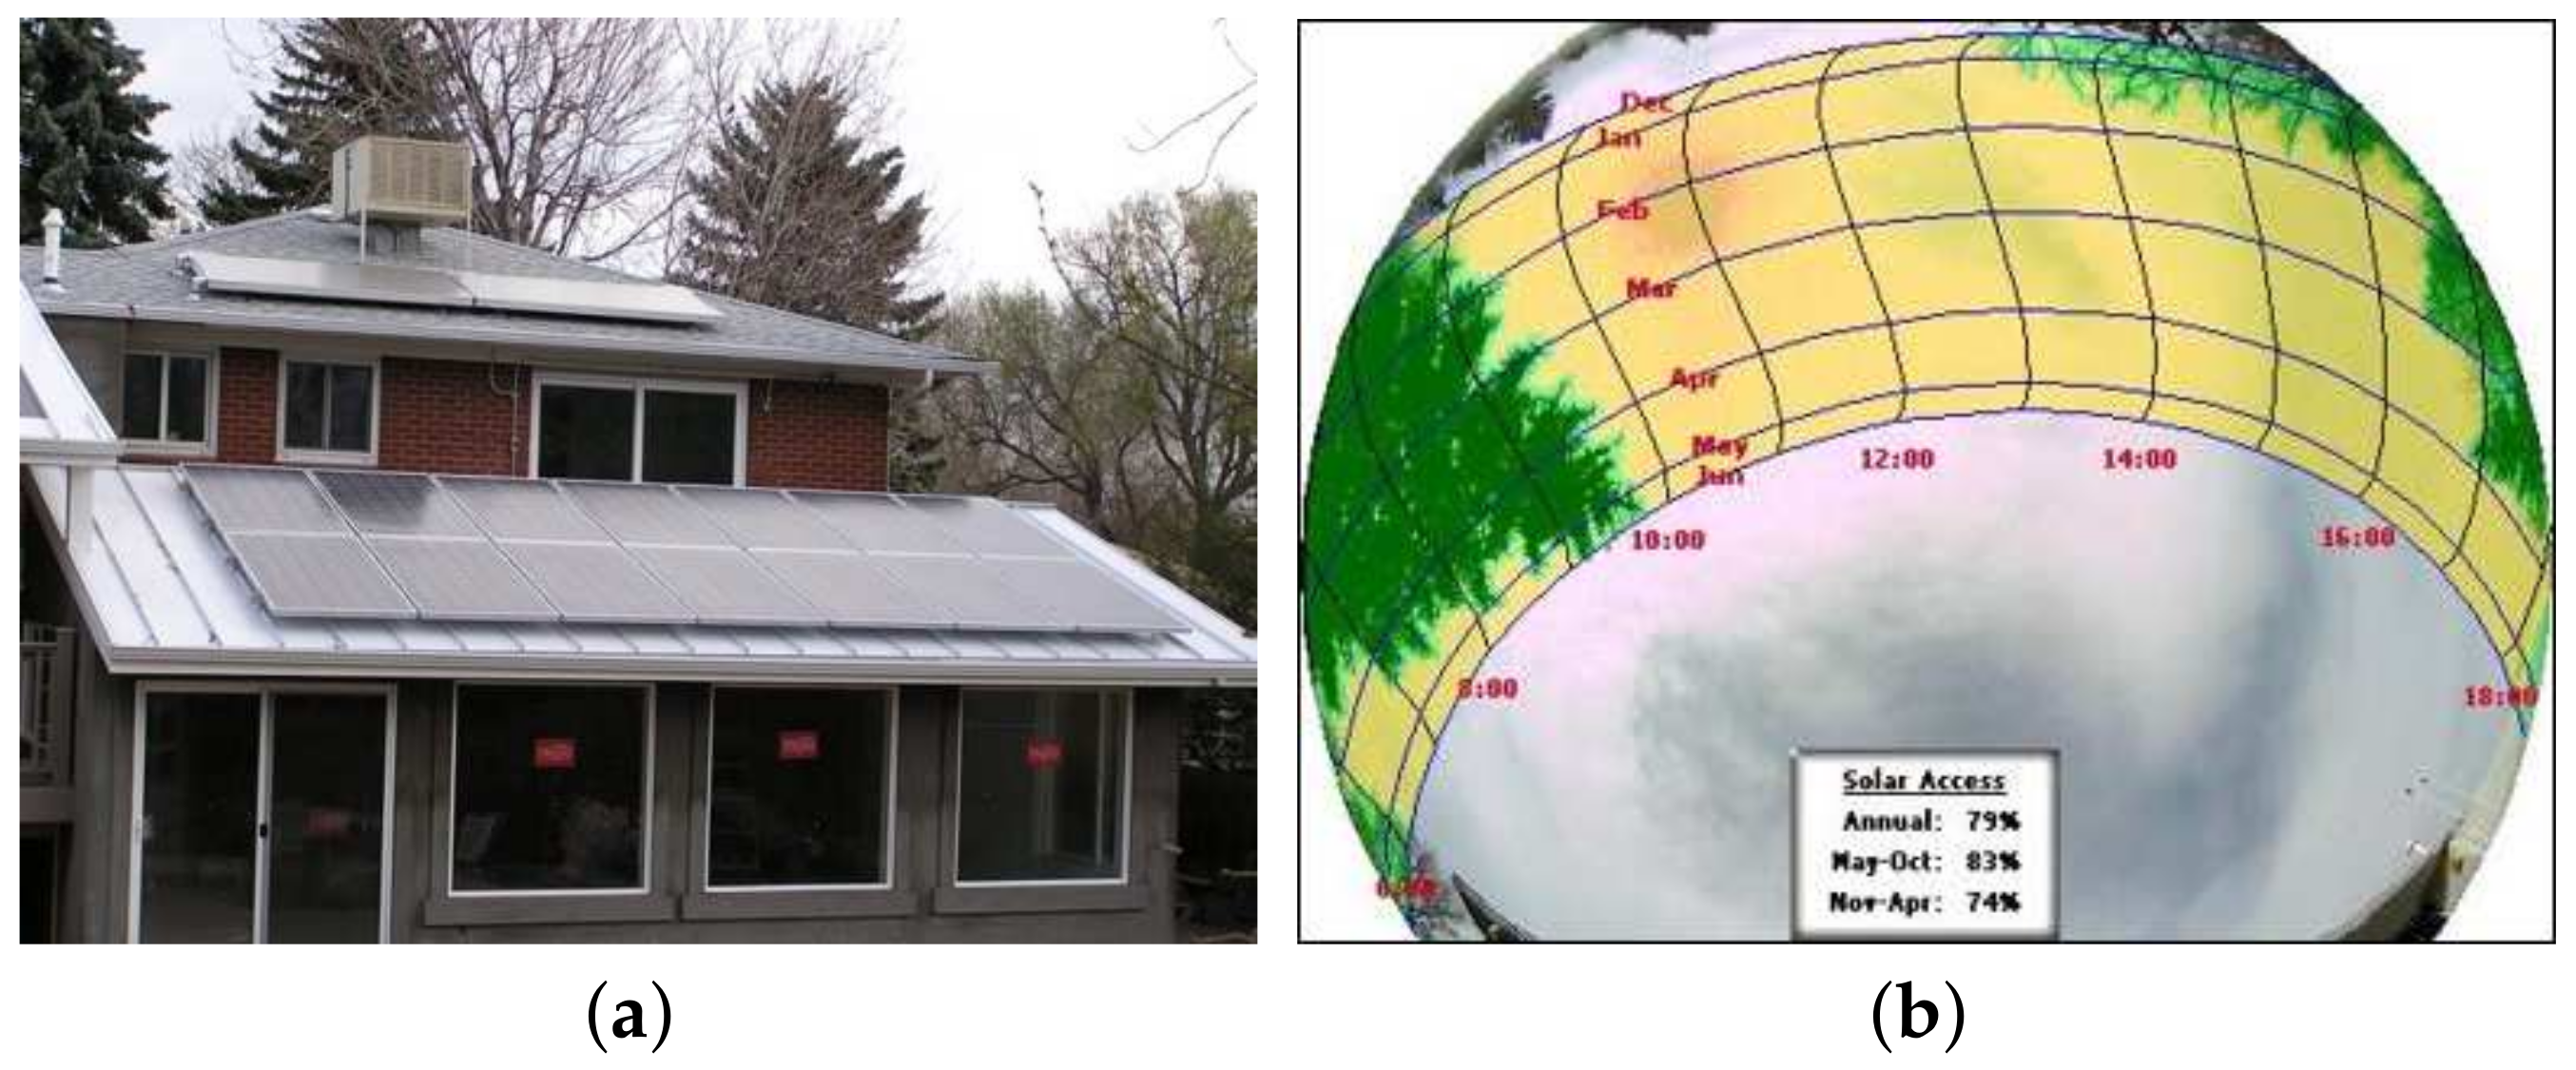
Figure 2.
(a) Equivalent circuit model of a PV cell. Subindexes stand for string s, module m, substring j, and cell k. Cell parameters and are assumed to be the same in all cells. (b) Reverse-bias characteristics of the cells.
Figure 2.
(a) Equivalent circuit model of a PV cell. Subindexes stand for string s, module m, substring j, and cell k. Cell parameters and are assumed to be the same in all cells. (b) Reverse-bias characteristics of the cells.
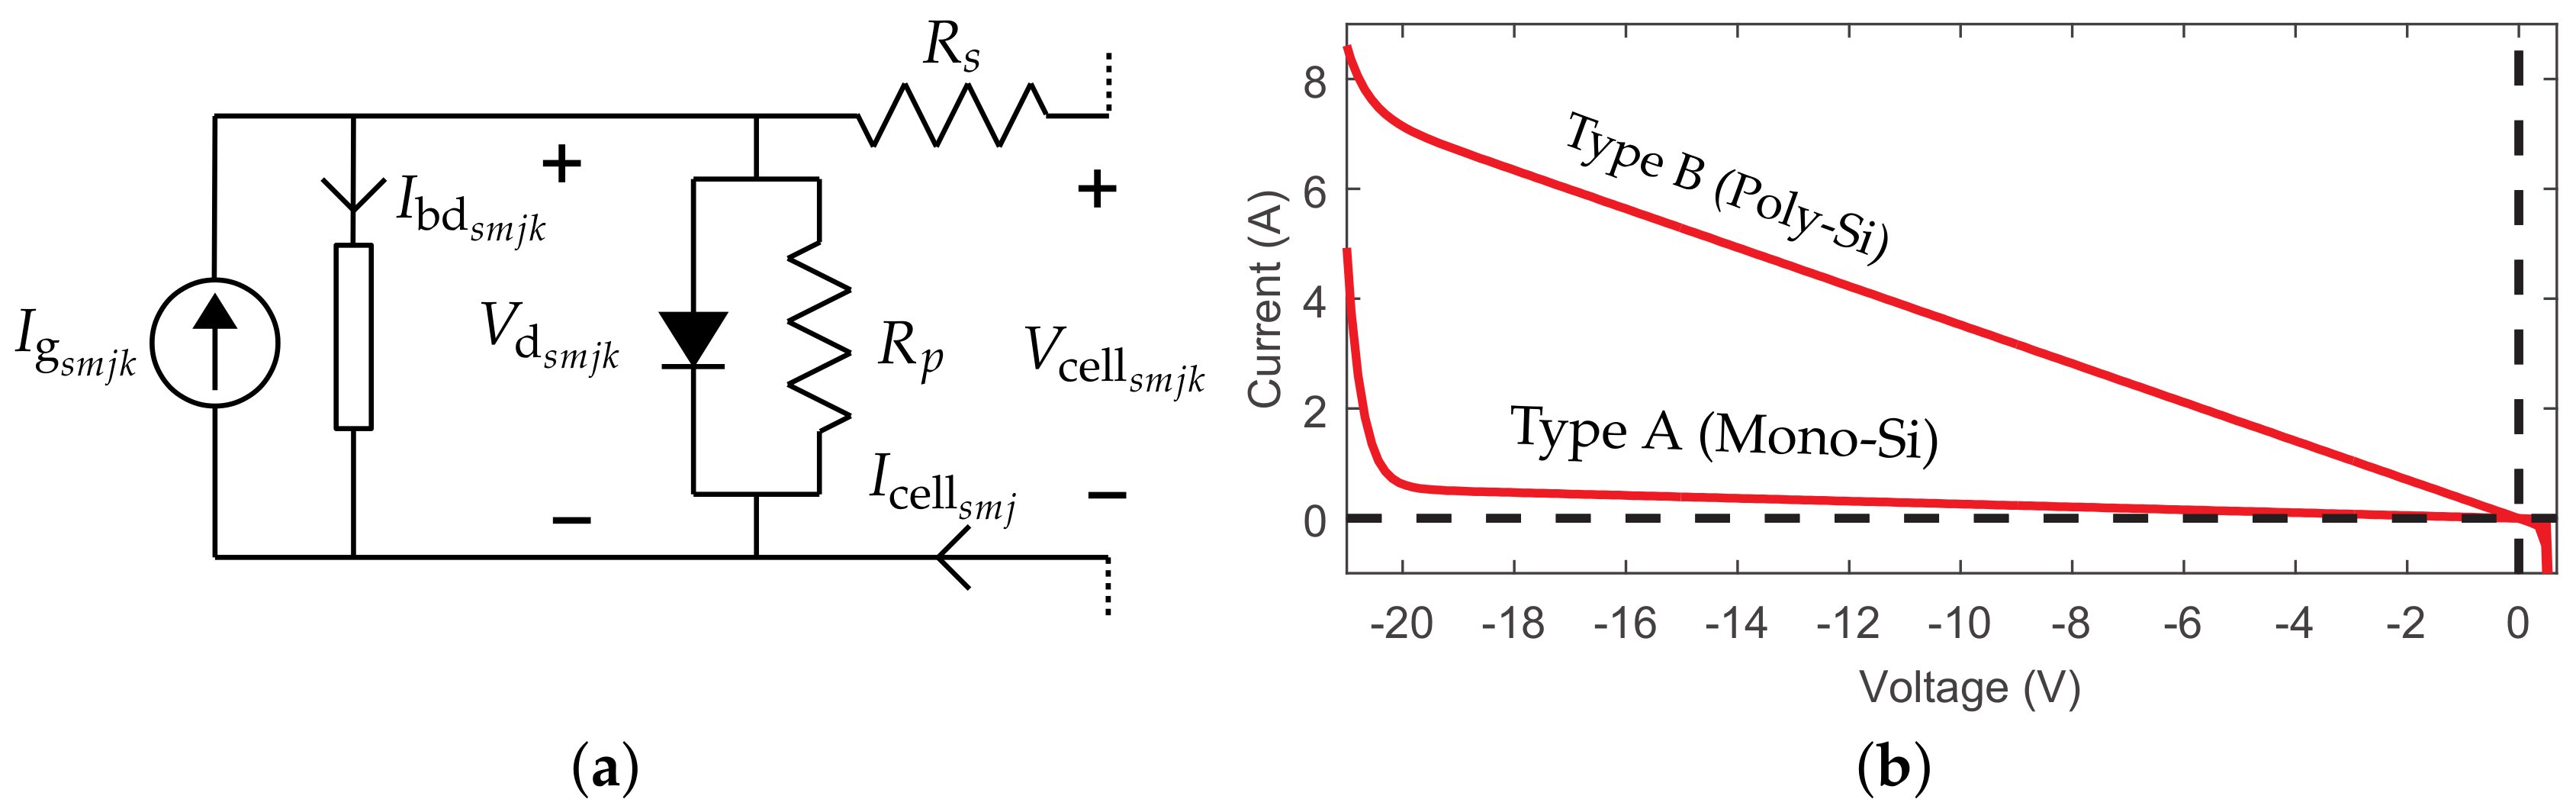
Figure 3.
Degradation and coefficient of variation of the short circuit currents of a population of 48 submodules over a period of 50 years.
Figure 3.
Degradation and coefficient of variation of the short circuit currents of a population of 48 submodules over a period of 50 years.

Figure 4.
Detail of operation of a bypassed submodule in the case of a heavy mismatch in a single cell. Assuming 20 cells connected in series in a submodule, forward biased cells impose a large reverse-bias voltage ( V) across the mismatched cell. Given a reverse current through the submodule, the affected cell may dissipate a large amount of power.
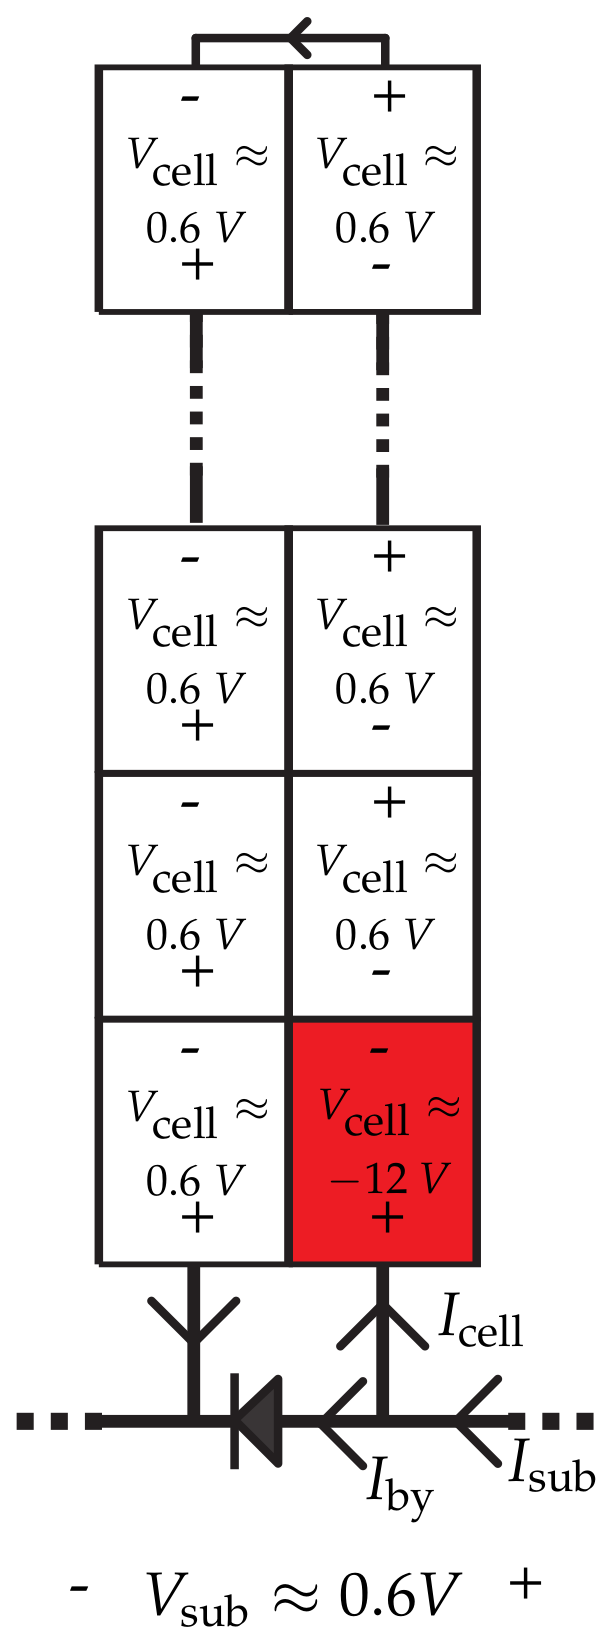
Figure 5.
Levels of granularity in a PV system.

Figure 6.
Different power electronics architectures in a PV system composed of strings, modules per string, and submodules (or substrings) per module: (a) with a conventional system-level or string-level inverter; (b) with FPP DC optimizers [29]; (c) with FPP microinverters [30]; (d) with DPP PV-to-bus subMICs [33]; (e) with DPP PV-to-PV subMICs [34]; (f) with FPP microinverters + DPP PV-to-bus subMICs [38].
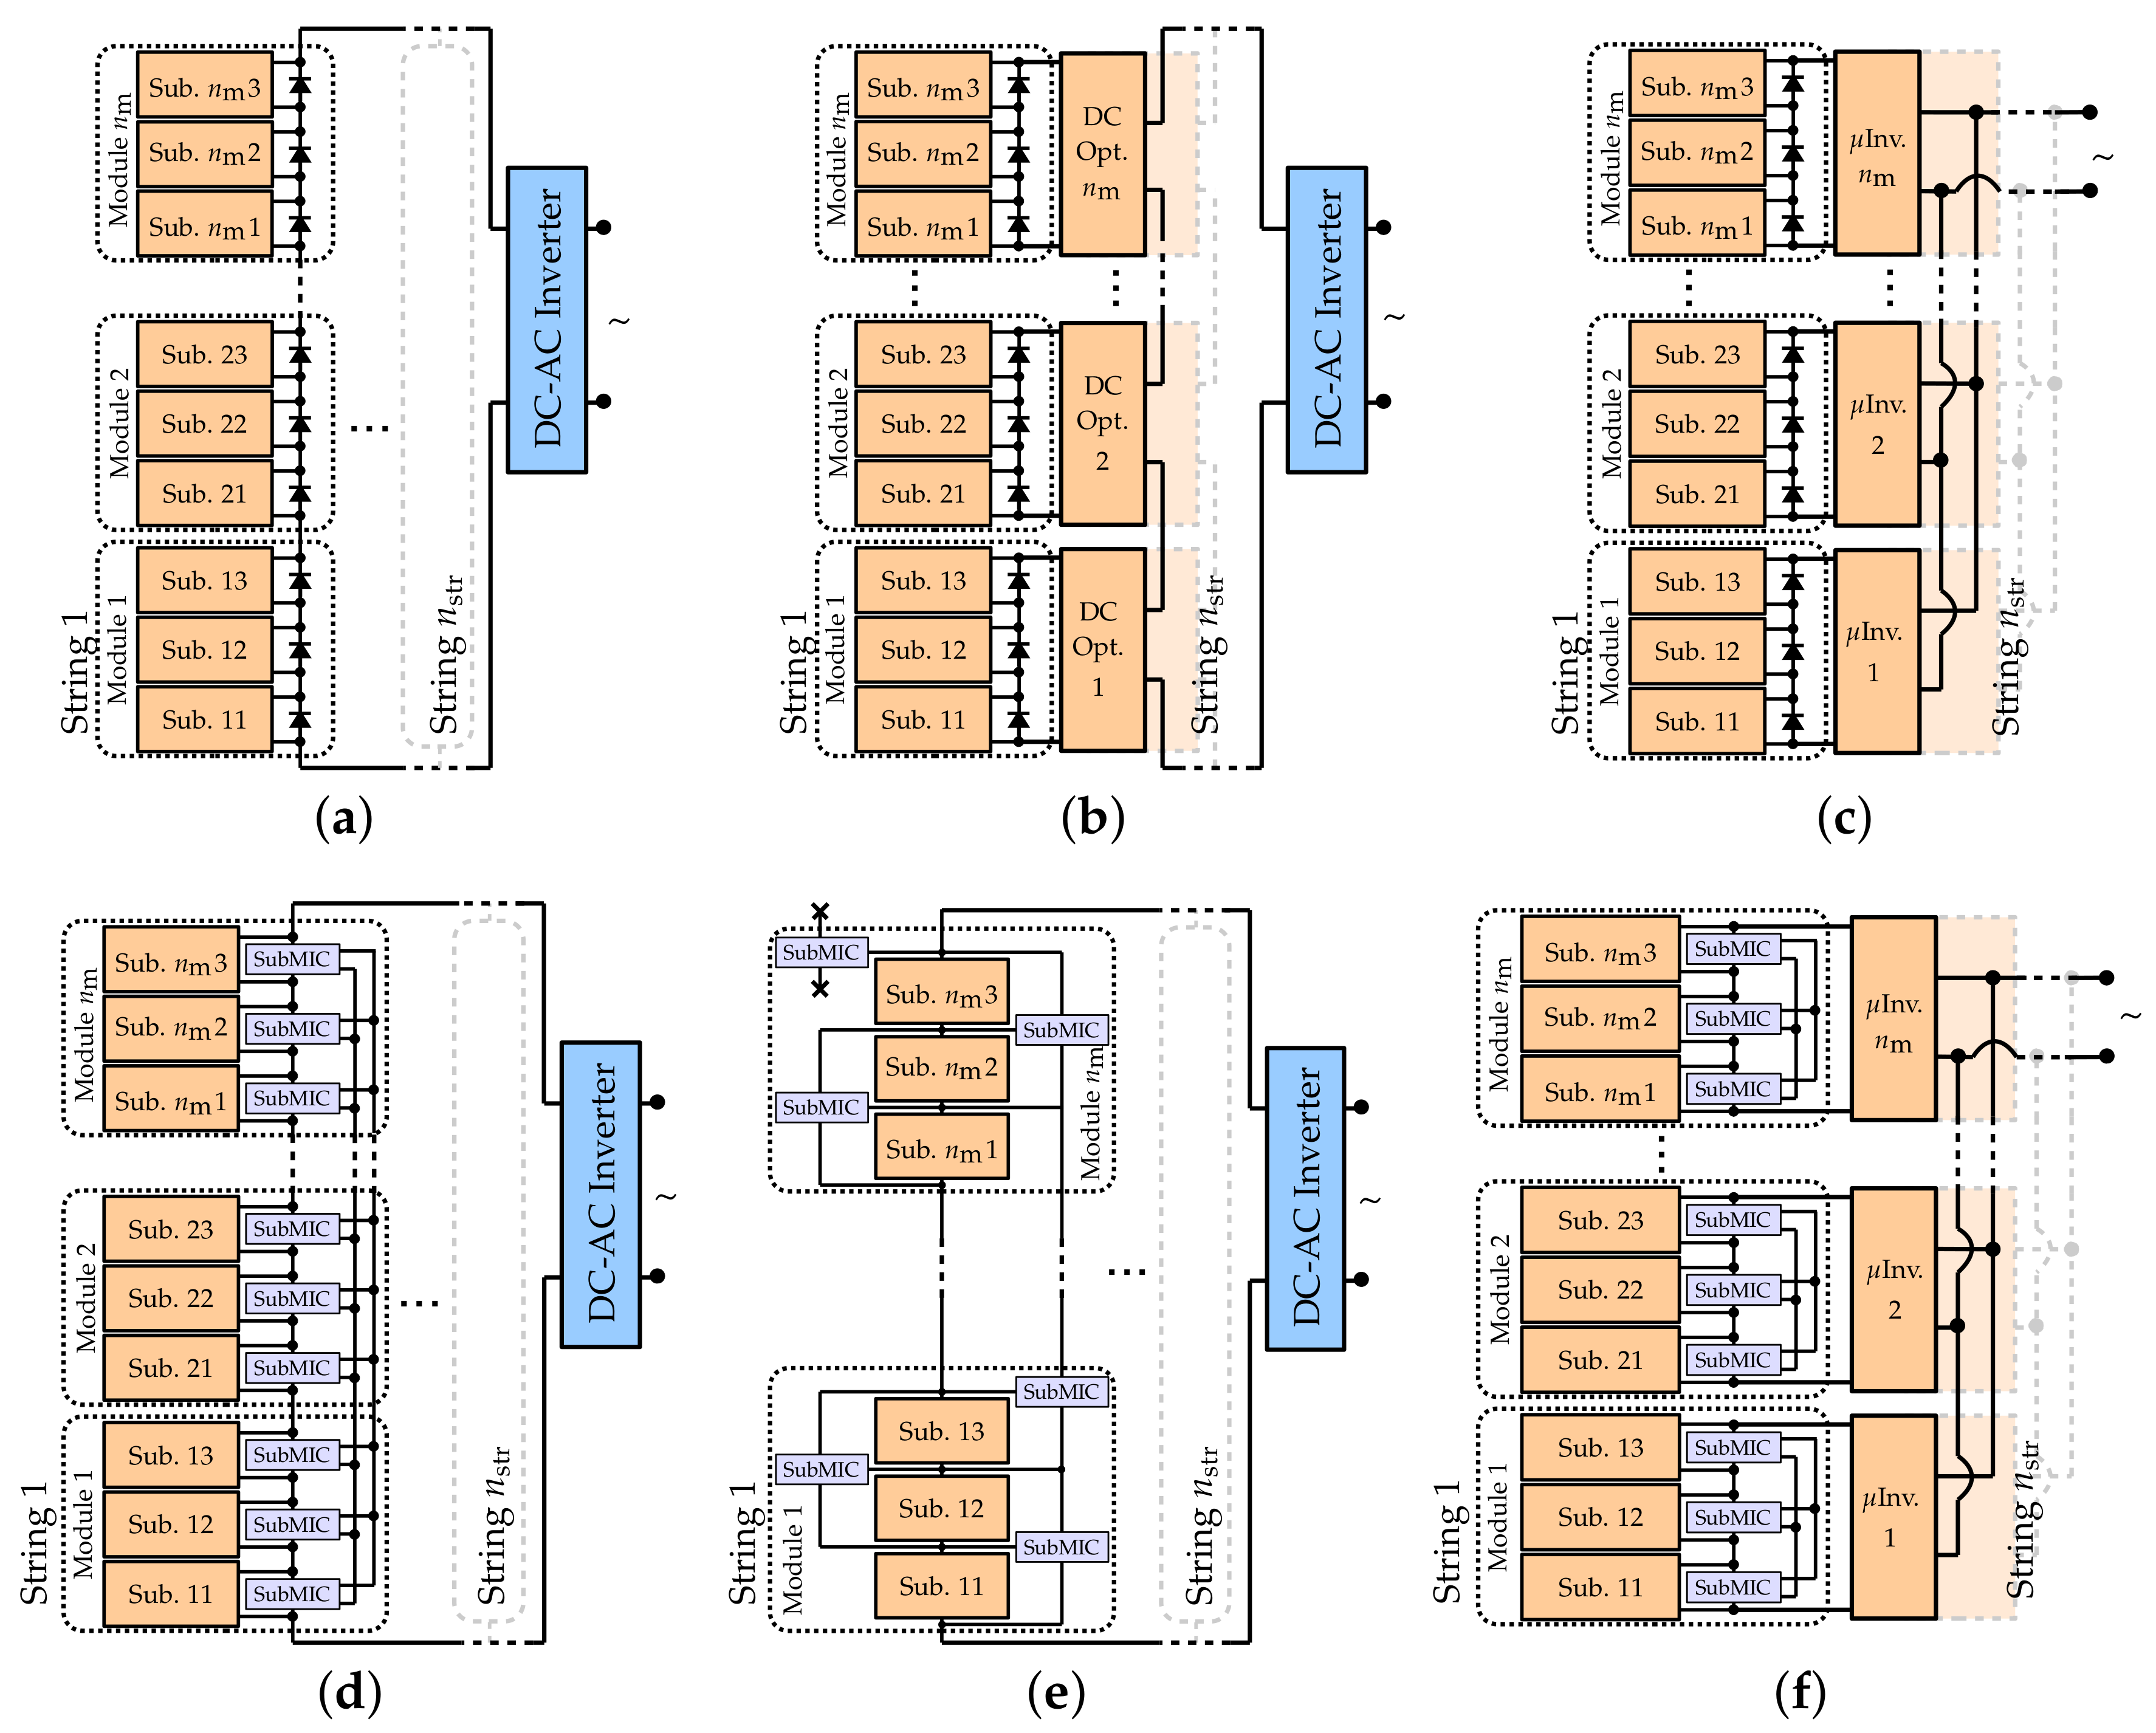
Figure 7.
Average histogram of power dissipated in PV cells over 50 years of operation. SubMICs in the PV-to-bus and subMIC-enhanced microinverter architectures are rated at one-third of the submodule power.
Figure 7.
Average histogram of power dissipated in PV cells over 50 years of operation. SubMICs in the PV-to-bus and subMIC-enhanced microinverter architectures are rated at one-third of the submodule power.
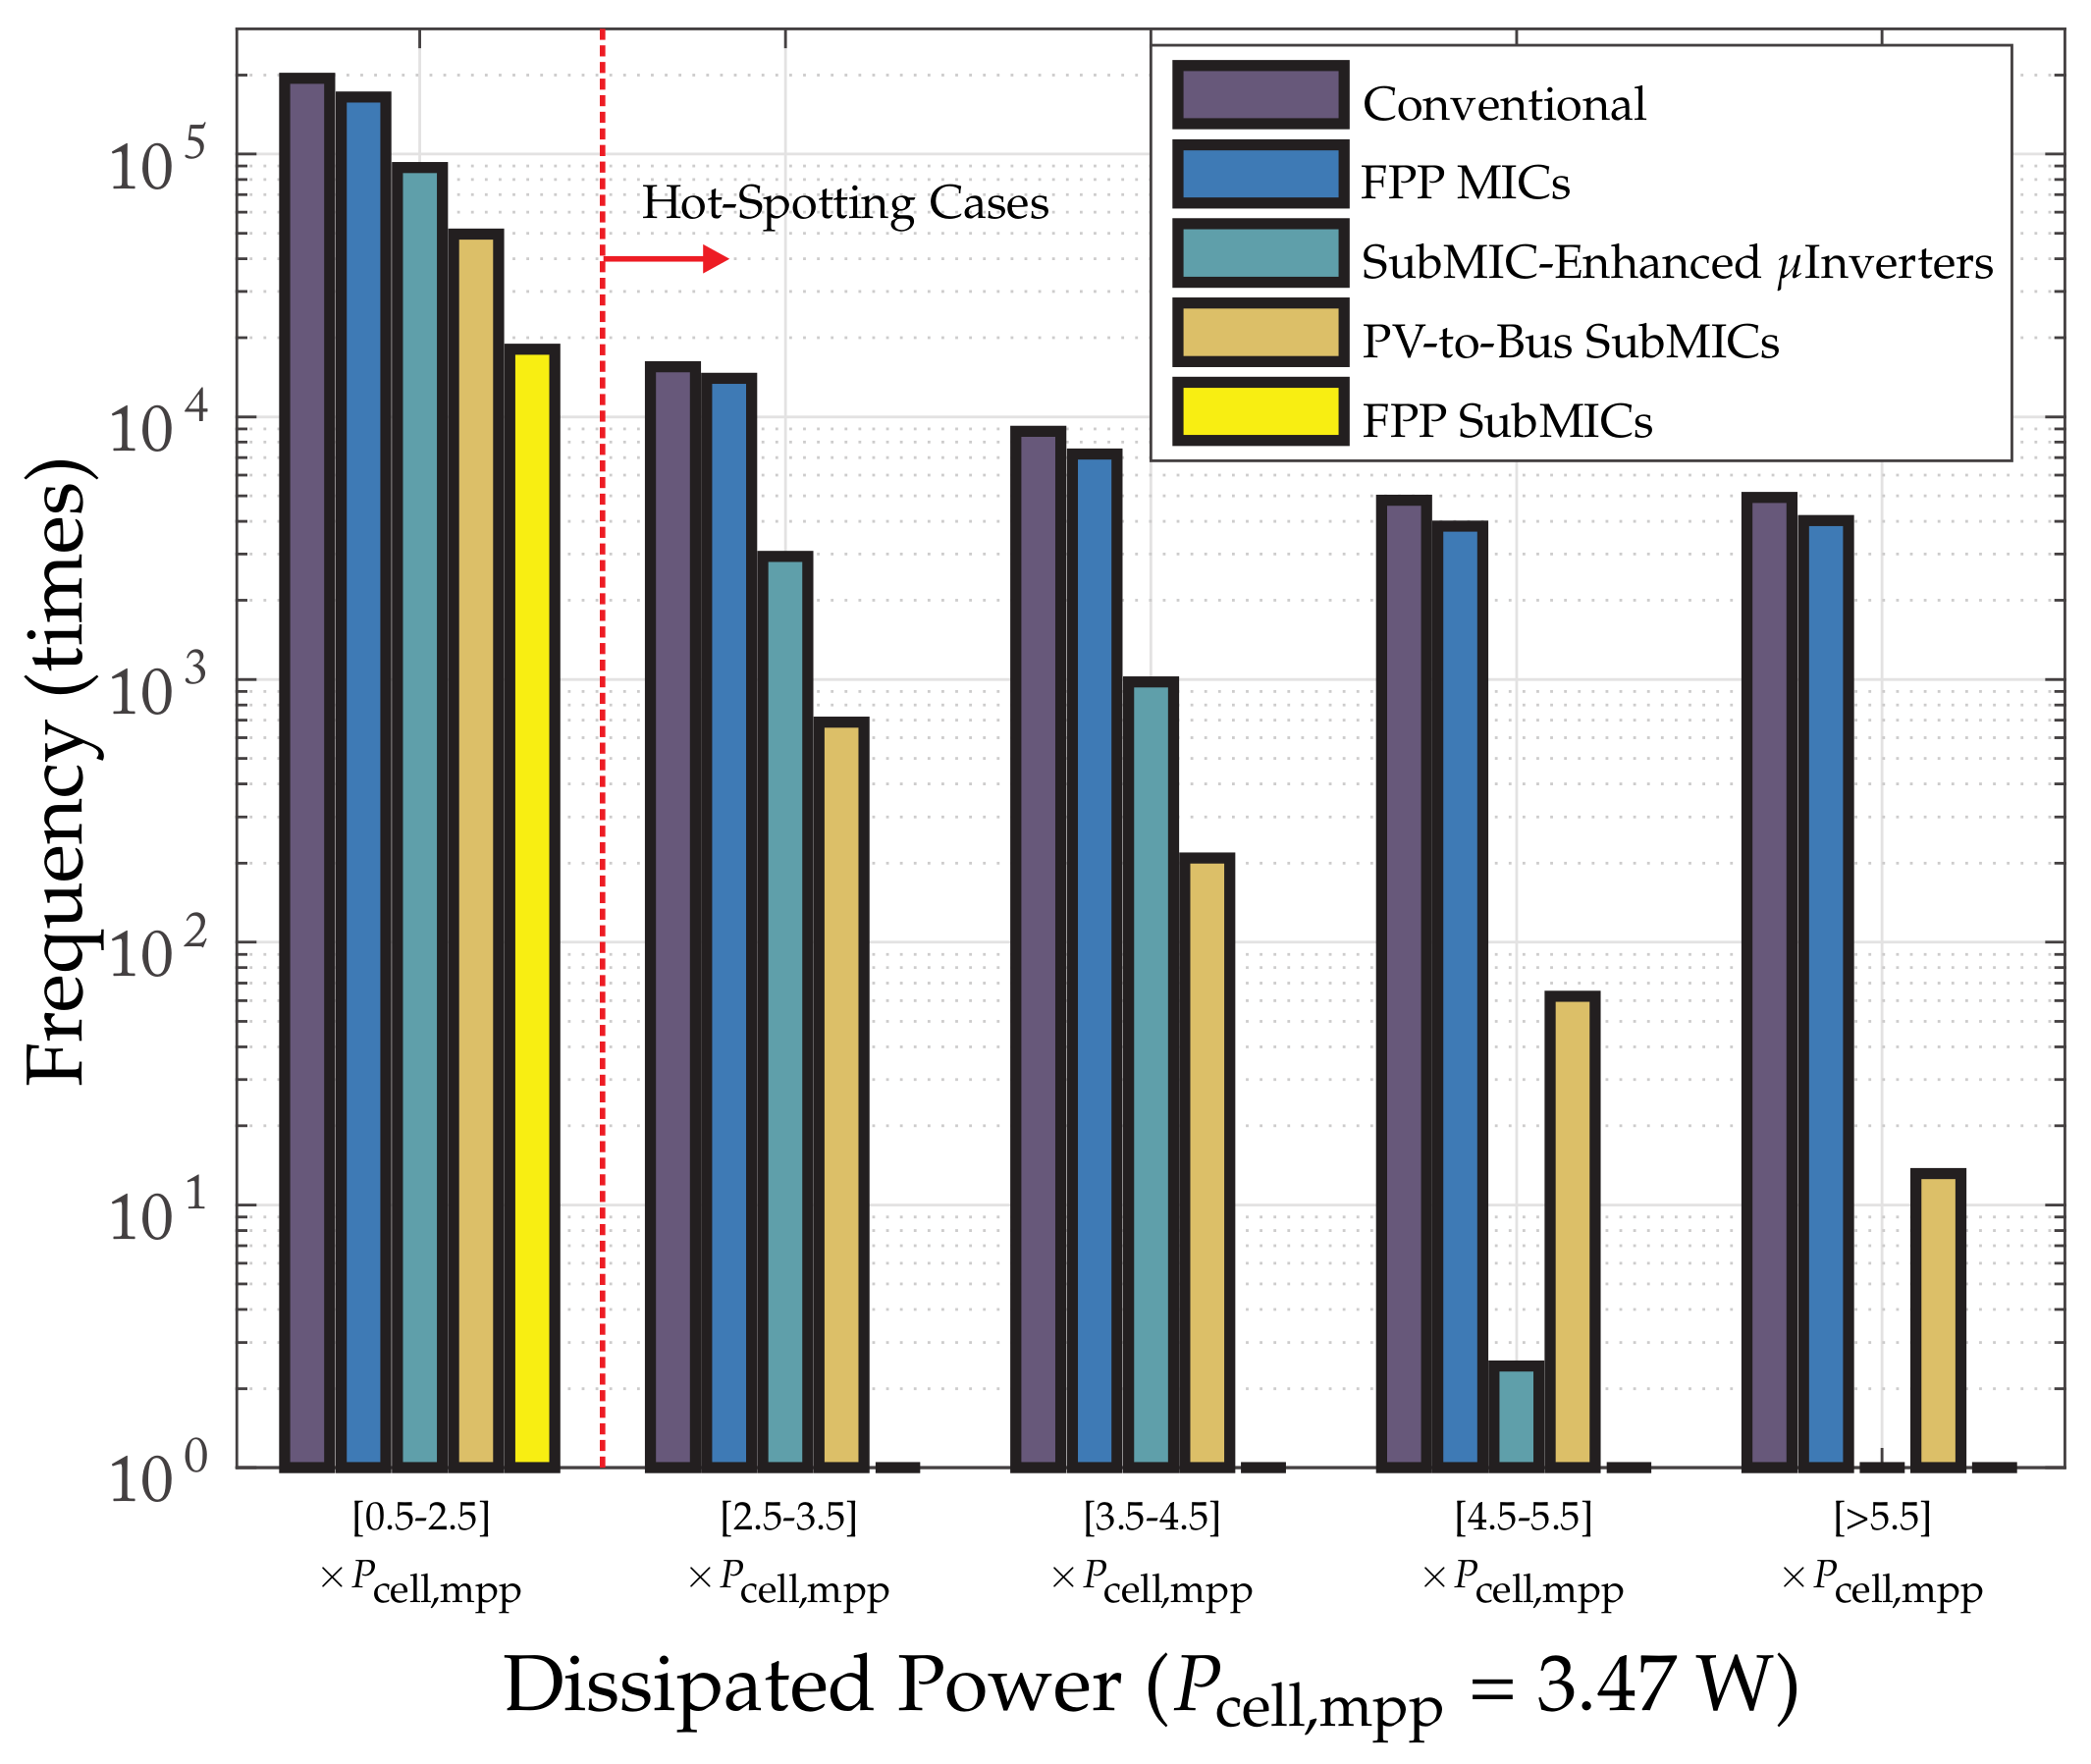
Figure 8.
Average histogram of yearly hot-spotting occurrence over 50 years of operation. SubMICs in the PV-to-bus and subMIC-enhanced microinverter architectures are rated at one-third of the submodule power.
Figure 8.
Average histogram of yearly hot-spotting occurrence over 50 years of operation. SubMICs in the PV-to-bus and subMIC-enhanced microinverter architectures are rated at one-third of the submodule power.
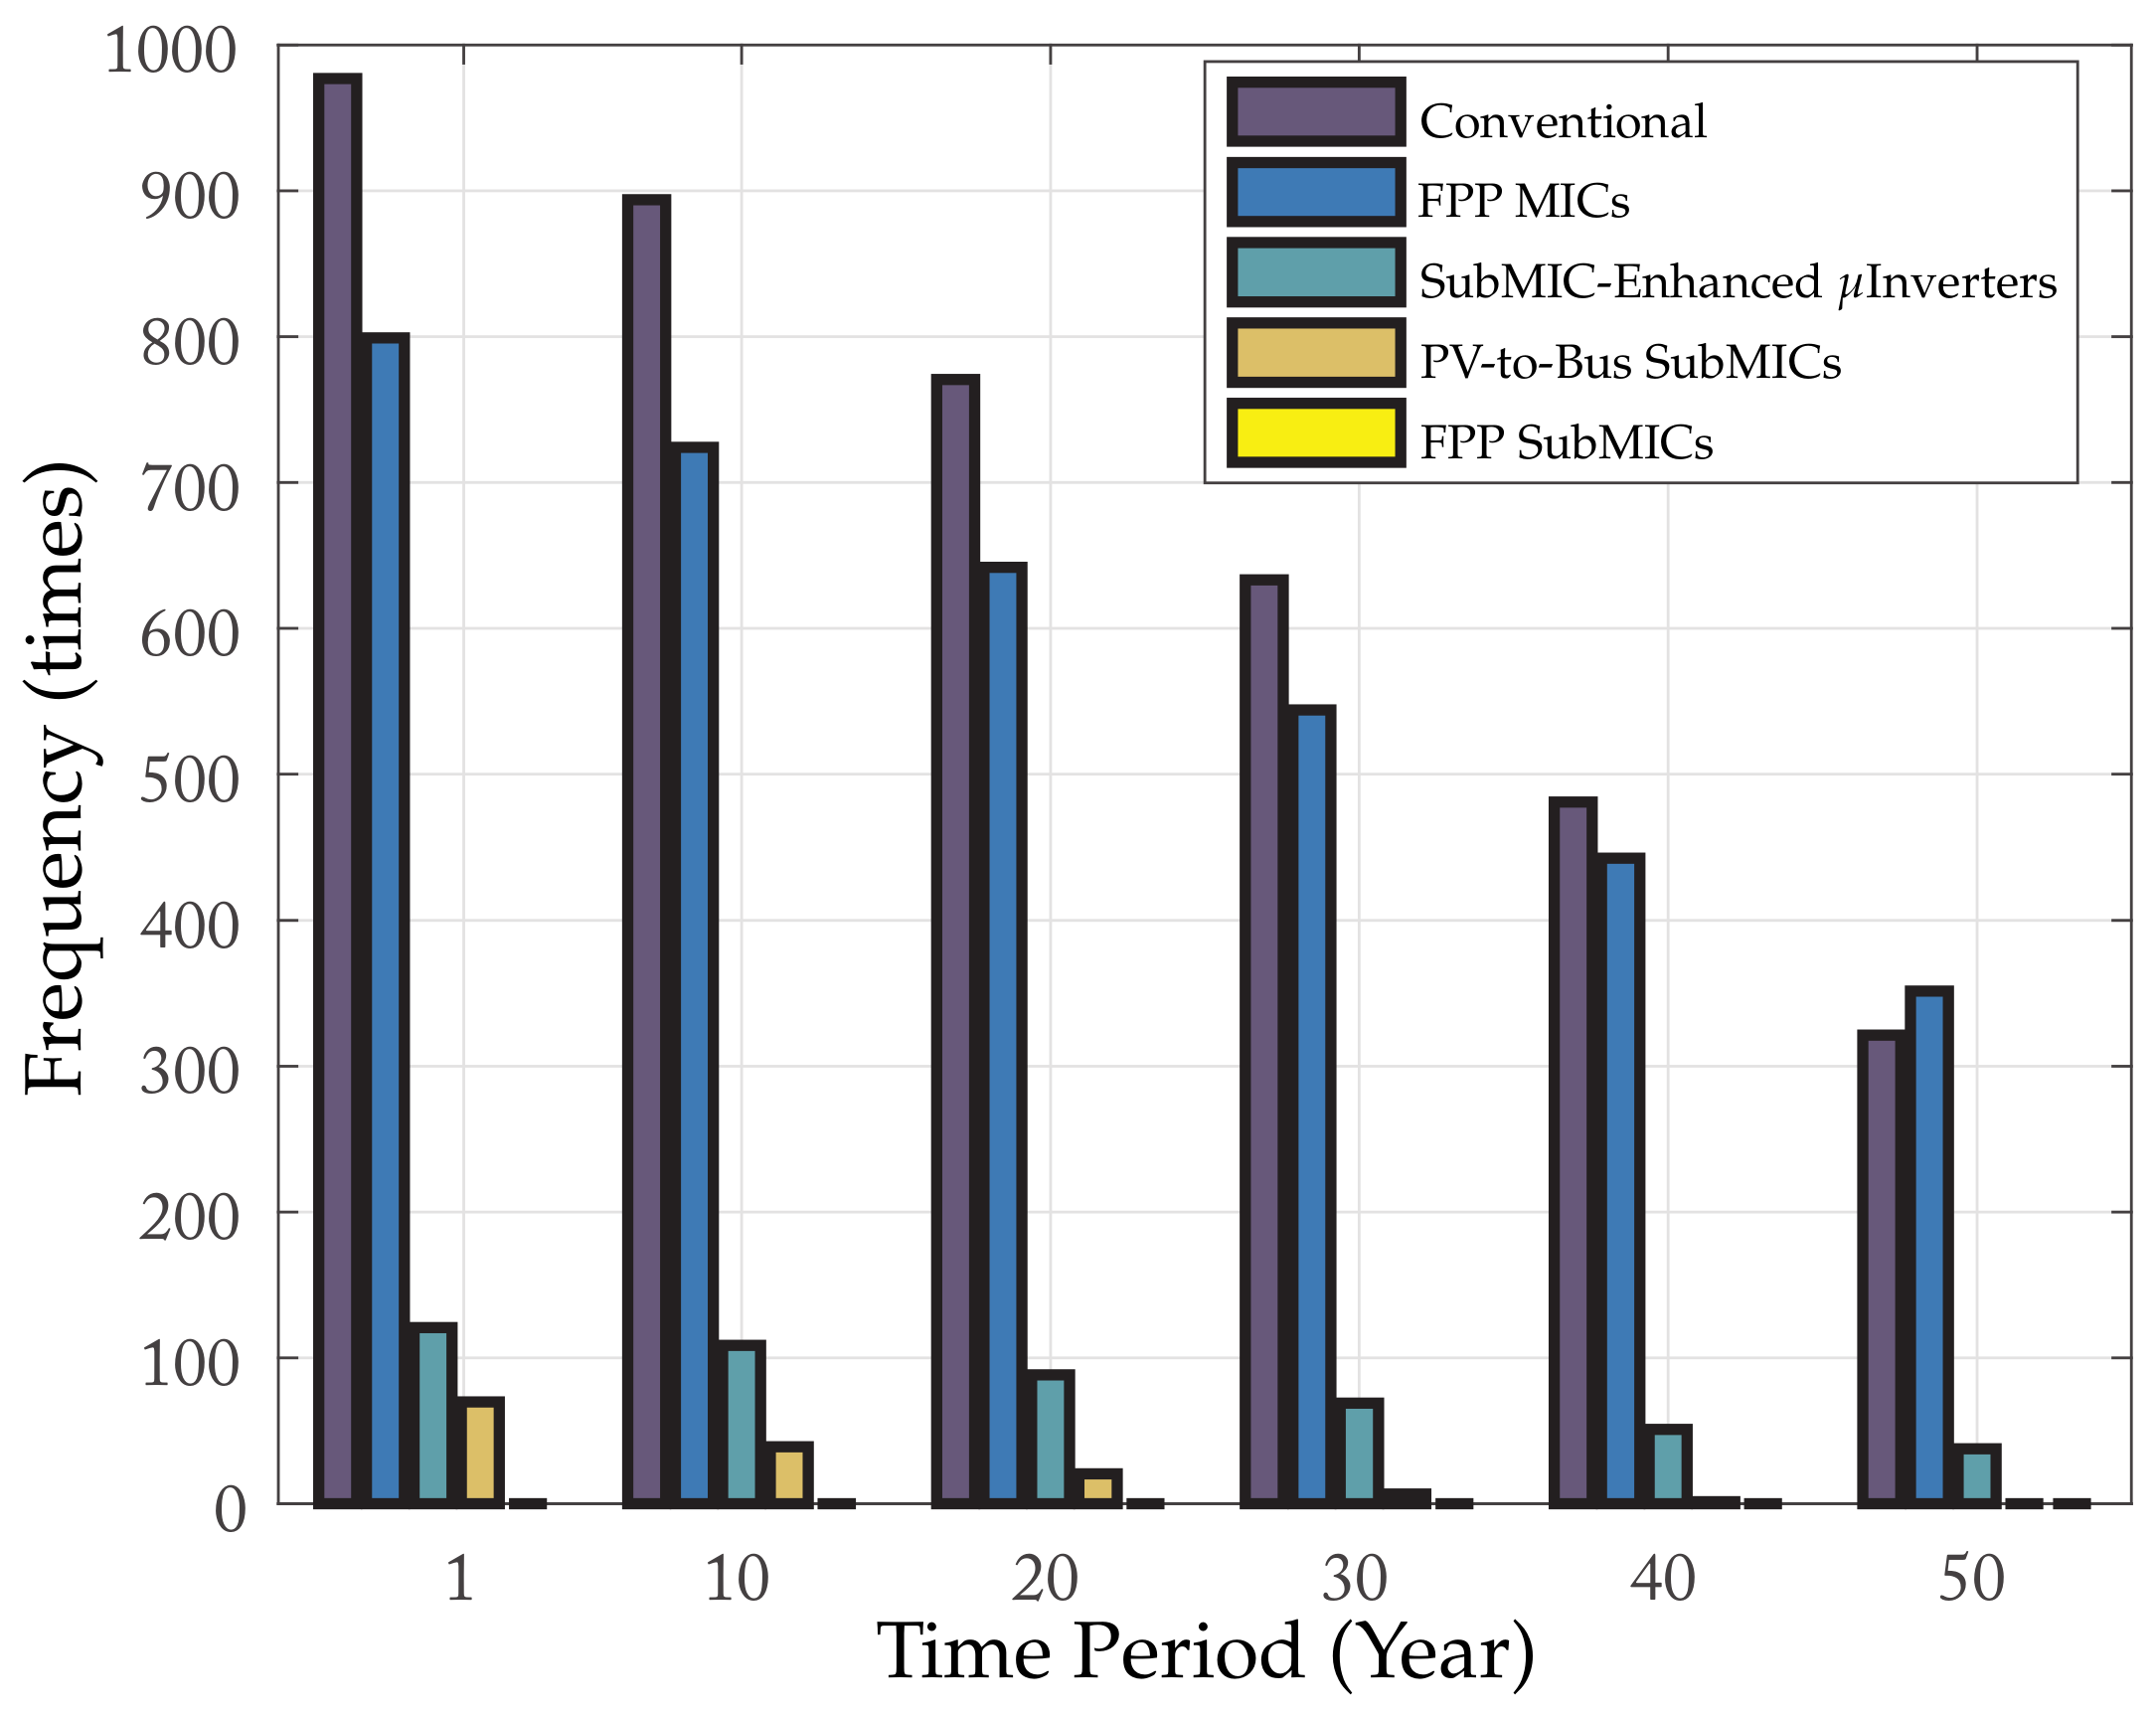
Figure 9.
Mono-Si modules: average histogram of yearly hot-spotting occurrence over 50 years of operation with accelerated ageing, with subMICs rated at one-third of the submodule power.
Figure 9.
Mono-Si modules: average histogram of yearly hot-spotting occurrence over 50 years of operation with accelerated ageing, with subMICs rated at one-third of the submodule power.
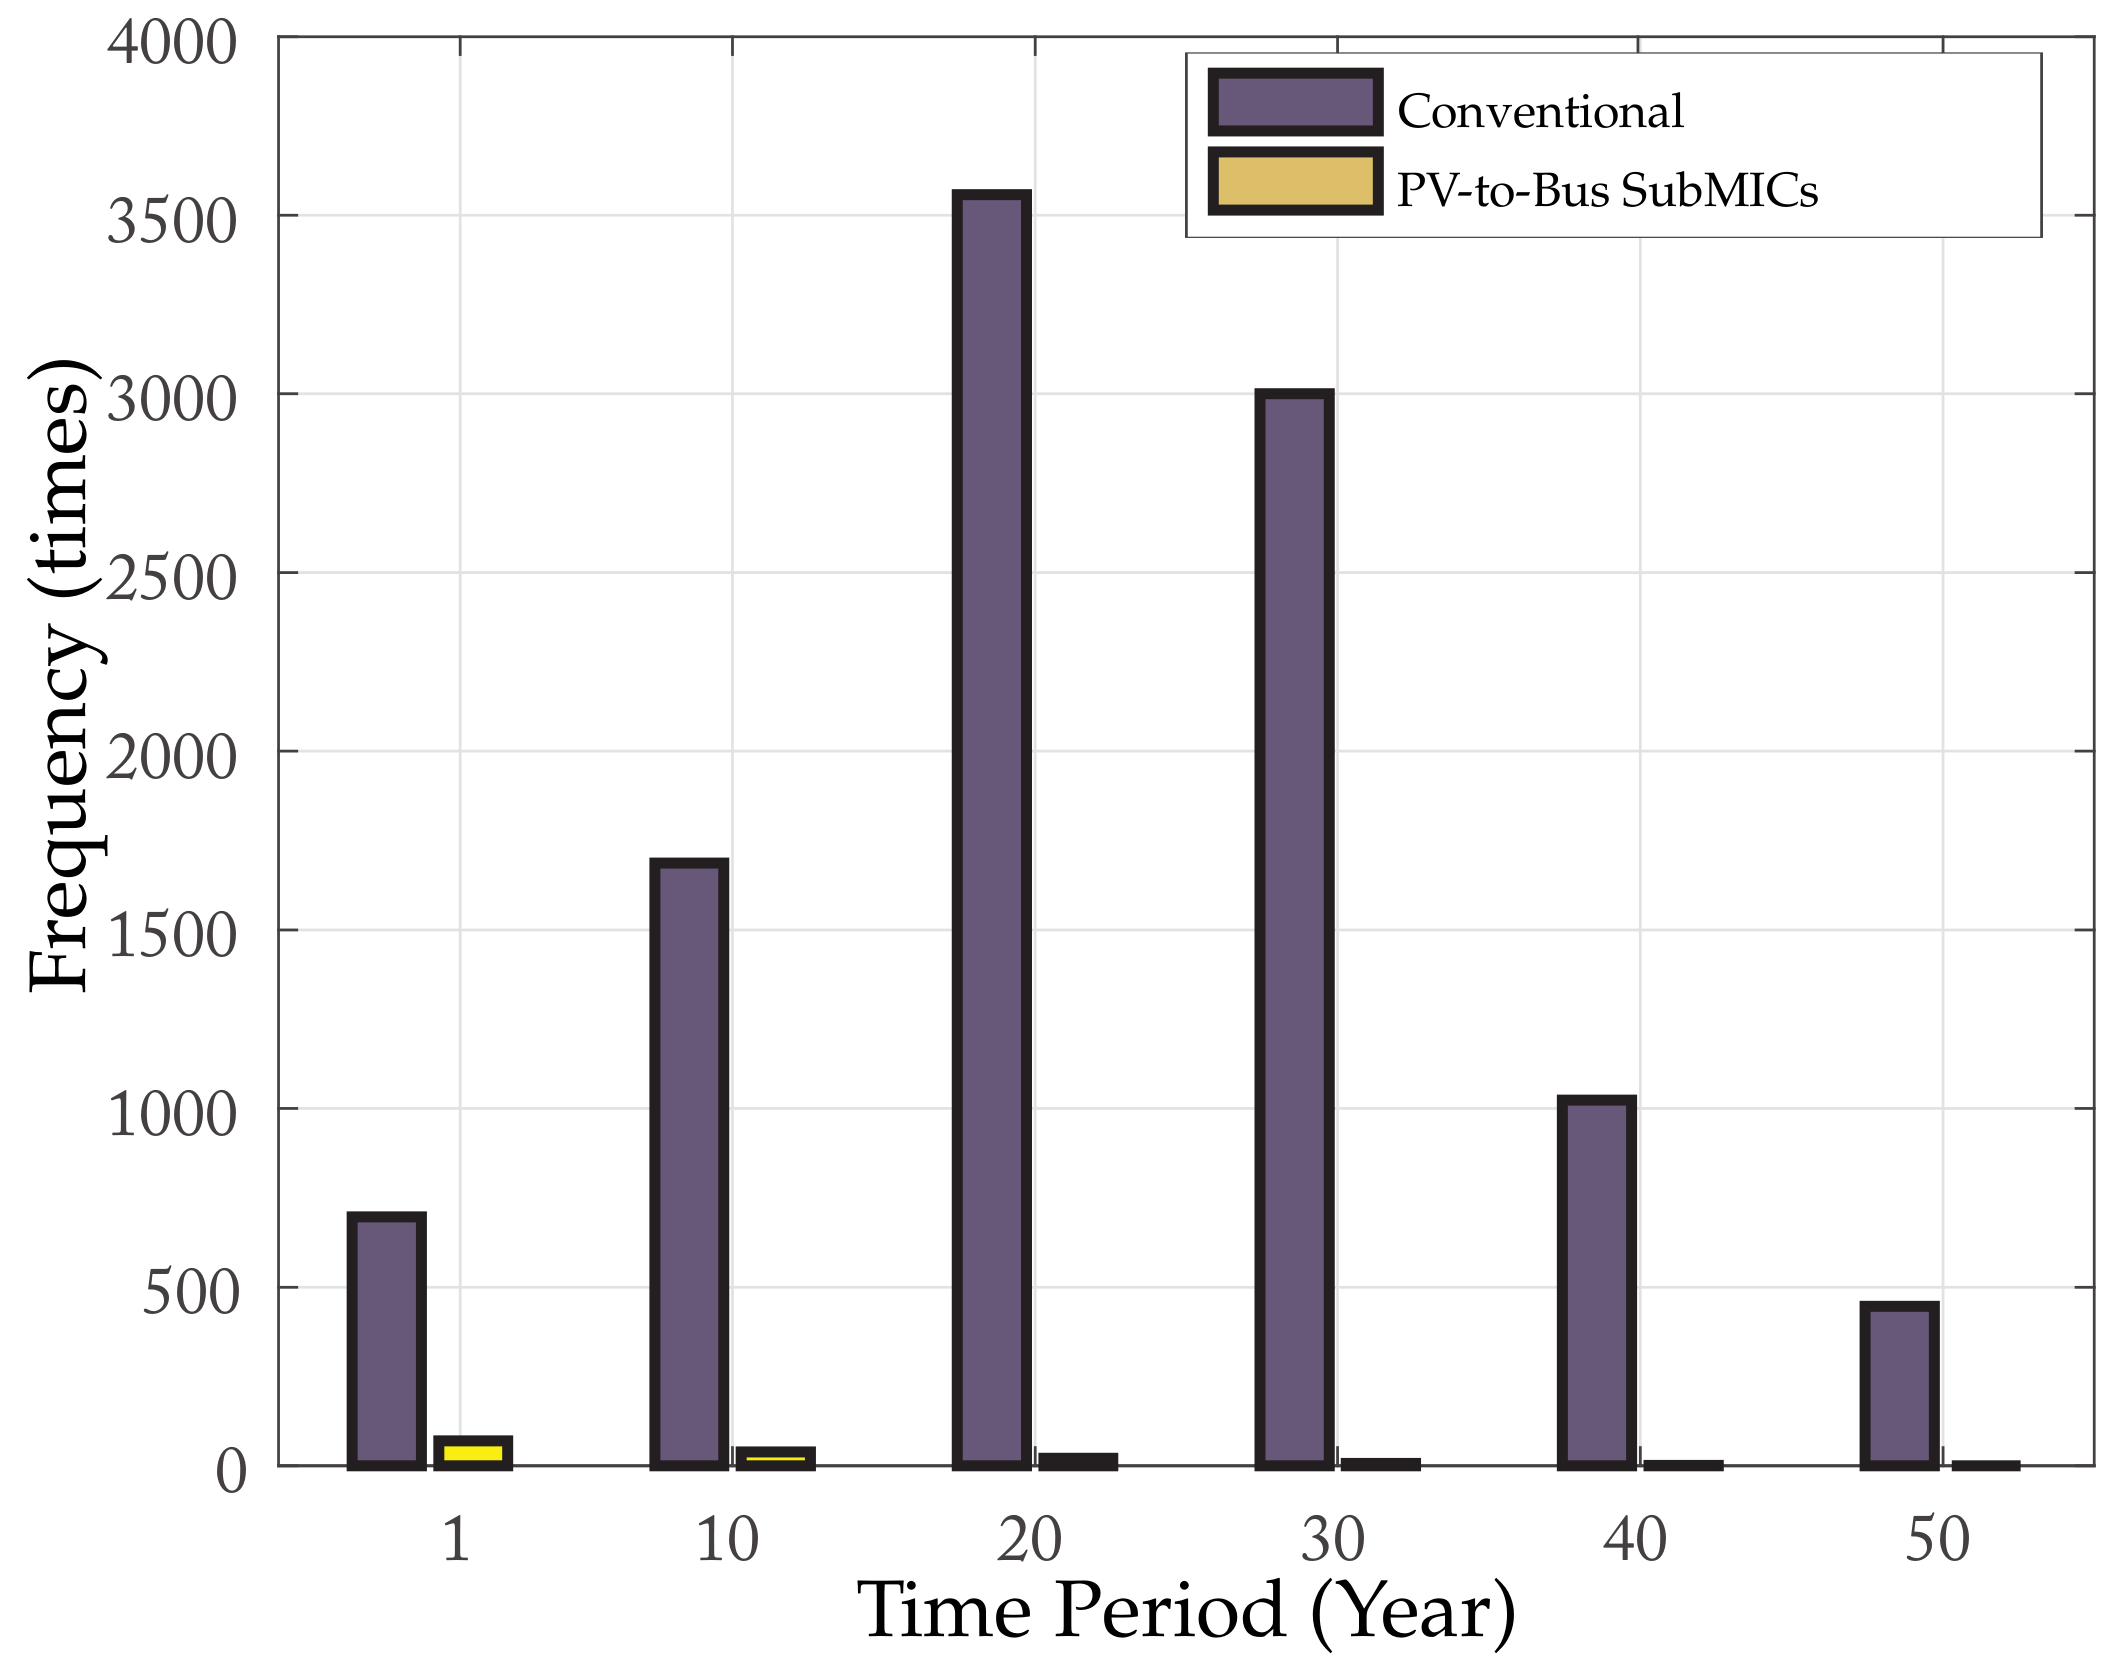
Figure 10.
Mono-Si modules: average yearly energy yield in the cases of uniform and accelerated ageing in the presence of partial shading. The initial performance loss of 19% and 14% is due to partial shading. Distributed power electronics such as DPP subMICs (rated only at one-third of the submodule power) decrease the effects of partial shading and mitigate hot-spotting, such that the energy yield is unaffected by accelerated ageing.


Table 1.
Datasheet module parameters under standard test conditions.
| Parameter | Poly-Si | Mono-Si |
|---|---|---|
| 8.1 A | 8.43 A | |
| 36.1 A | 37.2 A | |
| 7.3 A | 7.95 A | |
| 28.5 V | 30.2 V | |
| 2.83 | 36.8 | |
| 208 W | 240 W | |
| 3.47 W | 4 W | |
| # Cells | 60 | 60 |
| # Submodules | 3 | 3 |
Table 2.
Hot-spot occurrence over 50 years of operation.
| Architecture | # of Hot-Spots | Reduction (%) |
|---|---|---|
| Conventional | 34,077 | - |
| FPP MICs | 29,098 | 14.6% |
| SubMIC-Enhanced Inverters | 3922 | 88.5% |
| PV-to-Bus SubMICs | 973 | 97.1% |
| FPP SubMICs | 0 | 100% |
© 2018 by the authors. Licensee MDPI, Basel, Switzerland. This article is an open access article distributed under the terms and conditions of the Creative Commons Attribution (CC BY) license (http://creativecommons.org/licenses/by/4.0/).
Share and Cite
MDPI and ACS Style
Olalla, C.; Hasan, M.N.; Deline, C.; Maksimović, D. Mitigation of Hot-Spots in Photovoltaic Systems Using Distributed Power Electronics. Energies 2018, 11, 726. https://doi.org/10.3390/en11040726
AMA Style
Olalla C, Hasan MN, Deline C, Maksimović D. Mitigation of Hot-Spots in Photovoltaic Systems Using Distributed Power Electronics. Energies. 2018; 11(4):726. https://doi.org/10.3390/en11040726
Chicago/Turabian StyleOlalla, Carlos, Md. Nazmul Hasan, Chris Deline, and Dragan Maksimović. 2018. "Mitigation of Hot-Spots in Photovoltaic Systems Using Distributed Power Electronics" Energies 11, no. 4: 726. https://doi.org/10.3390/en11040726
Note that from the first issue of 2016, this journal uses article numbers instead of page numbers. See further details here.