Multi-Objective Optimal Design of Renewable Energy Integrated CCHP System Using PICEA-g

College of Systems Engineering, National University of Defense Technology, Changsha 410073, China
*
Author to whom correspondence should be addressed.
Energies 2018, 11(4), 743; https://doi.org/10.3390/en11040743
Submission received: 19 January 2018
/
Revised: 21 March 2018
/
Accepted: 21 March 2018
/
Published: 25 March 2018
Abstract
:The integration of renewable energies into combined cooling, heating, and power (CCHP) systems has become increasingly popular in recent years. However, the optimization of renewable energies integrated CCHP (RECCHP) systems (i.e., optimal component configurations) is far from being well addressed, especially in isolated mode. This study aims to fill this research gap. A multi-objective optimization model characterizing the system reliability, system cost, and environmental sustainability is constructed. In this model, the objectives include minimization of annual total cost (ATC), carbon dioxide emission (CDE), and loss of energy supply probability (LESP). The decision variables representing the configuration of the RECCHP system include the number of photovoltaic (PV) panels and wind turbines (WTs), the tilt angle of PV panels, the height of WTs, the maximum fuel consumption, and the capacity of battery and heat storage tanks (HSTs). The multi-objective model is solved by a multi-objective evolutionary algorithm, namely, the preference-inspired coevolutionary algorithm (PICEA-g), resulting in a set of Pareto optimal (trade-off) solutions. Then, a decision-making process is demonstrated, selecting a preferred solution amongst those trade-off solutions by further considering the decision-maker preferences. Furthermore, on the optimization of the RECCHP system, operational strategies (i.e., following electric load, FEL, and following thermal load, FTL) are considered, respectively. Experimental results show that the FEL and FTL strategies lead to different optimal configurations. In general, the FTL is recommended in summer and winter, while the FEL is more suitable for spring and autumn. Compared with traditional energy systems, RECCHP has better economic and environmental advantages.
1. Introduction
The combined cooling, heating, and power (CCHP) system—also known as the tri-generation system—has received increasing attention in both academia and industry in recent years because of its high efficiency in the use of energy sources [1,2]. The CCHP system has shown to be capable of converting about 80% of the available fuel into usable energy, which is much more efficient than separation systems [3,4]. Given the depletion of fossil energy and degradation of environment, renewable energies are currently strongly recommended to be integrated into CCHP systems [5]. The use of renewable energies facilitates the application of CCHP systems in places where the power grid is unavailable (e.g., islands, plateaus, deserts).
The early studies of CCHP system optimization mainly focus on the system cost minimization [6,7,8,9,10]. Recently, researchers have started to consider system reliability and environmental sustainability, in addition to the system cost [4,11,12,13,14,15]. Since the optimization model is often non-convex and/or non-linear and involves both integer and real decision variables, a number of algorithms have been proposed to solve the model. For example, Lahdelma et al. [16] modelled the hourly CCHP operation as a linear programming problem, and used the power simplex algorithm to solve it. Rong et al. [17] proposed different algorithms for their CCHP models, such as the extended power simplex algorithm and the relaxed ramp-constraints [18]. Hussain et al. [19] developed a mixed integer linear programming-based CCHP model to minimize the daily operation cost of the external energy network. Other related studies include [16,20,21,22,23,24]. However, since mathematical programming methods may face difficulty in some complex optimization problems, intelligent algorithms such as particle swarm algorithm (PSO) [25,26] and genetic algorithm (GA) [27] have also been used. For instance, Wang et al. [25,28] employed PSO and GA to find the optimal configuration of a CCHP system such that the system cost is minimized. In [29] the primary energy saving (PES), energy efficiency (), and CO2 emission reduction (CER) are employed to evaluate the performances of CCHP systems for a hypothetical building in Dalian (China). Wei et al. adopted the non-dominated sorting genetic algorithm-II to find a set of Pareto optimal configurations [14]. Gimelli et al. [30] used a predictive analysis method to optimize CCHP system configuration with the aim of maximizing the global energy saving. Muccillo et al. [31] carried out predictive analyses first, then employed a multi-objective approach to find optimal plant configurations that maximize the energy production while guaranteeing reasonable profitability. The results show that the proposed method can save over 17% primary energy. Alvarado et al. [32] presented a technology selection and operation (TSO) model for distributed energy systems in which the life-time cost, carbon emissions, and real-time energy prices and demands are used as indicators. This model provides meaningful insights that enable decision-makers to make more assured technical investments. Wang et al. [33] proposed a two-stage model (i.e., day-ahead cursory and real-time scheduling). The Search Improvement Process-Chaotic Optimization-Particle Swarm Optimization-Elite Retention algorithm (SIP-CO-PSO-ERS) is used to solve the model, and is shown to converge faster than traditional approaches. It is worth mentioning that the optimal configuration for a particular scenario may not be optimal when the scenario is changed. To overcome this shortage, very recently Gimelli et al. [34] developed a simple yet effective approach which can identify the most stable plant solutions through a multi-objective robust optimization.
There are also studies applying renewable energies to CCHP systems. For example, Soheyli et al. [35] built a novel CCHP system with renewable energies, and applied the co-constrained multi-objective particle swarm optimization algorithm to optimize the model. Wu et al. [36] proposed an optimization CHP micro-grid containing renewable energies. The model is shown to be able to reduce the operation cost of the micro-grid, and simultaneously to effectively increase the utilization rate of renewable energies. A photovoltaic-assisted CCHP system is introduced in [37], and a type of solar-assisted tri-generation system is analyzed in [38,39]. Both show that the system is efficient in terms of energy usage, emission reduction, and economic benefits [40]. Kang et al. [41] investigate the environmental and energy potential of a renewable CCHP system in a residential application under Korea and Canada weather conditions. In addition, there are two widely adopted operation strategies in CCHP systems: following electric load (FEL) and following thermal load (FTL) [3,11]. Rey et al. [42] reveal that the micro-CCHP system is suitable in mild weather during the summer season in the FTL strategy. Wang et al. [43] explain that the FTL strategy is more suitable for cold areas, while the FEL prefers mild climate zones. According to the life cycle assessment, the FTL is found to be more environmentally-friendly than the FEL in terms of energy saving and emission reduction [44,45]. However, the above studies on FEL and FTL are not very applicable to CCHP systems containing renewable energies. Therefore, new research needs to redesign the FEL and FTL operating strategies for the RECCHP system.
Although many studies in the literature have investigated the optimization of CCHP systems, the multi-objective optimization of isolated CCHP systems embedded with renewable energies has not been systematically studied—in particular, the performance of CCHP systems under the use of both FEL and FTL strategies and more detailed considerations about component models of stand-alone RECCHP systems. This study fills in this research gap. Its main contributions are as follows: (I) the system architecture of a renewable energies integrated CCHP (RECCHP) system in isolated mode is presented; (II) a multi-objective model considering the criteria of system cost, system reliability, and environmental sustainability is built to optimize configurations of the RECCHP system; (III) PICEA-g has been applied for the first time to the design of a multi-objective CCHP system with renewable energies [46]. Lastly, the effect of improved FEL and FTL strategies is discussed for the RECCHP system.
The rest of this paper is organized as follows. Section 2 introduces the structure, mathematical model, evaluation criteria, and operational strategies of the considered RECCHP system. Section 3 elaborates the problem solver (i.e., the multi-objective evolutionary algorithm, PICEA-g). The case study and results are discussed in Section 4. Section 5 concludes this study and identifies some future research directions.
2. System Model of CCHP System with Renewable Energies in Isolated Mode
2.1. Traditional Energy System
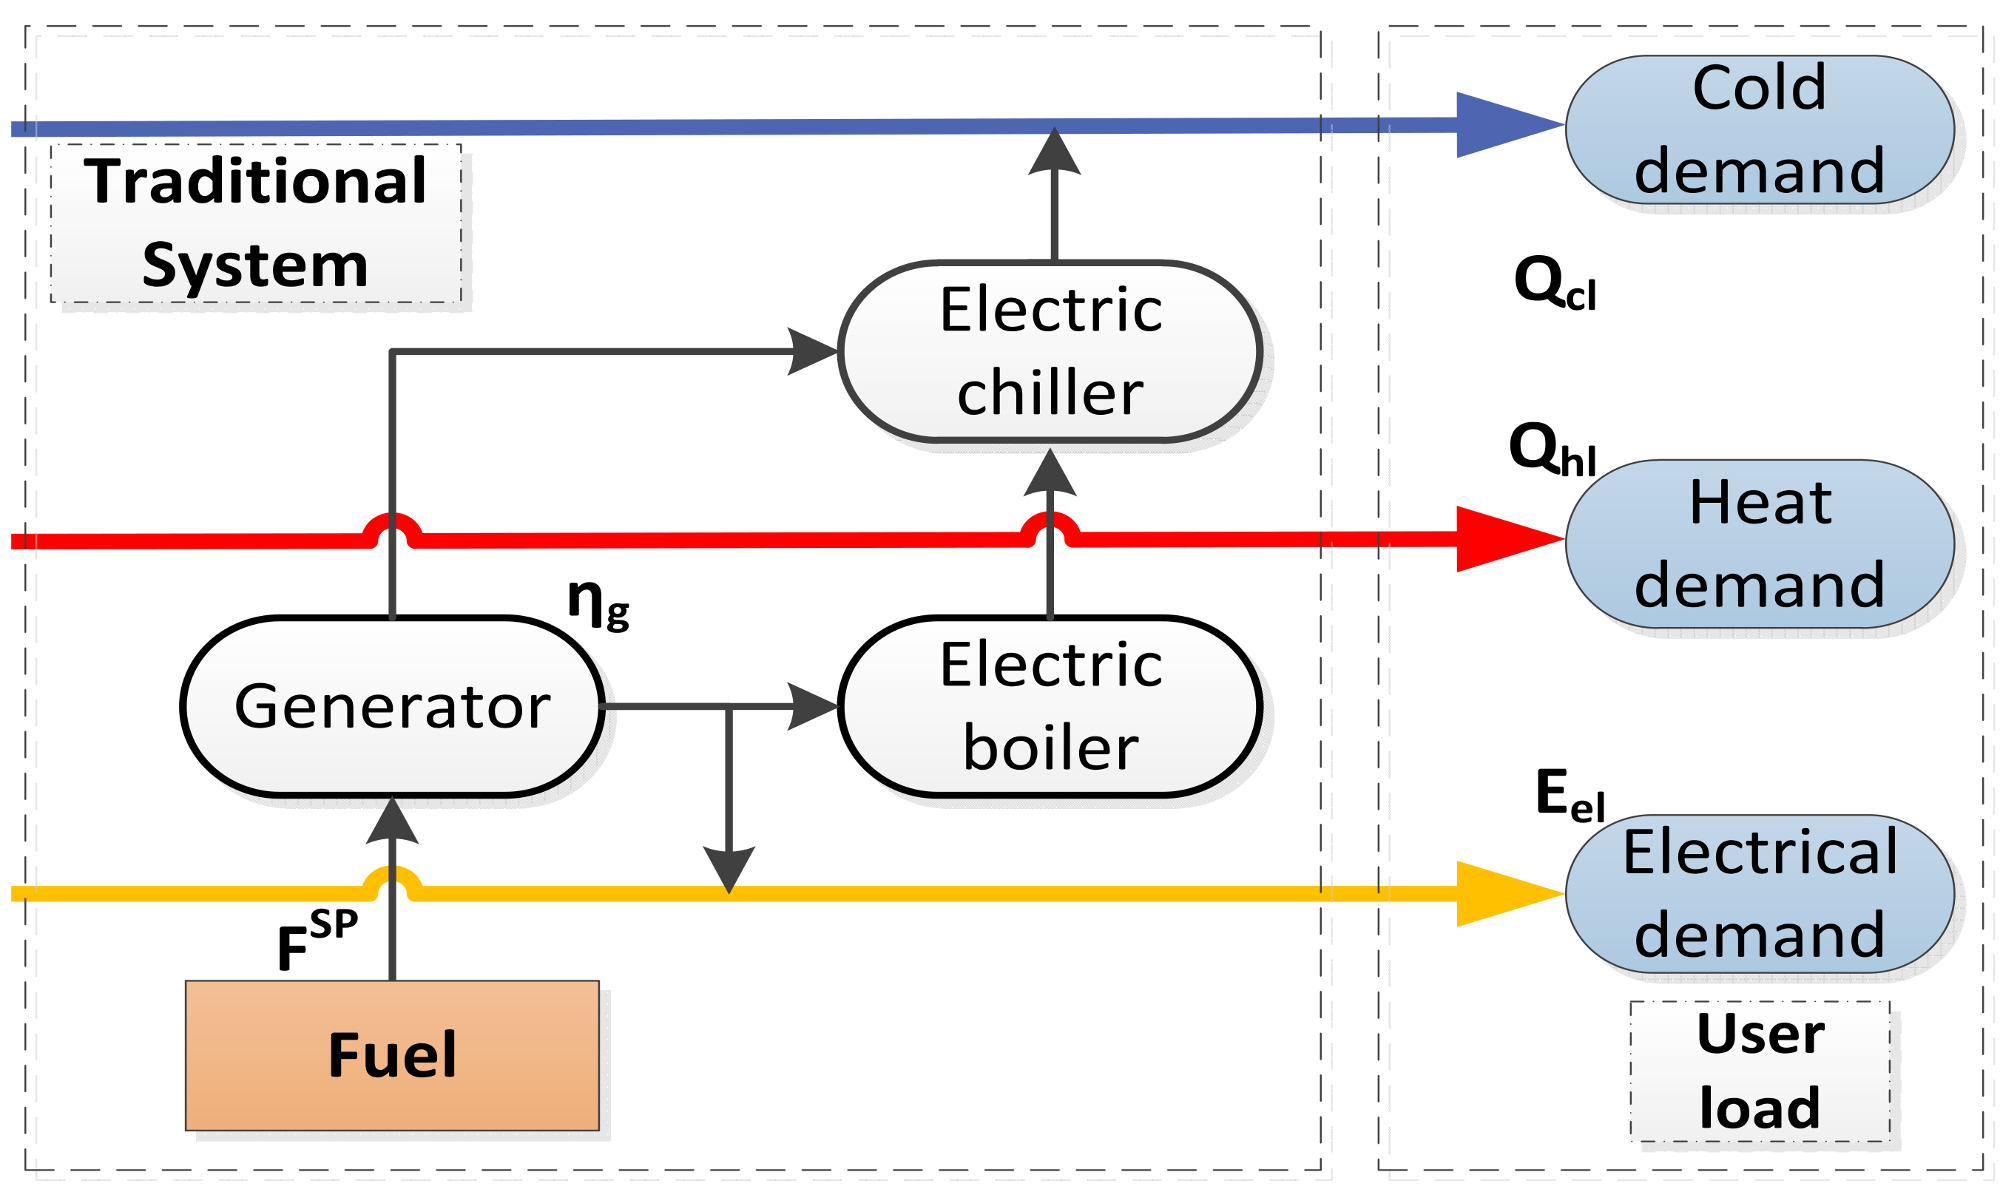
Traditional energy systems in isolated mode provide the electrical demand by the power generated by the generator directly and meet the heat and cold demand using electric boilers and electric chillers, respectively (see Figure 1). In other words, all electric, heat, and cold demands are from the electricity generated by a generator, which means the waste heat generated during generator operation will be wasted.
2.2. Structure of RECCHP System
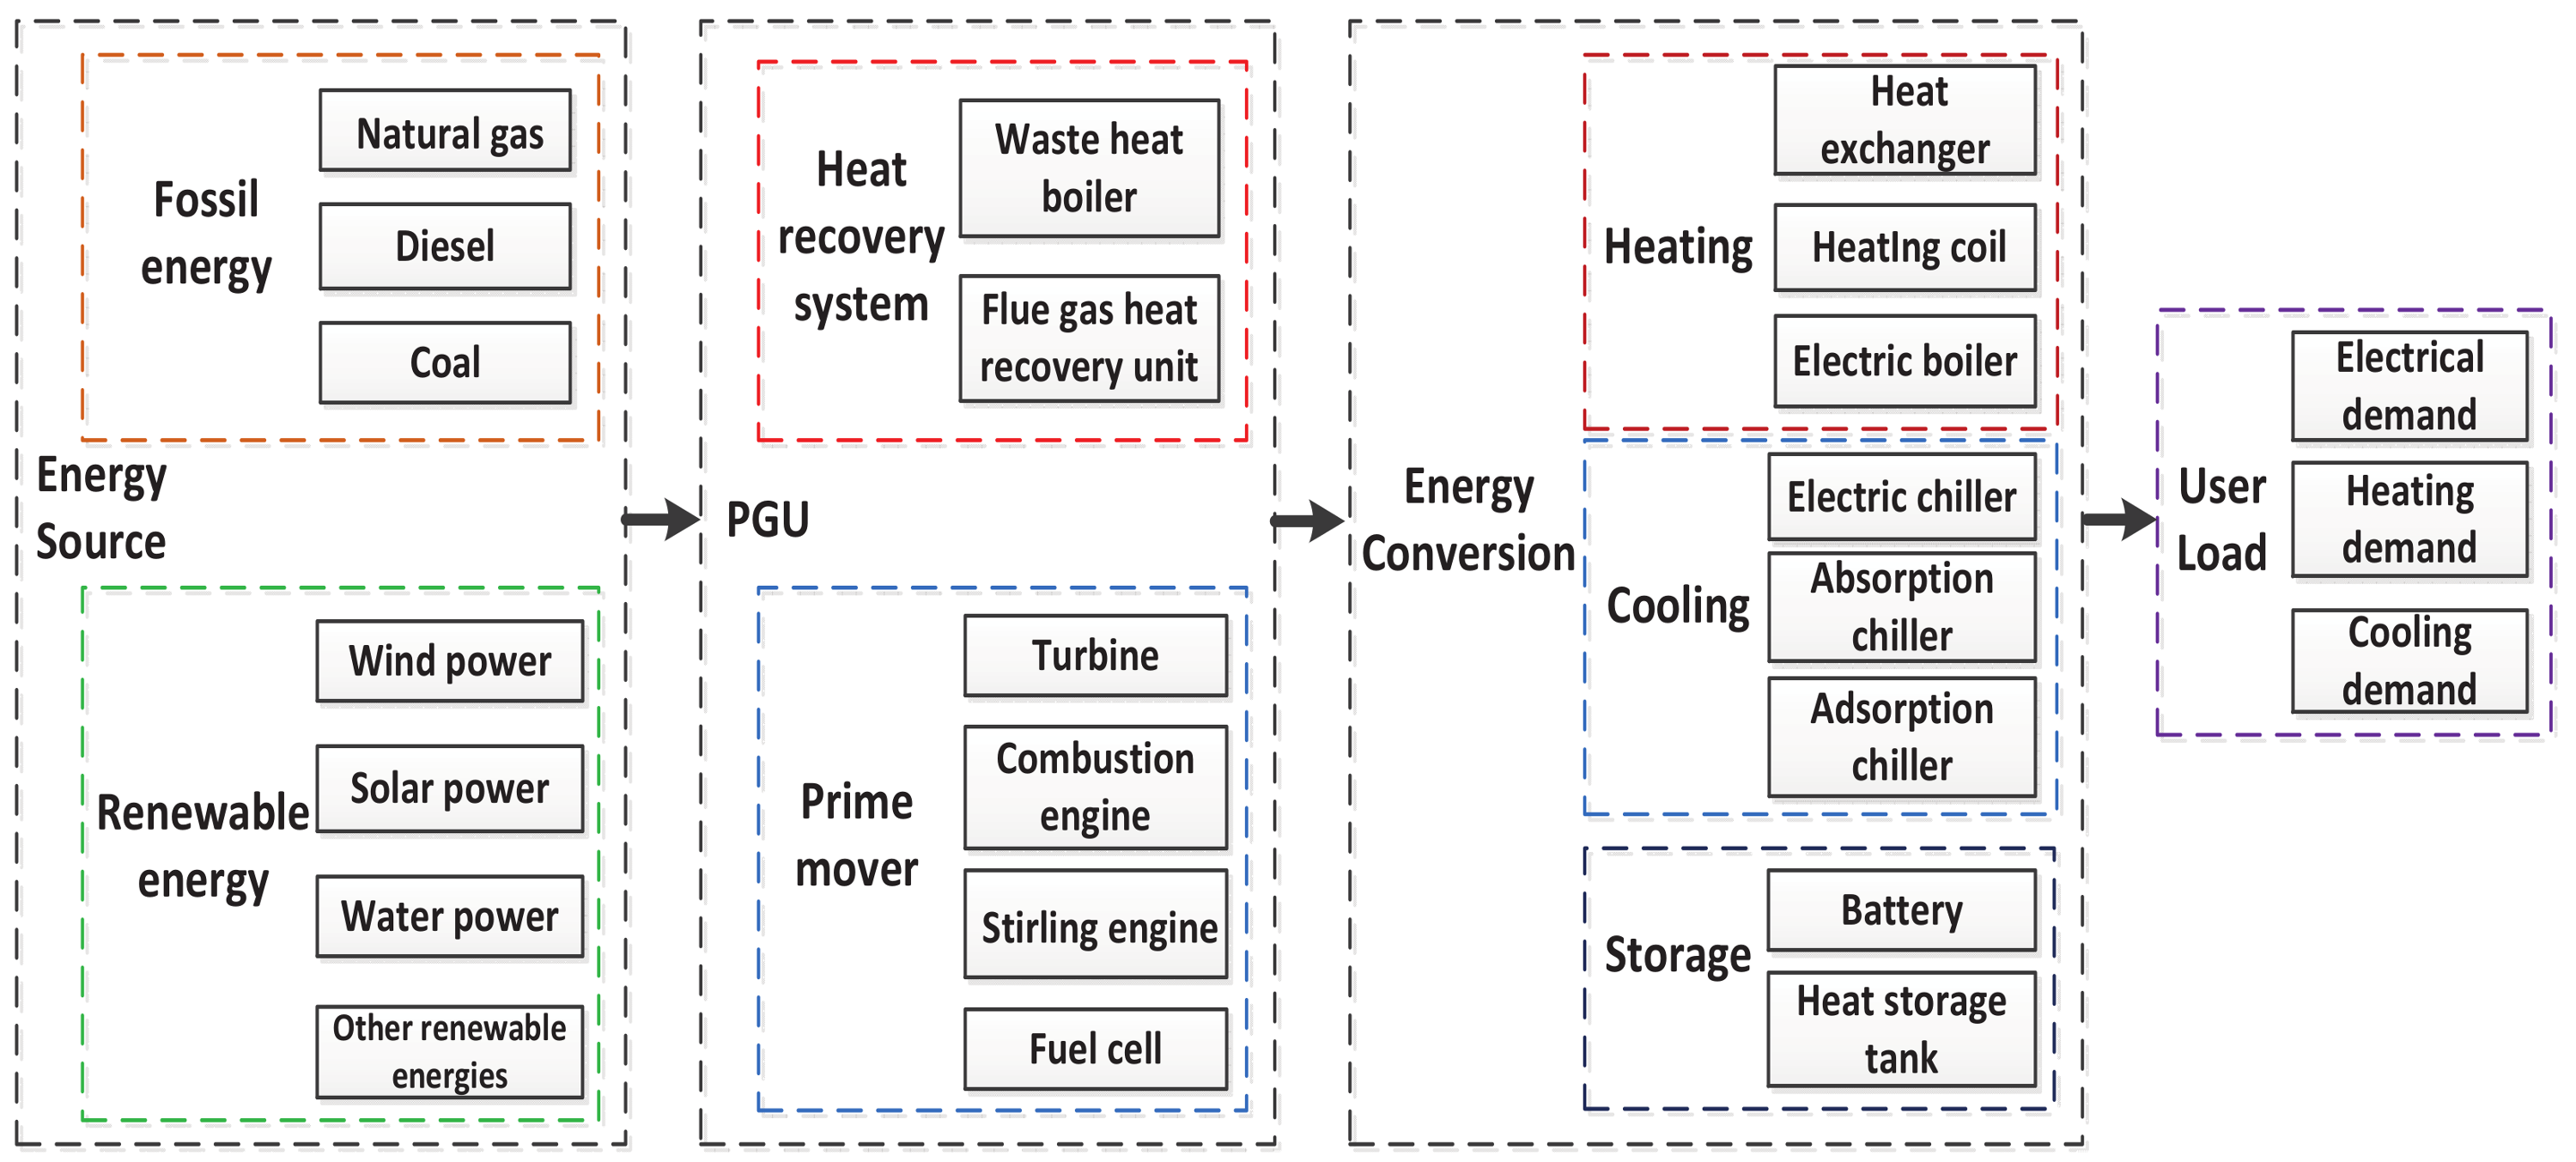
A typical CCHP system mainly contains four parts: energy sources, power generation units (PGUs), energy conversion devices, and user load demands, as shown in Figure 2.
Energy sources include fossil energies(e.g., natural gas, coal); and renewable energies (e.g., solar energy, wind energy). A PGU contains prime movers and heat recovery systems. The prime movers can be boilers, turbines, internal combustion engines, Stirling machines, fuel cells, and so on. Usually, the prime mover works with the heat recovery system, producing electricity and thermal energy. Conversion devices contain heat conversion devices (e.g., heat exchangers, electric boilers, and heating coils), cold conversion devices (e.g., electric chillers, absorption chillers, and adsorption chillers), and storage devices (e.g., batteries and heat storage tanks, HSTs) [25,47]. The electrical, cold, and heat energy are the main forms of user demand. The thermal demand is equal to the sum of cold and heat demand from user.
According to the composition of the CCHP system, Figure 3 illustrates the structure of the RECCHP system in isolated mode. The RECCHP system contains four parts: renewable energies devices, conversion devices, storage devices, and the user load. The renewable energies are converted into usable energy through photovoltaic (PV) panels and wind turbines (WTs). The function of the conversion device is to change the form of energy to meet the user demand. Additionally, given the stochastic feature of renewable energies, energy storage devices are required to improve the energy efficiency and system reliability. The introduction to the working procedure of the RECCHP is in Section 2.4.
2.3. Component Model
In order to formulate the performance of the RECCHP system, the mathematical models including the PV panel, the wind turbine, the battery, HST, and PGU are constructed as follows.
2.3.1. PV Panel
PV panels convert solar irradiation into electricity. The output electricity of a PV panel can be calculated as Equation (6) [48]. From the horizontal component of the solar radiation (S), the incident radiation on the inclined surface () can be calculated as follows [49]:
As shown in Figure 4, represents solar radiation perpendicular to the inclined PV panel, which is used to calculate the maximum output power of PV panels. The relationship equations are shown as follows [50,51]:
where and respectively represent the fill factor and the total number of PV panels. and respectively denote the short-circuit current and open-circuit voltage. and are short-circuit current and open-circuit voltage under standard test condition (STC). and represent short-circuit current temperature coefficient and open-circuit voltage temperature coefficient. NCOT is nominal cell operating temperature.
2.3.2. Wind Turbine
Wind power generation is closely related to the wind velocity, and can be calculated as Equation (7) [52]. When the wind speed exceeds , wind turbines stop working to protect themselves.
with:
where and are the cut-in and the cut-off wind velocity, respectively; is the wind velocity measured at the reference height . is the coefficient of wind power generation. The air density is marked as . represents the cross-section of the rotor and is the rated power of the wind turbine. is the height of the wind tower. The power law coefficient is denoted as .
2.3.3. Renewable Energy Generation
As can be seen from Figure 3, the renewable energy generation () comes from the solar energy () and the wind power generation (). Therefore, it can be calculated by Equation (9) and Equation (10):
where is renewable energy generation meeting the electrical demand. and are the heat and cold energy generated by electric boiler and electric chiller. and represent the efficiency of the electric boiler and electric chiller, respectively. is excess renewable energy generation stored in the battery.
2.3.4. Battery
The activity procedure of the battery is described as Equation (11) [50]:
S.T.
where and are the charging/discharging power of the battery, retained within and , respectively. Round-trip efficiency is denoted as and . State of charge denoted as is an important specification of the battery, retained within [, ]. is the time step.
2.3.5. Heat Storage Tank
Constraints in the process are explained as follows:
where and denote the input and output thermal energy of HST interacted with outside, retained within and , respectively; and are their efficiency. represents the content of HST.
2.3.6. Power Generation Unit
The electricity () and the thermal energy () generated by the PGU are calculated as follows:
where F is the fuel supplied to the PGU, and it produces electricity () and waste heat as a byproduct. The waste heat can be reused as thermal energy () by a heat recovery system, whose efficiency is . As shown in Figure 3, and are the recovery heat supplied to the absorption chiller and the heating coil; and respectively represent the cooling and heating from the absorption chiller and the heating coil. The efficiency of the absorption chiller and heating coil are marked as and , respectively.
2.4. Operation Strategy
Typically, the energy supply procedure in the RECCHP system is as follows. First, the power generated by renewable energies is used to meet the load demand (to maximize the usage of renewable energies). If the load demand is not satisfied, storage devices start working to supply energy. If the load demand still cannot be satisfied, the PGU starts to work. When the energy of the storage device is used up and the PGU works at rated power, the load demand is still unmet, then some load demands will be cut off and a loss of energy supply is recorded. With respect to the FEL and FTL operation strategies, the detailed RECCHP operational process is described in the following sections.
2.4.1. FEL Operation Strategy
In the FEL operation strategy, the electrical demand should be satisfied with a higher priority than the thermal demand. In this case, no extra electricity will be generated from the RECCHP system, since the amount of electricity from RECCHP follows the electrical demand. Besides, the thermal energy generated from the RECCHP system meets the thermal demand for the heating and cooling process. Note that the extra thermal energy might be generated by the PGU, which would be stored in the HST. Moreover, through the electric boiler and electric chiller, the electricity from the battery can be easily converted to the thermal energy used to meet the thermal demand. The FEL operational strategy is shown in Figure 5.
Case 1. If is , the electrical load demand is fully met by the renewable energy generation. The discriminant condition is expressed as Equation (22):
Then, the RECCHP system runs as follows:
1. If is , excess renewable energy is stored in the battery until it is fully charged. The discriminant condition is expressed as Equation (23):
with:
where is the amount of renewable energy generation meeting load demands.
2. If is and is , HST starts working to supply the thermal energy. The discriminant condition is expressed as Equation (25). The remaining cold and heat demand are denoted as and .
3. If is and is , PGU starts working to meet the gap of the thermal demand. Meanwhile, the unused electricity is stored into batteries. The discriminant condition is shown as Equation (26):
4. If is , a loss of the thermal energy is recorded, that is, the count of the thermal energy loss () plus one, as defined in Equation (27). In this state, HST is exhausted and PGU works at the rated power. The unused electricity is used to charge batteries.
Case 2. If is and is , the system runs as follows. The discriminant condition is expressed as Equation (28):
1. If is , HST starts to supply the thermal energy. The discriminant condition is expressed as Equation (29).
2. If is and is , PGU starts to work. Meanwhile, the unused electricity is stored in batteries. The discriminant condition is expressed as Equation (30):
3. If is , a loss of the thermal energy is recorded and increases one, as defined in Equation (27). In this state, HST is used up and PGU works at the rated power. Meanwhile, the unused electrical energy is stored into batteries.
Case 3. If is and is , the next steps are the same as 1, 2, and 3 in Case2. The discriminant condition is expressed as Equation (31):
Case 4. If is , a loss of the electrical energy is recorded; that is, the count of electrical energy loss () plus one, defined as Equation (32). In this state, batteries are exhausted and PGU works at the rated power. In addition, the remaining thermal energy is stored into HST.
2.4.2. FTL Operation Strategy
In the FTL operation strategy, the thermal demand is satisfied with a higher priority than the electrical demand. In this case, no extra thermal energy will be generated, since the amount of thermal energy from RECCHP follows the thermal demand. Additionally, excess electricity would be stored in batteries if the electrical demand is less than the electricity from RECCHP system. The FTL operational strategy is shown in Figure 6.
The operational details of the FTL strategy are analogous to the FEL strategy, and thus are not repeated here. However, the related discriminant condition and flowchart are described in Algorithm 1.
| Algorithm 1: Flowchart of FTL |
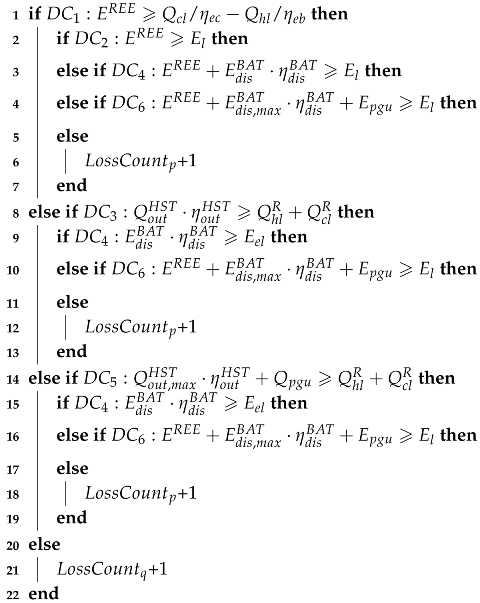 |
3. RECCHP System Optimization Model Using PICEA-g
3.1. Overview of PICEA-g
The optimization problems of the above RECCHP model are seen as multi-objective problems (MOPs), which is implemented in MATLAB (2015(b), MathWorks, Natick, MA, USA) and three objective functions (i.e., annual total cost (ATC), carbon dioxide emission (CDE), and loss of energy supply probability (LESP)) are optimized simultaneously using a multi-objective evolutionary algorithm. MOPs often appear in real-world design scenarios, requiring simultaneous optimization of two or more goals. As these objectives are generally conflicting with each other, the optimal solution of MOPs is not a single one, but rather a set of Pareto optimal solutions [53,54,55]. Due to the population-based approach, the multi-objective evolutionary algorithms are well-suited to solve the MOPs, since they can naturally lead to an approximately trade-off surface (or Pareto front) in operation.
The multi-objective evolutionary algorithms aim to find solutions satisfying all the conflicting objectives (f) simultaneously. Without loss of generality, a general multi-objective evolutionary minimization problem is stated as follows:
S.T.
where is the decision space. A solution is a vector of n decision variables: . m is the number of objectives; and are the inequality and equality constraints, and p and q are the number of them, respectively. F: include m real-valued objective functions and represents the objective space.
In this study, the state-of-the-art MOEA, PICEA-g, is applied as the problem solver. It is generally agreed that a set of preferences could orientate the search toward a subset of Pareto front interested by the decision maker; that is, different preferences sets may result in different Pareto fronts. The PICEA-g is a co-evolutionary algorithm in which the candidate solutions are co-evolved with a set of goal vectors. The formulations for calculating the fitness of the candidate solution s and the fitness of the preference g is given as follows [46]:
where represents the number of solutions satisfying the preference g. N is the population size of candidate solutions. G denotes the initial goal vectors set and is the goal vectors set after genetic variation. when s does not satisfy any g, the fitness is defined as 0.
The candidate solutions try to satisfy (Pareto dominate) as many goal vectors as possible, being guided towards the Pareto optimal front. The goal vectors try to avoid being satisfied by candidate solutions. Thus, the main idea of PICEA-g is that if multiple sets of hypothetical preferences are specified during the co-evolution process simultaneously, a meaningful subset of the Pareto front for a decision maker can be achieved. PICEA-g has been demonstrated as effective both on benchmarks and some real-world applications [50,56,57]. For more information about PICEA-g, please refer to the literature [46,58,59]. The source code of PICEA-g is available online at: http://ruiwangnudt.gotoip3.com/optimization.html.
3.2. Optimization Objectives
Three objectives from the aspects of economy, environment, and reliability are considered in the optimization of the RECCHP system. The three objectives are annual total cost, carbon dioxide emission, and loss of energy supply probability.
3.2.1. Annual Total Cost
Annual total cost (ATC) contains three parts; i.e., the initial investment cost , the operating and maintenance cost , and the fuel cost . They are calculated as follows:
- The annual operating and maintenance cost can be written as:
- The annual fuel cost is described as:
- The initial investment cost can be written as:with:
denotes the capital recovery factor, written as follows:
with:
where , , and respectively represent the capital of the renewable energy device, PGU, and the storage device. and denote the capital of the battery and HST; , , , , and are the capital of the wind turbine, the wind tower, the absorption chiller [60], the heating coil, and PGU. represents the maximum capacity of the PGU. The operation and maintenance cost of the PV panel, the wind turbine, the wind tower, PGU, the absorption chiller, and the heating coil are respectively marked as , , , , , and . is the height of the wind tower. , and represent the running time of the PV panel, the wind turbine, and the PGU. is the annual real interest rate. The annual inflation rate and nominal interest rate, denoted as and , are 1.5% and 3.75%, respectively. L, , and are the lifetime of the system, the battery, and HST. is the fuel price.
3.2.2. Carbon Dioxide Emission
The carbon dioxide emission (CDE) is used to measure the environmental sustainability of the system, which can be calculated using the emission conversion factor .
where denotes the hourly fuel consumption.
3.2.3. Loss of Energy Supply Probability
Loss of energy supply probability (LESP) is defined as the probability of failing to satisfy the electrical demand and the thermal demand. It is calculated by Equation (50):
where and are the available electrical and thermal energy generated from the RECCHP system. and represent the count of electrical and thermal energy loss over a year, respectively.
3.3. System Simulation and Optimization Model
The decision variables representing the configuration of the RECCHP system include the number of photovoltaic (PV) panels and wind turbines (WTs), the tilt angle of PV panels, the height of WTs, the maximum fuel consumption, and the capacity of battery and heat storage tank (HST). Decision variables related to renewable energies include the number of PV panels () and wind turbines (), the inclination angle of the tilted PV panel (), and the height of the wind tower (), which are obtained from the PV and wind tower model. The maximum capacity of PGU () impacts the selection of other devices and the capital cost [61], and thus is also considered as a decision variable obtained from the PGU model. In addition, the maximum capacity of the battery () and HST () are two other decision variables obtained from battery and HST model. In summary, decision variables are written as follows:
The simulation flowchart in the optimization process is described in Figure 7. represents the total renewable energy generation produced by PV panels and wind turbines at hour H of day D. Through this simulation, individuals can obtain the corresponding values of ATC, CDE, and LESP.
In order to minimize the three objectives (i.e., ATC, LESP, CDE) simultaneously, a three-objective optimization model is constructed as follows:
The parameter range is determined with the daily experience to improve solving speed.
S.T.
where is a vector consisting of decision variables; is the decision space; and the objective set is defined as .
4. Case Study and Result Analysis
4.1. Case Study
4.1.1. Input Data
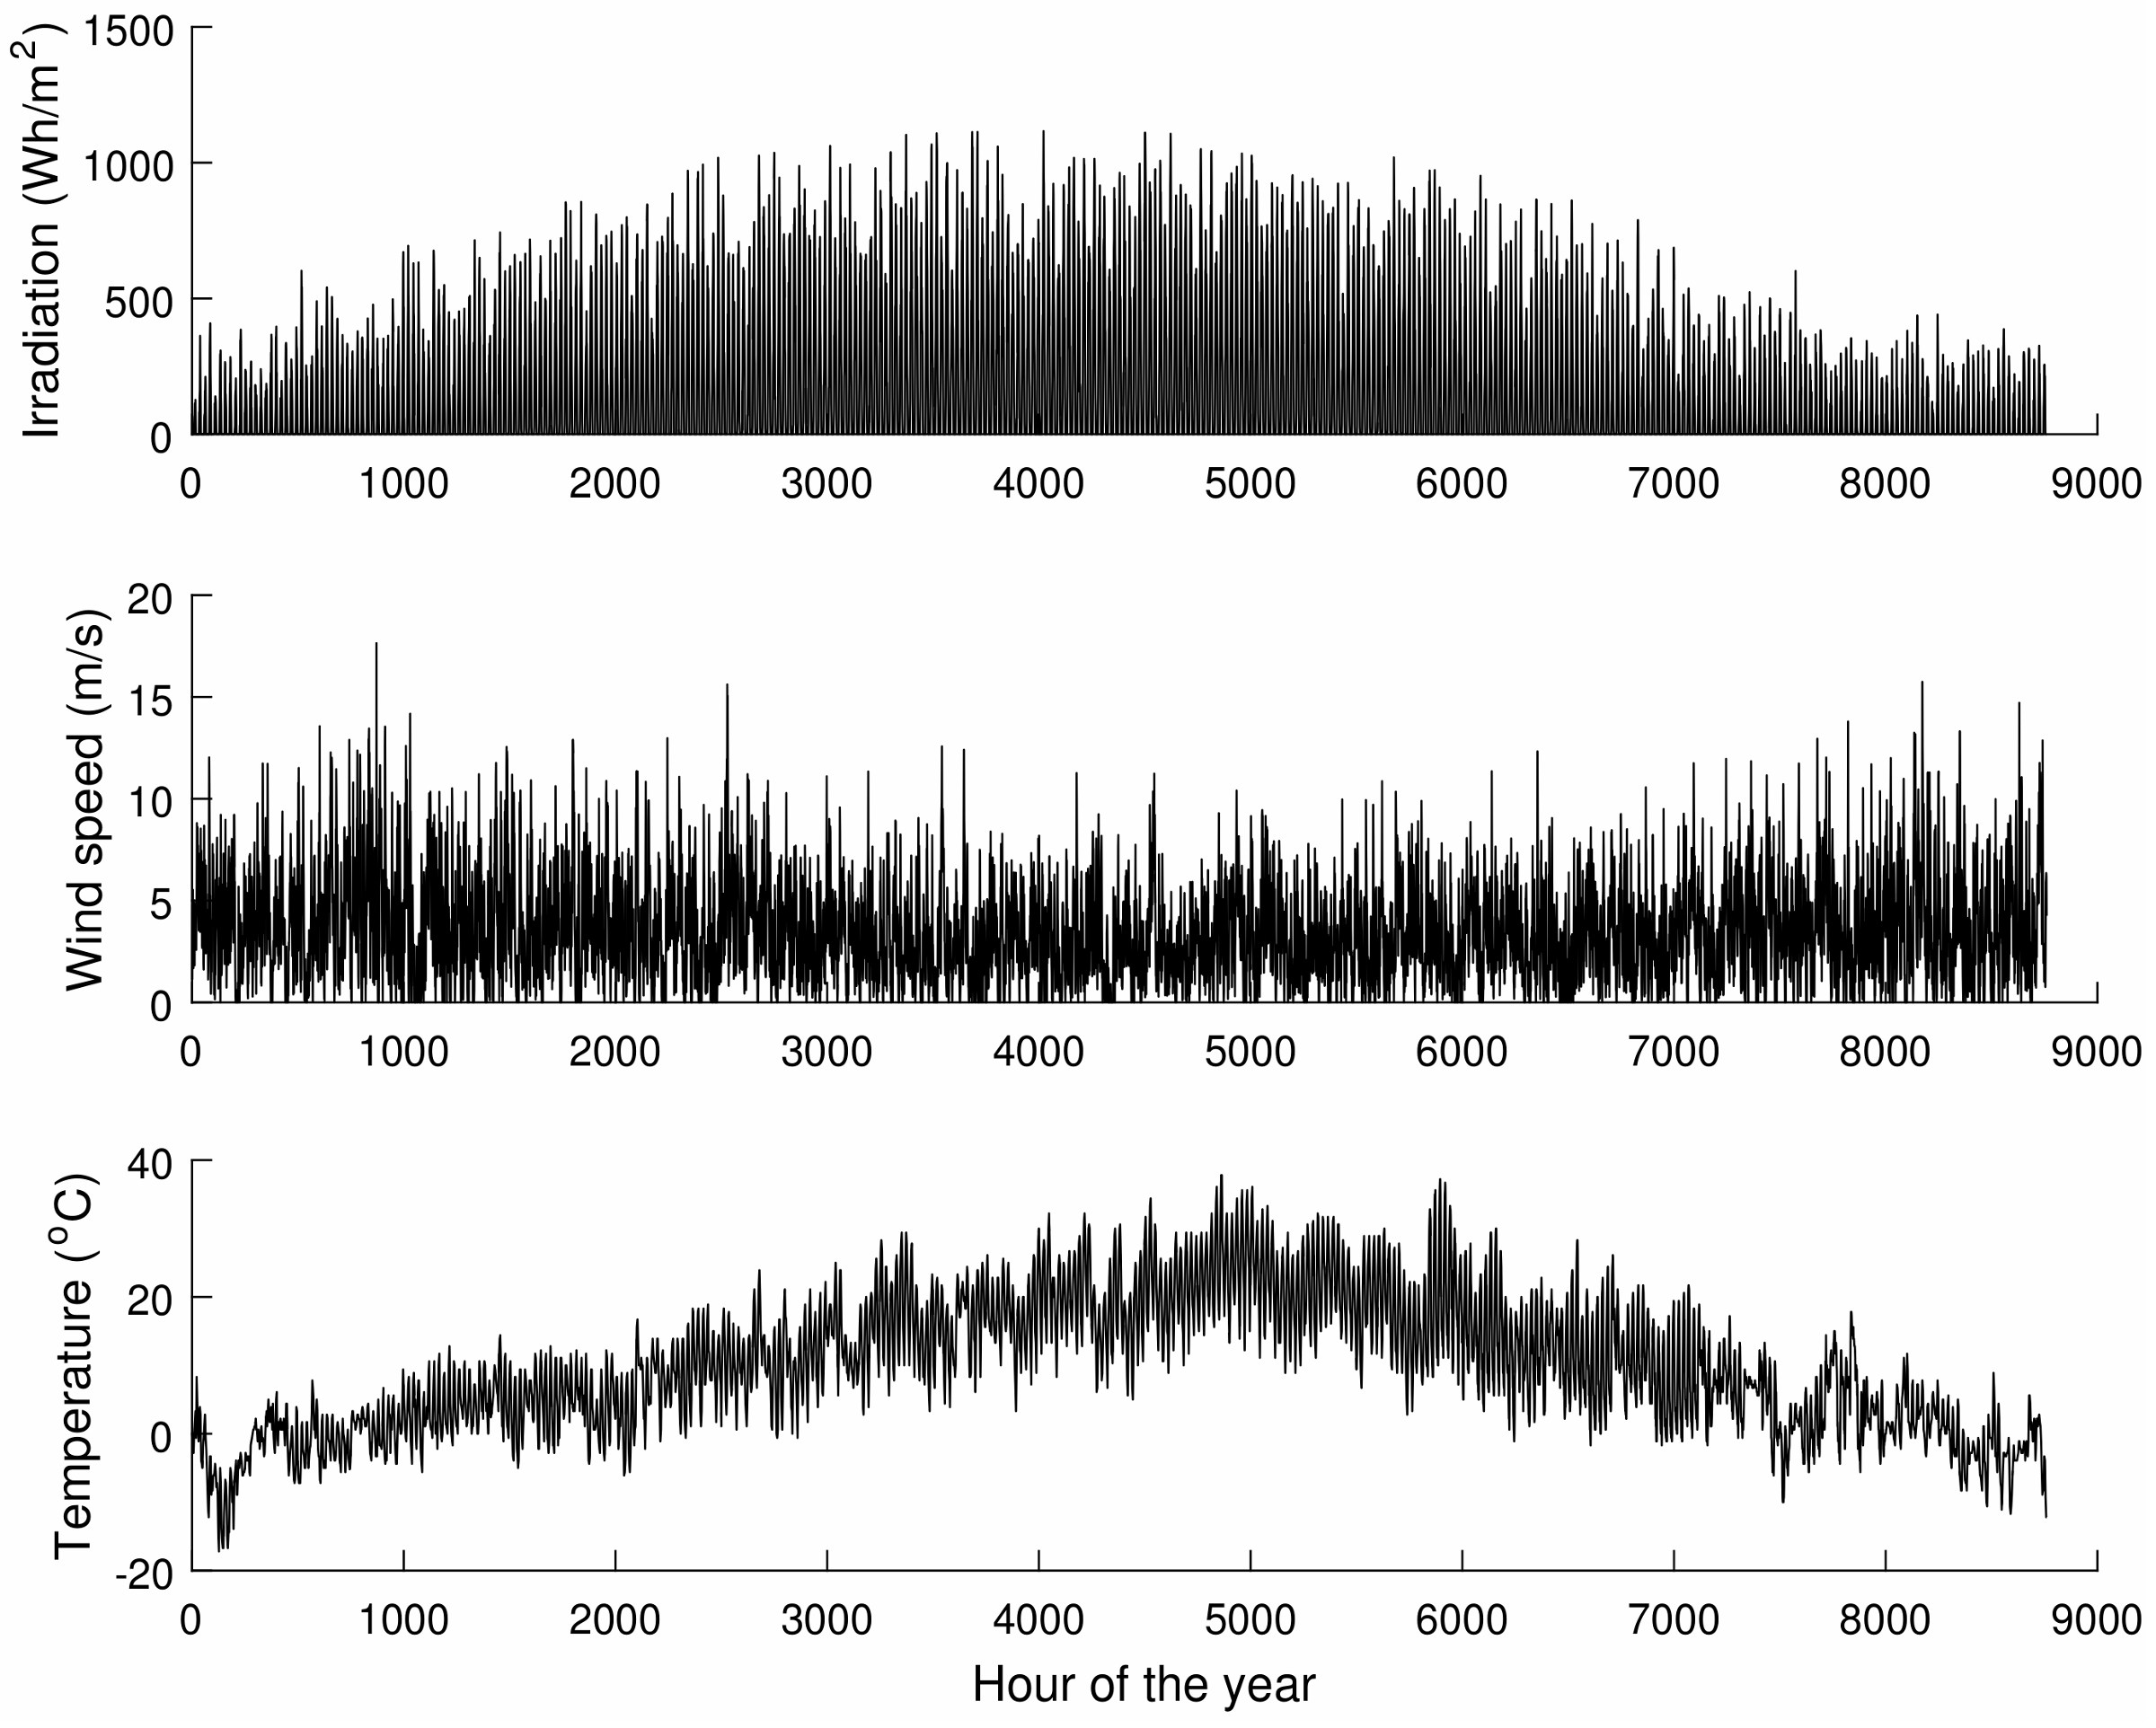
This section presents a case study to verify the proposed model and algorithm. A place (latitude 41.65°) in Spain is considered. Meteorological data are averaged over ten years that include the solar radiation intensity, the wind velocity at 10 m altitude, and the environmental temperature, as shown in Figure 8.
The hourly electrical, heat, and cold demand in representative days of spring, autumn, summer, and winter are taken from the study [62]. The distributions of electrical, heat, and cold load demands during a day are shown in Figure 9.
From Figure 9, the electrical demand is basically stable, while cold and heat demands vary greatly throughout a year. Specifically, the heat demand is large in winter while it is small in summer. The cold demand is the opposite.
4.1.2. Parameters
All parameters related to the RECCHP system are summarized in Table 1, Table 2 and Table 3 [28,50]. Additionally, the service life of the RECCHP system is assumed as 15 years in this study, and those of the battery and HST are 5 years.
The technical characteristics of RECCHP system components as the inputs to the simulation and optimization process are given in Table 1, Table 2 and Table 3. The specifications, lifetime, and efficiency of all components are presented in Table 1. Table 2 shows the characteristics of wind turbine modules. Additionally, the wind turbine height is limited between 5 m and 30 m, and the rated power of wind turbine is 10 kW. The investment cost of a wind turbine tower depends on its length. Besides, Table 3 shows the characteristics of PV modules that encompass the short-circuit current, the open-circuit voltage, the maximum operating voltage, and current. Both short-circuit current temperature coefficient and open-circuit voltage temperature coefficient equal 0.95. The operation and maintenance cost of battery, heat storage tank (HST), PGU, and heat recovery system are related to the operation time. The fuel is liquefied natural gas (LNG) whose price is 6.5 CNY/kg. In addition, the parameters settings of PICEA-g are shown in Table 4.
4.2. Results and Discussion
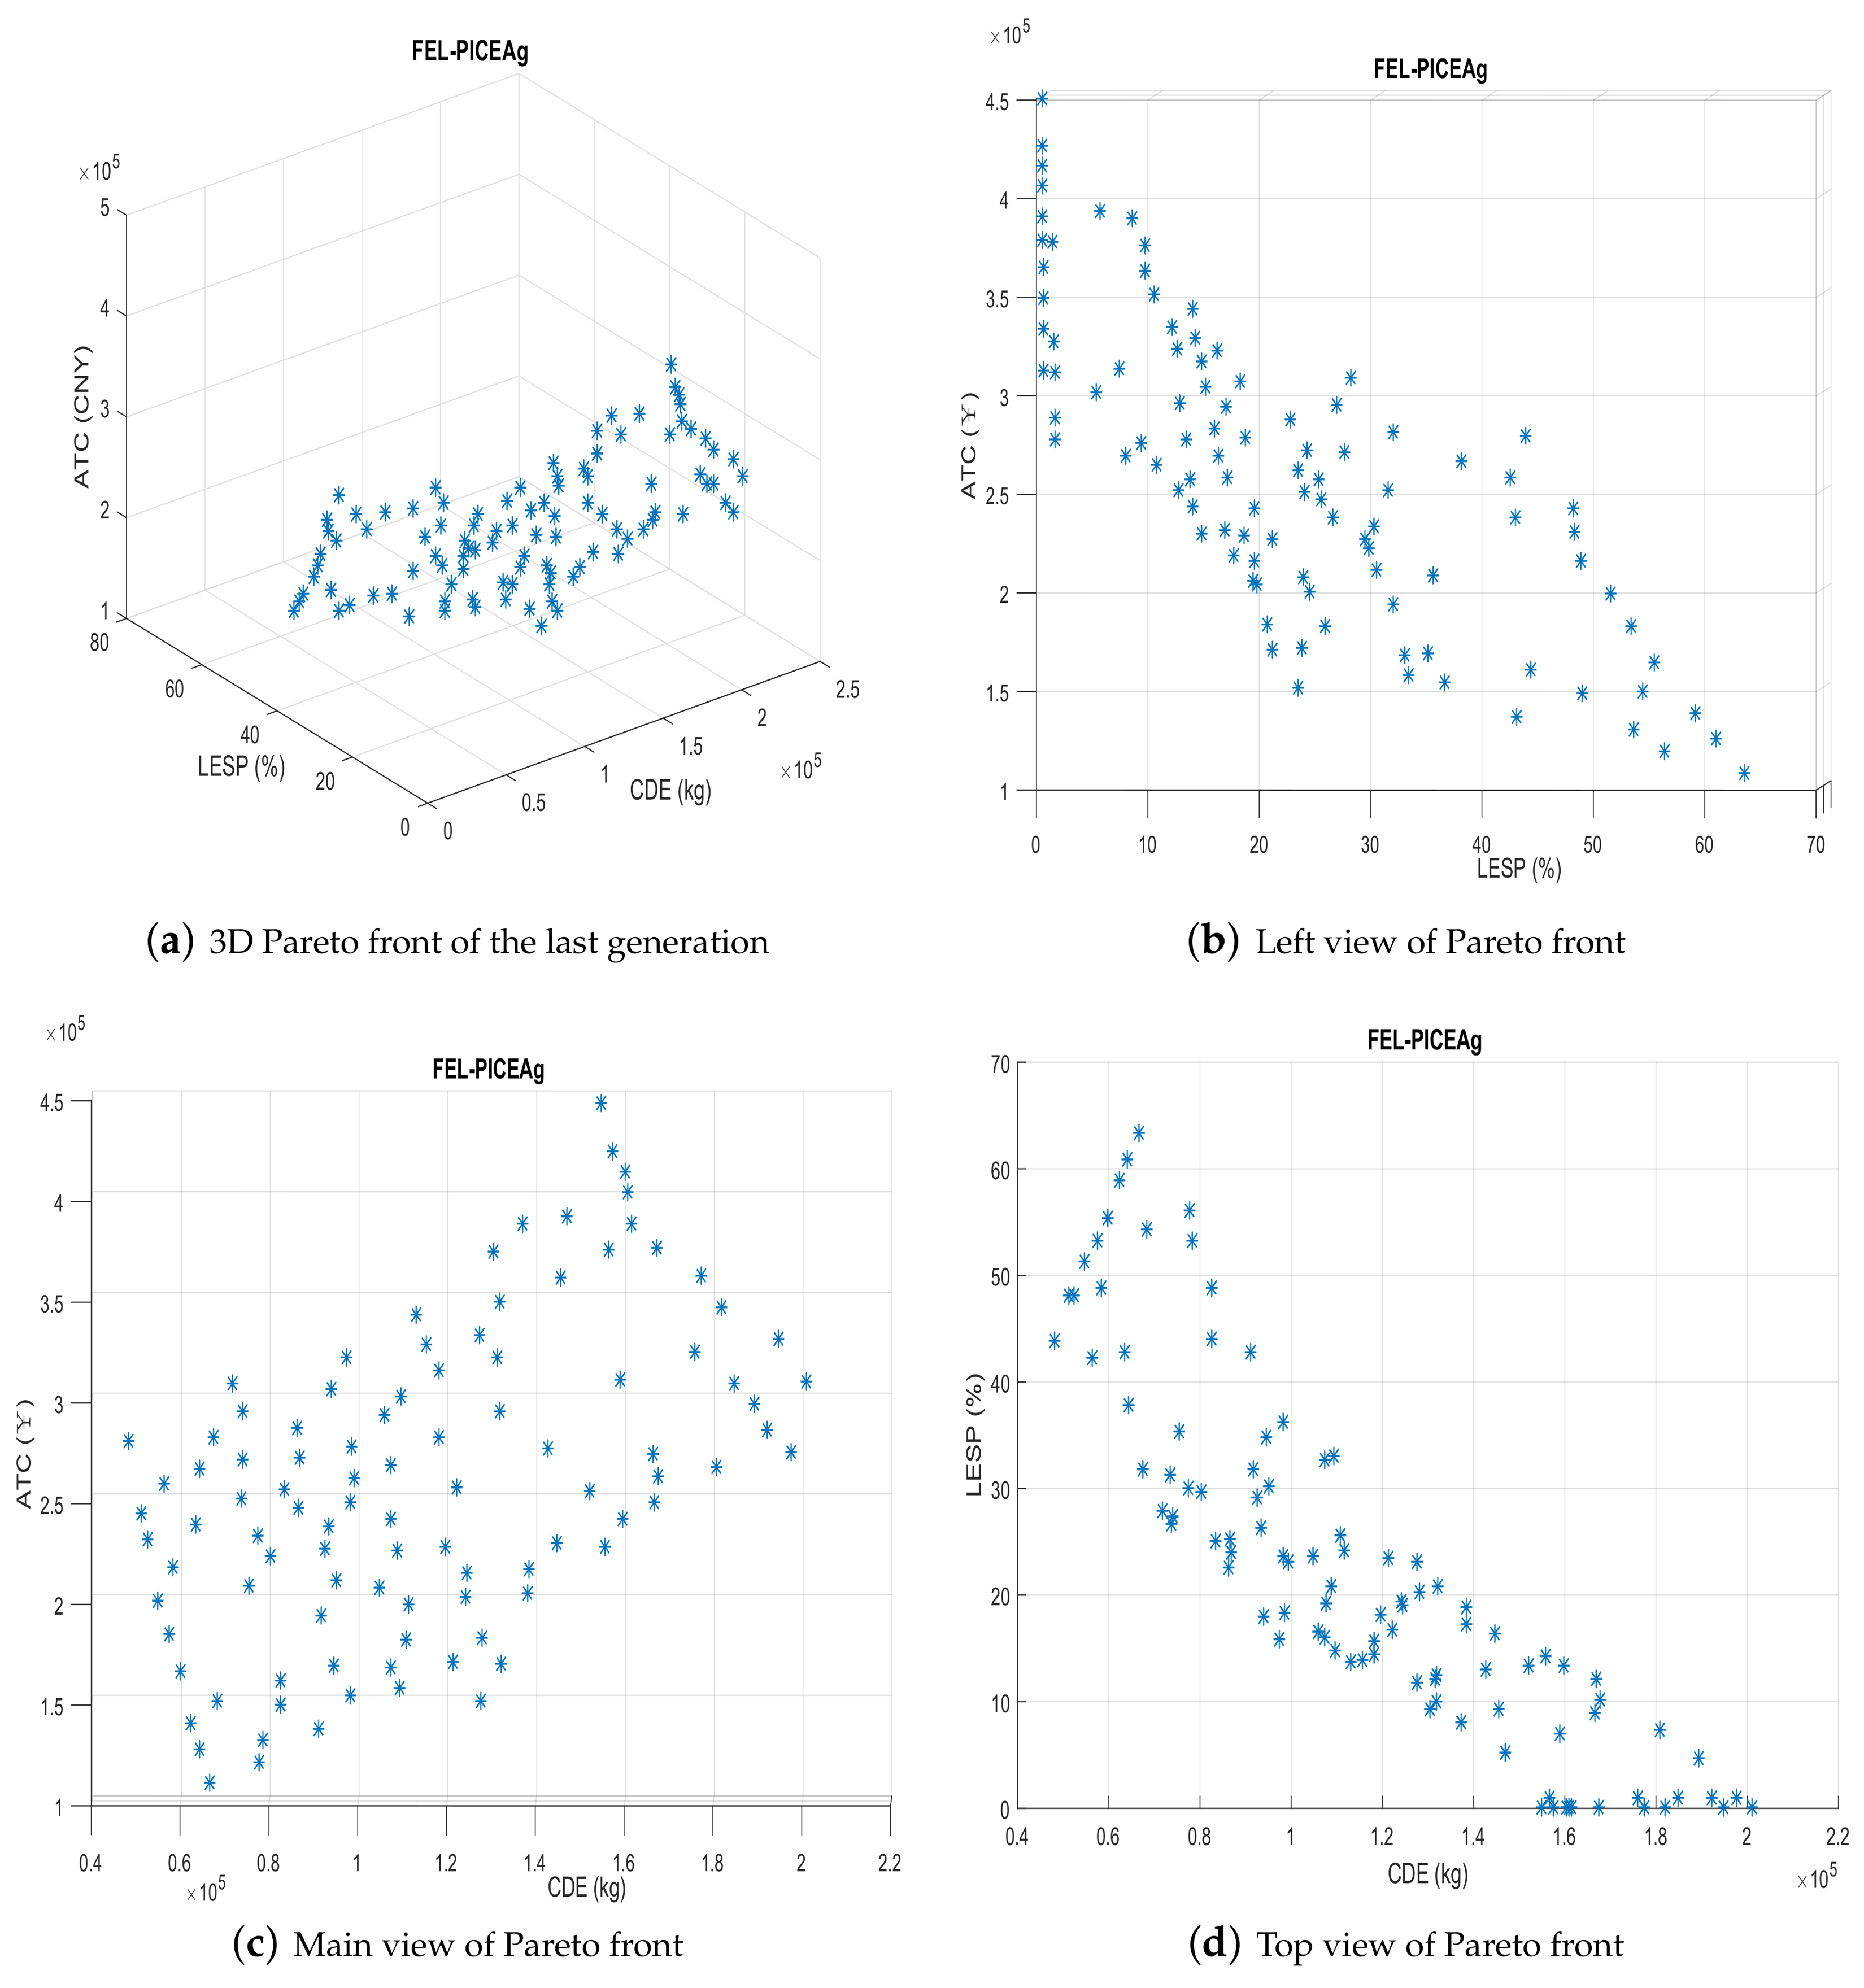
The planning time span in this article is one year (8760 h). For each system configuration, we simulated the operation of the various components of the RECCHP system every hour of the year until 8760 h. Then, the indicators of system configuration were obtained (i.e., ATC, CDE, and LESP), determining the system configuration as good or not. Through constant iteration, the system configuration was optimized toward the optimal direction of the indicator. By solving the model with PICEA-g, a set of Pareto optimal solutions was obtained as shown in Figure 10 and Figure 11.
In both Figure 10 and Figure 11, sub-figures (b), (c), and (d) are the left view, main view, and top view of sub-figure (a). As can be seen from sub-figure (b), the results from the optimization problem highlight a clear trade-off between indicator ATC and LESP. Reducing the value of LESP will often increase the value of ATC; that is, a high-energy reliable system is more expensive than a low-demand one. From sub-figure (d), indicators LESP and CDE are also contradictory. Reducing the value of LESP will often increase CDE. In other words, a higher energy reliable system will emit more CO2. If the desirable level for LESP and CDE are defined, we can find a lower cost for a better solution with the PICEA-g approach.
Among the obtained Pareto optimal solutions, the decision-maker can further introduce their preference so as to select the preferred one for implementation. For example, three solutions from the Pareto set are selected according to the desired LESP less than 0.1%, and the satisfactory configurations of the RECCHP system are shown in Table 5.
- A reliable RECCHP system should have a low LESP value, which is preferably 0. Three solutions with LESP less than 0.1% for the FEL and FTL strategies are shown in Table 5.
- Furthermore, if the decision-maker is more concerned about the system cost, the solution with the smallest ATC should be chosen. Likewise, solutions with the minimum CDE are more likely to be selected if the fuel usage and CO2 emission are considered as more important for the decision-maker.
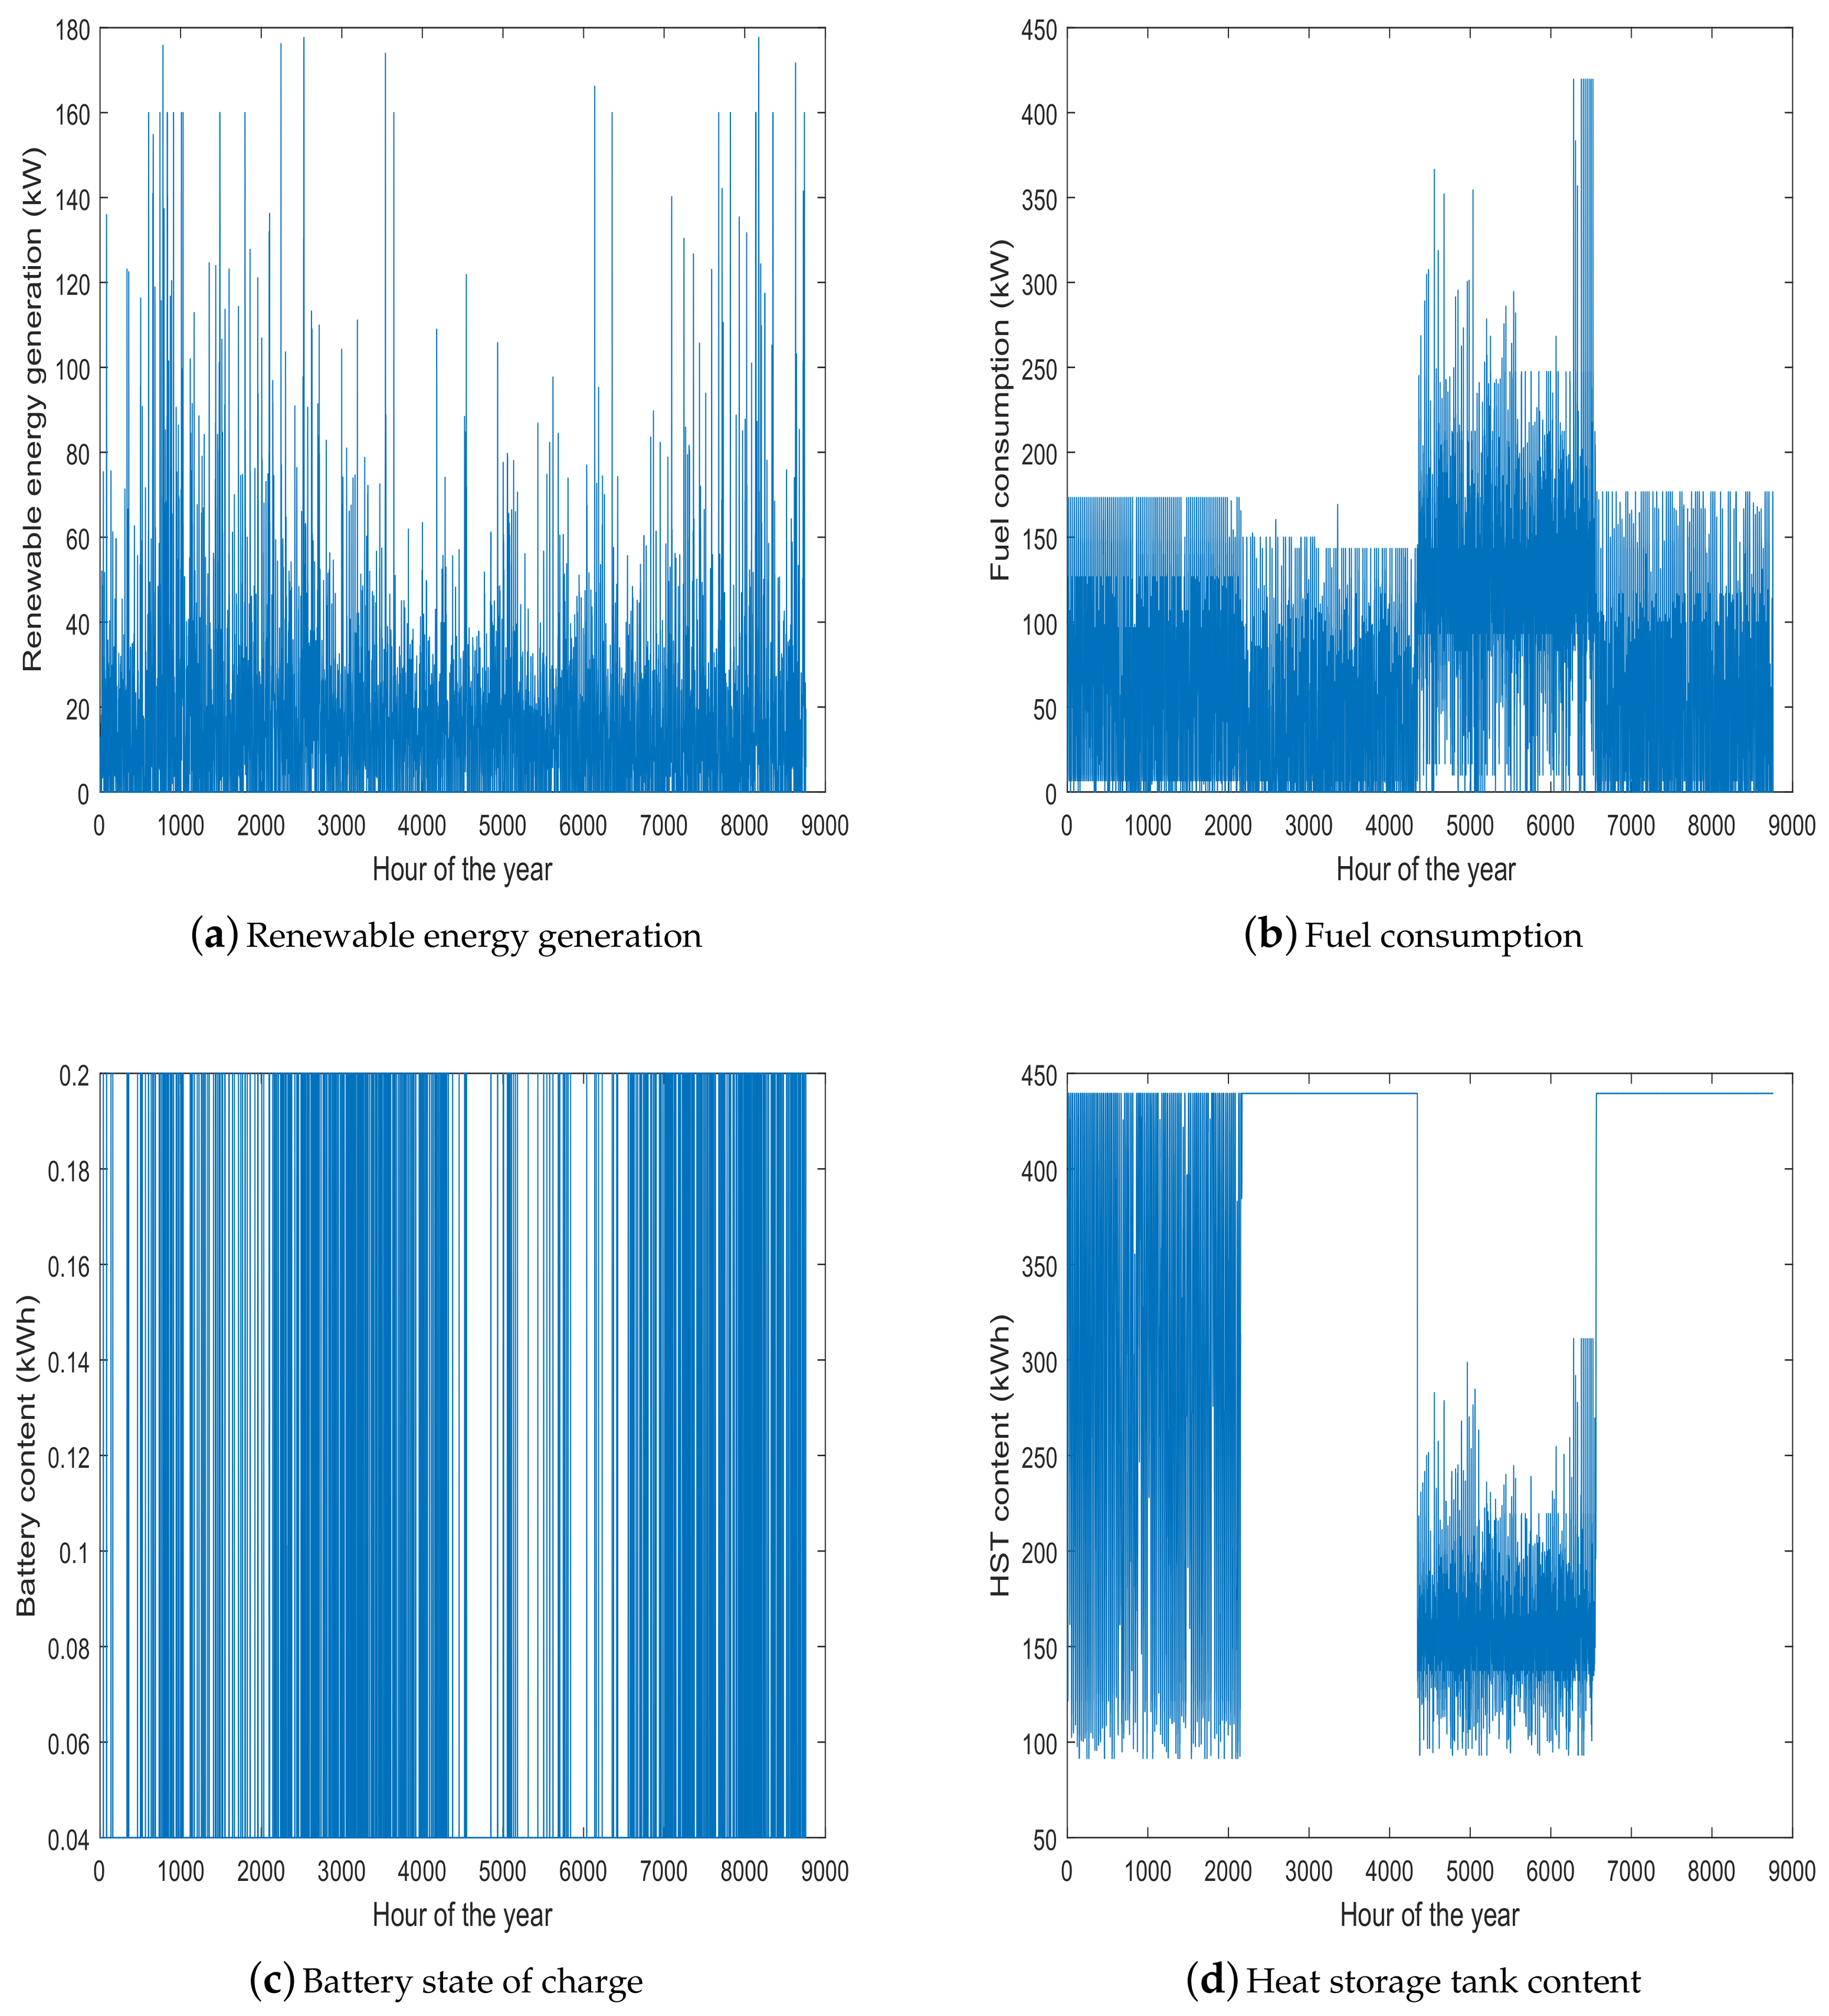
Table 5 presents the final optimal configurations of the RECCHP under the FEL and FTL strategies. It is found that the optimal system configurations for the two operation strategies are greatly different—for example, solution 1 in both FEL and FTL (marked as bold inTable 5). For FEL, 10 solar panels, 59 degree tilt angle for PV panels, 19 wind turbines, 29 m height for wind tower, 650 kW·h for the capacity of PGU, 145 kW·h for the capacity of battery, 2 kW·h for the capacity of heat storage tank, causing 1.55 () CNY for annual total cost, 0% for LESP, and 4.49 () kg, are the best components of RECCHP system in terms of decreasing cost. For FTL, 20 solar panels, 59 degree tilt angle for PV panels, 16 wind turbines, 25 m height for wind tower, 489.7 kW·h for the capacity of PGU, 0.2 kW·h for the capacity of battery, 439.5 kW·h for the capacity of the heat storage tank, causing 1.35 () CNY for annual total cost, 0% for LESP, and 3.83 () kg, are the best components of the RECCHP system in terms of decreasing cost. To further illustrate the difference, configurations with the smallest ATC are used to simulate a one-year energy supply process of the RECCHP system. The results are shown in Figure 12 and Figure 13.
It can be clearly seen from Figure 12 and Figure 13 that in the simulation process, all the constraints of the system are satisfied. It can be observed that when the renewable energy generation is unable to meet the higher load demand, the storage system will first discharge until the maximum depth of discharge is reached, and then the PGU starts working to supply the deficit energy.
- Comparing the fuel consumption of PGU under FEL and FTL strategies, it is obvious that the fuel consumption in FEL is large in summer and winter while small in spring and autumn. In addition, the difference for FTL in different seasons is as evident as that for the FEL.
- Regarding the FEL strategy, we can observe from Figure 12c,d that the battery has a large capacity while the capacity of HST is small and sometimes even reaches 0.
- Regarding the FTL strategy, we can observe from Figure 13c,d that the capacity of the battery is small while HST has great capacity. Obviously, in spring and autumn, HST is only slightly used. The reason may be that the thermal demand in these seasons is pretty small, which can be directly met by renewable energy generation. Hence, some thermal energy generated from PGU may be wasted.
The thermal demand in summer and winter is high. The FTL aims to meet the thermal demand as much as possible. Excess electricity generated from the PGU is stored into batteries which can then be used as needed, improving the system performance even further. The FEL aims to meet the electrical demand as much as possible. This strategy is shown as suitable for spring and autumn. In these seasons, the thermal demand is relatively low, which then can be easily met by the recovery thermal energy from the PGU. Using the FEL strategy, in the course of its operation for one year, renewable energy generation is 1.67 × kW· h, which is equivalent to saving 5.5 × kg of LNG. LNG consumption of the RECCHP system is 2.33 × 10⁵ kg, while traditional energy systems need to consume 4.63 × 10⁵ kg of LNG. It can be seen that using the RECCHP system reduces the LNG consumption and CO2 emissions by 50%. Besides, the annual total cost (ATC) of the RECCHP system is 1.55 × CNY, while it is 3.03 × CNY for traditional energy systems; thus, the RECCHP system has a better economic performance. This is mainly due to the savings in fuel costs. With the increase in fuel prices, the economic advantages of the RECCHP system will be more pronounced. When working in the FTL strategy, the total renewable energy generation is 1.51 × kW· h, which is equivalent to saving 5.0 × 10⁴ kg of LNG. The LNG consumption of the RECCHP system is 2.05 × 10⁵ kg, which means that using the RECCHP system reduces the LNG consumption and CO2 emissions by 55%. Similarly, the RECCHP system has good economic performance under the FTL strategy because of the reduction of fuel usage.
5. Conclusions
The combined cooling, heating, and power (CCHP) system has been widely used due to its high efficiency in terms of energy usage. This research studied optimal configurations of renewable energies integrated CCHP systems in isolated mode. A multi-objective optimization model aimed at the minimization of system cost, loss of energy supply, and carbon emission is constructed. It is solved by the multi-objective evolutionary algorithm, PICEA-g, obtaining a set of Pareto optimal solutions (optimal system configurations). These solutions represent different trade-offs among the three objectives. Lastly, the most satisfactory solution is finalized by introducing the decision-maker preference. In addition, it is found that the optimal system configurations vary greatly under FEL and FTL strategies. The FEL strategy is more suitable for spring and autumn, while the FTL strategy is more suitable for winter and summer. It can be seen that RECCHP system has better economic and environmental advantages. More specifically, compared to traditional energy systems, using the RECCHP system reduces the LNG consumption and CO2 emissions by 50% and 55% in FEL and FTL, respectively. At the same time, the ATC of the RECCHP system is lower.
In terms of future studies, first we would like to explore day-ahead optimal scheduling of CCHP systems. Second, an adaptive selection of operation strategies would be quite useful, which deserves further study. Lastly, more effective algorithms (i.e., dealing with mixed categorical and real decision variables) will be investigated.
Acknowledgments
This work was supported by the National Natural Science Foundation of China (Nos. 61773390, 71571187) and Natural Science Fund for Distinguished Young Scholars of Hunan Province (2017JJ1001).
Author Contributions
Guozheng Li and Rui Wang proposed the idea, wrote the paper, conceived and designed the experiments; Tao Zhang analyzed the data; Mengjun Ming performed the experiments.
Conflicts of Interest
The authors declare no conflict of interest.
Abbreviations
| ATC | annual total cost |
| CCHP | combined cooling, heating, and power |
| CDE | carbon dioxide emission |
| CRF | capital recovery factor |
| DC | discriminant condition |
| FF | fill factor |
| HST | heat storage tank |
| MOEA | multi-objective evolutionary algorithm |
| NCOT | nominal cell operating temperature |
| PGU | power generation unit |
| RECCHP | renewable energies integrated CCHP |
| LESP | loss of energy supply probability |
| LNG | liquid natural gas |
| SOC | battery state of charge |
| Superscripts | |
| BAT | battery |
| CCHP | combined cooling, heating, and power |
| FEL | following electric load |
| FTL | following the thermal load |
| R | the remaining user load after renewable energies supply |
| REE | renewable energies |
| S | storage devices |
| HST | heat storage tank |
| STC | standard test condition |
| Subscripts | |
| ac | absorption chiller |
| bat | battery |
| c | cool |
| cap | capital |
| CO2 | carbon dioxide |
| cl | cold load |
| ch | charge |
| dis | discharge |
| e | electricity |
| eb | electric boiler |
| ec | electric chiller |
| el | electrical load |
| h | heat |
| hc | heating coil |
| hl | heat load |
| in | input |
| max | maximum |
| min | minimum |
| oc | open-circuit |
| out | output |
| pgu | power generation unit |
| pv | photovoltaic |
| r | waste heat recovery system |
| rep | replace |
| sc | short-circuit |
| st | heat storage tank |
| tow | wind turbine tower |
| wt | wind turbine |
| Symbols | |
| C | cost |
| Cap | capital |
| COP | coefficient of performance |
| E | electric power |
| F | fuel |
| I | current |
| Q | thermal power |
| U | operation status of battery |
| V | operation status of heat storage tank/voltage |
| η | energy efficiency |
References
- Liu, M.X.; Shi, Y.; Fang, F. Combined cooling, heating and power systems: A survey. Renew. Sustain. Energy Rev. 2014, 35, 1–22. [Google Scholar] [CrossRef]
- Gu, W.; Wu, Z.; Bo, R.; Liu, W.; Zhou, G.; Chen, W.; Wu, Z.J. Modeling, planning and optimal energy management of combined cooling, heating and power microgrid: A review. Int. J. Electr. Power Energy Syst. 2014, 54, 26–37. [Google Scholar] [CrossRef]
- Cho, H.; Smith, A.D.; Mago, P. Combined cooling, heating and power: A review of performance improvement and optimization. Appl. Energy 2014, 136, 168–185. [Google Scholar] [CrossRef]
- Cho, H.; Mago, P.J.; Luck, R.; Chamra, L.M. Evaluation of CCHP systems performance based on operational cost, primary energy consumption, and carbon dioxide emission by utilizing an optimal operation scheme. Appl. Energy 2009, 86, 2540–2549. [Google Scholar] [CrossRef]
- Wang, H.; Yin, W.; Abdollahi, E.; Lahdelma, R.; Jiao, W. Modelling and optimization of CHP based district heating system with renewable energy production and energy storage. Appl. Energy 2015, 159, 401–421. [Google Scholar] [CrossRef]
- Wang, L.; Singh, C. Stochastic combined heat and power dispatch based on multi-objective particle swarm optimization. Int. J. Electr. Power Energy Syst. 2008, 30, 226–234. [Google Scholar] [CrossRef]
- Cho, H.; Luck, R.; Eksioglu, S.D.; Chamra, L.M. Cost-optimized real-time operation of CHP systems. Energy Build. 2009, 41, 445–451. [Google Scholar] [CrossRef]
- Sadat Hosseini, S.S.; Jafarnejad, A.; Behrooz, A.H.; Gandomi, A.H. Combined heat and power economic dispatch by mesh adaptive direct search algorithm. Expert Syst. Appl. 2011, 38, 6556–6564. [Google Scholar] [CrossRef]
- Sevencan, S.; Lindbergh, G.; Lagergren, C.; Alvfors, P. Economic feasibility study of a fuel cell-based combined cooling, heating and power system for a data centre. Energy Build. 2016, 111, 218–223. [Google Scholar] [CrossRef]
- Xu, Y.; Li, W.; Yuan, J.; Sciubba, E. Economical Efficiency of Combined Cooling Heating and Power Systems Based on an Enthalpy Method. Energies 2017, 10, 1821. [Google Scholar] [CrossRef]
- Mago, P.J.; Chamra, L.M. Analysis and optimization of CCHP systems based on energy, economical, and environmental considerations. Energy Build. 2009, 41, 1099–1106. [Google Scholar] [CrossRef]
- Wu, J.; Wang, J.; Li, S. Multi-objective optimal operation strategy study of micro-CCHP system. Energy 2012, 48, 472–483. [Google Scholar] [CrossRef]
- Xu, D.; Qu, M. Energy, environmental, and economic evaluation of a CCHP system for a data center based on operational data. Energy Build. 2013, 67, 176–186. [Google Scholar] [CrossRef]
- Wei, D.J.; Chen, A.; Sun, B.; Zhang, C.H. Multi-objective optimal operation and energy coupling analysis of combined cooling and heating system. Energy 2016, 98, 296–307. [Google Scholar] [CrossRef]
- Yousefi, H.; Ghodusinejad, M.H.; Noorollahi, Y. GA/AHP-based optimal design of a hybrid CCHP system considering economy, energy and emission. Energy Build. 2017, 138, 309–317. [Google Scholar] [CrossRef]
- Lahdelma, R.; Hakonen, H. An efficient linear programming algorithm for combined heat and power production. Eur. J. Oper. Res. 2003, 148, 141–151. [Google Scholar] [CrossRef]
- Rong, A.; Hakonen, H.; Lahdelma, R. An efficient linear model and optimisation algorithm for multi-site combined heat and power production. Eur. J. Oper. Res. 2006, 168, 612–632. [Google Scholar] [CrossRef]
- Rong, A.; Lahdelma, R. An effective heuristic for combined heat-and-power production planning with power ramp constraints. Appl. Energy 2007, 84, 307–325. [Google Scholar] [CrossRef]
- Hussain, A.; Bui, V.H.; Kim, H.M.; Im, Y.H.; Lee, J.Y. Optimal Energy Management of Combined Cooling, Heat and Power in Different Demand Type Buildings Considering Seasonal Demand Variations. Energies 2017, 10, 789. [Google Scholar] [CrossRef]
- Qin, C.; Tang, J.; Zhang, Y. An efficient algorithm for CCHP system sizing and an operational optimization model based on LP. J. Nat. Gas Sci. Eng. 2015, 25, 189–196. [Google Scholar] [CrossRef]
- Li, G.Q.; Zhang, R.F.; Jiang, T.; Chen, H.H.; Bai, L.Q.; Cui, H.T.; Li, X.J. Optimal dispatch strategy for integrated energy systems with CCHP and wind power. Appl. Energy 2017, 192, 408–419. [Google Scholar] [CrossRef]
- Carvalho, M.; Serra, L.M.; Lozano, M.A. Optimal synthesis of trigeneration systems subject to environmental constraints. Energy 2011, 36, 3779–3790. [Google Scholar] [CrossRef]
- Lozano, M.A.; Ramos, J.C.; Serra, L.M. Cost optimization of the design of CHCP (combined heat, cooling and power) systems under legal constraints. Energy 2010, 35, 794–805. [Google Scholar] [CrossRef]
- Gopisetty, S.; Treffinger, P. Generic Combined Heat and Power (CHP) Model for the Concept Phase of Energy Planning Process. Energies 2016, 10, 11. [Google Scholar] [CrossRef]
- Wang, J.J.; Zhai, Z.Q.; Jing, Y.Y.; Zhang, C.F. Particle swarm optimization for redundant building cooling heating and power system. Appl. Energy 2010, 87, 3668–3679. [Google Scholar] [CrossRef]
- Fu, X.; Huang, S.; Li, R.; Sun, H. Electric Power Output Optimization for CCHP Using PSO Theory. Energy Procedia 2016, 103, 9–14. [Google Scholar] [CrossRef]
- Subbaraj, P.; Rengaraj, R.; Salivahanan, S. Enhancement of combined heat and power economic dispatch using self adaptive real-coded genetic algorithm. Appl. Energy 2009, 86, 915–921. [Google Scholar] [CrossRef]
- Wang, J.J.; Jing, Y.Y.; Zhang, C.F. Optimization of capacity and operation for CCHP system by genetic algorithm. Appl. Energy 2010, 87, 1325–1335. [Google Scholar] [CrossRef]
- Li, M.; Mu, H.; Li, H. Analysis and Assessments of Combined Cooling, Heating and Power Systems in Various Operation Modes for a Building in China, Dalian. Energies 2013, 6, 2446–2467. [Google Scholar] [CrossRef]
- Gimelli, A.; Muccillo, M. Optimization criteria for cogeneration systems: Multi-objective approach and application in an hospital facility. Appl. Energy 2013, 104, 910–923. [Google Scholar] [CrossRef]
- Muccillo, M.; Gimelli, A.; Sannino, R. Multi-objective Optimization and Sensitivity Analysis of a Cogeneration System for a Hospital Facility. Energy Procedia 2015, 81, 585–596. [Google Scholar] [CrossRef]
- Alvarado, D.C.; Acha, S.; Shah, N.; Markides, C.N. A Technology Selection and Operation (TSO) optimisation model for distributed energy systems: Mathematical formulation and case study. Appl. Energy 2016, 180, 491–503. [Google Scholar] [CrossRef]
- Wang, F.; Zhou, L.; Ren, H.; Liu, X. Search Improvement Process-Chaotic Optimization-Particle Swarm Optimization-Elite Retention Strategy and Improved Combined Cooling-Heating-Power Strategy Based Two-Time Scale Multi-Objective Optimization Model for Stand-Alone Microgrid Operation. Energies 2017, 10, 1936. [Google Scholar] [CrossRef]
- Gimelli, A.; Muccillo, M.; Sannino, R. Optimal design of modular cogeneration plants for hospital facilities and robustness evaluation of the results. Energy Convers. Manag. 2017, 134, 20–31. [Google Scholar] [CrossRef]
- Soheyli, S.; Mayam, M.H.S.; Mehrjoo, M. Modeling a novel CCHP system including solar and wind renewable energy resources and sizing by a CC-MOPSO algorithm. Appl. Energy 2016, 184, 375–395. [Google Scholar] [CrossRef]
- Wu, F.; Guo, Q.; Sun, H.; Pan, Z. Research on the optimization of combined heat and power microgrids with renewable energy. In Proceedings of the 2014 IEEE PES Asia-Pacific Power and Energy Engineering Conference (APPEEC), Hong Kong, China, 7–10 December 2014; IEEE: New York, NY, USA, 2014; pp. 1–5. [Google Scholar]
- Arsalis, A.; Alexandrou, A.N.; Georghiou, G.E. Thermoeconomic Modeling and Parametric Study of a Photovoltaic-Assisted 1 MWe Combined Cooling, Heating, and Power System. Energies 2016, 9, 663. [Google Scholar] [CrossRef]
- Marrasso, E.; Sasso, M.; Tariello, F. Analysis of a Hybrid Solar-Assisted Trigeneration System. Energies 2016, 9, 705. [Google Scholar] [CrossRef]
- Bellos, E.; Tzivanidis, C. Optimization of a Solar-Driven Trigeneration System with Nanofluid-Based Parabolic Trough Collectors. Energies 2017, 10, 848. [Google Scholar]
- Acevedo, L.; Uche, J.; Almo, A.D.; Círez, F.; Usón, S.; Martínez, A.; Guedea, I. Dynamic Simulation of a Trigeneration Scheme for Domestic Purposes Based on Hybrid Techniques. Energies 2016, 9, 1013. [Google Scholar] [CrossRef]
- Kang, E.C.; Lee, E.J.; Ghorab, M.; Yang, L.; Entchev, E.; Lee, K.S.; Lyu, N.J. Investigation of Energy and Environmental Potentials of a Renewable Trigeneration System in a Residential Application. Energies 2016, 9, 760. [Google Scholar] [CrossRef]
- Rey, G.; Ulloa, C.; Míguez, J.L.; Cacabelos, A. Suitability Assessment of an ICE-Based Micro-CCHP Unit in Different Spanish Climatic Zones: Application of an Experimental Model in Transient Simulation. Energies 2016, 9, 969. [Google Scholar] [CrossRef]
- Wang, J.J.; Zhang, C.F.; Jing, Y.Y. Multi-criteria analysis of combined cooling, heating and power systems in different climate zones in China. Appl. Energy 2010, 87, 1247–1259. [Google Scholar]
- Jing, Y.Y.; Bai, H.; Wang, J.J.; Liu, L. Life cycle assessment of a solar combined cooling heating and power system in different operation strategies. Appl. Energy 2012, 92, 843–853. [Google Scholar] [CrossRef]
- Wang, J.J.; Yang, Y.; Mao, T.Z.; Sui, J.; Jin, H.G. Life cycle assessment (LCA) optimization of solar-assisted hybrid CCHP system. Appl. Energy 2015, 146, 38–52. [Google Scholar] [CrossRef]
- Wang, R.; Purshouse, R.C.; Fleming, P.J. Preference-inspired Co-evolutionary Algorithms for Many-objective Optimisation. IEEE Trans. Evol. Comput. 2013, 17, 474–494. [Google Scholar] [CrossRef]
- Barbieri, E.S.; Melino, F.; Morini, M. Influence of the thermal energy storage on the profitability of micro-CHP systems for residential building applications. Appl. Energy 2012, 97, 714–722. [Google Scholar] [CrossRef]
- Ming, M.; Wang, R.; Zha, Y.; Zhang, T. Multi-Objective Optimization of Hybrid Renewable Energy System Using an Enhanced Multi-Objective Evolutionary Algorithm. Energies 2017, 10, 674. [Google Scholar]
- Abedi, S.; Alimardani, A.; Gharehpetian, G.B.; Riahy, G.H.; Hosseinian, S.H. A comprehensive method for optimal power management and design of hybrid RES-based autonomous energy systems. Renew. Sustain. Energy Rev. 2012, 16, 1577–1587. [Google Scholar] [CrossRef]
- Shi, Z.; Wang, R.; Zhang, T. Multi-objective optimal design of hybrid renewable energy systems using preference-inspired coevolutionary approach. Sol. Energy 2015, 118, 96–106. [Google Scholar] [CrossRef]
- Koutroulis, E.; Kolokotsa, D.; Potirakis, A.; Kalaitzakis, K. Methodology for optimal sizing of stand-alone photovoltaic/wind-generator systems using genetic algorithms. Sol. Energy 2006, 80, 1072–1088. [Google Scholar] [CrossRef]
- Yang, H.; Lu, L.; Zhou, W. A novel optimization sizing model for hybrid solar-wind power generation system. Sol. Energy 2007, 81, 76–84. [Google Scholar] [CrossRef]
- Wang, R.; Xiong, J.; Ishibuchi, H.; Wu, G.; Zhang, T. On the effect of reference point in MOEA/D for multi-objective optimization. Appl. Soft Comput. 2016, in press. [Google Scholar] [CrossRef]
- Wang, R.; Zhou, Z.; Liao, T.; Zhang, T. Localized weighted sum method for many-objective optimization. IEEE Trans. Evol. Comput. 2016, 22, 3–18. [Google Scholar] [CrossRef]
- Wang, R.; Zhang, Q.; Zhang, T. Decomposition based algorithms using Pareto adaptive scalarizing methods. IEEE Trans. Evol. Comput. 2016, 20, 821–837. [Google Scholar] [CrossRef]
- Lei, H.; Wang, R.; Laporte, G. Solving a multi-objective dynamic stochastic districting and routing problem with a co-evolutionary algorithm. Comput. Oper. Res. 2016, 67, 12–24. [Google Scholar] [CrossRef]
- Lei, H.; Wang, R.; Zhang, T.; Liu, Y.; Zha, Y. A multi-objective co-evolutionary algorithm for energy-efficient scheduling on a green data center. Comput. Oper. Res. 2016, 75, 103–117. [Google Scholar] [CrossRef]
- Wang, R.; Purshouse, R.C.; Fleming, P.J. Preference-inspired co-evolutionary algorithms using weight vectors. Eur. J. Oper. Res. 2015, 243, 423–441. [Google Scholar] [CrossRef]
- Wang, R.; Purshouse, R.C.; Giagkiozis, I.; Fleming, P.J. The iPICEA-g: A new hybrid evolutionary multi-criteria decision making approach using the brushing technique. Eur. J. Oper. Res. 2015, 243, 442–453. [Google Scholar] [CrossRef]
- Cozzolino, R. Thermodynamic Performance Assessment of a Novel Micro-CCHP System Based on a Low Temperature PEMFC Power Unit and a Half-Effect Li/Br Absorption Chiller. Energies 2018, 11, 315. [Google Scholar] [CrossRef]
- Li, M.; Mu, H.; Li, N.; Ma, B. Optimal design and operation strategy for integrated evaluation of CCHP (combined cooling heating and power) system. Energy 2016, 99, 202–220. [Google Scholar] [CrossRef]
- Fang, F.; Wang, Q.H.; Shi, Y. A Novel Optimal Operational Strategy for the CCHP System Based on Two Operating Modes. IEEE Trans. Power Syst. 2012, 27, 1032–1041. [Google Scholar] [CrossRef]
Figure 1.
Illustration of the traditional energy system structure in isolated mode.

Figure 2.
Illustration of the composition of a typical combined cooling, heating, and power (CCHP) system. PGU: power generation unit.
Figure 2.
Illustration of the composition of a typical combined cooling, heating, and power (CCHP) system. PGU: power generation unit.

Figure 3.
Illustration of the renewable energies integrated CCHP (RECCHP) system structure in isolated mode. PV: photovoltaic.
Figure 3.
Illustration of the renewable energies integrated CCHP (RECCHP) system structure in isolated mode. PV: photovoltaic.
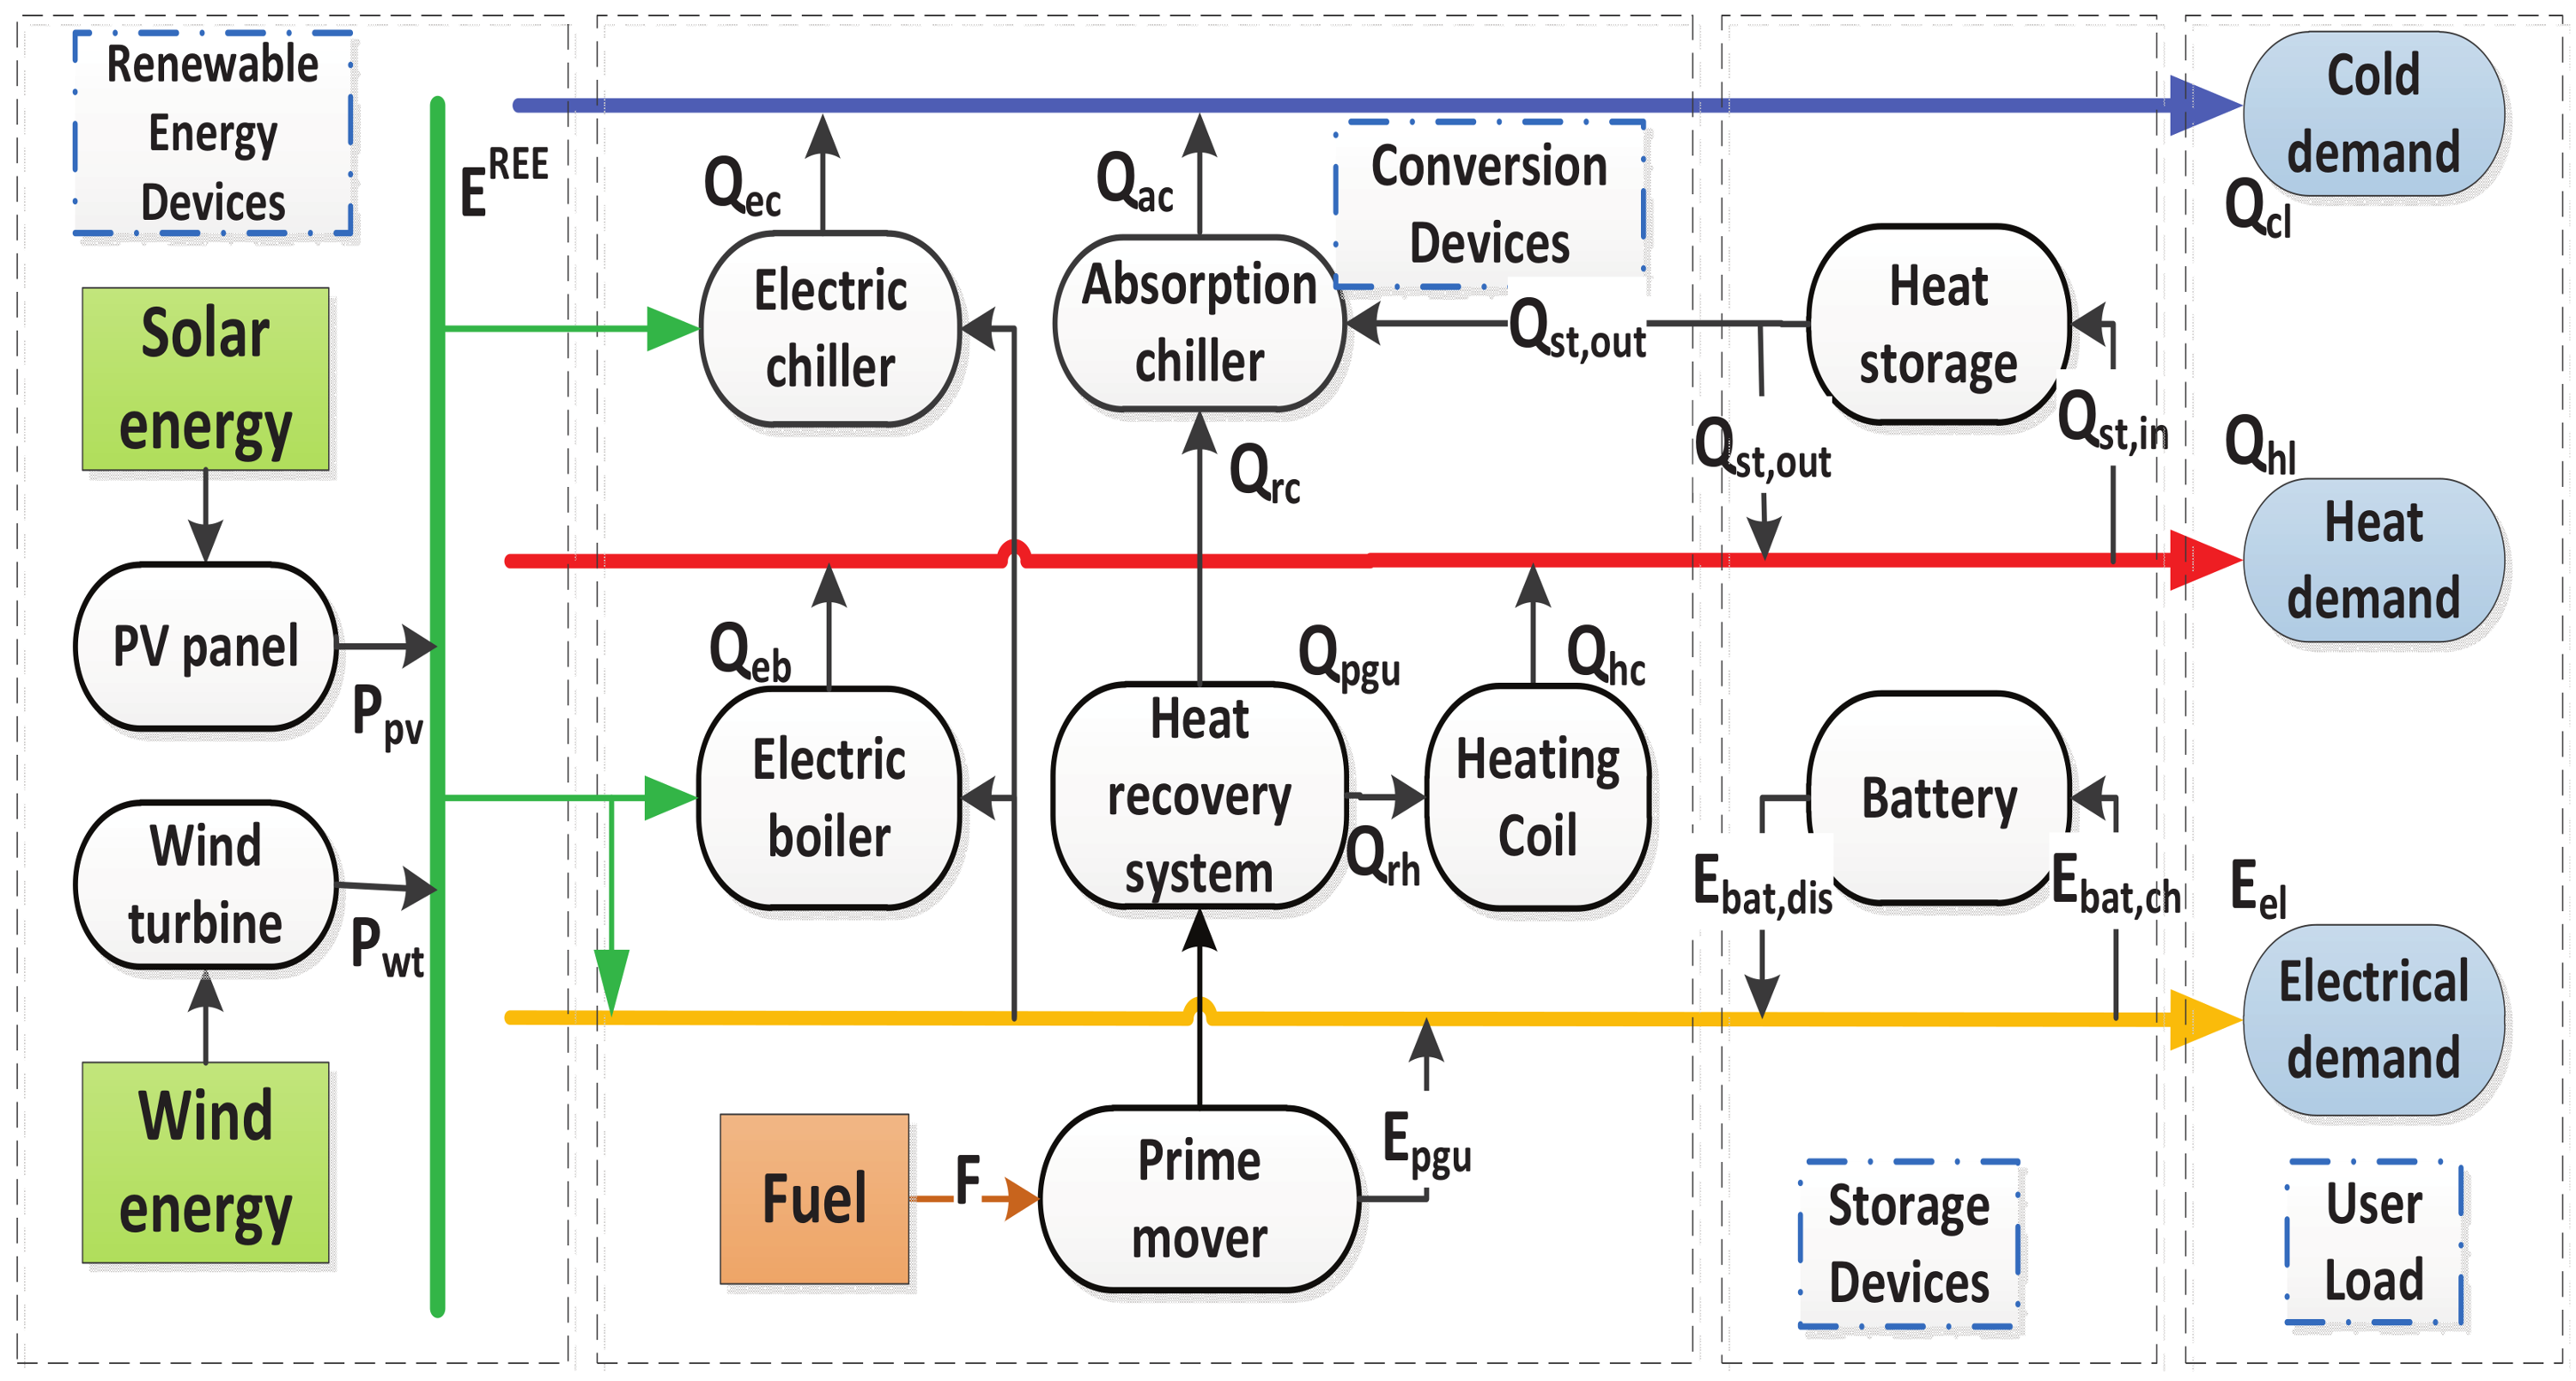
Figure 4.
Representation of solar irradiation.
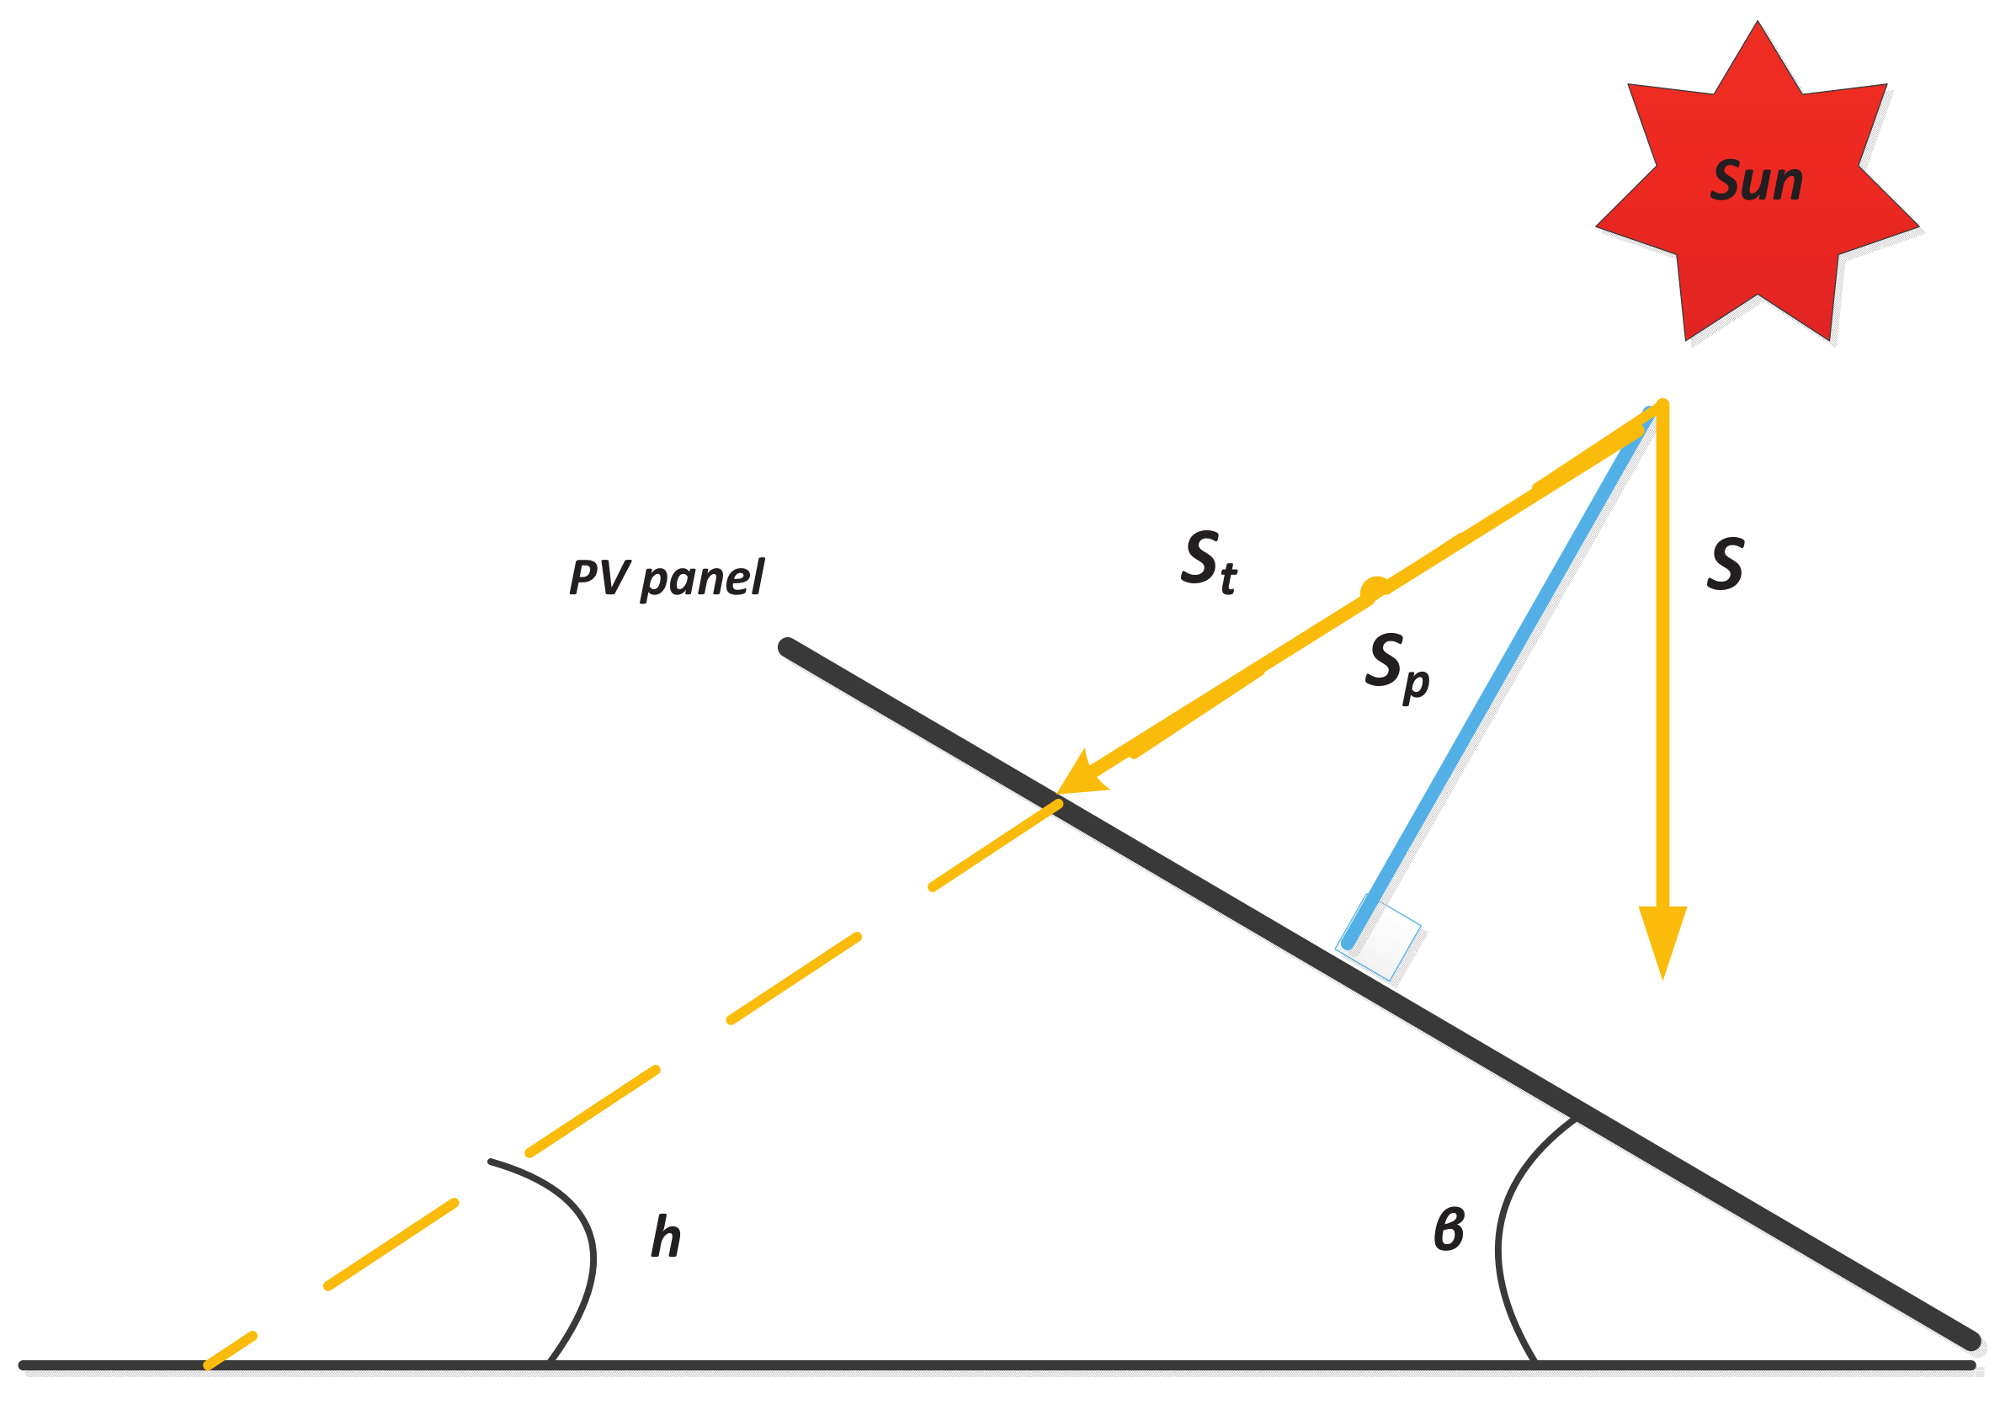
Figure 5.
Flowchart of the following electric load (FEL) operation strategy. : discriminant condition.
Figure 5.
Flowchart of the following electric load (FEL) operation strategy. : discriminant condition.
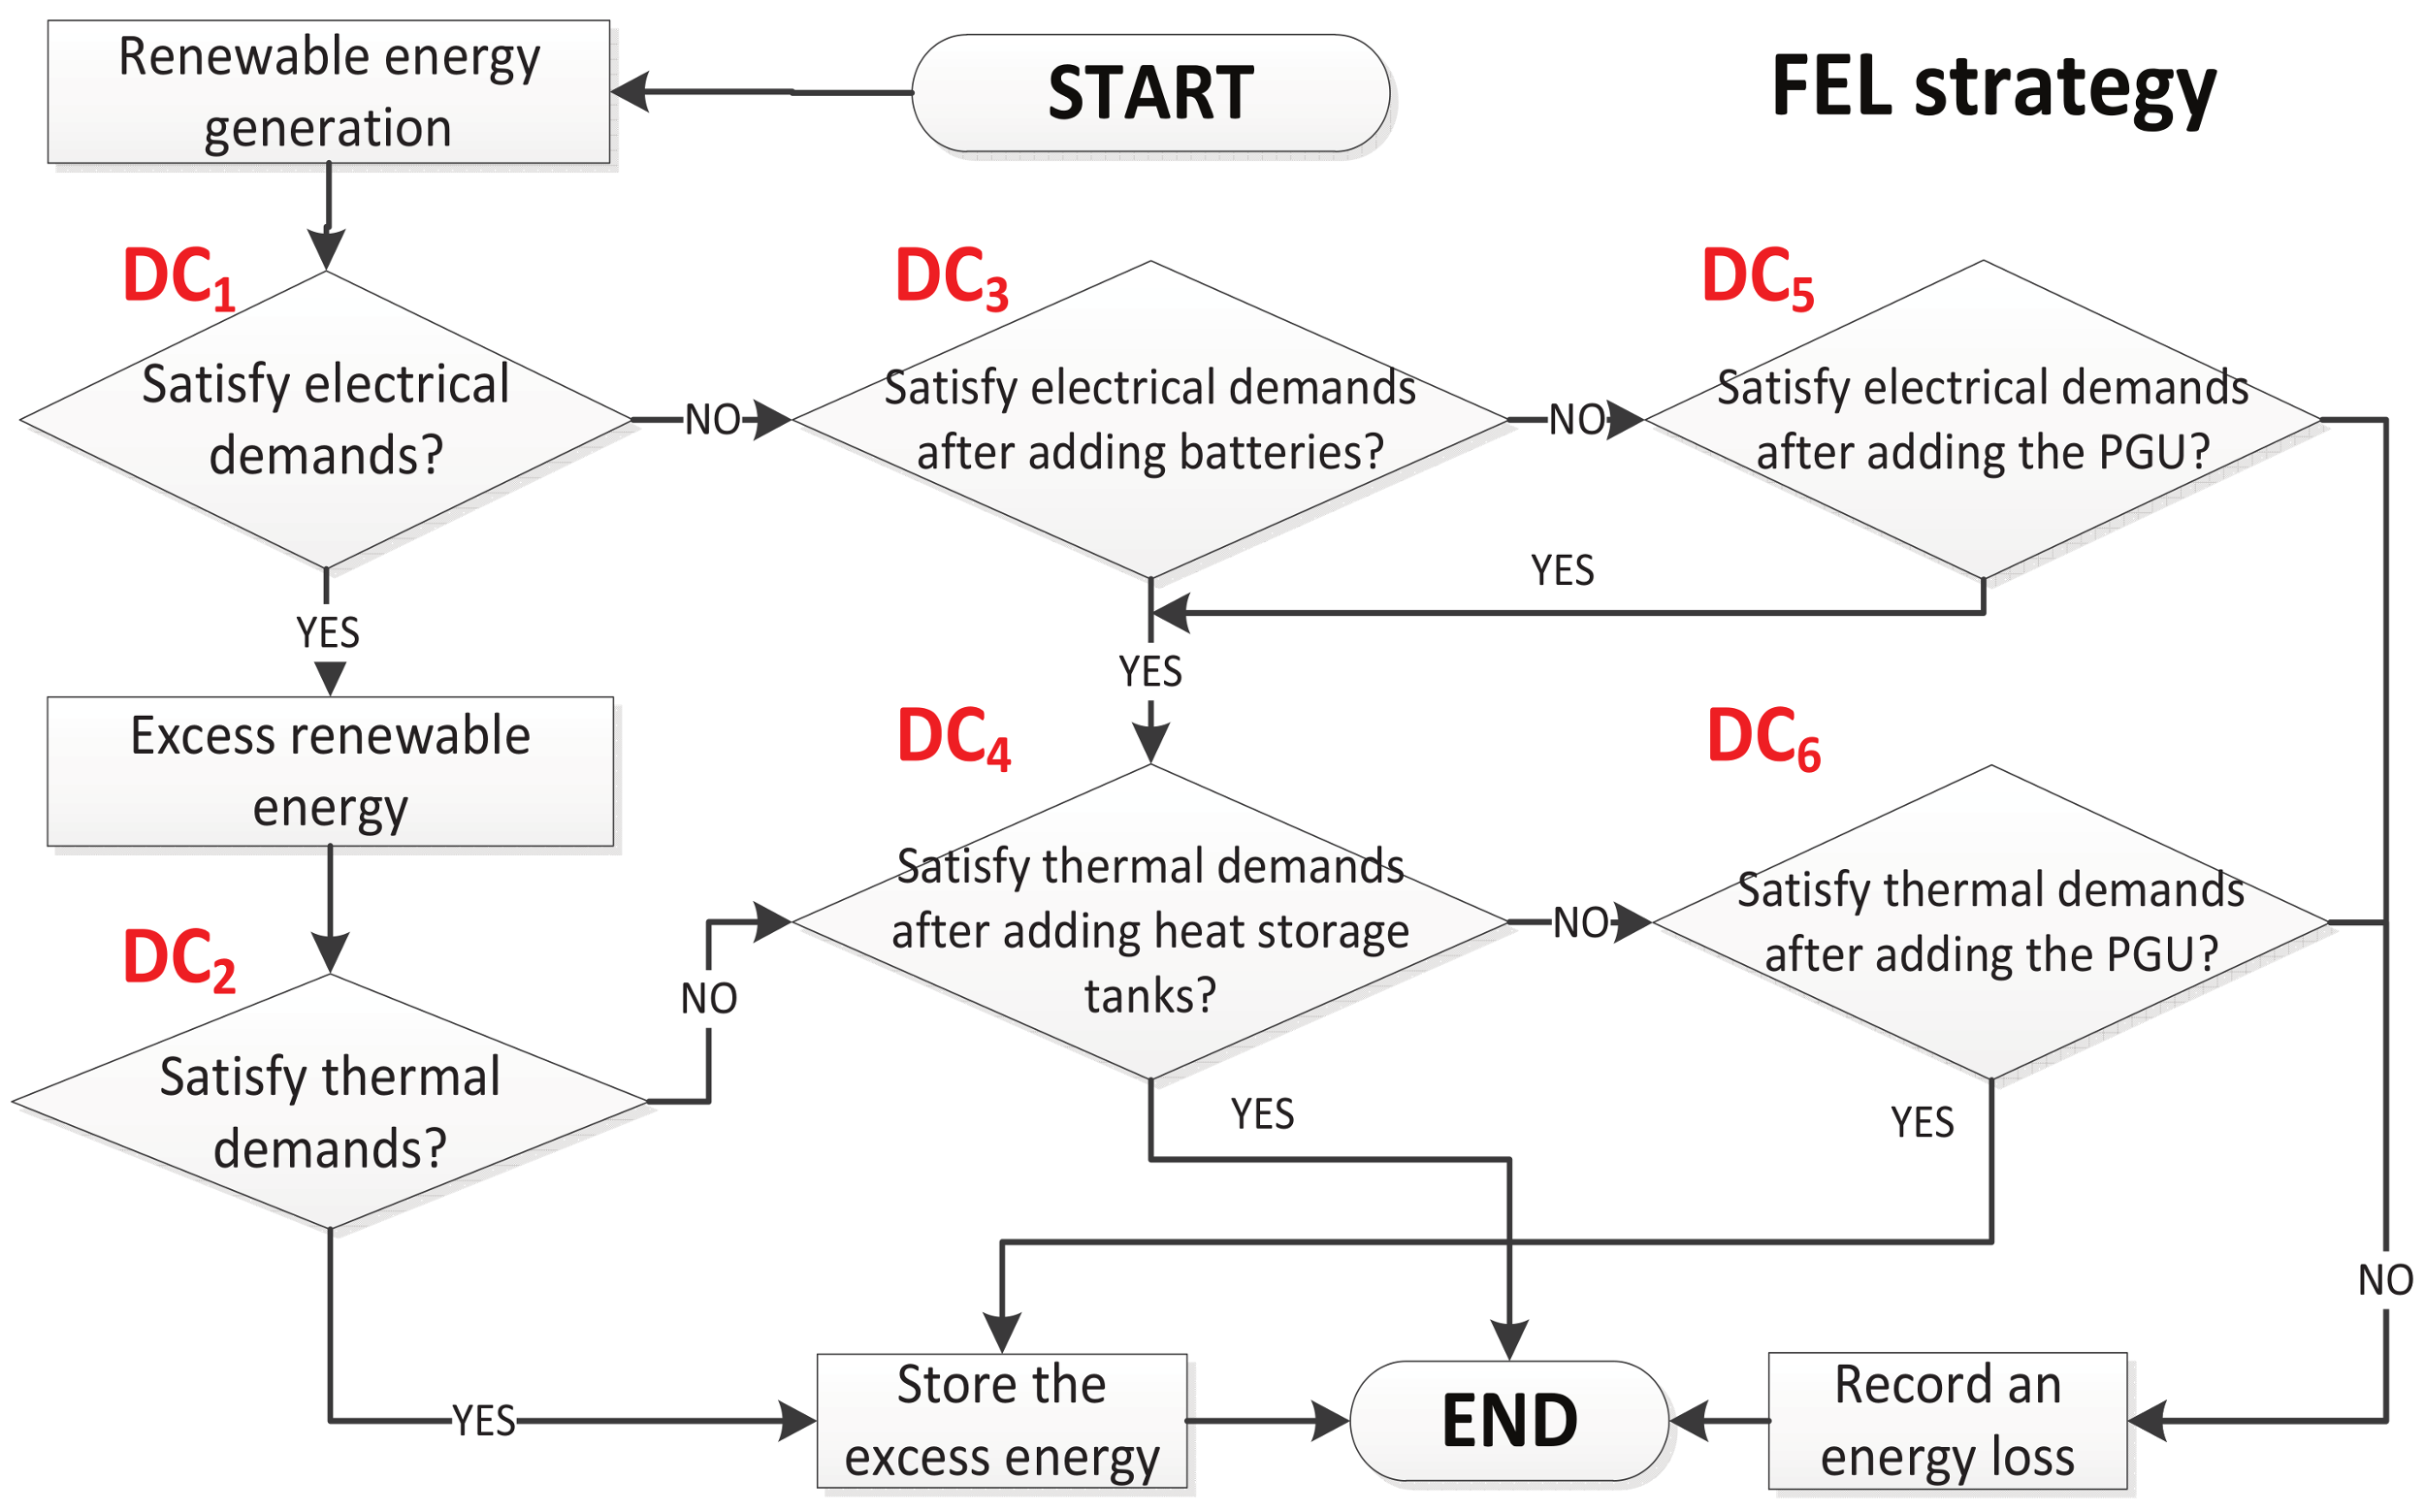
Figure 6.
Flowchart of the following thermal load (FTL) operation strategy.
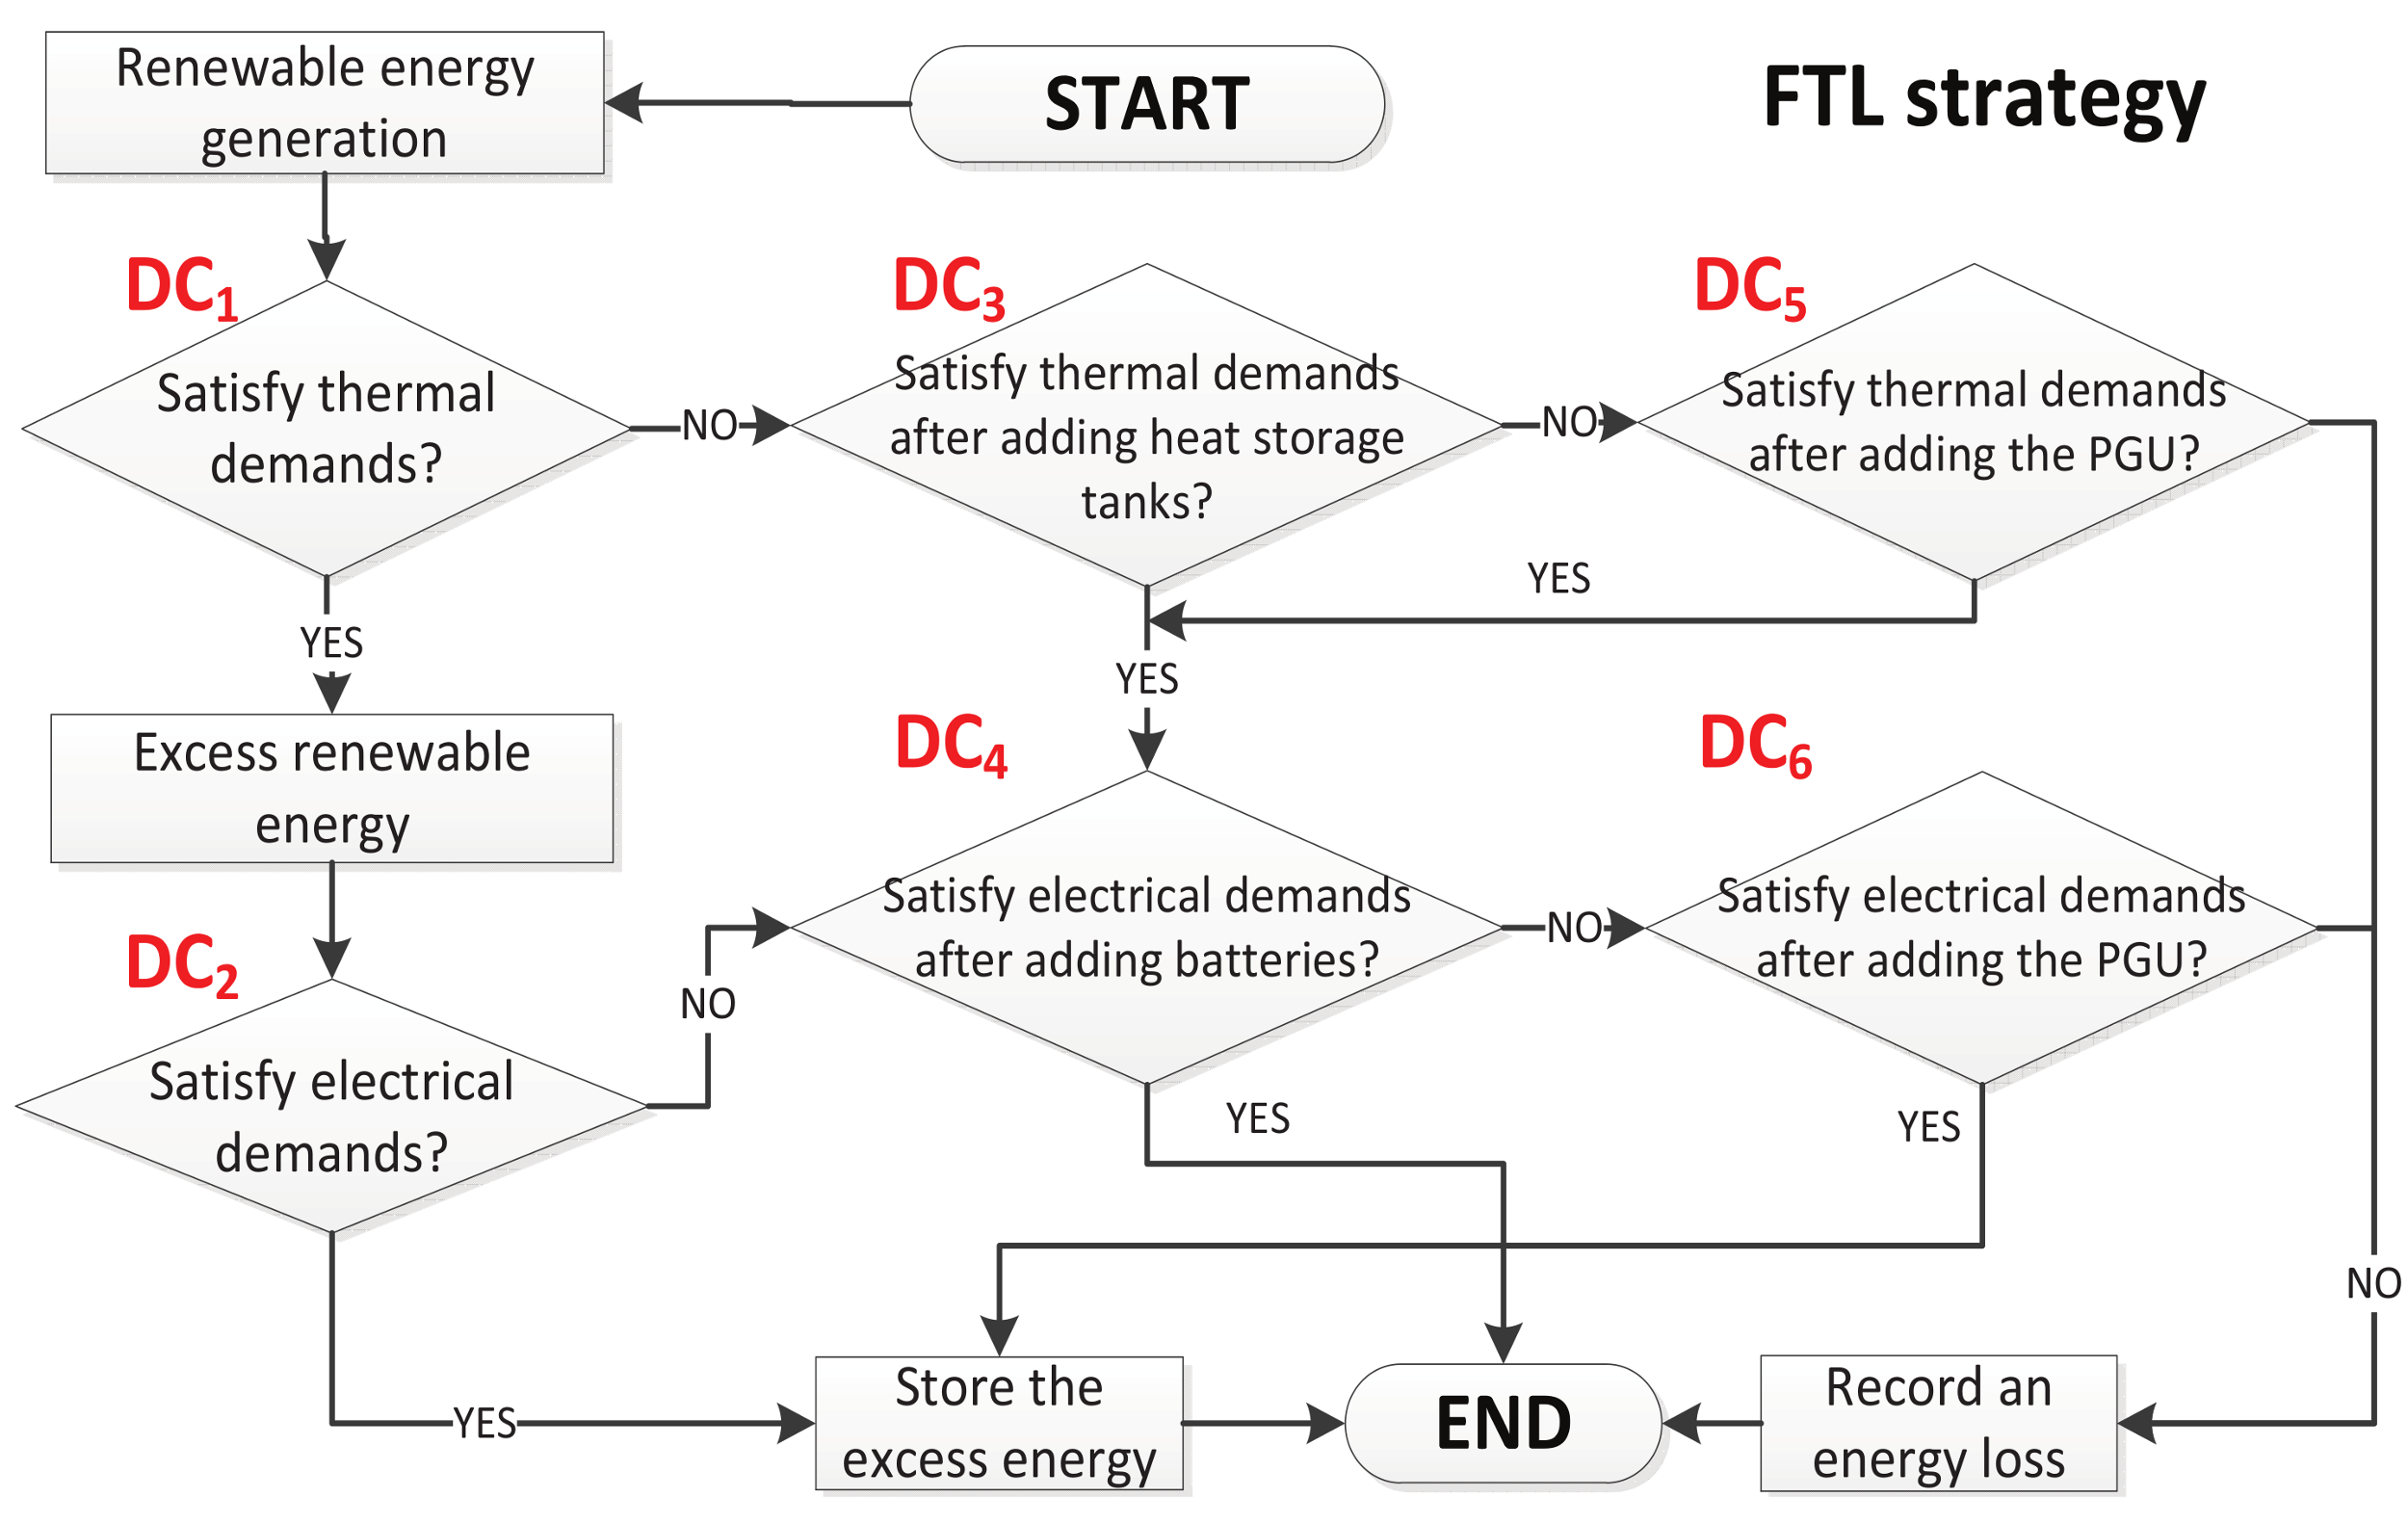
Figure 7.
Flowchart of system simulation. ATC: annual total cost; CDE: carbon dioxide emission; LESP: loss of energy supply probability.
Figure 7.
Flowchart of system simulation. ATC: annual total cost; CDE: carbon dioxide emission; LESP: loss of energy supply probability.
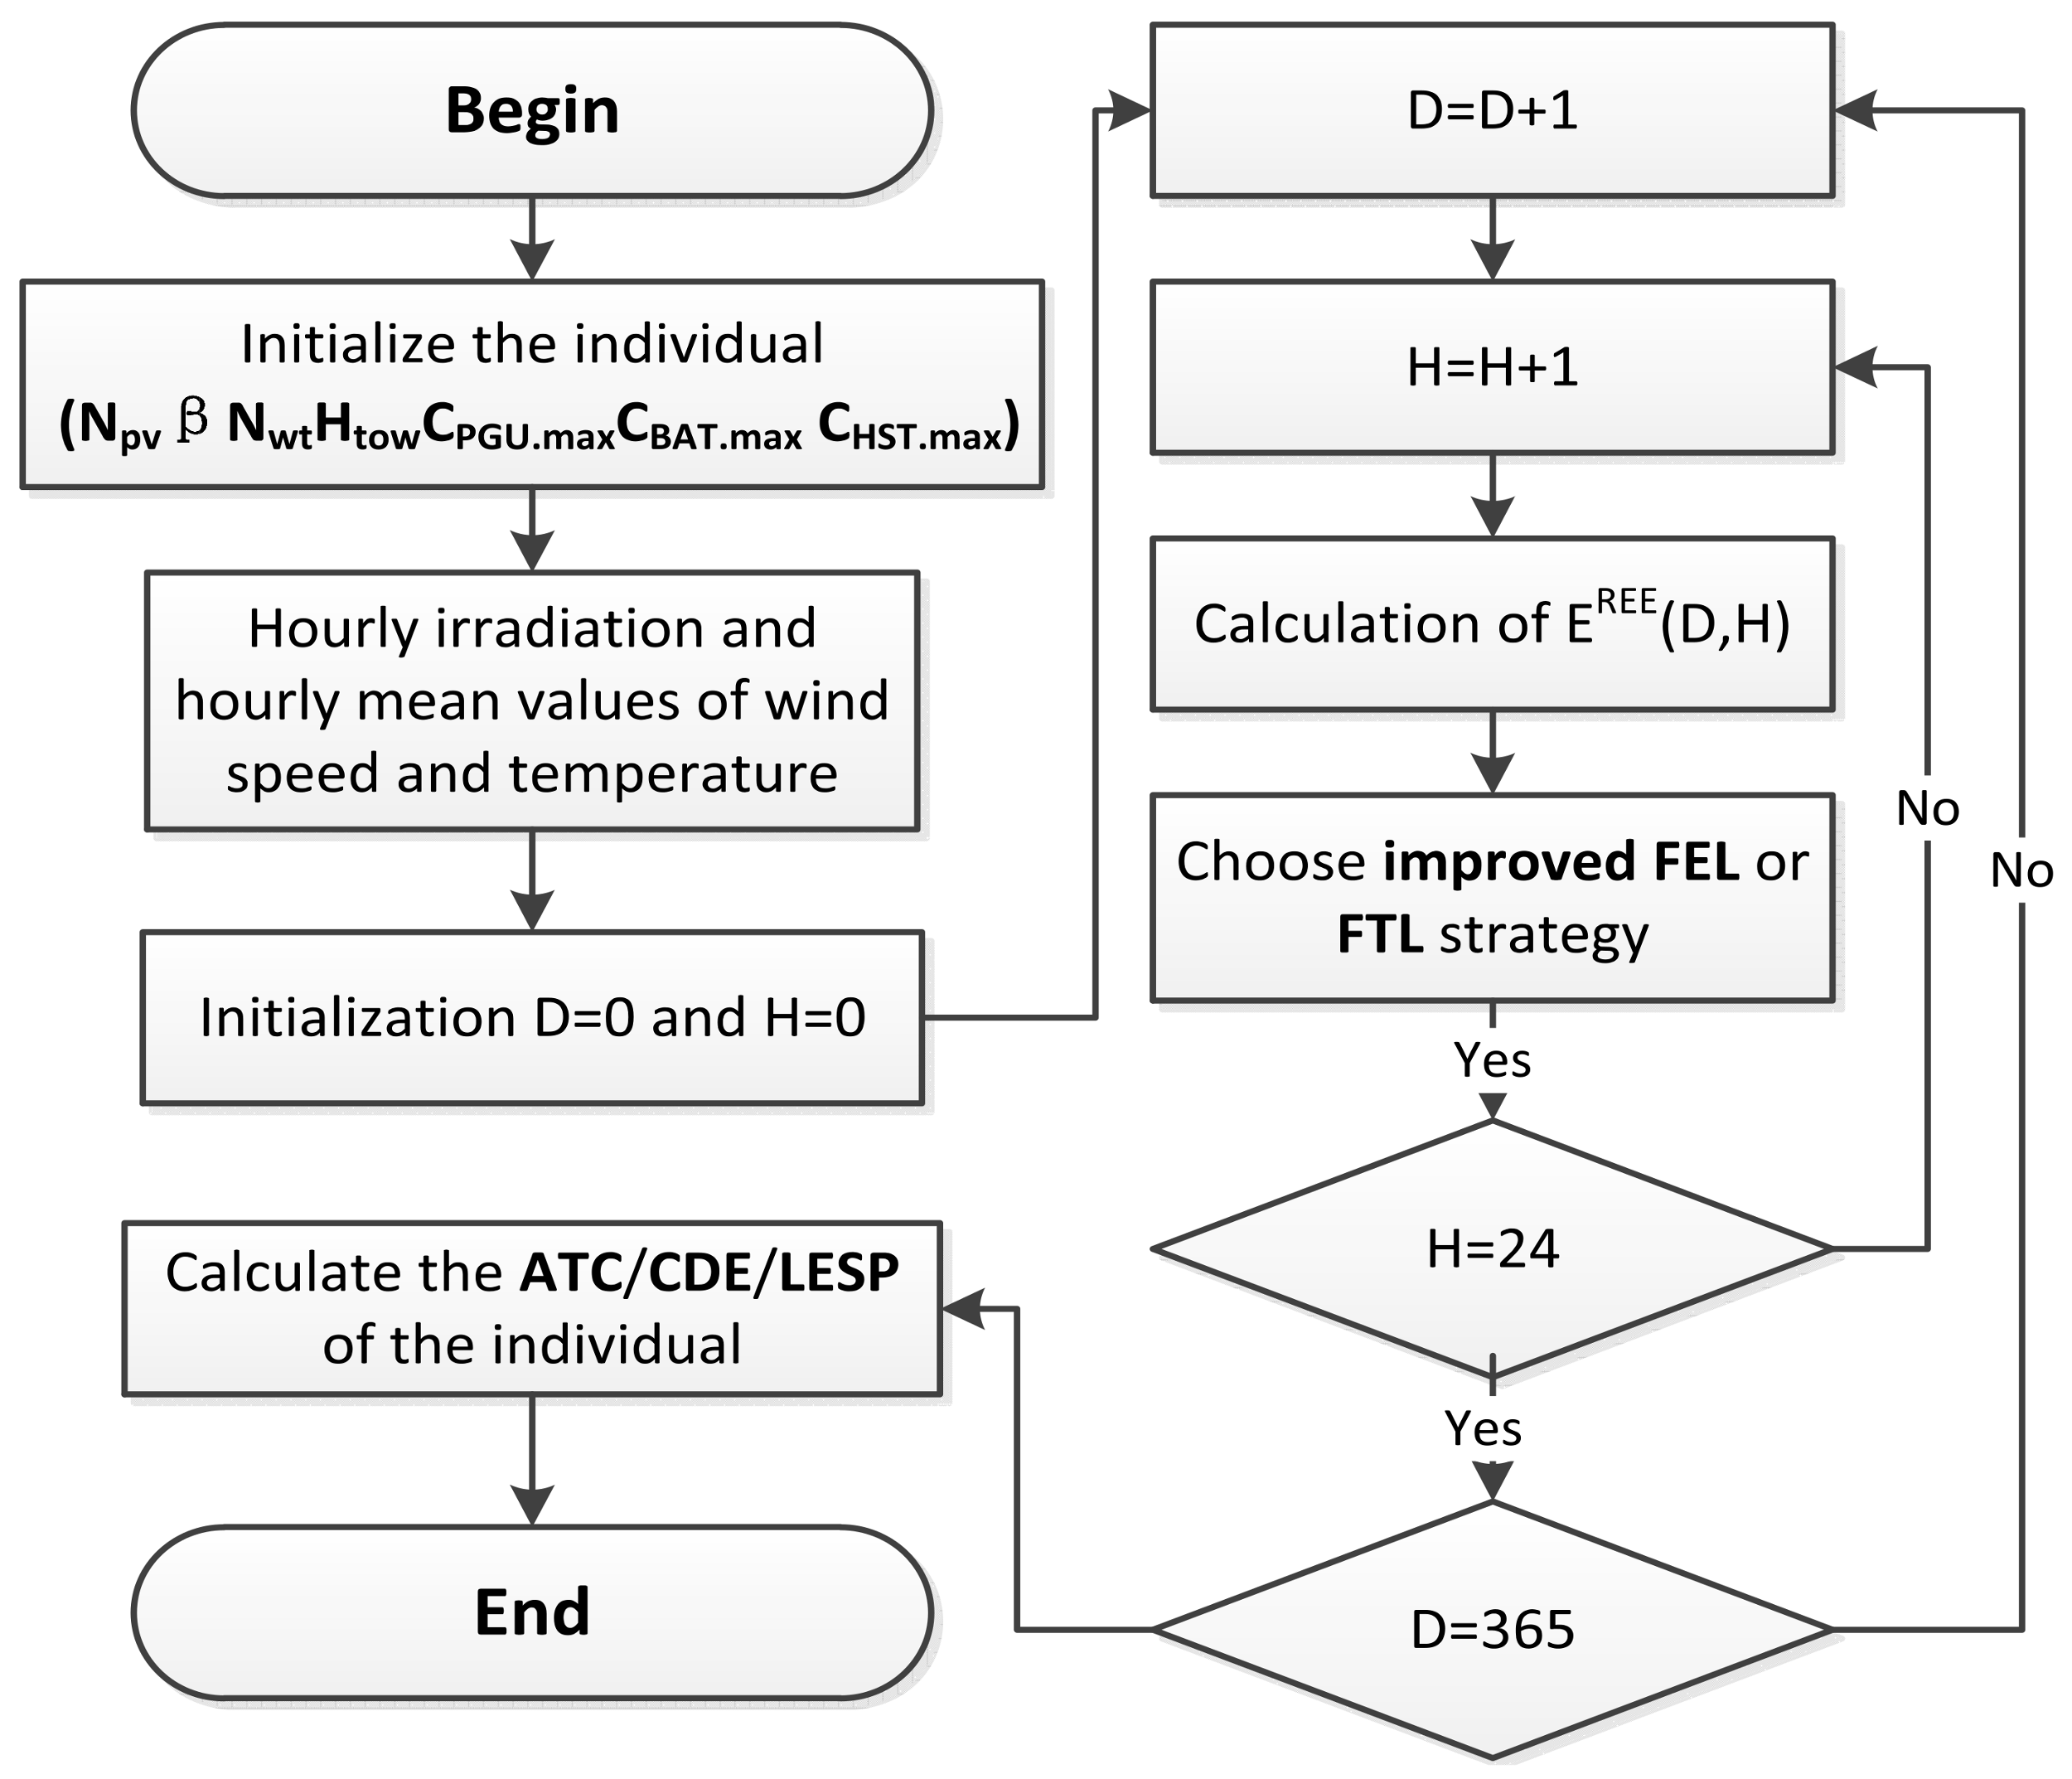
Figure 8.
Hourly mean values of meteorological conditions.

Figure 9.
Hourly electrical, cold, and heat demands in representative days.
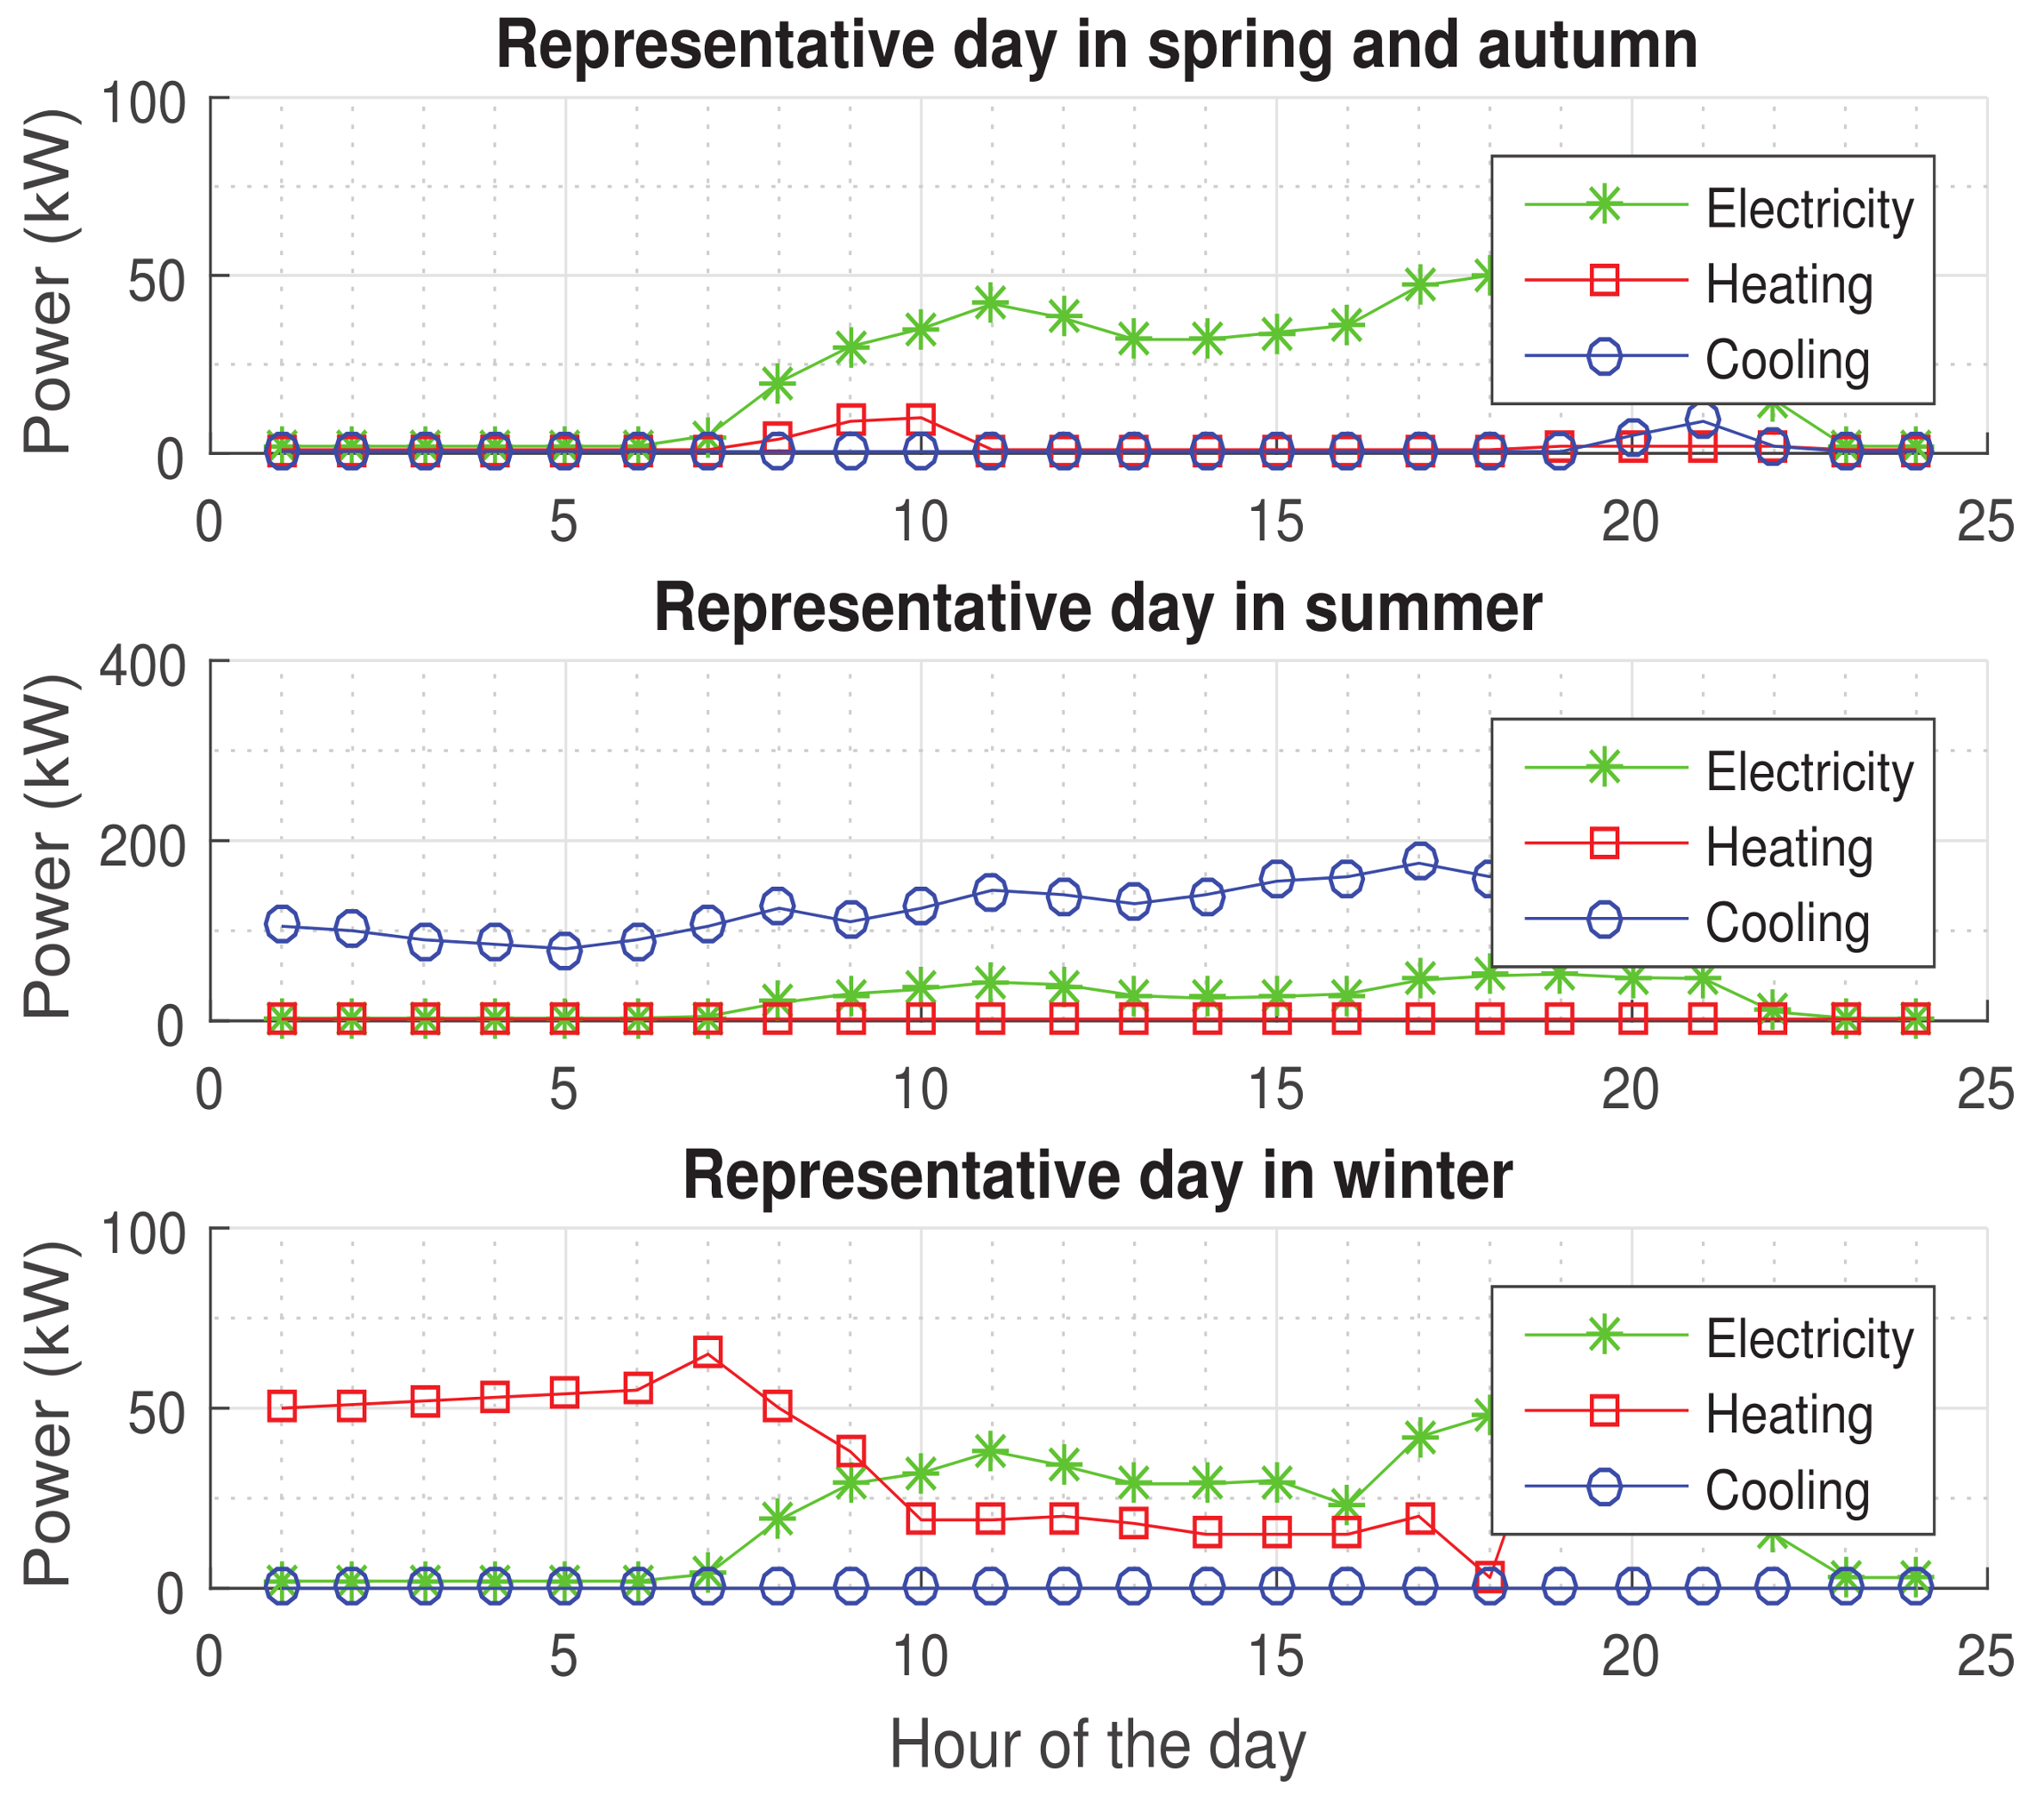
Figure 10.
RECCHP in FEL. ATC: annual total cost; CDE: carbon dioxide emission; LESP: loss of energy supply probability.
Figure 10.
RECCHP in FEL. ATC: annual total cost; CDE: carbon dioxide emission; LESP: loss of energy supply probability.

Figure 11.
RECCHP in FTL.
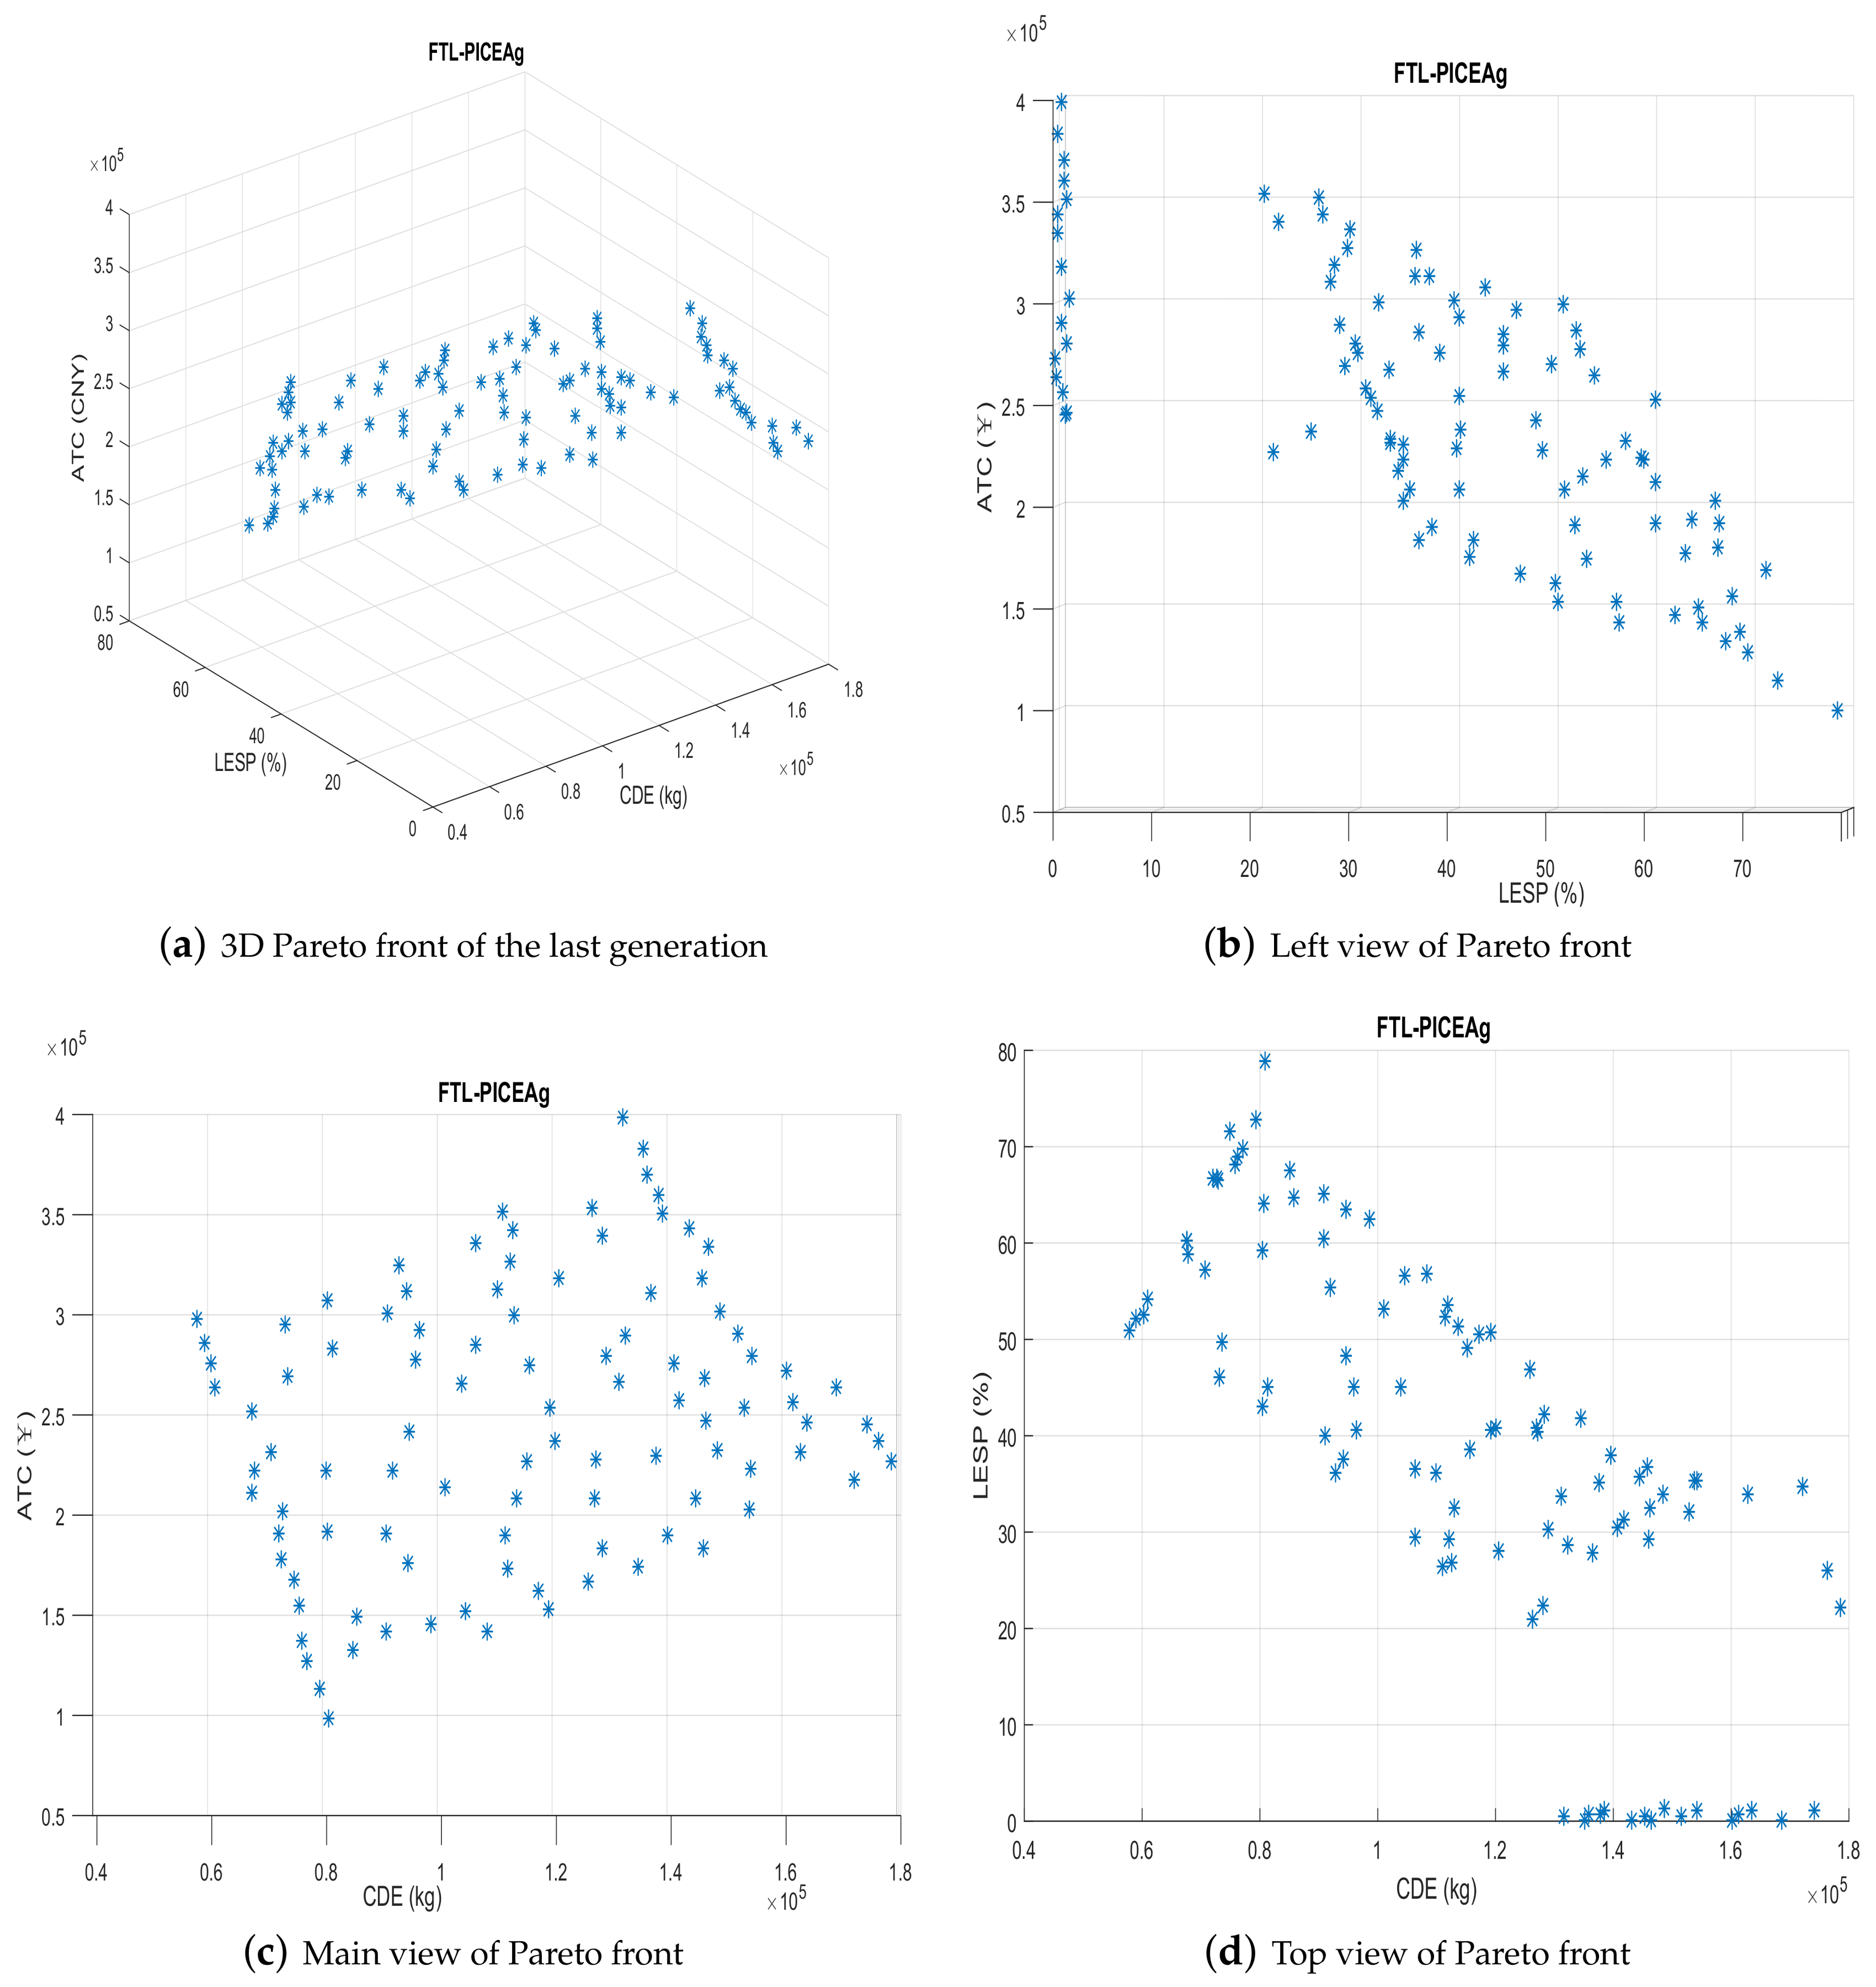
Figure 12.
RECCHP in FEL.
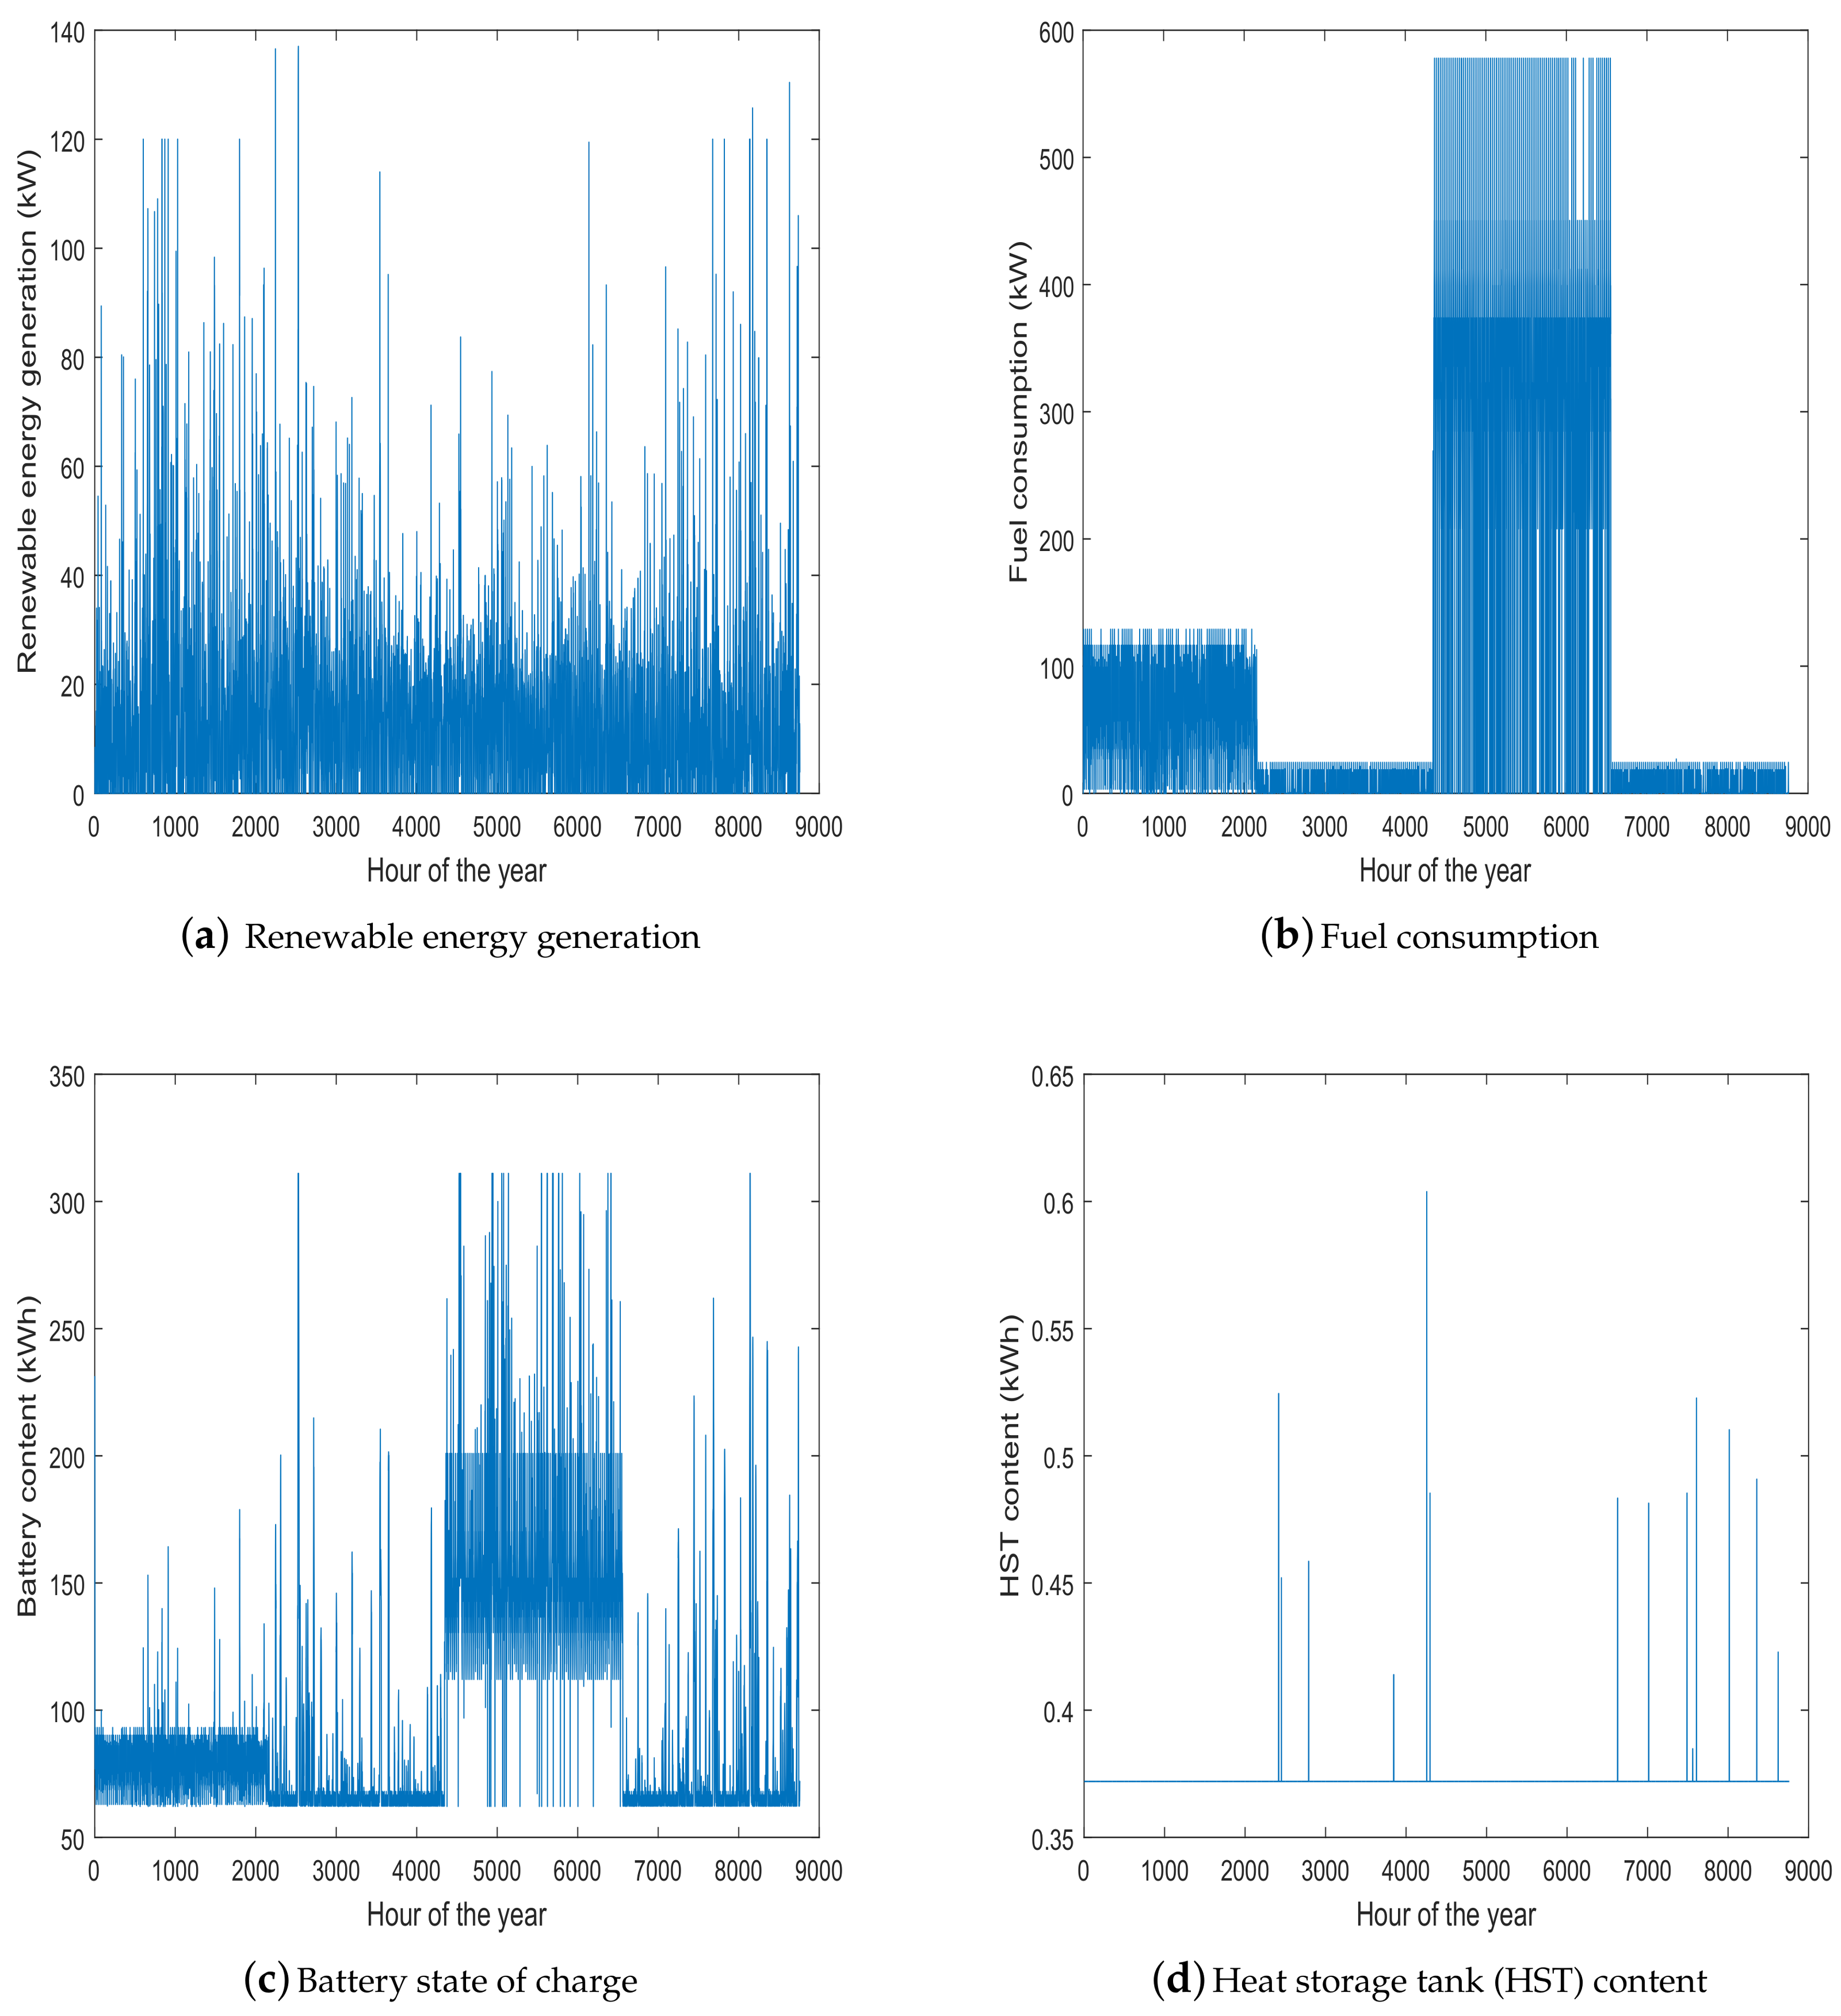
Figure 13.
RECCHP in FTL.

Table 1.
The specifications for the RECCHP system components. : coefficient of performance.
| Components | Lifetime (year) | & | ||
|---|---|---|---|---|
| PV panel | 1000 CNY | 0.05 CNY/h | 15 | 0.73 |
| Wind turbine | 30,000 CNY | 0.4 CNY/h | 15 | 0.4 |
| Wind tower | 2000 CNY/m | 0.1 CNY/m | 15 | Null |
| Battery | 200 CNY/kW | 0.2 CNY/kW·h | 5 | 0.8/0.8 (ch/dis) |
| Heat storage tank | 200 CNY/kW | 0.2 CNY/kW·h | 5 | 0.85/0.85 (in/out) |
| Electric boiler | 5500 CNY | 0.1 CNY/kW | 15 | 0.9 |
| Electric chiller | 9000 CNY | 0.1 CNY/kW | 15 | 3 |
| Absorption chiller | 64,000 CNY | 0.20 CNY/kW | 15 | 0.7 |
| Heating coil | 700 CNY | 0.24 CNY/kW | 15 | 0.9 |
| PGU | 3800 CNY/kW | 0.3 CNY/kW·h | 15 | 0.3 |
| Heat recovery system | 3000 CNY/kW | 0.2 CNY/kW·h | 15 | 0.8 |
Table 2.
Wind turbine modules specifications.
| 4 m/s | 14 m/s | 20 m/s | 12.59 m2 | 10 kW | 10 m | 1.29 kg/m3 | 0.143 |
Table 3.
PV modules specifications. NCOT: nominal cell operating temperature.
| NCOT | ||||||
|---|---|---|---|---|---|---|
| 7.22 A | 21 V | 17 | 6.47 | 0.95 | 0.95 | 43 °C |
Table 4.
Parameter settings of PICEA-g.
| Parameter | Value | Parameter | Value |
|---|---|---|---|
| Population size | 100 | Mutation probability | 0.01 |
| Evolutionary generations | 100 | Position parameter (k) | 18 |
| Crossover probability | 0.9 | Distance parameter (l) | 14 |
| Length of genes | 7 | Decision variables () | 32 |
Table 5.
Selected results using PICEA-g with specified preference.
| FEL | ||||||||||
| Solution | (m) | (kW·h) | (kW·h) | (kW·h) | (CNY) | LESP(%) | (kg) | |||
| 1 (ATC.opt) | 19 | 59 | 19 | 29 | 650 | 145 | 2 | 1.55 | 0 | 4.49 |
| 2 | 20 | 40 | 13 | 23 | 612 | 274.5 | 2 | 1.62 | 0 | 3.89 |
| 3 | 19 | 48 | 12 | 18 | 620 | 311 | 1.9 | 1.68 | 0 | 3.77 |
| FTL | ||||||||||
| 1 (ATC.opt) | 20 | 59 | 16 | 25 | 489.7 | 0.2 | 439.5 | 1.35 | 0 | 3.83 |
| 2 | 20 | 56 | 17 | 10 | 468.6 | 0 | 321 | 1.43 | 0.1 | 3.43 |
| 3 | 20 | 59 | 17 | 6 | 474.4 | 0.003 | 327 | 1.46 | 0.1 | 3.34 |
© 2018 by the authors. Licensee MDPI, Basel, Switzerland. This article is an open access article distributed under the terms and conditions of the Creative Commons Attribution (CC BY) license (http://creativecommons.org/licenses/by/4.0/).
Share and Cite
MDPI and ACS Style
Li, G.; Wang, R.; Zhang, T.; Ming, M. Multi-Objective Optimal Design of Renewable Energy Integrated CCHP System Using PICEA-g. Energies 2018, 11, 743. https://doi.org/10.3390/en11040743
AMA Style
Li G, Wang R, Zhang T, Ming M. Multi-Objective Optimal Design of Renewable Energy Integrated CCHP System Using PICEA-g. Energies. 2018; 11(4):743. https://doi.org/10.3390/en11040743
Chicago/Turabian StyleLi, Guozheng, Rui Wang, Tao Zhang, and Mengjun Ming. 2018. "Multi-Objective Optimal Design of Renewable Energy Integrated CCHP System Using PICEA-g" Energies 11, no. 4: 743. https://doi.org/10.3390/en11040743
Note that from the first issue of 2016, this journal uses article numbers instead of page numbers. See further details here.