Reliability Assessment of Wind Farm Electrical System Based on a Probability Transfer Technique


School of Electrical Engineering and Automation, Hefei University of Technology, Hefei 230009, China
*
Author to whom correspondence should be addressed.
Energies 2018, 11(4), 744; https://doi.org/10.3390/en11040744
Submission received: 25 February 2018
/
Revised: 22 March 2018
/
Accepted: 23 March 2018
/
Published: 25 March 2018
(This article belongs to the Section F: Electrical Engineering)
Abstract
:The electrical system of a wind farm has a significant influence on the wind farm reliability and electrical energy yield. The disconnect switch installed in an electrical system cannot only improve the operating flexibility, but also enhance the reliability for a wind farm. Therefore, this paper develops a probabilistic transfer technique for integrating the electrical topology structure, the isolation operation of disconnect switch, and stochastic failure of electrical equipment into the reliability assessment of wind farm electrical system. Firstly, as the traditional two-state reliability model of electrical equipment cannot consider the isolation operation, so the paper develops a three-state reliability model to replace the two-state model for incorporating the isolation operation. In addition, a proportion apportion technique is presented to evaluate the state probability. Secondly, this paper develops a probabilistic transfer technique based on the thoughts that through transfer the unreliability of electrical system to the energy transmission interruption of wind turbine generators (WTGs). Finally, some novel indices for describing the reliability of wind farm electrical system are designed, and the variance coefficient of the designed indices is used as a convergence criterion to determine the termination of the assessment process. The proposed technique is applied to the reliability assessment of a wind farm with the different topologies. The simulation results show that the proposed techniques are effective in practical applications.
1. Introduction
Wind energy, as a clean and renewable resource, has been widely exploited and utilized in the world [1]. With the encouragement of policy and the progress of wind power technology, the scale of wind farms is also becoming increasingly large. When compared with the traditional thermal power plant or the hydropower plant, the wind turbine generator (WTG) has the characteristics of small capacity, large number, and dispersed locations in a wind farm. Because of the positional dispersity of WTGs in a wind farm [2], the WTGs will be connected by transmission lines on the basis of a certain topology. The electrical system of a wind farm (WES) can be classified into different topology types [3], such as chain-type topology and ring-type topology. When compared with the ring-type topology, the chain-type topology has the characteristics of low cost and simple operation mode. Hence, the chain-type topology is widely used in the realistic wind farms. On the basis of different installing positions of disconnect switches, chain-type topology can be divided into chain-type I topology and chain-type II topology. However, the different topologies have different reliability levels. Therefore, an assessment approach needs to be developed for evaluating the reliability of wind farm electrical system with the consideration of electrical topology, stochastic equipment failure, and operation mode of switches.
Due to the intermittent and uncontrolled nature of wind speed, the energy yield of wind farm is also stochastic, and it has caused an important impact on the reliability of the wind-integrated power systems. Many literatures have discussed the reliability of the power system with the integration of wind farms [4,5,6]. A time-varying reliability assessment technique for short-term and medium-term reliability evaluation for power systems with a high penetration of wind power is proposed by Ding, Y. et al. [4]. Sulaeman, S. et al. [5] investigated an analytical technique to model the output of large wind farms for power system reliability assessment, and the variability of wind and random failures of WTGs are considered. An analytical method [6] is proposed for developing approximate wind models when time-synchronized wind data for two wind sites are not available. The above literatures have made helpful contributions for the development of the reliability theory of wind-integrated power systems. However, some factors that have affected the wind farm reliability are not discussed, such as the stochastic failure of electrical equipment, the operation mode of switches, and the connected type of electrical topology.
The topology type of electrical system has an important impact on the operation flexibility and the wind farm reliability [7]. Thus, the reasonable design of wind farm electrical system for power system planning and operation will be a valuable work. Some researchers have made the innovative contributions [7,8,9,10,11,12,13]. Quinonez-Varela, G. et al. [7] discussed a comparative analysis on the power loss, voltage level, and capital cost of WETs, and the advantages and disadvantages in terms of their steady-state performance and economics are analyzed. This literature has provided valuable contributions. However, the operation model of electrical switches is not considered into the reliability assessment. Lakshmanan, P. et al. [8] analyzed a technical and economic comparison between DC and AC collection systems of offshore wind farms. However, this literature dose not discuss the impact of disconnect switches on the reliability of a wind farm. Dahmani, O. et al. [9] demonstrated the optimization based on the genetic algorithm and the reliability based on the enumeration technique for obtaining the optimum topology of a wind farm. A section enumeration technique for assessing the reliability of wind farm electrical collector system is presented by Ref. [10]. Although the wind farm topology and the disconnect switch are considered, the used state enumeration technique [9,10] cannot easily calculate the reliability indices when the wind farm scale is considerable large. The optimal layout of WTGs in a wind farm is optimized by Yang, H.J. et al. [11], and the reliability of wind farm is also discussed. However, the electrical topology is not taken into account. Chen Y. et al. [12] and Wei, S. et al. [13] incorporate the electrical topology of a wind farm into the wind farm optimization, but the reliability of electrical system is not analyzed.
According to the above analysis, therefore, in order to consider the stochastic failure of electrical equipment, the operation mode of electrical switches, and the topology type of electrical system into the reliability assessment of a wind farm, this paper presents a probability transfer technique that is based on the thoughts that through transfer the unreliability of electrical system to the power transmission interruption of WTGs. The main works are demonstrated as follows. Firstly, a three-state reliability model of electrical equipment is established for replacing the exiting two-state reliability model, and a proportion allocation technique for calculating state probabilities of the three-state reliability model is presented. Secondly, the proposed probability transfer technique will be introduced. Finally, novel indices for describing the reliability of wind farm electrical system are designed, and the variance coefficient is used as a convergence criterion. The proposed technique in this paper is applied to the reliability assessment of wind farm with the chain-type I topology and chain-type II topology.
The contribution of this paper are concluded, as follows.
- (1)
- A probability transfer technique is developed for incorporating the stochastic failure of electrical equipment, the operation mode of switches, and the connected type of electrical topology into the reliability of wind farm electrical system. This method is through transferring the stochastic failure of electrical system to the power transmission interruption of wind turbine generators.
- (2)
- A three-state reliability model of electrical equipment is established to replace the existing two-state model for considering the impact of disconnect switch on the wind farm reliability.
- (3)
- A proportion apportion technique is presented to calculate the state probabilities of electrical equipment, including the normal state, the isolation state, and the maintenance state.
- (4)
- Some novel reliability indices of wind farm electrical system are designed to describe the influence of the electrical topology structure, the operation mode of electrical switches, and stochastic failure of electrical equipment.
The remainder of the paper is organized as follows. Section 2 describes basic wind power sampling model. Section 3 analyzes the reliability model of electrical equipment based on a proportion allocation method. Section 4 analyzes the reliability assessment of wind farm electrical system based on the proposed method. The case studies are discussed in Section 5. The paper is summarized in Section 6.
2. Wind Power Sampling Model
The probability density and distribution of Weibull distribution [14,15] are described by
where ws is hourly wind speed, and α and β are the scale and shape parameters, respectively [16].
The simulated power output of WTG [17,18] can be determined by
where Pr, vci, vr, and vco are the rated power output, cut-in speed, rated speed, and cut-out wind speed, respectively.
Let R represent a random variable that has a uniform distribution in [0, 1], and F(ws) be the probability distribution of wind speed. The power output of wind farm can be simulated by:
- Step1:
- Generate a random variable R, which is uniformly distributed in the interval [0, 1].
- Step2:
- Model the inverse function F−1(R) of probability distribution F(ws), and simulate the hourly wind speed by
Because F(ws) has a uniform distribution in [0, 1], 1−F(ws) also has a uniform distribution in [0, 1]. Therefore, 1−F(ws) in Equation (4) can be replaced by R.
- Step3:
- Calculate the power output of wind farm according to the simulated wind speed ws and the wind power curve.
- Step4:
- Repeat the above steps until the simulated sample size meets the assessment requirement.
3. Reliability Model of Electrical Equipment Based on a Proportion Allocation Method
3.1. Reliability Equivalence of Multiple Pieces of Equipment
In this paper, the reliability equivalence method can be described as follows:
- Disconnect all of the circuit breakers and disconnect switches.
- Find potentially equivalent devices using the Depth-First Search algorithm (DFS) [19] from each initial point, in which the initial point covers each circuit breaker and each disconnect switch in the topology.
- Calculate the equivalent failure rate λes and the equivalent repair time γes of the equivalent area bywhere Φs is a set of the sth boundary area, and λj and γj are the failure rate and repair time, respectively, of the jth equipment in Φs.
A simple wind power electrical system as an example is depicted in Figure 1. When all of the electrical switches are disconnected, the set Φi as an arbitrarily chosen set will become an equivalent set, which covers 3 components (j = 1, 2 and 3). Φk is another equivalent set.
3.2. Three-State Reliability Model of Electrical Equipment
The states of electrical equipment, generally, can be depicted using the state space diagram with a two-state model [20,21]. However, when the switching action is considered in reliability analysis, the two-state model is inadequate to describe the operation mode. Therefore, a three-state reliability model of electrical equipment is presented for the reliability assessment, as shown in Figure 2a. In Figure 2a, the variables λf, λds, and μm are the failure rate, the isolation rate, and the maintenance rate, respectively.
The time series process of state transition diagram is depicted in Figure 2b. Let tds denote the duration of the isolation state and tre denote the duration of the maintenance state. In Figure 2b, t1 represents the moment at which a failure occurs, t2 is the moment at which a piece of failed equipment is completely isolated, and t3 is the moment at which a piece of failed equipment is completely restored. Mttf is the mean time to failure, which can be obtained directly by statistical data. Si (i = 1, 2, and 3) represents the normal state, the isolation state, and the maintenance state, respectively. The failure reate λf (f/yr), isolation rate λds (f/yr), and repair rate μm (f/yr) for ith equipment can be determined by
where Tyr is the annual hours (generally, Tyr = 8760).
3.3. State Probability of Electrical Equipment Based on a Proportion Allocation Method
Assume that pNs(i), pOs(i), pIs(i), and pMs(i) denote state probabilities in the normal state, the outage state, the isolation state, and the maintenance state, respectively. To further decrease the complexity, a proportion allocation technique is proposed to directly calculate the state probabilities by
4. Reliability Assessment of a Wind Farm Electrical System Based on a Probability Transfer Technique
4.1. The Probability Transfer Technique for Reliability Assessment
The three-state reliability model introduced in Section 3 is to analyze the state probabilities for a single piece of electrical equipment. This section, however, presents an analysis of the state probabilities for the entire electrical system of wind farm, which is comprised of all the electrical equipment in a wind farm.
Figure 3 is taken as an example to describe the thoughts of the proposed technique. The probabilistic transfer technique is based on the thoughts that through transfer the unreliability of electrical system to the energy transmission interruption of WTGs. In Figure 3, there are six electrical equipment in a wind farm, and 0 and 1 denote the failed equipment and the normal equipment. “Yes” and “No” represent whether the energy transmission of a certain WTG is interrupted. Based on the introduced simulation technique, firstly, the operation states of all equipment are simulated based on their unavailability. Then, transfer the unreliability of electrical system to the energy transmission interruption of WTGs based on the Table 1. Finally, combining the wind speed data, the computation and analysis process is demonstrated for the ith iteration as follows:
- Analysis of the normal state of wind farm electrical system (WES)
When the states of all equipment in a WES are sampled in a normal state, this WES is in a normal state. Next, the deep first search is used to search the number of grid-connected WTGs under the normal state. Assume that Kn denotes the searched number of grid-connected WTGs, and Nwf denotes the total number of WTGs that are installed in a wind farm. When the WES is in a normal state, all of the WTGs of the wind farm are grid-connected, namely, Kn = Nwf. Let Fa(n, Kn) denote the average occurrence frequency of having Kn number of grid-connected WTGs during the nth iteration process. Thus, Fa(n, Kn) is calculated by
- Analysis of the isolation state of wind farm electrical system
The isolation state of WES is from the moment of the occurrence of equipment’s failure to the moment of the failed equipment being isolated. After the WES state is sampled as an isolation state, the number of grid-connected WTGs is determined by the deep first search.
Let Ln denote the searched number of grid-connected WTGs in the isolation state of WES during the nth iteration process and Fa(n, Ln) denote the average occurrence frequency of having Ln number of grid-connected WTGs during the nth iteration process. Thus, Fa(n, Ln) is calculated by
- Analysis of the maintenance state of wind farm electrical system
The maintenance state of WES is from the moment the failed component is isolated to the moment the failed component is repaired. After the WES state is sampled as a maintenance state, the number of grid-connected WTGs is determined by the deep first search.
Let Mn denote the searched number of the grid-connected WTGs in the maintenance state of WES during the nth iteration process and Fa(n, Mn) denote the average occurrence frequency of having Mn number of grid-connected WTGs during the nth iteration process. Thus, Fa(n, Mn) is calculated by
- The cumulative average occurrence frequency
Let N denote the potential number of grid-connected WTGs, where N = 0, 1, 2, …, Nwf. Fa(N) is the cumulative average occurrence frequency with N grid-connected WTGs. After the analysis of the normal state, the isolation state, and the maintenance state, the cumulative average times Fa(N) is calculated by Equation (15). Repeat the above sampling analysis until it converges.
4.2. Convergence Criterion
This paper takes the number of equivalent grid-connected WTGs as a random variable, and the variance coefficient used as the convergence criterion is given by
where η is the variance coefficient; Na(i) is the average number of grid-connected WTGs in a single sampling state; Ep is the average number of grid-connected WTGs in n sampling states; and, δ(Ep) is the mean of the sample variance.
4.3. Discrete Probability Distribution of Grid-Connected WTGs
Assume that Ns is the total number of system sampling states after the convergence criterion is satisfied. The cumulative average occurrence frequency and the corresponding probabilities for any number of grid-connected WTGs can be calculated. The cumulative average occurrence frequency and the probabilities of grid-connected WTGs are shown in Table 2.
4.4. Defining Reliability Indices of Wind Farm
This paper has discussed the reliability assessment method of wind farm electrical system. In order to effectively describe the reliability of wind farm electrical system, some novel reliability indices are designed.
- Average system availability index, ASAI (%)
This index is designed to describe the availability of wind farm electrical system. The stochastic failure of electrical equipment and the electrical topology structure have been incorporated into this index. The theoretical range of ASAI’s values is from 0% to 100%. The larger the value, the more reliable the wind farm.
- Average system unavailability index, ASUI (%)
This index is related to the ASAI. It denotes the unavailability of wind farm electrical system.
- Average energy not generated index, AEGN (MWh/yr.)
This index is designed to reflect the influence of electrical system’s unreliability in a wind farm on the wind electrical energy yield.
where and are the average power output of a wind farm with and without the consideration of the failure of wind farm electrical system, respectively.
- Average interrupted WTGs number index, AIWN
This index is designed to describe the number of WTGs interruption that is caused by the unreliability of electrical topology.
- Average annual generation energy index, AAGE (MWh/yr.)
The AAGE denotes the average annual yielded energy of a wind farm while considering both the wind resource nature and the unreliability of electrical system.
where Sn is the number of states of wind farm power output; Pwfi is the ith state power; and, pwf(Pwfi) is the corresponding probability of Pwfi.
- Wind farm generation efficiency index, WFGE (%)
The WFGE denotes the generation efficiency when considering both the wind resource nature and the unreliability of electrical system.
The algorithm flowchart of the reliability assessment of wind farm electrical system is described in Figure 4.
5. Case Studies
5.1. Basic Data Used in the Case Studies
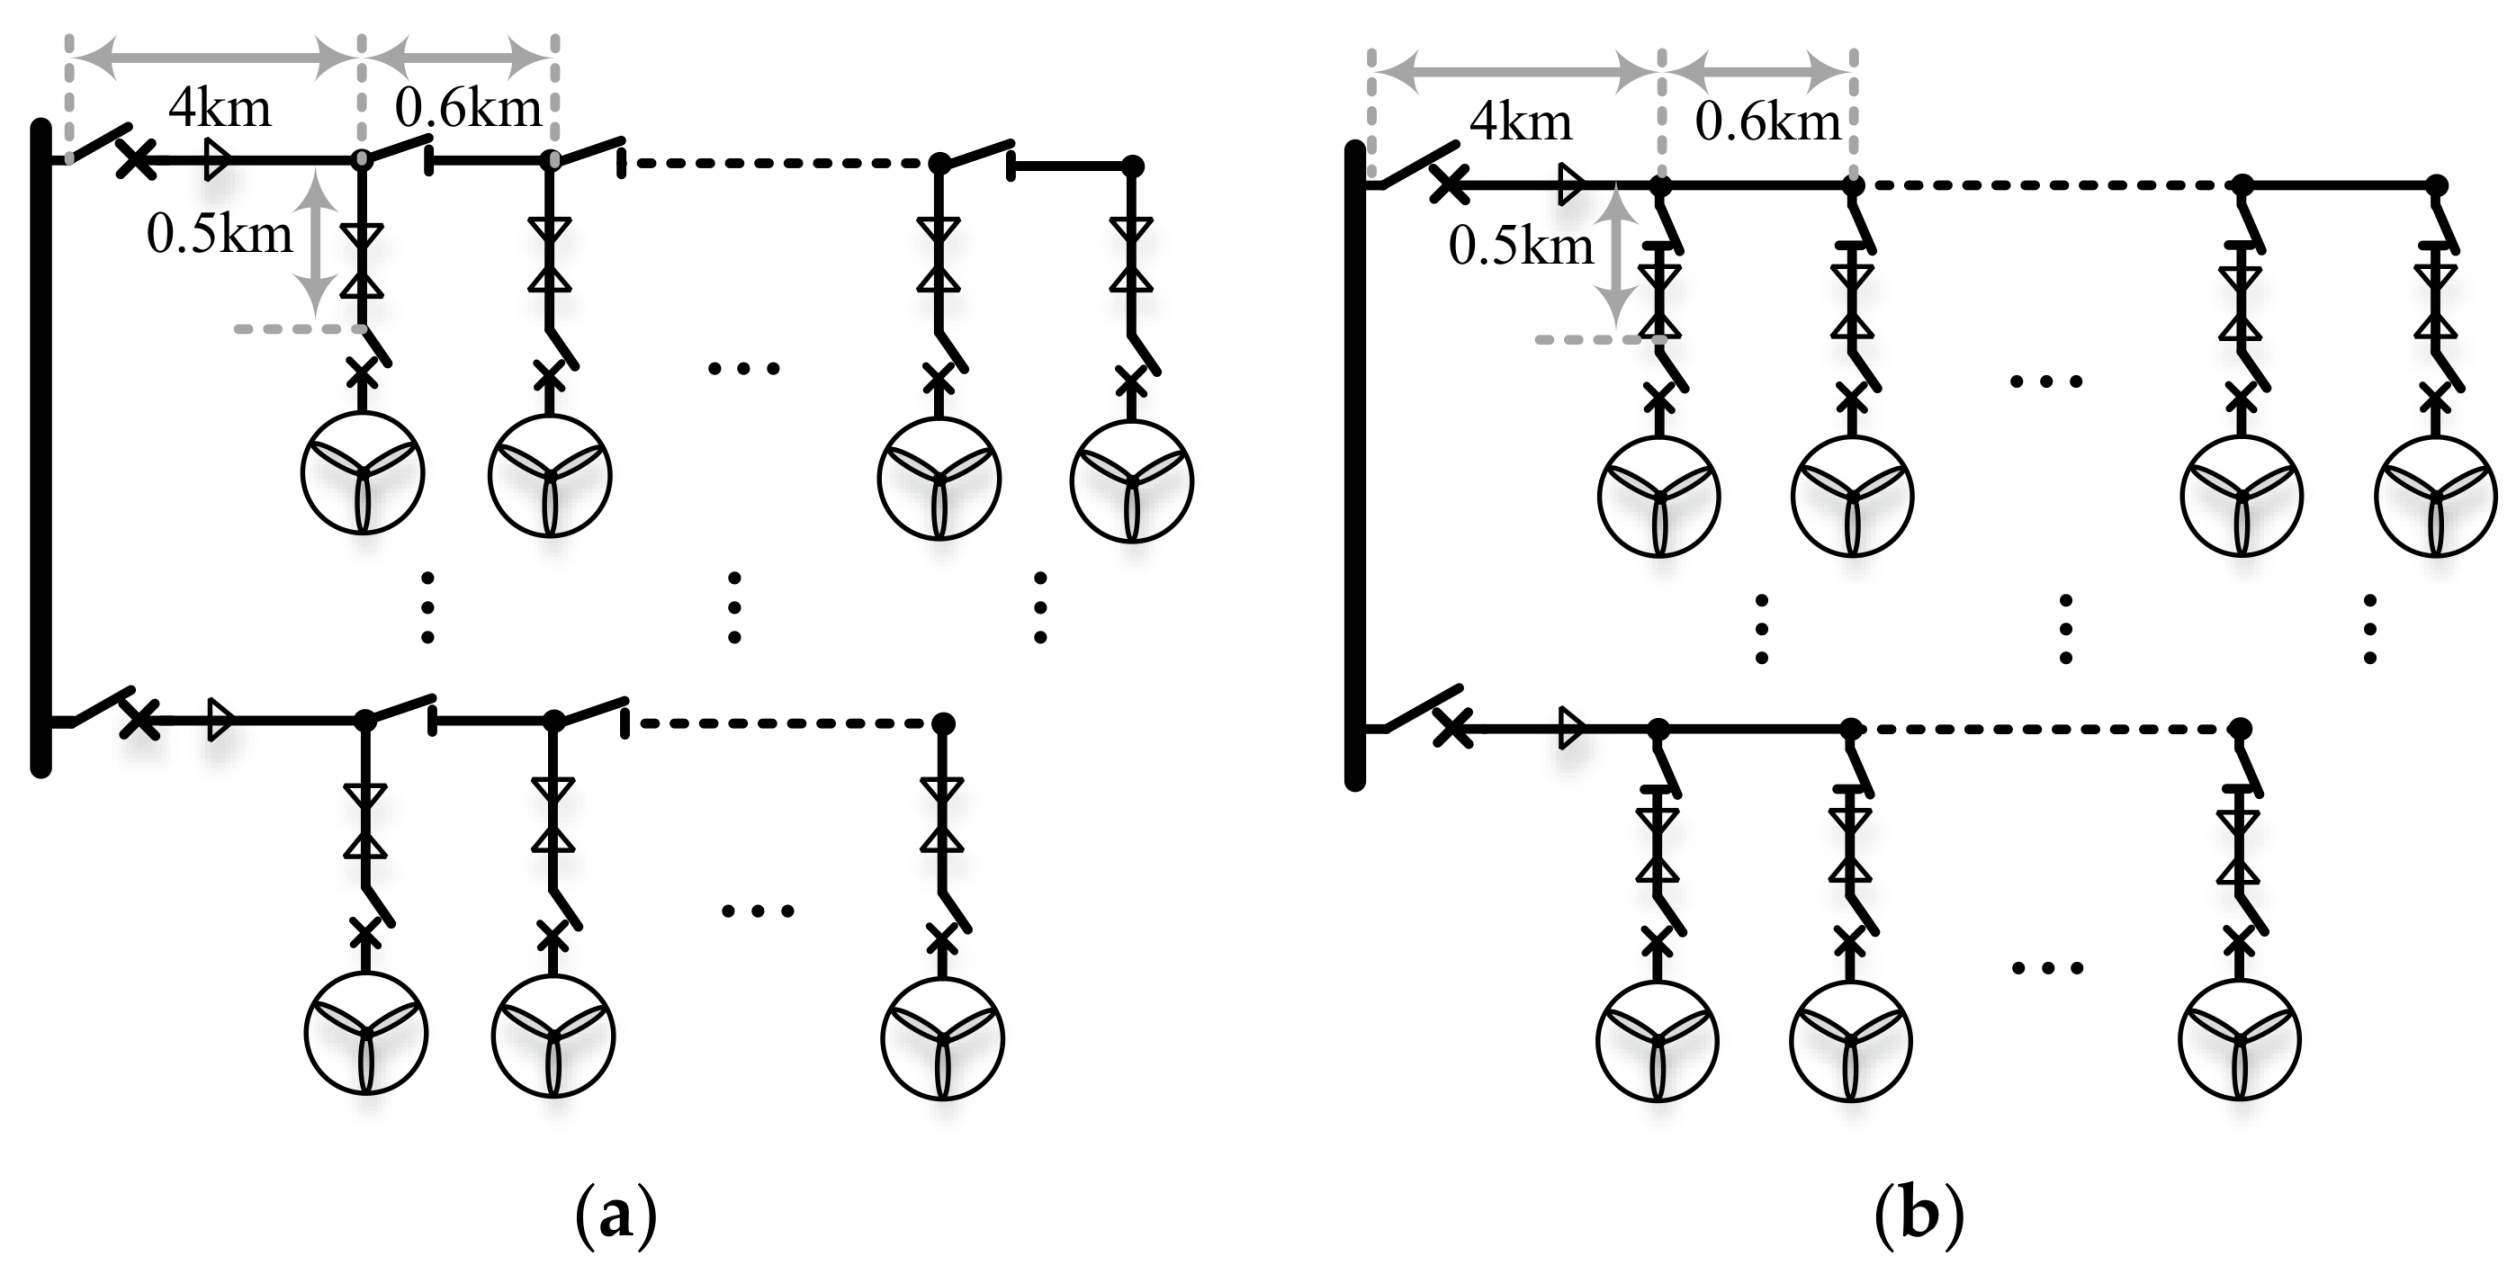
Figure 5a,b depict two simplified chain-type topologies, i.e., chain-type I and chain-type II, respectively. The difference between the two topologies is that disconnect switches are installed at different positions. In chain-type I, disconnect switches are installed on the main feeders, and disconnect switches are arranged on branch feeders in chain-type II.
In these case studies, it is assumed that there are 12 main feeders and 96 WTGs in a wind farm, and the number of main feeders with 10 WTGs, seven WTGs, and six WTGs in the wind farm are five, four, and three, respectively. The WTGs are arranged uniformly in the wind farm. In fact, the proposed approach can not only assess the reliability of a wind farm with a uniform layout but also assess that with a non-uniform layout. The length of all feeders is displayed in Figure 5.
In this paper, the measured wind speed data [22] is used to estimate the parameters of the Weibull model. The scale parameter α and shape parameter β of Weibull model are 5.7085 and 1.7746, respectively. The statistical characteristics of simulated wind speed data and measured wind speed data are compared in Table 3. The cut-in, rated, and cut-out wind speeds are 4 m/s, 12 m/s, and 25 m/s, respectively [23]. The rated power output of the used WTG is 2 MW.
5.2. Reliability Analysis of Wind Farm Electrical Topology
5.2.1. Reliability Assessment of Wind Farm Electrical Topology
Four scenarios will be designed for the case studies according to whether the WTGs’ failure is considered into the reliability assessment. The scenarios are shown in Table 5.
The reliability indices of the four scenarios (i.e., the Case I, Case II, Case III, and Case IV) are listed in Table 6.
As shown in Table 6, when the failure of WTGs is not considered into the reliability assessment, the ASAI (Average system availability index) of the wind farm with chain-type I and chain-type II are 98.023% and 97.840%, respectively. The ASAI of chain-type I is 0.183%, which is slightly higher than that of the chain-type II. When the failure of WTGs is considered, the ASAI indices with chain-type I and chain-type II are 88.852% and 88.683%, respectively. The ASAI of chain-type I is 0.168%, which is slightly higher than that of chain-type II. The data shows that the chain-type I has a higher reliability level than the chain-type II. The reason of differences is that disconnect switches installed in a main feeder can isolate the failure of main feeder and recover the involved no-failure WTGs to continue yielding energy. While, if disconnect switches are installed in a branch feeder, once the main feeder fails, all of the WTGs connected to the feeder must stop yielding energy. Therefore, the electrical topology with the chain-type I is suggested to take priority in a wind farm planning.
For the same topology type, when considering and ignoring the failure of WTGs, there is a difference of 9.172% in the ASAI of chain-type I. For chain-type II, the difference is 9.157%. The differences are contributed by the unreliability of WTGs. A similar method can be used to analyze the ASUI index (Average Topology Unavailability Index). In addition to the ASAI and ASUI, the Average Interrupted WTGs Number index (AIWN) is also defined in this paper. When considering and ignoring the failure of WTGs, there is a difference of 8.803 in the AIWN of chain-type I. For chain-type II, the difference is 8.790. Because of the failure of WTGs, the AIWN index of chain-type I will change from 1.9 to 10.703, and the AIWN index of chain-type II will change from 2.074 to 10.864. Regarding the AIWN index, the reliability level of chain-type I is still higher than that of chain-type II under the same conditions. The AENG (Average Energy Not Generated Index of WTG) index can be calculated according to the simulated wind speed data and the WTG type that is used in this paper. For The AENG index, when the failure of WTGs is not considered, the AEGN indices of chain-type I and chain-type II are 99.834 MWh and 109.089 MWh, respectively, and they account for approximately 2.02% and 2.21%, respectively, of the annual energy output of the whole wind farm.
According to the above analysis, the reliability of chain-type I is slightly higher than that of chain-type II, and all indices have a consistent conclusion.
5.2.2. Probability Distribution of Multistate WTGs Number in a Wind Farm
The paper first simulates the states of transmission lines, transformers, WTGs, and wind speed data. Next, the grid-connected WTGs number, the interrupted WTGs number, and their corresponding probabilities are assessed using the proposed technique. Taking Case II and Case IV as examples, Figure 6a depicts the probability distribution of grid-connected WTGs number. Figure 6b depicts the probability distribution of grid-connected WTGs number.
Figure 6a shows the difference between the probability distribution of grid-connected WTGs number of chain-type I and that of chain-type II. The average number of grid-connected WTGs for Case II and Case IV are 85.297 and 85.136, respectively, and the average number of interrupted WTGs are 10.703 and 10.864, respectively. The grid-connected WTGs number and interrupted WTGs number with a maximum probability are 87 and 9, respectively. If the failure of WTGs is not considered, then the average number of grid-connected WTGs for Case II and Case IV are 94.10 and 93.93, respectively.
The proposed approach can directly display the probability distribution of WTGs number in a wind farm, and the probability distribution characteristic that is shown in Figure 6 can efficiently describe the reliability of wind farm electrical system. The results verify that the chain-type I has a higher reliability level than the chain-type II. In addition, the stochastic failure of WTGs has a relatively large influence on the reliability of wind farm. Therefore, the WTGs’ failure should be considered into the reliability analysis of wind farm electrical system.
5.2.3. Influence of the Failure Rate of Transmission Line on Wind Farm Reliability
The above analysis is implemented under the condition of the transmission line failure rate of 0.015. However, the failure rate of the transmission line is influenced by a number of factors. In addition to internal factors of wind farm (such as quality of transmission line, and type of transmission line), external factors (such as weather condition and terrain) also affect the failure rate of transmission line. Therefore, the failure rate of transmission line in a wind farm is not always constant. Thus, this section focuses on the analysis of the impact of different failure rates on the reliability of wind farm electrical system. Taking Case II and Case IV as examples, the variation of failure rates is from 0.01 to 0.10, and the corresponding results are shown in Figure 7 and Figure 8.
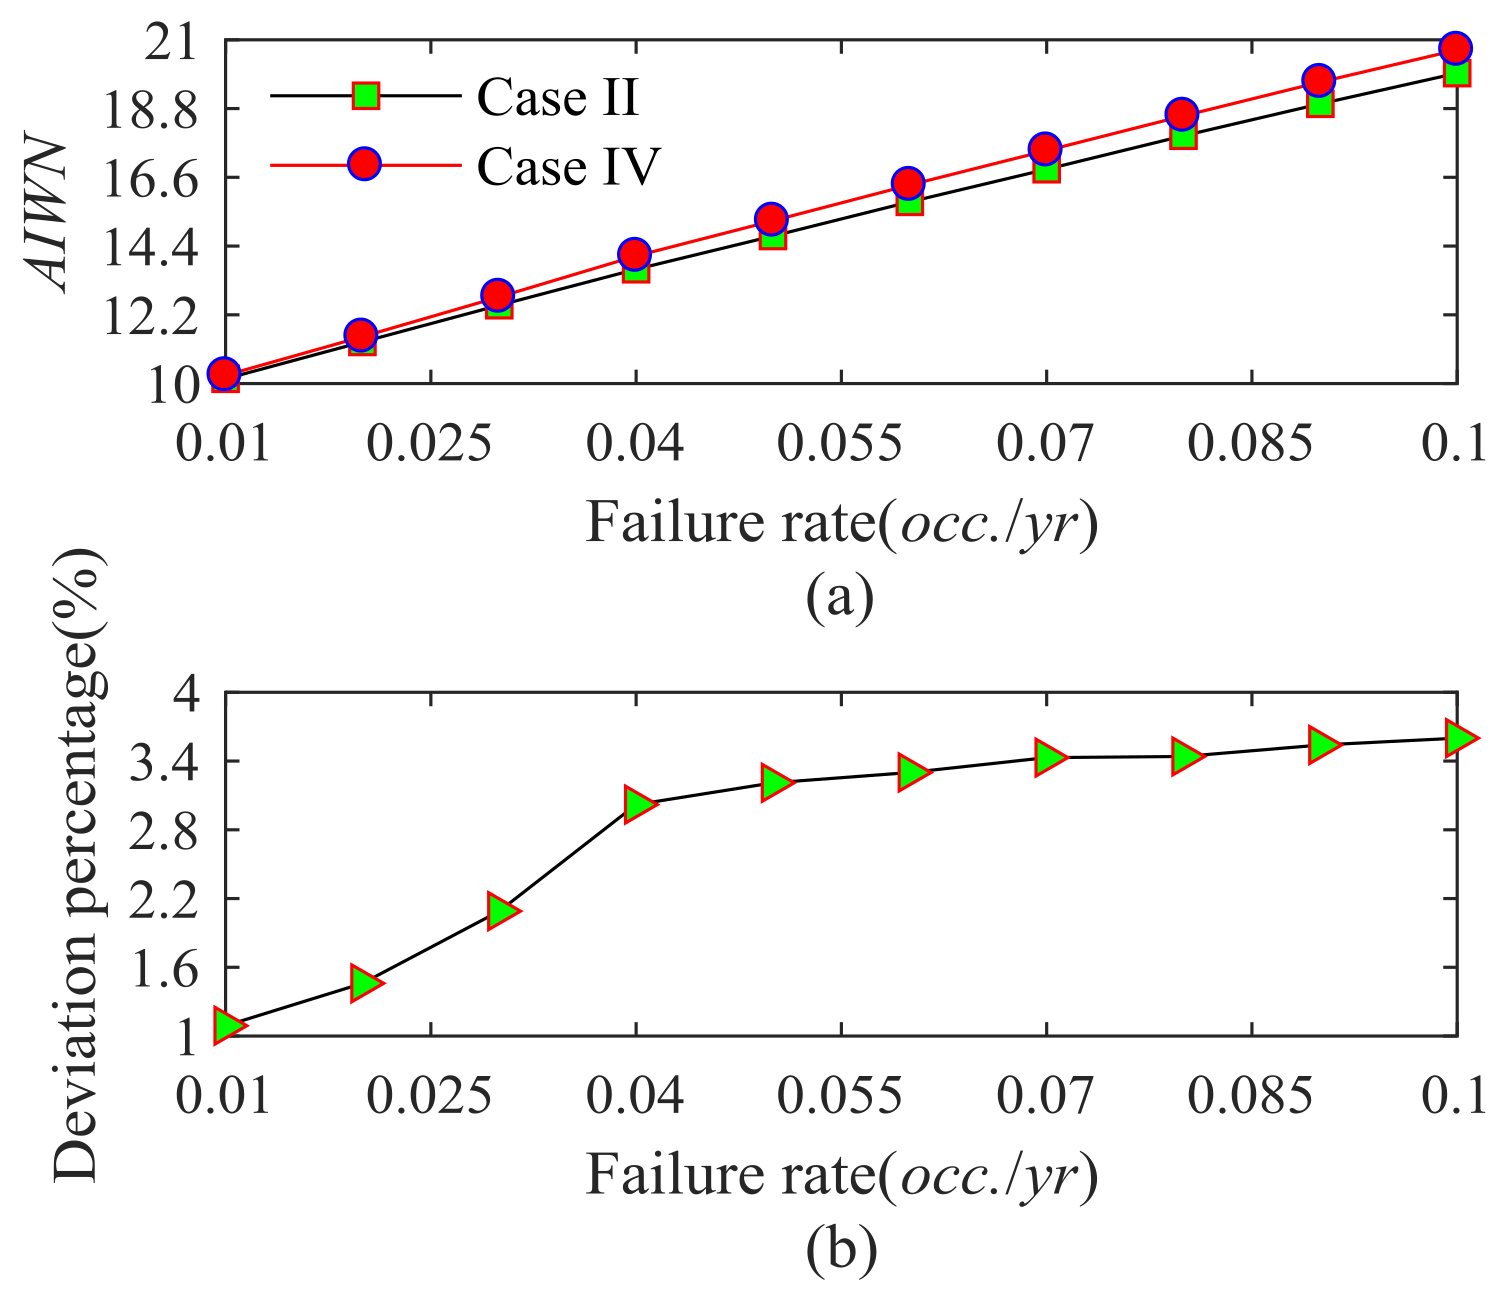
From Figure 7a, the reliability index ASAI (Average system availability index) of chain-type I (Case II) and chain-type II (Case IV) linearly decreased with the increasing failure rate of transmission line. The chain-type I is always located above chain-type II. From Figure 7b, the absolute deviation percentage between chain-type I and chain-type II for ASAI is gradually increasing with the increasing failure rate of transmission line. From Figure 8a, index AIWN (Average interrupted WTGs number index) of chain-type I (Case II) and chain-type II (Case IV) linearly increased with the increasing failure rate of transmission line. The chain-type I is always below chain-type II. From Figure 8b, the absolute deviation percentage between chain-type I and chain-type II for AIWN is gradually increasing with the increasing failure rate of transmission line.
Therefore, this phenomenon further proved that the reliability level of chain-type I is higher than that of chain-type II, and, with the increase of failure rate, the advantage of chain-type I is increasingly obvious. Improving the reliability of transmission line can effectively enhance the wind farm reliability.
5.2.4. Influence of Disconnect Switches on Wind Farm Reliability under Different Failure Rates
In this section, Case II is taken as an example to be analyzed. The proposed technique will be applied to the reliability assessment of wind farm with or without the consideration of the isolation operation of disconnect switches. The index variations of ASAI and AIWN with different failure rates of transmission line are shown in Figure 9 and Figure 10.
Figure 9a and Figure 10a show an obvious difference in the reliability indices between the cases of with and without the isolation operation of disconnect switches, and the difference is increasing as the failure rate of the transmission line increases. Figure 9b and Figure 10b describe the absolute deviation percentage related to the ASAI index and AIWN index. In Figure 9, the maximum and minimum difference in ASAI index between with and without the isolation operation are about 0.62 and 5.15, respectively, and the corresponding deviation percentages are 0.69% and 6.95%, respectively. In Figure 10, the maximum and minimum difference in AIWN index between with and without the isolation operation are approximately 0.59 and 4.94, respectively, and the corresponding deviation percentages are 10.74% and 19.87%, respectively.
Therefore, the analysis results reveal that, when the failure rate of the transmission lines is relatively small, the disconnected switches have an insignificant impact; however, when the failure rate of transmission lines is relatively large, ignoring the isolation operation of disconnect switches will cause great error.
5.2.5. Convergence Criterion Analysis
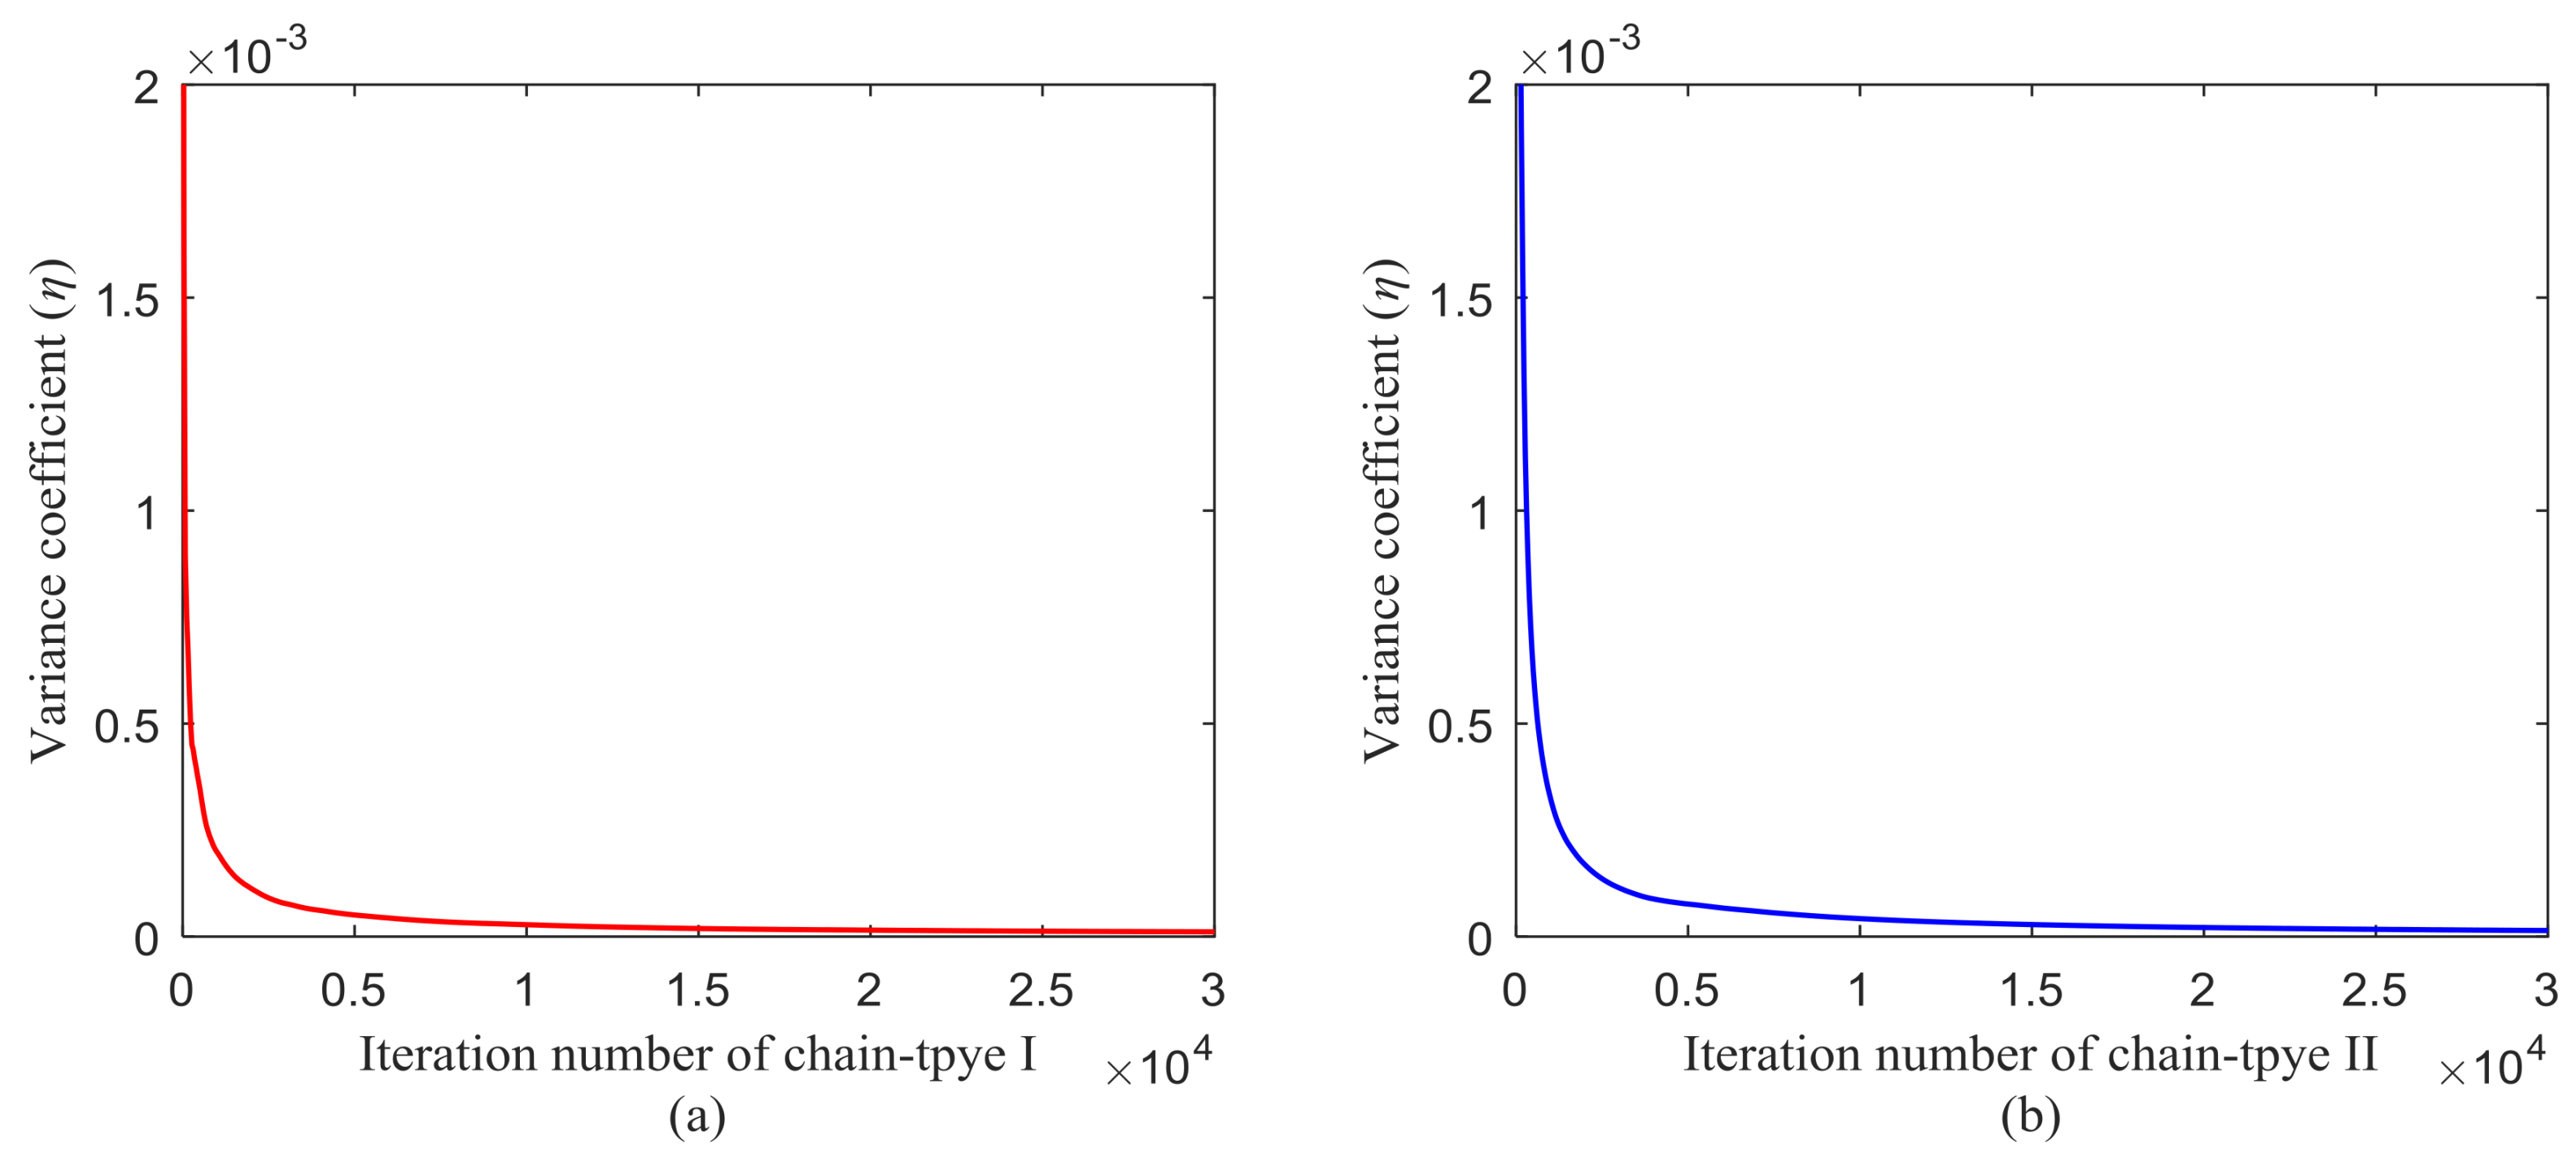
In this paper, the variance coefficient (η) is used as the convergence criterion to terminate the assessment process [21]. There is a negative correlation between the iteration number and η value. For clearly displaying the variation process of variance coefficient, η = 10−5 is taken as the convergence limit value of sampling.
The variation processes of variance coefficient of chain-type I and chain-type II are recorded, as shown in Figure 11a,b. It can be seen from Figure 11 that the variance coefficient has a faster decline in the early sampling period (approximately 2000 iterations and the corresponding η = 0.126 × 10⁻³), and then it tends to be stable in the later sampling period.
6. Conclusions
The electrical system of a wind farm has a significant influence on the reliability of a wind farm. Therefore, evaluating the reliability of different wind farm topologies can provide a reasonable decision for wind farm planning and safety operation. In the existing literatures that are related to the reliability of wind farm electrical system, the isolation operation of disconnect switches is not completely considered. The paper presents a probability transfer technique based on the thought that is to transfer the unreliability of electrical equipment to the energy transmission interruption of WTGs. First, a three-state reliability model of electrical equipment is established. Then, a proportion allocation technique for calculating state probabilities of three-state reliability model is presented. Finally, some of the novel indices for describing the wind farm reliability of considering the electrical system are designed. The number of equivalent grid-connected WTGs is applied to the convergence criterion to terminate the assessment process.
The proposed approach is used to analyze the reliability of wind farm electrical system with chain-type I and chain-type II. According to the case studies, the following conclusions can be drawn:
- The reliability of chain-type I is slightly higher than that of chain-type II, and with the increasing failure rate of transmission lines, the advantage of chain-type I is increasingly obvious.
- The unreliability of the wind turbine generator itself has a greater impact on the reliability of the wind farm than the unreliability of the electrical topology.
- To enhance the assessment accuracy, disconnect switches should be considered in the reliability analysis of the wind farm electrical topology. The influence of disconnect switches will increase with the increasing failure rate of wind farm electrical equipment.
In summary, a reliability assessment technique of wind farm electrical topology is developed in this paper, and the proposed method can provide theoretical support for the planning and reliable operation of a wind farm.
Acknowledgments
This work was supported by Anhui Provincial Natural Science Foundation (1708085ME107), National Natural Science Foundation of China (51607051), National Key R&D Program of China (2016YFB0901101).
Author Contributions
All the authors gave equal contributions in writing the paper.
Conflicts of Interest
The authors declare no conflict of interest.
Nomenclature
| Main symbols | |
| ws | Wind speed |
| α, and β | Scale parameter, and shape parameter |
| Pr, vci, vr and vco | Rated power output, cut-in speed, rated speed, and cut-out wind speed |
| F(ws) | Probability distribution of wind speed |
| λes, and γes | Equivalent failure rate, and equivalent repair time |
| Φs | Set of the sth boundary area |
| λj, and γj | Failure rate and repair time of the jth equipment |
| λf, λds, and μm | Failure rate, isolation rate, and maintenance rate |
| Tyr | Hours for an entire year |
| Mttf | The mean time to failure |
| pNs(i), pOs(i), pIs(i) and pMs(i) | State probabilities in the normal state, the outage state, the isolation state and the maintenance state |
| Nwf | Total WTGs’ number in a wind farm |
| η | Variance coefficient |
| Na(i) | Average number of grid-connected WTGs in a single sampling state |
| Ep | Average number of grid-connected WTGs in n sampling states |
| δ(Ep) | Mean of the sample variance |
| Pwfi, and pwf(Pwfi) | Power and probability of the ith state |
| Abbreviations | |
| WTG | Wind turbine generator |
| WET | Electrical topology of a wind farm |
| DFS | Deep first search |
| ASAI | Average system availability index, (%) |
| ASUI | Average system unavailability index, (%) |
| AEGN | Average energy not generated index, (MWh/yr.) |
| AIWN | Average interrupted WTGs number index |
| AAGE | Average annual generation energy index, (MWh/yr.) |
| WFGE | Wind farm generation efficiency index, (%) |
References
- Hamouda, Y.A. Wind energy in Egypt: Economic feasibility for Cairo. Renew. Sustain. Energy Rev. 2012, 16, 3312–3319. [Google Scholar] [CrossRef]
- Mirhassani, S.A.; Yarahmadi, A. Wind farm layout optimization under uncertainty. Renew. Energy 2017, 107, 288–297. [Google Scholar] [CrossRef]
- Liu, X.; Islam, S. Reliability Issues of Offshore Wind Farm Topology. In Proceedings of the 10th International Conference on Probabilistic Methods Applied to Power Systems, Rincon, Puerto Rico, 25–29 May 2008; pp. 1–5. [Google Scholar]
- Ding, Y.; Singh, C.; Goel, L.; Ostergaard, J.; Wang, P. Short-term and medium-term reliability evaluation for power systems with high penetration of wind power. IEEE Trans. Sustain. Energy 2017, 5, 896–906. [Google Scholar] [CrossRef]
- Sulaeman, S.; Benidris, M.; Mitra, J.; Singh, C. A wind farm reliability model considering both wind variability and turbine forced outages. IEEE Trans. Sustain. Energy 2017, 8, 629–637. [Google Scholar] [CrossRef]
- Dhungana, D.; Karki, R. Data Constrained Adequacy Assessment for Wind Resource Planning. IEEE Trans. Sustain. Energy 2014, 6, 219–227. [Google Scholar] [CrossRef]
- Quinonez-Varela, G.; Ault, G.W.; Anaya-Lara, O.; Mcdonald, J.R. Electrical collector system options for large offshore wind farms. IET Renew. Power Gener. 2007, 1, 107–114. [Google Scholar] [CrossRef]
- Lakshmanan, P.; Liang, J.; Jenkins, N. Assessment of collection systems for HVDC connected offshore wind farms. Electr. Power Syst. Res. 2015, 129, 75–82. [Google Scholar] [CrossRef]
- Dahmani, O.; Bourguet, S.; Machmoum, M. Optimization and reliability evaluation of an offshore wind farm architecture. IEEE Trans. Sustain. Energy 2017, 8, 542–550. [Google Scholar] [CrossRef]
- Xie, K.G.; Yang, H.J.; Hu, B.; Yu, D. Reliability evaluation for electrical collector systems of wind farm using the section enumeration technique. J. Renew. Sustain. Energy 2013, 5, 1–15. [Google Scholar] [CrossRef]
- Yang, H.J.; Xie, K.G.; Tai, H.M.; Chai, Y. Wind farm layout optimization and its application to power system reliability analysis. IEEE Trans. Power Syst. 2016, 31, 2135–2143. [Google Scholar] [CrossRef]
- Chen, Y.; Dong, Z.; Meng, K. Collector system layout optimization framework for large-scale offshore wind farms. IEEE Trans. Sustain. Energy 2016, 7, 1398–1407. [Google Scholar] [CrossRef]
- Wei, S.; Zhang, L.; Xu, Y. Hierarchical optimization for the double-sided ring structure of the collector system planning of large offshore wind farms. IEEE Trans. Sustain. Energy 2017, 8, 1029–1039. [Google Scholar] [CrossRef]
- Ozay, C.; Celiktas, M.S. Statistical analysis of wind speed using two-parameter Weibull distribution in Alaçatı region. Energy Convers. Electr. 2016, 121, 49–54. [Google Scholar] [CrossRef]
- Akgül, F.G.; Şenoğlu, B.; Arslan, T. An alternative distribution to Weibull for modeling the wind speed data: Inverse Weibull distribution. Energy Convers. Manag. 2016, 114, 234–240. [Google Scholar] [CrossRef]
- Larsen, R.J.; Marx, M.L. An Introduction to Mathematical Statistics and Its Application; Prentice Hall: Upper Saddle River, NJ, USA, 2011. [Google Scholar]
- Kim, H.; Singh, C.; Sprintson, A. Simulation and estimation of reliability in a wind farm considering the wake effect. IEEE Trans. Sustain. Energy 2012, 3, 274–282. [Google Scholar] [CrossRef]
- Billinton, R.; Chowdhury, A.A. Incorporation of wind energy conversion systems in conventional generating capacity adequacy assessment. IEE Proc. C Gener. Transm. Distrib. 2002, 139, 47–56. [Google Scholar] [CrossRef]
- Pandey, H.M. Design Analysis and Algorithm; University Science Press: New Delhi, India, 2008. [Google Scholar]
- Billinton, R.; Allan, R. Reliability Evaluation of Power System; Springer: Boston, MA, USA, 1996. [Google Scholar]
- Li, W. Risk Assessment of Power Systems: Models, Methods, and Applications; John Wiley & Sons: Mississauga, ON, Canada, 2005. [Google Scholar]
- Potential Wind Speed of the Netherlands. Available online: http://projects.knmi.nl/klimatologie/onde rzo ek sgegevens/potentiele_wind/ (accessed on 25 December 2010).
- Dobakhshari, A.S.; Fotuhi-Firuzabad, M. A reliability model of large wind farms for power system adequacy studies. IEEE Trans. Energy Convers. 2009, 24, 792–801. [Google Scholar] [CrossRef]
- Ribrant, J.; Bertling, L.M. Survey of failures in wind power systems with focus on Swedish wind power plants during 1997–2005. IEEE IEEE Trans. Energy Convers. 2007, 20, 167–173. [Google Scholar] [CrossRef]
Figure 1.
A simplified wind farm electrical system for reliability equivalence analysis.
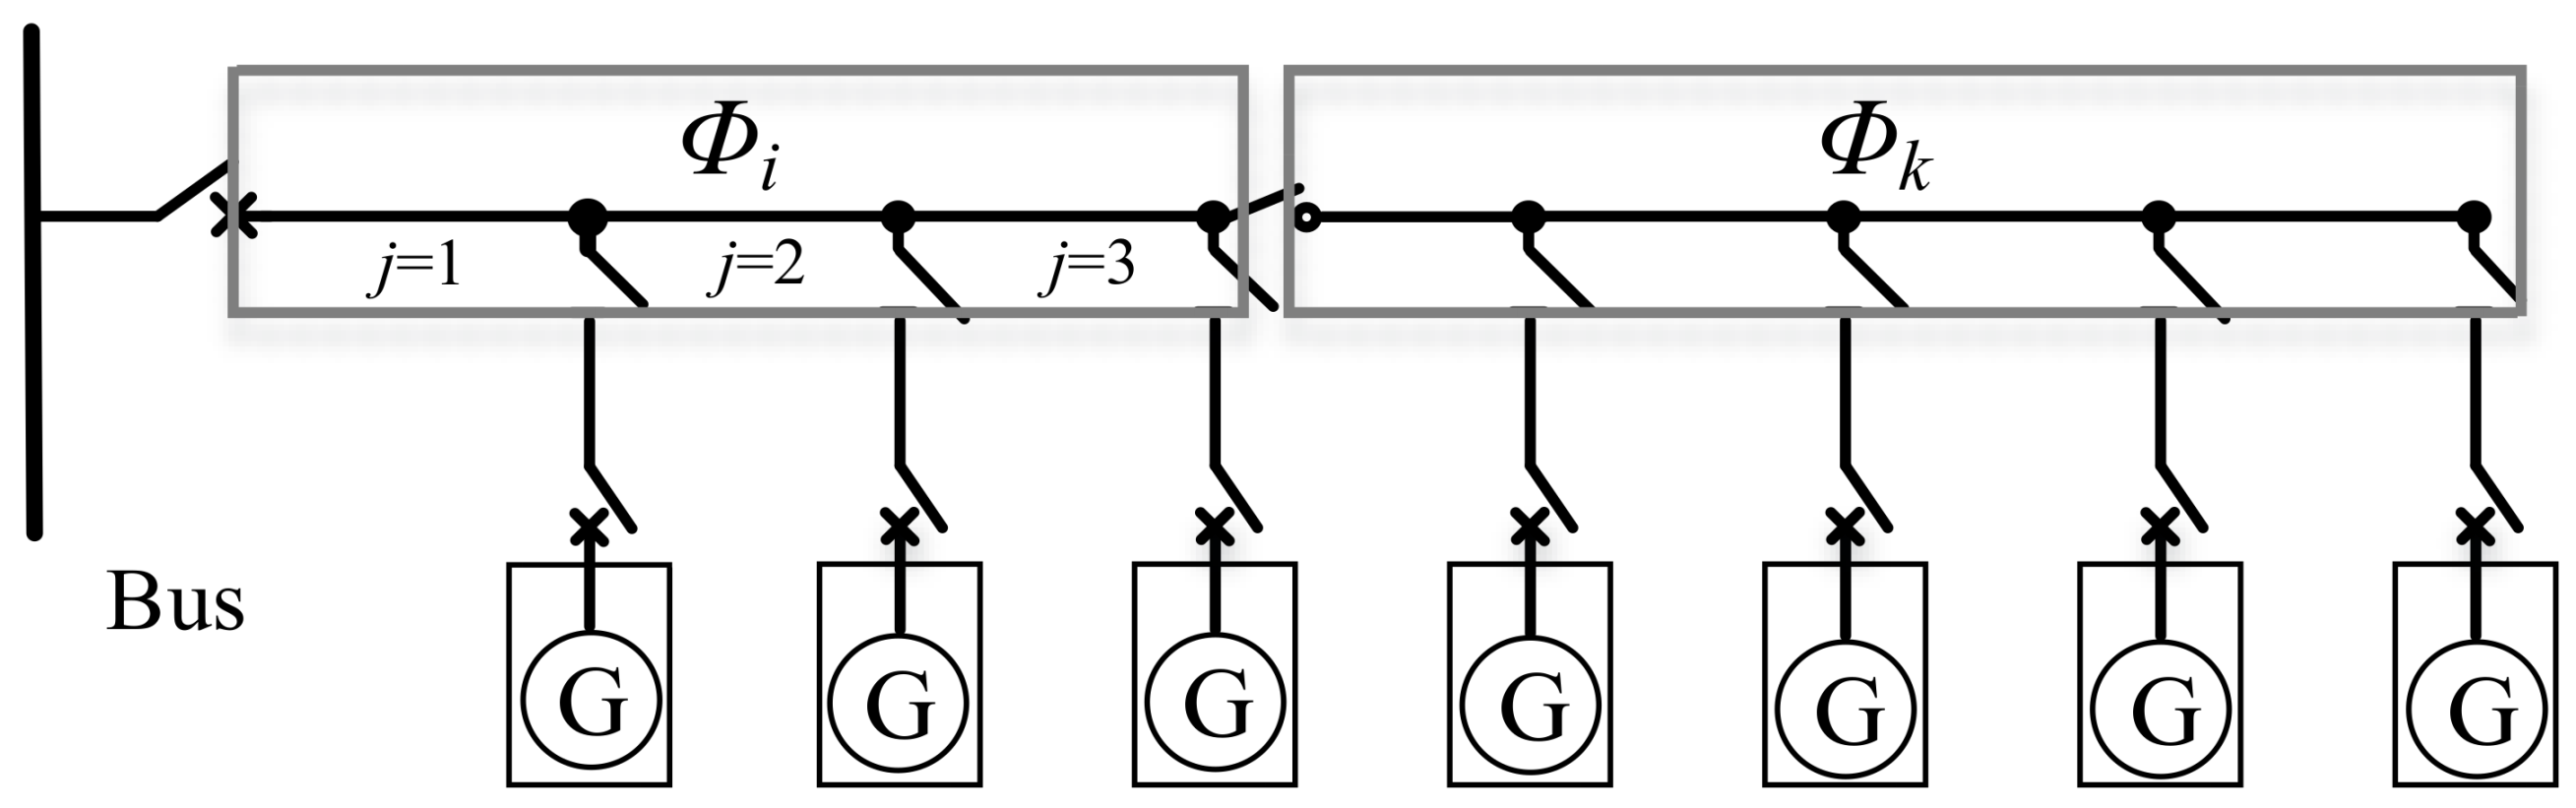
Figure 2.
(a) Three-state reliability model. (b) Time series of state transition.
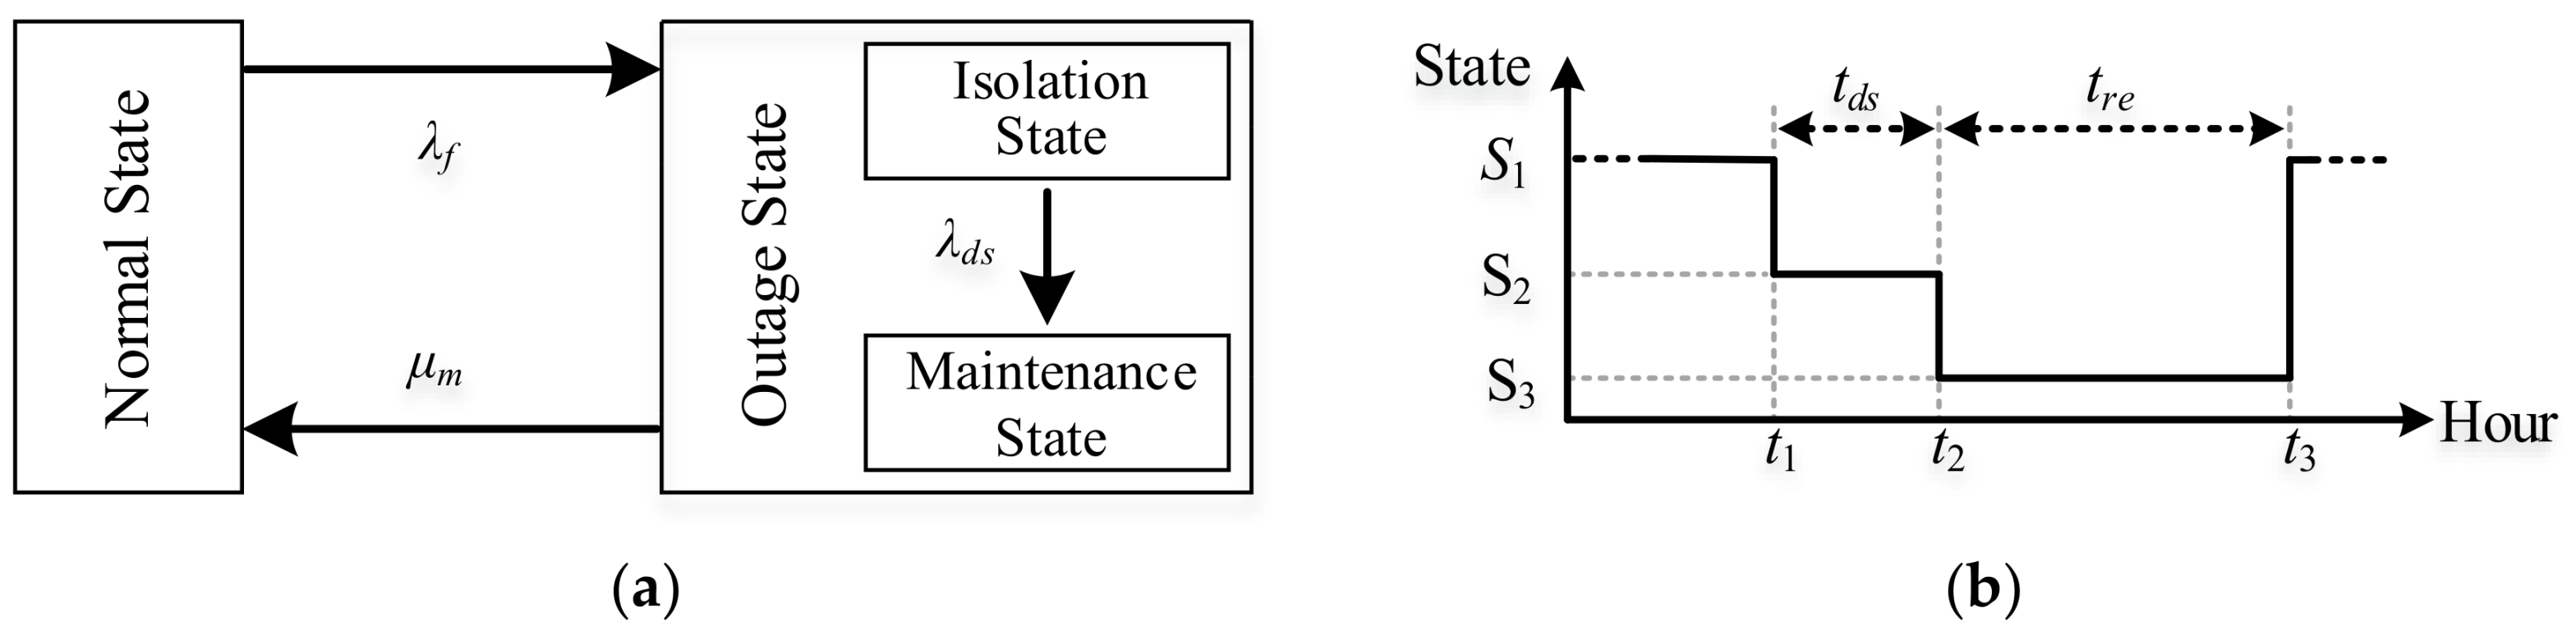
Figure 3.
A simplified wind farm electrical system for describing the proposed technique.
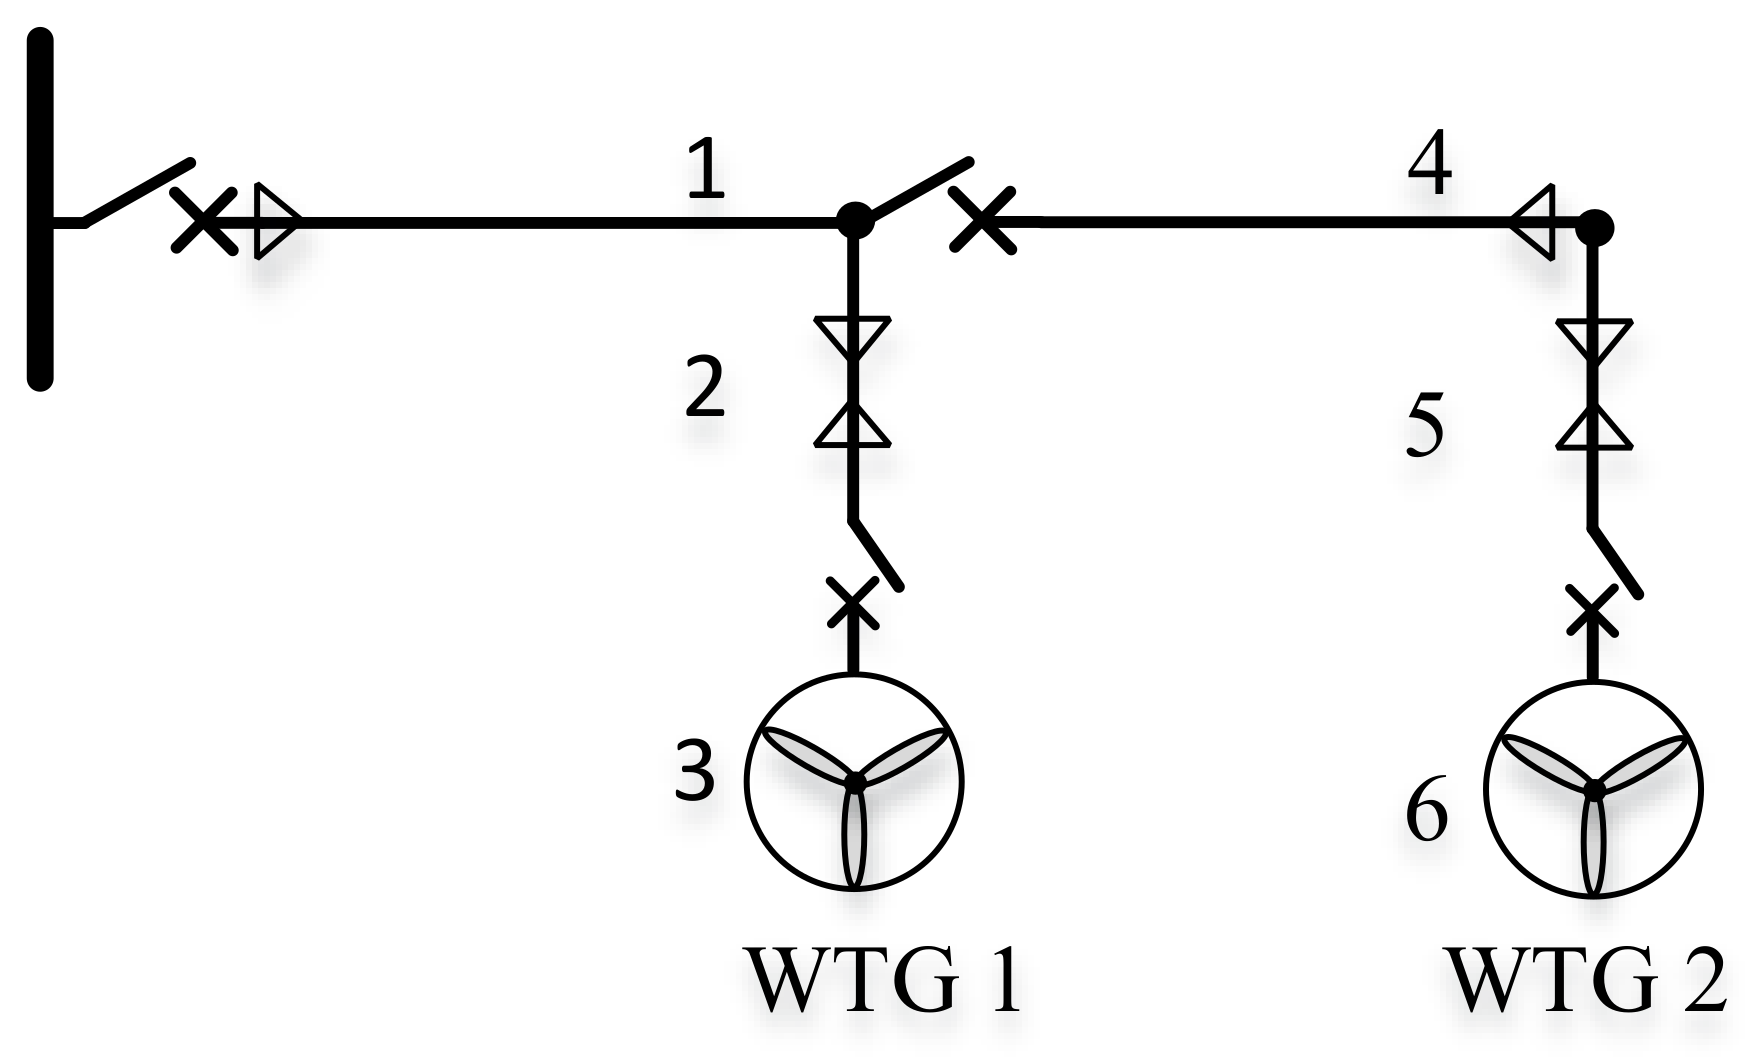
Figure 4.
Flowchart for reliability assessment of wind farm electrical system.

Figure 5.
Two simplified chain-type topologies: (a) chain-type I; and, (b) chain-type II.

Figure 6.
Probabilities of (a) grid-connected WTGs number and (b) interrupted WTGs number.
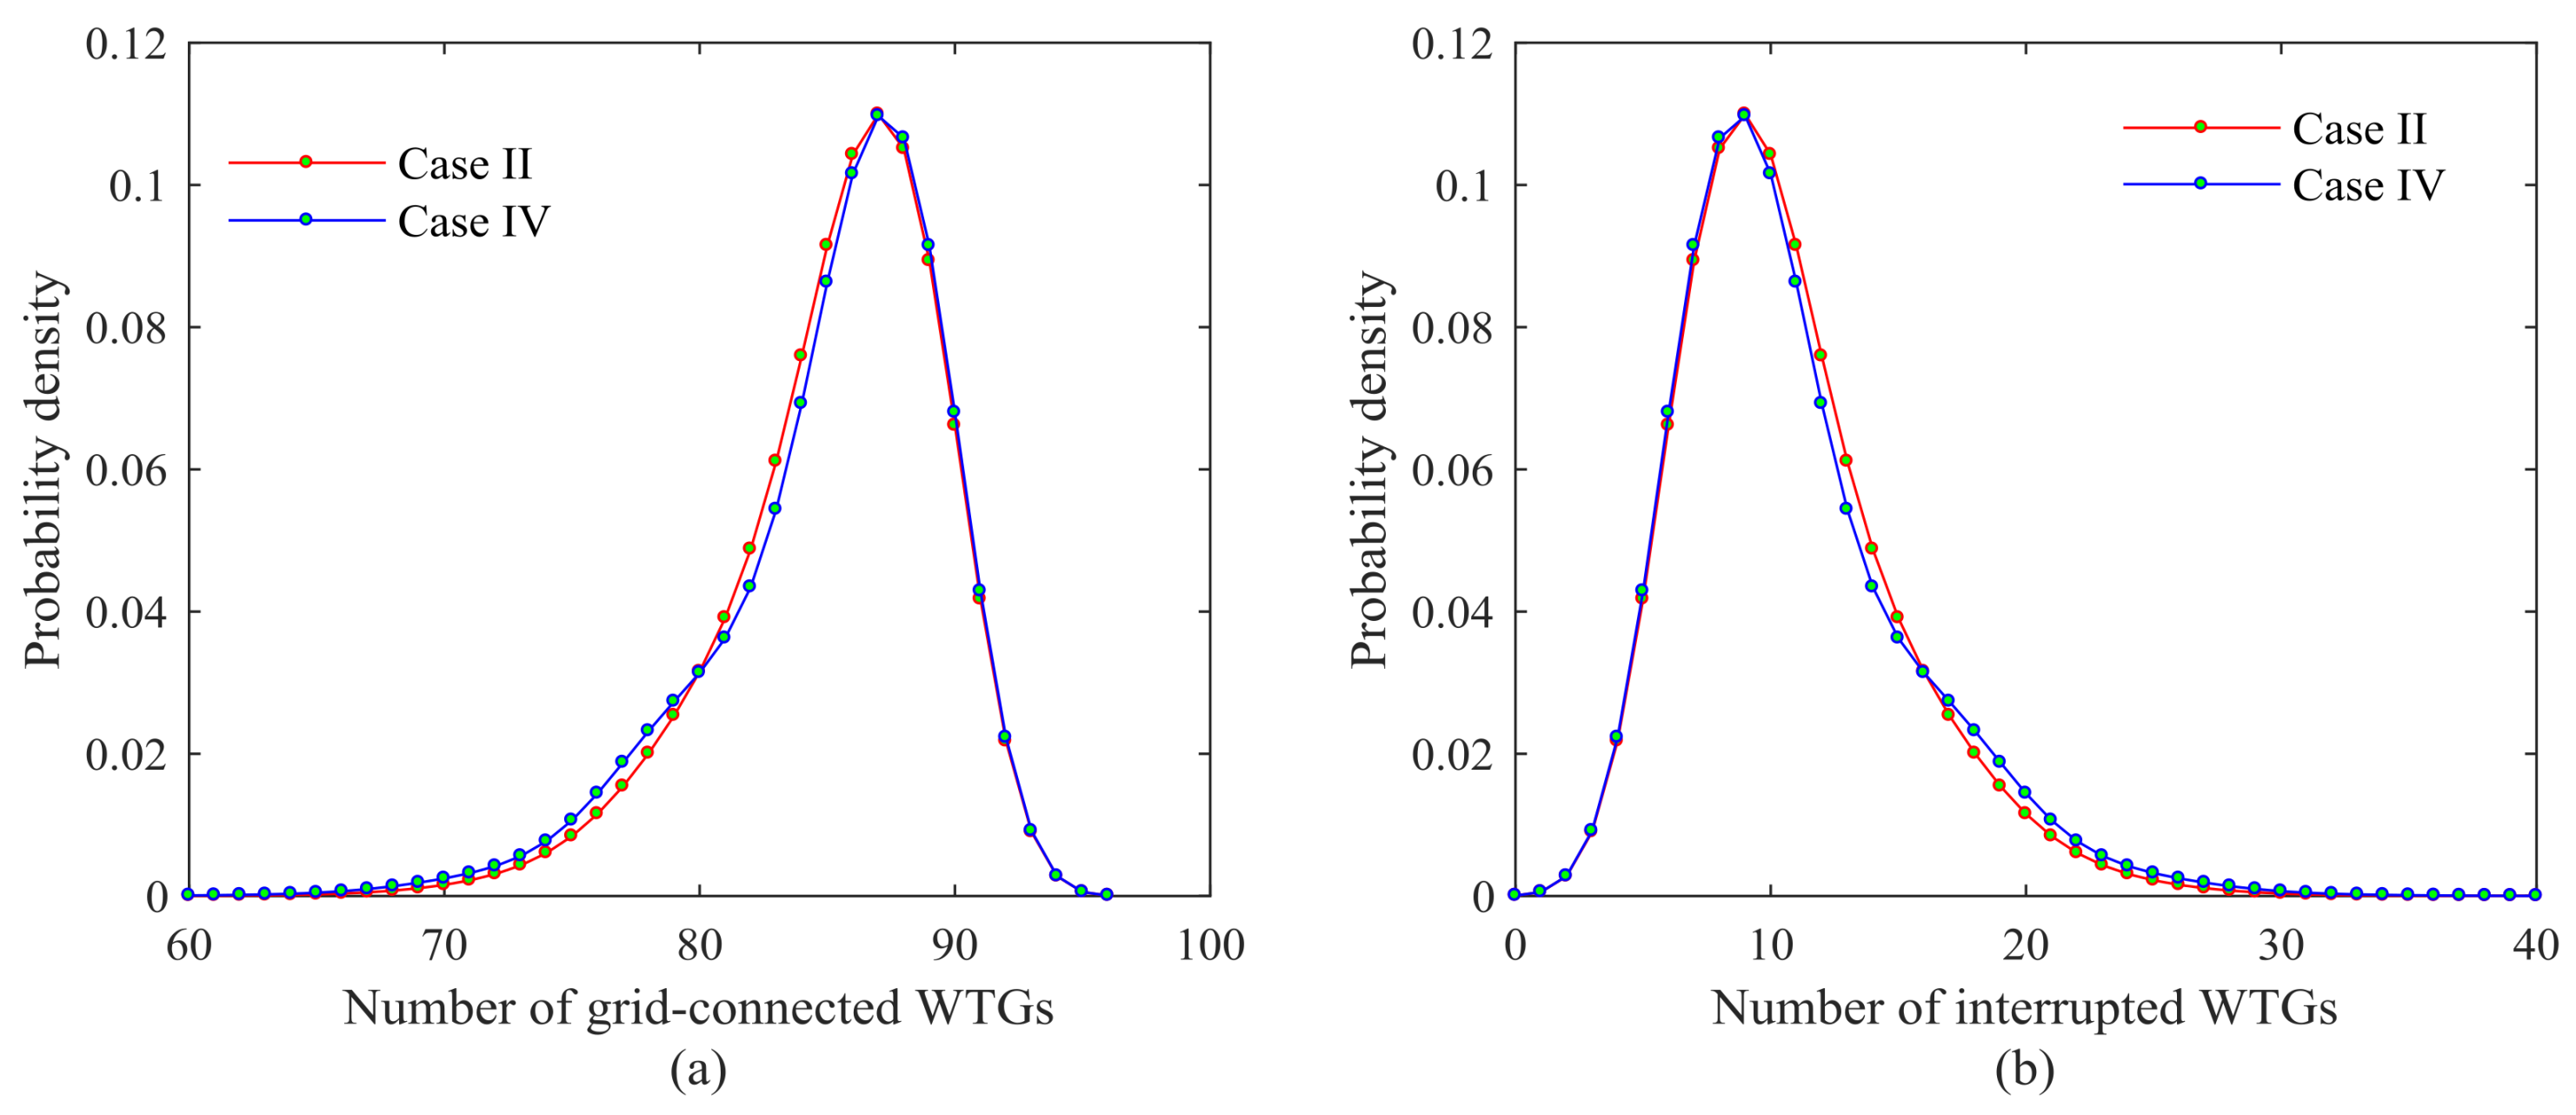
Figure 7.
(a) Average system availability index (ASAI) changes with failure rate; (b) Deviation percentage of ASAI index between chain-type I and chain-type II.
Figure 7.
(a) Average system availability index (ASAI) changes with failure rate; (b) Deviation percentage of ASAI index between chain-type I and chain-type II.
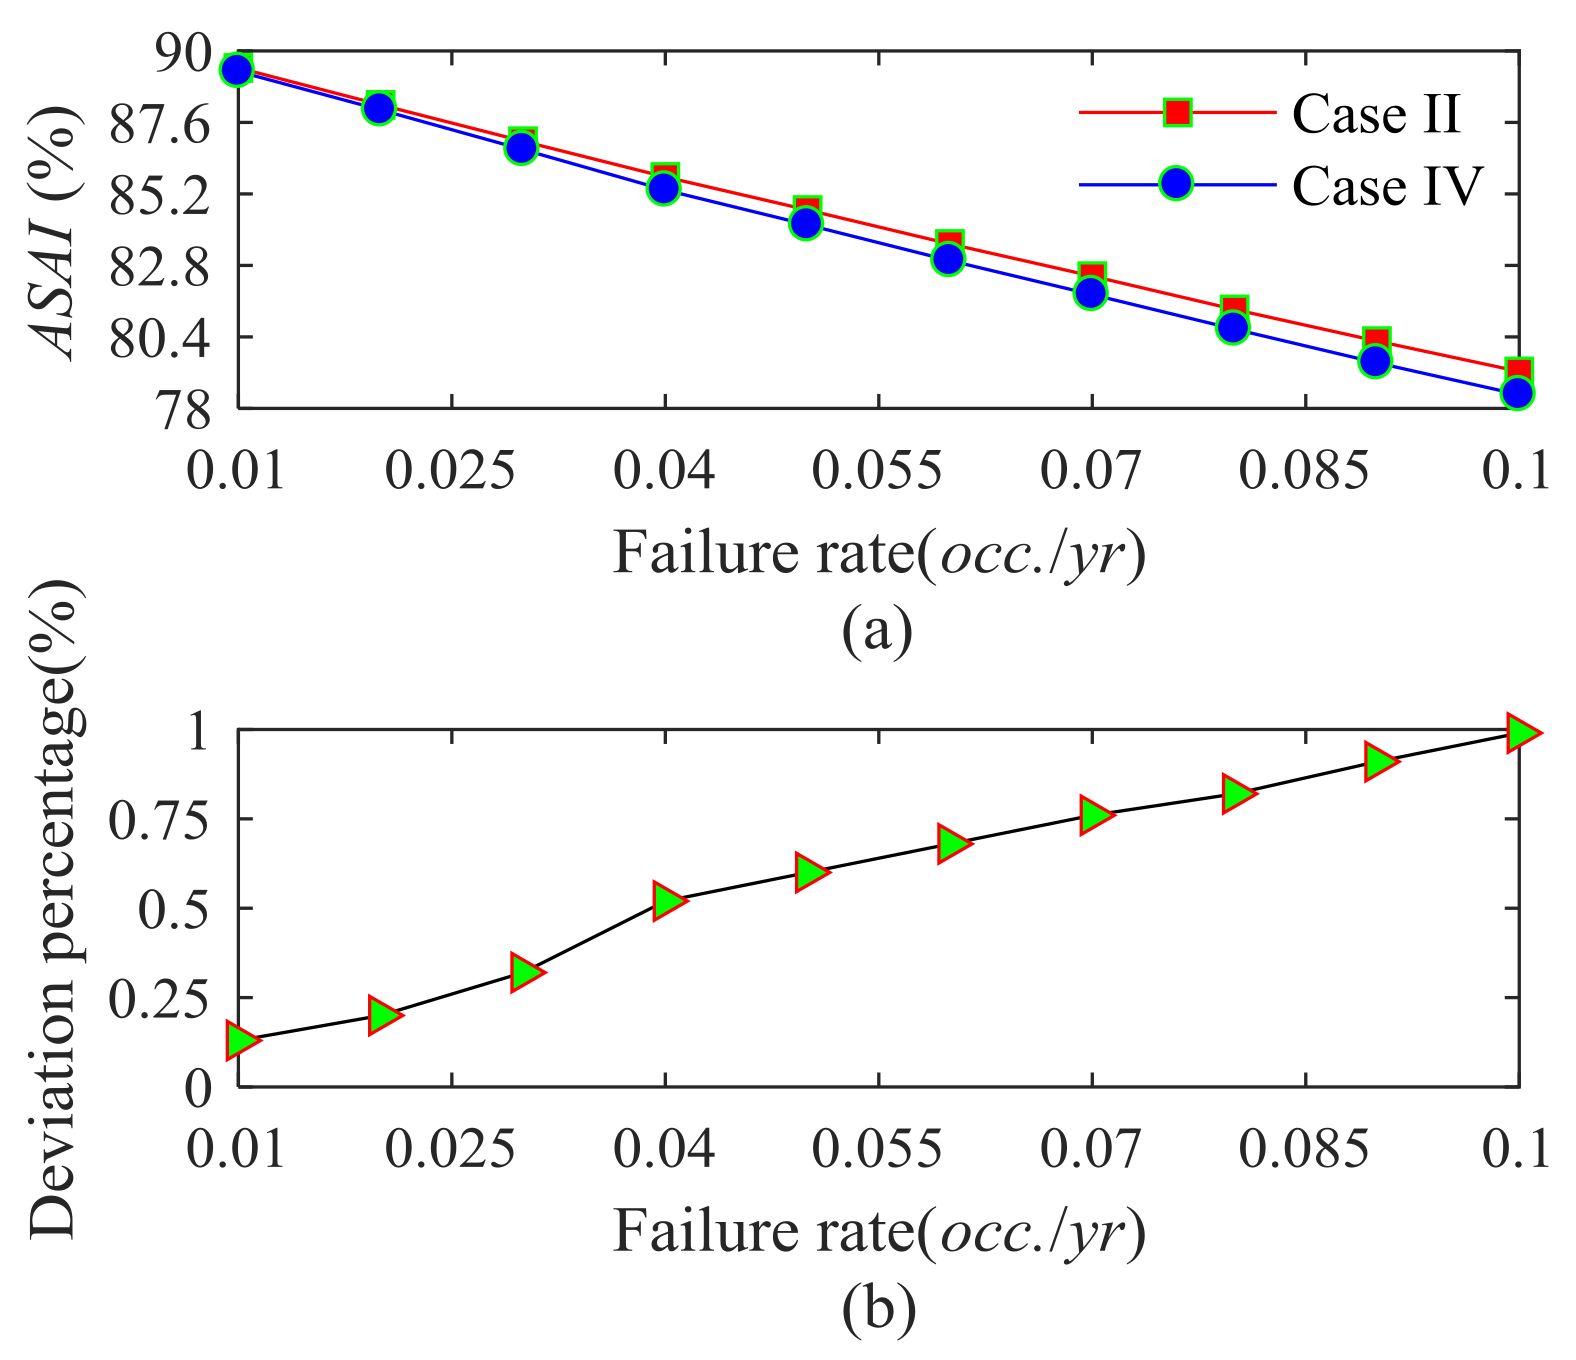
Figure 8.
(a) Average Interrupted WTGs Number index (AIWN) index changes with failure rate; (b) Deviation percentage of AIWN index between chain-type I and chain-type II.
Figure 8.
(a) Average Interrupted WTGs Number index (AIWN) index changes with failure rate; (b) Deviation percentage of AIWN index between chain-type I and chain-type II.

Figure 9.
(a) ASAI index versus failure rate; (b) Deviation percentage of ASAI index between with and without consideration of isolation operation.
Figure 9.
(a) ASAI index versus failure rate; (b) Deviation percentage of ASAI index between with and without consideration of isolation operation.
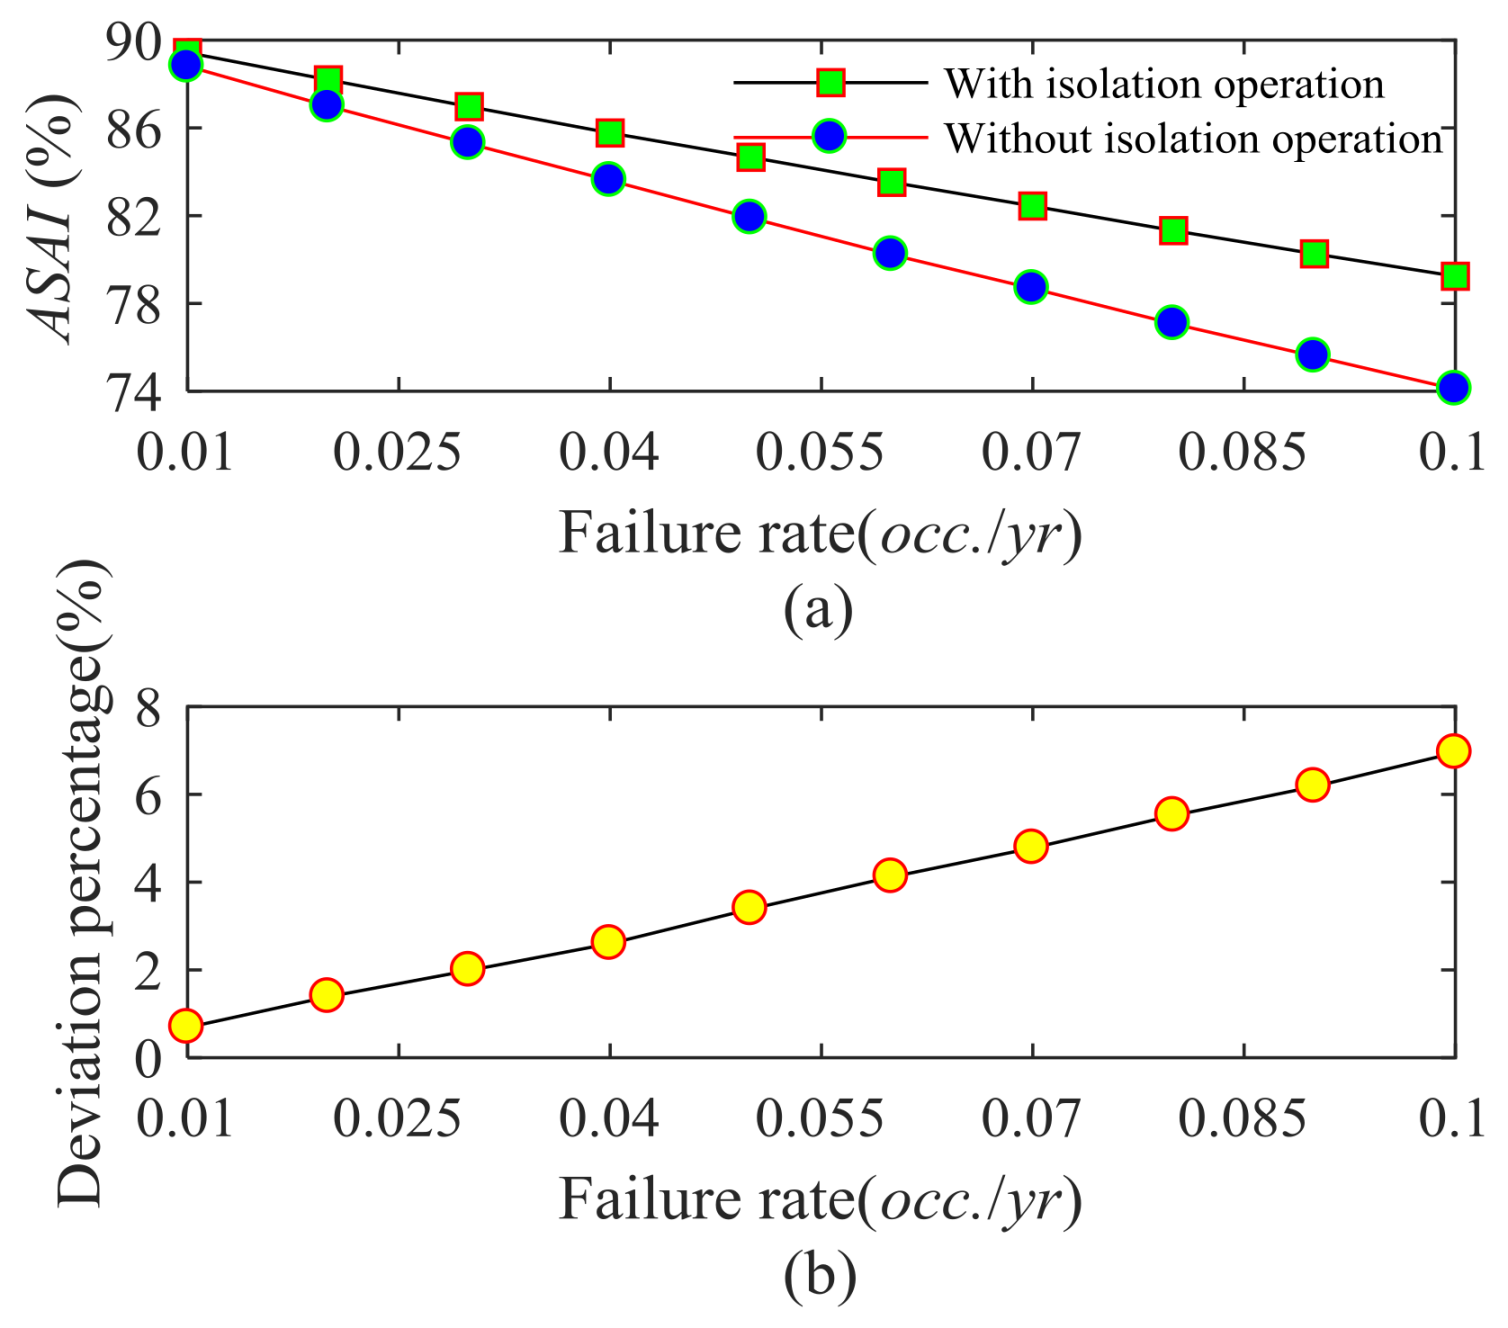
Figure 10.
(a) AIWN index versus failure rate; (b) Deviation percentage of AIWN index between with and without consideration of isolation operation.
Figure 10.
(a) AIWN index versus failure rate; (b) Deviation percentage of AIWN index between with and without consideration of isolation operation.
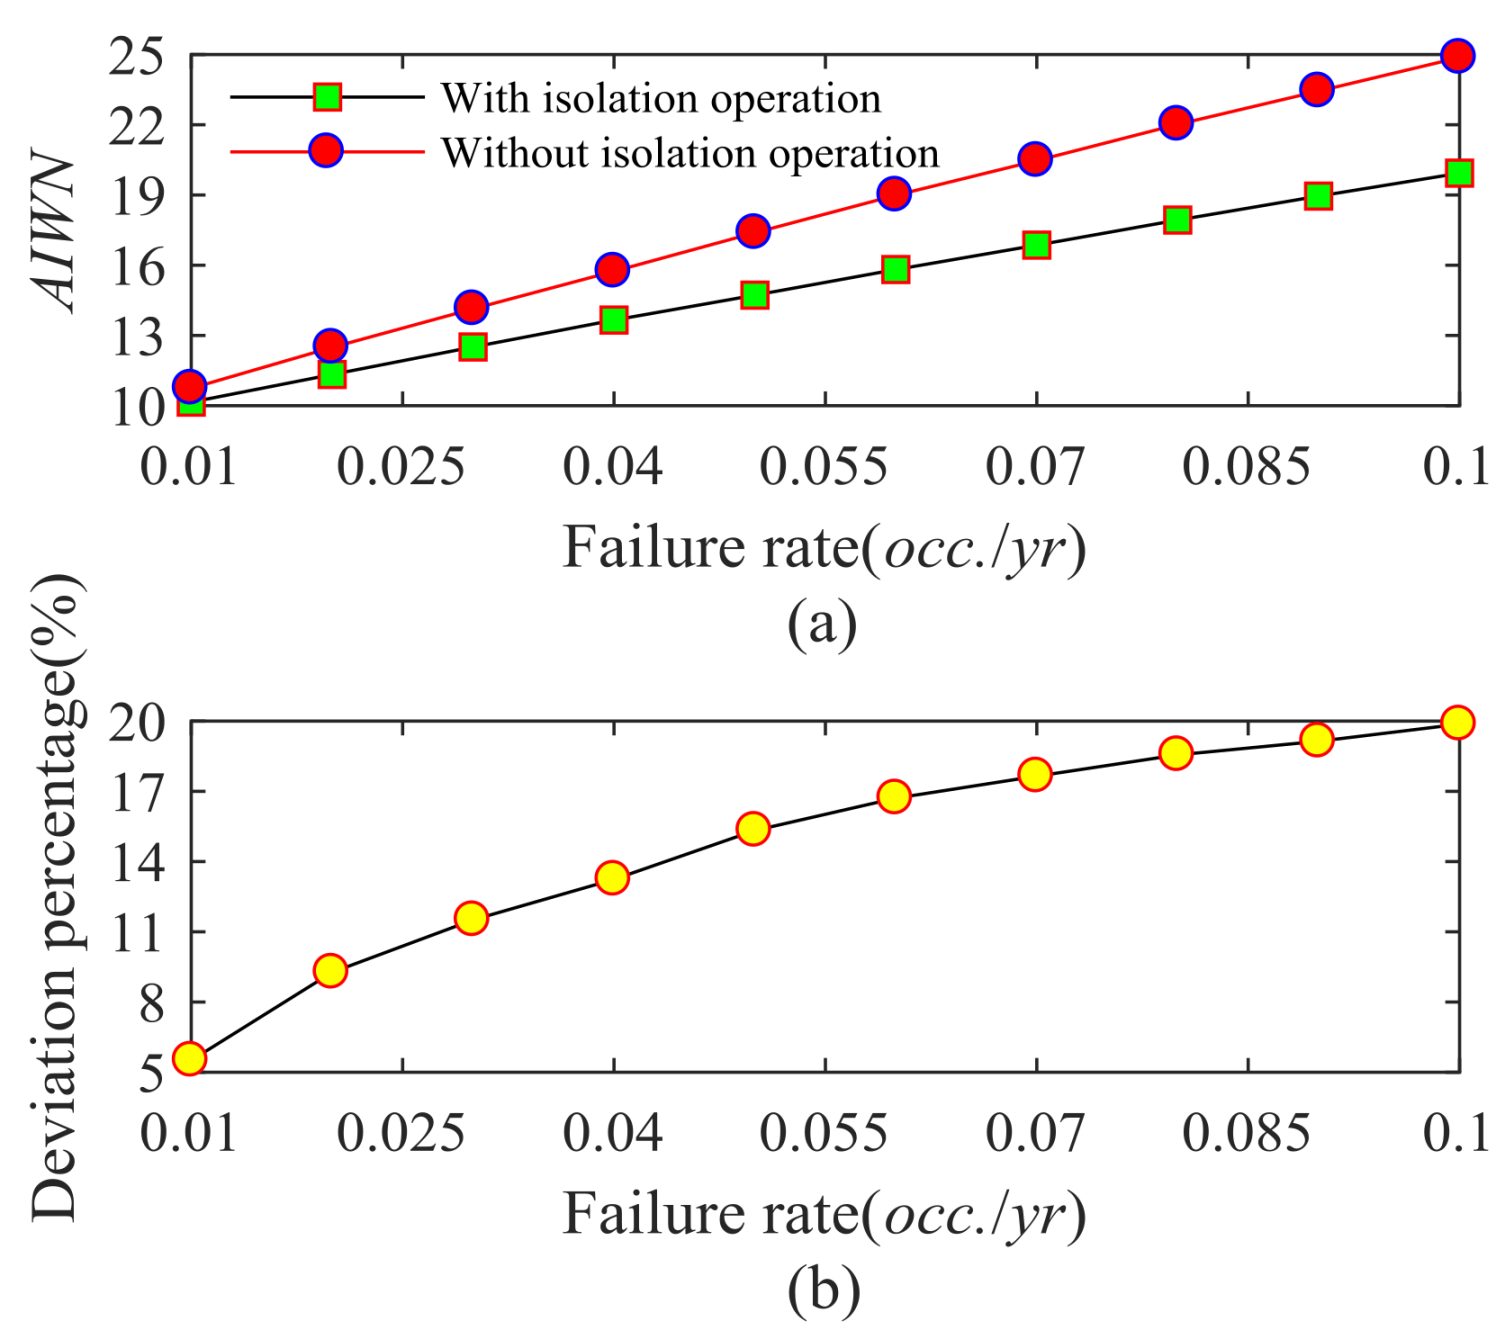
Figure 11.
Variation process of the variance coefficient for (a) chain-type I and (b) chain-type II.
Figure 11.
Variation process of the variance coefficient for (a) chain-type I and (b) chain-type II.


Table 1.
An example for describing the proposed technique.
| Simulated States of All Equipment | Energy Transmission Interruption for WTG 1 | Energy Transmission Interruption for WTG 2 |
|---|---|---|
| 1 0 0 0 0 0 | Yes | Yes |
| 0 1 0 0 0 0 | Yes | Yes |
| 0 0 1 0 0 0 | Yes | No |
| 0 0 0 1 1 0 | No | Yes |
| 0 0 0 1 1 1 | No | Yes |
| …… | …… | …… |
Table 2.
Discrete probability distribution of grid-connected wind turbine generators (WTGs).
| Number of WTGs | Probabilities |
|---|---|
| 0 | p(0) = Fa(0)/Ns |
| 1 | p(1) = Fa(1)/Ns |
| … | … |
| k | p(k) = Fa(k)/Ns |
| … | … |
| Nwf | p(Nwf) = Fa(Nwf)/Ns |
Table 3.
Statistical characteristics of wind speed samples.
| Variables | Measured Wind Speed (m/s) | Simulated Wind Speed (m/s) | Error (%) |
|---|---|---|---|
| Mean value | 5.0856 | 5.0818 | 0.075 |
| Standard deviation | 2.9460 | 2.9590 | 0.441 |
Table 4.
Failure rate and repair time of wind farm equipment.
| Component | Failure Rate (occ./yr.) | Repair Time (h/occ.) |
|---|---|---|
| Cable feeder | 0.015/km | 1440 |
| Wind turbine generator | 1.5 | 600 |
| Tower transformer | 0.0131 | 240 |
| Tower cable | 0.015/km | 240 |
The “occ.” represents the number of occurrences.
Table 5.
Four scenarios for reliability analysis of wind farm electrical topology.
| Scenarios | Topology Type | With or Without Failure of WTG |
|---|---|---|
| Case I | Chain-type I | Without |
| Case II | Chain-type I | With |
| Case III | Chain-type II | Without |
| Case IV | Chain-type II | With |
Table 6.
Reliability indices of the wind farm electrical system.
| Indices | Case I | Case II | Case III | Case IV |
|---|---|---|---|---|
| ASAI (%) | 98.023 | 88.852 | 97.840 | 88.683 |
| ASUI (%) | 1.977 | 11.148 | 2.160 | 11.317 |
| AIWN | 1.900 | 10.703 | 2.074 | 10.864 |
| AENG (MWh/yr.) | 99.834 | 562.996 | 109.089 | 571.499 |
| AAGE (MWh/yr.) | 475,215.62 | 430,752.09 | 474,327.14 | 429,935.78 |
| WFGE (%) | 28.254 | 25.611 | 28.202 | 25.562 |
© 2018 by the authors. Licensee MDPI, Basel, Switzerland. This article is an open access article distributed under the terms and conditions of the Creative Commons Attribution (CC BY) license (http://creativecommons.org/licenses/by/4.0/).
Share and Cite
MDPI and ACS Style
Yang, H.; Wang, L.; Zhang, Y.; Qi, X.; Wang, L.; Wu, H. Reliability Assessment of Wind Farm Electrical System Based on a Probability Transfer Technique. Energies 2018, 11, 744. https://doi.org/10.3390/en11040744
AMA Style
Yang H, Wang L, Zhang Y, Qi X, Wang L, Wu H. Reliability Assessment of Wind Farm Electrical System Based on a Probability Transfer Technique. Energies. 2018; 11(4):744. https://doi.org/10.3390/en11040744
Chicago/Turabian StyleYang, Hejun, Lei Wang, Yeyu Zhang, Xianjun Qi, Lei Wang, and Hongbin Wu. 2018. "Reliability Assessment of Wind Farm Electrical System Based on a Probability Transfer Technique" Energies 11, no. 4: 744. https://doi.org/10.3390/en11040744
Note that from the first issue of 2016, this journal uses article numbers instead of page numbers. See further details here.