Reliability Equivalence to Symmetrical UHVDC Transmission Systems Considering Redundant Structure Configuration


College of Electric Engineering, Zhejiang University, Hangzhou 310027, China
*
Author to whom correspondence should be addressed.
Energies 2018, 11(4), 753; https://doi.org/10.3390/en11040753
Submission received: 15 February 2018
/
Revised: 14 March 2018
/
Accepted: 22 March 2018
/
Published: 26 March 2018
(This article belongs to the Special Issue 17TH International Conference on Environment and Electrical Engineering)
Abstract
:In recent years, the ultra-high voltage direct current (UHVDC) transmission system has been developed rapidly for its significant long-distance, high-capacity and low-loss properties. Equipment failures and overall outages of the UHVDC system have increasingly vital influence on the power supply of the receiving end grid. To improve the reliability level of UHVDC systems, a quantitative selection and configuration approach of redundant structures is proposed in this paper, which is based on multi-state reliability equivalence. Specifically, considering the symmetry characteristic of an UHVDC system, a state space model is established as a monopole rather than a bipole, which effectively reduces the state space dimensions to be considered by deducing the reliability merging operator of two poles. Considering the standby effect of AC filters and the recovery effect of converter units, the number of available converter units and corresponding probability are expressed with in universal generating function (UGF) form. Then, a sensitivity analysis is performed to quantify the impact of component reliability parameters on system reliability and determine the most specific devices that should be configured in the redundant structure. Finally, a cost-benefit analysis is utilized to help determine the optimal scheme of redundant devices. Case studies are conducted to demonstrate the effectiveness and accuracy of the proposed method. Based on the numerical results, configuring a set of redundant transformers is indicated to be of the greatest significance to improve the reliability level of UHVDC transmission systems.
1. Introduction
With the continuous improvement of electric power equipment manufacturing, direct current (DC) transmission technology has achieved a significant development from extra-high voltage (EHV) to ultra-high voltage (UHV) [1]. With promising large-scale application potential, ultra-high voltage direct current (UHVDC) transmission has become one of the most important solutions of modern high-efficiency power delivery due to its long-distance, high-capacity and low-loss properties [2].
Across the world, many countries have energized the research and application of advanced UHVDC systems, e.g., the United States, China, Brazil and India [3]. Moreover, several UHVDC transmission projects have been built and officially put into operation. China is the main country with large-scale UHVDC engineering application to reduce the occupation of land, control short circuit currents, increase the power system stability and improve the level of the power equipment manufacturing industry [4]. The development of UHV technology, especially UHVDC transmission, is regarded as a significant solution to achieve the wide area west-to-east and south-to-north power transmission and sustain the national strong smart grids in China [5]. By December 2017, the State Grid Corporation of China already had ten UHVDC transmission projects in operation and one project under construction, while the China Southern Power Grid Corporation, another power giant, has three UHVDC transmission projects in operation. It is anticipated that the size of the UHVDC grid of China will be unprecedentedly large.
A large-capacity UHVDC transmission system is often the main power transmission channel between regions. Therefore, UHVDC transmission system failures have a significant impact on the power abundance of ambilateral alternating current (AC) terminals. Reference [6] proposed that reliability is one of the most important challenges of UHVDC transmission systems. Considerable efforts have been devoted to improving the operation reliability of UHVDC projects, which can be summarized into three levels. At the equipment level, the technical and economic analysis of the main devices, such as converter valves, converter transformers, smoothing reactors, arresters and grounding electrodes, have been explored in references [7,8,9,10,11,12]; based on which, the configuration of the devices has been optimized. At the station level, reference [8] discussed the design parameters of converter stations. At the system level, references [13,14] analyzed the stability and protection control strategy of UHVDC transmission systems.
In engineering, redundancy refers to the duplication of critical components or functions with the intention of increasing the reliability of a system [15]. By arranging some key spare devices, e.g., converter valves and converter transformers, the reliability of UHVDC can be greatly improved. However, the configuration of spare devices needs some quantitative analyses as the basis of any decision. According to Perrow, redundancies sometimes produce less, not more reliability because spare devices result in a more complex system, more prone to errors and accidents [16]. Therefore, a mapping relationship between the configuration mode of redundancy and reliability improvement of the UHVDC systems is expected. On the other hand, compared with the original standard structure, the addition of spare devices brings some extra costs. An appropriate UHVDC redundancy should be a trade-off between the system reliability improvement and the economic costs of spare devices. Therefore, economic factors should also be considered in any redundancy configuration.
At present, the reliability analysis methods of UHVDC transmission systems can be classified as Monte-Carlo simulation methods and analytical methods. Reference [17] proposed a computer program to evaluate the state probability, frequency and other complicated indices of UHVDC transmission systems. Reference [18] introduced the fault tree analysis (FTA) method in UHVDC transmission system reliability evaluation, which considers the basic failure incidents, discusses the source of system outages, and goes deeply into the failure groups. Reference [19] considered the logical relationship among subsystems and proposed a UHVDC reliability evaluation model based on a state enumeration method. Monte-Carlo simulation may have problems in terms of computational efficiency. The series-parallel analysis method and FTA method cannot directly take the passive outage effect and mutual interaction of UHVDC transmission system components into account. Therefore, the frequency & duration (F&D) method based on state space has become the mainstream of UHVDC reliability analysis. Reference [20] quantified the reliability of the converter transformers for the double 12-pulse UHVDC transmission system with the state space and F&D method. In reference [21], an improved F&D method is proposed to fully and progressively consider the topology of the whole UHVDC bipolar system. However, the state space structure of the model is so complex that the calculation can be time-consuming and the state enumeration and transition matrix are prone to bring about some state omissions.
Each realistic UHVDC transmission system has its unique structure characteristics, which are known as its bipolar symmetry. Based on this, a novel UHVDC reliability model and evaluation method is proposed in this paper, which successfully reduces the dimension of the complex state space solution. Specifically, considering the symmetry characteristics of the UHVDC, a state space model is established as a monopole rather than a bipole. Considering the standby effect of AC filters and the recovery effect of converter units, the number of available converter units and corresponding probability are expressed with a universal generating function (UGF) form. Then, a sensitivity analysis is followed to quantify the impact of device parameters on system reliability and determine the devices that should be configured in a redundant structure. Finally, cost-benefit analysis is conducted to help determine the optimal number of utilized redundant devices. The benefit of the proposed technique is illustrated by some case studies. Numerical results demonstrate that the proposed technique contributes to a better UHVDC structure design.
2. Reliability Equivalence of UHVDC Transmission System
In this section, a multi-state reliability equivalence model of a symmetrical UHVDC transmission system is established. The frequency and duration method (F&D method), a production of the Markov progress, is widely utilized in reliability analysis of UHVDC transmission systems. F&D method can be depicted by the flowchart of Figure 1.
As we know, the computational complexity of the F&D method is decided by the number of considered states. Therefore, if the number and type of system components are large and the topology is complex, the modeling and calculation process will inevitably be time-consuming. Though the UHVDC transmission system has a large number of components, the type of components is limited, so advantage can be taken of the bipolar symmetry in the structure, and the F&D method is quite suitable for this case.
Step 1: define the state and performance of UHVDC transmission system.
According to CIGRE, a typical DC transmission system can be divided into six parts: converter valve (CV), converter transformer (CT), converter control & protection device (CC), AC filter (ACF), DC filter (DCF), and DC line (DCL) equipment [22]. Compared with this, an UHVDC transmission system possesses higher voltage levels and a more complex structure, but its main equipment and the topology are not significantly different. Therefore, in this paper, UHVDC transmission systems are also considered to have the mentioned six-part structure for reliability analysis purposes.
As shown in Figure 2, an UHVDC transmission system typically consists of two poles with two 12-pulse converters per pole in series. Compared with a HVDC transmission system, the number of converters and transformers is doubled, but the capacity is reduced by half, favoring the manufacture and transport of equipment. Since the 12-pulse converter can operate independently as a basic converter unit, the 12-pulse converter valve manifold can be constructed in stages according to the monopole low voltage 1/4 rated capacity, bipole low-voltage 2/4 rated capacity, bipole asymmetric high and low voltage 3/4 rated capacity, and bipole high voltage 4/4 rated capacity building. Since each pole of the UHVDC transmission system has two 12-pulse converter units, through the switch at the sending end or receiving end, only one 12-pulse converter units (1/4 of rated capacity) will suffer an outage when the converter valves or transformers suffer a fault. The impact on the AC system of both ends turns out to be relatively small, therefore, the UHVDC transmission system can be considered as a multi-state system with several operating modes [19]:
- Normal state: two poles are in a normal state. The number of available converter units is 4. The transmission power is 100% rated capacity in constant power control mode.
- Monopole partial outage: one pole is in a normal state and the other is in a partial failure state. The number of available converter units is 3. The transmission power is 75% of the rated capacity in constant power control mode.
- Monopole outage: one pole is in a normal state and the other is in a failure state. The number of available converter units is 2. The transmission power is 50% of the rated capacity in constant power control mode.
- Bipole partial outage: two poles are in a partial failure state: the number of available converter units is 2 and the transmission power is 50% of the rated capacity in constant power control mode, or one pole is in a partial failure state and the other is in a failure state: the number of available converter units is 1 and the transmission power is 25% of the rated capacity in constant power control mode.
- Bipole outage: two poles are in a failure state. The number of available converter units is 0. The transmission power is 0% of the rated capacity in constant power control mode.
Step 2: abstract the reliability analysis structure from the actual system.
The UHVDC transmission system is a complex multi-state system which contains many components. The state space for the reliability analysis will be extremely complicated. Meanwhile, the UHVDC transmission system has a unique characteristic—bipolar symmetry—which can greatly reduce the complexity of our reliability analysis. Figure 3 shows the reliability topological structure of an UHVDC transmission system.
Step 3: simplify reliability analysis structure by applying series and parallel equivalence.
According to the components and topology structure of the UHVDC transmission system, series equivalence can be conducted for the first stage. As for a system composed of two independent series of components, the overall reliability parameters can be derived from the single component reliability parameters by using Equation (1), where λs1 and μs1 respectively indicate the failure rate and repair rate of the first component, λs2 and μs2 respectively indicate the failure rate and the recovery rate of the second component, λs and μs respectively indicate the failure rate and repair rate of the series system:
Correspondingly, for the multi-state system composed of several independent elements in series, the overall reliability parameter calculation formula is given by Equation (2) where λsi and μsi respectively indicate the failure rate and repair rate of component i:
Using the above equation for series equivalence of the UHVDC transmission system, converter transformer, converter valve and converter valve control & protection equipment are equivalent to TVC, whose failure rate and repair rate are respectively λ1 and μ1, as shown in the red dashed rectangle of Figure 3. For the AC filter, the corresponding failure rate and repair rate are respectively λ2 and μ2. DC lines and both sides of the DC filter equipment are equivalent to FLF, whose failure rate and repair rate are respectively λ3 and μ3, as shown in the green dashed rectangle of Figure 3.
Step 4: characterize the state space transfer diagram.
After series equivalence, the state space of the UHVDC transmission system still has considerable complexity. Solving the reliability indices by using state space method directly tends to easily cause mistakes. Considering the symmetry of the UHVDC transmission system, the dimension of the state space equation can be further simplified by only considering the monopole system. Figure 4 presents the state space model of monopole UHVDC transmission system, as shown in the black dash rectangle of Figure 3.
- The upper right number of each state diagram represents the state number. The lower right number represents the number of available converter bridges. The black icon of the left part indicates that the component is in a fault state while the white part indicates that the component is in a normal working condition.
- The equipment outage due to non-self-reasons, such as failure of other equipment, is defined as ‘passive outage’ [21]. As shown in the red dashed rectangle of Figure 4, state 3 is in shutdown state because of ACF failure. There will be no further fault situation on TVC and FLF components. TVC and FLF components are out of operation, but do not need repairs, which is denoted as a passive outage. There will be no transfer progress from state 3 to state 7. However, state 7 may transfer from state 2 and 10, and further transfers to state 3. In this way, the transfer progress between state 3 and state 7 is presented as a one-way arrow in state space diagram. Similarly, the one-way arrows in orange dashed rectangle between state 7 and state 10, in green dashed rectangle between state 4 and state 8, in blue dashed rectangle between state 6 and state 9, and in purple dashed rectangle between state 8 and state 11 can be explained likewise.
Step 5: deduce state space matrix and solve steady probability.
According to the state space diagram and the state transition process, the state transition matrix and the corresponding differential equation can be given by Equation (3), which is used to obtain the probability pi of state i:
where:
By utilizing the Markov approximation principle, the steady-state probability of each capacity state can be obtained. The universal generating function (UGF) method, which basic idea is to represent discrete random variables in polynomial form, can describe well the performance and reliability of a multi-state system [23]. The UGF method can get the final polynomial form result of discrete random variables by defining the merging operators of polynomials according to the discrete random variables algorithm. The UGF method develops a bridge over the monopole to the whole UHVDC transmission system, which is adopted to make a combination and obtain the reliability indices.
Step 6: obtain the reliability indices of UHVDC transmission system.
The same capacity status can be merged according to the number of available converter units. State 1 corresponds to the situation that the number of available converter units is 2 and the cumulative probability is P2. State 2 and state 5 correspond to the situation that the number of available converter units is 1 and the cumulative probability is P1, respectively. Other states correspond to the situation that the number of available converter units is 0 and the cumulative probability is P0.
The AC filter groups of the same converter station can be reserved for each other, which is denoted as the ‘standby effect’ of AC filters. When the number of available converter units is reduced due to the AC filter failure, the number of available converter units can be maximized by adjusting the AC filter position, and then the transmission capacity of the faulty system might increase. As shown in Figure 5a, the number of available converter units of the whole UHVDC transmission system will increase from 1 to 2 by adjusting the AC filter position. The state which number of available converter units equals to zero should be distinguished. State 3, state 7 and state 10 correspond to monopole outage caused by AC filter failure and the cumulative probability is P01. State 4, state 6, state 8, state 9, and state 11 correspond to monopole outage by TVC or FLF failure, and the cumulative probability is P02.
After taking the standby effect of the AC filters into account, there are different situations, as shown in Figure 5. Before replacement, the number of available converter units in Figure 5a,b is both 0. After replacement, the number of converter units increases to 2 in Figure 5a while the number of converter units only increases to 1 in Figure 5b, which is denoted as the ‘recovery effect’ of converter units. As a result, the bipole outage caused by an AC filter failure needs to be distinguished. State 3 corresponds to the situation that the number of the available converter units recovers to 2 and the cumulative probability is P011. State 7 and state 10 correspond to situation that the number of the available converter units recovers to 1 and the cumulative probability is P012.
The number of available converter unit of monopole UHVDC transmission system (Nt) and corresponding probability can be expressed with the following UGF form:
The two poles are in a parallel connection and the number of available converter units satisfies the same probability distribution. When two poles are both in a fault state caused by an AC filter failure, it can be divided into two cases. When the second AC filter fault occurs on the same side, there are no available converter units. When the second AC filter fault occurs on the opposite side, since AC filter group on the same pole can reserve for each other, there are still available converter units and the UHVDC transmission system is equivalent to monopole shutdown. The probability of the two cases is the same. Considering the standby effect of AC filters and the recovery effect of available converter units, the merging operator of two poles can be deduced and the UGF form for the number of available converter units of the whole UHVDC transmission system (NT) can be expressed as Equation (6):
Equations (7)–(11) express the steady probability of state which number of available converter units is 4, 3, 2, 1 and 0 respectively:
Energy availability (EA) and energy unavailability (EU) can be calculated by Equations (12) and (13):
3. Sensitivity Analysis and Redundant Structure Configuration
In this section, sensitivity analysis is utilized to select the most effective redundant components of a UHVDC transmission system and a quantitative redundant structure configuration approach based on cost-benefit analysis is proposed.
Sensitivity analysis is used to locate the key equipment of UHVDC transmission system in terms of reliability. Given the reliability parameters of the various components, the reliability indices of the UHVDC transmission system are determined. Therefore, the steady-state probability of each capacity of the UHVDC transmission system can be regarded as a multi-function of the reliability parameters. Due to the complexity of the state space and the diversity of the situation to be considered by the merging operator, it is difficult to obtain the function expression and the partial derivative between the reliability indices of the UHVDC transmission system and the reliability parameters of various components. The sensitivity of the UHVDC system can be approximated by the slope at a given operating point, calculated by Equation (14):
The sensitivity s can only reflect the influence of component failure rate and repair rate on the probability indices of system transmission capacity. Therefore, the concept of elastic sensitivity e is introduced to reflect the effect of component reliability parameters change on the probability change of system capacity, given by Equation (15) [24]:
Taking the simple two-state system as an example, the normal state is defined as 1 while the fault state is defined as 0. The corresponding failure rate and repair rate are denoted as λ and μ. It is not difficult to obtain that the steady-state probabilities of state 1 and 0 are μ/(λ + μ) and λ/(λ + μ), respectively. EA is μ/(λ + μ) while EU is λ/(λ + μ) in this case. Sensitivity of EA on failure rate and repair rate can be calculated by Equations (16) and (17):
Elastic sensitivity of EA on failure rate and repair rate can be calculated by Equations (18) and (19):
According to the aforementioned theoretical analysis, reducing the failure rate or improving repair rate of crucial device can effectively ameliorate the reliability situation of an UHVDC transmission system. Subject to manufacture and maintenance levels, greatly ameliorating the reliability parameter is unrealistic. A typical method used to improve the reliability level of UHVDC transmission systems in engineering practice is configuring a redundant structure, namely arranging spares for crucial devices. Since spares do not affect the relationships between devices, their contributions to reliability can be discussed at the device level rather than the system level.
Considering a basic device whose failure rate, repair rate and installation rate are λ, μ and γ, respectively, the state space of the Markov process with 0 spare is shown in Figure 6a, with the state number and state capacity given at the top right and top middle of the block, failure and reserve situation given at the bottom, ‘F’ is indicated for failure and ‘R’ is indicated for reserve.
Equation of Markov process transition in steady state is deduced as Equation (20):
Solving above equation, steady probabilities can be obtained as Equations (21)–(23):
Further, device availability (DA) and device unavailability (DU) of the basic unit can be obtained as Equations (24) and (25):
Failure rate and repair rate of equivalent two-state device can be deduced as Equations (26) and (27):
When there is 1 spare for a basic device, the state space of the Markov process is shown as Figure 6b. It is indicated that adding spares will increase the number of both available and unavailable states.
The equation of the Markov process transition in steady state is deduced as Equation (28):
Solving above equation, steady probabilities can be obtained as Equations (29)–(33):
Further, DA and DU of the basic unit with 1 spare can be obtained as Equations (34) and (35):
Under normal circumstances, μ and γ are far great than λ. DA in the case of 0 spare and 1 spare can be approximately comparable:
Failure rate and repair rate of equivalent two-state device can be deduced as Equations (37) and (38):
When there are two spares for a basic device, a similar analysis can be conducted, but is omitted due to limited space in this paper. Adding spares does not change the failure rate but improves the repair rate of an equivalent two-state device. If more spares are configured, the equivalent repair rate will be closer to the actual installation rate. As a result, device availability is improved and system reliability is further ameliorated.
What redundant structure configuration brings to the UHVDC transmission system, is not only reliability amelioration, but also economical cost. Reliability amelioration embodies in improvement of EA while economical cost includes initial fixed cost and recurring operational cost. Evaluation and optimization to the redundant structure configuration of UHVDC system is a trade-off between reliability and economy. Due to the inconsistency between reliability indices and economy indices in terms of dimension and magnitude, redundant structure configuration is difficult. However, the improvement of reliability can be reflected in economic indicators.
Life-cycle cost (LCC) analysis is used to evaluate the total cost of device or system during the life span. LCC of spare device mainly consists of investment cost (CI), operation cost (CO), maintenance cost (CM) and scrapping cost (CS). All costs are converted to current worth by Equation (39):
where n is the lifespan of the spare device and i is the net discount rate after deducting factors such as inflation.
Adding spares can improve the availability of the UHVDC system, which can be reflected in terms of economy, that is, the reduction of cost used to purchase electricity from the real-time market (EP) and enable ancillary service from a reserve provider during the occurrence of de-rated operation or bipole block outage of the UHVDC transmission system (EA), which will result in unplanned power transmission and unexpected frequency deviation:
where E is the earnings of a spare device, ∆EU is the reduction of energy unavailability, PUHVDC is the rated capacity of the UHVDC transmission system, TU is the annual utilization hours of UHVDC transmission system, pe is the electricity price of receiving end grid, ER is the earnings of device salvage, n, A, B and i are the same as Equation (39). Net earnings of spare device can be calculated by Equation (41):
The terms E and LCC can be regarded as a function of the spare number. There will be different EN in different redundant configuration. The number of spares is a discrete and the figure of EN on spares number N can be drawn. Further, redundant structure configuration can be optimized to aim for maximum EN during specific spare number or spare LCC.
4. Case Study
4.1. Reliability Equivalence of UHVDC Transmission System
Taking typical UHVDC transmission system as an example, the reliability parameters of each component are determined by reference [20,25], as shown in Table 1.
The results are shown in Table 2. The probability of normal operation (the number of available converter units is 4) is much higher than the probability of de-rated operation and complete outage (the number of available converter units is 3, 2, 1 or 0). It is a result of the characteristic that various components of the UHVDC transmission system are provided with relatively low level of failure rate but high level of repair rate. The probability of the number of available converter units being 2 is higher than the probability of the number of available converter units being 3, since both AC filter faults and FLF faults cause monopole shutdowns and multiple TVC faults might also cause a complete monopole outage.
The probability of the number of available converter units being 3 or 2 is much higher than the probability of the number of available converter units being 1 or 0, which is mainly because the bipole failure of an UHVDC system always derives from a monopole failure.
4.2. Sensitivity Analysis of UHVDC Transmission System
Table 4 and Table 5 show the sensitivity analysis of reliability parameters to state probability when parameter variation equals to ±1%. Relatively speaking, the reliability failure rate in the UHVDC transmission system is higher than the repair rate. Therefore, when faced with the choice of reducing the failure rate or increasing repair rate in actual operation process, the former should be chosen.
The failure rate and repair rate have little effect on the state probability of the number of available converter units being 1 or 0. The converter valve, converter transformer, valve control and protection unit mainly affect the capacity state that the number of available converter units is 4 and 3. The DC filter, DC lines and AC filters mainly affect the capacity state that the number of available converter units is 4 or 2. Because the converter, the converter transformer, the valve control & protection device are likely to cause a monopole partial shutdown, while the DC filter, DC lines and AC filters easily lead to a complete monopole shutdown.
Table 6 shows the sensitivity and elastic sensitivity analysis results of reliability parameters to energy availability, which adequately confirms the conclusion of the theoretical analysis. In terms of sensitivity data, the influence of the failure rate on the EA of the UHVDC transmission system is higher than that of repair rate since. As for elastic sensitivity data, the effect of failure rate on the EA of the UHVDC transmission system is comparable to the repair rate.
4.3. Redundant Structure Configuration of an UHVDC Transmission System
According to the sensitivity analysis of Section 4.2 in addition to actual engineering experience, converter valves (CV) and converter transformer (CT) are chosen as specific devices, which need a redundant structure configuration. Reliability parameter of CV and CT after two-state equivalence are shown in Table 7.
The installation rate of CV and CT are 1460 occ./yr and 183 occ./yr respectively. A group of converter transformer contains six transformers, so that the failure rate is six times the single failure rate. It can be seen that adding spares will not change equivalent failure rate but really improves equivalent repair rate. With a few spares, the repair rate of equivalent device can approach the installation rate, which is consistent with the result of theoretical analysis. EU in different redundant configuration can be calculated, as shown in Table 8.
A redundant configuration can reduce the energy unavailability of the UHVDC transmission system. Different redundant configurations have different effects on the reduction of energy unavailability. As can be seen from the data in the above table, the configuration effect of the converter transformer is better than that of the converter valve. Arranging one spare can maximize the redundant configuration effect on reliability amelioration. The effect is quite limited starting with the second spare. According to previous reliability parameter analysis results of spare, configuring one spare can make the repair rate of the equivalent system approach the theoretical maximum, that is, the installation rate.
The proposed method is used to conduct cost-benefit analysis of redundant configuration for an UHVDC transmission system. In terms of LCC, the investment cost (CI) of each spare CT is ¥10,000,000, the investment cost (CI) of each spare CV is ¥30,000,000, the operation cost (CO) of each spare device is 2% of investment cost each year, the maintenance cost (CM) of each spare is 3% of investment cost each year, the scrapping cost (CS) is 2% of investment cost and the life span of spare device is 30 years. The earnings of device salvage (ER) is 8% of investment cost. It is assumed that the rated capacity of UHVDC transmission system (PUHVDC) is 8000 MW, the annual utilization hours of UHVDC transmission system (TU) is 5000, the average electricity price of receiving end grid (pe) is ¥0.6, and the cost reduction of ancillary service (EA) is relatively small to be regarded as 0. The net discount rate (i) is valued as 7%. The cost-benefit analysis result in different redundant configuration is shown in Figure 7.
The LCC of a CV spare is higher than that of a CT spare. There is a positive correlation between LCC and spare number, that is, the more spares, the higher the lifetime cost. In terms of spare earnings, the CT spare is much better than the CV spare. For net earnings, a CV spare is negative while a CT spare is positive. If faced with a trade-off, the latter should be chosen.
The proposed method also helps make redundant construct configuration decisions, that is, to determine the optimal scheme in the given constraints. In pursuit of maximum benefit, schemes of 1 CT spare and 0 CV spare should be chosen. In pursuit of relatively high benefit while ensuring relatively low energy unavailability, schemes of 1 CT spare and 1 CV spare should be chosen.
5. Conclusions
In this paper, a redundant structure configuration approach based on reliability equivalence of symmetrical UHVDC transmission systems is proposed. Considering the inherent symmetry characteristics, a state space model to be considered as a monopole rather than a bipole, which effectively reduces the problem dimensions. Merging the operator of a monopole to a bipole is deduced by taking the standby effect of the AC filter and recovery effect of available converter units into account, aiming to realize the reliability equivalence of the whole UHVDC transmission system. Sensitivity analysis is followed to quantify the impact of device parameters on system reliability and locate the specific redundant devices. Cost-benefit analysis is utilized to help configure spares schemes. Case studies are conducted, which lead to some illuminating conclusions.
- The probability of UHVDC transmission system in de-rated operation or bipole outage is much lower than that of normal operation, which matches the practical situation.
- Sensitivity analysis reveals that converter transformer and converter valve should be given the first priority to be configured with redundant structures.
- Configuring a set of redundant transformers is indicated to be of the greatest significance to improve the UHVDC transmission system reliability according to the cost-benefit analysis.
The proposed method can be directly used for UHVDC transmission system reliability evaluation, and can also be extended to other engineering fields with bipolar symmetry characteristics.
Acknowledgments
This work was supported in part by a science and technology project of the State Grid Corporation of China, named “Research on key technology of distribution network planning considering operation control factors” (5211JY17000L).
Author Contributions
Xing Jiang, Chengjin Ye, Yi Ding and Ruipeng Guo proposed and developed the basic models and methods, conducted case studies, analyzed the data and wrote the paper together.
Conflicts of Interest
The authors declare no conflict of interest.
References
- Xi, H.; Tang, G.; Liu, J.; Wei, X.; Zha, K. Development of the ±800 kV/4750 A Ultra High Voltage Direct Current Converter Valve. Proc. CSEE 2014, 32, 15–22. [Google Scholar]
- Liu, Z.; Engineer, S. Ultra-High Voltage AC/DC Grids; Elsevier: Amsterdam, The Netherlands, 2015. [Google Scholar]
- Yuan, Q. Present State and Application Prospect of Ultra HVDC Transmission in China. Power Syst. Technol. 2005, 29, 1–3. [Google Scholar]
- Rao, H.; Luo, B.; Li, X.; Cai, Z.; Li, L. Development of ±800 kV UHVDC Transmission Technology in China. In Proceedings of the International Conference on High Voltage Engineering and Application, Chongqing, China, 9–12 November 2008; pp. 1–7. [Google Scholar]
- Li, Y.; Xu, X.; Chen, S.; Yan, Z. Determine the Reliable Generating Capacity of Power Systems with High HVDC penetration Considering Both Stability and Ancillary Service Requirements. IET Gener. Transm. Distrib. 2018, 12, 540–547. [Google Scholar] [CrossRef]
- Lescale, V.F.; Kumar, A.; Juhlin, L.E.; Bjorklund, H. Challenges with Multi-Terminal UHVDC Transmissions. In Proceedings of the Joint International Conference on Power System Technology and IEEE Power India Conference, Powercon, 2008, New Delhi, India, 12–15 October 2008; pp. 1–7. [Google Scholar]
- Sheng, B.; Danielsson, J.; Fu, Y.; Liu, Z. Converter Valve Design and Valve Testing for Xiangjiaba-Shanghai ±800 kV 6400 MW UHVDC Power Transmission Project. In Proceedings of the International Conference on Power System Technology, Hangzhou, China, 24–28 October 2010; pp. 1–5. [Google Scholar]
- Cheng, X.; Lv, J.; Gou, R.; Zhao, J. Study for Arrangement of the Smoothing Reactor in ±800 kV UHVDC Project. In Proceedings of the International Conference on High Voltage Engineering and Application, ICHVE 2008, Chongqing, China, 9–12 November 2008; pp. 371–374. [Google Scholar]
- Zhou, X.; Lv, J.; Gou, R.; Zhao, J. The Arrester Protection Study for Valve Side of Highest Potential Converter Transformer in ±800 kV UHVDC Project. In Proceedings of the International Conference on High Voltage Engineering and Application, ICHVE 2008, Chongqing, China, 9–12 November 2008; pp. 80–83. [Google Scholar]
- Wang, J.; Wen, X.; Lei, L.; Li, J. Technical and Economic Performance Analysis on Vertical Grounding Electrodes of ±800 KV UHVDC. In Proceedings of the International Conference on Power System Technology, Powercon, 2006, Chongqing, China, 22–26 October 2006; pp. 1–6. [Google Scholar]
- Lv, J.; Li, L. Study on the Key Equipment’s Insulation Level of ±800 kV UHVDC Power Transmission Project. In Proceedings of the Power Engineering Society Conference and Exposition in Africa, PowerAfrica ’07, Johannesburg, South Africa, 16–20 July 2007; pp. 1–4. [Google Scholar]
- Huang, H.; Ramaswami, V. Design of UHVDC Converter Station. In Proceedings of the 2005 IEEE/PES Transmission and Distribution Conference and Exhibition: Asia and Pacific, Dalian, China, 18 August 2005; pp. 1–6. [Google Scholar]
- Deng, X.; Zhou, R.; Zhang, C. Study on Stability of ±800 kV UHVDC Transmission Project. In Proceedings of the IPEC 2007 Power Engineering Conference, Singapore, 3–6 December 2007; pp. 625–629. [Google Scholar]
- Fu, L.; Wei, F.; Yu, Y. Research on Test Technology of Security and Stability Control Technology of UHVDC Based on Real-Time Digital Simulation. In Theory, Methodology, Tools and Applications for Modeling and Simulation of Complex Systems; Springer: Singapore, 2016; pp. 432–441. [Google Scholar]
- Zhang, Y.; Chi, Y.; Wen, F. An Analytic Model for Fault Diagnosis in Power Systems Utilizing Redundancy and Temporal Information of Alarm Messages. IEEE Trans. Power Syst. 2016, 31, 4877–4886. [Google Scholar] [CrossRef]
- Perrow, C. Normal Accidents: Living with High Risk Technologies; Princeton University Press: Princeton, NJ, USA, 2011. [Google Scholar]
- Wang, L.; Wang, G.; Li, B. Reliability Evaluation of UHVDC Systems Using Monte Carlo Simulation. In Proceedings of the IEEE Power & Energy Society General Meeting, Calgary, AB, Canada, 26–30 July 2009; pp. 1–6. [Google Scholar]
- Hua, Y.; Li, S.; Ma, Y.; Chen, P. Reliability Evaluation of UHVDC Systems Based on Fault Tree Analysis. In Proceedings of the International Conference on Power System Technology, Chengdu, China, 20–22 October 2014; pp. 2173–2178. [Google Scholar]
- Xie, K.; Hu, B.; Singh, C. Reliability Evaluation of Double 12-Pulse Ultra HVDC Transmission Systems. IEEE Trans. Power Deliv. 2015, 31, 210–218. [Google Scholar] [CrossRef]
- Ma, Y.; Li, S.; Hua, Y.; Yu, L. Reliability Evaluation to Converter Transformers of 2 × 12-Pulse UHVDC Transmission System. In Proceedings of the China International Conference on Electricity Distribution, Shenzhen, China, 23–26 September 2014; pp. 219–222. [Google Scholar]
- Li, S.; Ma, Y.; Hua, Y.; Chen, P. Reliability Equivalence and Sensitivity Analysis to UHVDC Systems Based on the Matrix Description of the F&D Method. IEEE Trans. Power Deliv. 2016, 31, 456–464. [Google Scholar] [CrossRef]
- CIGRE 14-97(WG04). Protocol for Reporting the Operational Performance of HVDC Transmission Systems; CIGRE: Paris, France, 2014. [Google Scholar]
- Lisnianski, A.; Frenkel, I.; Ding, Y. Multi-State System Reliability Analysis and Optimization for Engineers and Industrial Managers; Springer: London, UK, 2010. [Google Scholar]
- Zhou, J.; Chen, W.; Xie, K. A Sensitivity Analysis Model of HVDC Transmission System Reliability Evaluation. Power Syst. Technol. 2007, 31, 18–23. [Google Scholar]
- Yang, D.; Zhang, Y.; Zhu, D. Reliability Evaluation Method for UHVDC Transmission System. Mod. Electr. Power 2011, 4, 2. [Google Scholar]
Figure 1.
F&D method for reliability analysis of UHVDC transmission system.

Figure 2.
Main devices and topological structure of UHVDC transmission.
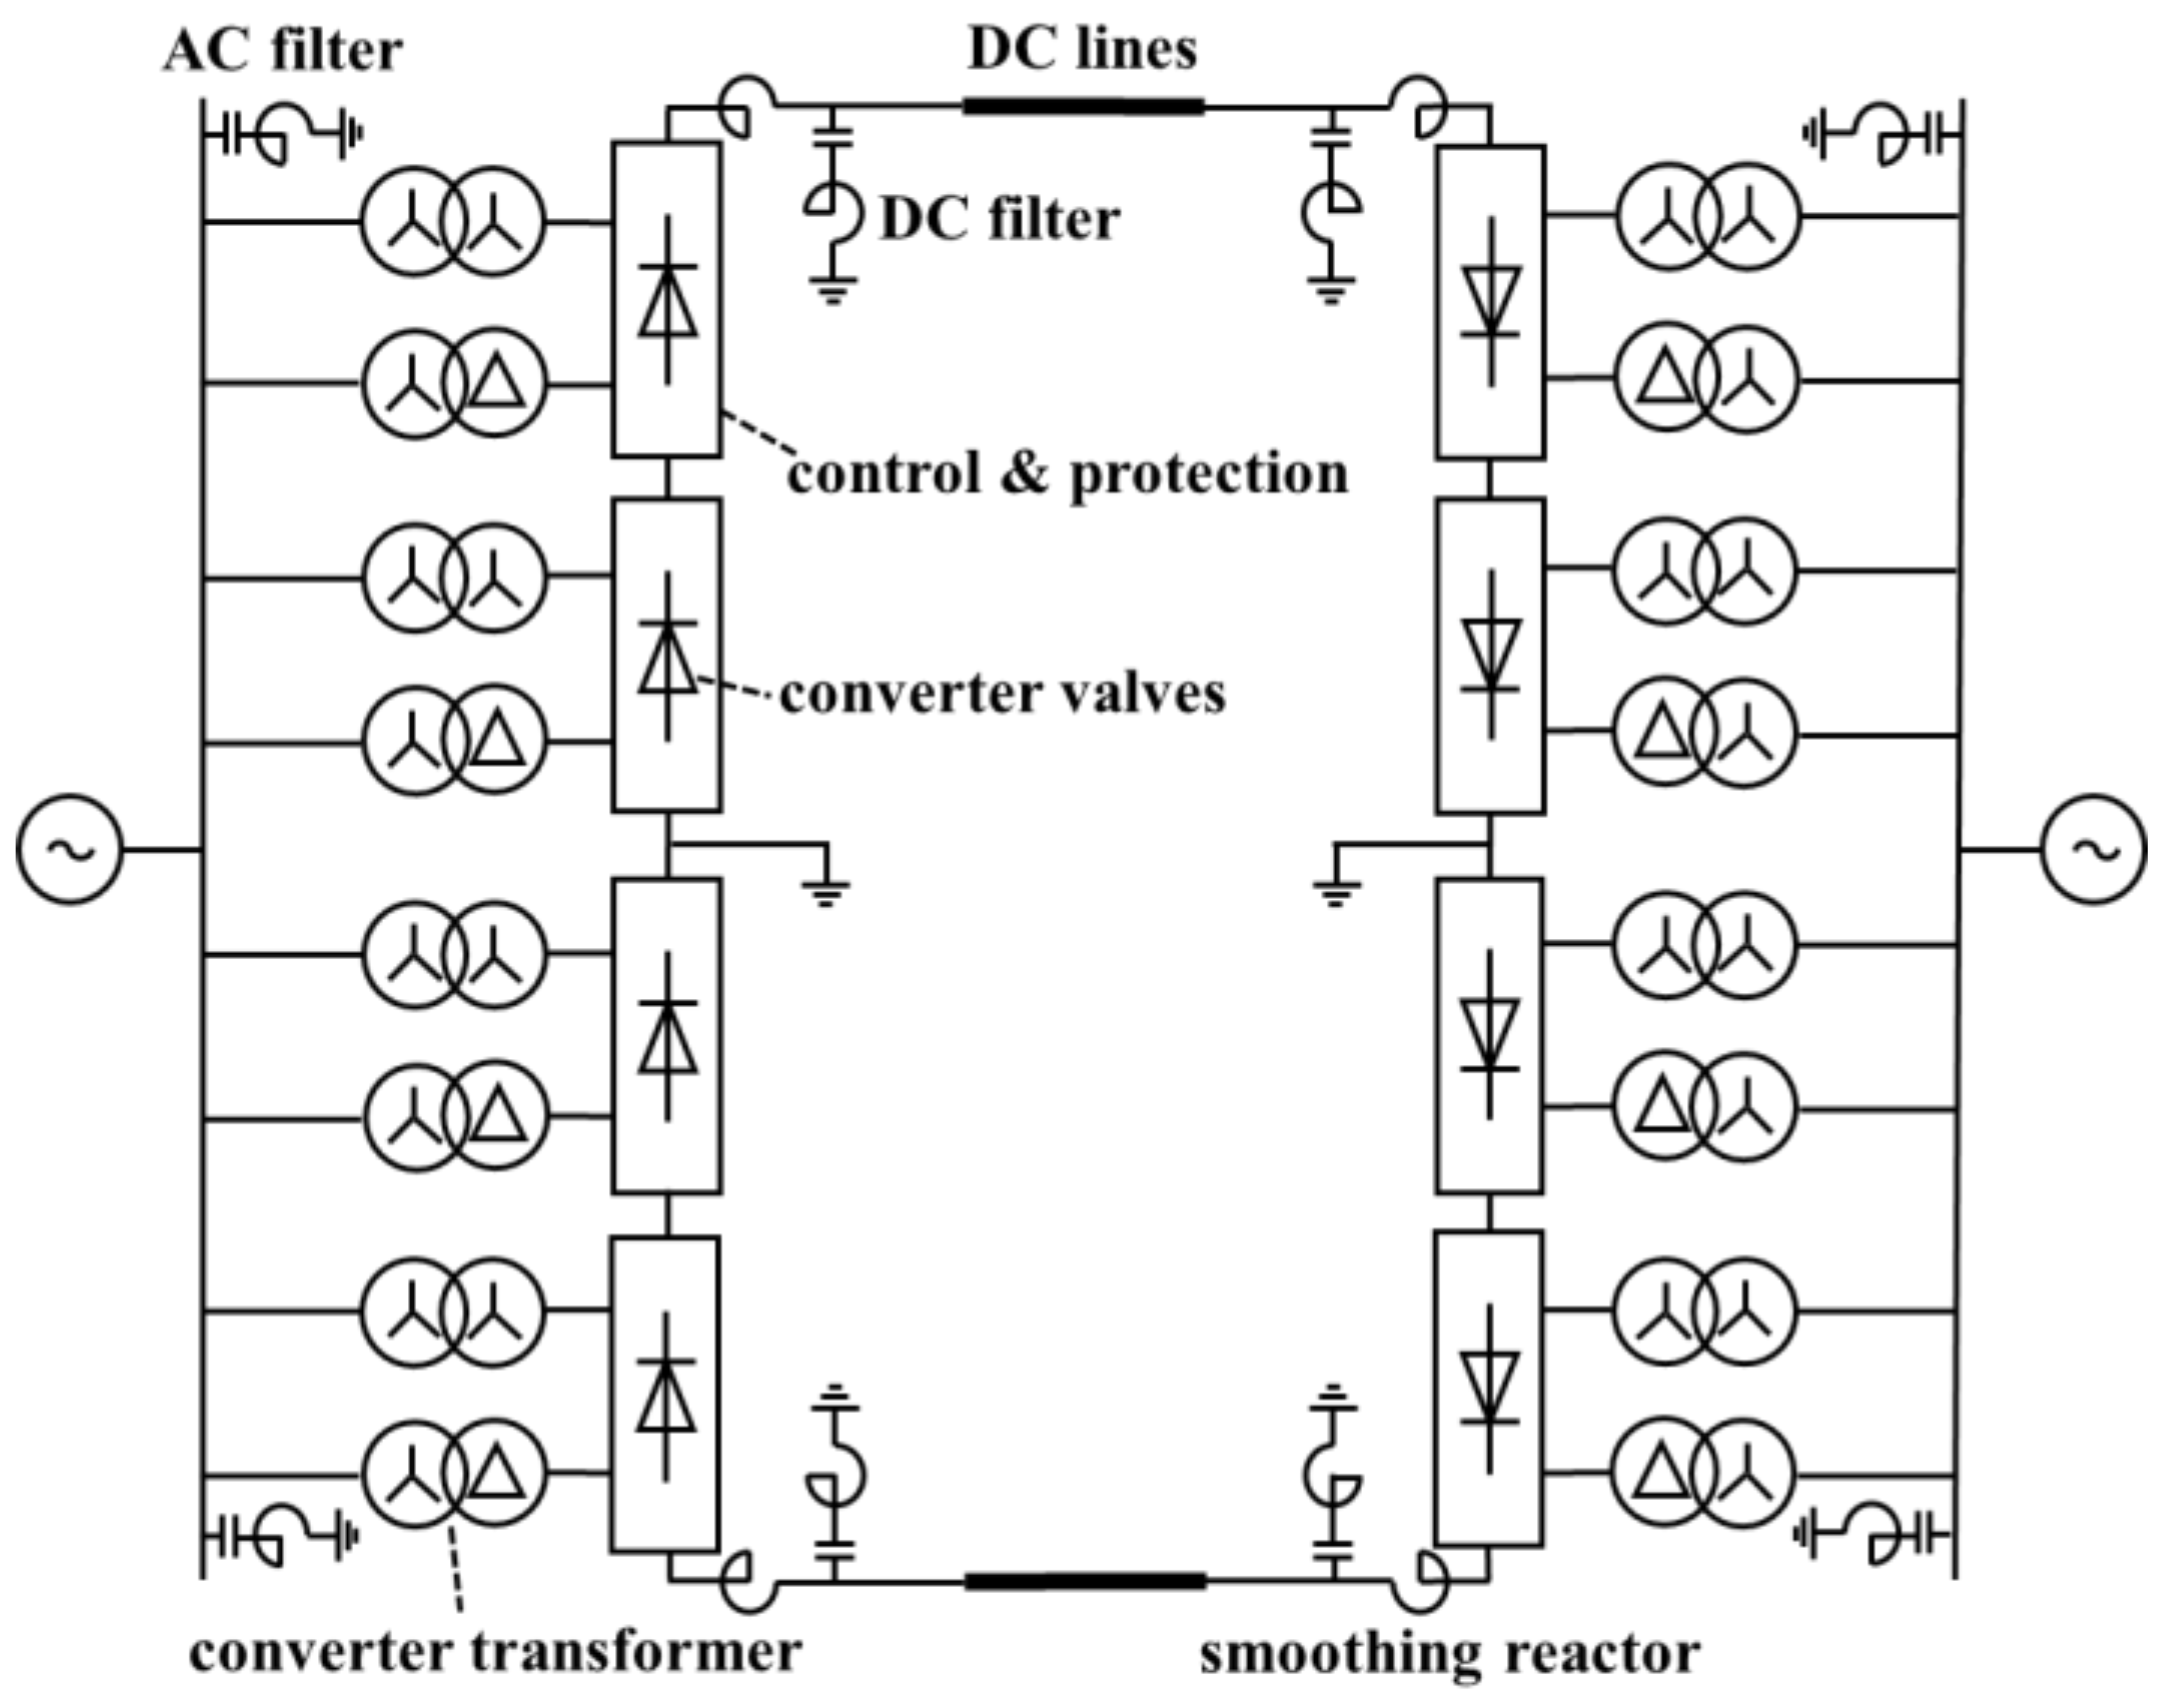
Figure 3.
Reliability topological structure of UHVDC transmission.

Figure 4.
Monopole state space model of UHVDC transmission system.
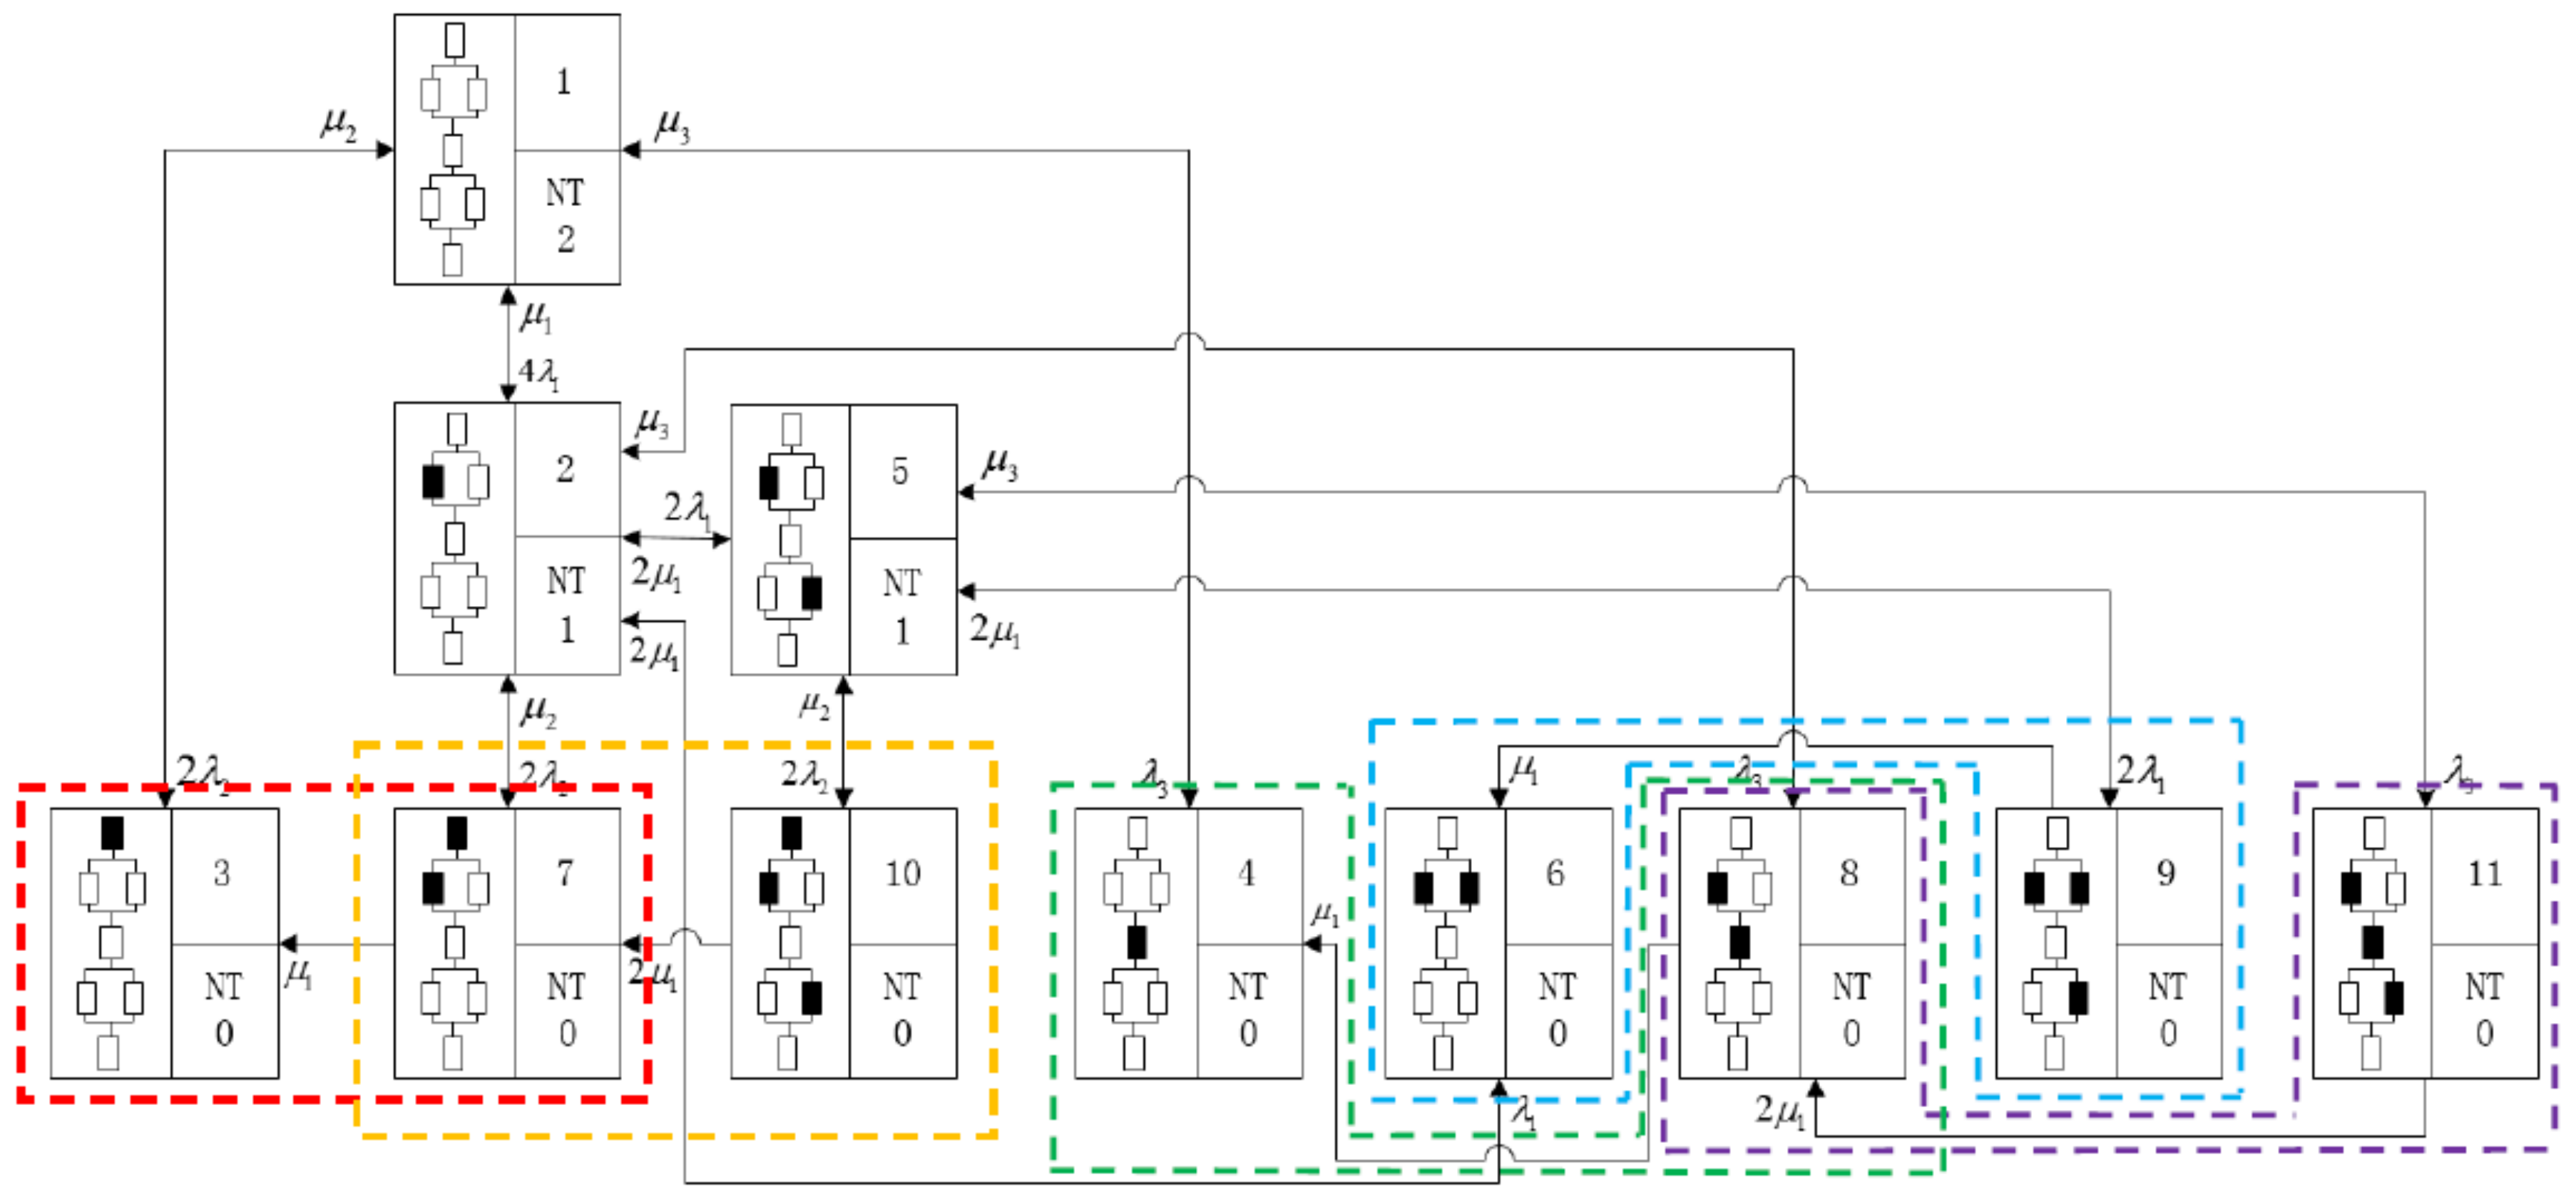
Figure 5.
Effect to be concerned when deducing the merging operator of two poles: (a) Standby effect of AC filters; (b) Recovery effect of converter units.
Figure 5.
Effect to be concerned when deducing the merging operator of two poles: (a) Standby effect of AC filters; (b) Recovery effect of converter units.
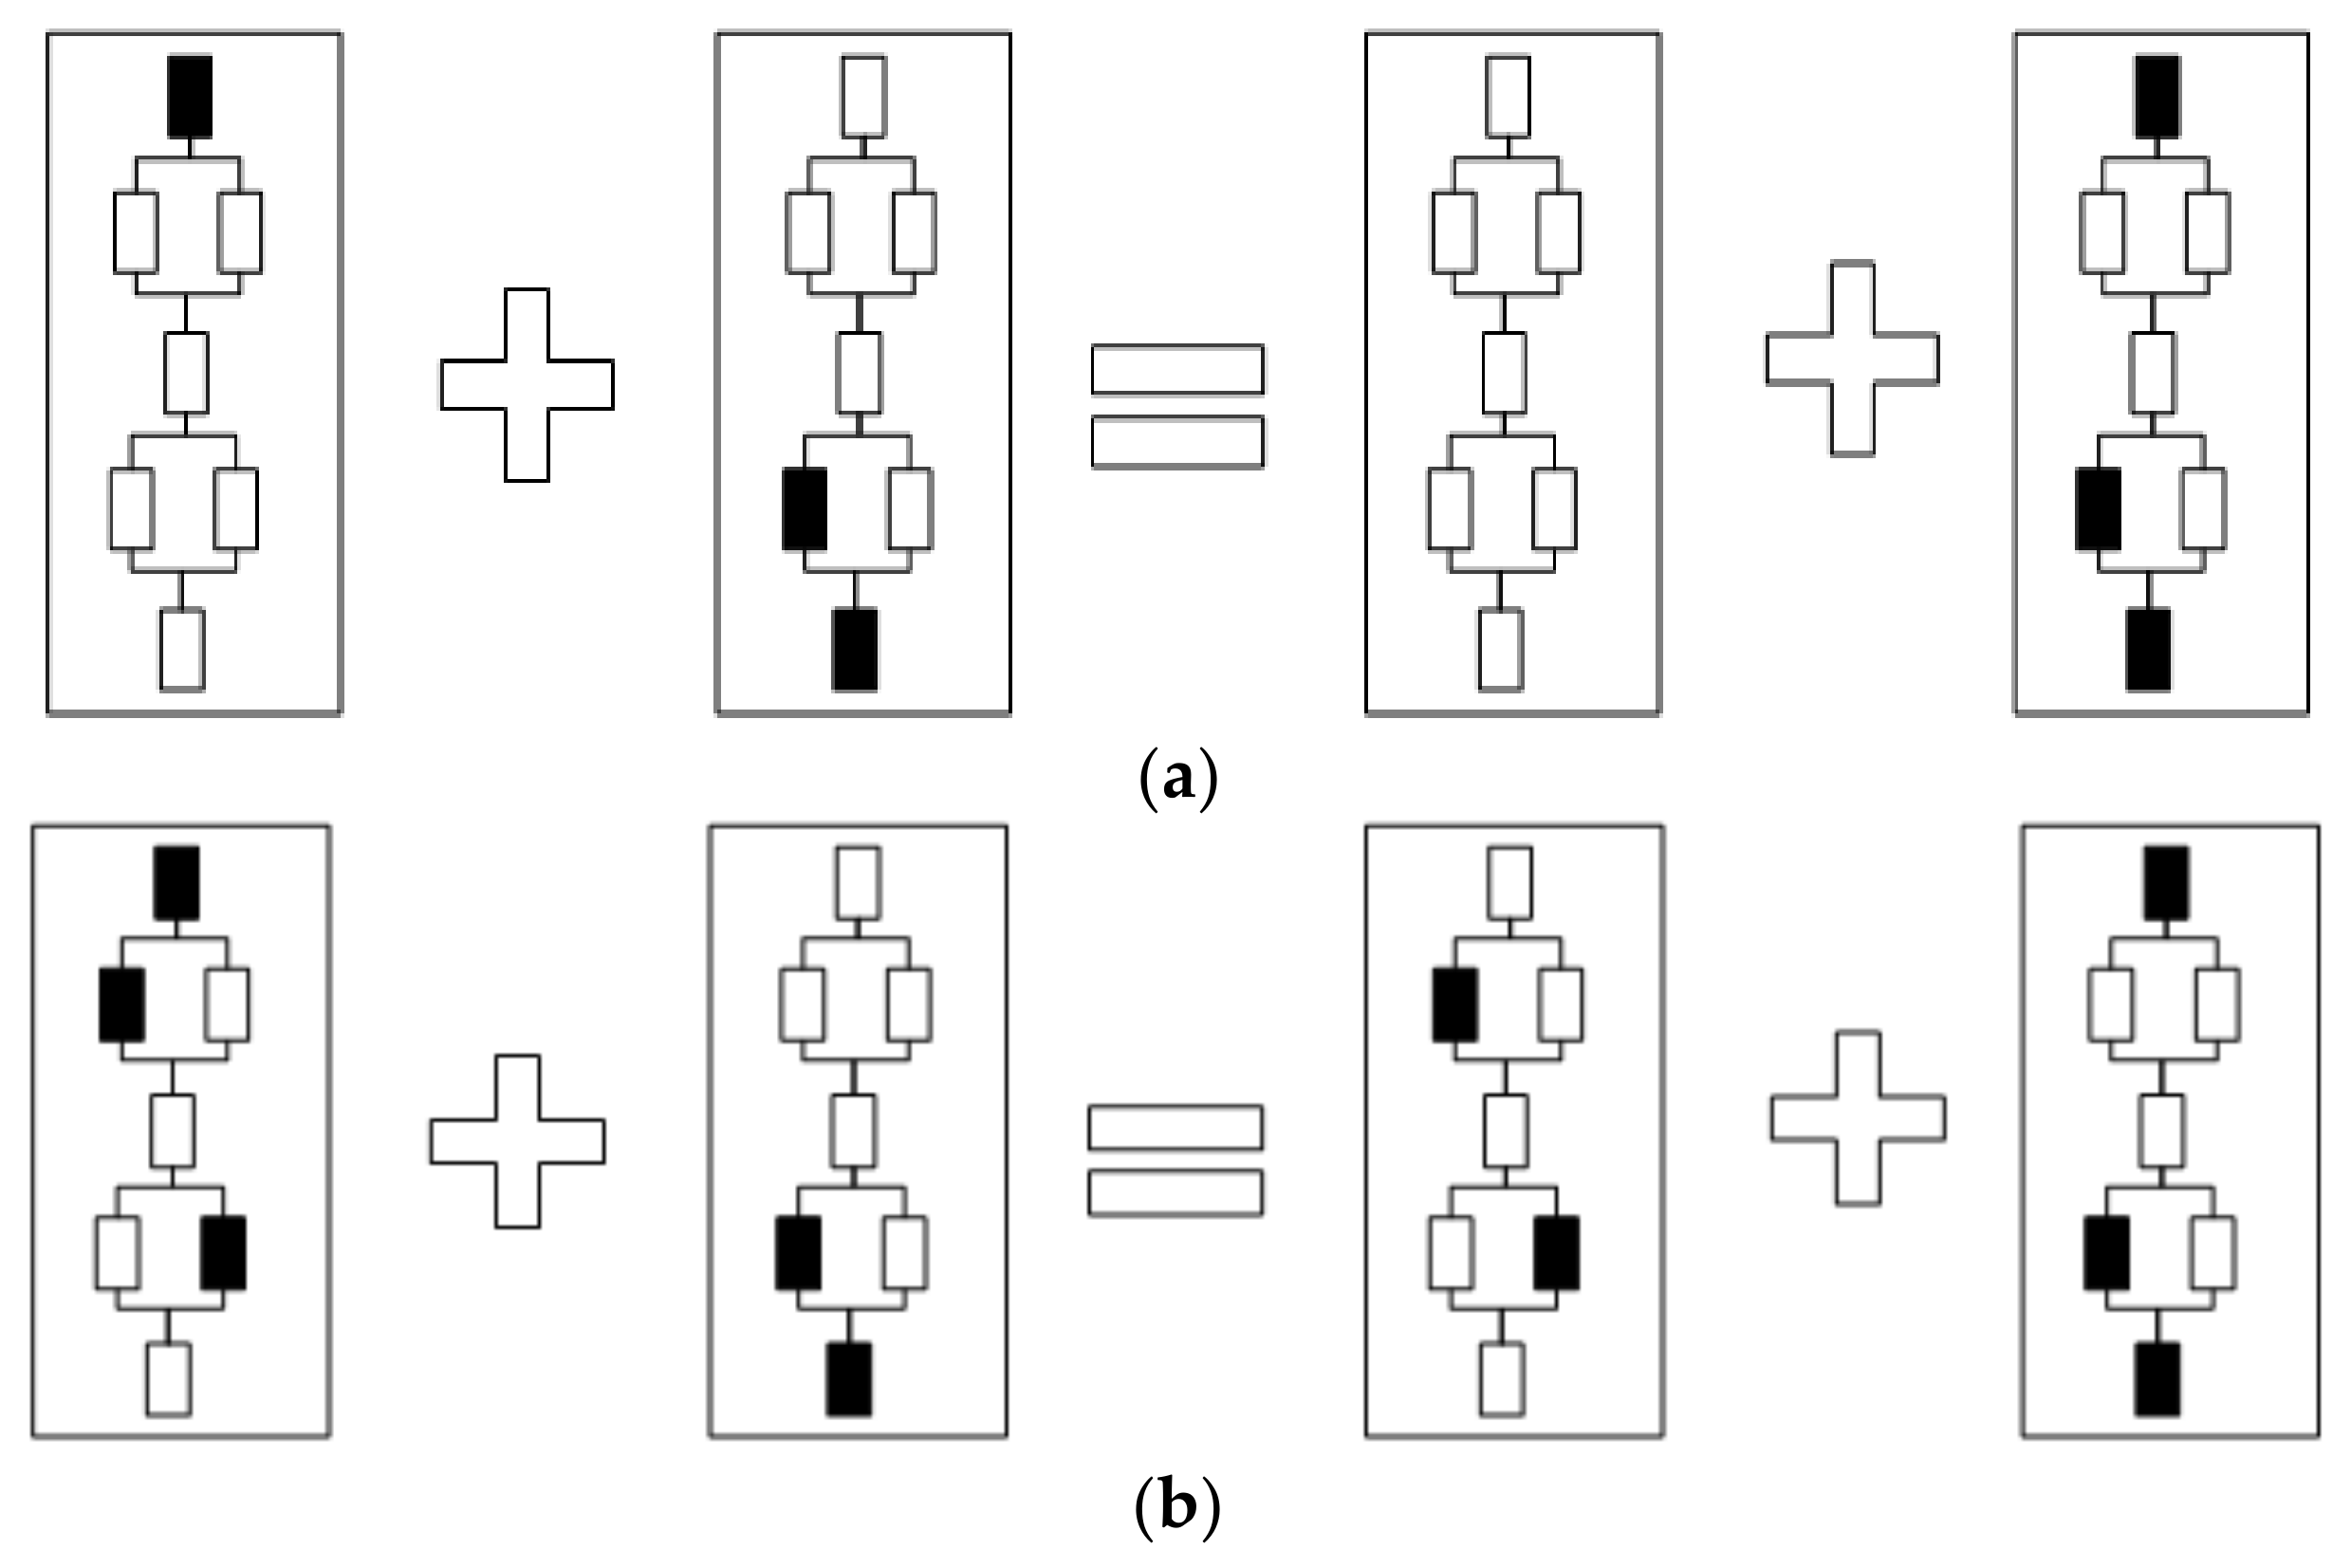
Figure 6.
State space model of basic device for reliability analysis: (a) Basic device without spare; (b) Basic device with 1 spare.
Figure 6.
State space model of basic device for reliability analysis: (a) Basic device without spare; (b) Basic device with 1 spare.
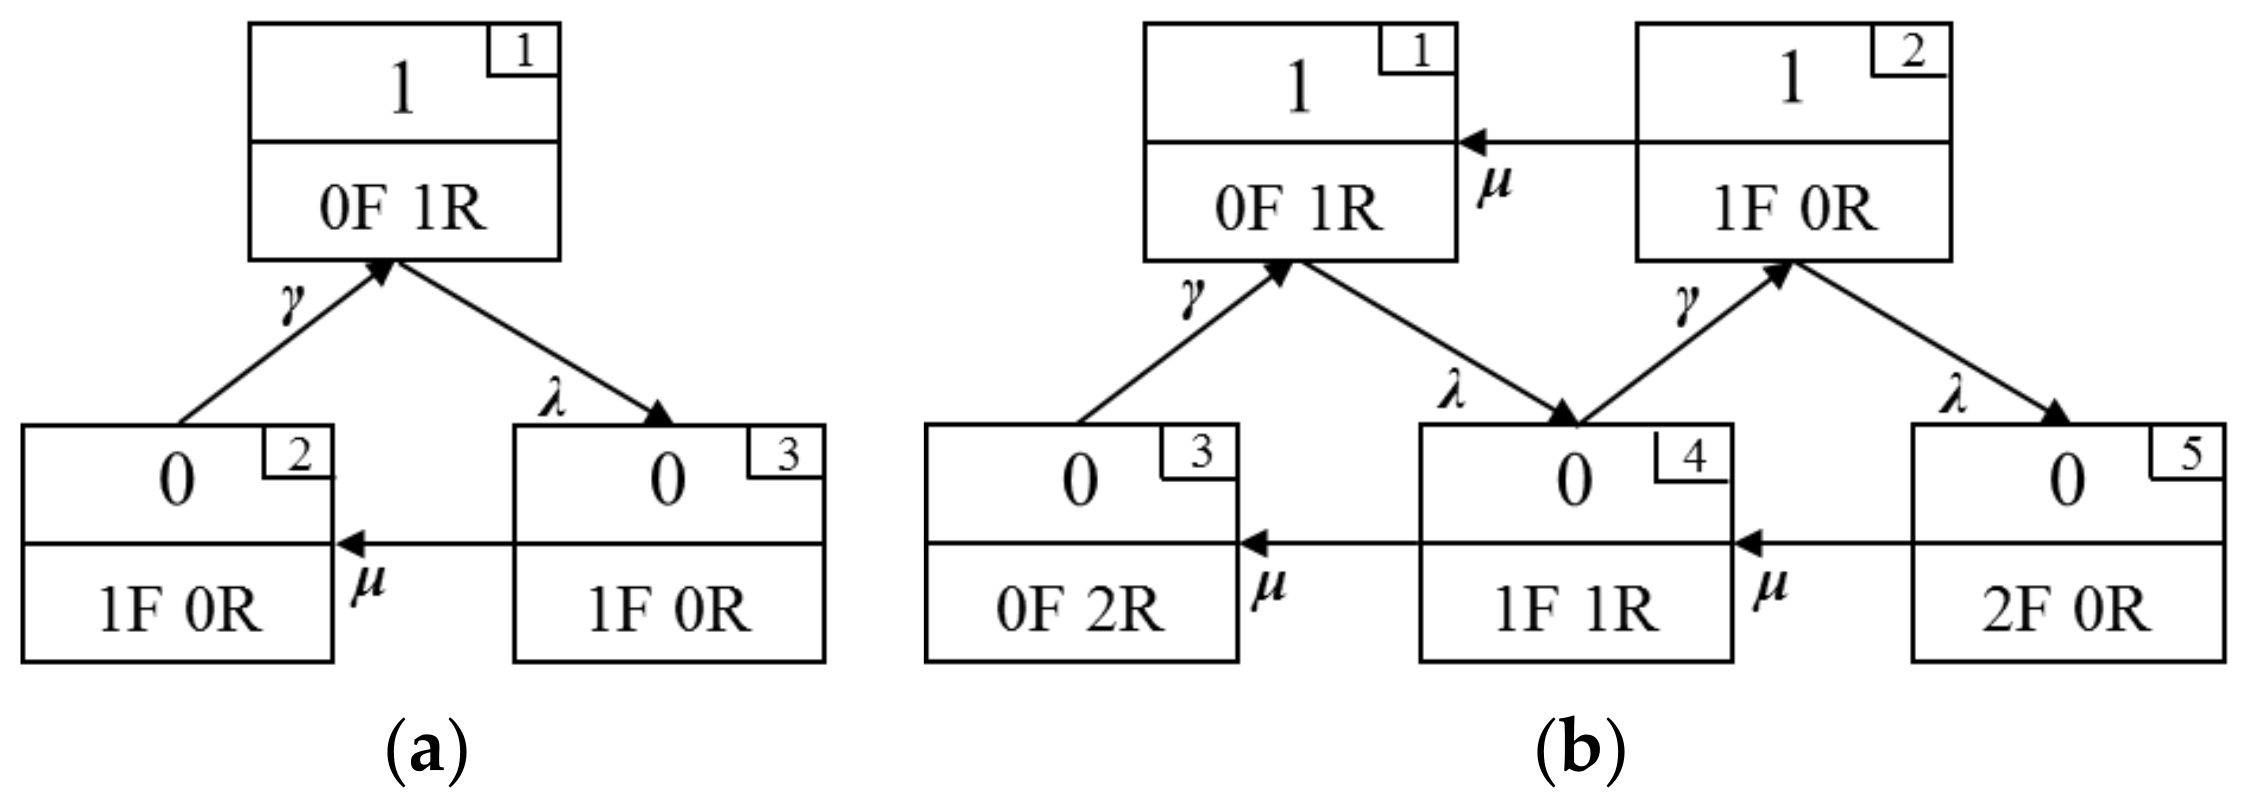
Figure 7.
Cost-benefit analysis: (a) LCC in different redundant configuration; (b) E in different redundant configuration; (c) EN in different redundant configuration.
Figure 7.
Cost-benefit analysis: (a) LCC in different redundant configuration; (b) E in different redundant configuration; (c) EN in different redundant configuration.


Table 1.
Reliability parameters of UHVDC transmission systems.
| Component | Failure Rate (occ./yr) | Repair Rate (occ./yr) |
|---|---|---|
| Converter valve (CV) | 0.1374 | 1460.000 |
| Converter transformer (CT) | 0.0126 | 290.501 |
| Converter control (CC) | 0.088 | 1158.12 |
| DC filter (DCF) | 0.25 | 730 |
| DC line (DCL) | 4.7080 | 1101.890 |
| AC filter (ACF) | 0.2 | 876 |
Table 2.
Comparison of reliability indices in terms of state reliability.
| Number of Available Converter Unit | This Article | Reference [25] |
|---|---|---|
| 4 | 0.98757 | 0.98758 |
| 3 | 0.00169 | 0.00169 |
| 2 | 0.01071 | 0.01071 |
| 1 | 0.00001 | 0.00001 |
| 0 | 0.00002 | 0.00001 |
Table 3.
Computational efficiency of proposed method and the method in reference [25].
Table 3.
Computational efficiency of proposed method and the method in reference [25].
| Method | Environment | CPU | Tool | Computational Time |
|---|---|---|---|---|
| Proposed method | PC (Lenovo) | Intel Core i5-4590T (2.0 GHz) | matlab | 0.000121 s |
| Reference [25] | PC (Lenovo) | Intel Core i5-4590T (2.0 GHz) | matlab | 0.050839 s |
Table 4.
Sensitivity analysis of failure parameters to state probability.
| λ | NT = 4 | NT = 3 | NT = 2 | NT = 1 | NT = 0 |
|---|---|---|---|---|---|
| CV | 0.005399 | 0.005393 | 2.11 × 10⁻⁵ | 2.68 × 10⁻⁵ | 5.7 × 10⁻⁹ |
| CT | 0.027097 | 0.027069 | 0.000106 | 0.000135 | 2.86 × 10⁻⁸ |
| CC | 0.006804 | 0.006797 | 2.66 × 10⁻⁵ | 3.38 × 10⁻⁵ | 7.18 × 10⁻⁹ |
| DCF | 0.005405 | 1.11 × 10⁻⁵ | 0.005385 | 4.58 × 10⁻⁶ | 2.69 × 10⁻⁵ |
| DCL | 0.001783 | 3.80 × 10⁻⁶ | 0.001777 | 1.51 × 10⁻⁶ | 8.87 × 10⁻⁶ |
| ACF | 0.004483 | 9.33 × 10⁻⁶ | 0.004492 | 3.65 × 10⁻⁸ | 9.20 × 10⁻⁷ |
Table 5.
Sensitivity analysis of repair parameters to state probability.
| μ | NT = 4 | NT = 3 | NT = 2 | NT = 1 | NT = 0 |
|---|---|---|---|---|---|
| CV | 5.07 × 10⁻⁷ | 5.07 × 10⁻⁷ | 1.98 × 10⁻⁹ | 2.52 × 10⁻⁹ | 5.36 × 10⁻¹³ |
| CT | 1.18 × 10⁻⁶ | 1.17 × 10⁻⁶ | 4.59 × 10⁻⁹ | 5.86 × 10⁻⁹ | 1.24 × 10⁻¹² |
| CC | 5.16 × 10⁻⁷ | 5.16 × 10⁻⁷ | 2.02 × 10⁻⁹ | 2.56 × 10⁻⁹ | 5.45 × 10⁻¹³ |
| DCF | 1.85 × 10⁻⁶ | 3.53 × 10⁻⁹ | 1.84 × 10⁻⁶ | 1.57 × 10⁻⁹ | 9.21 × 10⁻⁹ |
| DCL | 7.62 × 10⁻⁶ | 1.45 × 10⁻⁸ | 7.59 × 10⁻⁶ | 6.46 × 10⁻⁹ | 3.79 × 10⁻⁸ |
| ACF | 1.02 × 10⁻⁶ | 1.91 × 10⁻⁹ | 1.03 × 10⁻⁶ | 8.52 × 10⁻¹² | 2.10 × 10⁻¹⁰ |
Table 6.
Sensitivity analysis of reliability parameters to energy availability.
| Component | s | e | ||
|---|---|---|---|---|
| λ | μ | λ | μ | |
| CV | 0.001358 | 1.276 × 10⁻⁷ | 0.000188 | 0.000187 |
| CT | 0.006815 | 2.955 × 10⁻⁷ | 0.000086 | 0.000086 |
| CC | 0.001714 | 1.299 × 10⁻⁷ | 0.000151 | 0.000151 |
| DCF | 0.002720 | 9.316 × 10⁻⁷ | 0.000684 | 0.000684 |
| DCL | 0.000897 | 3.835 × 10⁻⁶ | 0.004250 | 0.004251 |
| ACF | 0.002245 | 5.126 × 10⁻⁷ | 0.000452 | 0.000452 |
Table 7.
Reliability parameter analysis of specific devices.
| Device | Converter Valves | Converter Transformer | ||
|---|---|---|---|---|
| Parameter | Failure Rate (occ./yr) | Repair Rate (occ./yr) | Failure Rate (occ./yr) | Repair Rate (occ./yr) |
| No spares | 0.1374 | 730.000 | 0.0756 | 70.7264 |
| 1 spare | 0.1374 | 1459.9 | 0.0756 | 182.9884 |
| 2 spares | 0.1374 | 1460.0 | 0.0756 | 183 |
Table 8.
Energy unavailability in different redundant structure configuration.
| Converter Transformer | No Spares | 1 Spare | 2 Spares | |
|---|---|---|---|---|
| Converter Valves | ||||
| No spares | 0.026598898 | 0.014013514 | 0.014013005 | |
| 1 spare | 0.026418713 | 0.013829798 | 0.013829288 | |
| 2 spares | 0.026418700 | 0.013829785 | 0.013829272 | |
© 2018 by the authors. Licensee MDPI, Basel, Switzerland. This article is an open access article distributed under the terms and conditions of the Creative Commons Attribution (CC BY) license (http://creativecommons.org/licenses/by/4.0/).
Share and Cite
MDPI and ACS Style
Jiang, X.; Ye, C.; Ding, Y.; Guo, R. Reliability Equivalence to Symmetrical UHVDC Transmission Systems Considering Redundant Structure Configuration. Energies 2018, 11, 753. https://doi.org/10.3390/en11040753
AMA Style
Jiang X, Ye C, Ding Y, Guo R. Reliability Equivalence to Symmetrical UHVDC Transmission Systems Considering Redundant Structure Configuration. Energies. 2018; 11(4):753. https://doi.org/10.3390/en11040753
Chicago/Turabian StyleJiang, Xing, Chengjin Ye, Yi Ding, and Ruipeng Guo. 2018. "Reliability Equivalence to Symmetrical UHVDC Transmission Systems Considering Redundant Structure Configuration" Energies 11, no. 4: 753. https://doi.org/10.3390/en11040753
Note that from the first issue of 2016, this journal uses article numbers instead of page numbers. See further details here.