Influence of In Situ Pyrolysis on the Evolution of Pore Structure of Oil Shale
by
 ,
,
Zhijun Liu
1,2 ,
,
Dong Yang
1,*,
Yaoqing Hu
1,
Junwen Zhang
3,
Jixi Shao
1,
Su Song
4 and
Zhiqin Kang
1 1
Institute of Mining Technology, Taiyuan University of Technology, Taiyuan 030024, China
2
School of Mining Engineering, Heilongjiang University of Science and Technology, Harbin 150022, China
3
College of Resource and Safety Engineering, China University of Mining and Technology (Beijing), Beijing 100083, China
4
Department of Mechanical Engineering, Keio University, Yokohama 223-8522, Japan
*
Author to whom correspondence should be addressed.
Energies 2018, 11(4), 755; https://doi.org/10.3390/en11040755
Submission received: 9 February 2018
/
Revised: 11 March 2018
/
Accepted: 21 March 2018
/
Published: 27 March 2018
Abstract
:The evolution of pore structure during in situ underground exploitation of oil shale directly affects the diffusion and permeability of pyrolysis products. In this study, on the basis of mineral analysis and thermogravimetric results, in combination with the low-pressure nitrogen adsorption (LPNA) and mercury intrusion porosimetry (MIP) technique, the evolution of pore structure from 23 to 650 °C is quantitatively analyzed by simulating in situ pyrolysis under pressure and temperature conditions. Furthermore, based on the experimental results, we analyze the mechanism of pore structure evolution. The results show the following: (1) The organic matter of Fushun oil shale has a degradation stage in the temperature range of 350–540 °C, and there is no obvious temperature gradient between decomposition of kerogen and the secondary decomposition of bitumen. The thermal response mechanisms of organic matter and minerals are different in each temperature stage, and influence the change of pore structure. (2) Significant changes occur in pore shape at 350 °C, where thermal decomposition of kerogen begins. The ink-bottle pores are dominant when the temperature is less than 350 °C, whereas slit pores dominate when the temperature is greater than 350 °C. (3) The change in pore structure of oil shale is much less significant from 23 to 350 °C. The pore volume, porosity, and specific surface area (SSA) of samples increase rapidly with temperature varying from 350 to 600 °C. The variation of each parameter is dissimilated from 600 to 650 °C: the porosity and pore volume increases with a small gradient from 600 to 650 °C, and SSA decreases significantly. (4) The lithostatic pressure does not cause change in the evolution discipline of the pore structure, but the inhibitory effect on the pore development is significant.
1. Introduction
According to the World Energy Council (WEC) [1], global energy demand is expected to increase by approximately 30 percent by 2040. Oil shale, an organic-rich and fine-grained sedimentary rock, consists of a mineral porous matrix that contains insoluble kerogen. Liquid hydrocarbons (shale oil) and combustible shale gas can be obtained from insoluble kerogen after heat treatment [2]. The world’s oil shale reserves contain approximately 6050 billion barrels of shale oil, which is four times that of conventional crude oil [3]. Therefore, as a kind of unconventional energy, oil shale has attracted worldwide attention with its rich resources and comprehensive utilization value [4,5,6].
With the development of mining technology, in situ exploitation has become a new trend because of its large mining depth, high oil recovery rate, minimal land occupation, and environmentally friendly methods [7]. In situ oil shale exploitation refers to the method of directly heating the existing oil shale in the ground to convert the solid kerogen into liquid or gaseous hydrocarbon at high temperatures by means of electricity [8,9], fluid convection [10,11], radiation [12], or combustion [13]. These products are expelled through pores and fractures in the oil shale and are extracted through production wells. In situ pyrolysis of oil shale involves complex physicochemical reactions [14]. The microscopic pore structure and physicochemical properties (such as mechanical properties and adsorption properties) interact with each other and vary significantly during the pyrolysis process [15]. The complex porous structure in the oil shale plays an important role in the process of in situ exploitation, which influences the flow behavior and heat transfer efficiency of the heating medium directly during the in situ transformation process (convection heating mode), and also affects the diffusion and flow behavior of oil and gas products in oil shale [16,17]. Therefore, it is particularly important to pay attention to the characteristics of pyrolysis of oil shale and the mobility of products. At present, research has made great progress in describing the physicochemical characteristics of oil shale and kerogen [18,19,20,21,22], as well as the relationship between pyrolysis characteristics of oil shale and pyrolysis temperature, pyrolysis pressure, heating rate, heating duration, particle size, and other factors [23,24,25,26,27,28,29,30,31,32]. Analysis on the pore structure mainly focuses on shale’s geologically evolving processes or reservoir characteristics, such as the relationship between porosity and organic matter content, maturity, etc. [33,34,35,36,37]. However, this is not enough to study the evolution of pore construction in the pyrolysis process of oil shale.
Some scholars, based on the combination of CT technology and three-dimensional reconstruction, studied the structure of microscale pore clusters during oil shale pyrolysis [38], the consistency of thermal weight loss and porosity [39], and estimation of permeability [40]. Yang et al. [41] quantitatively characterized the pore structure during pyrolysis by mercury intrusion porosimetry (MIP). On a smaller scale, using low-pressure nitrogen adsorption (LPNA), Han and Sun et al. [42,43] concluded that heating softens or carbonizes organic matter and causes pore blockage, which affects pore structure parameters. Wang et al. [44] considered that pore connectivity caused by the generation and migration of pyrolysis products is an important factor for the increase of porosity. Due to the different effective range and testing principles of various testing methods, while the pore size of oil shale has a larger-scale distribution from the nanometer level to the micrometer level under pyrolysis conditions, it is difficult to fully display the distribution of the entire pore space by using a single means. Therefore, Bai and Geng et al. [17,45] analyzed the pyrolysis characteristics and pore structure of oil shale by combining MIP with CT or LPNA. In the above studies, as a factor that cannot be neglected in in situ pyrolysis, the role of lithostatic pressure is seldom considered. Based on the condition of the in situ pressure, Nottenburg et al. [46] analyzed the change in mechanical properties of oil shale during pyrolysis and found that 380 °C is a turning point for the deterioration of mechanical properties of Green River oil shale. Allan et al. [47] described the pore structure change of oil shale qualitatively using a scanning electron microscope (SEM), and found that the lithostatic pressure caused partial pores to be compressed associated with the pyrolysis products escaping from oil shale. Eseme et al. [15] found that the increasing temperature results in loss of strength and decrease in Young’s modulus, and the response is correlated with organic matter content. The above results deepened people’s understanding of oil shale pore structure evolution during in situ pyrolysis. However, in situ pyrolysis characteristics and multiscale characterizations of oil shale pore structure remain largely unstudied.
The purpose of this study is to provide a more comprehensive and quantitative characterization of the pore structure evolution of oil shale during in situ pyrolysis. The lithostatic pressure is simulated, and the in situ pyrolysis is carried out at temperatures ranging from 23 to 650 °C. The pore structure evolution of Fushun oil shale is measured and analyzed at varying pyrolysis final temperatures by combining the LPNA and MIP techniques. This research is crucial to the technology for in situ underground conversion of oil shale.
2. Materials and Methods
2.1. Preparation of Oil Shale Samples
Oil shale samples were collected from the Eastern Fushun Opencast Mine in the Liaoning Province, China; they were collected at a depth of 400 m and were sealed immediately using paraffin wax to avoid weathering and deterioration. After that, they were machined into standard 50 mm diameter, 100 mm long cylinders and dried for 12 h at 70 °C for use in pyrolysis experiments.
The density and porosity of samples of initial oil shale were determined according to the national standards GB/T 23561.2-2009 [48] and SY/T 5336-2006 [49], respectively (Table 1). The mineral composition of the sample was determined by using a Rigaku D/Max-2500 X-ray diffractometer (manufactured by Shimadzu, Kyoto, Japan) (Table 1). Fushun oil shale has a relatively low original porosity, and quartz and clay are the primary mineral components of the oil shale, followed by microcline and albite, and smaller amounts of pyrite and ankerite. Clay minerals mainly contain illite and kaolinite.
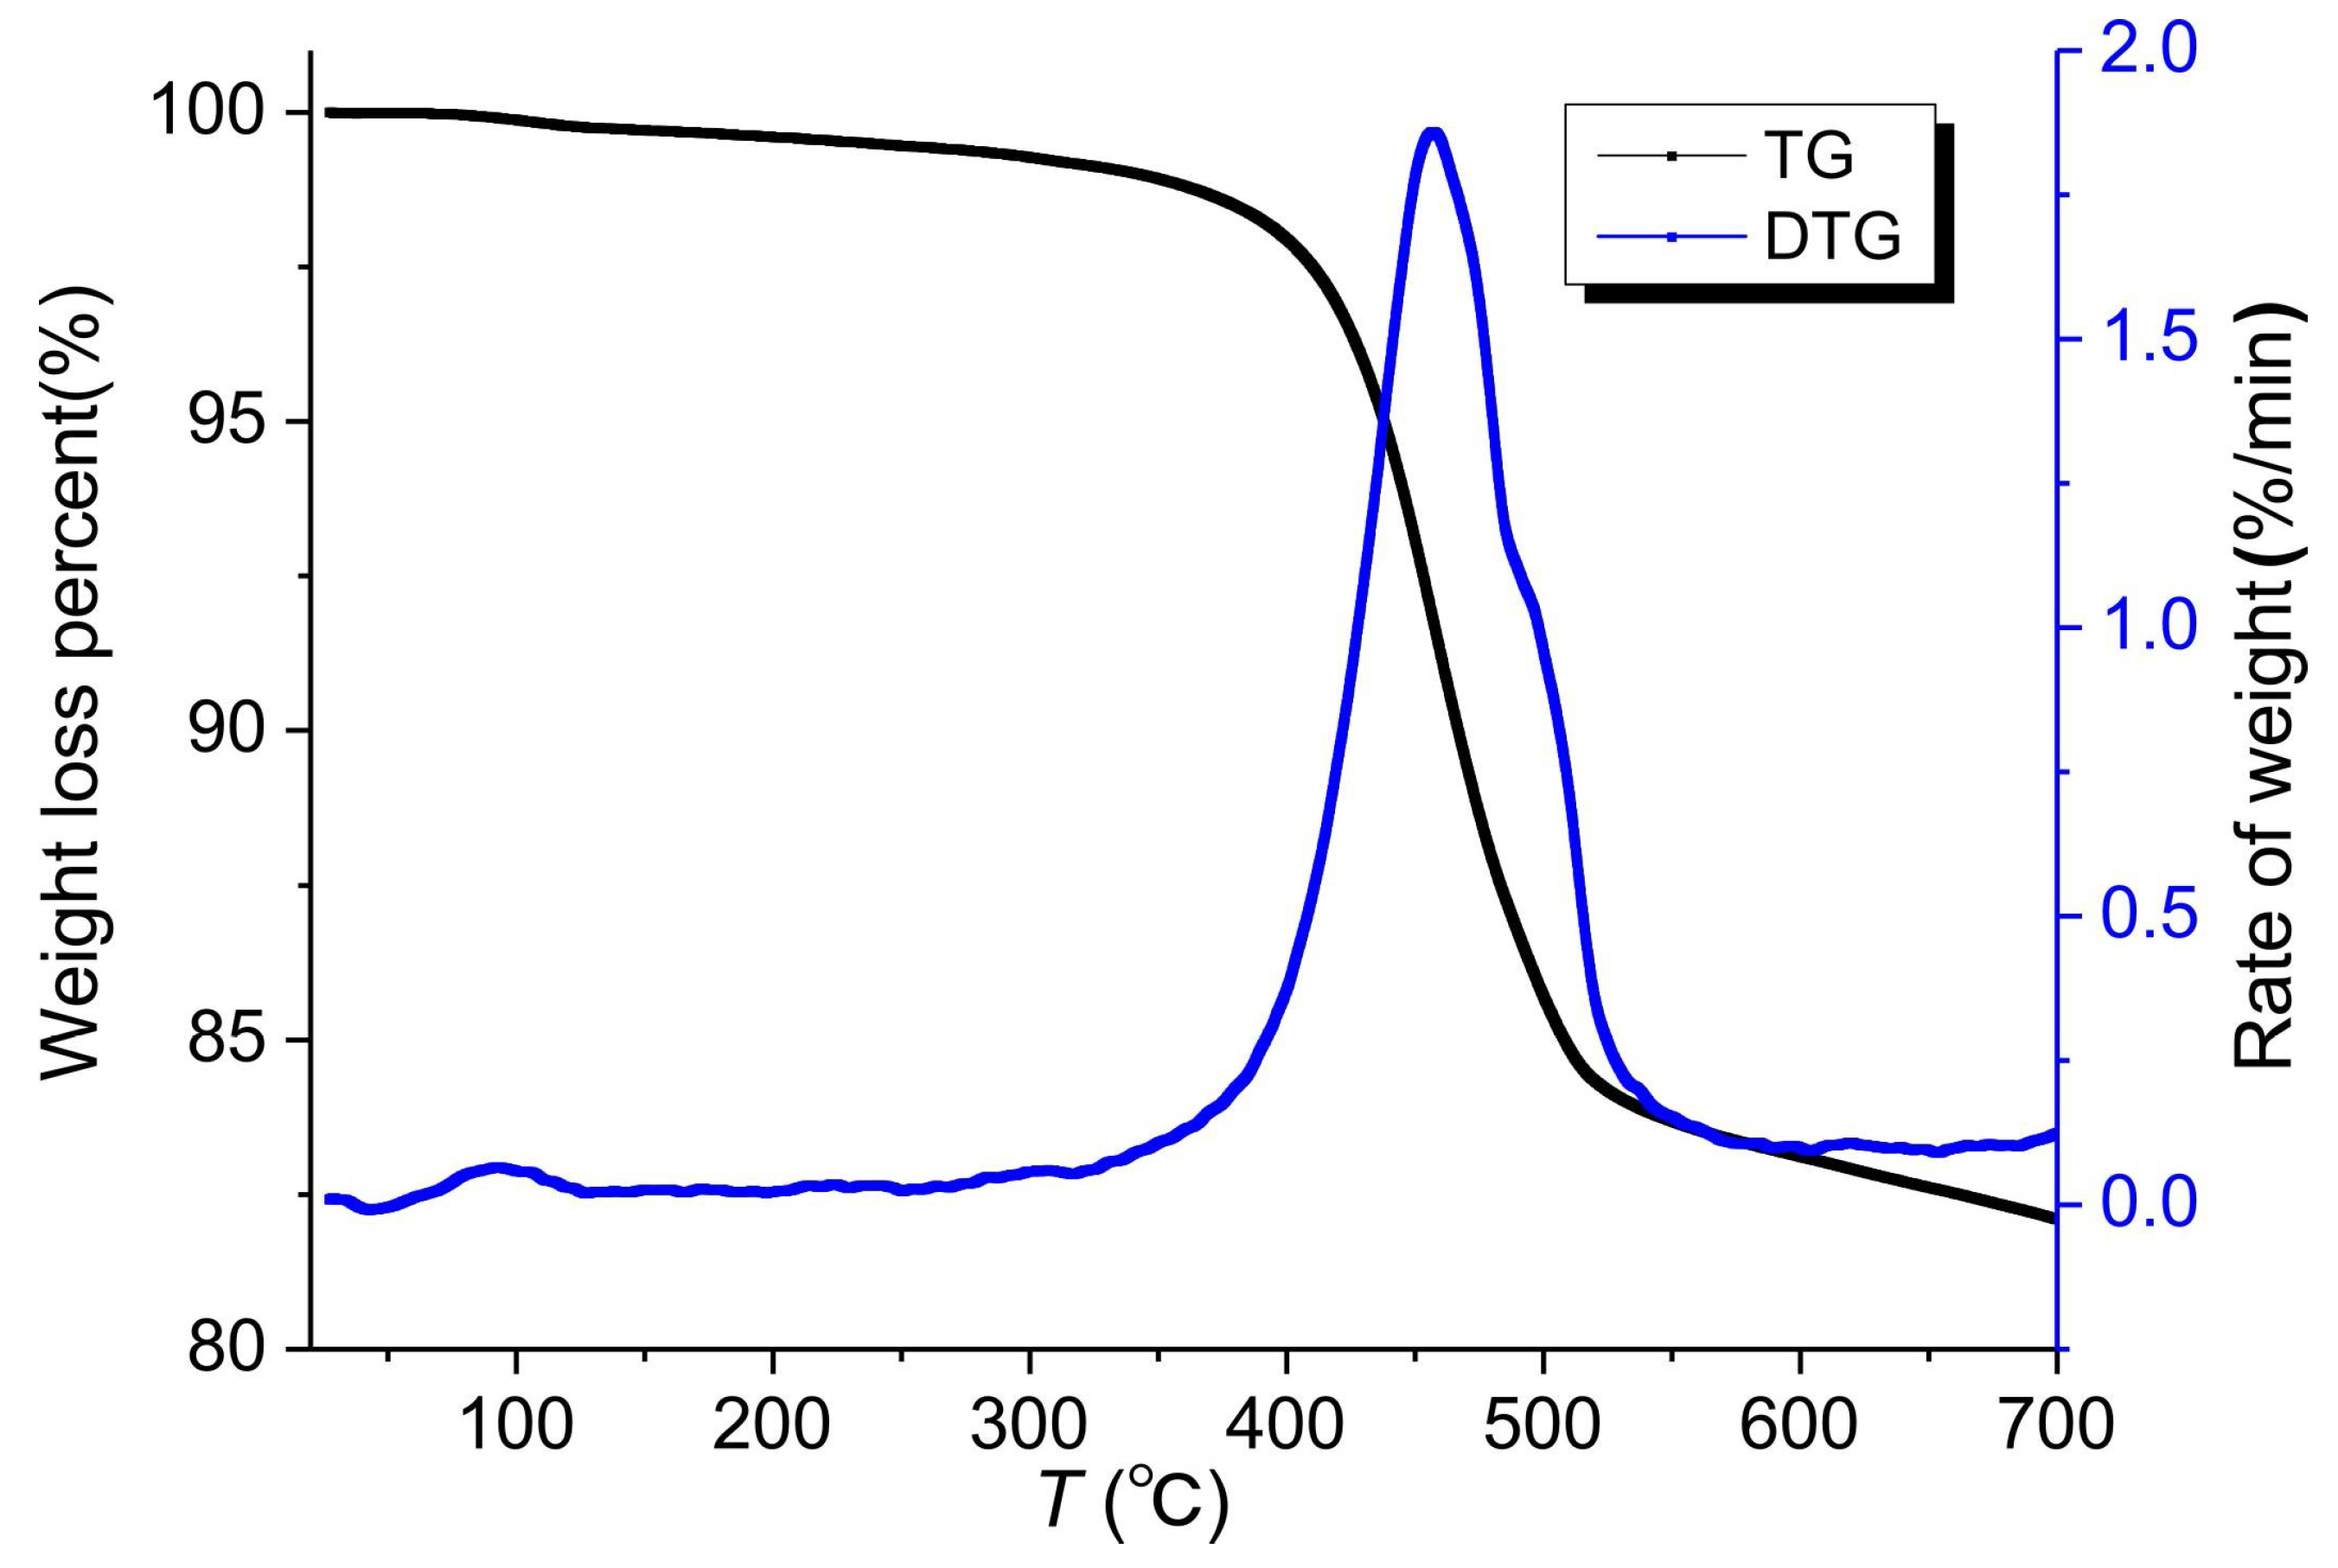
Pyrolysis characteristics of the samples were analyzed using thermogravimetric analysis (TGA) by utilizing a SETSYS Evolution 16/18 synchronous thermal analyzer (Setaram Co., Caluire, France). The TG resolution of this equipment is 0.03 μg, and the vacuum degree is 10–4 mbar. Oil shale samples were heated to 700 °C at a rate of 5 °C/min using nitrogen as a protective gas. Test results are shown in Figure 1. The total weight loss of the oil shale was 17.9%. The pyrolysis process can be divided into three stages. In the first stage, between 23 and 200 °C, weight loss was 0.4%, and peak weight loss corresponds to 93 °C. Weight loss in the first stage is also considered a measurement of free water content in the oil shale and kerogen. The second stage, between 200 and 540 °C, is the main oil shale pyrolysis stage; weight loss in this stage was 15.8%. The range 350–540 °C was the main weight loss range, accounting for 84.4% of the total stage weight loss; this is owing to the decomposition of organic matter such as kerogen and bitumen to release low-molecular-weight gaseous volatile matter [50]. Thus, the 350–540 °C range is considered to be the oil-producing stage of oil shale. The third stage, 540–650 °C, had a weight loss of 1.7% with no obvious weight loss peak. Weight loss in the third stage is related to the decomposition of inorganic matter, especially the decomposition of clay minerals [51].
2.2. In Situ Pyrolysis Experiment
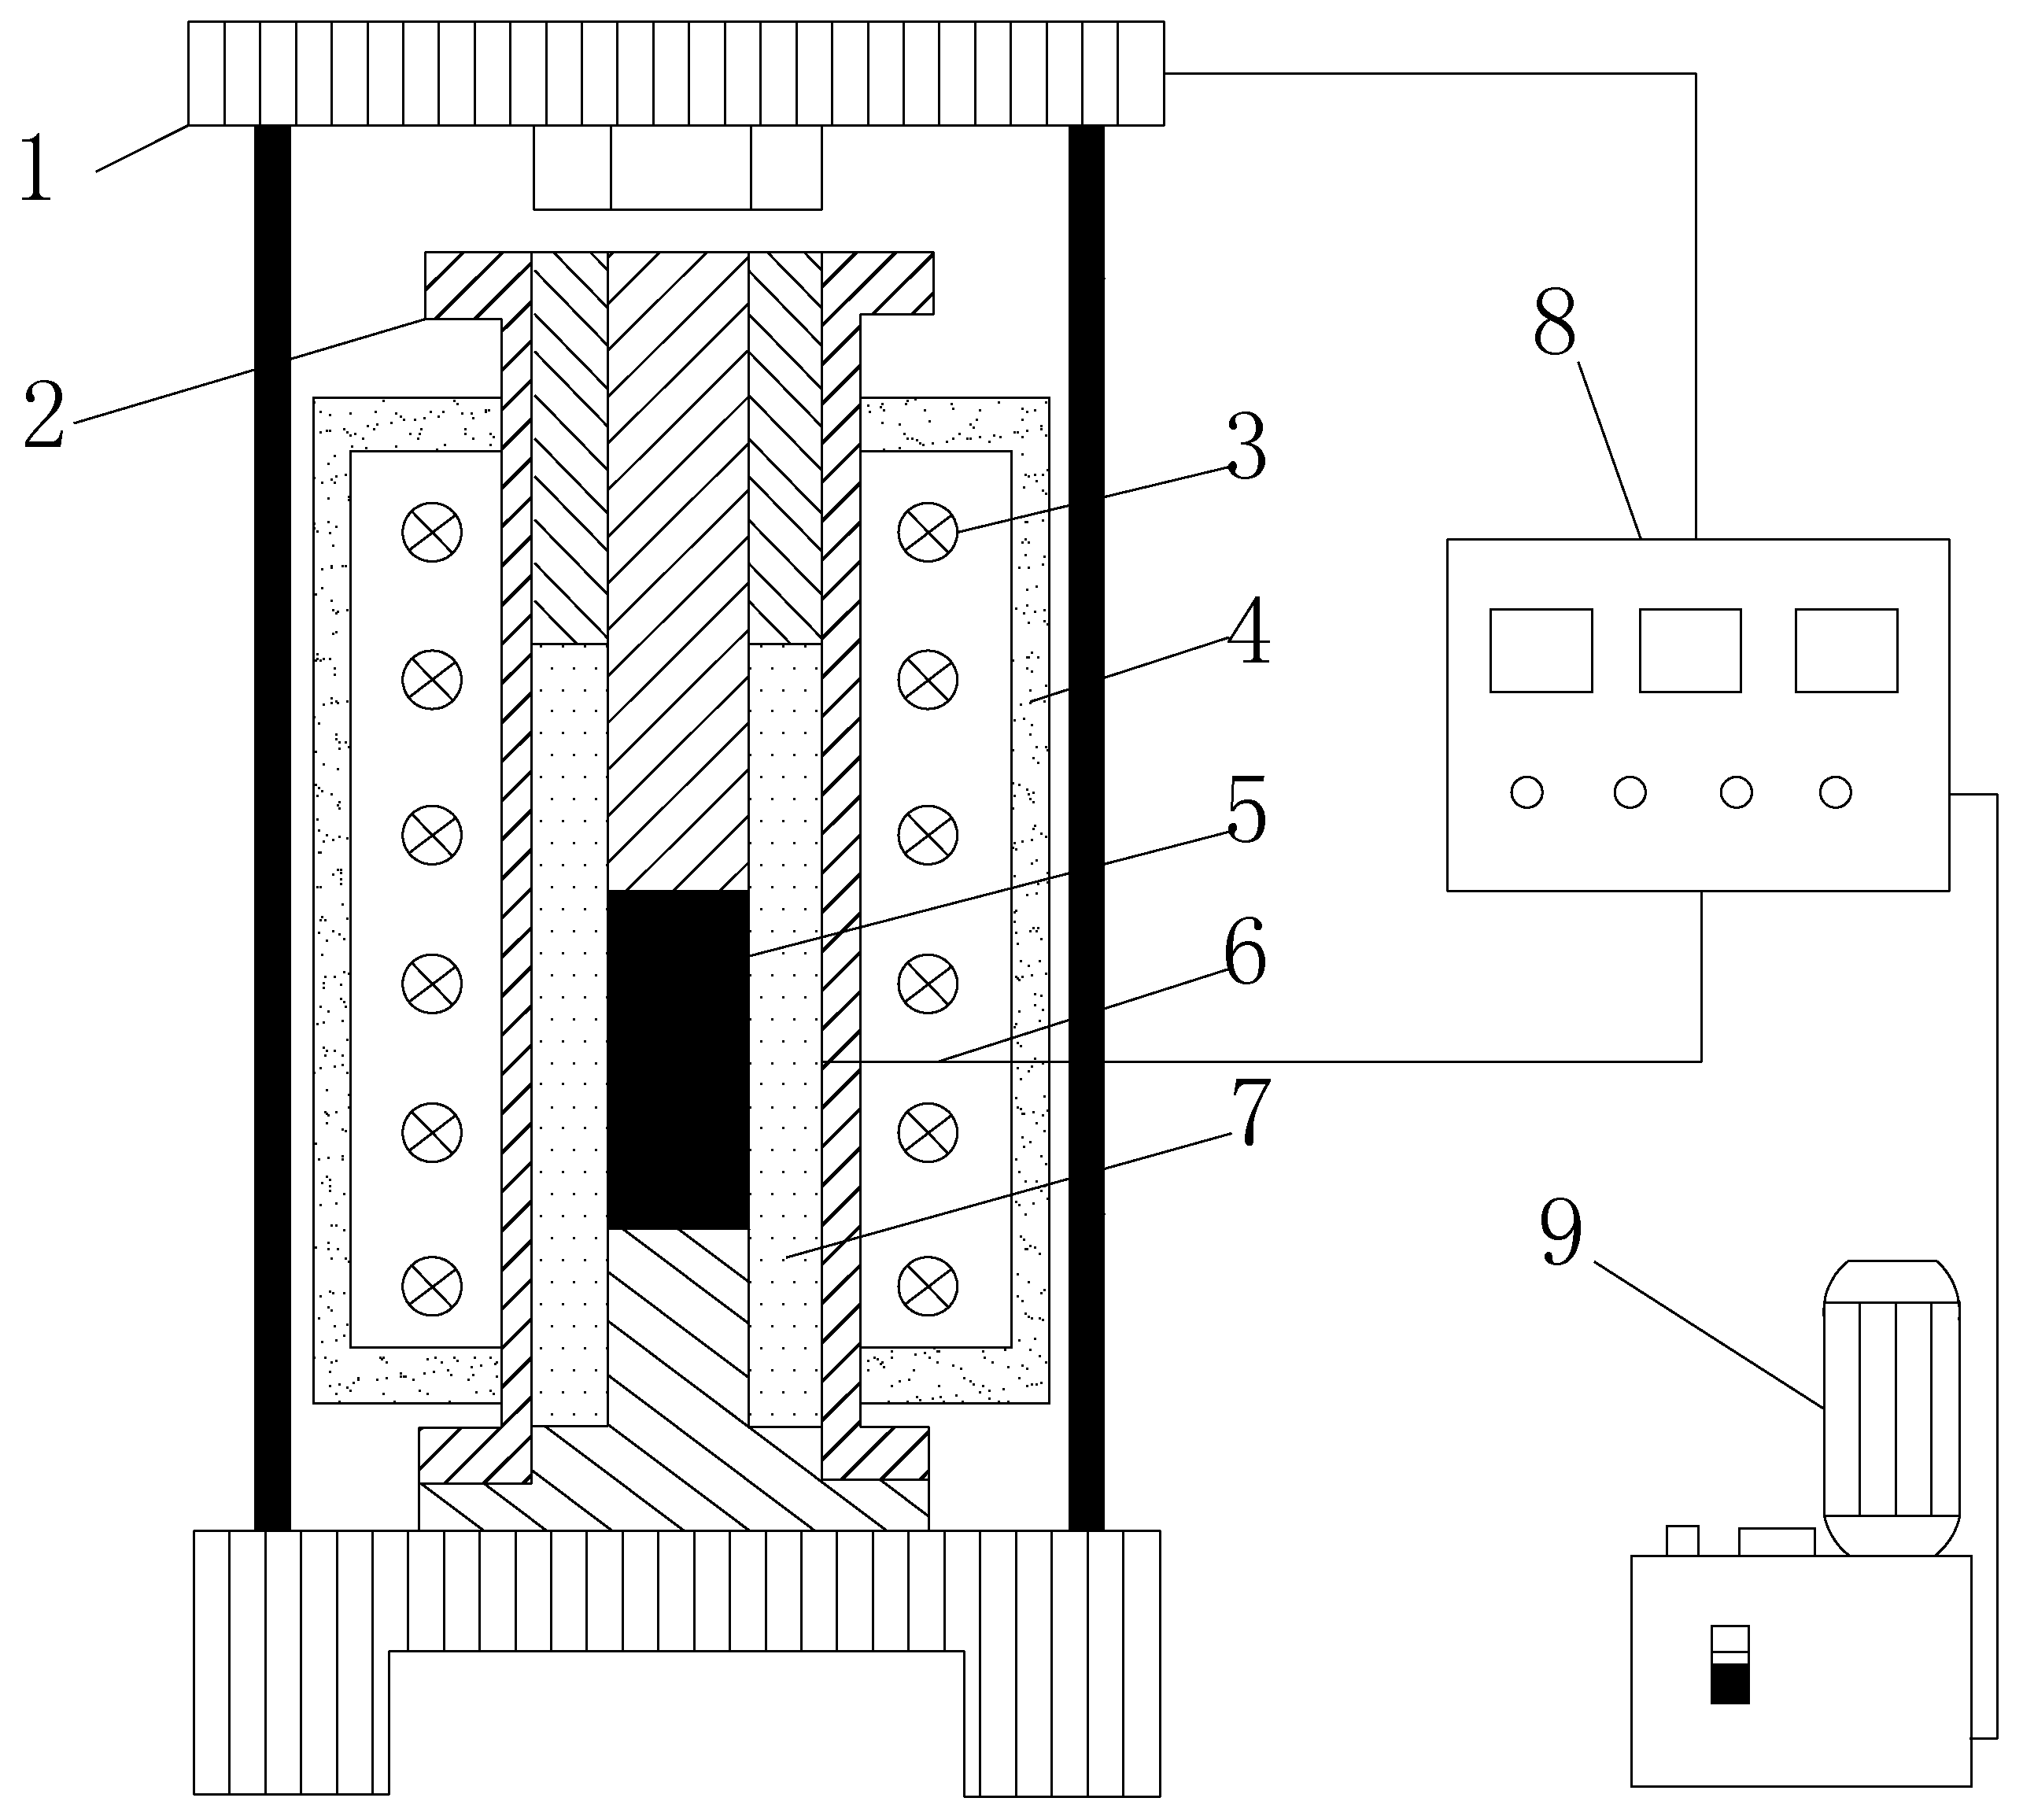
The standard cylindrical specimens were treated under high temperature and triaxial stress conditions using the in situ pyrolysis test bench (Figure 2) developed by Taiyuan University of Technology (Taiyuan, China). The test bench is composed of a triaxial loading system and a temperature measurement and control system. The triaxial loading system is composed of an axial operating system and lateral operating system, which has a maximum pressure of 25 MPa. The temperature control system has a maximum limit of 650 °C, and the sensitivity is not less than 0.2%.
In this study, the lithostatic pressure at a depth of 400 m was simulated using an axial pressure of 10 MPa. The confining pressure was set to 12 MPa. The samples were put into the test bench separately and the axial and confining pressures were loaded to predetermined values under room temperature conditions. After applying the predetermined pressures, oil shale samples were heated to the target temperature (i.e., 100 °C, 200 °C, 300 °C, 400 °C, 500 °C, 600 °C, or 650 °C) at a rate of 2 °C/min. At the target temperatures, the samples were kept for 6 h and then cooled slowly to room temperature at the same 2 °C/min rate so as to ensure that the temperature distributions were uniform. After heat treatment, a 25 mm cube portion was cut from each sample for MIP testing and the remaining part of the sample was ground to particles smaller than 75 μm in diameter for LPNA testing. All the cubes and particles were dried before testing.
2.3. Pore Structure Tests at Different Scales
According to the Hodot classification method, oil shale pores can be divided into micropores (<10 nm), transition pores (10–100 nm), mesopores (100–1000 nm), and macropores (>1000 nm).
Based on the LPNA at 77 K, micropore and transition pore structures in oil shale after pressure and different temperatures effects were analyzed using the sample after in situ pyrolysis. The 3H-2000PS2 apparatus was used for LPNA testing. The equipment error is less than ±1.5%, and N2 was used as the test gas. The specific surface area (SSA) of the sample was obtained by the Brunauer–Emmett–Teller (BET) model [52], and the pore volume and pore size distribution (PSD) were obtained by the Barrett–Joyner–Halenda (BJH) theory [53] according to the desorption branch. The conditions of the effective test range are SSA more than 0.01 m2/g, and pore diameter 2–100 nm.
The AutoPore IV9500-type automatic mercury injection apparatus (Micromeritics Instrument Co., Norcross, GA, USA) and the sample after in situ pyrolysis was used for MIP testing. The experimental application pressure ranged from 0.00069 to 413 MPa and the effective aperture test ranged from 3 nm to 100 μm. As for the liquid mercury, 130° was the wetting angle, and 0.485 N/m was the surface tension. According to the Washburn equation [54], the pore radius corresponding to different pressures can be calculated, and the mercury–pressure curve of oil shale can be obtained. Based on this, the relevant pore structure parameters can be obtained.
3. Results and Analysis
3.1. Experimental Results and Analysis Based on LPNA
Different adsorption isotherm shapes reflect different adsorption materials and pore distributions. Therefore, the surface properties of the material can be analyzed according to the type of the adsorption curve. The isothermal curves of the Fushun oil shale at different pyrolysis temperatures are shown in Figure 3. The adsorption branches of N2 adsorption–desorption isotherms in all samples increase gradually with the relative pressure lower than 0.8 and rise steeply when P/P0 > 0.8. The adsorption branch does not show a plateau even as the relative pressure approaches 1, which indicates that the samples possess a heterogeneous pore structure containing a broad range of pore sizes from micropores to macropores [55,56]. According to the International Union of Pure and Applied Chemistry (IUPAC) isotherm classification criteria [57], adsorption isotherms at 23–300 °C are of type IV; while the isotherms exhibit a steep rise at relative pressures below 0.1 (typically characteristic of a type I isotherm) from 400 °C, this is an indicator of the presence of micropores [58], and so the isotherms are a combination of types I and IV. The variation of the isothermal curve indicates that the pyrolysis temperature controls the type of the N2 adsorption isothermal curve.
Because the relative pressure responding to capillary condensation and evaporation is different, the oil shale adsorption and desorption isotherms are not coincident at higher relative pressure (P/P0 > 0.4). The desorption isotherm is located above the adsorption isotherm. Therefore, a hysteresis loop occurs; the shape of this reflects the pore structure. The shapes of hysteresis loops between 23 and 300 °C are of the H2 type, indicating that the pores are ink-bottle shaped (Figure 3). However, the shapes of hysteresis loops between 400 and 650 °C are of the H3 type, indicating that the pores are slit pores. The above results show that the oil shale pore structure changes significantly after pyrolysis at varying temperatures.
The pore structure parameters of the Fushun oil shale are shown in Table 2. The SSA shows a decreasing–increasing–decreasing trend with rising temperature (Figure 4). The SSA decreases slowly from 23 to 200 °C and reaches a minimum of 3.59 m2/g at 200 °C. It significantly increases from 300 to 500 °C and reaches a maximum of 35.31 m2/g at 500 °C—this is 5.13 times greater than the initial state. From 600 to 650 °C, the SSA shows a slight decrease. The variation trends of the total pore volume as well as the pore volume in each pore size range are in agreement with the SSA (Figure 4). However, the total pore volume and transition pore volume reach a maximum at 600 °C—2.93 and 5.78 times greater, respectively, than the initial state. From 23 to 600 °C, the average pore size increases with temperature, but the pore size become smaller at 300 °C.
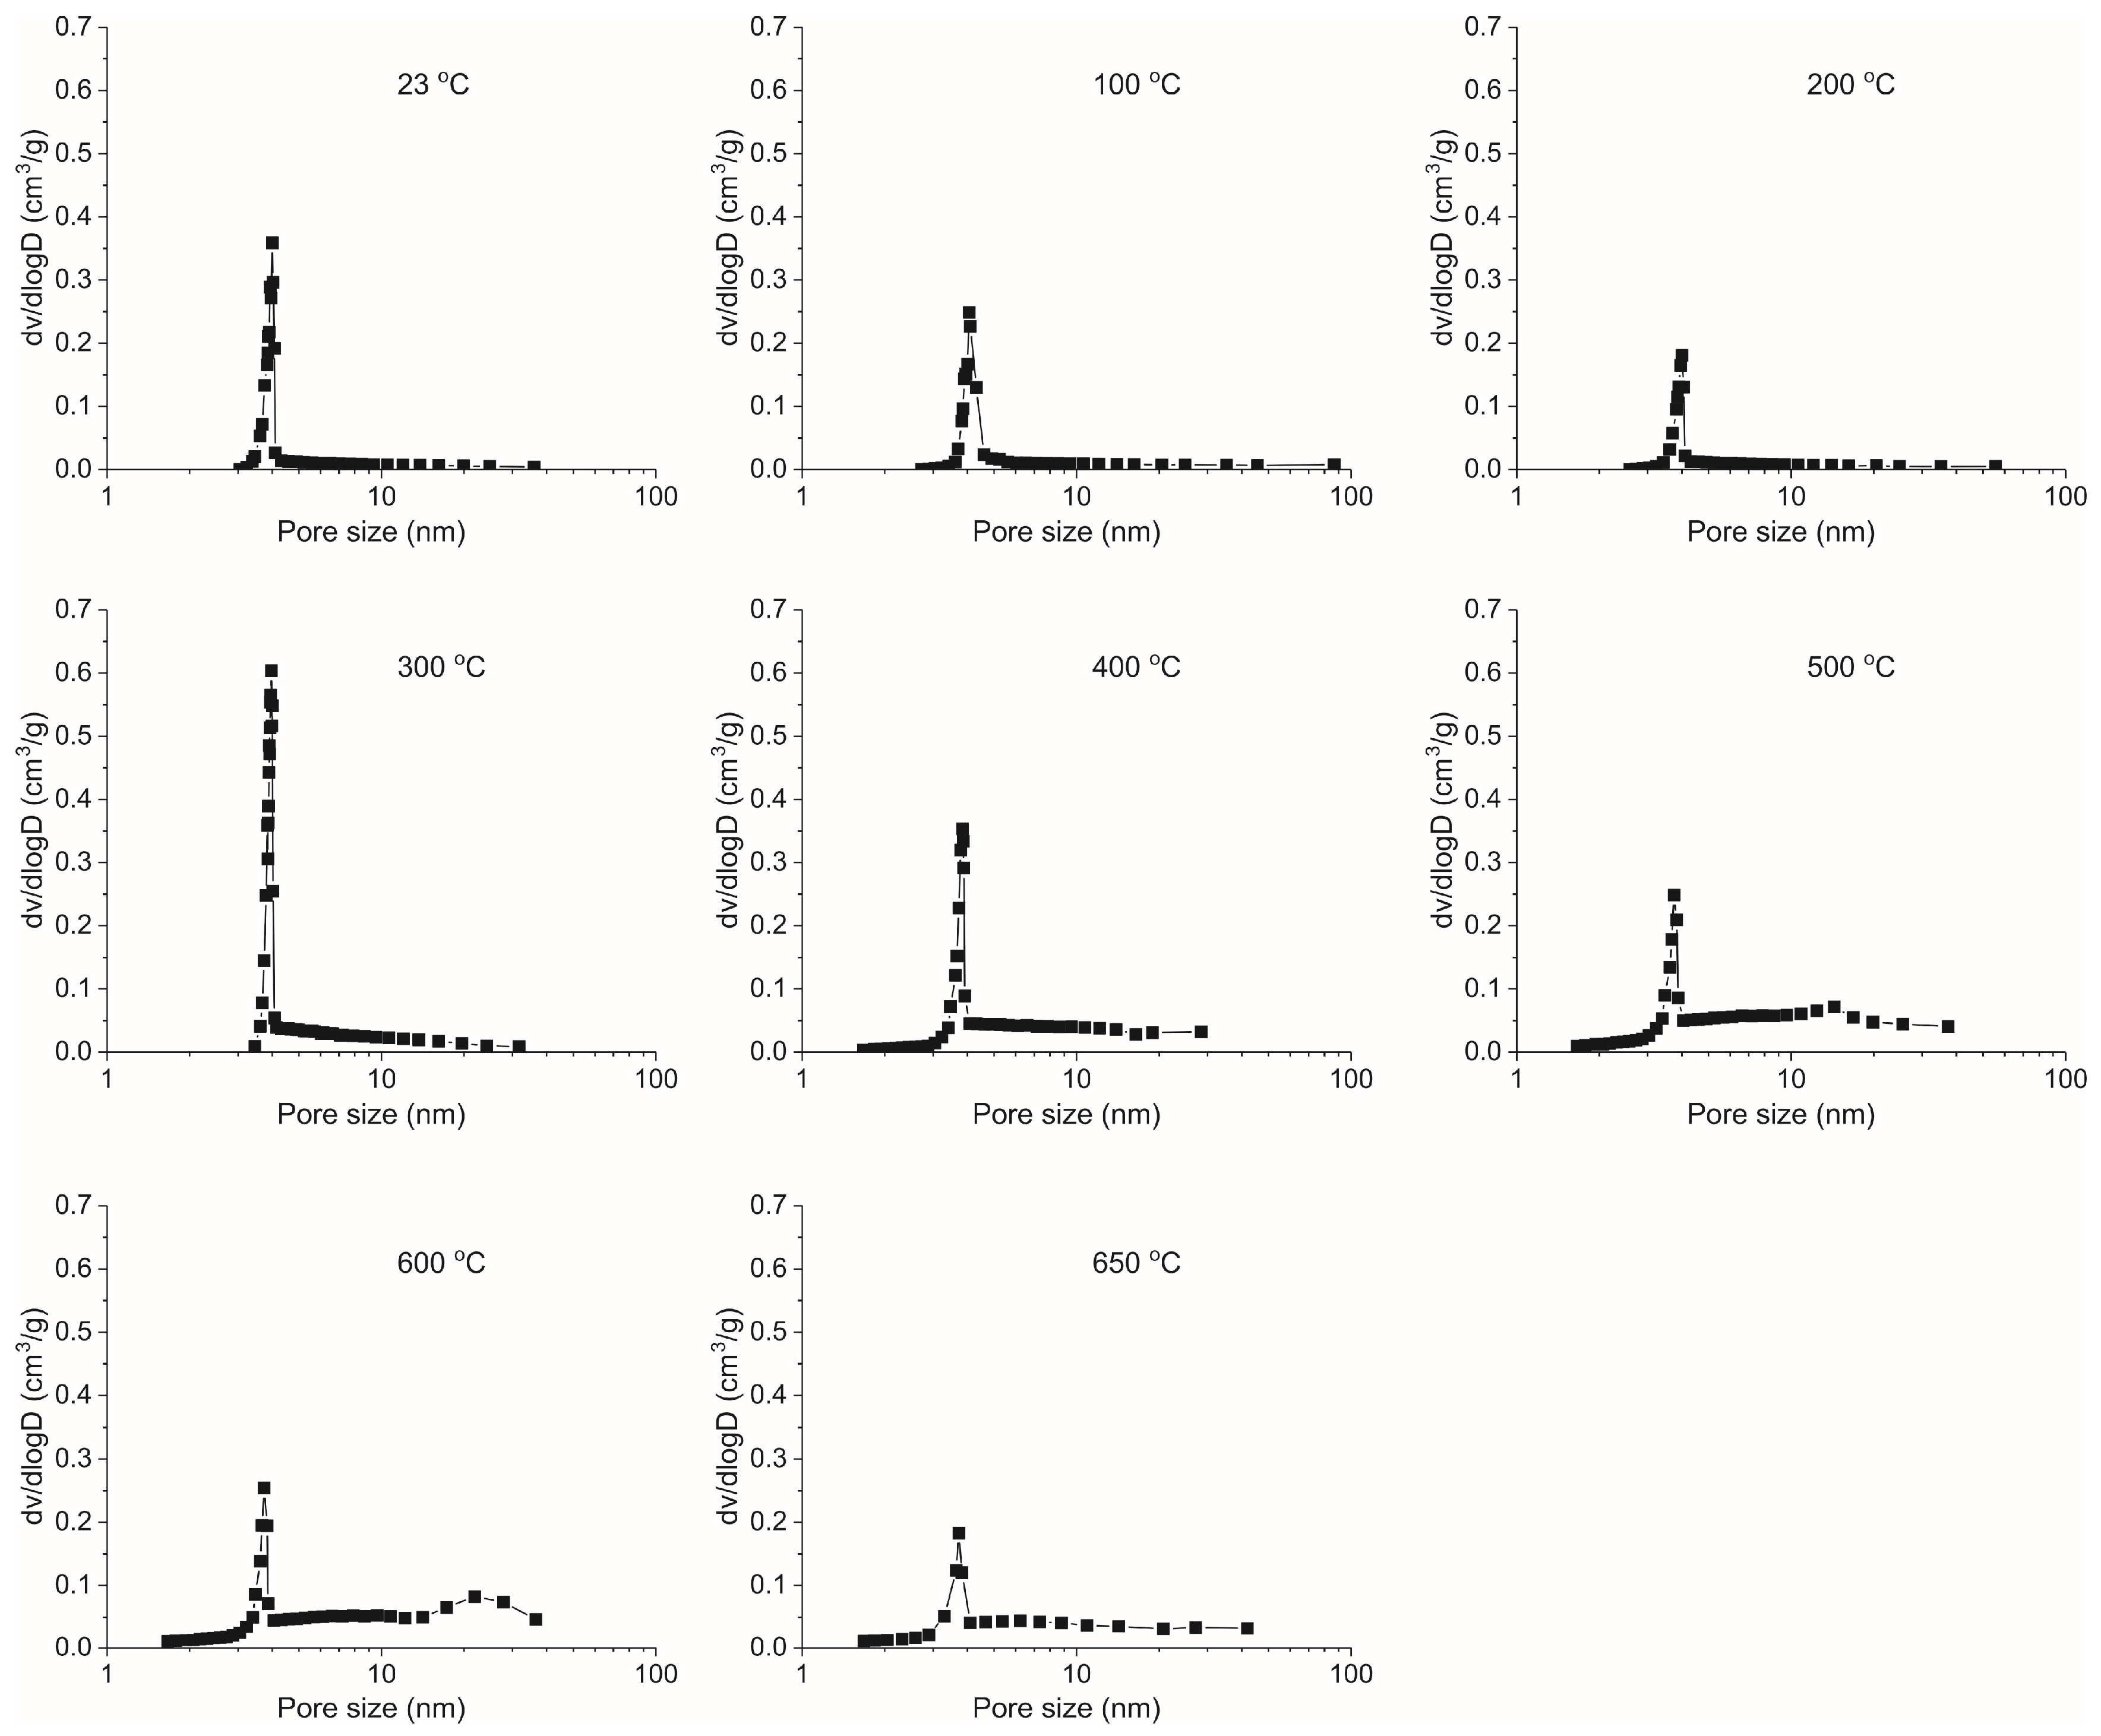
PSD curves of the Fushun oil shale all show a unimodal distribution (Figure 5). Curve shape variations are not obvious between 23 and 650 °C, and the peak of PSD is about 4 nm, which indicates that pores of this size are well developed. At 300 °C, the PSD curve shows a maximum peak. Starting at 400 °C, the pore distribution on both sides of the peak increases gradually with increasing temperature, which indicates the gradual development of micropores and transitional pores. It can be seen from the Figure 3 that the isotherms diverge at P/P0 = 0.4–0.5 and are invariable over temperature in all the samples. According to the Kevin equation, when the relative pressure is 0.5, the corresponding pore diameter is approximately 3.6 nm, which can be confirmed from the PSD.
3.2. Experimental Results and Analysis Based on MIP
The morphology of pore volume versus pore diameter curves is closely related to the pore structure of the sample, which can be used to qualitatively analyze pore structure variation in oil shale (Figure 6). During the MIP test, the influence of the pore shielding effect [59,60,61] results in the mercury being prone to hysteresis and even residue. Hysteresis in MIP experiments indicates that “ink-bottle” pores have developed within the oil shale, which is consistent with the LPNA analysis.
Pore volume versus pore diameter curves for oil shale at different pyrolysis temperatures are shown in Figure 6. From 23 to 300 °C, the pore volume accumulation curves are all concave, indicating the development of micropores, transitional pore, and macropores. Mesopores are not developed. In addition, the connectivity among pores is poor. However, an “anti-S-shaped” curve is present between 400 and 650 °C, which indicates the development of transitional pores and mesopores. Micropores and macropores are not developed. Also, pores are more concentrated, and pore connectivity is improved.
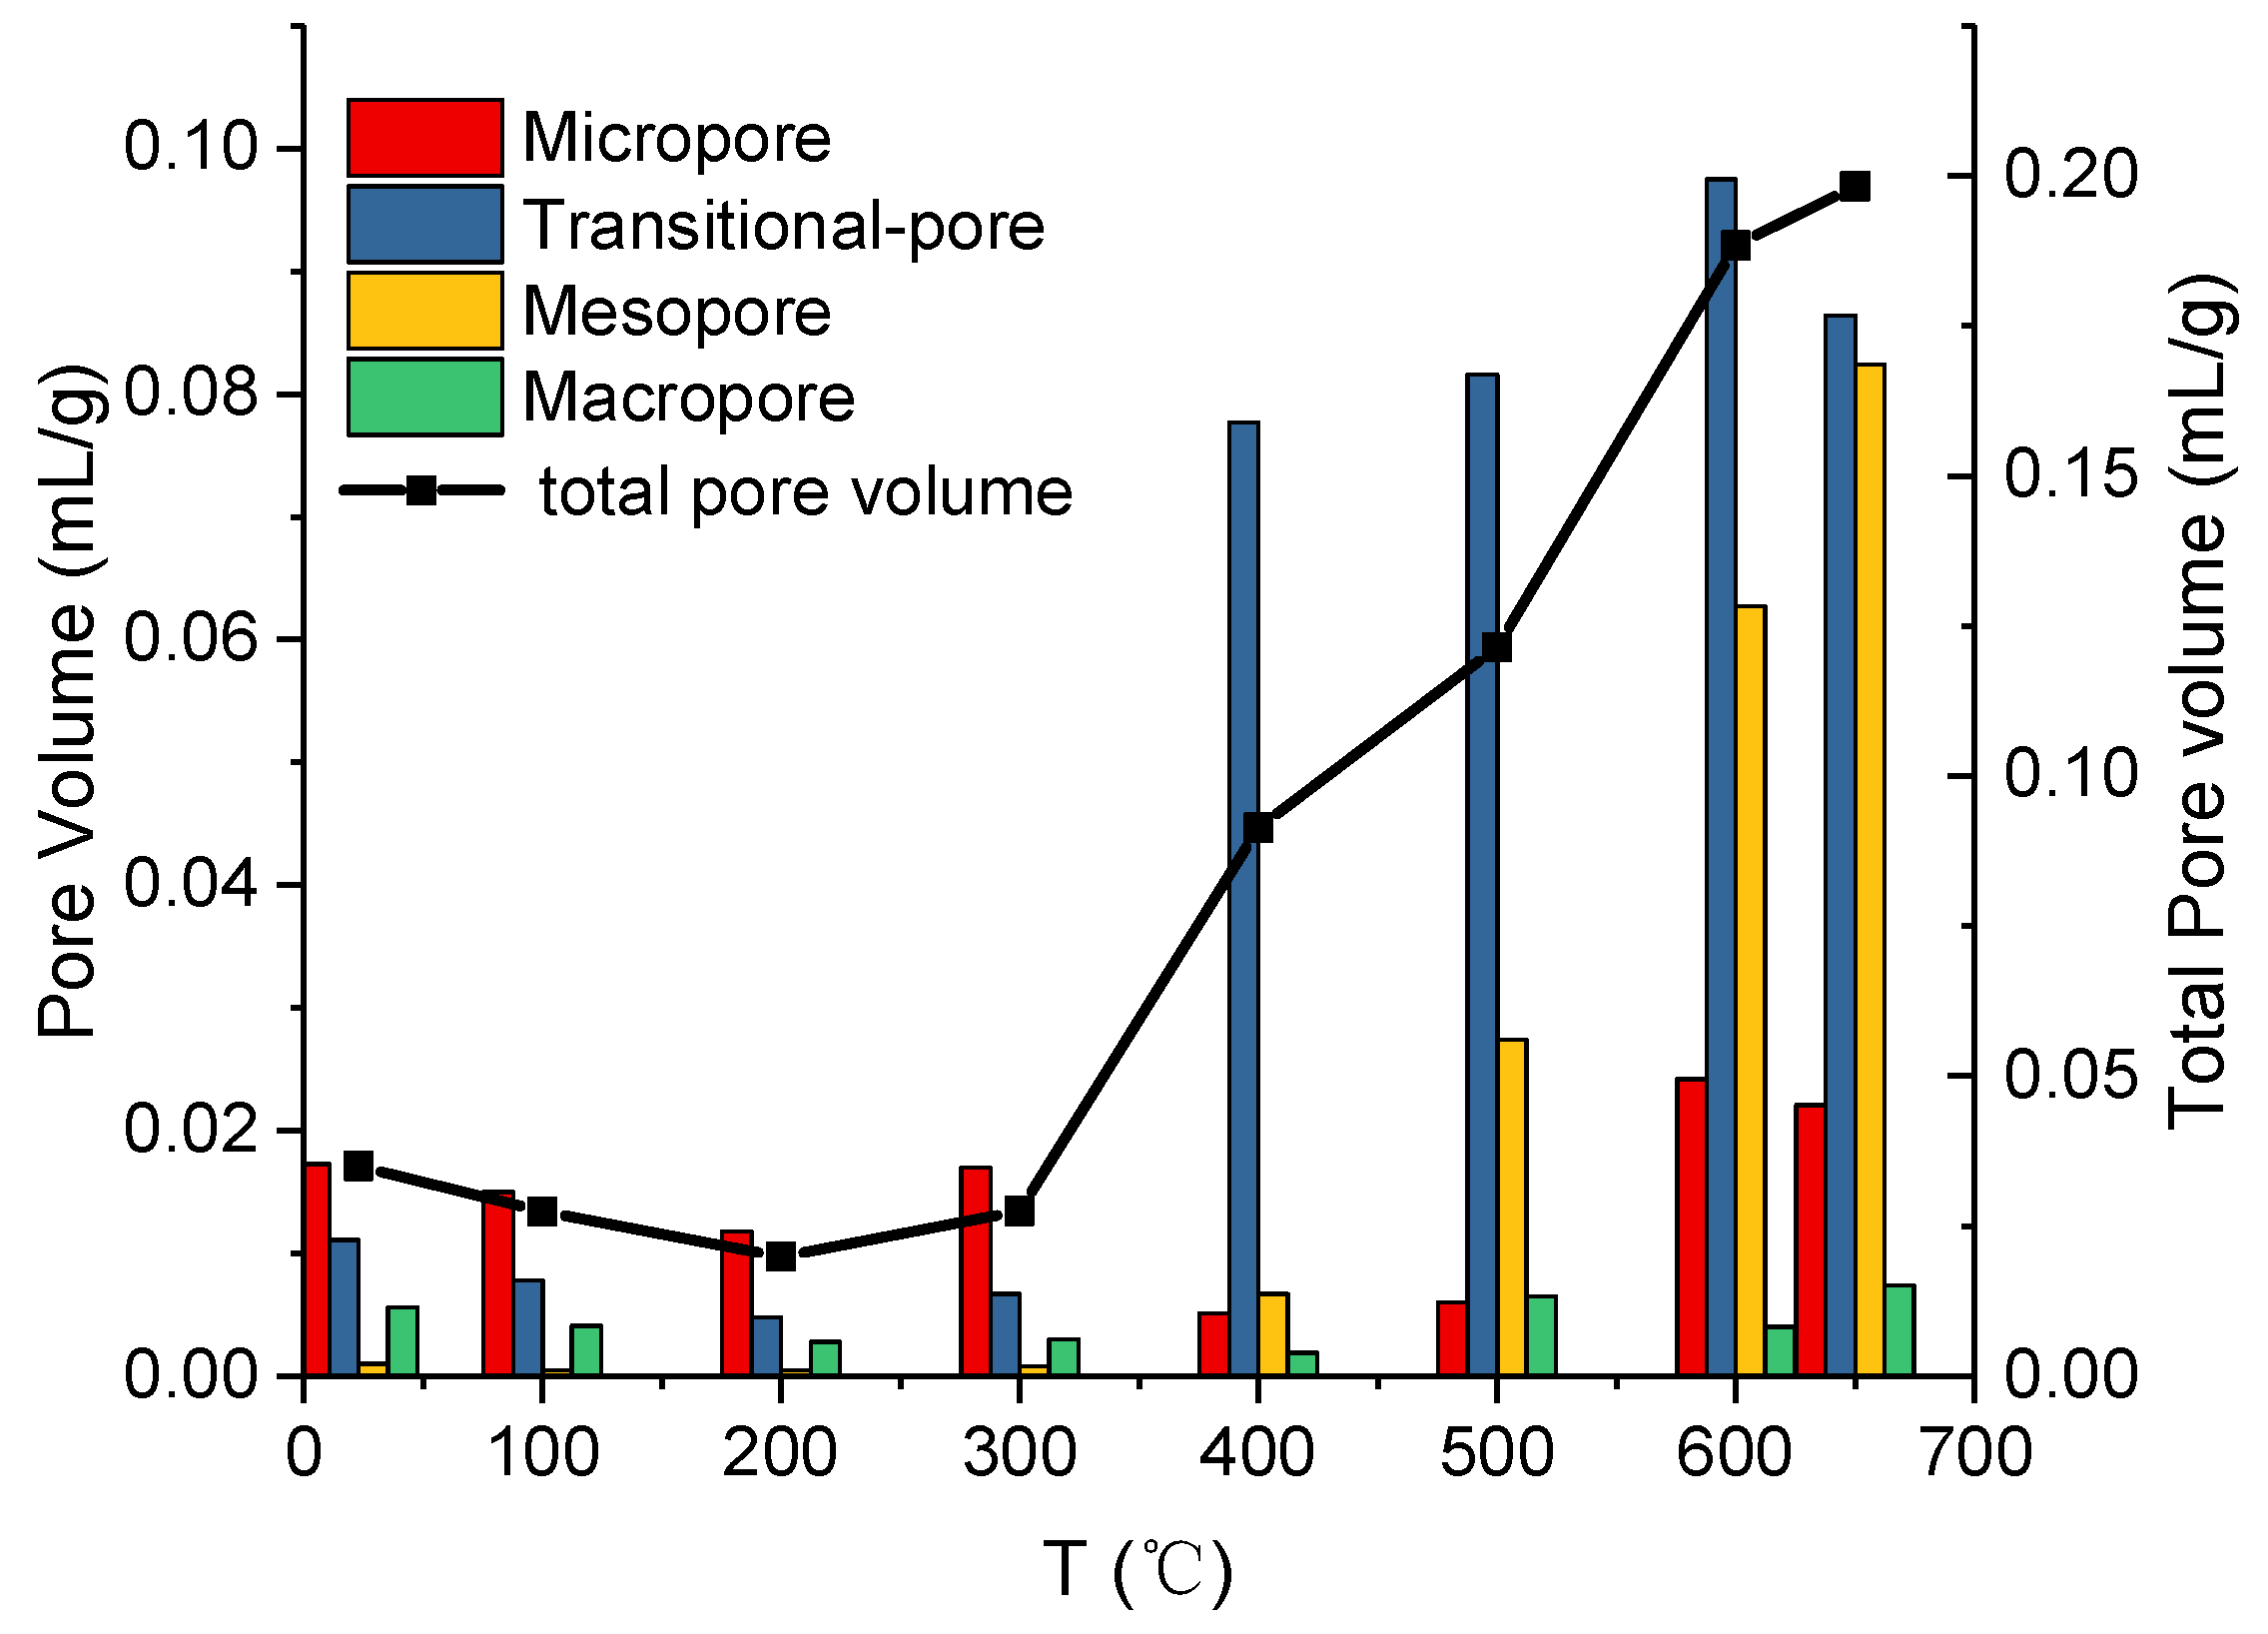
PSD curves of the Fushun oil shale are concentrated in two intervals (less than 100 nm and more than 100 μm) when the pyrolysis temperature is below 400 °C (Figure 7a), indicating that pore size has a bimodal distribution. For T = 400–650 °C, PSD curves change radically (Figure 7b). PSD curves show a primary peak and a secondary peak. The peaks shift to the right with increasing temperature, changing from 77.1 nm and 5.2 nm at 400 °C to 120.7 nm and 40.3 nm at 600 °C, which indicates an increase in pore size. At 650 °C, the PSD is concentrated further, and the PSD becomes unimodal with a peak at 151.1 nm. The pore volume in each pore size range and cumulative total volume changes slightly before 400 °C (Figure 8, Table 3). The total pore volume increases continuously from 400 to 650 °C, and the transitional pore volume increases sharply at 400 °C (Figure 8, Table 3); however, the pore volume increase with increasing temperature is lower than that of the total pore volume, which was validates the result that as new transition pores form, some of the previous transition pores expand into mesopores. When the temperature exceeds 600 °C, the total pore volume increases slightly, and the pore structure shows a change from transition pores to mesopores. It should be noted that the results of tests by MIP and LPNA have some differences in PSD, which is mainly related to the increase of mesopores beyond the scope of the LPNA test, and the average pore size is also the same.
Porosity is an important parameter for characterizing pore development in oil shale, which determines the quantity of pores. The changing porosity causes changes in permeability, which determines the mass transport capability [62]. On the other hand, it affects heat transfer rates between permeable pores and a low-permeability rock matrix [63]. The porosity of oil shale shows little change in the low temperature range and a continuous increase in the high temperature range with increasing temperature (Table 3). From 23 to 200 °C, the porosity decreases slightly and reaches a minimum of 4.28% from 7.02%. Porosity shows little change at 300 °C and increases between 300 and 600 °C. At T > 600 °C, the comprehensive effect of the lithostatic stress and the decomposition of inorganic mineral cause the porosity to decrease slightly. It can be concluded that temperature increase is beneficial for increasing porosity; however, porosity stabilizes between 600 and 650 °C.
4. Discussion
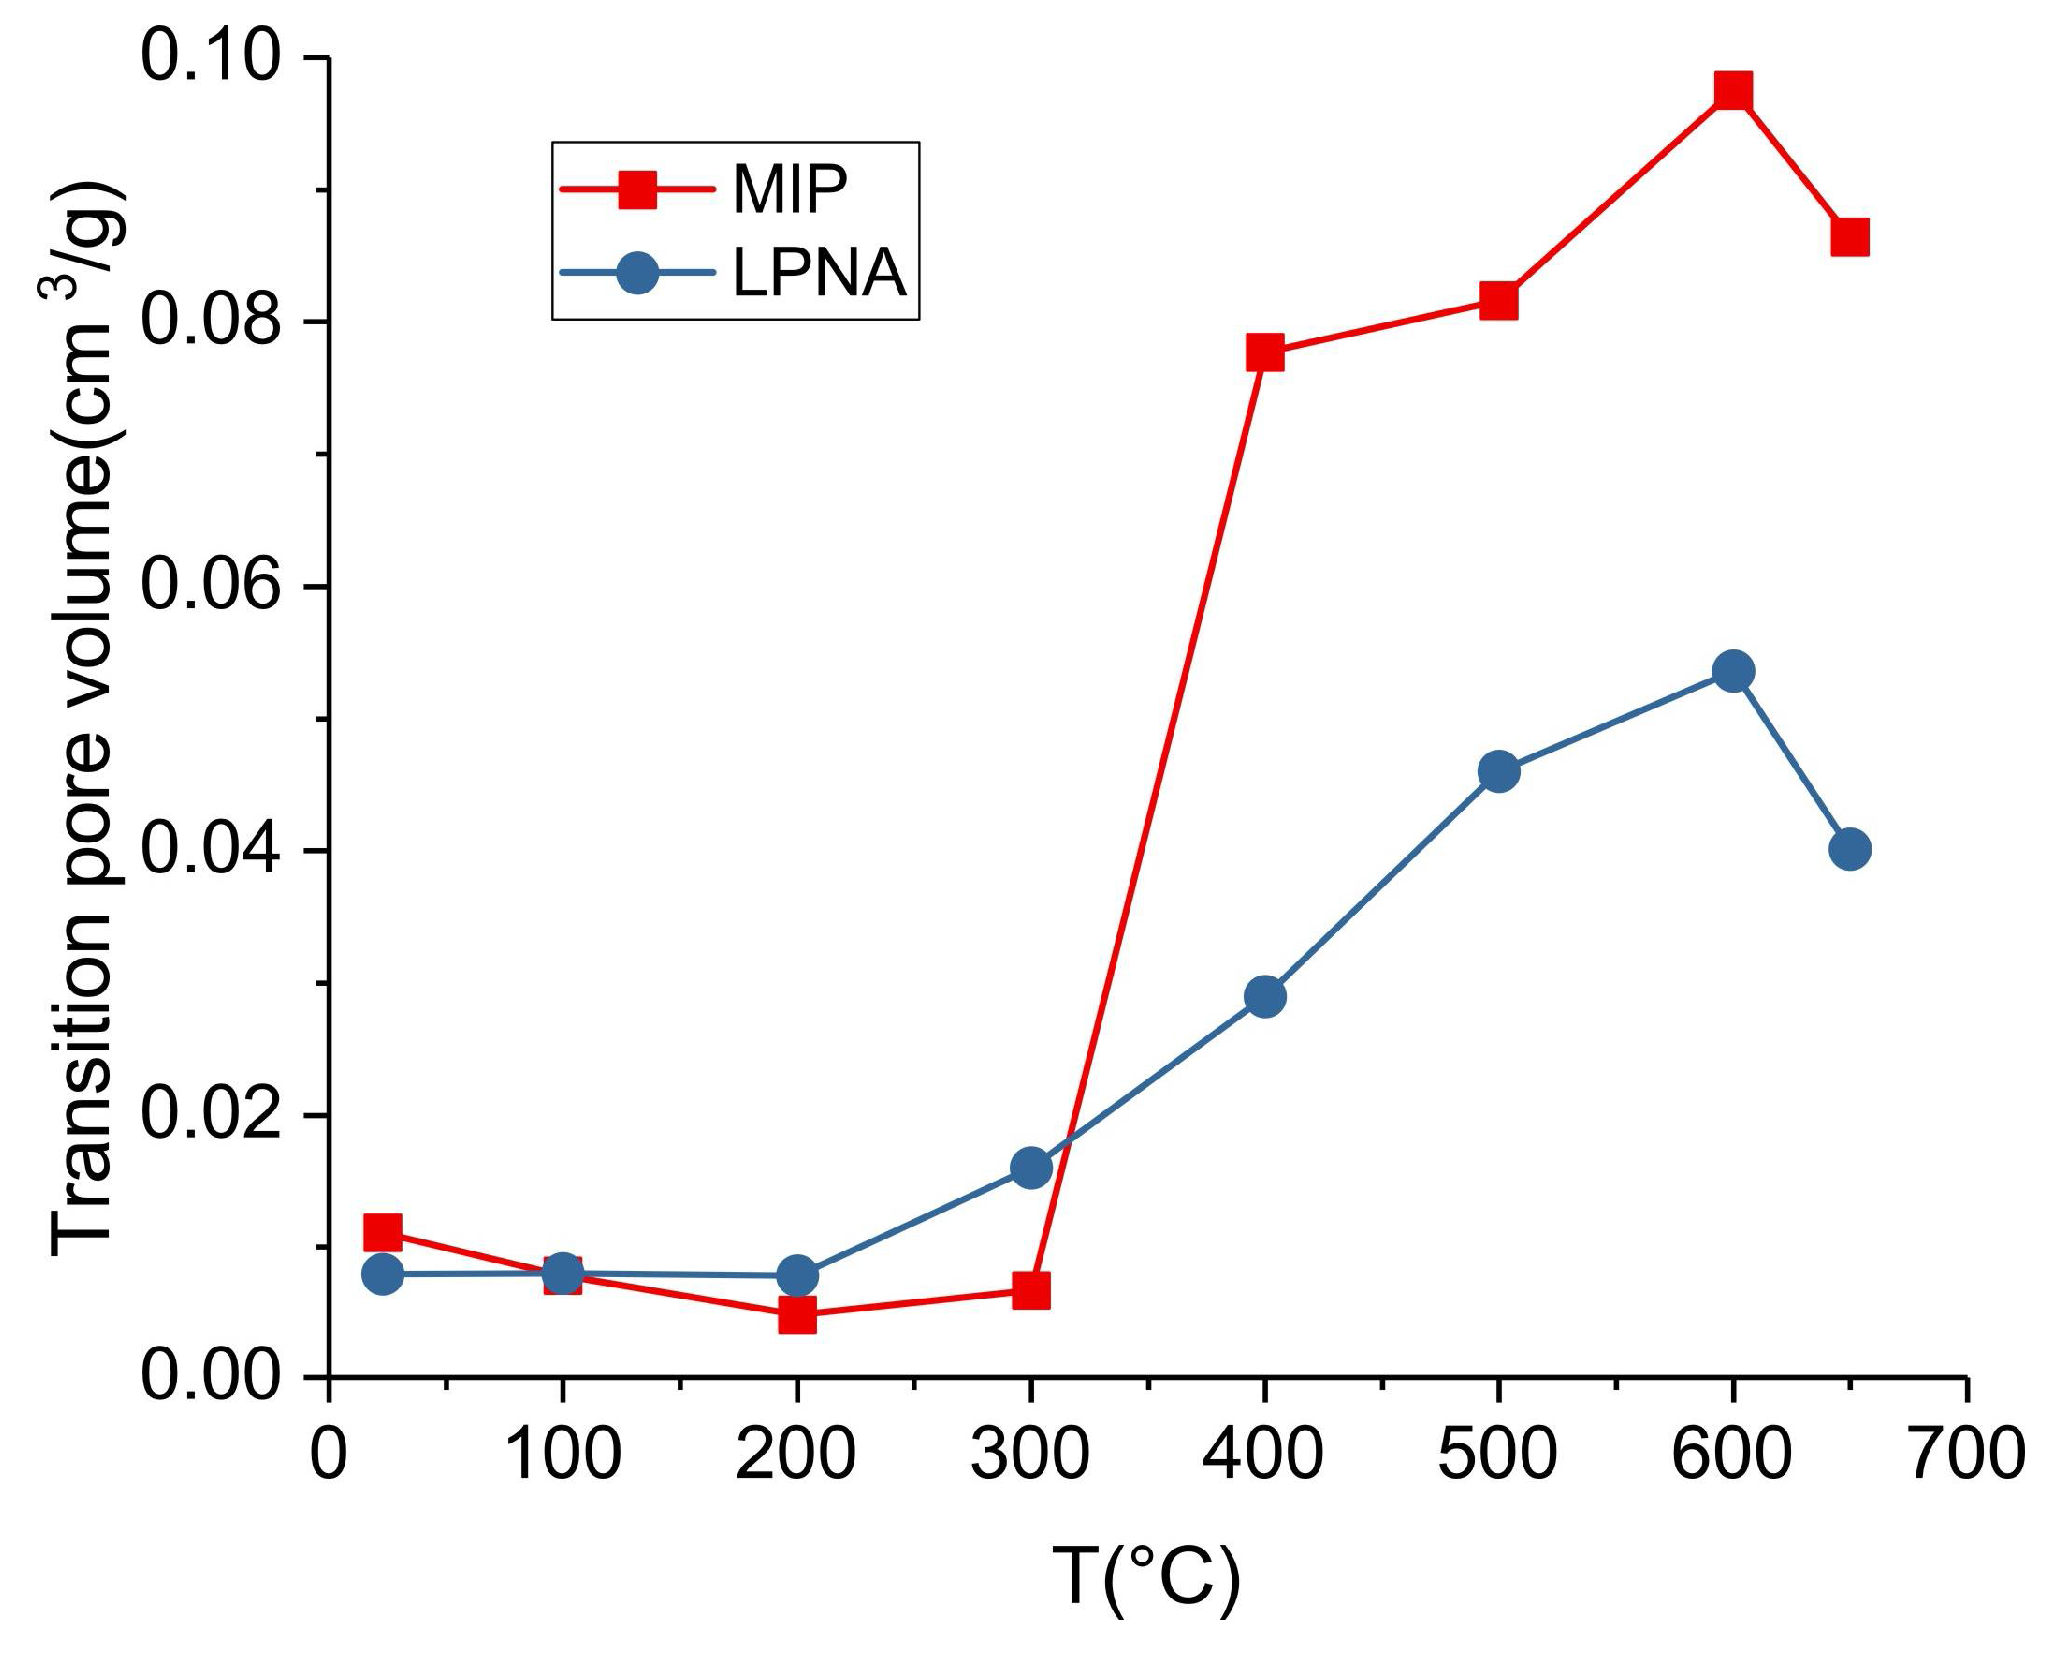
This study examines the pore structure from 2 nm to 100 μm, and the results present a comprehensive characterization of the Fushun oil shale pore structure evolution. In the common effective range of the LPNA and MIP tests, the test data showed a significant difference between the two test methods concerning the transitional pore (10–100 nm) volume due to the different testing principles. However, the variation trend of data with increasing temperature has better consistency (Figure 9), showing a small change at 23–300 °C, with a significant increase at 300–600 °C, and a decrease at 600–650 °C. This illustrates the reliability of the test results.
The process of pyrolysis of organic matter in oil shale is complex and involves a series of parallel reactions [23,64]. Usually, the decomposition of the organic matter is a two-stage process: first is the organic matter decomposition of unstable intermediate and small-molecular-weight liquid and/or gaseous hydrocarbons; second, as the temperature increases, the unstable intermediate produces secondary cracking, further releasing some liquid and gaseous products [65,66]. The decomposing temperatures of different organic matter structures are different, and may show one or two stages on the TG-DTG curve, depending on the type of oil shale. In this study, the DTG curve has only one peak in the pyrolysis process, indicating that the pyrolysis is done in the same temperature range. In this study, a single peak state is presented on the DTG curve, which means that the two pyrolysis stages of the oil shale sample are completed in the same temperature range (350–540 °C).
There are many controlling factors on pore structure evolution under varying temperature and pressure, including the swelling pressure of organic matter and pyrolysis products, decomposition of inorganic minerals, and connectivity and blockage of pores caused by thermal cracking of the mineral skeleton. These factors contribute to the change of pore structure in oil shale. (1) From 23 to 200 °C, micropores, which are produced by free water escaping from the oil shale and thermal deformation of minerals, account for some pore space. Some pores shrink or even close, resulting in a loss of pore space, caused by organic matter softening and structural adjustment under pressure. The competition between them makes the pore parameters change. SSA, cumulative pore volume, pore volume in each pore size range, and porosity show a slight decreasing trend. At 300 °C, the organic matter in the oil shale has not yet reached its decomposition temperature, but the uncoordinated thermal deformation of mineral grain leads to a slight upward trend in all pore parameters. The pore volume of micropores increases greatly, which leads to a corresponding decrease in average pore size. The mechanical properties of oil shale are relatively stable at T < 300 °C, and the effect of formation pressure on pore structure is not obvious. (2) The temperature range of organic matter pyrolysis is 400–600 °C, where the product is separated from the mineral skeleton and the pore space is formed; this is the reason for the reduced load-bearing capacity of the oil shale [15,67]. The organic matter in the oil shale reaches the pyrolysis temperature and decomposes violently, forming a large amount of oil and gas, resulting in pressure that enlarges pervious pores or forms new pores. In addition, thermal fractures caused by inhomogeneous thermal stress on inorganic minerals and thermal decomposition of clay minerals cause an increase in the volume or number of pores. All of the above reasons lead to an increase in porosity, pore size, pore volume, SSA, and transformation from an H2-type to an H3-type pore structure. At 600 °C, the organic matter is almost completely pyrolyzed (Figure 1). The comprehensive effect of water loss from clay minerals and the expansion stress from the quartz phase transition from α- to β-quartz make the pore structure continue to expand. At this temperature, the mineral skeleton has not been completely destroyed, and the formation pressure effect leads to shrinkage and even closure of some micropores as well as a decrease in SSA. (3) At 650 °C, in oil shale, thermal reaction of the solid framework occurs mainly under pressure and causes an intensity decrease: The rate of pore growth is determined by thermal fracture, and the rate of pore reduction is caused by pore structure collapse, blocking, and the structure recombination and pore shrinkage of clay minerals. The competition of these rates of pore growth and reduction leads to a complex pore structure.
Previous studies have shown that stress can cause a decrease in oil yield or systematic changes in the composition of shale oil generated [68,69]. Similarly, the stress can also affect the development of pore structure and the transmission capacity of the hydrocarbon product during pyrolysis. Compared with other scholars’ conclusions on the Fushun oil shale, the variation trend of the test results with temperature in this study is consistent with the current literature [38,45]. MIP test results show that the total pore volume and porosity obtained by in situ pyrolysis are smaller than those in data from a no-nitrogen pressure test [45]. Specifically, the difference is small in the temperature range 23–300 °C, and obvious in the temperature range 400–600 °C. Oil shale strength is stable and pores are undeveloped under low-temperature conditions. Pressure and temperature have little effect on the pore structure. After the organic matter is decomposed, the load-bearing capacity of the mineral skeleton surrounding the pore space is insufficient to support the lithostatic stress, which leads to the collapse or blockage of some pores, indicating that lithostatic pressure inhibits pore structure development. Hence, oil shale pore structure during the pyrolysis process is related to the pyrolysis temperature, and the influence of lithostatic pressure cannot be neglected.
5. Conclusions
Based on the mineral composition and TGA analysis of the Fushun oil shale, the oil shale pore structure evolution was studied after in situ thermal treatment under simulated lithostatic pressure with a temperature range of 23–650 °C by LPNA and MIP tests. Conclusions are as follows:
- (1)
- In situ pyrolysis is the process of heat injection into an oil shale reservoir under lithostatic pressure. The lithostatic pressure does not cause change in the evolution discipline of the pore structure, but the inhibitory effect on the development of pores is significant and cannot be neglected.
- (2)
- The LPNA results display that pores are primarily ink-bottle shaped, and the effect of heating on the pore structure of oil shale is insignificant at 23–300 °C. However, at 400–650 °C, pores are mainly slit pores, which is closely related to the pyrolysis of oil shale organic matter at 350 °C. This means that pyrolysis plays a controlling role in the evolution of oil shale pore structure. The SSA shows a three-stage characteristic with increasing temperature: it decreases slowly from 23 to 200 °C, significantly increases from 300 to 500 °C—reaching a maximum at 500 °C—and slightly decreases from 600 to 650 °C.
- (3)
- The results from the MIP show that micropores, transitional pores, and macropores are developed from 23 to 300 °C, and the connectivity among pores is poor. While the transitional pores and mesopores are developed from 400 to 650 °C, the PSD becomes concentrated, and pore connectivity is improved. The porosity changes insignificantly from 23 to 300 °C, and increases steadily from 300 to 600 °C, while the development of porosity is limited at 600–650 °C. It can be concluded that temperature increase is beneficial for increasing porosity; however, porosity remains stable when the temperature is above 600 °C.
- (4)
- The evolution of oil shale pore structure involves complex physicochemical processes which are the result of the interaction between organic matter, pyrolysis products, and inorganic minerals under the actions of pressure and temperature. The change in pore structure before 350 °C is small and primarily caused by the deformation and fine adjustment of the components of oil shale under temperature and pressure. The pore structure changes greatly from 350 to 540 °C, mainly caused by the influence of the pyrolysis of organic matter and the escape of the product, followed by the decomposition and thermal cracking of inorganic minerals. At 600 °C, the further expansion of pores is attributed to the decomposition and thermal cracking of inorganic minerals. Above 600 °C, as a result of pressure, the mineral skeleton cannot support the pore space, resulting in the collapse and blockage of pores, complicating the pore structure. Therefore, the in situ pyrolysis final temperature should be selected on the premise of complete organic matter decomposition and optimization of pore structure parameters.
Acknowledgments
This work has been supported jointly by the National Key Research and Development Program (Grant No. 2016YFC0600901), the National Natural Science Foundation of China (Grant Nos. 51474099, 51574173, 51574115).
Author Contributions
Dong Yang conceived and designed the experiments; Junwen Zhang, Su Song and Zhiqin Kang performed the experiments; Zhijun Liu and Yaoqing Hu analyzed the data; Jixi Shao contributed reagents/materials/analysis tools and searched literature; Zhijun Liu wrote the paper.
Conflicts of Interest
The authors declare no conflict of interest.
References
- World Energy Council. World Energy Focus Annual 2017. Available online: https://www.worldenergy.org/publications/2017/world-energy-focus-2017/ (accessed on 10 January 2018).
- Sun, Y.; Bai, F.; Liu, B.; Liu, Y.; Guo, M.; Guo, W.; Wang, Q.; Lü, X.; Yang, F.; Yang, Y. Characterization of the oil shale products derived via topochemical reaction method. Fuel 2014, 115, 338–346. [Google Scholar] [CrossRef]
- World Energy Council. World Energy Resources 2016. Available online: https://www.worldenergy.org/publications/2016/world-energy-resources-2016/ (accessed on 10 January 2018).
- Ishii, S.; Seta, M.; Nagasaki, T.; Nakai, N.; Nagai, M.; Miyamoto, Y.; Imada, H.; Doihata, K.; Saito, K.; Sekimoto, Y. Oil Shales of the World; Pergamon Press: Oxford, UK, 1990; pp. 1285–1291. [Google Scholar]
- Dyni, J.R. Geology and resources of some world oil-shale deposits. Oil Shale 2003, 20, 193–252. [Google Scholar]
- Mohr, S.H.; Wang, J.; Ellem, G.; Ward, J.; Giurco, D. Projection of world fossil fuels by country. Fuel 2015, 141, 120–135. [Google Scholar] [CrossRef]
- Kang, Z.; Yang, D.; Zhao, Y.; Hu, Y. Thermal cracking and corresponding permeability of Fushun oil shale. Oil Shale 2011, 28, 273–283. [Google Scholar] [CrossRef]
- Symington, W.A.; Olgaard, D.L.; Otten, G.A.; Phillips, T.C.; Thomas, M.M.; Yeakel, J.D. ExxonMobil’s Electrofrac™ Process for In Situ Oil Shale Conversion. In Oil Shale: A Solution to the Liquid Fuel Dilemma; ACS Symposium Series; ACS Publication: Washington, DC, USA, 2008; Volume 1032, pp. 185–216. [Google Scholar]
- Beer, G.; Zhang, E.; Wellington, S.; Ryan, R.; Vinegar, H. Shell’s In situ Conversion Process—Factors Affecting the Properties of Produced Shale Oil. In Proceedings of the 28th Oil Shale Symposium US, Golden, CO, USA, 13–15 October 2008. [Google Scholar]
- Dwyer, A.S.; Kasevich, R.S.; Kolker, M. In Situ Radio Frequency Selective Heating Process. U.S. Patent 4,140,179, 20 February 1979. [Google Scholar]
- Yang, D.; Elsworth, D.; Kang, Z.Q.; Zhao, Y.S.; Zheng, B. Experiments on permeability evolution with temperature of oil shale. In Proceedings of the 28th 46th US Rock Mechanics/Geomechanics Symposium, Chicago, IL, USA, 24–27 June 2012; Volume 3, pp. 1831–1835. [Google Scholar]
- Sresty, G.C.; Snow, R.H.; Bridges, J.E. Recovery of Liquid Hydrocarbons from Oil Shale by Electromagnetic Heating In Situ. U.S. Patent 4,485,869, 4 December 1984. [Google Scholar]
- Tham, M.J. Serially Burning and Pyrolyzing to Produce Shale Oil from a Subterranean Oil Shale. U.S. Patent 3,987,851, 26 October 1976. [Google Scholar]
- Braun, R.L. Mathematical Modeling of Modified In Situ and Aboveground Oil Shale Retorting; Lawrence Livermore National Laboratory: Livermore, CA, USA, 1981.
- Eseme, E.; Urai, J.L.; Krooss, B.M.; Littke, R. Review of mechanical properties of oil shales: Implications for exploitation and basin modelling. Oil Shale 2007, 24, 159–174. [Google Scholar]
- Saif, T.; Lin, Q.; Bijeljic, B.; Blunt, M.J. Microstructural imaging and characterization of oil shale before and after pyrolysis. Fuel 2017, 197, 562–574. [Google Scholar] [CrossRef]
- Bai, F.; Sun, Y.; Liu, Y.; Guo, M. Evaluation of the porous structure of Huadian oil shale during pyrolysis using multiple approaches. Fuel 2017, 187, 1–8. [Google Scholar] [CrossRef]
- Tong, J.; Han, X.; Wang, S.; Jiang, X. Evaluation of Structural Characteristics of Huadian Oil Shale Kerogen Using Direct Techniques (Solid-State13C NMR, XPS, FT-IR, and XRD). Energy Fuels 2011, 25, 4006–4013. [Google Scholar] [CrossRef]
- Remusat, L.; Derenne, S.; Robert, F.; Knicker, H. New pyrolytic and spectroscopic data on Orgueil and Murchison insoluble organic matter: A different origin than soluble? Geochim. Cosmochim. Acta 2005, 69, 3919–3932. [Google Scholar] [CrossRef]
- Mao, J.; Fang, X.; Lan, Y.; Schimmelmann, A.; Mastalerz, M.; Xu, L.; Schmidt-Rohr, K. Chemical and nanometer-scale structure of kerogen and its change during thermal maturation investigated by advanced solid-state 13C NMR spectroscopy. Geochim. Cosmochim. Acta 2010, 74, 2110–2127. [Google Scholar] [CrossRef]
- Bhargava, S.; Awaja, F.; Subasinghe, N. Characterisation of some Australian oil shale using thermal, X-ray and IR techniques. Fuel 2005, 84, 707–715. [Google Scholar] [CrossRef]
- Fertl, W.H. Kerogen, Insoluble Organic Matter from Sedimentary Rocks. Earth-Sci. Rev. 1982, 18, 87–88. [Google Scholar] [CrossRef]
- Burnham, A.K.; Happe, J.A. On the mechanism of kerogen pyrolysis. Fuel 1984, 63, 1353–1356. [Google Scholar] [CrossRef]
- Na, J.G.; Im, C.H.; Chung, S.H.; Lee, K.B. Effect of oil shale retorting temperature on shale oil yield and properties. Fuel 2012, 95, 131–135. [Google Scholar] [CrossRef]
- Tiwari, P.; Deo, M. Compositional and kinetic analysis of oil shale pyrolysis using TGA–MS. Fuel 2012, 94, 333–341. [Google Scholar] [CrossRef]
- Kok, M.V. Heating rate effect on the DSC kinetics of oil shales. J. Therm. Anal. Calorim. 2007, 90, 817–821. [Google Scholar] [CrossRef]
- Bai, F.; Guo, W.; Lü, X.; Liu, Y.; Guo, M.; Li, Q.; Sun, Y. Kinetic study on the pyrolysis behavior of Huadian oil shale via non-isothermal thermogravimetric data. Fuel 2015, 146, 111–118. [Google Scholar] [CrossRef]
- Maier, C.G.; Zimmerly, S.R. Chemical dynamics of the transformation of the organic matter to bitumen in oil shale. Utah Univ. Res. Invest. Bull. 1924, 14, 62–81. [Google Scholar]
- Lewan, M.D.; Spiro, B.; Illich, H.; Raiswell, R.; Mackenzie, A.S.; Durand, B.; Manning, D.A.C.; Comet, P.A.; Berner, R.A.; Leeuw, J.W.D. Evaluation of Petroleum Generation by Hydrous Pyrolysis Experimentation. Philos. Trans. R. Soc. Lond. 1985, 315, 123–134. [Google Scholar] [CrossRef]
- Hubbard, A.B.; Robinson, W.E. A Thermal Decomposition Study of Colorado Oil Shale; US Department of the Interior, Bureau of Mines: Washington, DC, USA, 1950.
- Allred, V.D. Kinetics of oil shale pyrolysis. Chem. Eng. Prog. 1966, 62, 55–60. [Google Scholar]
- Rothman, A.J. Recent Experimental Developments in Retorting Oil Shale at the Lawrence Livermore Laboratory; Lawrence Livermore Lab.: Livermore, CA, USA, 1978. [Google Scholar]
- Jiang, Z.; Zhang, W.; Chao, L.; Wang, Y.; Liu, H.; Xiang, C. Characteristics and evaluation elements of shale oil reservoir. Acta Petrolei Sin. 2014, 35, 184–196. [Google Scholar]
- Bernard, S.; Wirth, R.; Schreiber, A.; Schulz, H.-M.; Horsfield, B. Formation of nanoporous pyrobitumen residues during maturation of the Barnett Shale (Fort Worth Basin). Int. J. Coal Geol. 2012, 103, 3–11. [Google Scholar] [CrossRef]
- Curtis, M.E.; Cardott, B.J.; Sondergeld, C.H.; Rai, C.S. Development of organic porosity in the Woodford Shale with increasing thermal maturity. Int. J. Coal Geol. 2012, 103, 26–31. [Google Scholar] [CrossRef]
- Chen, J.; Xiao, X. Evolution of nanoporosity in organic-rich shales during thermal maturation. Fuel 2014, 129, 173–181. [Google Scholar] [CrossRef]
- Modica, C.J.; Lapierre, S.G. Estimation of kerogen porosity in source rocks as a function of thermal transformation: Example from the Mowry Shale in the Powder River Basin of Wyoming. AAPG Bull. 2012, 96, 87–108. [Google Scholar] [CrossRef]
- Kang, Z.; Zhao, J.; Yang, D.; Zhao, Y.; Hu, Y. Study of the evolution of micron-scale pore structure in oil shale at different temperatures. Oil Shale 2017, 34, 42. [Google Scholar] [CrossRef]
- Saif, T.; Lin, Q.; Singh, K.; Bijeljic, B.; Blunt, M.J. Dynamic imaging of oil shale pyrolysis using synchrotron X-ray microtomography. Geophys. Res. Lett. 2016, 43, 6799–6807. [Google Scholar] [CrossRef]
- Tiwari, P.; Deo, M.; Lin, C.L.; Miller, J.D. Characterization of oil shale pore structure before and after pyrolysis by using X-ray micro CT. Fuel 2013, 107, 547–554. [Google Scholar] [CrossRef]
- Yang, L.; Yang, D.; Zhao, J.; Liu, Z.; Kang, Z. Changes of oil shale pore structure and permeability at different temperatures. Oil Shale 2016, 33, 101–110. [Google Scholar] [CrossRef]
- Han, X.; Jiang, X.; Yan, J.; Liu, J. Effects of Retorting Factors on Combustion Properties of Shale Char. 2. Pore Structure. Energy Fuels 2011, 25, 97–102. [Google Scholar] [CrossRef]
- Sun, L.; Tuo, J.; Zhang, M.; Wu, C.; Wang, Z.; Zheng, Y. Formation and development of the pore structure in Chang 7 member oil-shale from Ordos Basin during organic matter evolution induced by hydrous pyrolysis. Fuel 2015, 158, 549–557. [Google Scholar] [CrossRef]
- Wang, Q.; Jiao, G.; Liu, H.; Bai, J.; Li, S. Variation of the pore structure during microwave pyrolysis of oil shale. Oil Shale 2010, 27, 135–146. [Google Scholar]
- Geng, Y.; Liang, W.; Liu, J.; Cao, M.; Kang, Z. Evolution of Pore and Fracture Structure of Oil Shale under High Temperature and High Pressure. Energy Fuels 2017, 31, 10404–10413. [Google Scholar] [CrossRef]
- Nottenburg, R.N.; Rajeshwar, K.; Rosenvold, R.J.; Dubow, J.B. Temperature and stress dependence of electrical and mechanical properties of Green River oil shale. Fuel 1979, 58, 144–148. [Google Scholar] [CrossRef]
- Allan, A.M.; Clark, A.C.; Vanorio, T.; Kanitpanyacharoen, W.; Wenk, H.R. On the evolution of the elastic properties of organic-rich shale upon pyrolysis-induced thermal maturation. Geophysics 2015, 81, D271–D289. [Google Scholar] [CrossRef]
- General Administration of Quality Supervision, Inspection and Quarantine of China. Methods for Determining the Physical and Mechanical Properties of Coal and Rock—Part 2: Methods for Determining the True Density of Coal and Rock; GB/T 23561.2-2009; China Standards Press: Beijing, China, 2009.
- Oil and Gas Development Professional Standardization Committee. Practices for Core Analysis; SY/T 5336-2006; Petroleum Industry Press: Beijing, China, 2007. [Google Scholar]
- Shi, J.; Ma, Y.; Li, S.; Zhang, L. Characteristics of Thermal Bitumen Structure as the Pyrolysis Intermediate of Longkou Oil Shale. Energy Fuels 2017, 31, 10535–10544. [Google Scholar] [CrossRef]
- Yan, J.; Jiang, X.; Han, X. Study on the Characteristics of the Oil Shale and Shale Char Mixture Pyrolysis. Energy Fuels 2009, 23, 5792–5797. [Google Scholar] [CrossRef]
- Brunauer, S.; Emmett, P.H.; Teller, E. Adsorption of Gases in Multimolecular Layers. J. Am. Chem. Soc. 1938, 60, 309–319. [Google Scholar] [CrossRef]
- Barrett, E.P.; Joyner, L.G.; Halenda, P.P. The Determination of Pore Volume and Area Distributions in Porous Substances. I. Computations from Nitrogen Isotherms. J. Am. Chem. Soc. 1951, 73, 373–380. [Google Scholar] [CrossRef]
- Washburn, E.W. The Dynamics of Capillary Flow. Phys. Rev. 1921, 17, 273–283. [Google Scholar] [CrossRef]
- Han, X.; Jiang, X.; Cui, Z. Change of Pore Structure of Oil Shale Particles during Combustion. 2. Pore Structure of Oil-Shale Ash. Chem. Phys. Lett. 2008, 198, 367–372. [Google Scholar] [CrossRef]
- Xi, Z.; Tang, S.; Zhang, S.; Sun, K. Pore structure characteristics of marine–continental transitional shale: A case study in the Qinshui Basin, China. Energy Fuels 2017, 31, 7854–7866. [Google Scholar] [CrossRef]
- Rouquerol, J.; Avnir, D.; Everett, D.H.; Fairbridge, C.; Haynes, M.; Pernicone, N.; Ramsay, J.D.F.; Sing, K.S.W.; Unger, K.K. Guidelines for the Characterization of Porous Solids. Pure Appl. Chem. 1994, 66, 1739–1758. [Google Scholar] [CrossRef]
- Gregg, S.J.; Sing, K.S.W. Adsorption, Surface Area, and Porosity; Academic Press: Cambridge, MA, USA, 1982; pp. 220–221. [Google Scholar]
- Rigby, S.P.; Edler, K.J. The influence of mercury contact angle, surface tension, and retraction mechanism on the interpretation of mercury porosimetry data. J. Colloid Interface Sci. 2002, 250, 175–190. [Google Scholar] [CrossRef] [PubMed]
- Wardlaw, N.C.; Mckellar, M. Mercury porosimetry and the interpretation of pore geometry in sedimentary rocks and artificial models. Powder Technol. 1981, 29, 127–143. [Google Scholar] [CrossRef]
- Yao, Y.; Liu, D. Comparison of low-field NMR and mercury intrusion porosimetry in characterizing pore size distributions of coals. Fuel 2012, 95, 152–158. [Google Scholar] [CrossRef]
- Kibodeaux, K.R. Evolution of porosity, permeability, and fluid saturations during thermal conversion of oil shale. In Proceedings of the SPE Annual Technical Conference and Exhibition, Amsterdam, The Netherlands, 27–29 October 2014. [Google Scholar]
- Fan, Z.; Parker, J.C. An Efficient Modeling Approach to Simulate Heat Transfer Rate between Fracture and Matrix Regions for Oil Shale Retorting. Transp. Porous Media 2010, 84, 229–240. [Google Scholar]
- Williams, P.F.V. Thermogravimetry and decomposition kinetics of British Kimmeridge Clay oil shale. Fuel 1985, 64, 540–545. [Google Scholar] [CrossRef]
- Mckee, R.H.; Lyder, E.E. The Thermal Decomposition of Shales. I—Heat Effects. Ind. Eng. Chem. 2002, 13, 613–618. [Google Scholar] [CrossRef]
- Li, M.; Zhan, J.H.; Lai, D.; Tian, Y.; Liu, X.; Xu, G. Study on the evolution characteristic of intermediate during the pyrolysis of oil shale. J. Therm. Anal. Calorim. 2017, 130, 2227–2238. [Google Scholar] [CrossRef]
- Sun, K.; Zhao, Y.; Yang, D. Thermoelastoplastic damage model of heterogeneous medium and its application to thermal cracking analysis of oil shale in underground mining. Chin. J. Rock Mech. Eng. 2008, 27, 42–52. [Google Scholar]
- Burnham, A.K.; Singleton, M.F. High-Pressure Pyrolysis of Colorado Oil Shale; American Chemical Society Division of Fuel Chemistry: DuPage County, IL, USA, 1983; Volume 28. [Google Scholar]
- Meurer, W.P.; Symington, W.A.; Braun, A.L.; Kaminsky, R.D.; Olgaard, D.L.; Otten, G.A.; Phillips, T.C.; Thomas, M.M.; Wenger, L.M.; Yeakel, J.D. Parameteric Controls on the Composition of Oil Generated by In Situ Pyrolysis of Oil Shale. In Proceedings of the 28th Oil Shale Symposium, Golden, CO, USA, 13–15 October 2008. [Google Scholar]
Figure 1.
TG/DTG curve of Fushun oil shale.

Figure 2.
Schematic diagram of high-temperature triaxial pressure pyrolysis testing system: (1) support frame; (2) steel tube; (3) heating wire; (4) muff; (5) specimen; (6) thermocouple; (7) graphite packing; (8) temperature and pressure controller; and (9) oil pump.
Figure 2.
Schematic diagram of high-temperature triaxial pressure pyrolysis testing system: (1) support frame; (2) steel tube; (3) heating wire; (4) muff; (5) specimen; (6) thermocouple; (7) graphite packing; (8) temperature and pressure controller; and (9) oil pump.

Figure 3.
Adsorption–desorption isotherms of Fushun oil shale at varying temperatures.
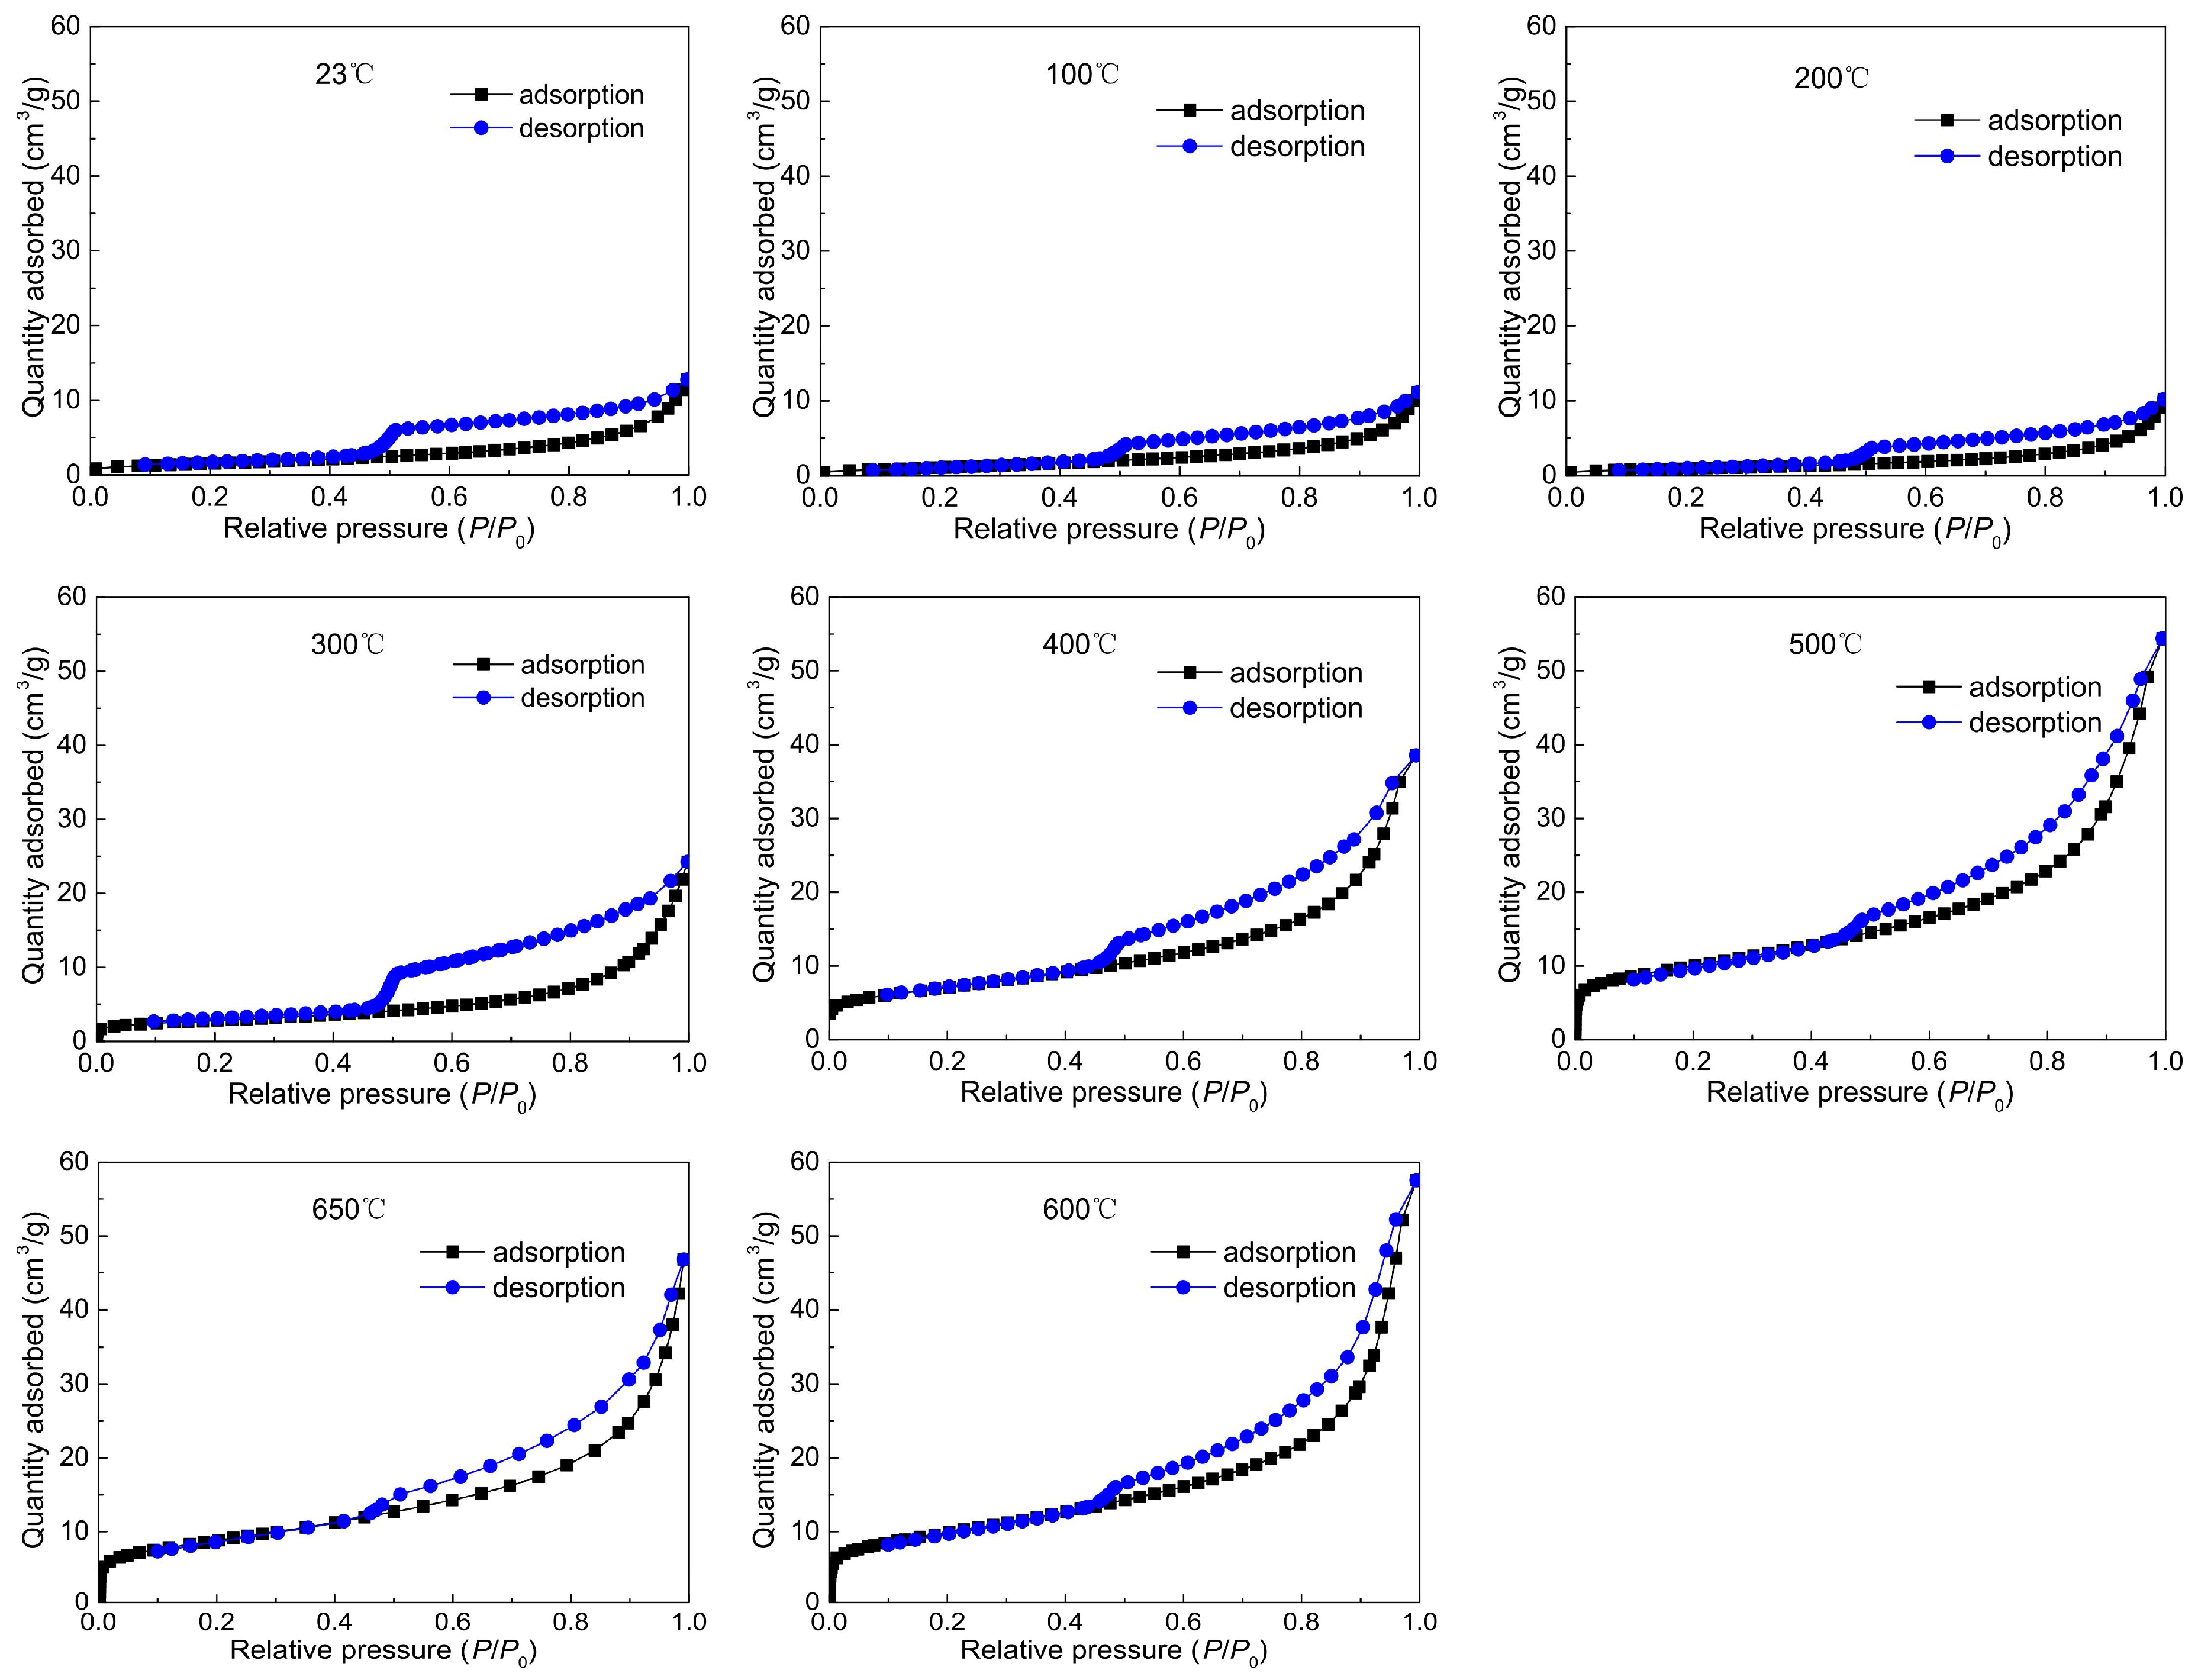
Figure 4.
Specific surface area (SSA) and pore volume curve with varying temperature by LPNA.
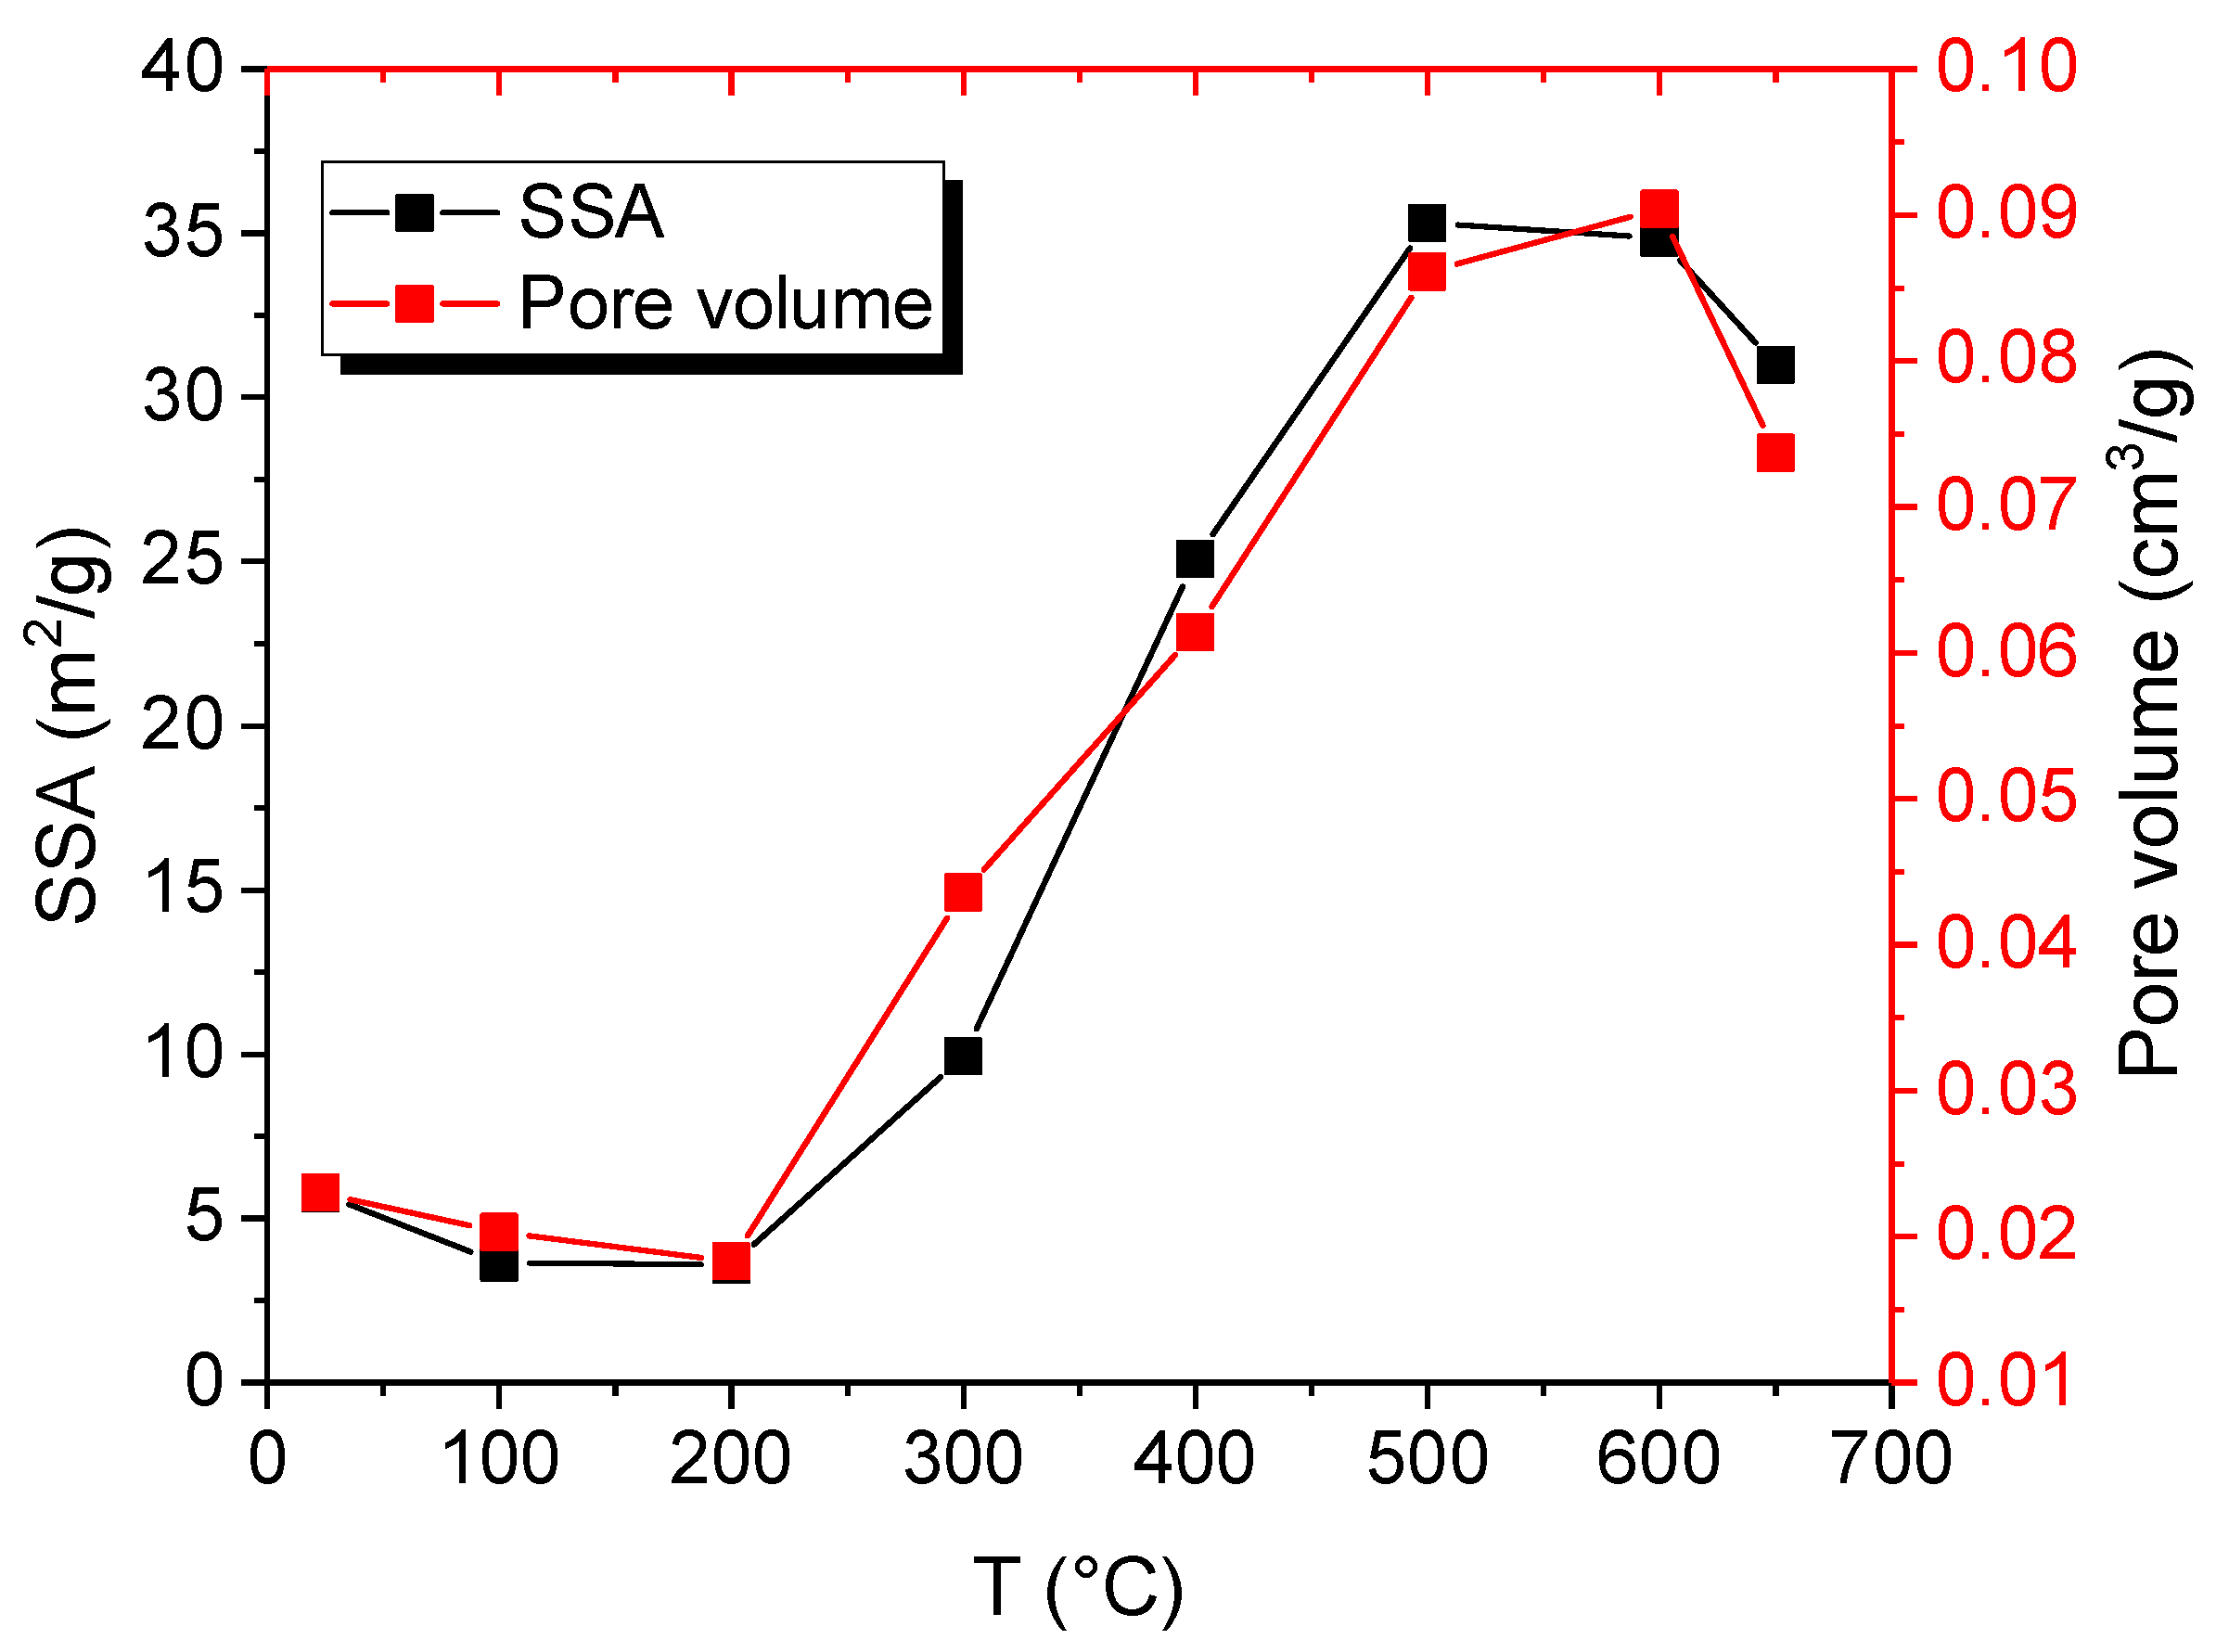
Figure 5.
Pore size distribution (PSD) curve of LPNA at different pyrolysis temperatures.

Figure 6.
Pore volume versus pore diameter curves of mercury intrusion porosimetry (MIP) at different pyrolysis temperatures.
Figure 6.
Pore volume versus pore diameter curves of mercury intrusion porosimetry (MIP) at different pyrolysis temperatures.

Figure 7.
PSD curves at different temperatures of MIP. (a) 23–300 °C; (b) 400–650 °C.
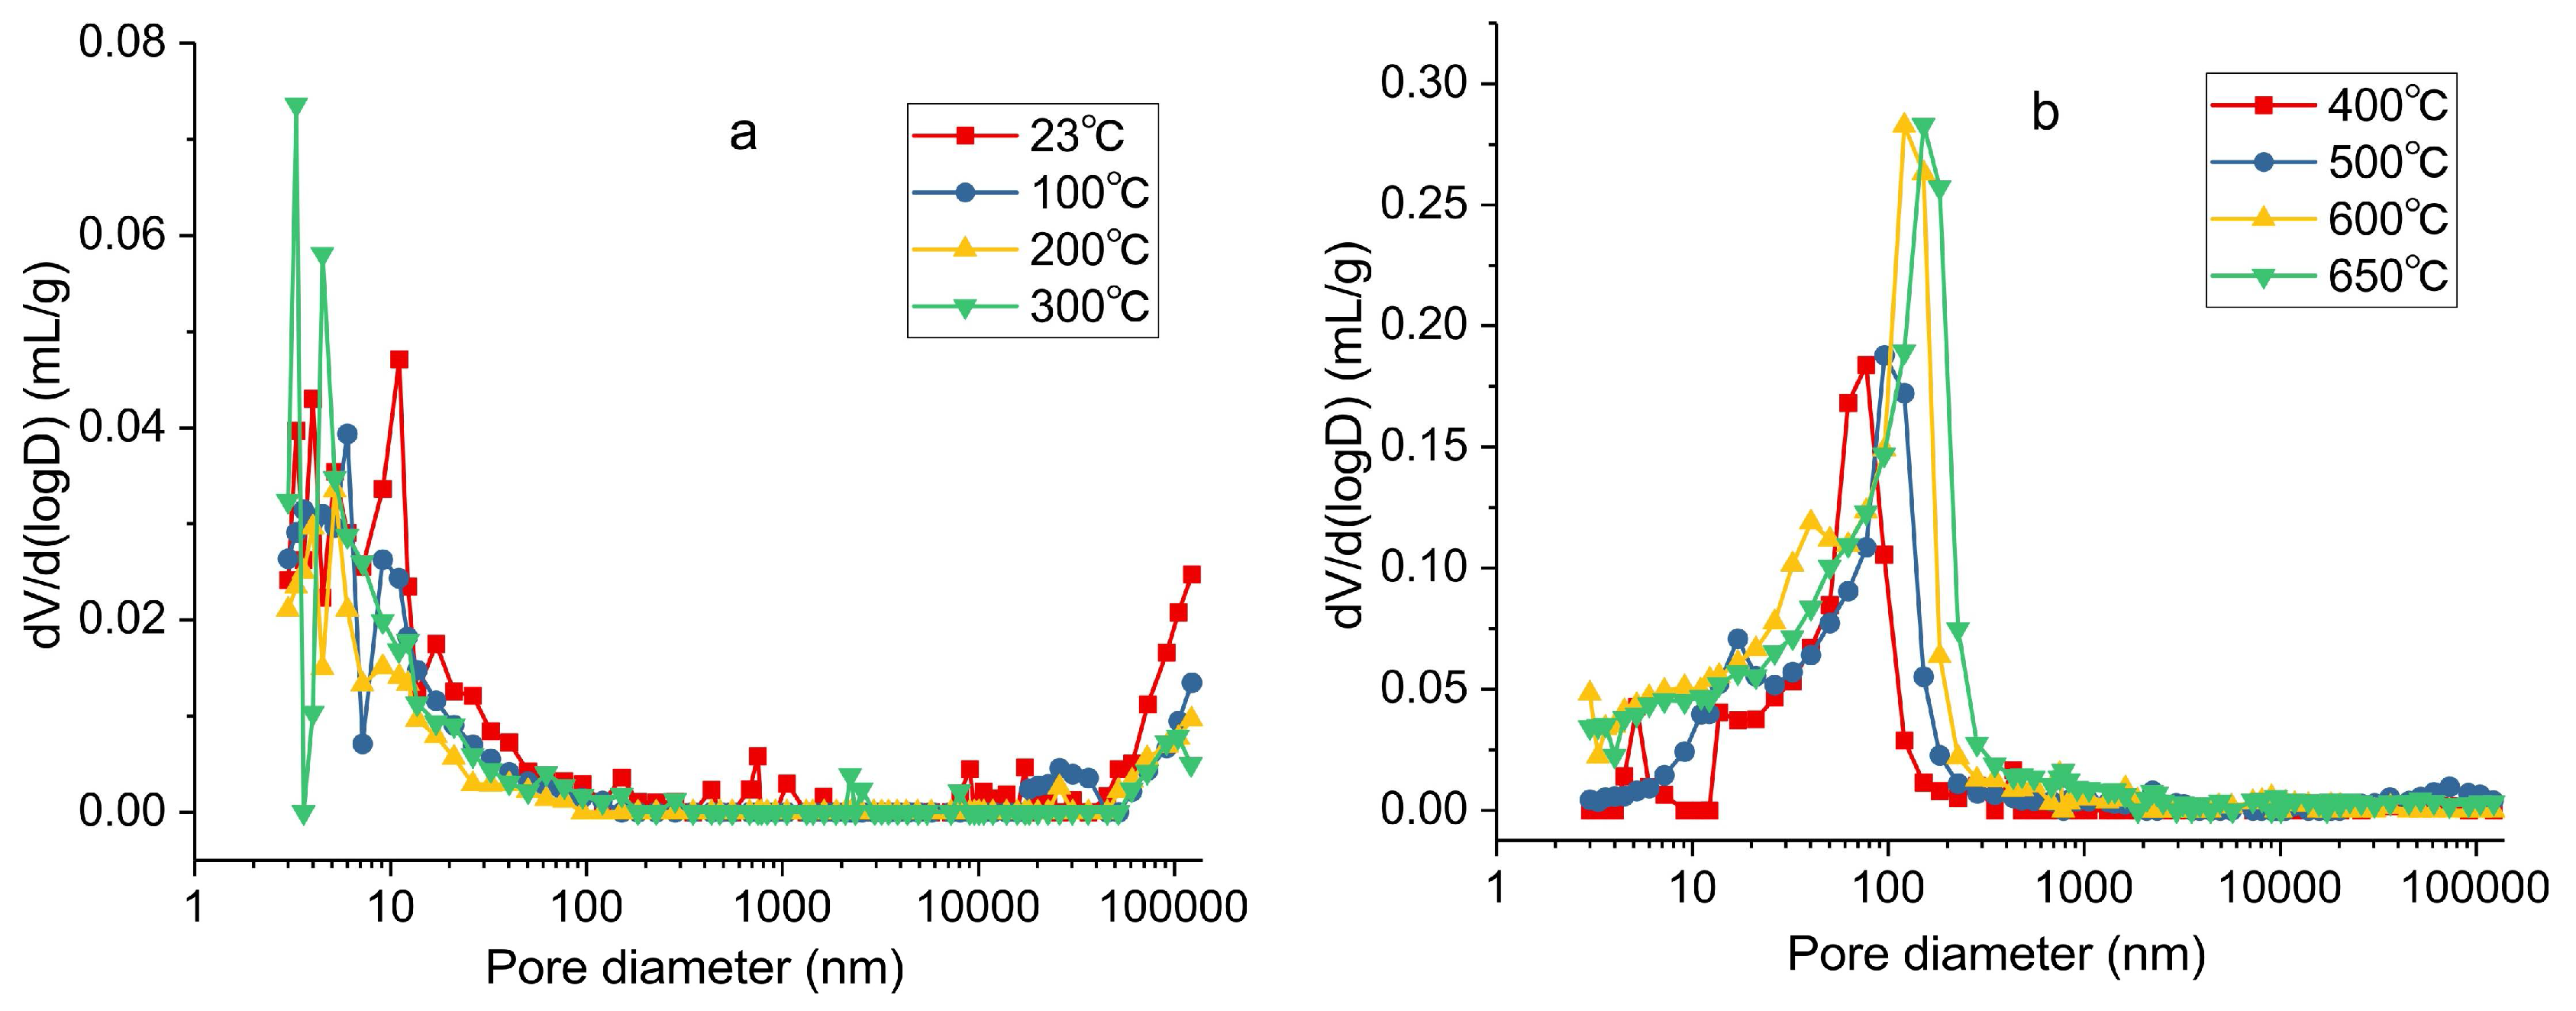
Figure 8.
Diagram of the relationship between pore volume and temperature by MIP.

Figure 9.
The relationship between transition pore volume and temperature from MIP and LPNA.


Table 1.
Physical parameters and mineral components of the Fushun oil shale.
| Physical Parameters (23 °C) | Mineral Composition (%) | ||||||
|---|---|---|---|---|---|---|---|
| Density (g/cm3) | Porosity (%) | Quartz | Microcline | Albite | Pyrite | Ankerite | Clay |
| 2.19 | 7.02 | 45.2 | 5.1 | 4.2 | 1.0 | 1.8 | 42.7 |
Table 2.
Low-pressure nitrogen adsorption (LPNA) pore structure characteristic parameters.
| Sample | Specific Surface Area | Average Pore Size | Pore Volume | Volume of Different-Sized Pores cm3/g | ||
|---|---|---|---|---|---|---|
| °C | m2/g | nm | cm3/g | Micropores | Transitional-Pores | Mesopores |
| 23 | 5.758 | 4.31 | 0.023 | 0.0151 | 0.0079 | 0 |
| 100 | 3.6486 | 5.27 | 0.0203 | 0.0123 | 0.008 | 0 |
| 200 | 3.5883 | 6.53 | 0.0183 | 0.0105 | 0.0078 | 0 |
| 300 | 9.9257 | 6.14 | 0.0436 | 0.0276 | 0.016 | 0 |
| 400 | 25.0759 | 8.62 | 0.0614 | 0.0324 | 0.029 | 0 |
| 500 | 35.3099 | 10.85 | 0.0861 | 0.0401 | 0.046 | 0 |
| 600 | 34.8532 | 12.17 | 0.0904 | 0.0368 | 0.0536 | 0 |
| 650 | 30.9812 | 10.9 | 0.0737 | 0.0336 | 0.0401 | 0 |
Table 3.
Main pore structure parameters of MIP.
| Sample | Average Pore Size | Porosity | Pore Volume | Volume of Different-Sized Pores cm3/g | |||
|---|---|---|---|---|---|---|---|
| °C | nm | % | cm3/g | Micropores | Transitional-Pores | Mesopores | Macropores |
| 23 | 12.9 | 7.0189 | 0.035 | 0.0173 | 0.0111 | 0.001 | 0.0056 |
| 100 | 12.4 | 5.5175 | 0.0274 | 0.015 | 0.0078 | 5 × 10⁻⁴ | 0.0041 |
| 200 | 8.4 | 4.2829 | 0.0199 | 0.0118 | 0.0048 | 5 × 10⁻⁴ | 0.0028 |
| 300 | 10.2 | 5.6020 | 0.0275 | 0.017 | 0.0067 | 8 × 10⁻⁴ | 0.003 |
| 400 | 35.8 | 18.2599 | 0.0914 | 0.0051 | 0.0777 | 0.0067 | 0.0019 |
| 500 | 38.6 | 22.7861 | 0.1215 | 0.006 | 0.0816 | 0.0274 | 0.0065 |
| 600 | 25.8 | 32.4670 | 0.1884 | 0.0242 | 0.0975 | 0.0627 | 0.004 |
| 650 | 30 | 32.3090 | 0.1983 | 0.0221 | 0.0864 | 0.0824 | 0.0074 |
© 2018 by the authors. Licensee MDPI, Basel, Switzerland. This article is an open access article distributed under the terms and conditions of the Creative Commons Attribution (CC BY) license (http://creativecommons.org/licenses/by/4.0/).
Share and Cite
MDPI and ACS Style
Liu, Z.; Yang, D.; Hu, Y.; Zhang, J.; Shao, J.; Song, S.; Kang, Z. Influence of In Situ Pyrolysis on the Evolution of Pore Structure of Oil Shale. Energies 2018, 11, 755. https://doi.org/10.3390/en11040755
AMA Style
Liu Z, Yang D, Hu Y, Zhang J, Shao J, Song S, Kang Z. Influence of In Situ Pyrolysis on the Evolution of Pore Structure of Oil Shale. Energies. 2018; 11(4):755. https://doi.org/10.3390/en11040755
Chicago/Turabian StyleLiu, Zhijun, Dong Yang, Yaoqing Hu, Junwen Zhang, Jixi Shao, Su Song, and Zhiqin Kang. 2018. "Influence of In Situ Pyrolysis on the Evolution of Pore Structure of Oil Shale" Energies 11, no. 4: 755. https://doi.org/10.3390/en11040755
Note that from the first issue of 2016, this journal uses article numbers instead of page numbers. See further details here.