Comparative Study of the Aerodynamic Performance of the New MEXICO Rotor under Yaw Conditions

Jiangsu Key Laboratory of Hi-Tech Research for Wind Turbine Design, Nanjing University of Aeronautics and Astronautics, Nanjing 210016, China
*
Author to whom correspondence should be addressed.
Energies 2018, 11(4), 833; https://doi.org/10.3390/en11040833
Submission received: 12 February 2018
/
Revised: 18 March 2018
/
Accepted: 2 April 2018
/
Published: 4 April 2018
(This article belongs to the Collection Wind Turbines)
Abstract
:The influence of yaw misalignment on the aerodynamic performance of the New MEXICO rotor is investigated using blade-resolved Computational Fluid Dynamics (CFD) approaches with three wind speeds considered at a fixed yaw angle of 30 degrees. The air-load predictions and near wake characteristics from the numerical results are compared and discussed against the most recent wind tunnel test data. The nacelle impact, dynamic stall phenomenon and wake characteristics are analyzed, demonstrating the yaw effects and numerical issues raised from Reynolds-Averaged Navier Stokes (RANS) and Detached Eddy Simulation (DES) computations.
1. Introduction
A yaw situation occurs when a rotor is not perpendicular to the wind direction, which could happen to any wind turbine on every wind farm at any time. Even with a controlling system implemented, the rotor is not capable of following the continuous changing of the wind direction and hence spends much of its operating time misaligned with the wind. The air-loads on each blade vary in time when the turbine is yawed due to large fluctuations in the relative velocity at the leading edge. Results from both experimental and computational studies have shown that unsteady aerodynamics exist during all operating conditions and that dynamic stall can occur for high yaw angle operation while stall hysteresis occurs for even small yaw angles [1,2,3,4]. These unsteady aerodynamic phenomena are coupled with a long and flexible blade together with a tall tower for modern wind turbine, resulting severe structural dynamic response and hence wind turbine failures, reduced machine life and increased operating maintenance. Understanding the unsteady aerodynamic behaviour of the wind turbine in complicated yawed flow is essential to reliable and efficient designs.
Many experiments have been carried out on wind turbine aerodynamics. One is the well-known Unsteady Aerodynamics Experiment (UAE) Phase VI conducted by National Renewable Energy Laboratory (NREL) in the NASA Ames 24.4 m × 36.6 m wind tunnel [5,6], where comprehensive wind tunnel data of a two-bladed, stall-regulated horizontal axis wind turbine were obtained under a wide range of wind inflow speeds and yaw angles. Another is the ongoing Model Experiment in Controlled Conditions (MEXICO) project [7,8,9,10] carried out in Large Scale Low Speed Facility (LLF) of the German-Dutch Wind Tunnel (DNW), in which pressure and load data of a three-bladed model were measured under various inflow conditions together with detailed flow field data taken by Particle Image Velocimetry (PIV) technique. Several follow-up experiments, namely the Mexnext-II and Mexnext-III New Mexico project [11] have been performed to enlarge the yaw flow wind tunnel database. In addition, experiments have been carried out by Schreck [12,13] to explore the 3D dynamic stall processes on the NREL UAE Phase VI rotor through the analysis of blade surface pressure data and the local inflow angles when operating under yaw conditions. The wind tunnel experiments of these two wind turbines have accumulated detailed data, which provides the modeling basis and comparison reference for wind turbine aerodynamic computation and modeling.
Despite the difficulties [14], various modeling approaches have been developed or improved to investigate the unsteady aerodynamics of two wind turbines in yaw [15,16,17,18,19,20,21,22,23,24,25,26,27,28,29,30]. The dynamic stall phenomenon has been studied using Beddoes–Leishman dynamic stall model validated against the experimental results [27]. Yaw flow study is commonly conducted by comparing the aerodynamic performance in axial flow and yawed flow, such as in Sørensen [28], Tsalicoglou [29] and Schulz [30]. Relatively large discrepancies can be observed between computations and measurements. Under this circumstance, accurate predictions of the rotor aerodynamics are of significance to understand the physical mechanisms of the wind turbine flow field.
The present numerical study is built on the recent yawed inflow wind tunnel experiments in Mexnext-III New MEXICO project [11]. Unsteady aerodynamic performance of yawed wind turbine under three wind speeds of 10, 15, and 24 m/s, is investigated using computational fluid dynamic (CFD) method. The yaw angle between the rotor axis and wind direction is fixed at 30°. Full rotor geometry is resolved in the computations. Computational results of the rotor power and load variations are compared against the wind tunnel measurements. Sensitivity analysis of the influence of the grid resolution and nacelle effect is presented. Reynolds Averaged Navier-Stokes (RANS) and Detached Eddy Simulations (DES) computations are both employed, and evaluation regarding the adaptability and accuracy of the two methods has been made. The advancing and retreating effect and the flow physics of dynamic stall phenomenon on the blade inboard section are discussed.
2. Methodology
2.1. Wind Turbine Geometrical and Operational Descriptions
The recent wind tunnel experiments in the MEXICO project, which was carried out in Large Scale Low Speed Facility (LLF) of the German-Dutch Wind Tunnel (DNW) with an open test section of 9.5 m × 9.5 m, involved extensive measuring of air loads, surface pressure and near wake flow field data. The wind tunnel blockage ratio was 18% and breathing slots were placed behind the collector to decrease the tunnel effect. The experimental model was a three-bladed wind turbine with a diameter of 4.5 m. The geometry profile of the blade is given in Table 1. The rotor was designed for an optimum tip speed ratio of 6.7 with the pitch angle of −2.3° at the tunnel velocity of 15 m/s. The tip speed ratio is defined as λ = ωR/U∞, where ω is the rotational speed, R stands for rotor radius and U∞ is the wind speed. The model was placed on a six component balance, measuring three forces and three moments at the foot of the tower. A total of 148 pressure sensors were instrumented and distributed at five blade spanwise positions 25%R, 35%R, 60%R, 82%R and 92%R, where R stands for the rotor radius. A zig-zag tape at 5% of the chord was used both on the blade upper and lower surfaces to trigger the laminar-to-turbulent transition. Phase locked stereo PIV measurements were performed at the 9 o’clock plane of the rotor for a variety of configurations and locations to characterize near wake flow. A complete description of the experiment setups is documented in the report of Boorsma and Schepers [11]. The nacelle geometry is simplified in this study. It is modelled as a cylinder with a diameter of 0.54 m and a length of 4 m. The nacelle nose and tail take the form of a tapered cylinder ending with a spherical cap.
In the most recent yawed condition MEXICO experiments, on which this study is based, the rotating speed of the rotor was fixed at 425.1 rpm and the blades were pitched with −2.3°. Measurements were performed at the yaw angle of 30° under the tunnel speeds of 10, 15 and 24 m/s, corresponding to tip speed ratios of 10, 6.7 and 4.2, respectively.
2.2. Grid Generation
Numerical investigations in this work are built on the yawed inflow wind tunnel experiments as mentioned above. Full computational domain is required in the transient yawed inflow simulation. Body-fitted mesh is applied in the present computations. The wind turbine is modeled without consideration of either zigzag or the tower in this numerical study. The sliding mesh technique is utilized to enable the rotation movement of the rotor. A pair of non-conforming axisymmetric interfaces is constructed between the static region and the rotating region. The structured multi-blocked computational meshes are generated using Pointwise. Mesh parameters are detailed in the following.
- Rotational region: The rotational zone has a shape of a cylinder. The rotor rotates around the +x axis with the origin located at point (0, 0, 0). The radius of the rotating region is 1D, and the region extends from −D to 3D in the x direction, where D is the rotor diameter. The boundary mesh topology around the blade surface is O-type. The height of the first boundary layer cells is kept at 5 × 10⁻⁶ m to ensure y+ ≈ 1.
- Stationary region: The outer stationary zone has a cuboid shape in order to ensure the inlet and outlet boundaries easy to specify. The computational domain ranges from [−5D, −5D, −5D] to [10D, 5D, 5D] in the x, y, z directions, respectively. The snapshots of the computational mesh are shown in Figure 1.
2.3. Numerical Methods
The tip Mach number of the rotor blade does not exceed 0.3, and consequently compressibility is neglected. The governing equations are the incompressible form of Navier–Stokes equations:
where is the fluid velocity vector, the density-normalized pressure, the fluid kinematic viscosity, and the fluid turbulent viscosity.
With the inflow wind speed ranging from 10 m/s to 24 m/s, unsteady flow structures, such as massive flow separations and dynamic stall phenomenon, can be found near the blades. Therefore, the SST k-ω DES model [31] is employed in our study in addition to the commonly used Stress Transport (SST) k-ω RANS model [31]. The governing equations for the SST k-ω RANS model are described as follows:
where:
The value of the coefficients and can be found in [31].
Modification to the dissipation term in the k equation is made to switch the model from RANS to DES:
where Δ is the maximum local grid spacing () and is a calibration constant of the DES formulation.
Numerical simulations are conducted based on OpenFOAM-v2.3.x, in which the finite volume method is used to solve the Navier-Stokes equations. The convective terms are discretized using a third-order Quadratic Upstream Interpolation for Convective Kinematics (QUICK) scheme, and the viscous terms are discretized using central difference scheme. Temporal discretization of unsteady solution is treated through a second-order iterative time-stepping method. A uniform inflow velocity boundary condition is set at the inlet. A convective outflow boundary condition is applied at the outlet. Rotor blades and nacelle surface are treated as no-slip walls. The interpolation of the flux and variables between the non-conforming mesh interfaces is treated via an arbitrary mesh interface (AMI) projection technique [32]. The time step is set at 1.96 × 10⁻⁴ s, equivalent to 720 steps per revolution. All the numerical results are sampled after 20 revolutions with the scaled residual of all equations below 1 × 10⁻⁵ and time-averaged over the last five revolutions to ensure the convergence of the simulation. All our numerical simulations have been carried out using both RANS and DES models.
3. Results and Discussion
To facilitate the interpretation of the results, definitions of the two coordinate systems in yawed flow are specified in Figure 2a,b. The rotor rotates in clockwise direction when looking from the upstream. The blade azimuthal angle is defined to be zero when pointing to +z direction. The normal force on a blade section is normal to the local chord, positive pointing in downwind direction. The tangential force is parallel to the local chord, positive pointing from the trailing edge to the leading edge, see Figure 2c. The experimental data presented in the following discussion come from the MEXICO Experiment wind tunnel database from ECN [9,10] and the wind tunnel experiments described in the report of Boorsma and Schepers [11].
3.1. Grid Dependency
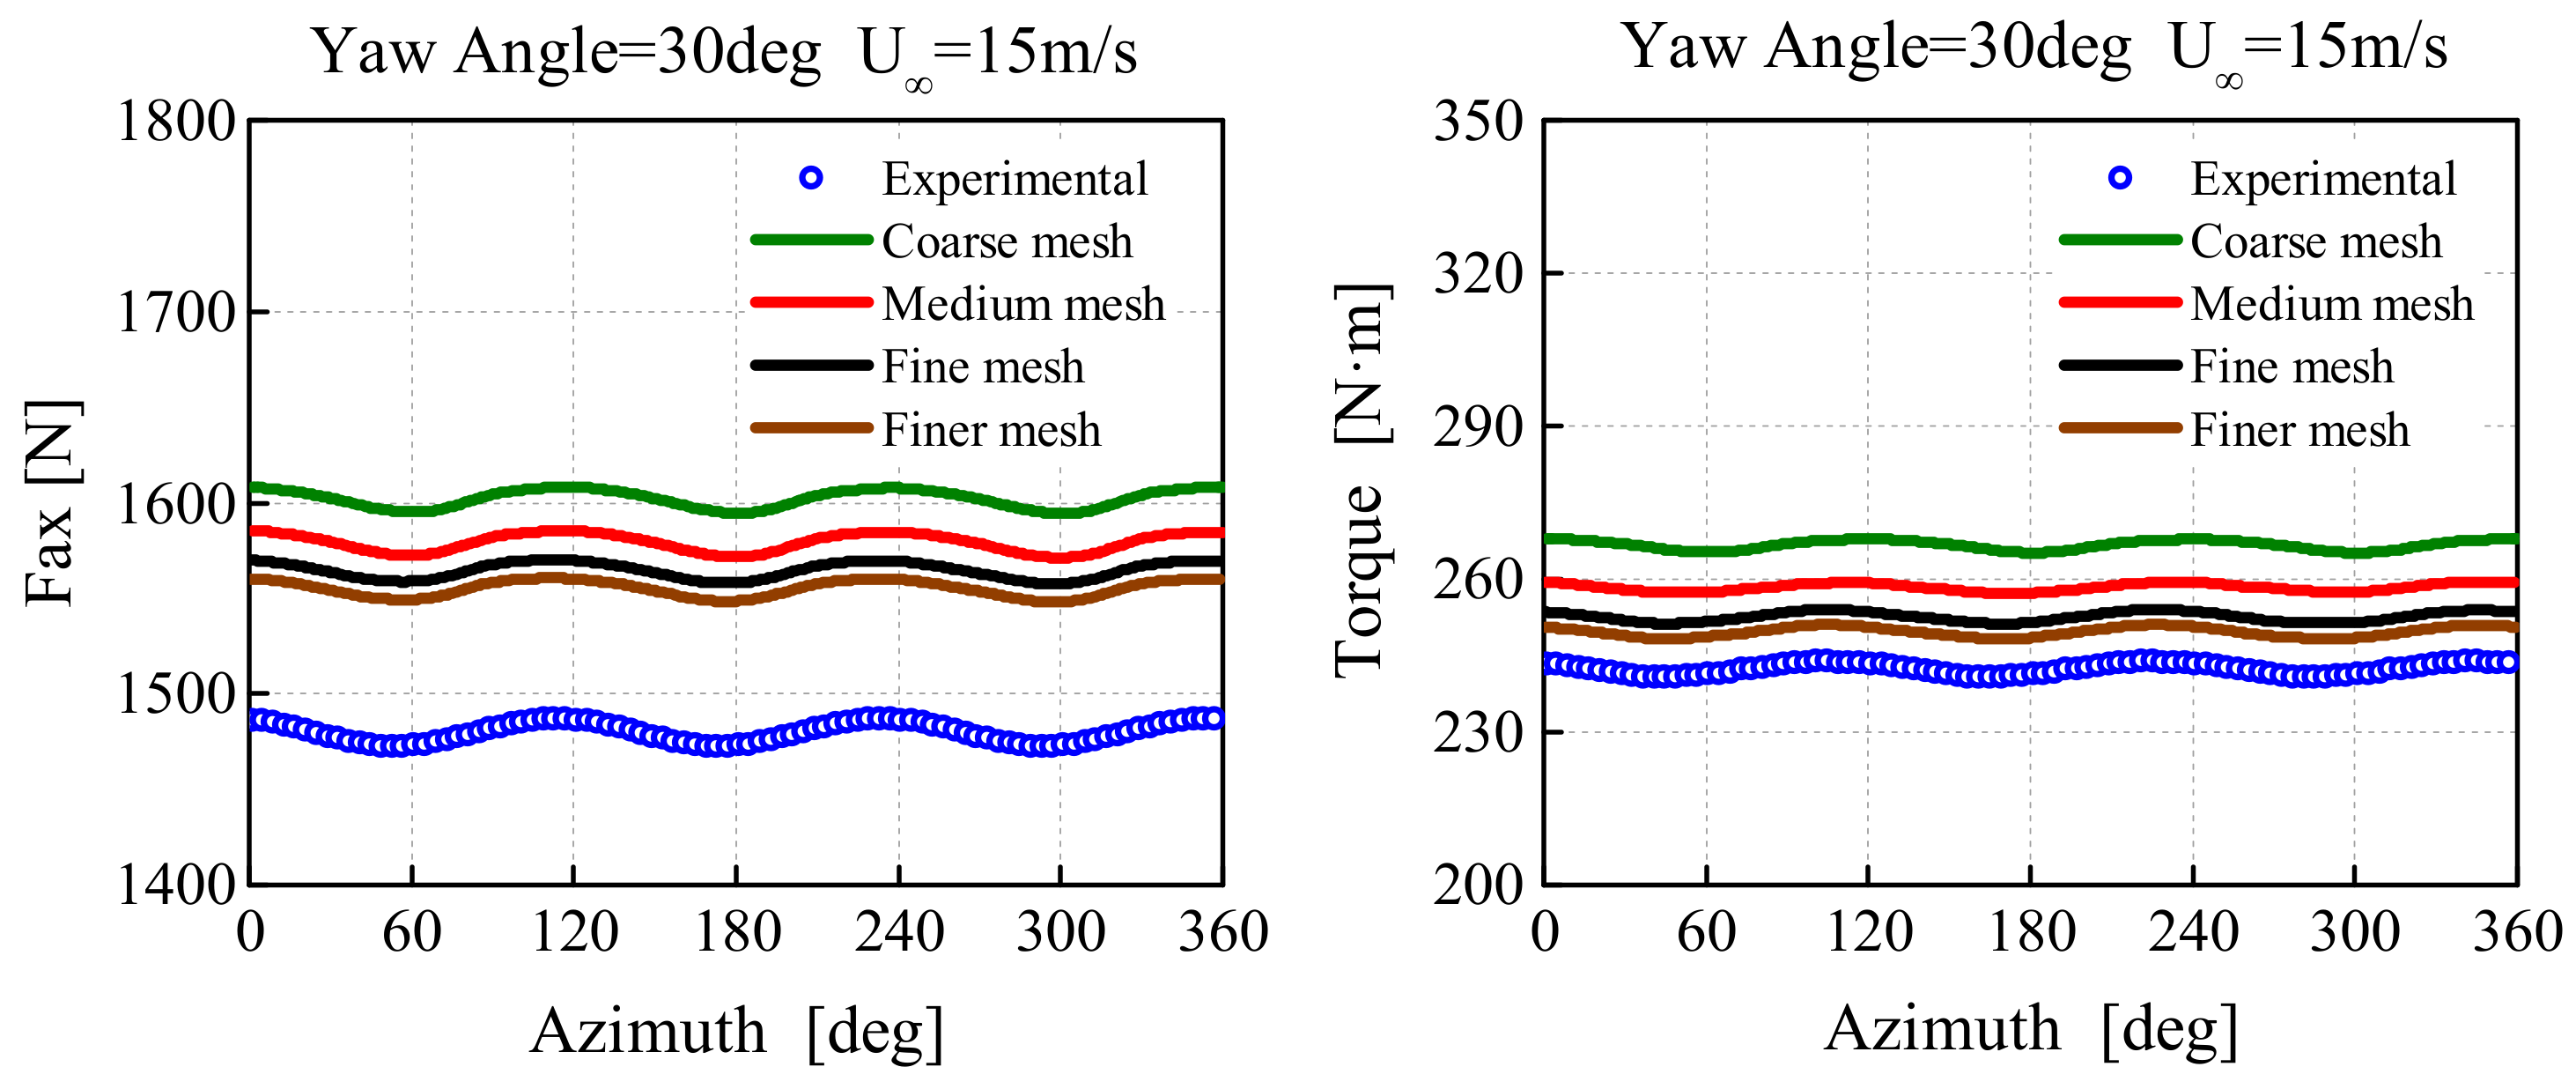
Four different resolution meshes as listed in Table 2 have been applied to investigate the influence on the load predictions. Computations are performed using the method described in Section 2.3 with turbulence modeled by SST k-ω RANS model. Wind inflow of 15 m/s is chosen to conduct this round of grid dependency study.
Comparisons of the rotor torque and axial force between computations and experiments are shown in Figure 3. The air-loads on the blade experience a periodic change as the blade incidence flow angle varies with azimuthal position. The overall shape and fluctuation amplitude of the rotor torque and axial force are well predicted. Over-estimation can be observed comparing to the measured data, which is also been found in similar studies by other research groups using CFD methods. The reason for the discrepancy could be tunnel effects, which cause the velocity accelerated. It has been pointed out in the numerical study of Réthoré [24], Bechmann [25] and Shen [26] that normalized velocity one rotor diameter upstream is different for simulations and measurements in the aligned flow condition. In addition to that, recent study [33] has also show that zig-zag tape is one of the probable factor resulting large discrepancy between fully turbulent CFD results and measured ones.
In Figure 3, the largest deviation can be found between the coarse mesh case and the measured data. The mean levels of the axial force and torque are over-predicted by 10%. With the increase in rotor resolution, the deviations gradually decrease as more detail flow structures can be captured in the simulation. The average difference is reduced down to around 6% for medium grid resolution case, and further decreased to less than 5% for the fine mesh case. The reduction of the mean value is less than 1% when the grid resolution changes from the fine to finer one, indicating that, with respect to the integrated loads, the results can be considered to be grid independent.
3.2. Rotor Performance Validation at Different Tip Speed Ratios
Rotor performance under inflow wind speeds of 10, 15 and 24 m/s, corresponding to tip speed ratios of 10, 6.7 and 4.2, is investigated. Comparisons of torque and axial force variations with blade azimuth are presented in Figure 4, Figure 5 and Figure 6. Large separations may occur when high wind speed is considered, hence DES is employed in this round of numerical computations. Air-loads of the rotor at the optimal inflow 15 m/s from RANS computations have already been presented in Section 3.1, and so we pay more attention to the other two “off-design” conditions.
For inflow wind speed of 15 m/s, corresponding to tip speed ratio of 6.7, the results of torque and thrust predictions using the two turbulence models are very close. The over-estimations of axial thrust and rotor torque are both within 6% compared to the measured data, which is better than in previous studies. Even though the differences are small, the amplitudes of the force and torque fluctuations from DES results fit the experimental data a little better than the RANS results. For instance, the fluctuation amplitude of the axial force with azimuthal angle calculated from RANS is 11 N, while this result from DES is 17 N closer to the experimental result of 15 N.
The scenario changes for the “off-design” state of a lower wind speed of 10 m/s, corresponding to high tip speed ratio of 10.0. In Figure 5, the axial thrust predictions are in good agreement with the measurements. The maximum over-estimation in RANS result is within 3%. DES result is slightly improved over RANS with 0.5 percentage reduction in maximum error. Strong discrepancy can be observed in torque prediction compared to measurement, although the relative error of the thrust prediction remains the same level as that at the wind speed of 15 m/s. The predicted torque is about 20% higher than the experimental result. At this low wind speed the blade inflow angle is rather low, and therefore the drag plays a more important negative role in torque production. It is reasonable that drag prediction may not be accurate enough using either RANS or DES technique, resulting in notable relative error in torque prediction, despite the fact that its absolute error is decreased compared to that in the design state. In this case, DES results were not significantly improved compared with RANS results.
For the wind speed of 24 m/s, flow separations are expected to occur as the blade operates at high incidence angles. The difference between RANS and DES results is significant, as expected. In Figure 6, predictions of total force and torque from RANS computations have a maximum over-estimation of 30% compared to the measurements. On the other hand, DES gives a better prediction of the error level below 20% compared to the wind tunnel data, although this is still unsatisfactory, at least to some extent. The dynamic stall phenomenon, the three-dimensional rotational augmentation and advancing and retreating effect all together pose more difficulties in rotor load predictions.
3.3. Nacelle Effect
The influence of nacelle on the rotor aerodynamics and near wake flow tends to be neglected in axial flow because the flow is axisymmetric and the nacelle frontal area is relatively small compared to the rotor swept area. According to the numerical study carried out by Sørensen [34], the presence of the nacelle would increase the power and the axial load by approximately 1–2%. He also pointed out that the scales of the blade and nacelle in the wind tunnel experiment were not in proportion to a full-size wind turbine, and therefore the effect is much larger than it should be expected for a full-size turbine [34]. However, when yaw misalignment is present, the flow state changes from axisymmetric to non-asymmetric. The impact area of nacelle is not confined to the frontal area, and it is possible that the nacelle interacts with the turbine wake. Under this circumstance, the presence of nacelle is more likely to bring more impact on the near wake flow than the axial inflow condition.
In order to evaluate exactly how much influence nacelle would bring on the rotor aerodynamic performance and near wake flow field, a trial of computations is conducted with and without the nacelle. The wind speed of 15 m/s is chosen in this case. The exact same resolution grids and numerical scheme set-ups are applied. Comparisons of the loads from the two cases are shown in Figure 7. The mean level of total torque gets a 3% increase when nacelle geometry is considered. Meanwhile, the axial force is less sensitive and the presence of nacelle geometry only causes a less than 2% increase.
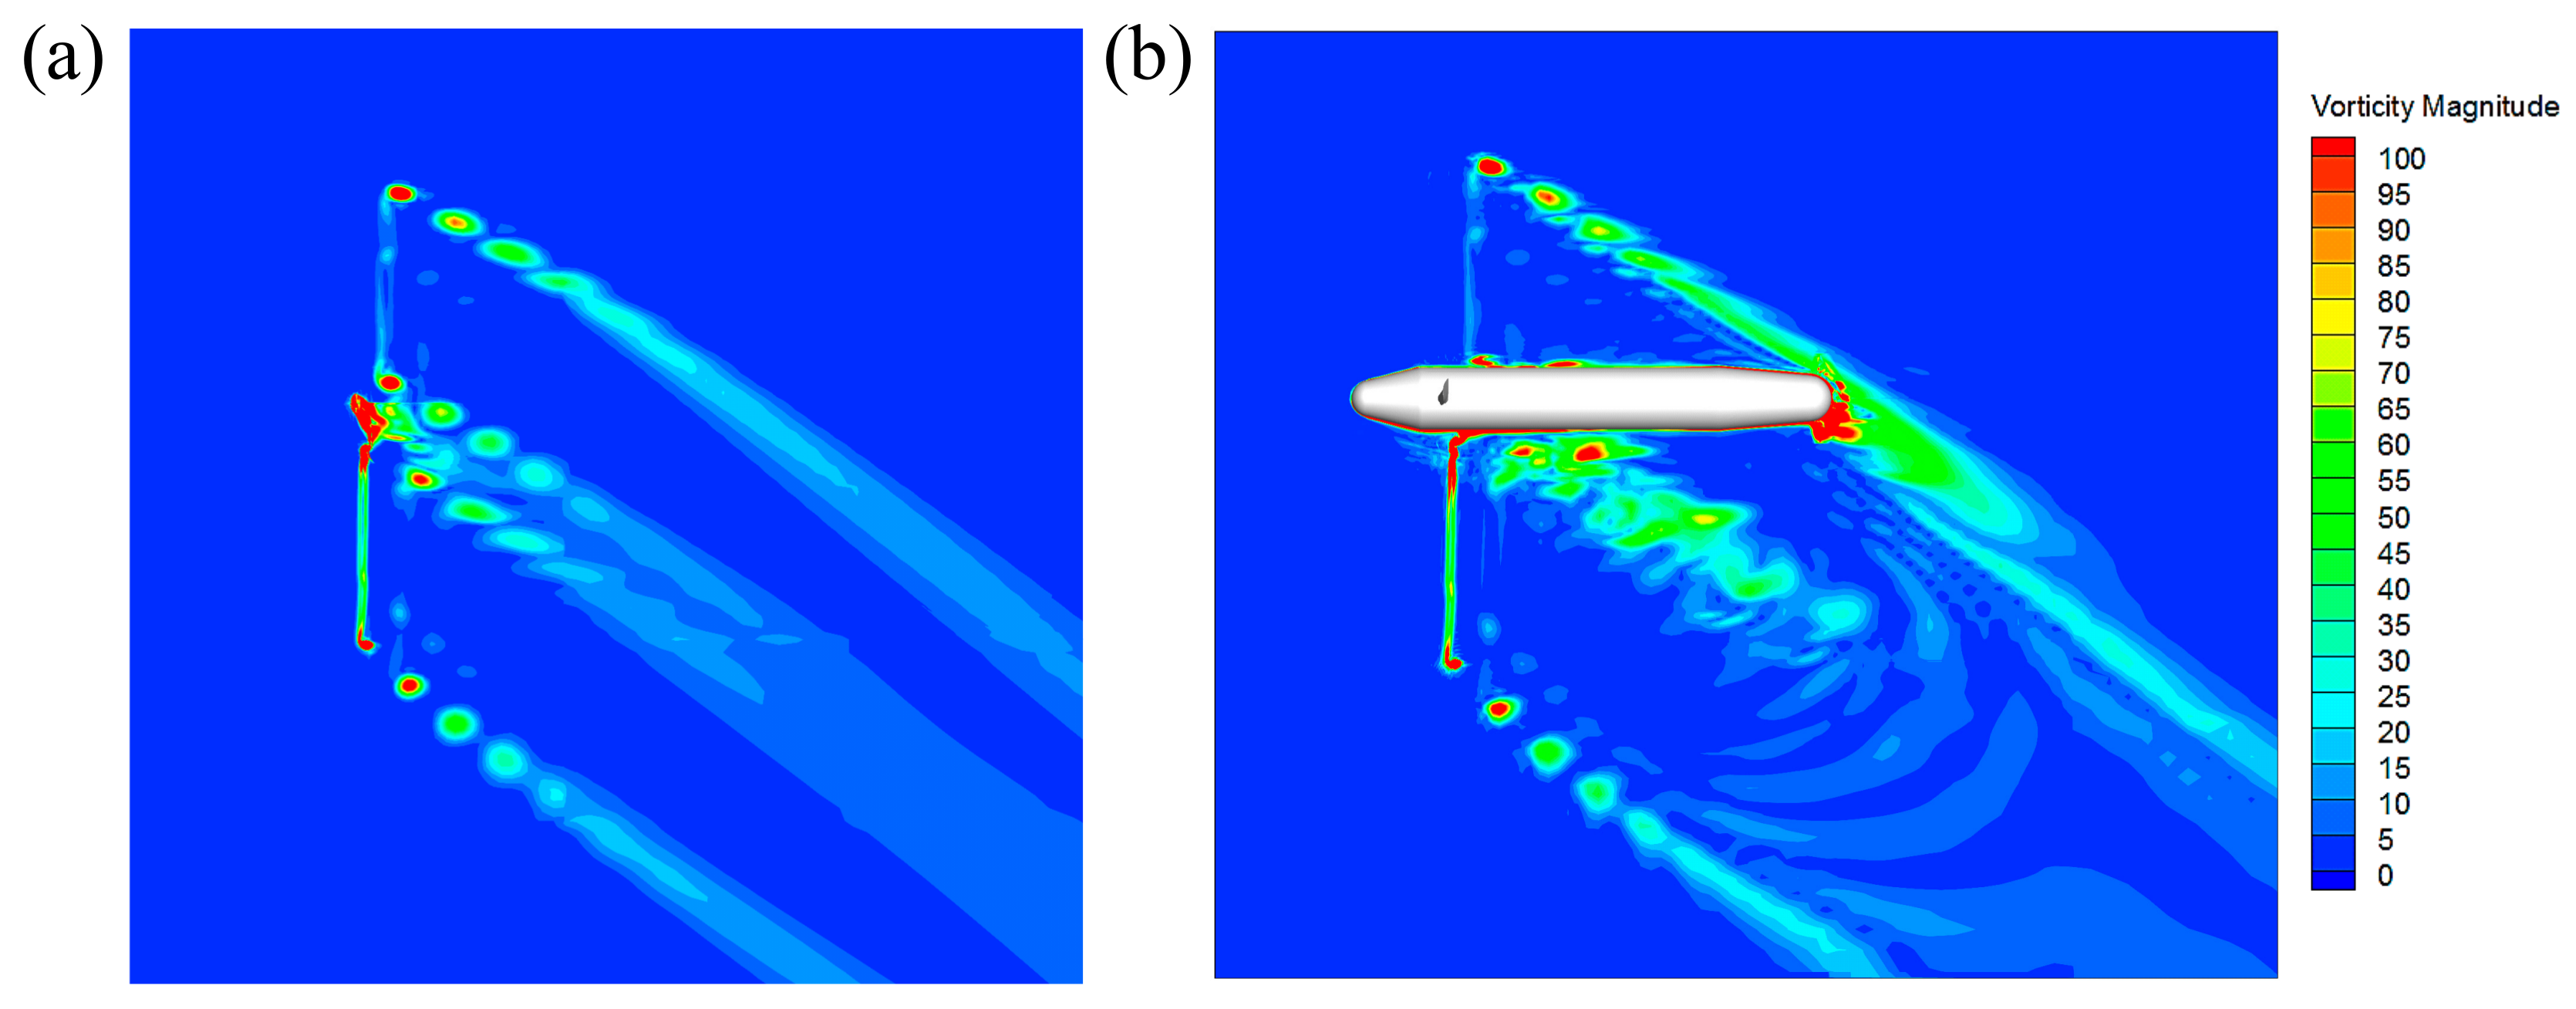
From the fully developed flow fields in Figure 8, where the vorticity magnitude contours are presented, it can be observed that nacelle presence does have influence on the wake development. The tip vortices and the root vortices are transported uniformly with the mainstream when there’s no nacelle presence. When the nacelle geometry is resolved, the root vortex structures are attached to the nacelle surface and later detach from the surface at about 0.2D behind the rotor plane. Detached vortex structures soon break into unsteady eddies. Another difference is that the vortices shedding from the trailing edge of nacelle happen to interact with the blade tip vortices in the windward side. Besides all that, the frontal area of the hub also causes a slight shadow effect on the root region of the downwind blade.
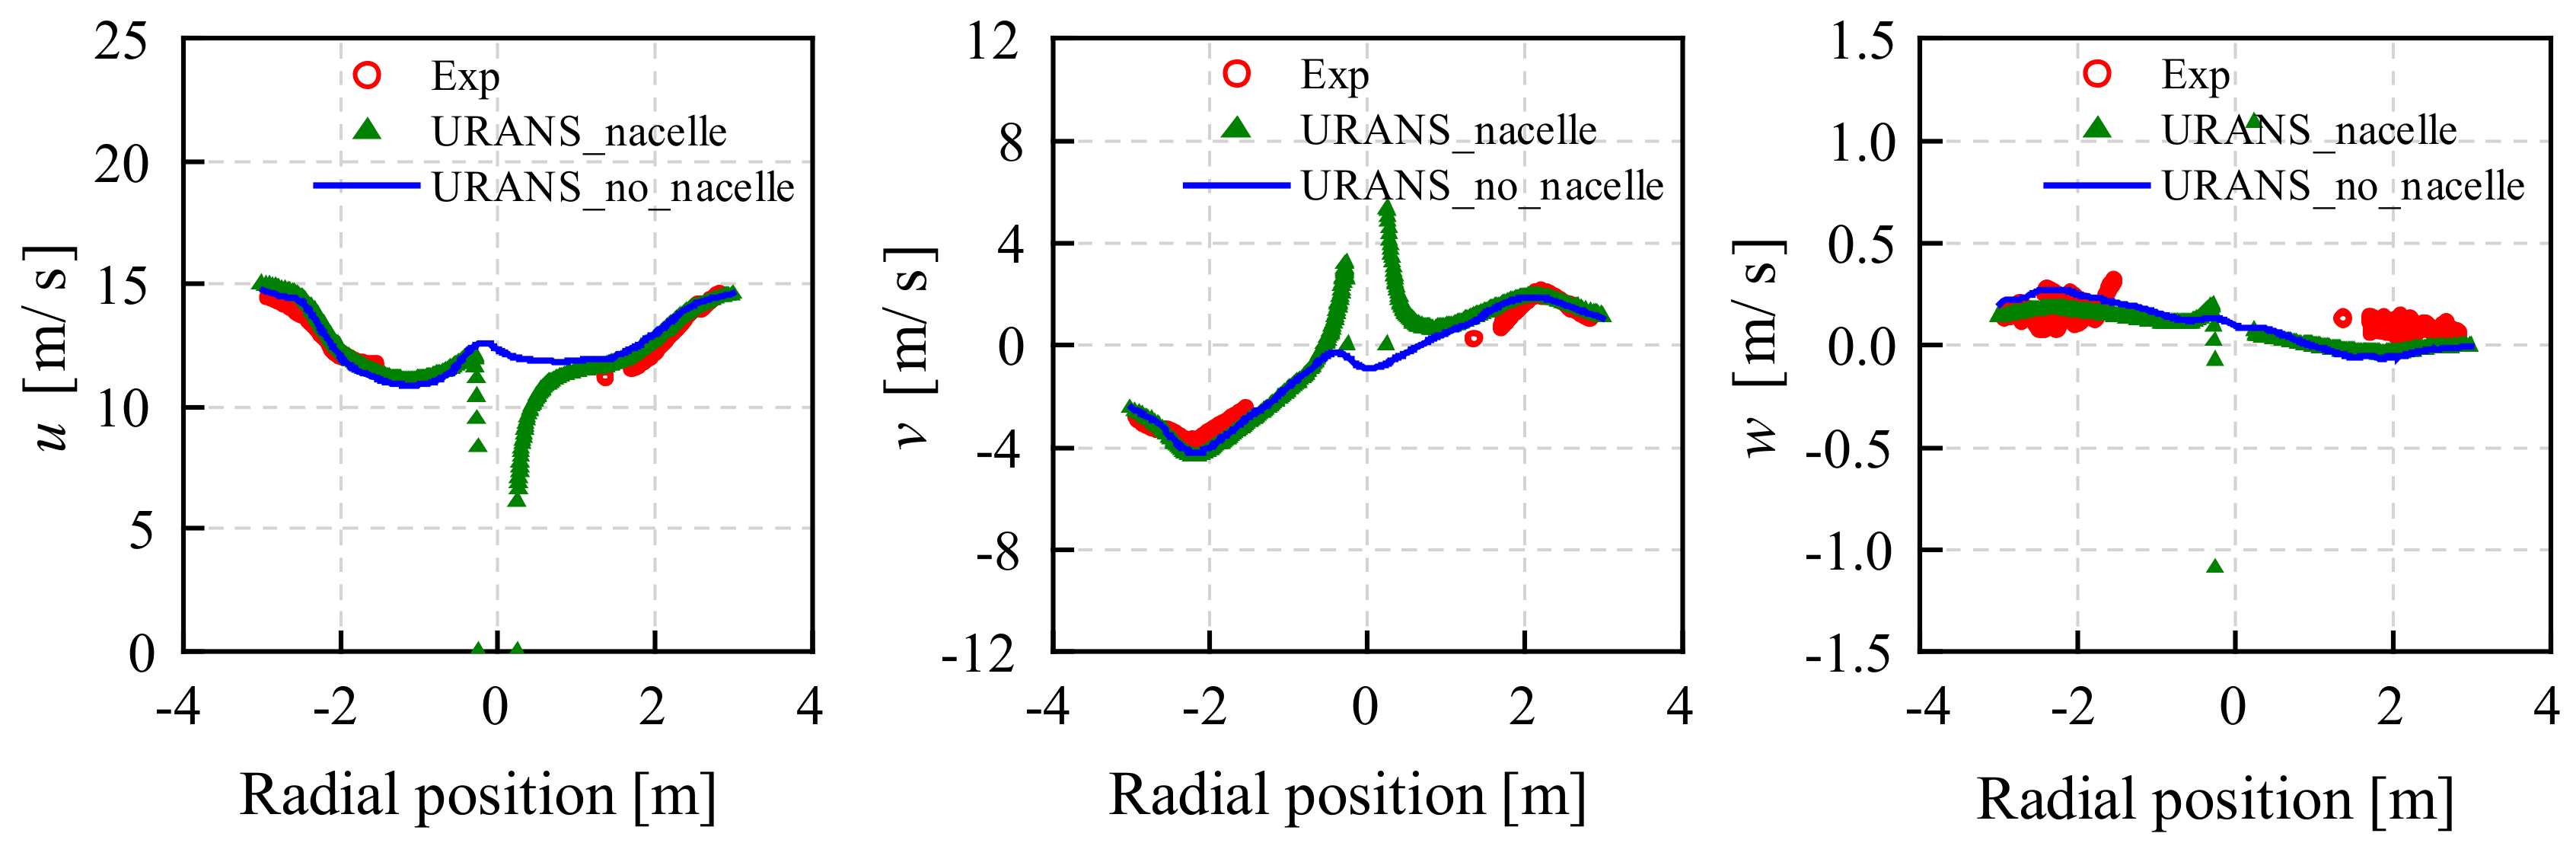
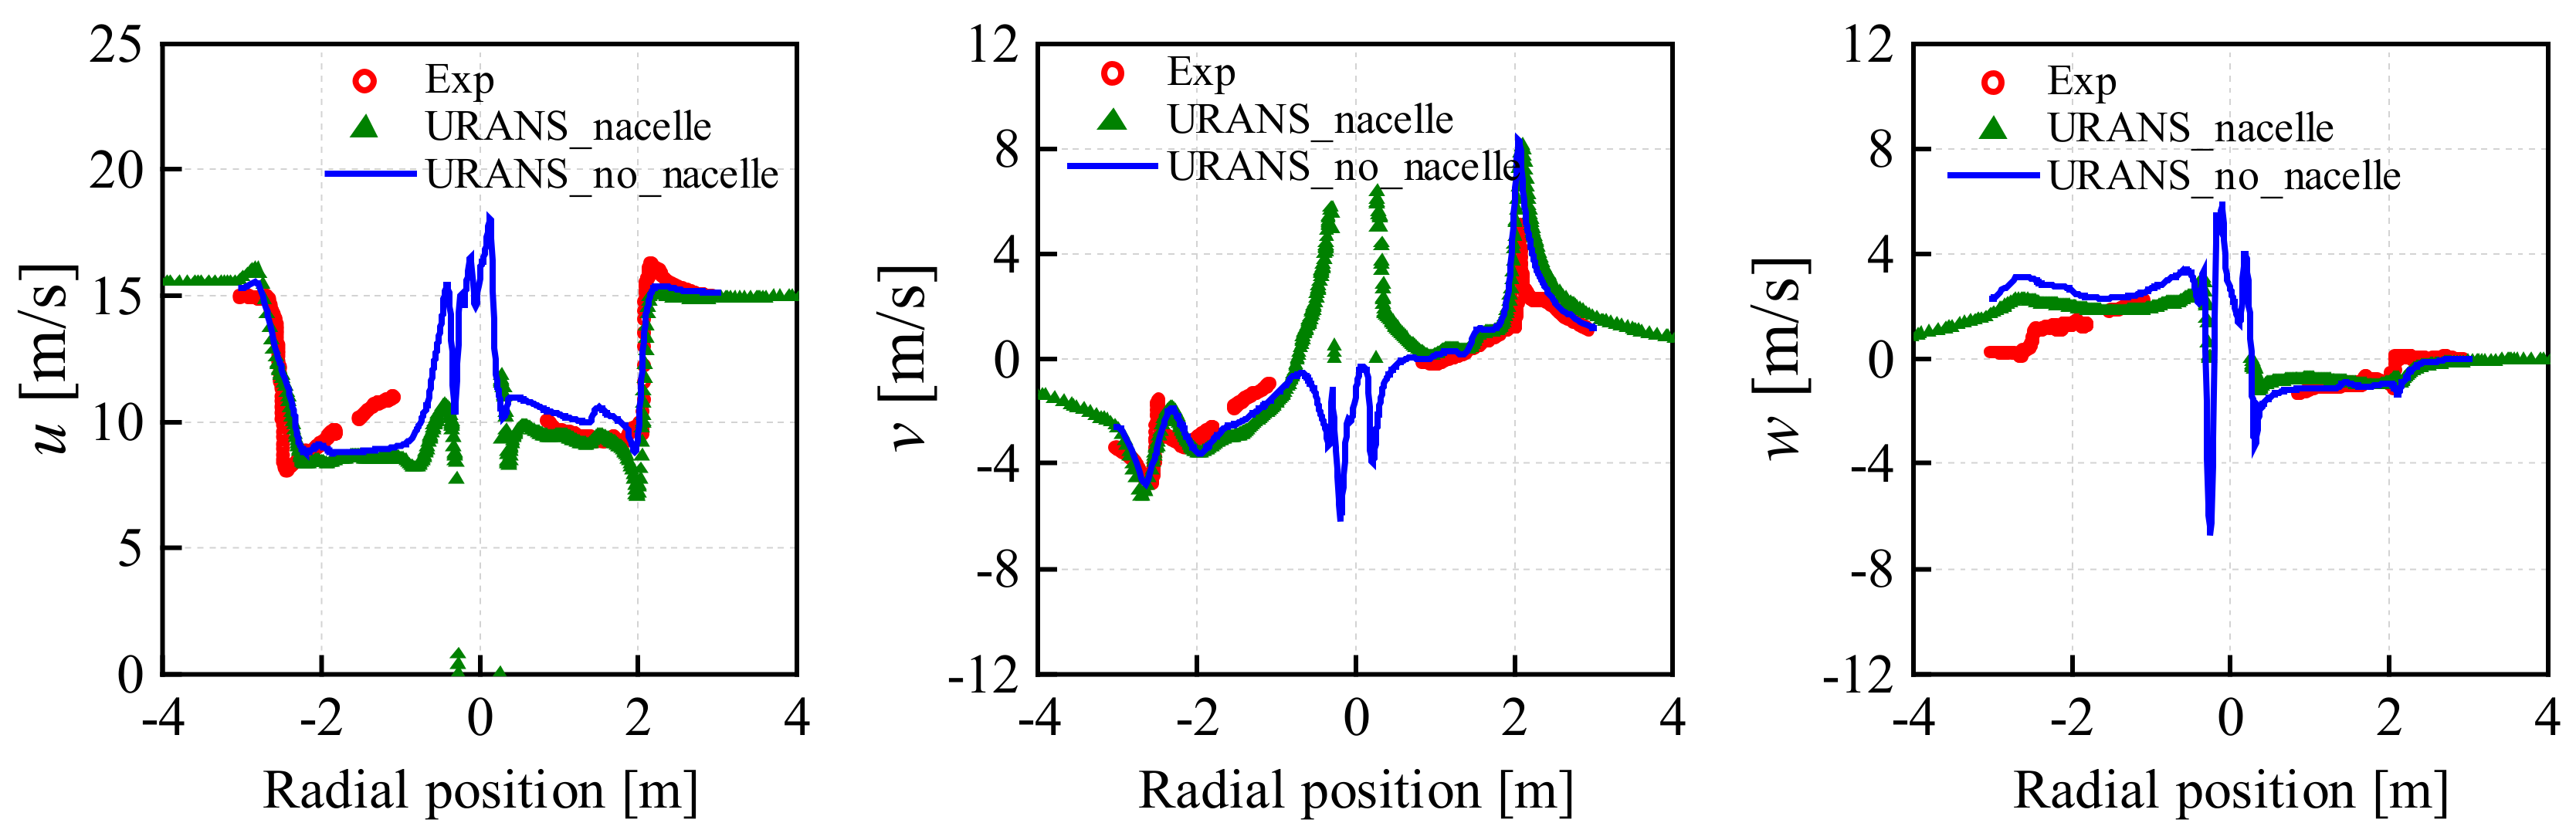
To elaborate on the nacelle influence on the near wake flow field statistically, radial and axial profiles of velocity components are compared against the wind tunnel data obtained using PIV technique [8,11] in Figure 9, Figure 10 and Figure 11. The radial profiles of averaged velocity components extracted parallel to the rotor plane at x = −0.3 m (upstream) and x = 0.3 m (downstream) in the model coordinate system are presented in Figure 9 and Figure 10. Results in both cases are very close and agree well with the measured data in the outboard section. Discontinuous peaks in the center area of no nacelle case occur due to the root vortices. The radial profiles of velocity components do not vary much whether the nacelle geometry is considered or not.
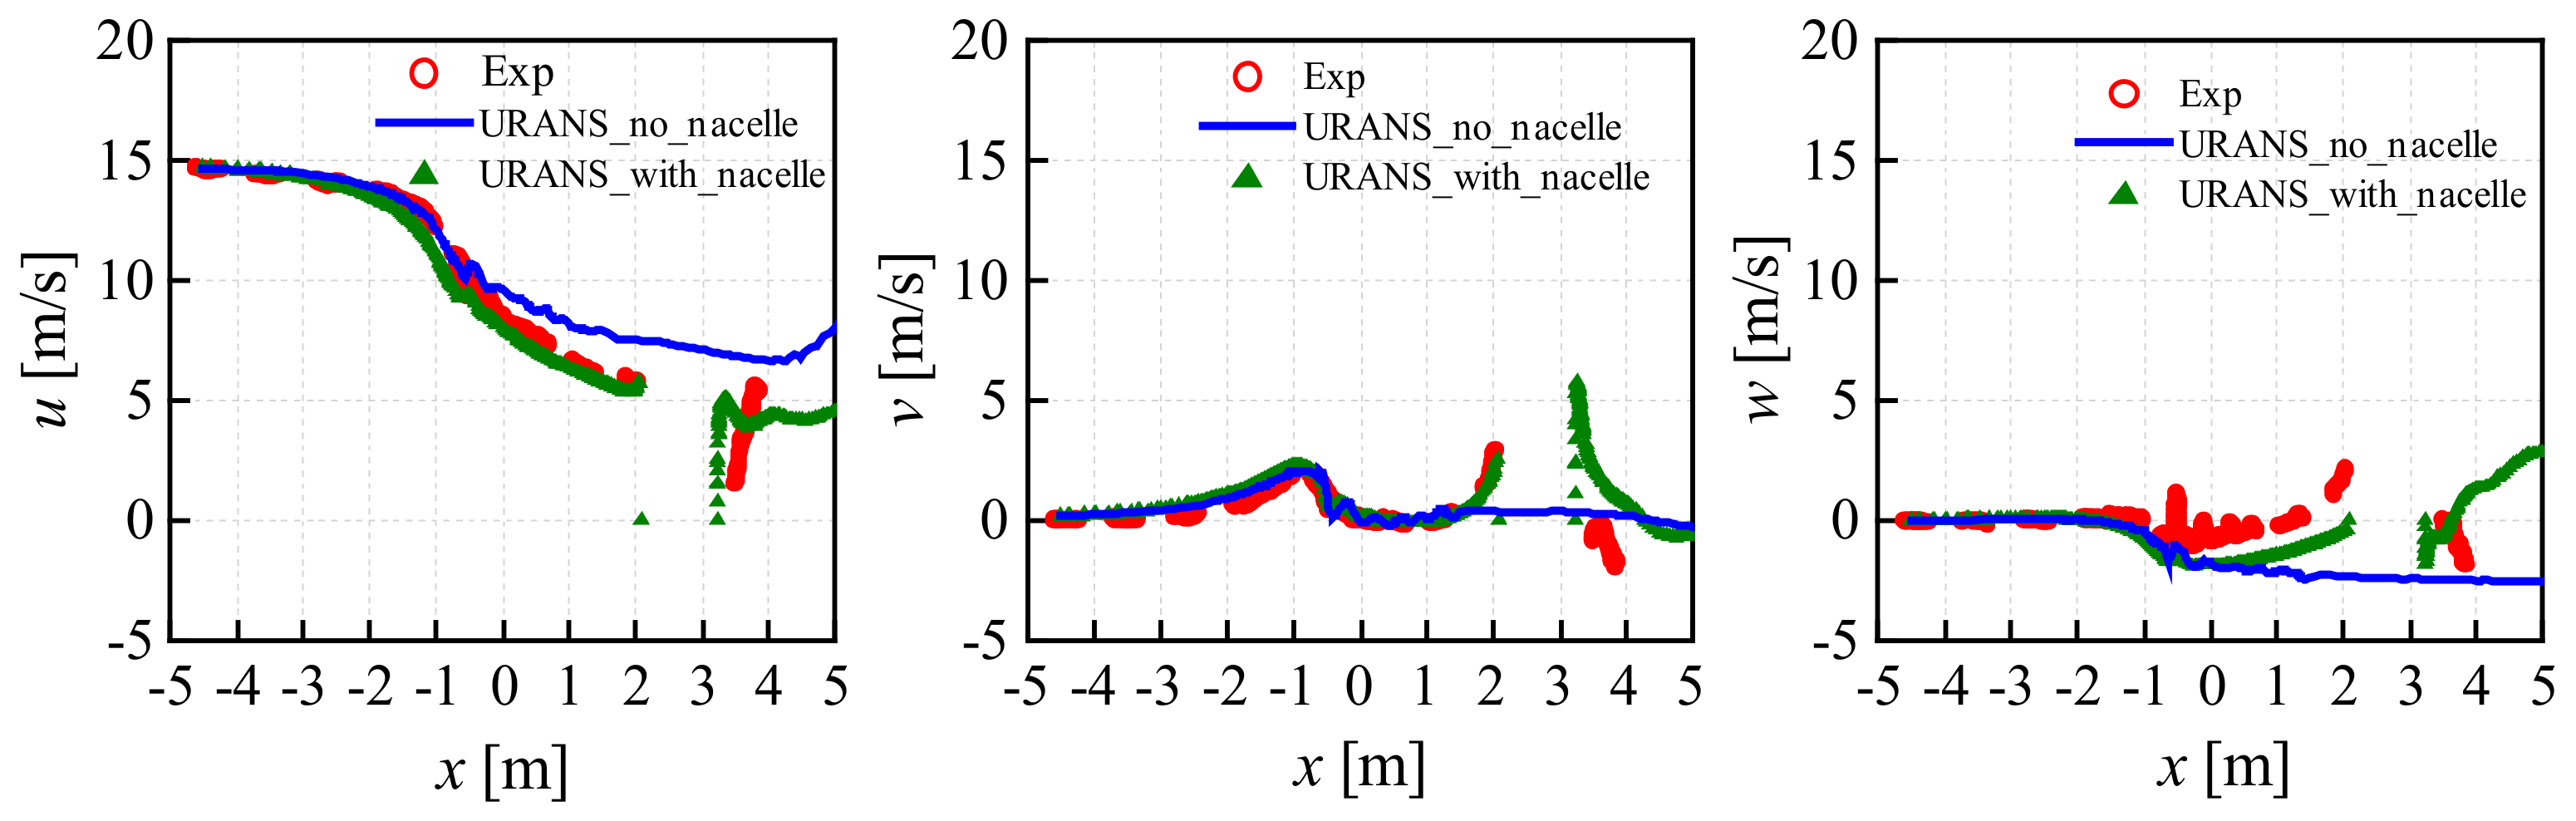
The velocity distribution in the axial direction is sampled at y = +1.5 m with respect to the wind tunnel system when the blade is pointing straight up. The influence of nacelle geometry on the axial profile of the near wake can be easily observed in the range between x = 2 m and x = 4 m in Figure 11. The results of the velocity components when nacelle is considered are in good agreement with the experimental data. In the meantime, large deviations can be observed in the “nacelle impact zone” between simulated results without nacelle and the measured data, especially the over-estimation of velocity component u. Therefore, for the future study of rotor flow field under yawed inflow, nacelle presence needs to be included.
3.4. Advancing and Retreating Phenomenon
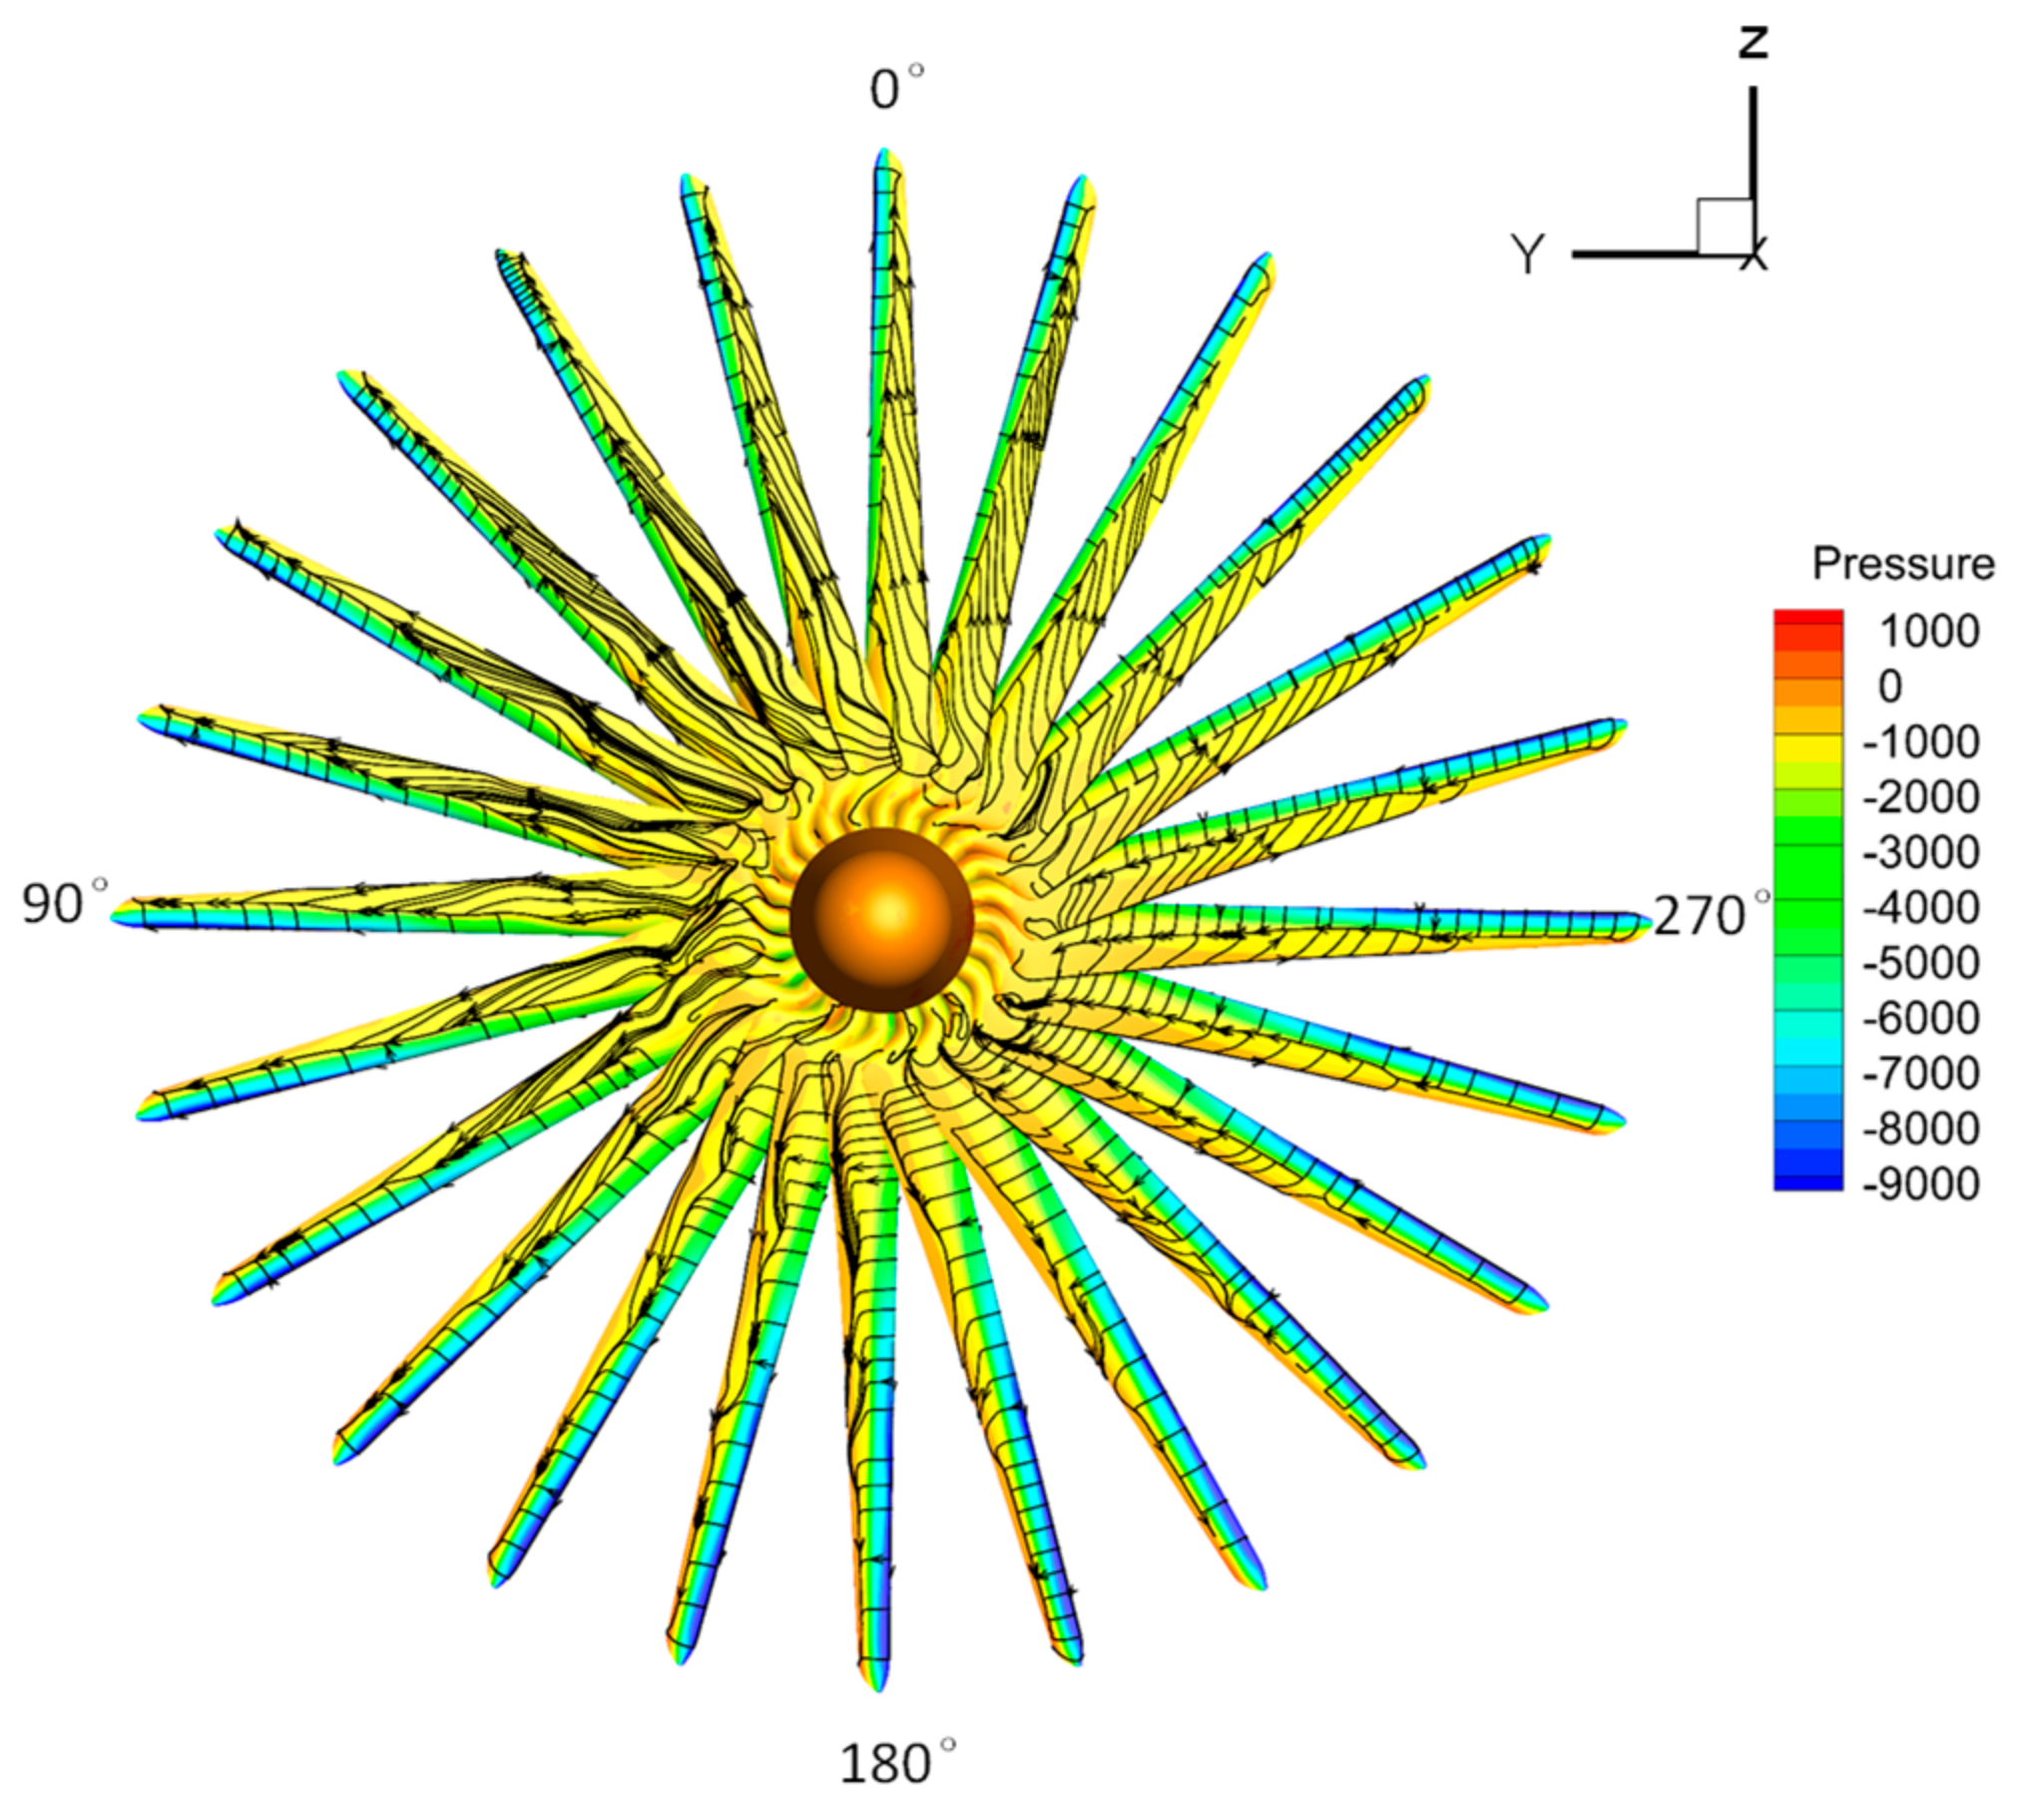
In contrast the axial inflow, there is a contribution of the wind in both x and y directions when the rotor is positioned in yawed inflow. Contour of pressure on the suction side of rotor blades at different azimuthal angles is shown in Figure 12. The influence of the extra y direction contribution on the rotor blade is changing due to the rotational motion, and consequently increases or decreases the velocity in chordwise direction periodically. This advancing and retreating phenomenon is characterized by a minimum and maximum at 0° and 180° azimuthal angles, respectively. At these two positions, the flow is either fully aligned with or opposite to the rotational speed. The local incidence angle reaches the highest and lowest at 0° and 180° azimuthal angle. From Figure 12, we can observe that the flow is mainly attached at 180° and almost fully separated at 0°. The change of incidence angles further induces dynamic stall.
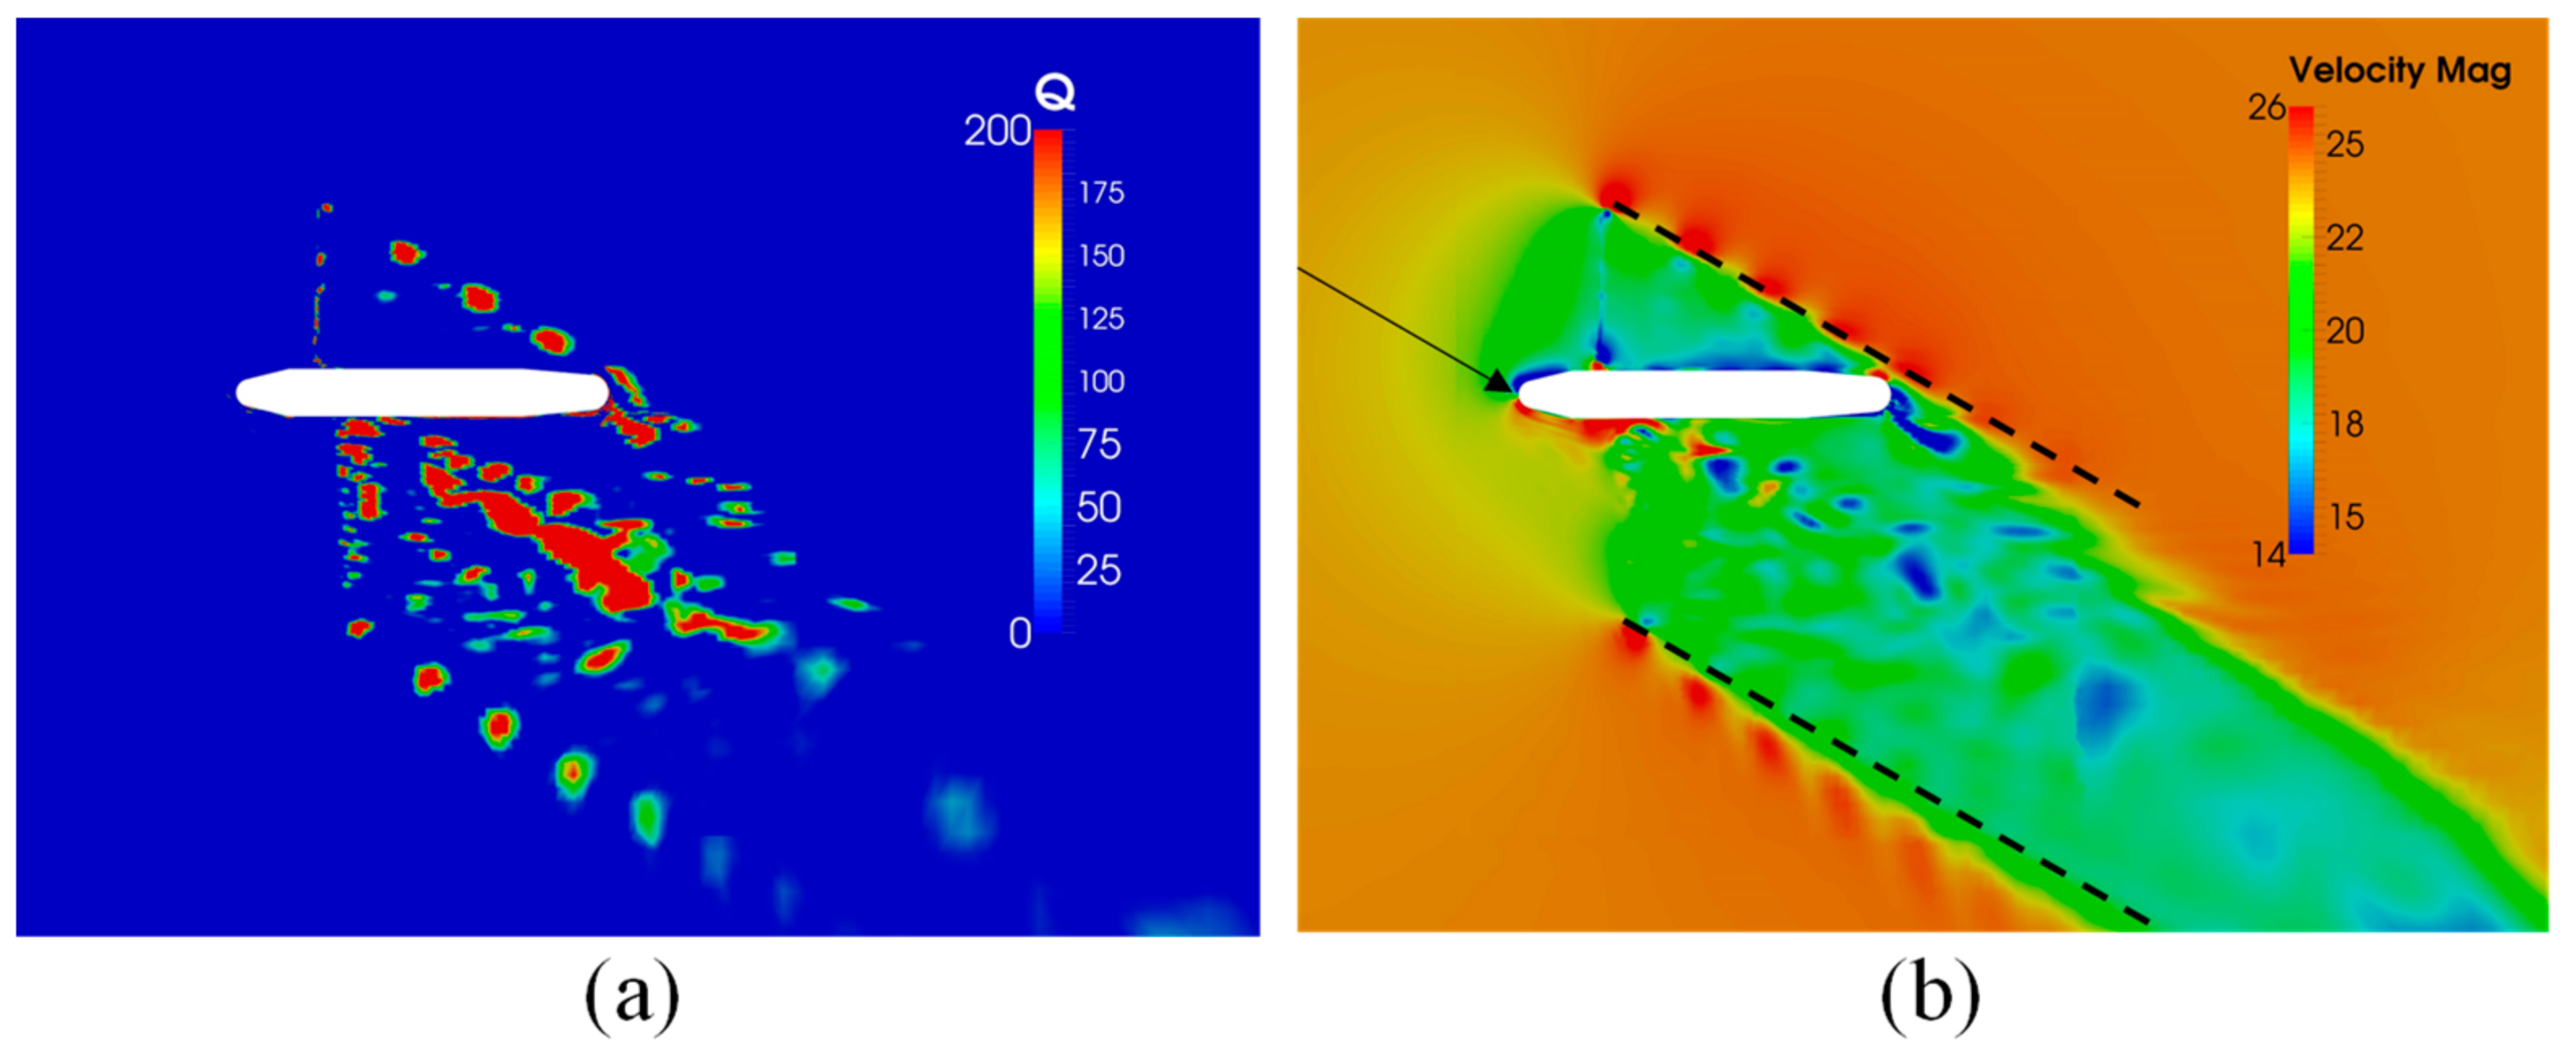
On the other hand, the extra y-contribution also has a periodic impact on the flow in the radial direction. The radial contribution either weakens or enhances the centrifugal pumping caused by rotational augmentation. This effect is important for blade inboard sections, where the inflow speed is relatively large compared to the rotational speed at low TSR. This effect reaches the maximum and minimum at the azimuthal angle of 90° and 270°, respectively. In addition to that, the axial induction on the downwind side becomes larger than the upwind rotor side resulting in an additional deflection beyond the wind direction to the skewed wake (marked by the two dashed lines) due to yawed flow, see Figure 13.
3.5. Dynamic Stall
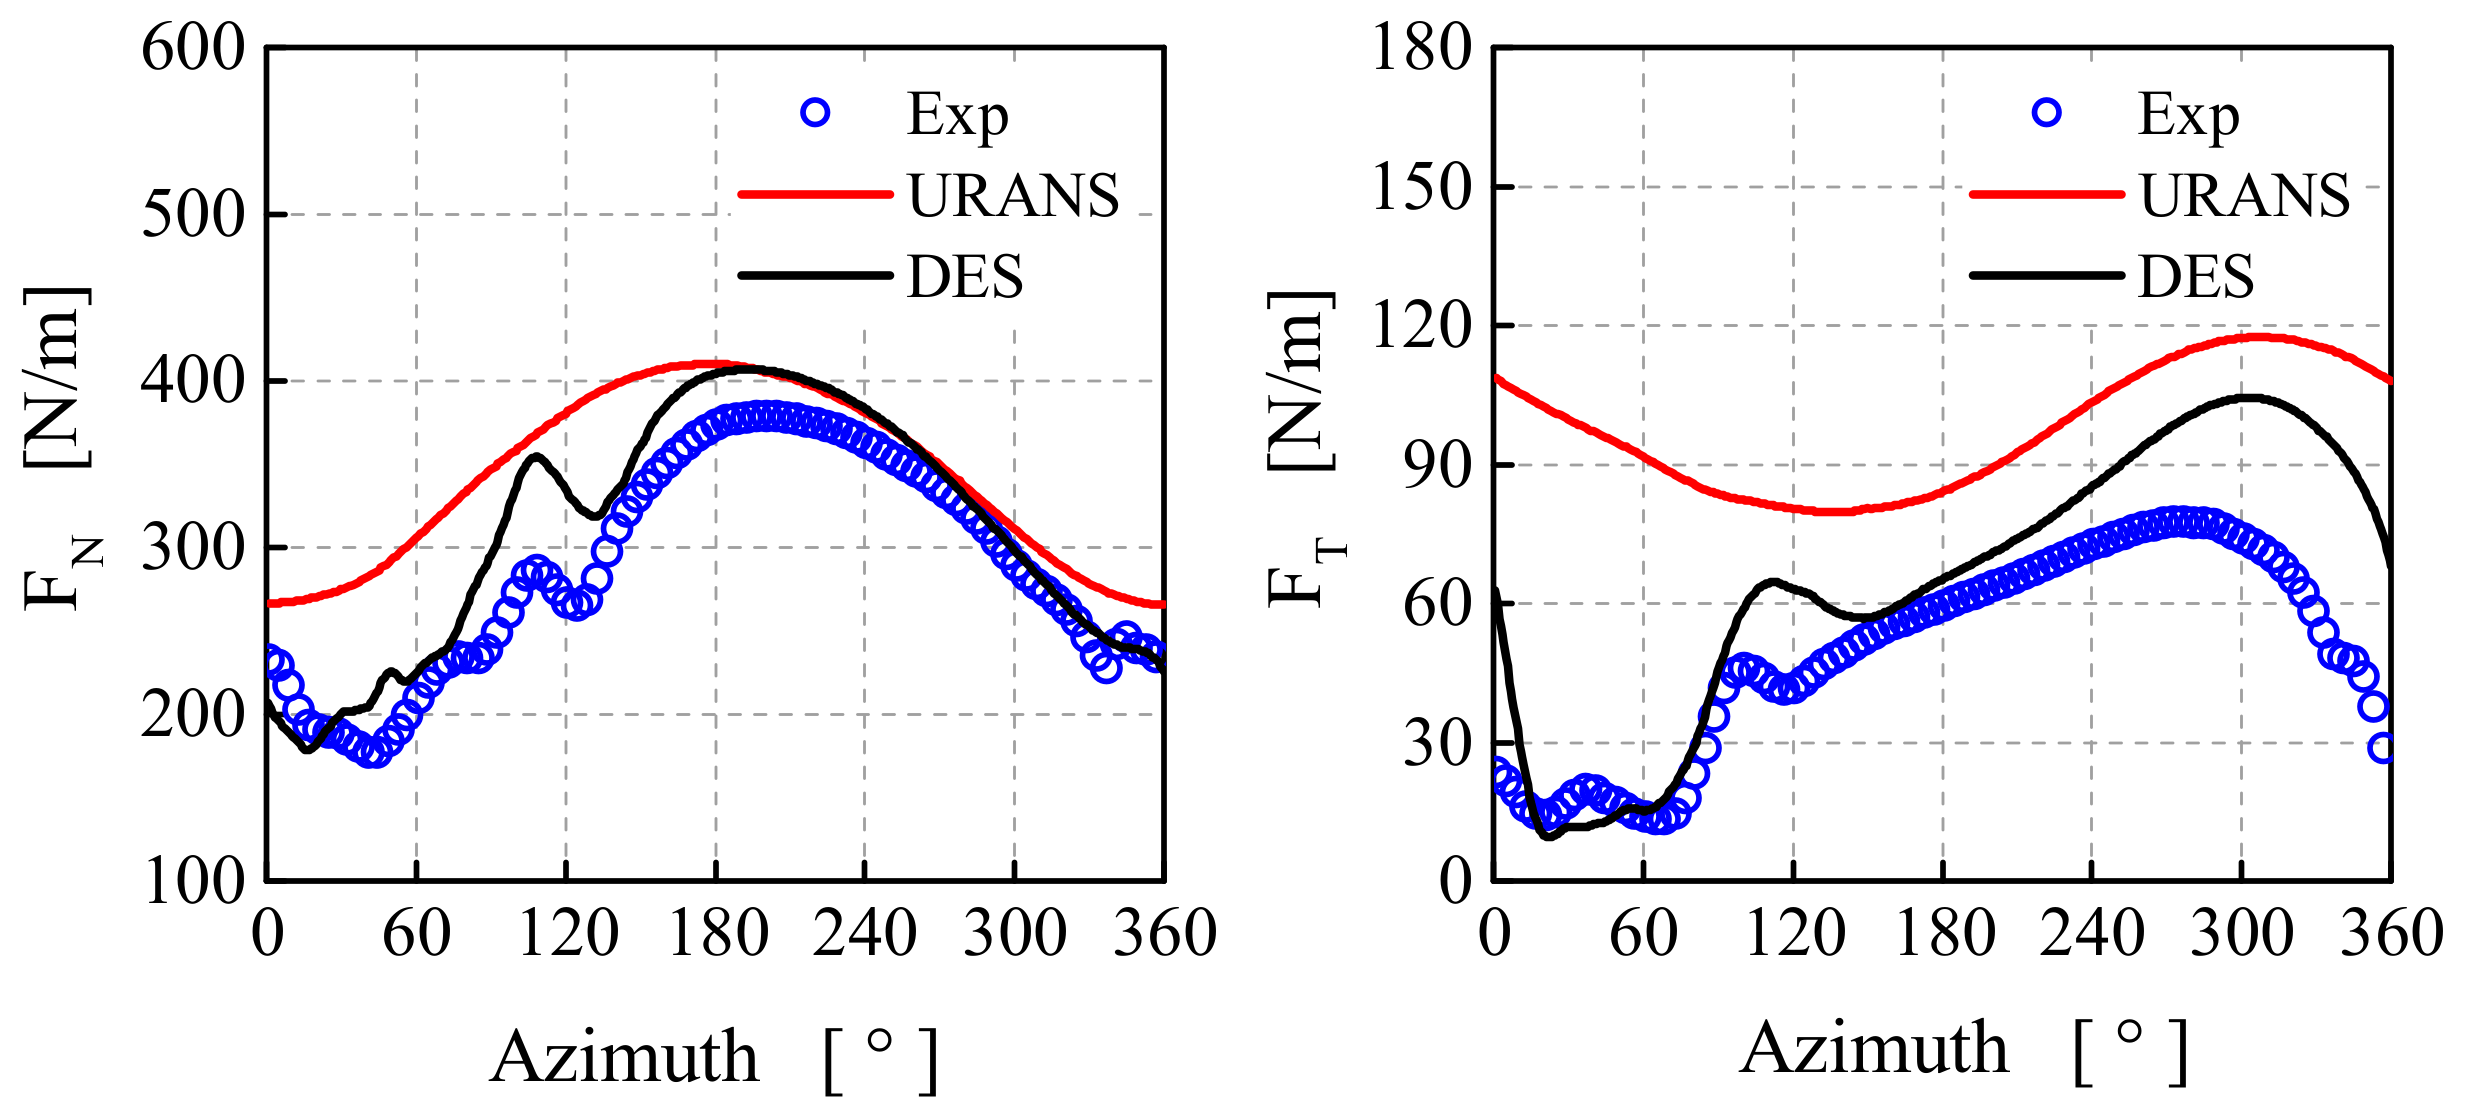
Dynamic stall is expected to occur in the blade inboard section when the turbine is yawed with respect to the wind [8]. Large load fluctuations are known to be imposed on the airfoil section when compared to the static loading characteristics. The wind speed of 24 m/s is chosen for the dynamic stall investigation. Three typical cross sections with two airfoil types are discussed here, namely the DU91-W2-250 airfoil at the 25% and 35% span and the RISØ A1-21 airfoil at the 60% span.
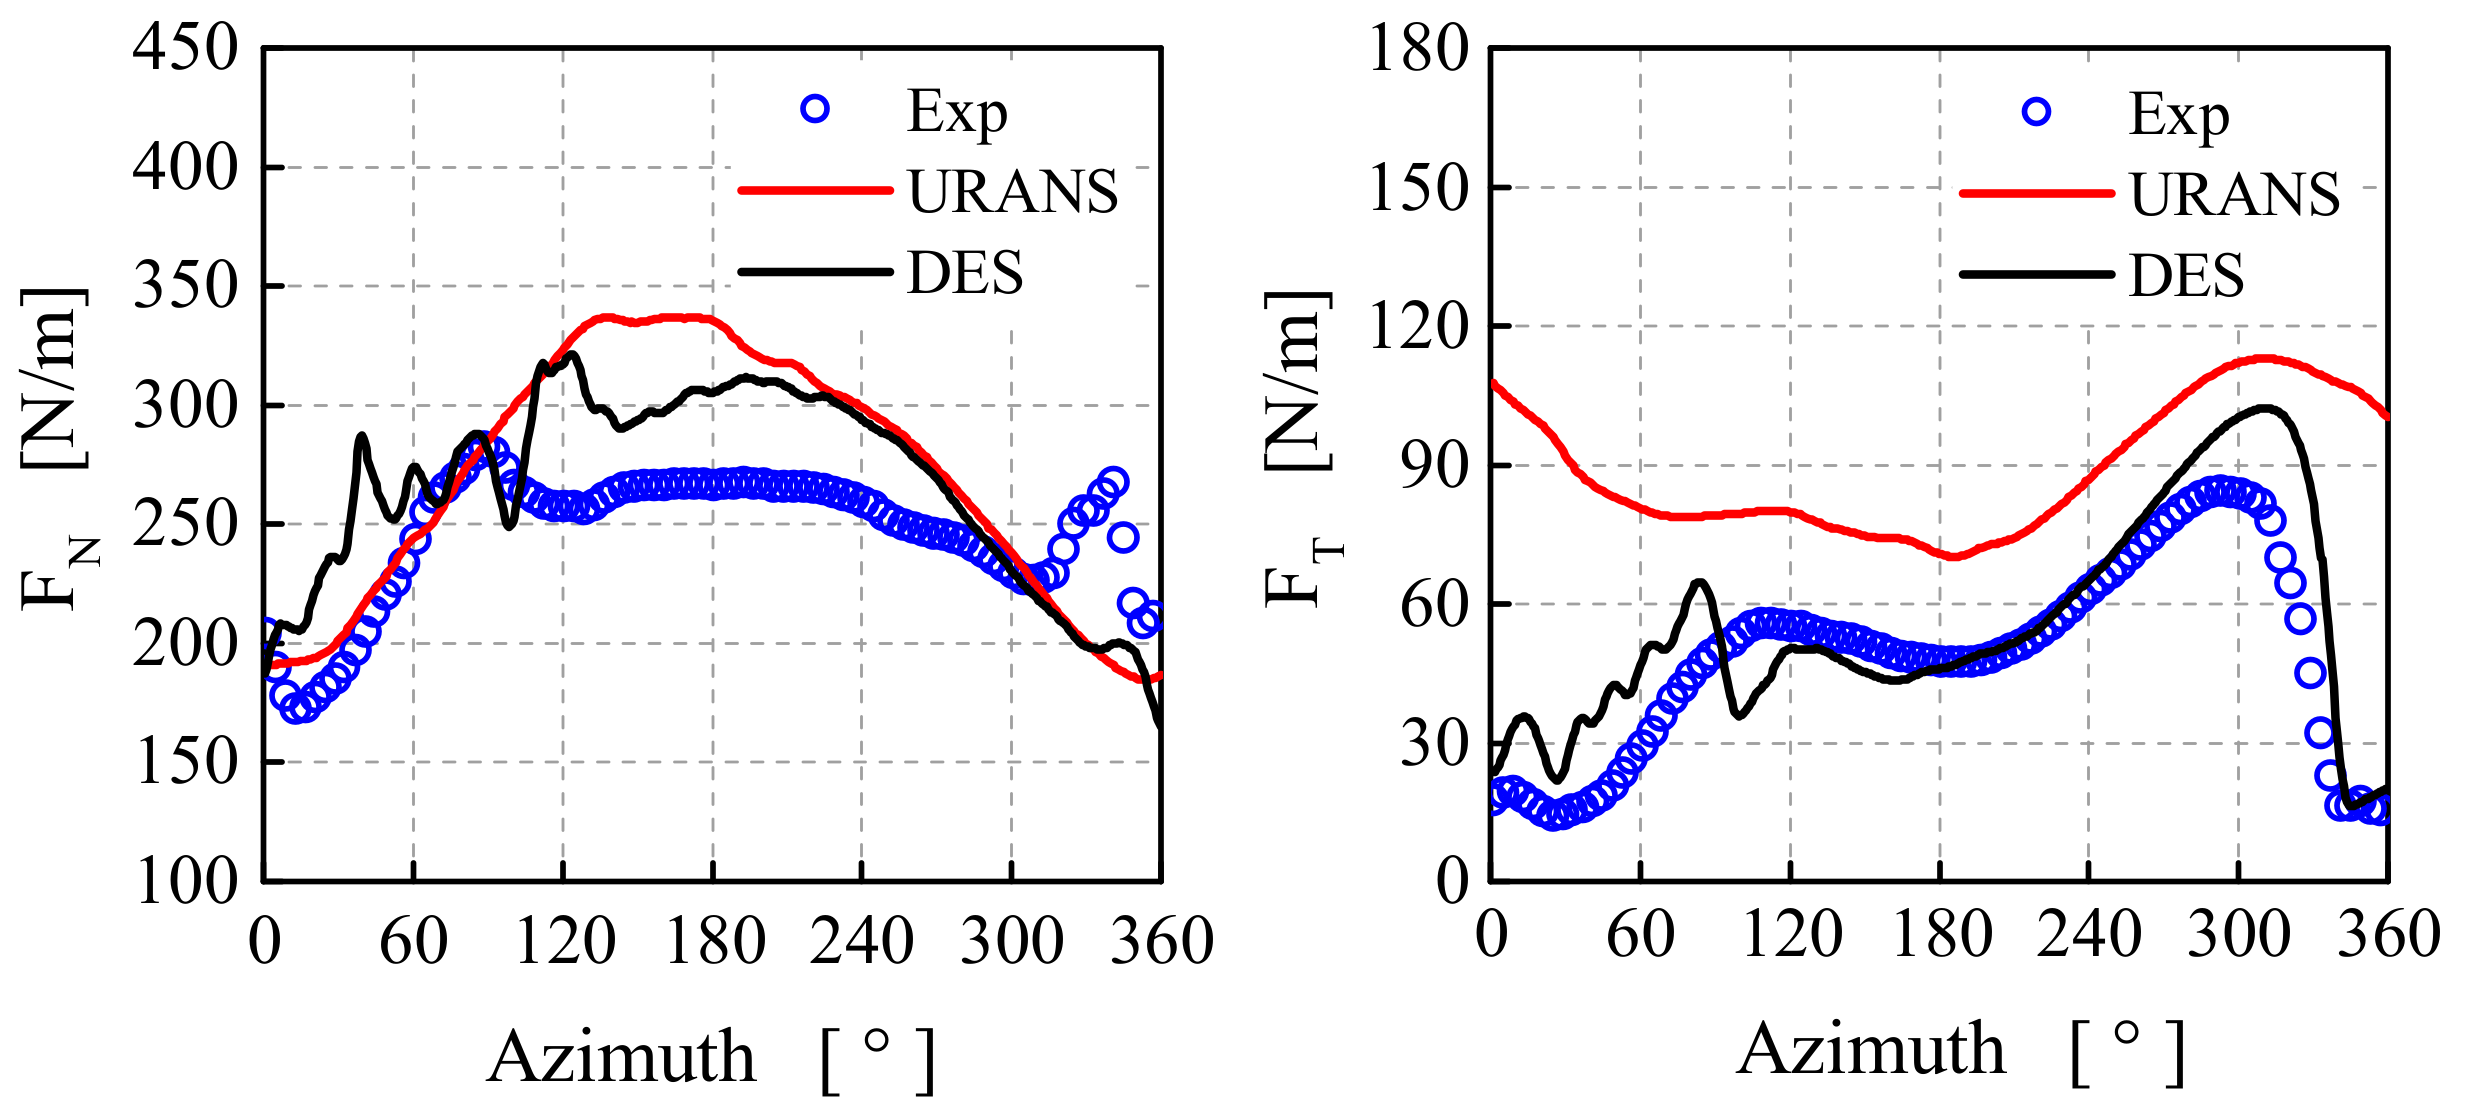
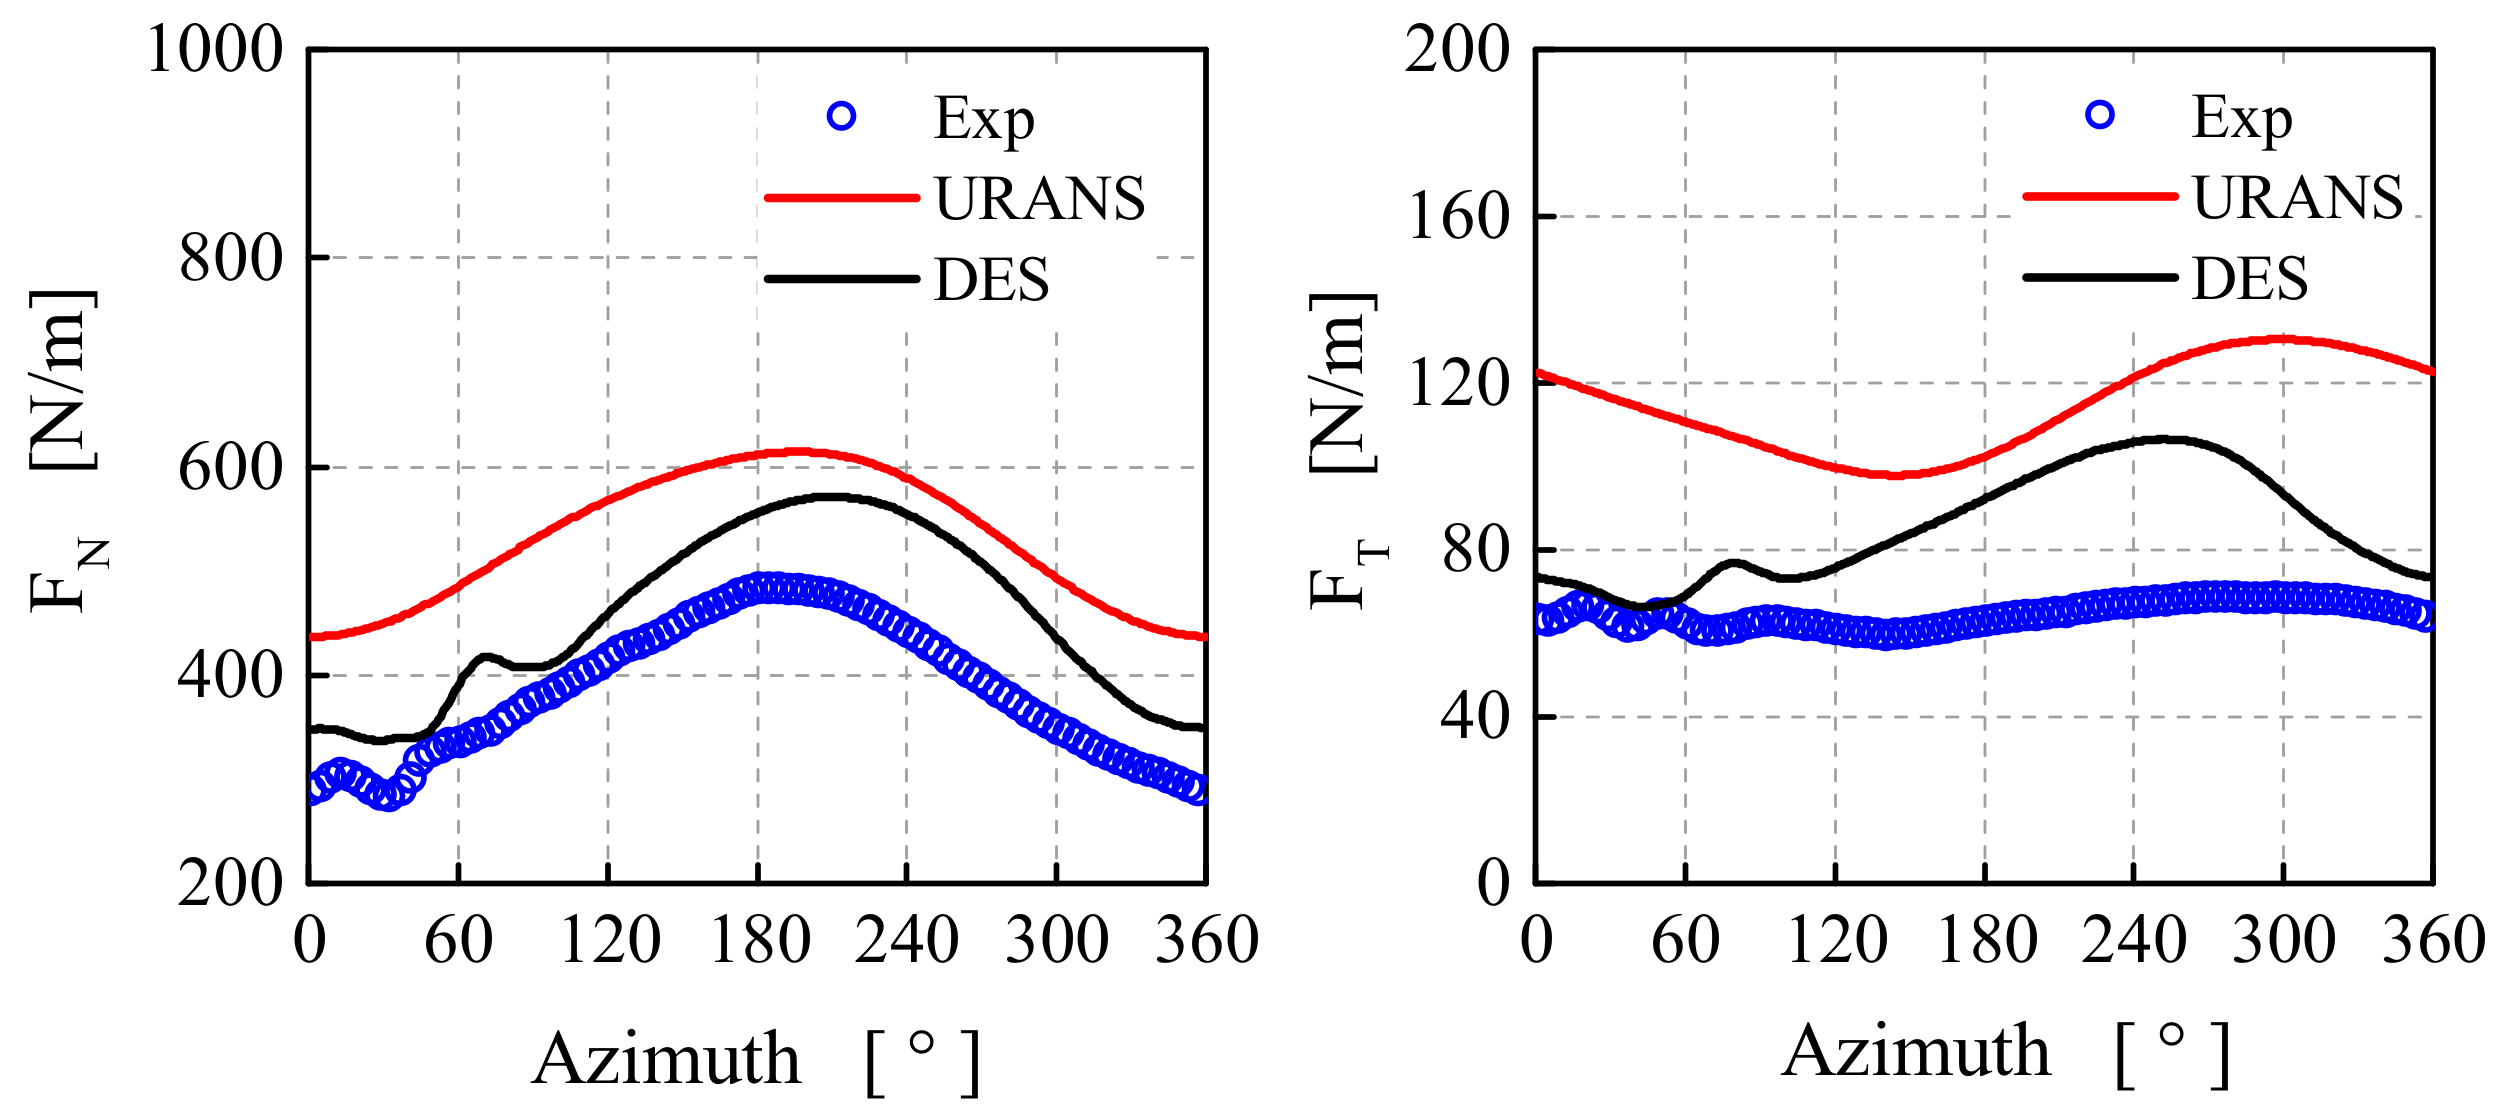
Comparisons of normal and tangential forces at the three spanwise positions are presented in Figure 14, Figure 15 and Figure 16. Strong discrepancies can be easily detected between RANS and DES results especially in the downwind side azimuth range from 0° to 180°. The same pattern can also be found in tangential force predictions between 0° and 180°. At the 25% span, despite the good agreement in the range of 0° to 90°, RANS result fails to reproduce the drop in normal force prediction compared to the measurements, and strong discrepancy can be observed after the drop as the RANS prediction rises to the maximum, which is almost 20% higher than the measured value. On the other hand, the general shape and mean level from the DES prediction are closer to the measured data. The fluctuation-related difference between the measurements and DES results may be related to the data filtering approach, although the reason for this difference still remains open. As for the tangential force comparison of the 25% span, it is obvious that DES results are closer to the measured data than URANS results. RANS results fail to reproduce either the overall shapes or the mean level. At the 35% span positions, the fluctuations of the normal forces when the incidence angle is retreating from the maximum value are not predicted in RANS computations. DES method, by contrast, is able to give a better estimation of both mean value and fluctuations. However, when it comes to the 60% span location, the agreements of both RANS and DES results with the measured data are deteriorated. The reason for this still remains open, but it may relate to the three-dimensional vortex shedding phenomenon at this particular mid-span section due to the blade design [35].
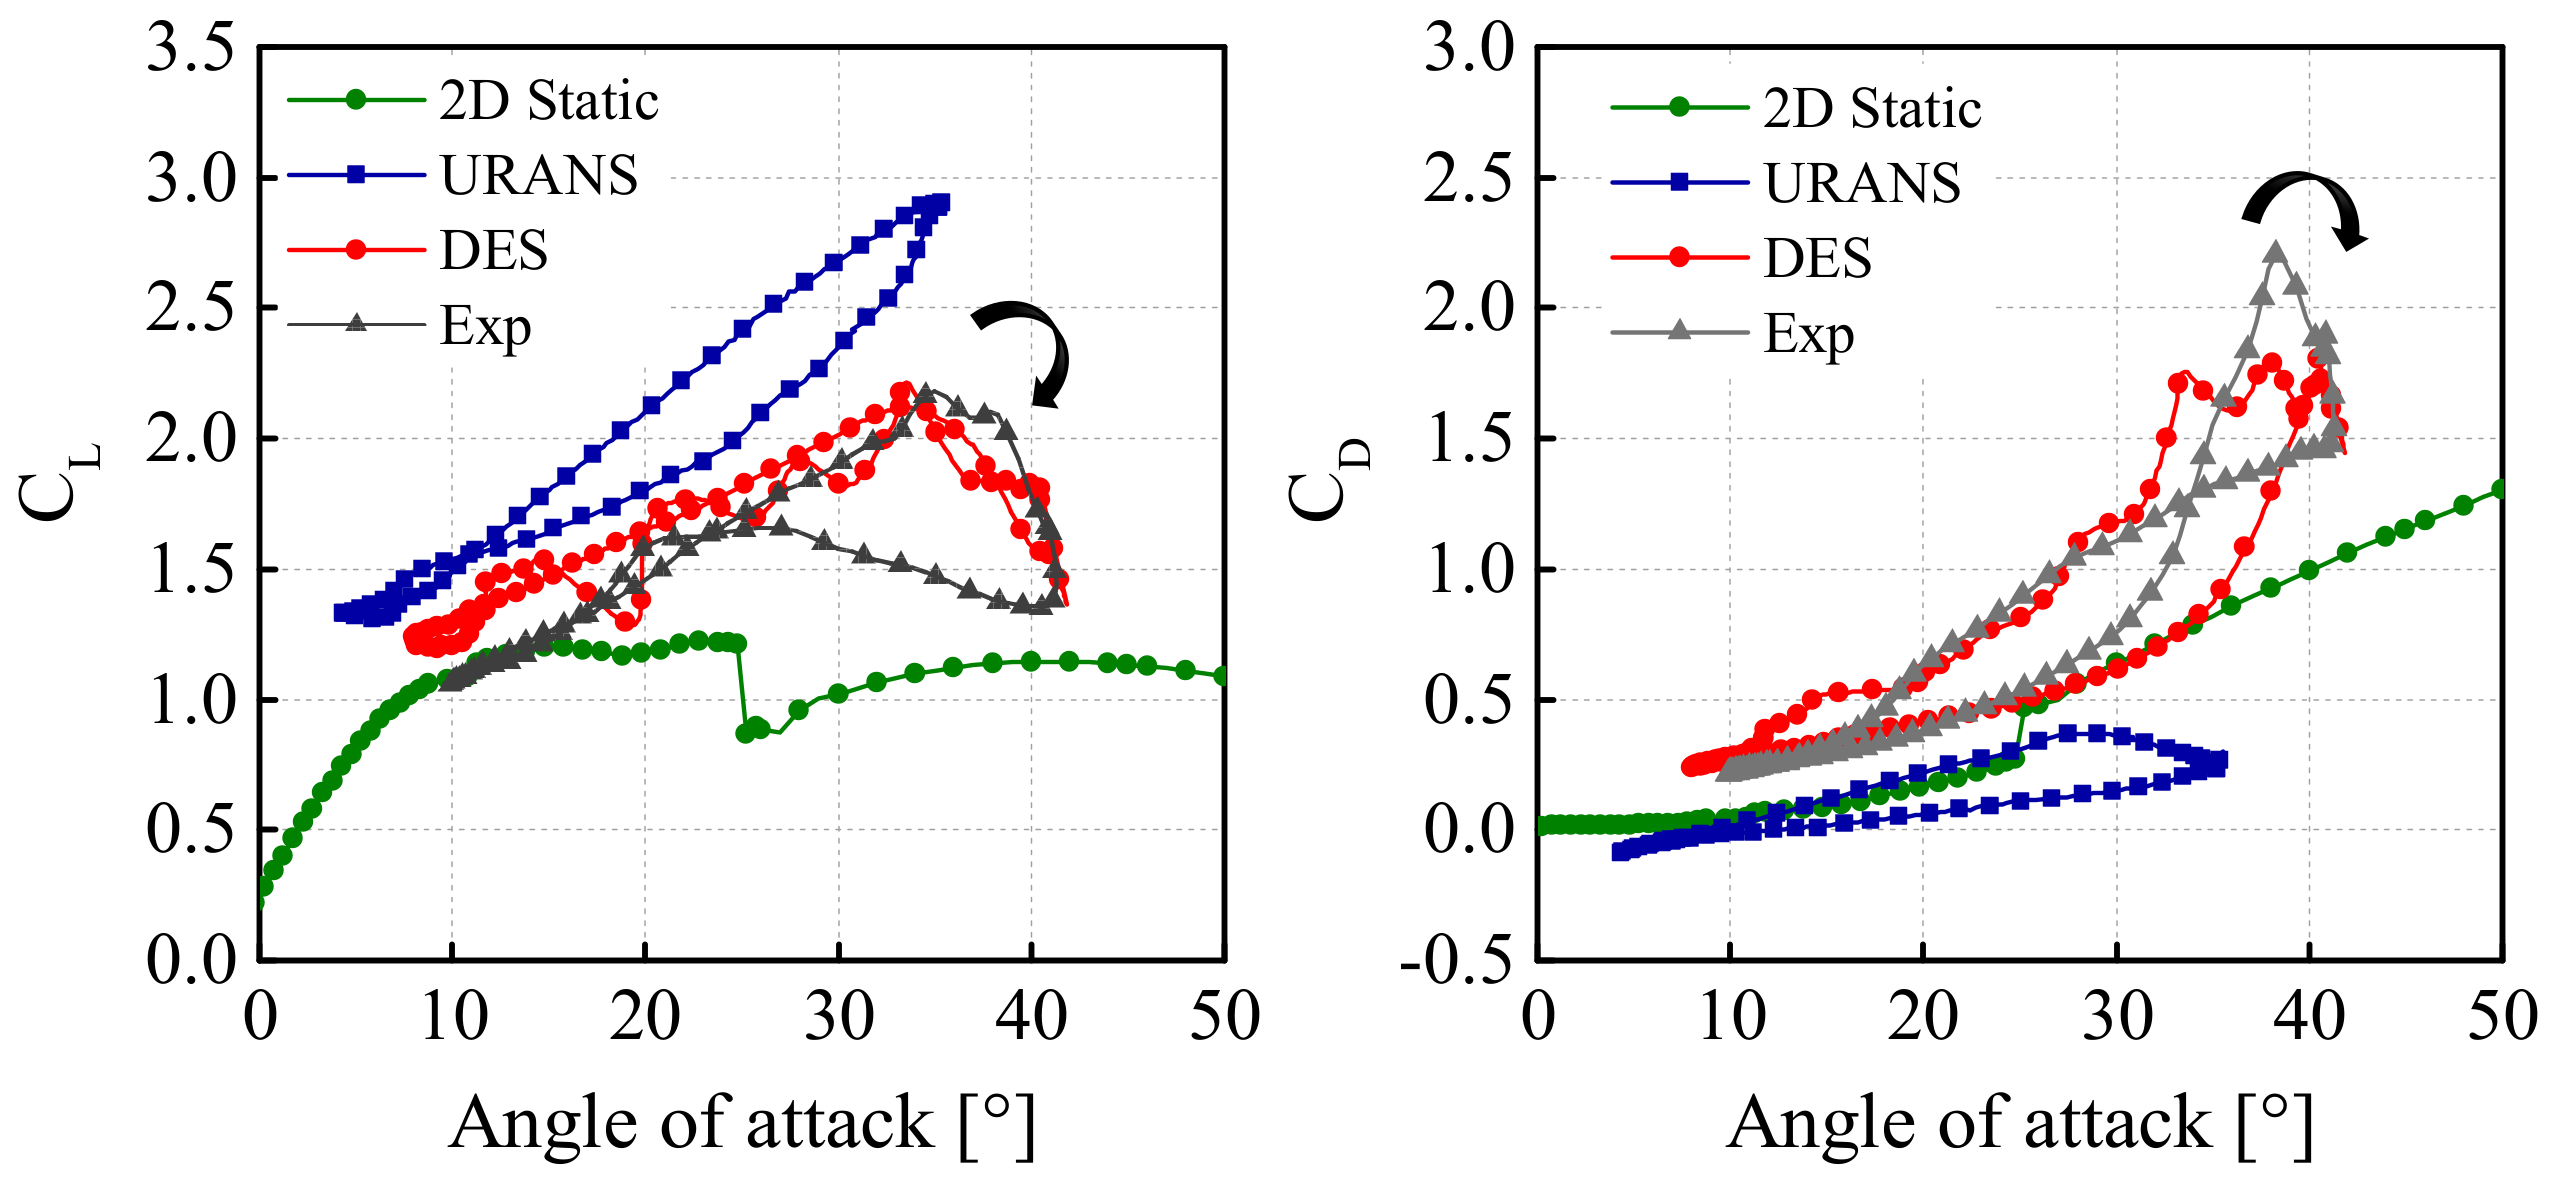
The lift and drag characteristics of the three sections extracted from the simulations have been compared with the 2D case provided by Mexnext MEXICO project [7,8,9,10]. The exact angle of attack (AOA) of the blade cross section is known to be difficult to determine, and various approaches have been proposed, such as free wake vortex [36], inverse BEM [37,38], 3-Point method [39], Shen model [40]. Evaluation of these methods can be found in [41]. The sectional lift and drag coefficients are derived using the inverse BEM theory through the normal and tangential coefficients obtained from CFD simulation. The amplitude of the changes in AOA is high at the inboard sections and gradually decreases toward the outboard region.
The DU91-W2-250 airfoil is used at the 25% and 35% span positions. It can be observed from the 2D CL plots (see Figure 17) that the airfoil stalls at the critical angle of attack of 25°, where the lift has a sudden drop and the drag increases significantly. The changes in angle of attack at the 25% and 35% span positions are very large during one rotational cycle in yawed inflow. At the 25% span, rotational augmentation causes the lift coefficient at 10° to be higher than 2D case. The lift coefficient increases linearly up to the maximum value of 2.2 at a 3D stall angle of attack about 32°, and then it drops with the increase of AOA. The three dimensional drag coefficient is much larger than the 2D result with no sudden increase at the critical angle of attack. Similar patterns can be found in the lift and drag characteristics at the 35% span location in Figure 18. The increase of lift coefficient is also linear and the hysteresis loop at the 35% span is wider than that at the 25% span.
The RISØ A1-21 airfoil is used at the 60% span. The measured 3D lift demonstrates a much different scenario from both the computations and 2D static lift line, see Figure 19. There is no sudden drop in 2D lift when the stall angle is reached. Neither the RANS nor the DES results agree with the measured dynamic data, they both give much larger predictions and wider loops. The reason of these differences is still not well determined, but they may be related to the blade design and a special aerodynamic behaviour at this particular spanwise station, where a mid-span vortex exists [35]. This requires further investigations.
3.6. Near Wake Characteristics Analysis
The predicted flow field velocity profiles in the near wake region are discussed in the following sections. The velocities and coordinates discussed here are given with respect to the wind tunnel coordinate system. Instantaneous velocity components u, v, w in the wind tunnel coordinates at different positions along the wind direction are obtained via wind tunnel PIV data. Axial profiles of velocity components from numerical computations at two positions are compared against the measured data, one is at y = 1.5 m when blade azimuth is 0° and the other one is at y = −1.5 m when blade azimuth is 60° [8,11]. All the velocity components are extracted on the horizontal plane at the height of the rotor center. Unfortunately, this round of wind tunnel measurements did not provide much data for the two off-design state (10 m/s and 24 m/s) and the wake deficit after 1D. Hence, the analyses of the axial velocity distribution are primarily concentrated on the very near wake region.
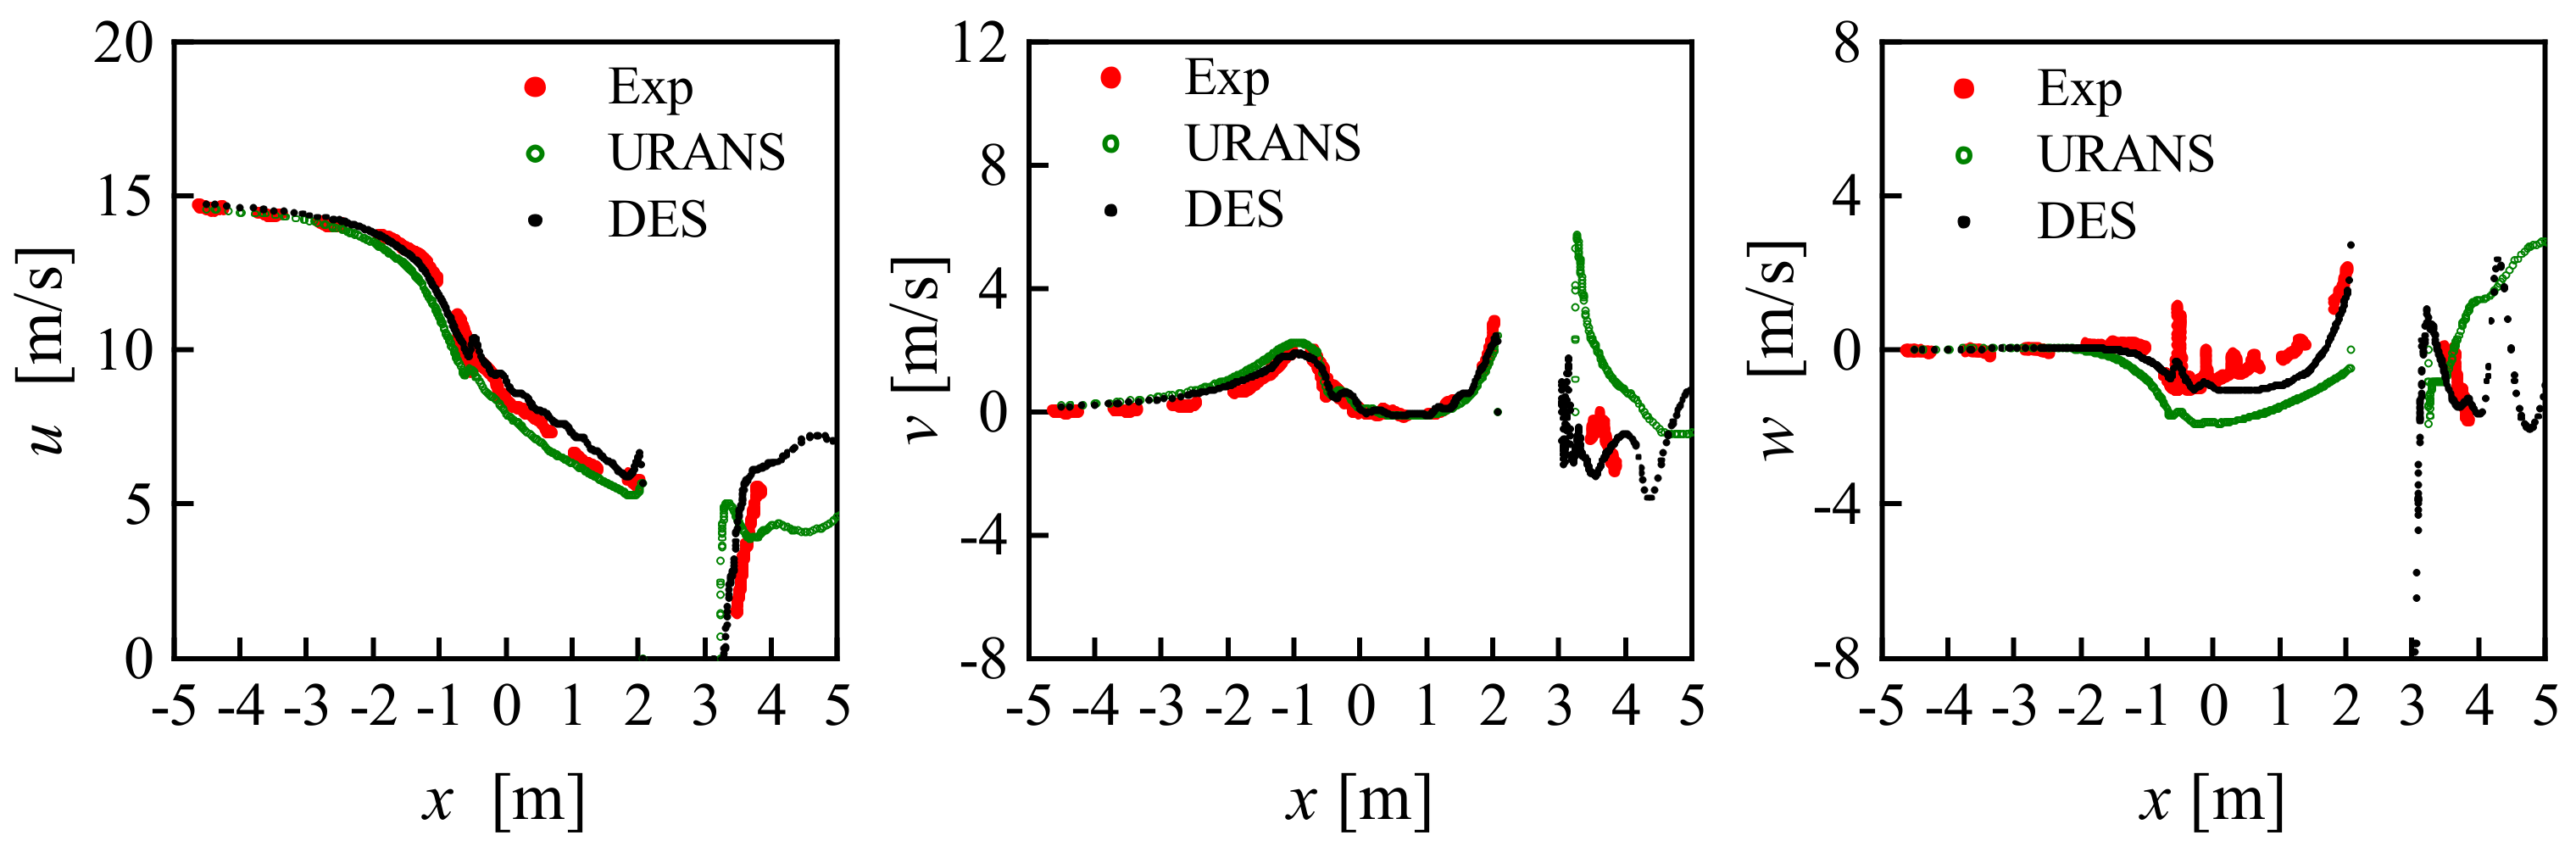
For the axial velocity distributions at the windward side y = 1.5 m in Figure 20, Figure 21 and Figure 22, good agreements can be observed between the computational results and measured data before the wake structure interacts with nacelle geometry. The obstruction of the nacelle between x = 2 m and x = 4 m can be clearly observed in the numerical results. After that, strong discrepancy can be found between RANS and DES results in all the three wind speeds because of the unsteadiness in the interacting wake.
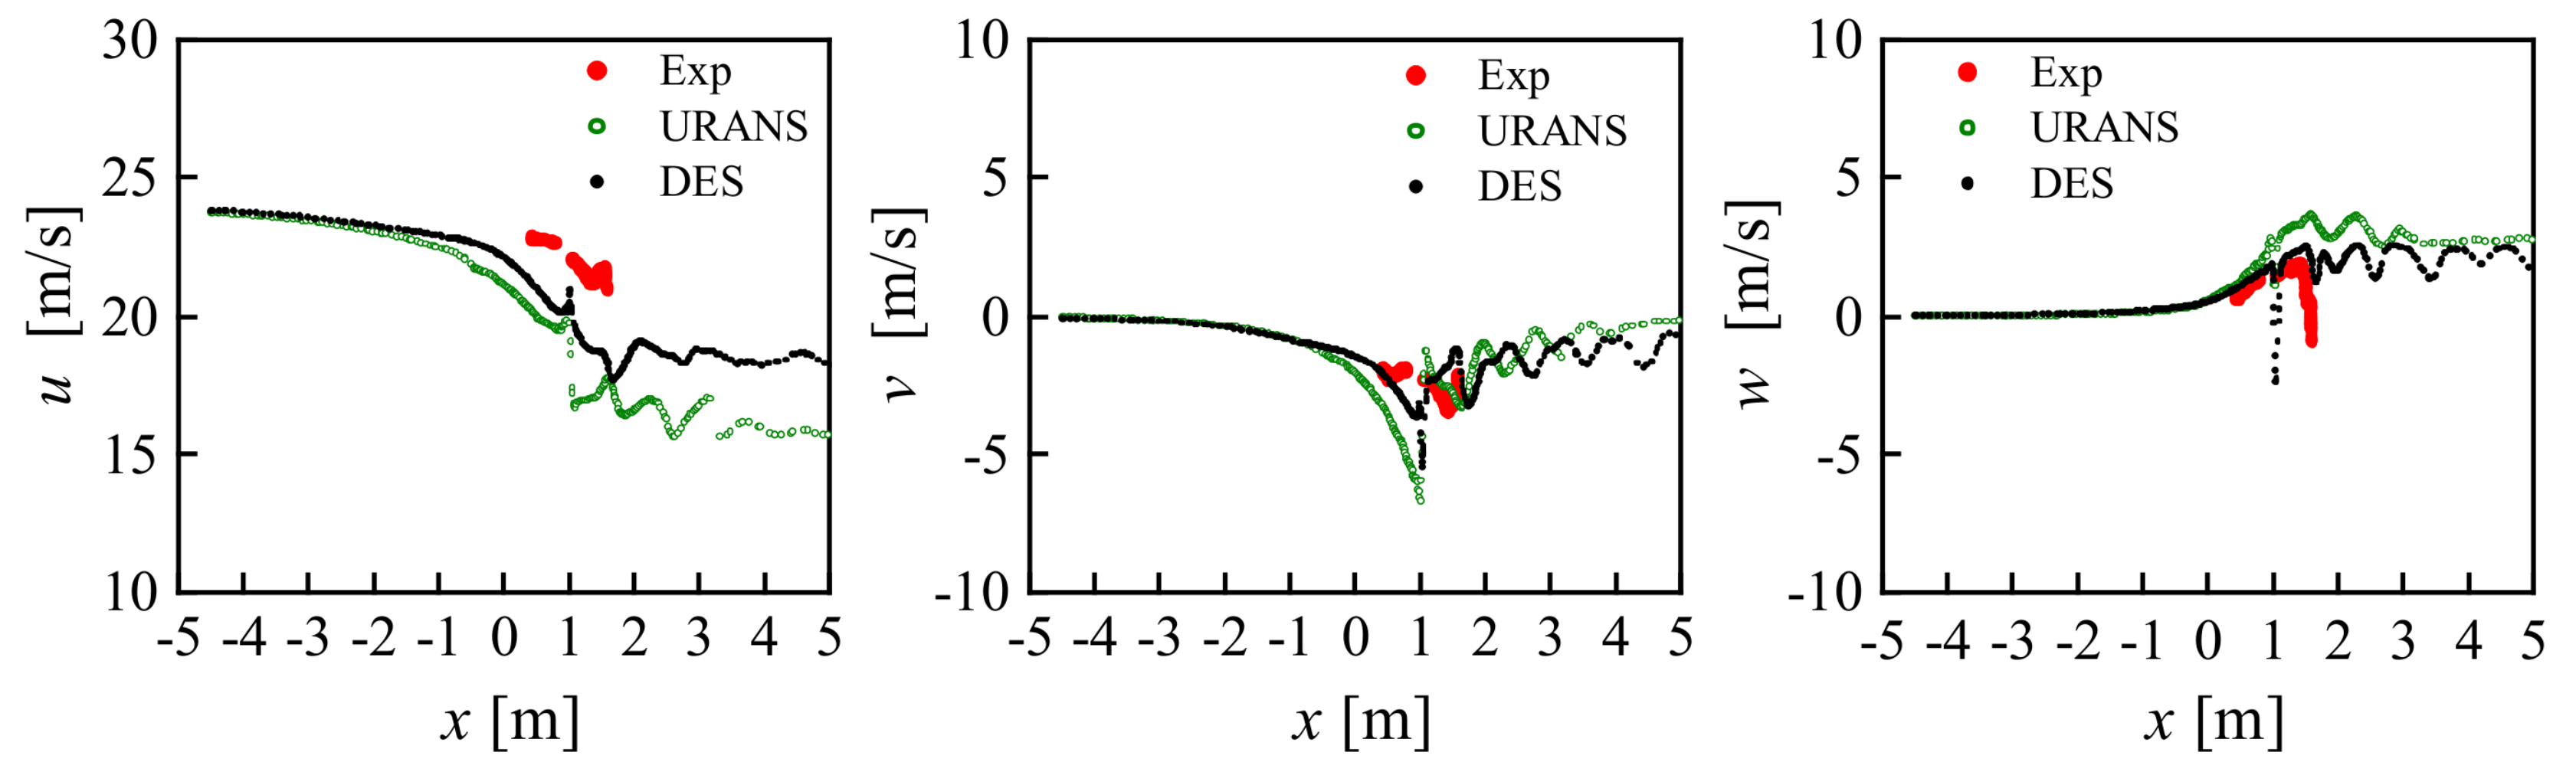
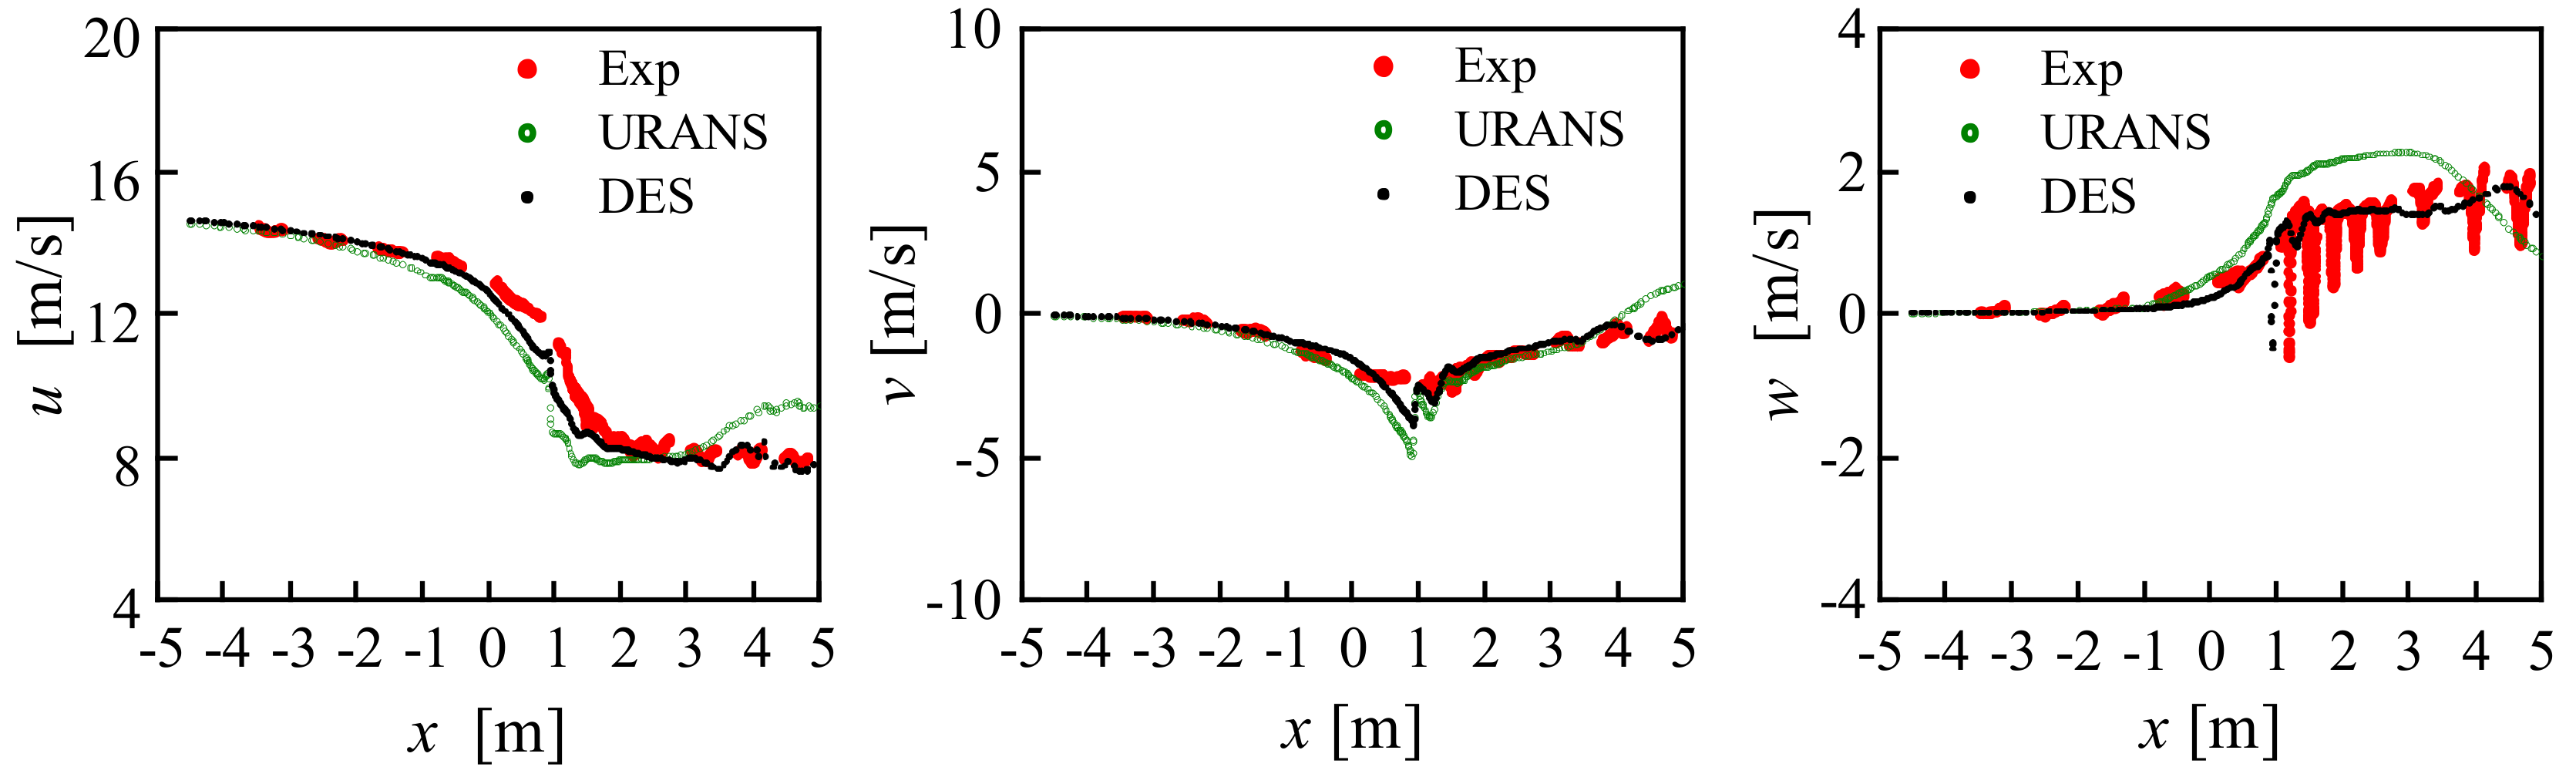
While in the leeward side of y = −1.5 m, the influence of the nacelle obstruction disappears. For optimal wind speed of 15 m/s, other than the overestimation of w-velocity component in RANS computation, the axial profiles of the computational velocity components agree well with the measurements, see Figure 23. At the wind speed of 10 m/s corresponding to the tip speed ratio of 10, a strong discrepancy can be found in Figure 24 between the RANS and DES results, probably due to the quick dissipation of RANS model leading to a quick breakdown of the tip vortices. At higher wind speed of 24 m/s, larger deviations can be found among the experimental results and different numerical results in Figure 25. It seems from the velocity components comparison that DES result fits the experimental data better than the RANS one. For example at x = 1 m, a very near wake position, the error of the u component prediction using DES is reduced almost by a half compared to that using RANS. The similar improvement can be found in the comparison of v and w components. The DES model shows advantage in capturing the evolution of tip vortex structure and the breakdown.
4. Conclusions
A detailed investigation of the effects from the yaw misalignment has been presented based on the New MEXICO rotor using blade-resolved CFD approach. Three inflow wind speeds are considered at a fixed yaw angle of 30°. Two types of numerical computation approaches, i.e., RANS and DES, are used in the study. Sensitivity studies on the grid dependency and nacelle effect have been performed. The simulation results indicate that yaw misalignment has significant influence on aerodynamic torque, thrust behaviour. Complex flow phenomena have been observed in the wind turbine flow field. The following conclusions are obtained:
- Good agreements can be found in the total force and thrust prediction in optimal wind speed of 15 m/s with the maximum error below 6%. Improvements have been made in off-design state of 10 m/s and 24 m/s.
- The presence of nacelle causes a 3% increase in rotor torque and a 2% increase in thrust. Interactions between the blade tip/root vortices and nacelle are demonstrated. The axial profile shows less wake deficit of the mainstream velocity component when the nacelle obstruction is not taken into consideration.
- Results of the normal and tangential forces at the 25%, 35% and 60% spanwise stations have been validated against the experimental data, and the three dimensional lift and drag characteristics have been analyzed to demonstrate the influence of dynamic stall on the rotor load predictions at the wind speed of 24 m/s in yawed flow.
- The near wake velocity components show a good agreement with the measurement. The DES model shows its advantage in both blade load predictions and wake characteristics.
Acknowledgments
This work was funded jointly by the National Basic Research Program of China (973 Program) under Grant No. 2014CB046200, the Jiangsu Provincial Natural Science Foundation under Grant No. BK20140059, the Priority Academic Program Development of Jiangsu Higher Education Institutions, the National Natural Science Foundation of China under Grant No. 11172135. The author would like to thank ECN for providing access to the MEXICO Experiment wind tunnel database.
Author Contributions
Yaoru Qian conducted the data collection and wrote the manuscript; Tongguang Wang revised the manuscript; Zhenyu Zhang contributed technical guidance.
Conflicts of Interest
The authors declare no conflict of interest.
References
- Burton, T.; Sharpe, D.; Jenkins, N.; Bossanyi, E. Wind Energy Handbook; John Wiley & Sons Ltd.: West Sussex, UK, 2011; pp. 96–99. ISBN 978-0-474-48997-9. [Google Scholar]
- Huyer, S.A.; Simms, D.; Robinson, M.C. Unsteady aerodynamics associated with a horizontal axis wind turbine. AIAA J. 1996, 34, 1410–1419. [Google Scholar] [CrossRef]
- Shipley, D.E.; Miller, M.S.; Robinson, M.C. Dynamic stall occurrence on a horizontal axis wind turbine. In Proceedings of the Fourteenth ASME-ETCE Wind Energy Symposium, Houston, TX, USA, 29 January–1 February 1995; Volume 16, pp. 167–173. [Google Scholar]
- Butterfeld, C.P.; Scott, G.; Musial, W. Comparison of wind tunnel airfoil performance data with wind turbine blade data. ASME J. Solar Energy Eng. 1992, 114, 119–124. [Google Scholar] [CrossRef]
- Hand, M.; Simms, D.; Fingersh, L.; Jager, D.; Cotrell, J.; Schreck, S.; Larwood, S. Unsteady Aerodynamics Experiment Phase VI: Wind Tunnel Test Configurations and Available Data Campaigns; Technical Report NREL/TP-500-29955; National Renewable Energy Laboratory: Golden, CO, USA, 2001. [Google Scholar]
- Simms, D.; Schreck, D.; Hand, M.; Fingersh, L.J. NREL Unsteady Aerodynamics Experiment in the NASA-Ames Wind Tunnel: A Comparison of Predictions to Measurements; Technical Report NREL/TP-500-29494; National Renewable Energy Laboratory: Golden, CO, USA, 2001. [Google Scholar]
- Schepers, J.G.; Snel, H. MEXICO, Model Experiments in Controlled Conditions; Technical Report ECN-E-07-042; Energy Research Center of The Netherlands: Petten, The Netherlands, 2007. [Google Scholar]
- Snel, H.; Schepers, J.G.; Montgomerie, B. The MEXICO project (Model Experiment in Controlled Conditions): The database and first results of data processing and interpretation. J. Phys. Conf. Ser. 2007, 75, 012014. [Google Scholar] [CrossRef]
- Schepers, J.G.; Boorsma, K.; Cho, T.; Sørensen, N.N. Final Report of IEA Task 29, Mexnext (Phase 1): Analysis of MEXICO Wind Tunnel Measurements; Technical Report ECN-E-12-004; Energy Research Center of The Netherlands: Petten, The Netherlands, 2012. [Google Scholar]
- Schepers, J.G.; Boorsma, K.; Cho, T.; Sørensen, N.N. Final Report of IEA Wind Task 29: Mexnext (Phase 2); Technical Report ECN-E14-060; Energy Research Center of The Netherlands: Petten, The Netherlands, 2014. [Google Scholar]
- Boorsma, K.; Schepers, J.G. Rotor experiments in controlled conditions continued: New MEXICO. The Science of Making Torque from Wind (TORQUE 2016). J. Phys. Conf. Ser. 2016, 753, 022004. [Google Scholar] [CrossRef]
- Schreck, S.; Robinson, M.; Hand, M.; Simms, D. HAWT dynamic stall response asymmetries under yawed flow conditions. Wind Energy 2000, 3, 215–232. [Google Scholar] [CrossRef]
- Schreck, S.; Robinson, M.; Hand, M.; Simms, D. Blade dynamic stall vortex kinematics for a horizontal axis wind turbine in yawed conditions. J. Sol. Energy Eng. 2001, 123, 272–281. [Google Scholar] [CrossRef]
- Leishman, J.G. Challenges in modeling the unsteady aerodynamics of wind turbines. Wind Energy 2002, 5, 85–132. [Google Scholar] [CrossRef]
- Xu, G.; Sankar, L.N. Effects of transition, turbulence and yaw on the performance of horizontal axis wind turbines. AIAA Pap. 2000. [Google Scholar] [CrossRef]
- Sorensen, N.N.; Michelsen, J.A.; Schreck, S. Application of CFD to wind turbine aerodynamics. In Proceedings of the 4th GRACM Congress on Computational Mechanics, Patras, Greece, 27–29 June 2002. [Google Scholar]
- Madsen, H.A.; Sørensen, N.; Schreck, S. Yaw aerodynamics analyzed with three codes in comparison with experiment. In Proceedings of the ASME 2003 Wind Energy Symposium, Reno, NV, USA, 6–9 January 2003; pp. 94–103. [Google Scholar]
- Tongchitpakdee, C.; Benjanirat, S.; Sankar, L.N. Numerical simulation of the aerodynamics of horizontal axis wind turbines under yawed flow conditions. J. Sol. Energy Eng. 2005, 127, 464–474. [Google Scholar] [CrossRef]
- Bazilevs, Y.; Hsu, M.C.; Takizawa, K.; Tezduyar, T.E. ALE-VMS and ST-VMS methods for computer modeling of wind turbine rotor aerodynamics and fluid–structure interaction. Math. Models Methods Appl. Sci. 2012, 22, 1230002. [Google Scholar] [CrossRef]
- Hsu, M.C.; Akkerman, I.; Bazilevs, Y. Finite element simulation of wind turbine aerodynamics: Validation study using NREL Phase VI experiment. Wind Energy 2014, 17, 461–481. [Google Scholar] [CrossRef]
- Micallef, D.; Kloosterman, M.; Ferreira, C.S.; Van Bussel, G.J.W.; Sant, T. Validating BEM, direct and inverse free wake models with the MEXICO experiment. In Proceedings of the 48th AIAA Aerospace Sciences Meeting Including the New Horizons Forum and Aerospace Exposition, Orlando, FL, USA, 4–7 January 2010. [Google Scholar]
- Abedi, H.; Davidson, L.; Voutsinas, S. Development of Free Vortex Wake Model for Wind Turbine Aerodynamics under Yaw Condition. In Proceedings of the 34th Wind Energy Symposium, San Diego, CA, USA, 4–8 January 2016. [Google Scholar]
- Blondel, F.; Boisard, R.; Milekovic, M.; Ferrer, G.; Lienard, C.; Teixeira, D. Validation and comparison of aerodynamic modelling approaches for wind turbines. The Science of Making Torque from Wind (TORQUE 2016). J. Phys. Conf. Ser. 2016, 753, 022029. [Google Scholar] [CrossRef]
- Réthoré, M.; Zahle, F.; Sørensen, N.; Bechmann, A. CFD Simulations of the MEXICO Wind Tunnel and Wind Turbine. In Proceedings of the European Wind Energy Association (EWEA), Brussels, Belgium, 14–17 March 2011. [Google Scholar]
- Bechmann, A.; Sørensen, N.N.; Zahle, F. CFD simulations of the MEXICO rotor. Wind Energy 2011, 14, 677–689. [Google Scholar] [CrossRef]
- Shen, W.Z.; Zhu, W.J.; Sørensen, J.N. Actuator line/Navier-Stokes computations for the MEXICO rotor: Comparison with detailed measurements. Wind Energy 2012, 15, 811–825. [Google Scholar] [CrossRef]
- Pereira, R.; Schepers, G.; Pavel, M.D. Validation of the Beddoes–Leishman dynamic stall model for horizontal axis wind turbines using MEXICO data. Wind Energy 2013, 16, 207–219. [Google Scholar] [CrossRef]
- Sørensen, N.N.; Bechmann, A.; Réthoré, P.-E.; Zahle, F. Near wake Reynolds-averaged Navier–Stokes predictions of the wake behind the MEXICO rotor in axial and yawed flow conditions. Wind Energy 2014, 17, 75–86. [Google Scholar] [CrossRef] [Green Version]
- Tsalicoglou, C.; Jafari, S.; Chokani, N.; Abhari, R.S. RANS computations of MEXICO rotor in uniform and yawed inflow. J. Eng. Gas Turbines Power 2014, 136, 011202. [Google Scholar] [CrossRef]
- Schulz, C.; Meister, K.; Lutz, T.; Krämer, E. Investigations on the wake development of the MEXICO rotor considering different inflow conditions. In New Results in Numerical and Experimental Fluid Mechanics X; Springer International Publishing: Cham, Switzerland, 2016; pp. 871–882. [Google Scholar]
- Menter, F.R.; Kuntz, M.; Langtry, R. Ten years of industrial experience with the SST turbulence model. Turbulence Heat Mass Transf. 2003, 4, 625–632. [Google Scholar]
- Farrell, P.E.; Maddison, J.R. Conservative interpolation between volume meshes by local Galerkin projection. Comput. Methods Appl. Mech. Eng. 2011, 200, 89. [Google Scholar] [CrossRef]
- Zhang, Y.; Zuijlen, A.; Bussel, G. The MEXICO rotor aerodynamic loads prediction: ZigZag tape effects and laminar-turbulent transition modeling in CFD. J. Wind Eng. Ind. Aerodyn. 2017, 168, 152–163. [Google Scholar] [CrossRef]
- Sørensen, N.N.; Zahle, F.; Boorsma, K.; Schepers, G. CFD computations of the second round of MEXICO rotor measurements. J. Phys. Conf. Ser. 2016, 753, 022054. [Google Scholar] [CrossRef]
- Plaza, B.; Bardera, R.; Visiedo, S. Comparison of BEM and CFD results for MEXICO rotor aerodynamics. J. Wind Eng. Ind. Aerodyn. 2015, 145, 115–122. [Google Scholar] [CrossRef]
- Sant, T.; Kuik, G.; Bussel, G.J.W. Estimating the angle of attack from blade pressure measurements on the NREL Phase VI rotor using a free wake vortex model: Axial conditions. Wind Energy 2006, 9, 549–577. [Google Scholar] [CrossRef]
- Lindenburg, C. Investigation into Rotor Blade Aerodynamics; Technical Report ECN-C-03-025; Energy Research Center of The Netherlands: Petten, The Netherlands, 2003. [Google Scholar]
- Johansen, J.; Sørensen, N.N. Airfoil characteristics from 3D CFD rotor computations. Wind Energy 2004, 7, 283–294. [Google Scholar] [CrossRef]
- Rahimi, H.; Hartvelt, M.; Peinke, J.; Schepers, J.G. Investigation of the current yaw engineering models for simulation of wind turbines in BEM and comparison with CFD and experiment. J. Phys. 2016, 753, 022016. [Google Scholar] [CrossRef]
- Shen, W.Z.; Hansen, M.O.L.; Sørensen, J.N. Determination of the angle of attack on rotor blades. Wind Energy 2009, 12, 91–98. [Google Scholar] [CrossRef]
- Guntur, S.; Sørensen, N.N. An evaluation of several methods of determining the local angle of attack on wind turbine blades. J. Phys. Conf. Ser. 2014, 555, 012045. [Google Scholar] [CrossRef]
Figure 1.
Schematic of the computational mesh: (a) outline of the computational domain; (b) blade root and nacelle surface mesh; (c) blade tip surface mesh.
Figure 1.
Schematic of the computational mesh: (a) outline of the computational domain; (b) blade root and nacelle surface mesh; (c) blade tip surface mesh.
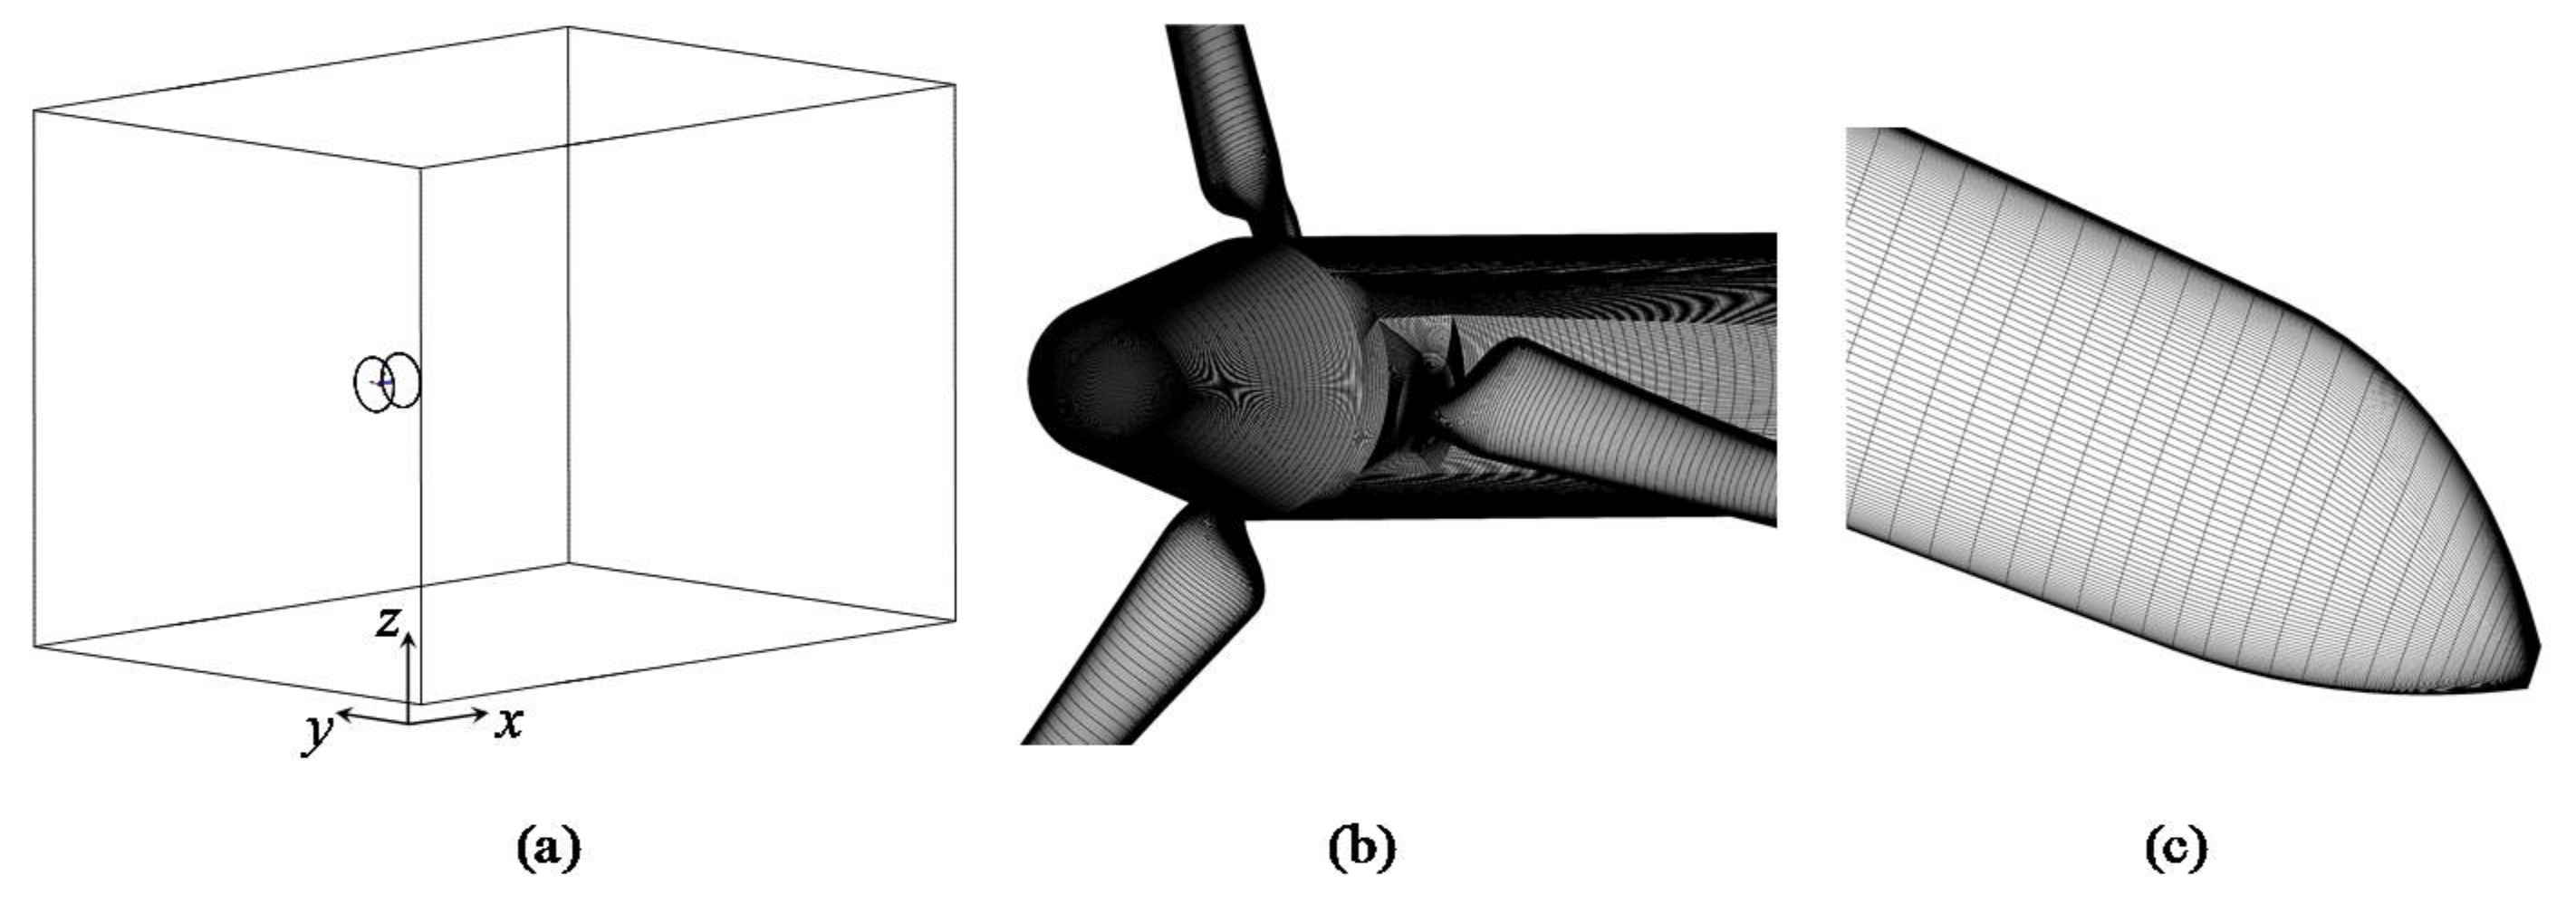
Figure 2.
(a,b) Descriptions of the wind tunnel and rotor coordinate systems for yaw computations and (c) forces on a blade cross-sectional element.
Figure 2.
(a,b) Descriptions of the wind tunnel and rotor coordinate systems for yaw computations and (c) forces on a blade cross-sectional element.
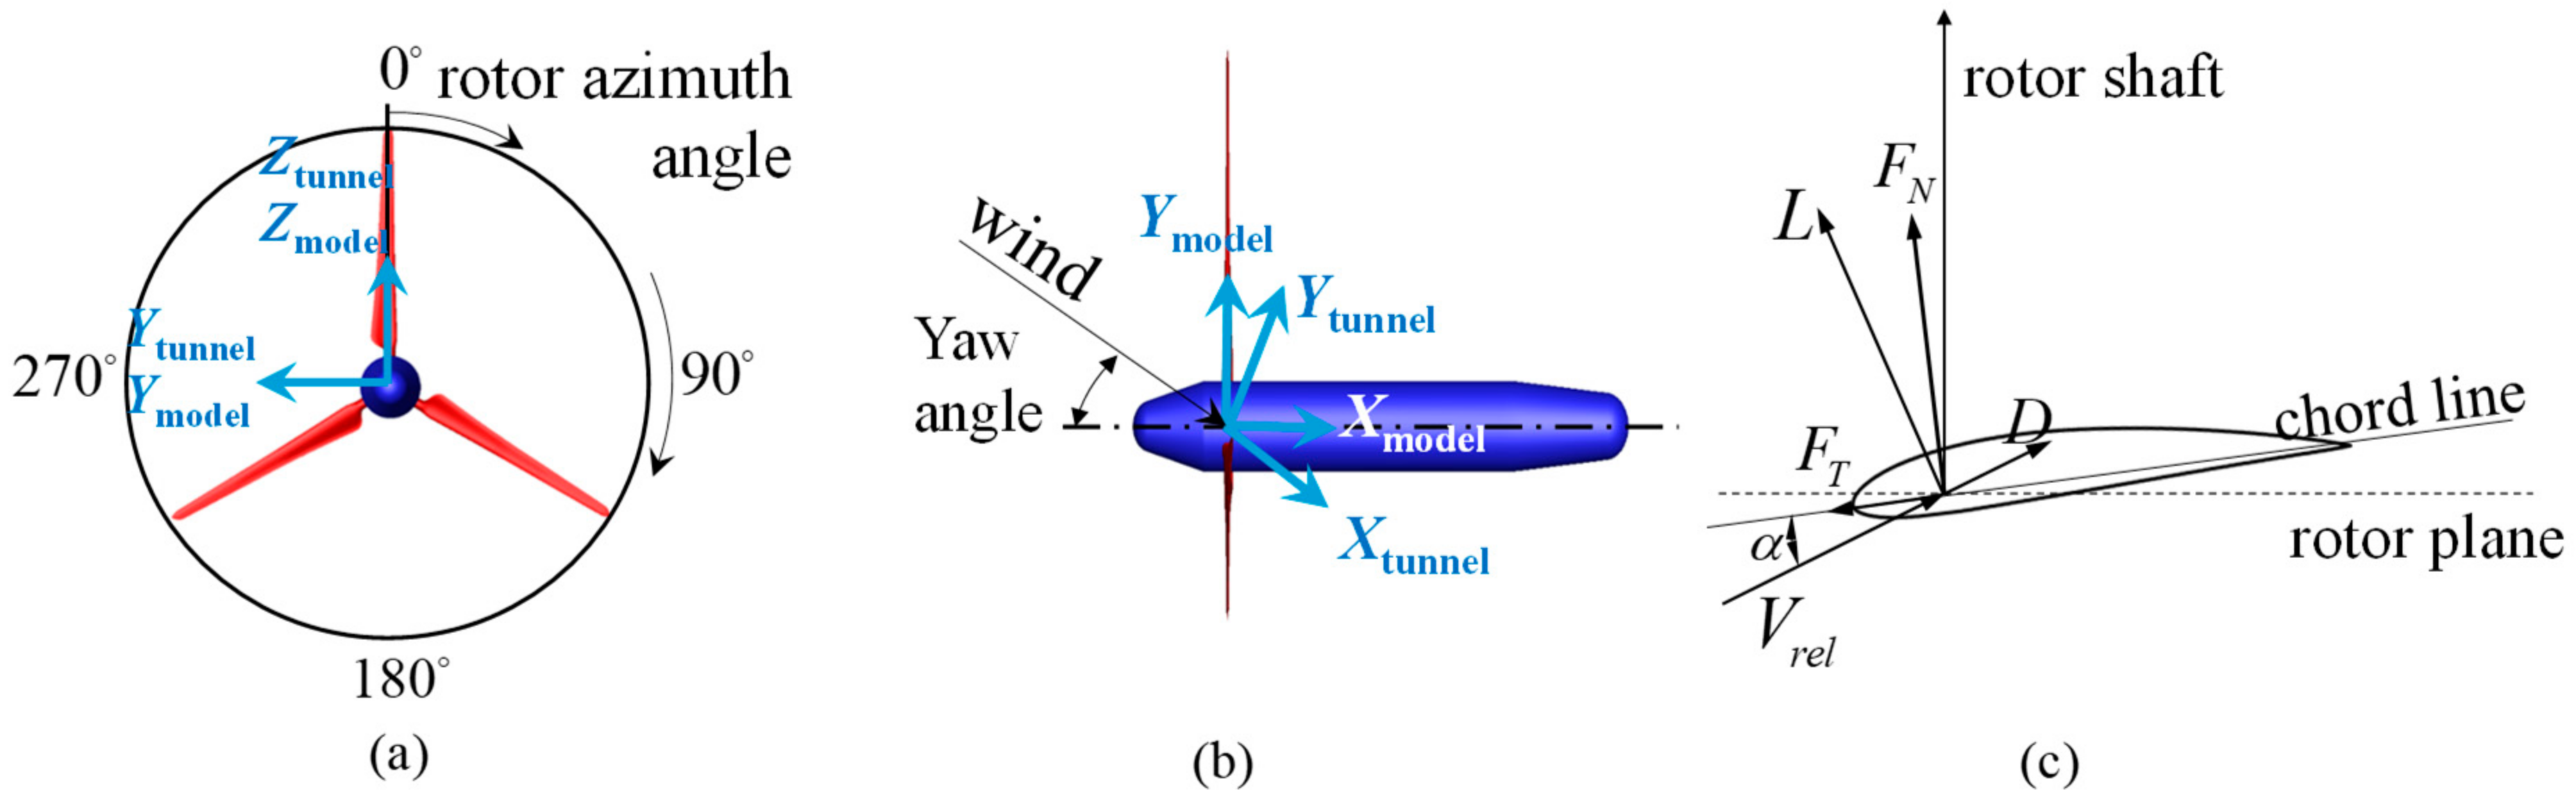
Figure 3.
Grid dependency study at the inflow velocity of 15 m/s, TSR = 6.7.

Figure 4.
Comparison of the rotor axial force and torque at the wind speed of 15 m/s, TSR = 6.7.
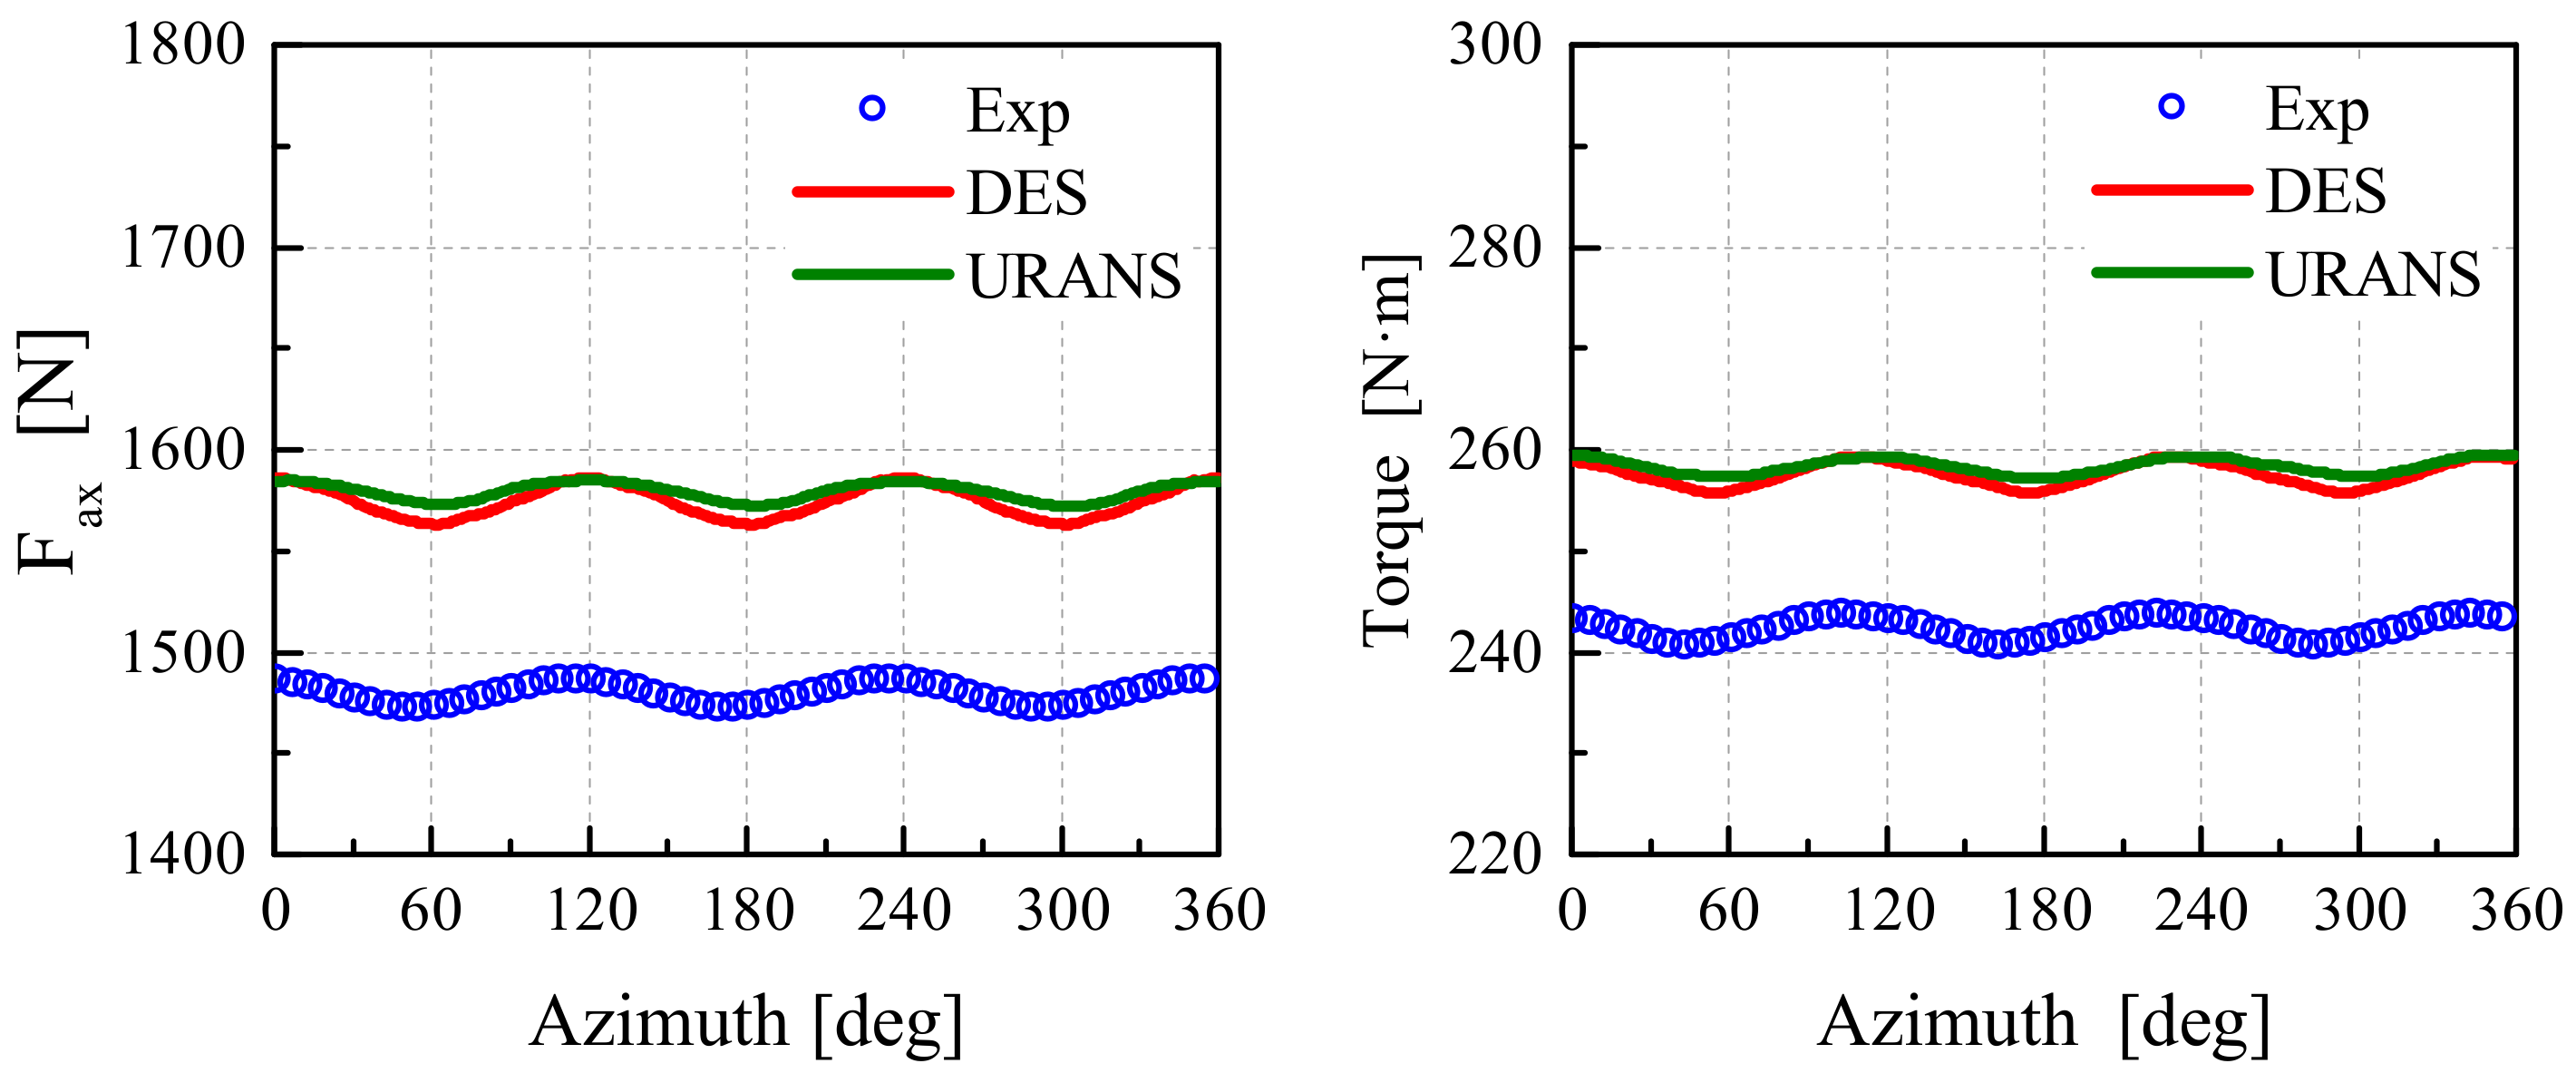
Figure 5.
Comparison of the rotor axial force and torque at the wind speed of 10 m/s, TSR = 10.
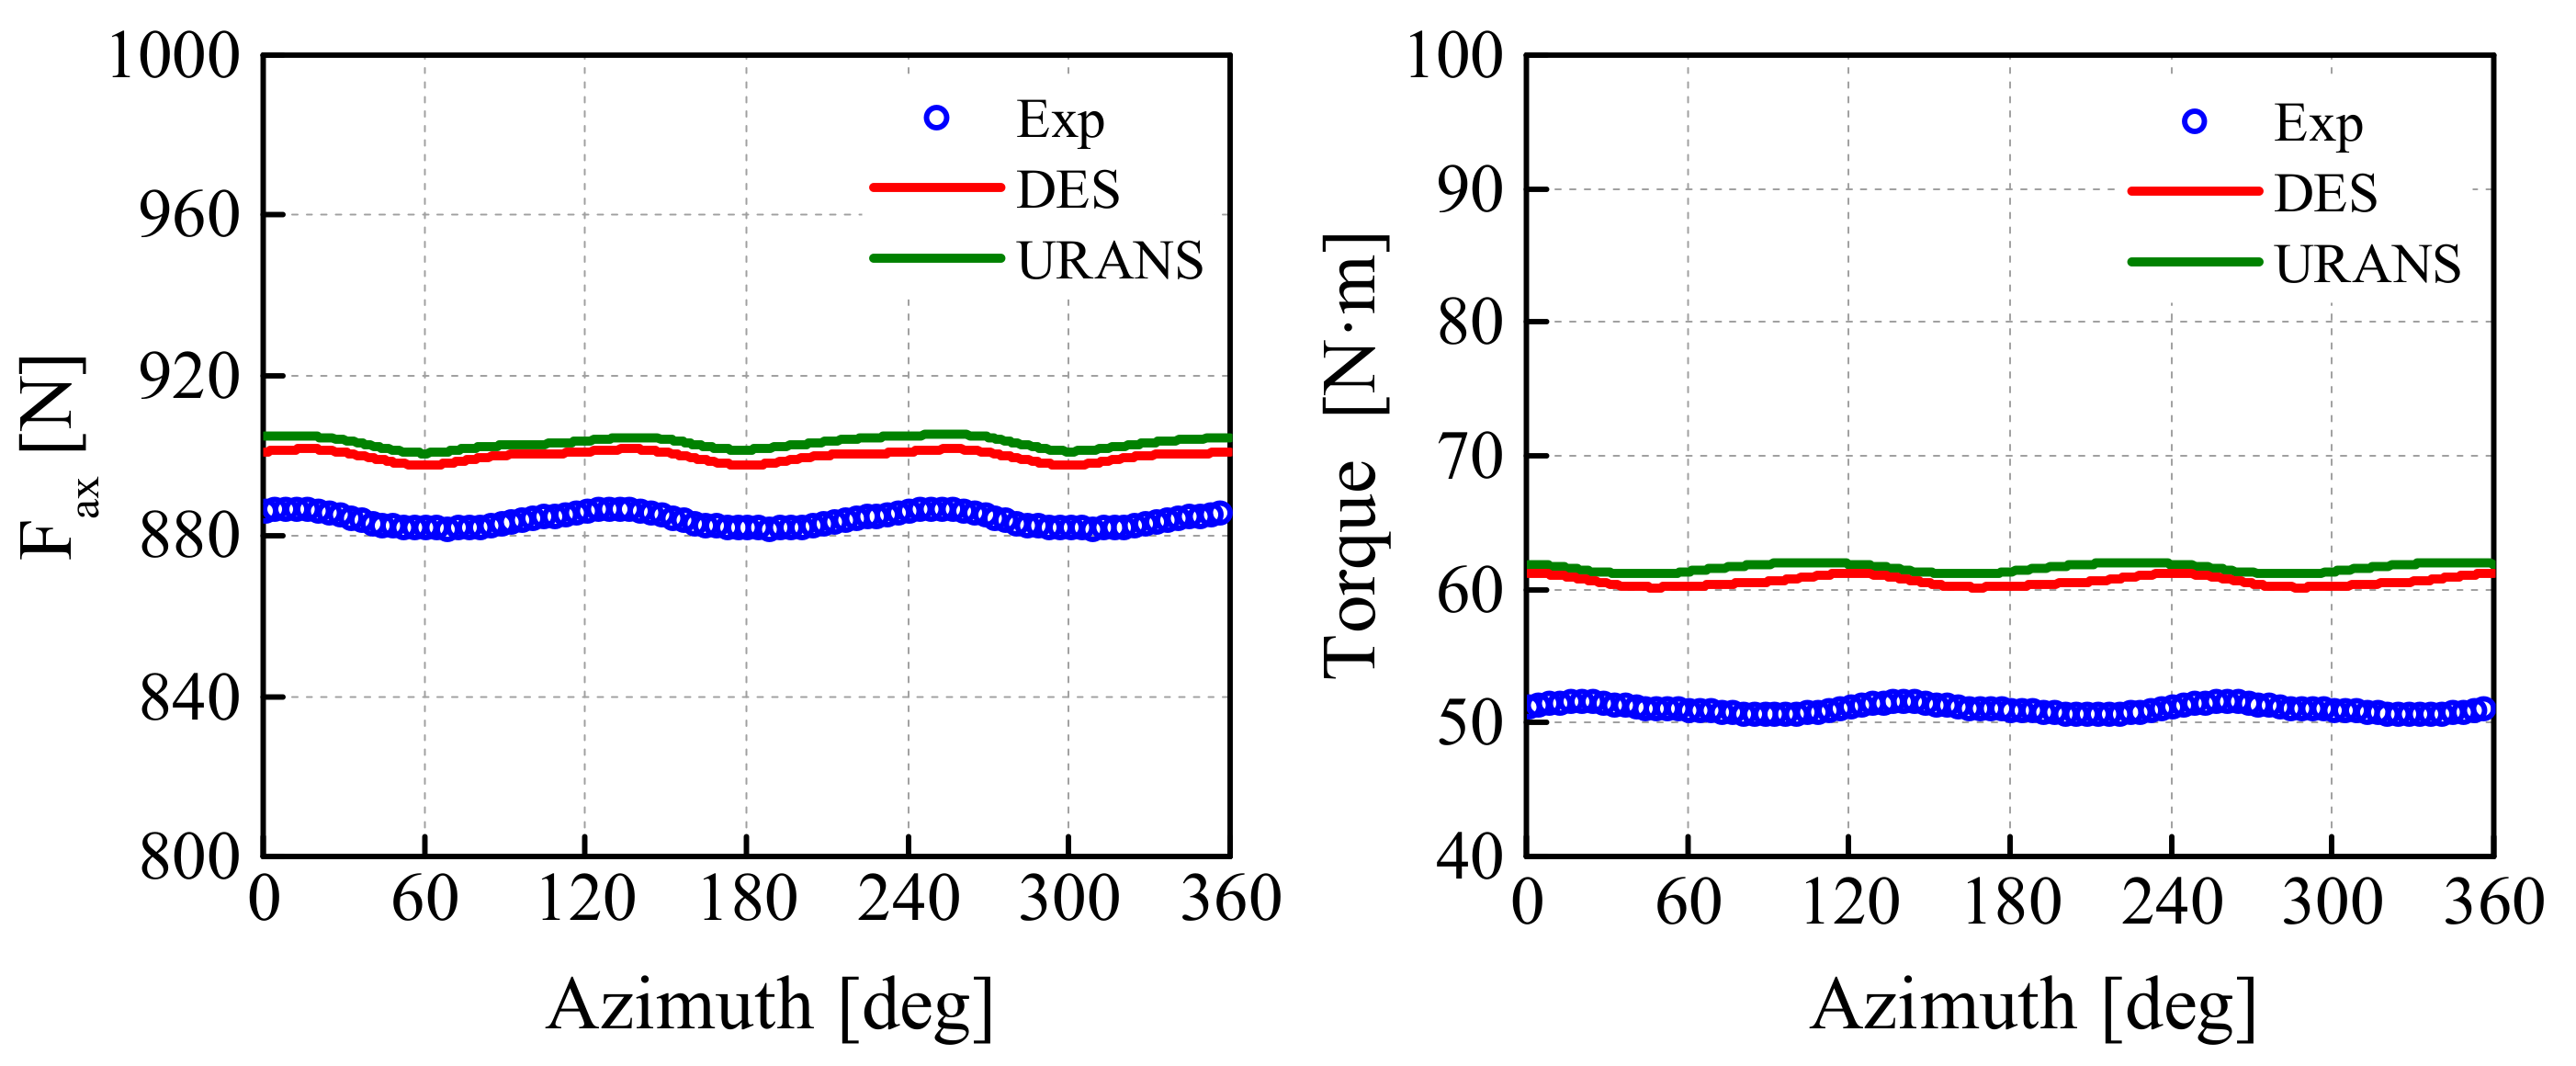
Figure 6.
Comparison of the rotor axial force and torque at the wind speed of 24 m/s, TSR = 4.2.
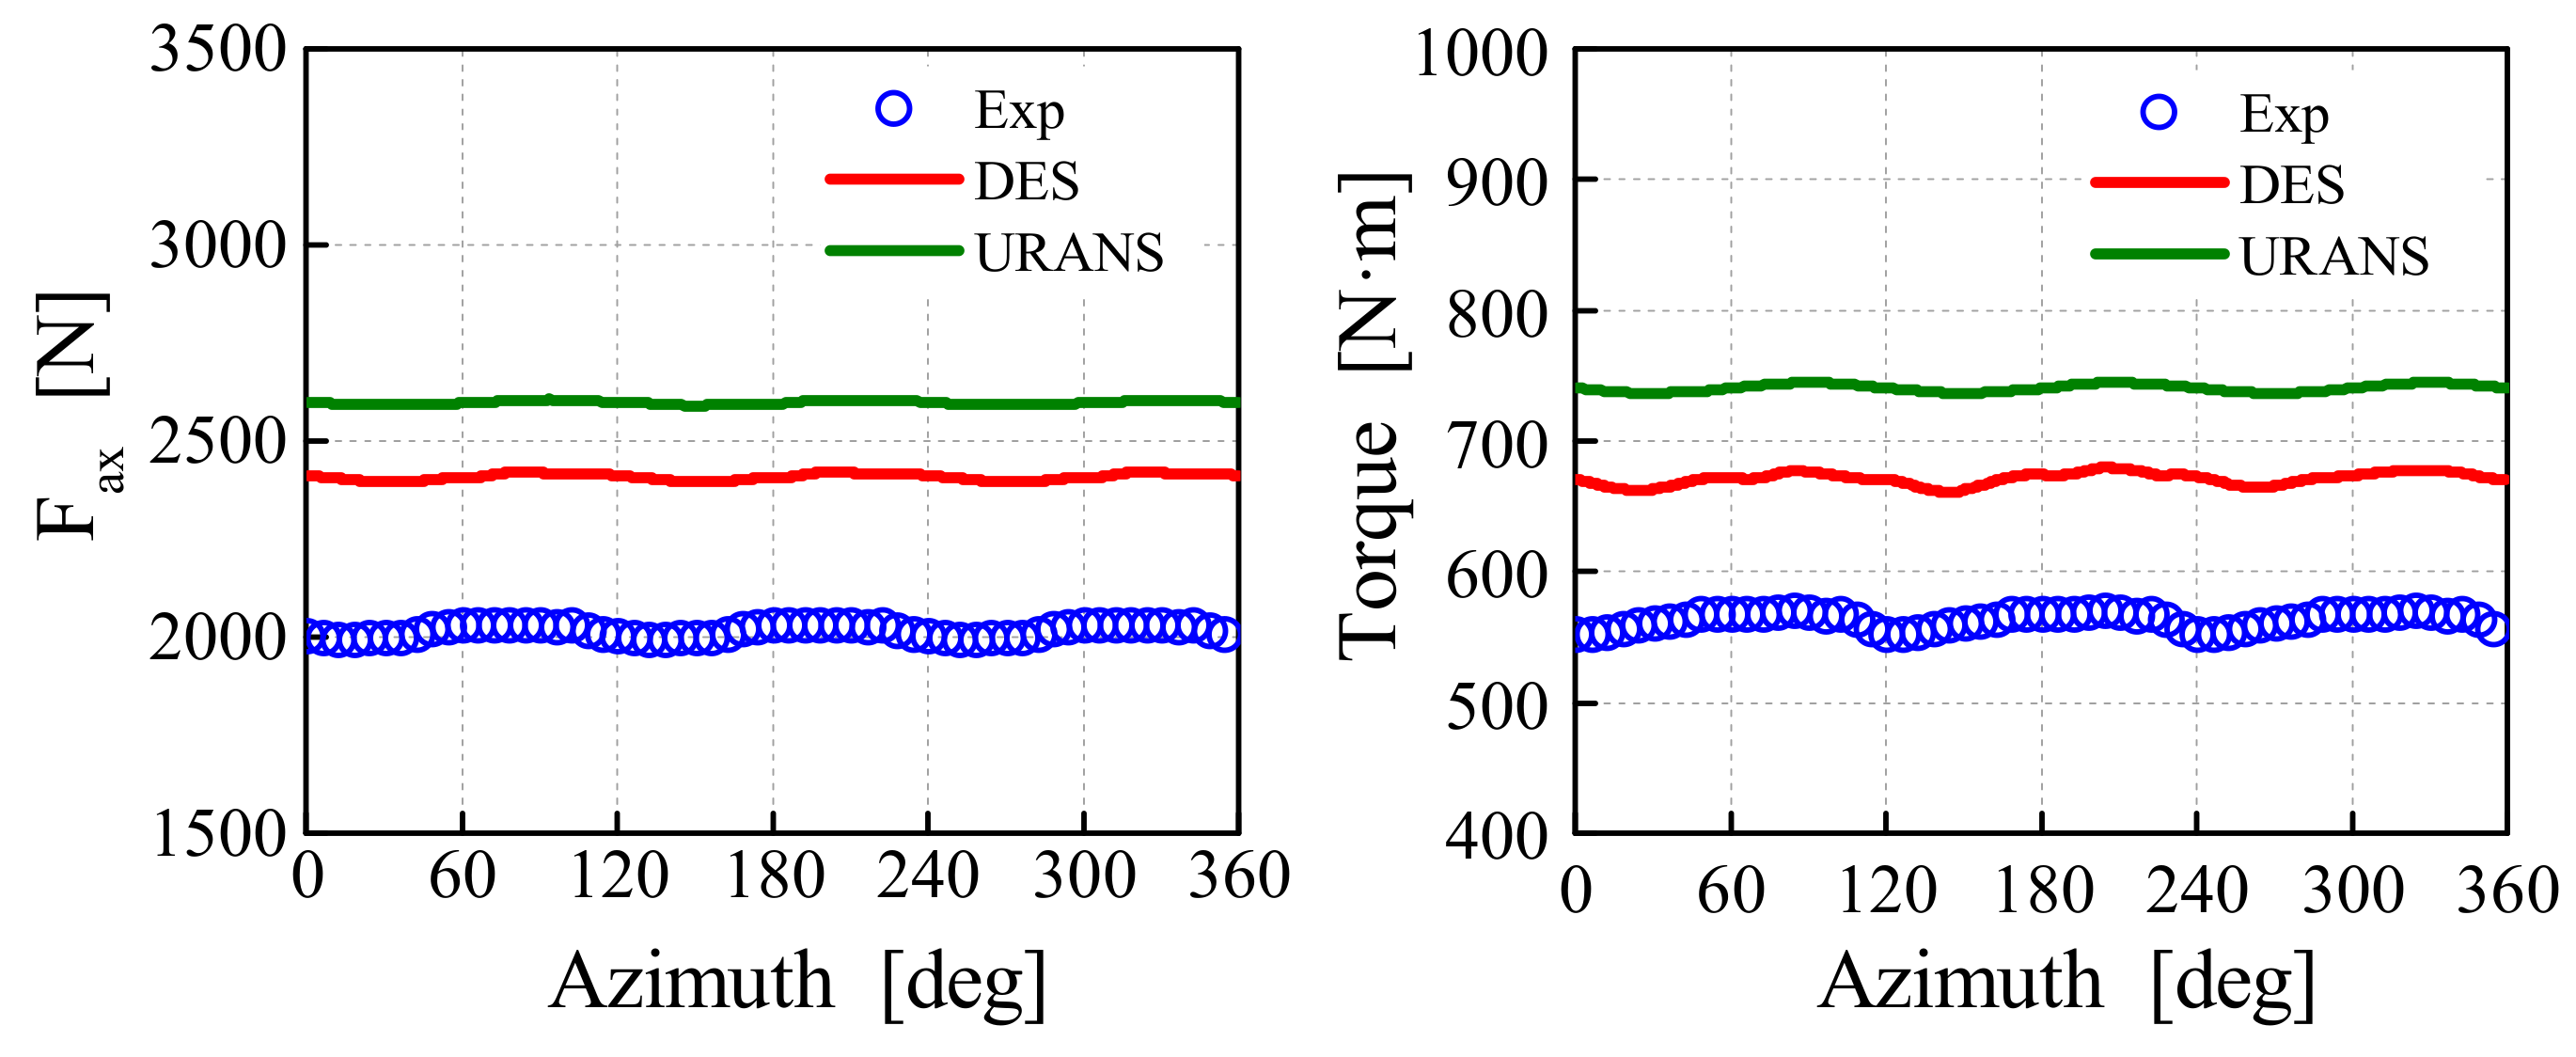
Figure 7.
Comparisons of the rotor torque and thrust regarding the nacelle effect.
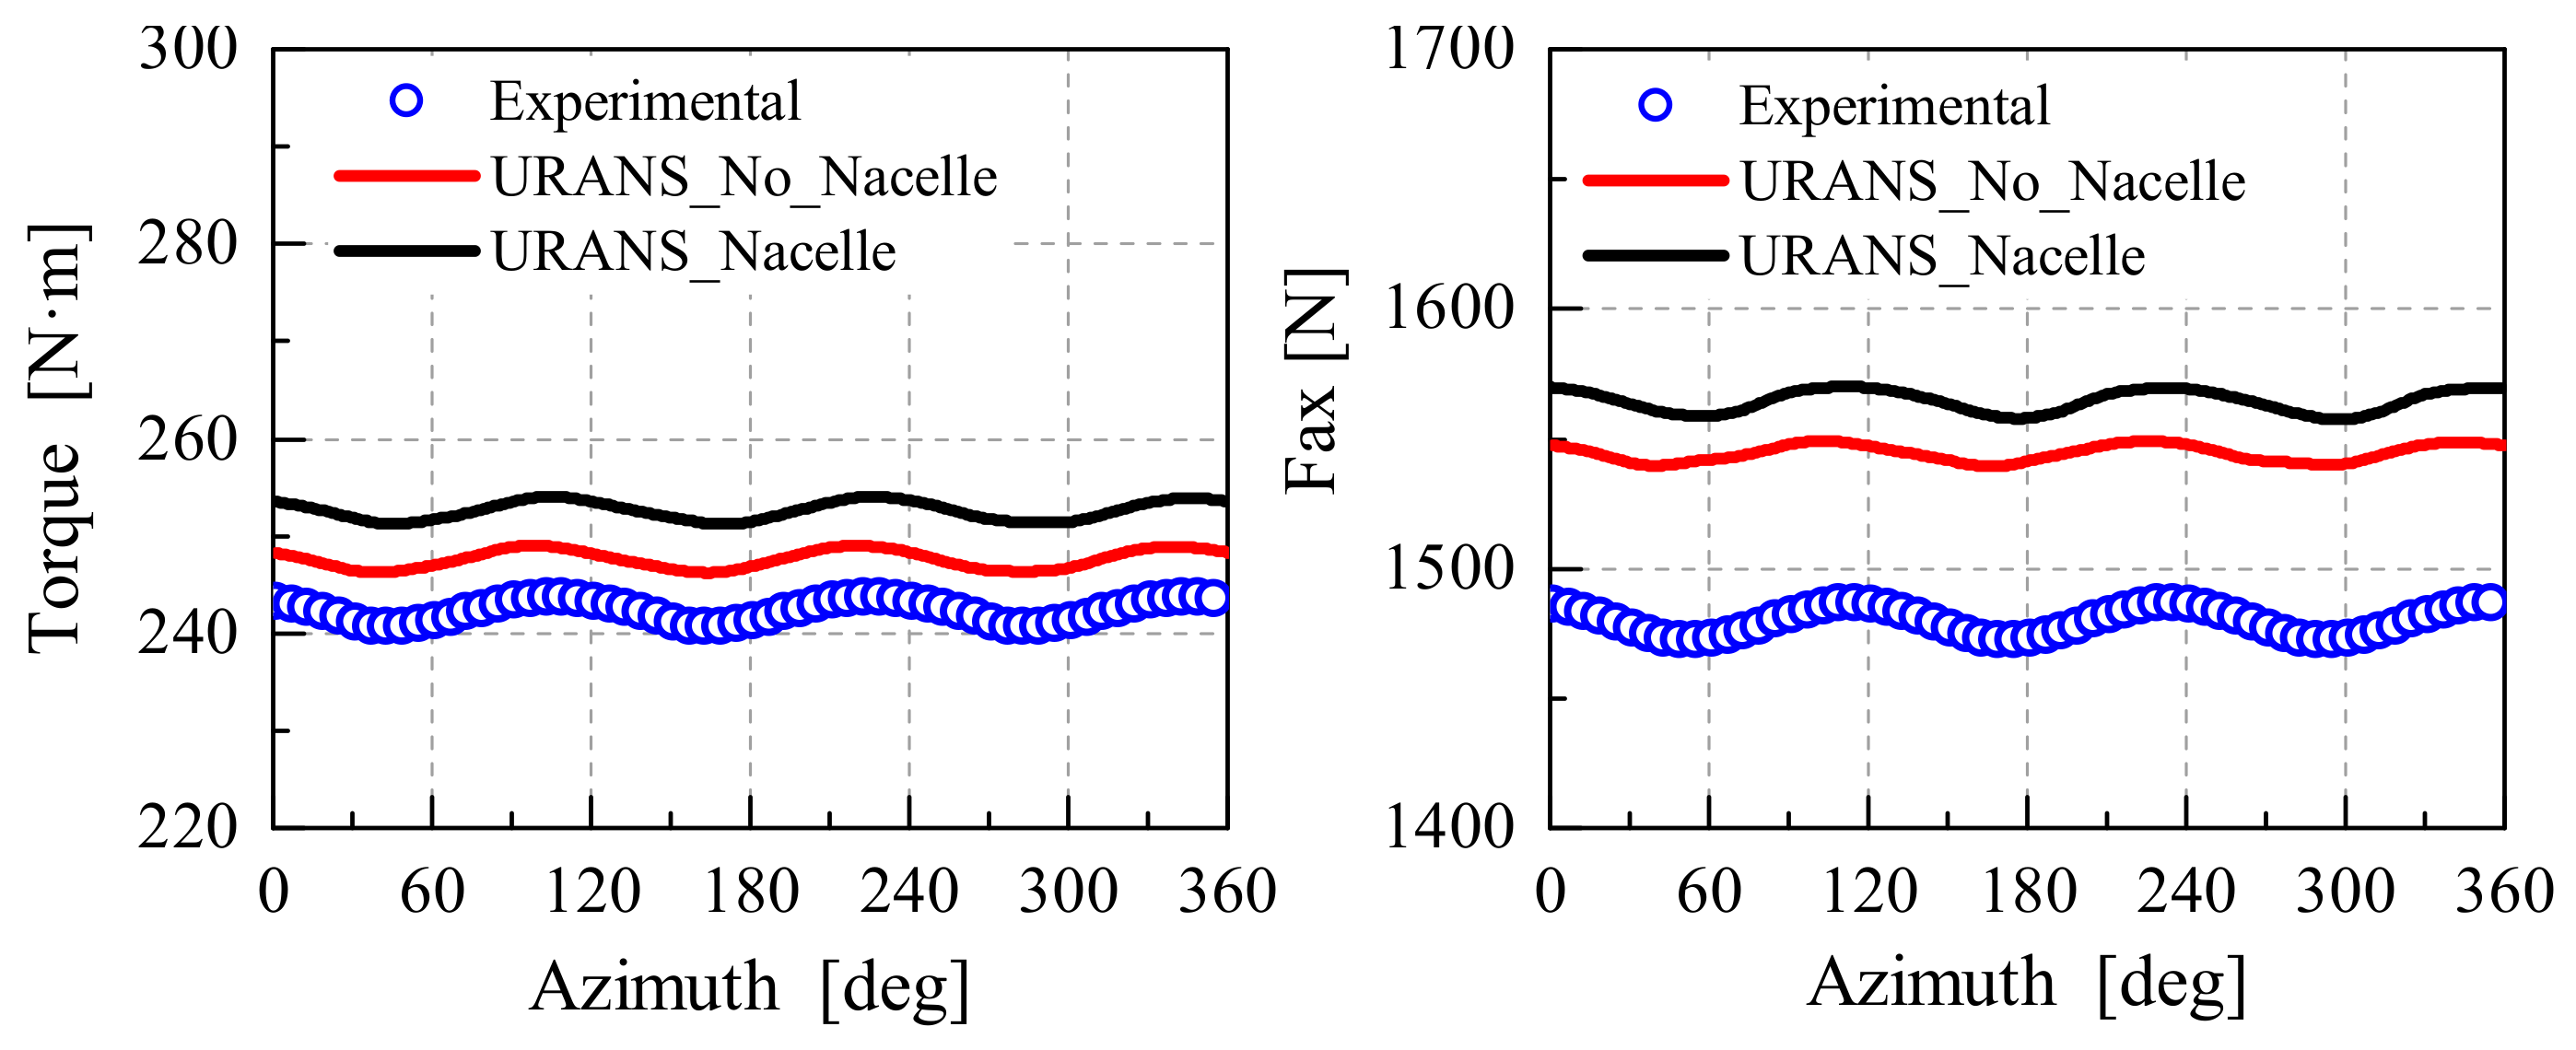
Figure 8.
Contours of vorticity magnitude on the horizontal plane when blade pointing to +z direction: (a) nacelle is not included; (b) nacelle is considered.
Figure 8.
Contours of vorticity magnitude on the horizontal plane when blade pointing to +z direction: (a) nacelle is not included; (b) nacelle is considered.

Figure 9.
Comparisons of radial velocity distributions at x = −0.3 m regarding nacelle effect.

Figure 10.
Comparisons of radial velocity distributions at x = 0.3 m regarding nacelle effect.

Figure 11.
Comparisons of axial velocity distributions regarding nacelle effect.

Figure 12.
Contour of pressure distribution and streamlines of wall shear stress on the blade surface with inflow of 24 m/s, TSR = 4.2, at the yaw angle of 30°.
Figure 12.
Contour of pressure distribution and streamlines of wall shear stress on the blade surface with inflow of 24 m/s, TSR = 4.2, at the yaw angle of 30°.

Figure 13.
Contours of (a) Q-criteria field and (b) velocity magnitude field in horizontal plane at inflow speed of 24 m/s, TSR = 4.2.
Figure 13.
Contours of (a) Q-criteria field and (b) velocity magnitude field in horizontal plane at inflow speed of 24 m/s, TSR = 4.2.

Figure 14.
Normal and tangential forces variations at 25% span at 24 m/s wind inflow.

Figure 15.
Normal and tangential forces variations at 35% span at 24 m/s wind inflow.

Figure 16.
Normal and tangential forces variations at 60% span at 24 m/s wind inflow.

Figure 17.
Comparison of CL and CD characteristics at 25% span for inflow speed of 24 m/s.

Figure 18.
Comparison of CL and CD characteristics at 35% span for inflow speed of 24 m/s.
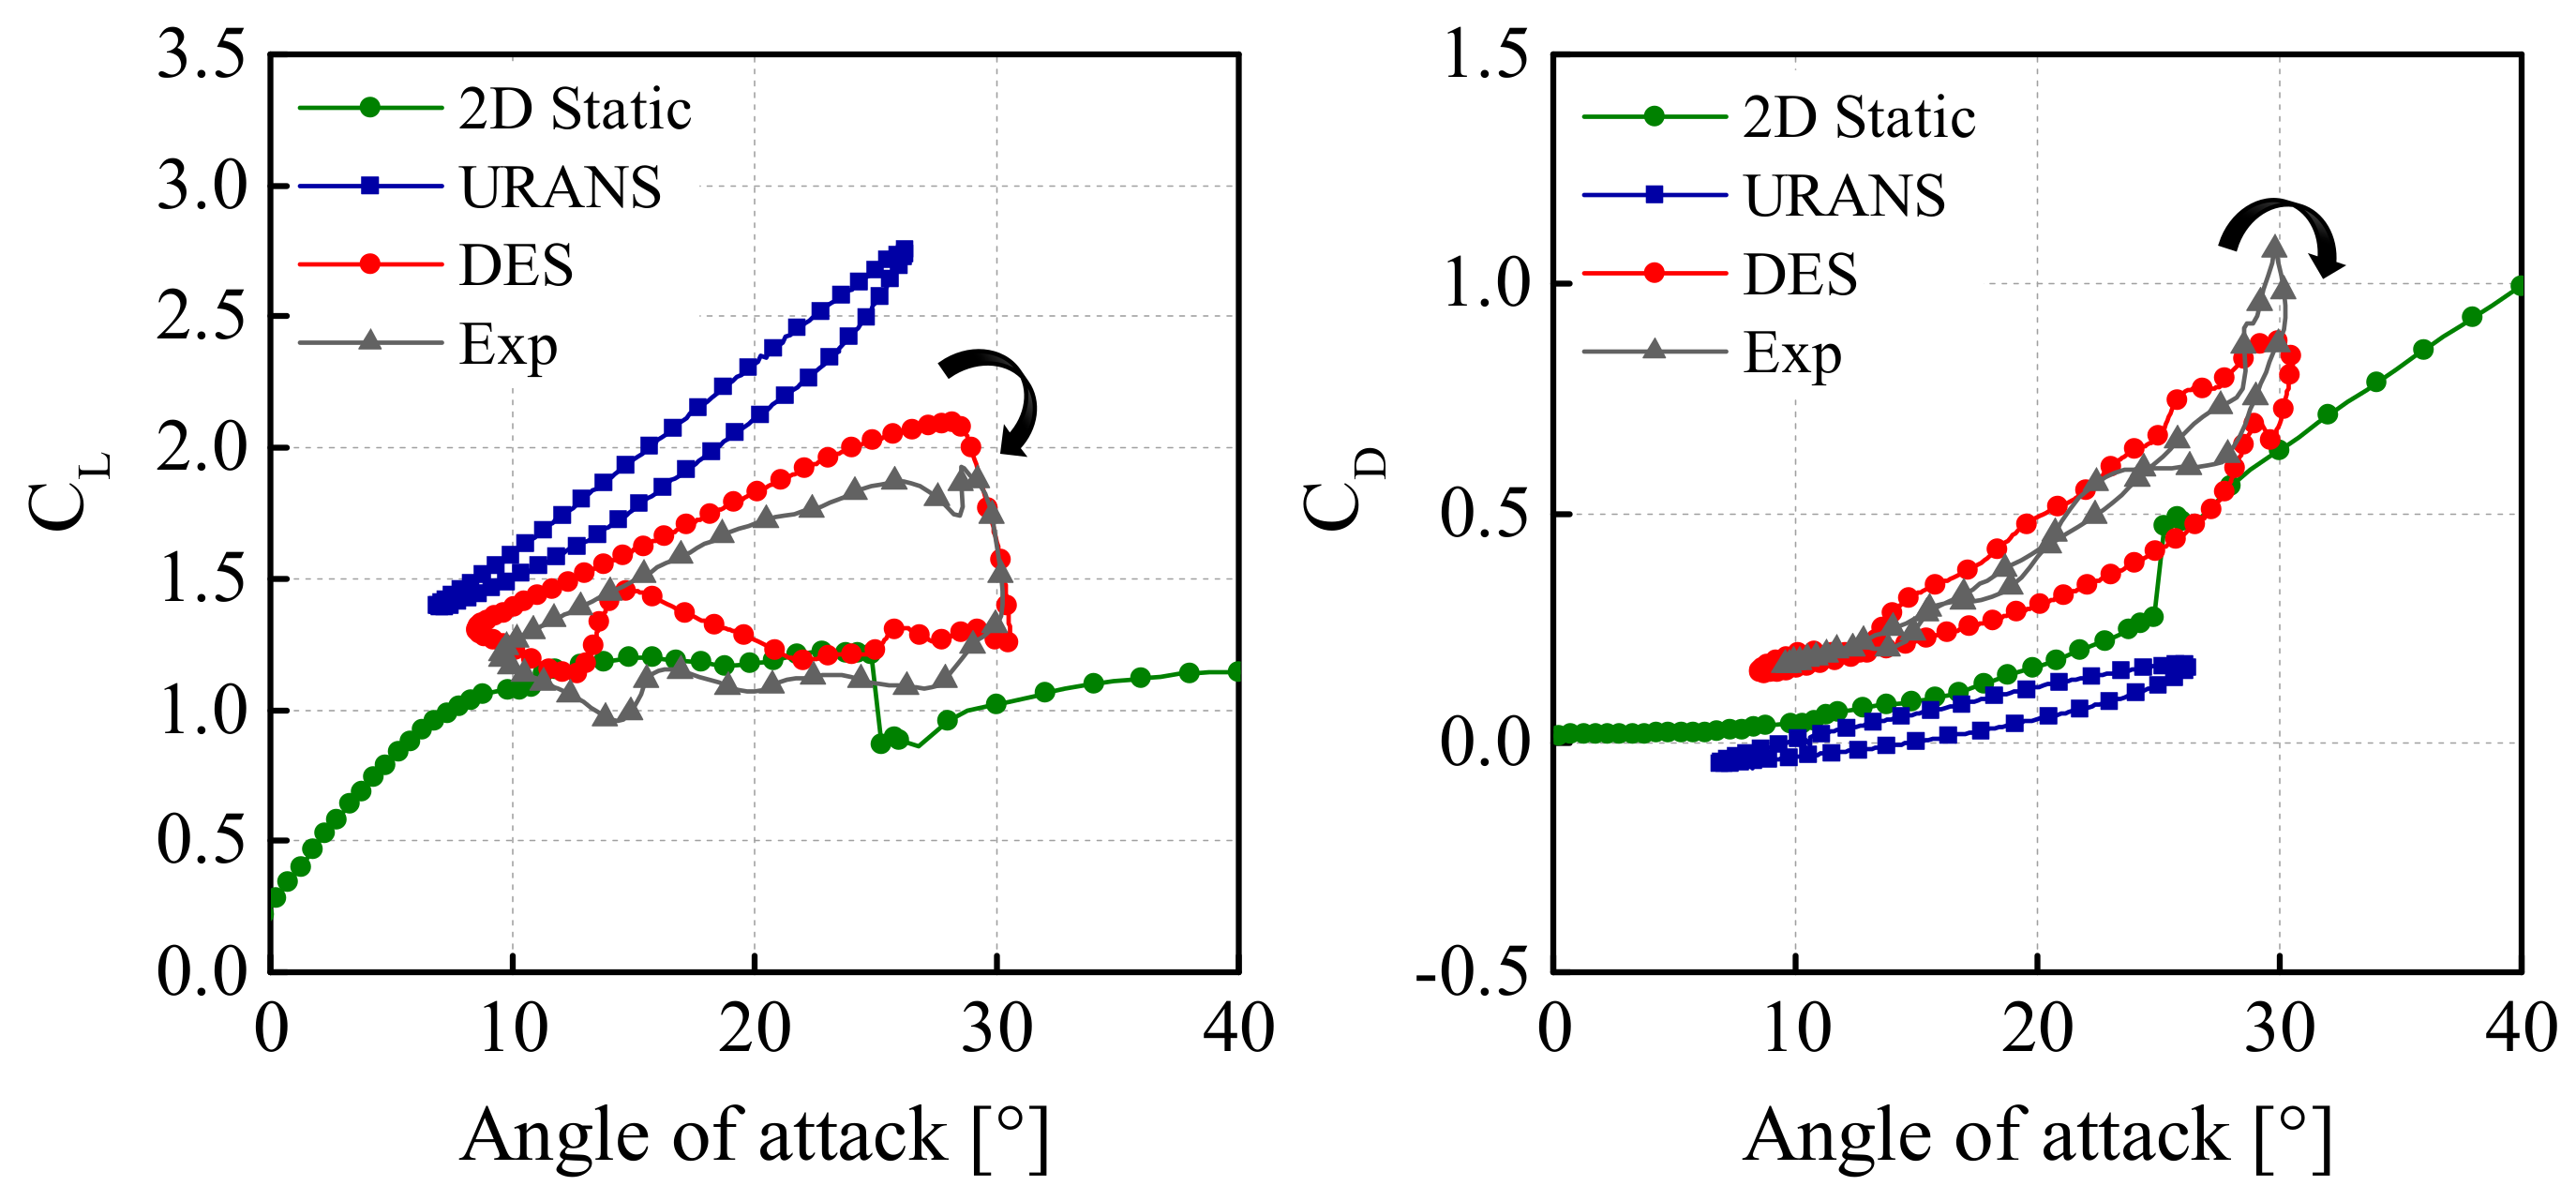
Figure 19.
Comparison of CL and CD characteristics at 60% span for inflow speed of 24 m/s.
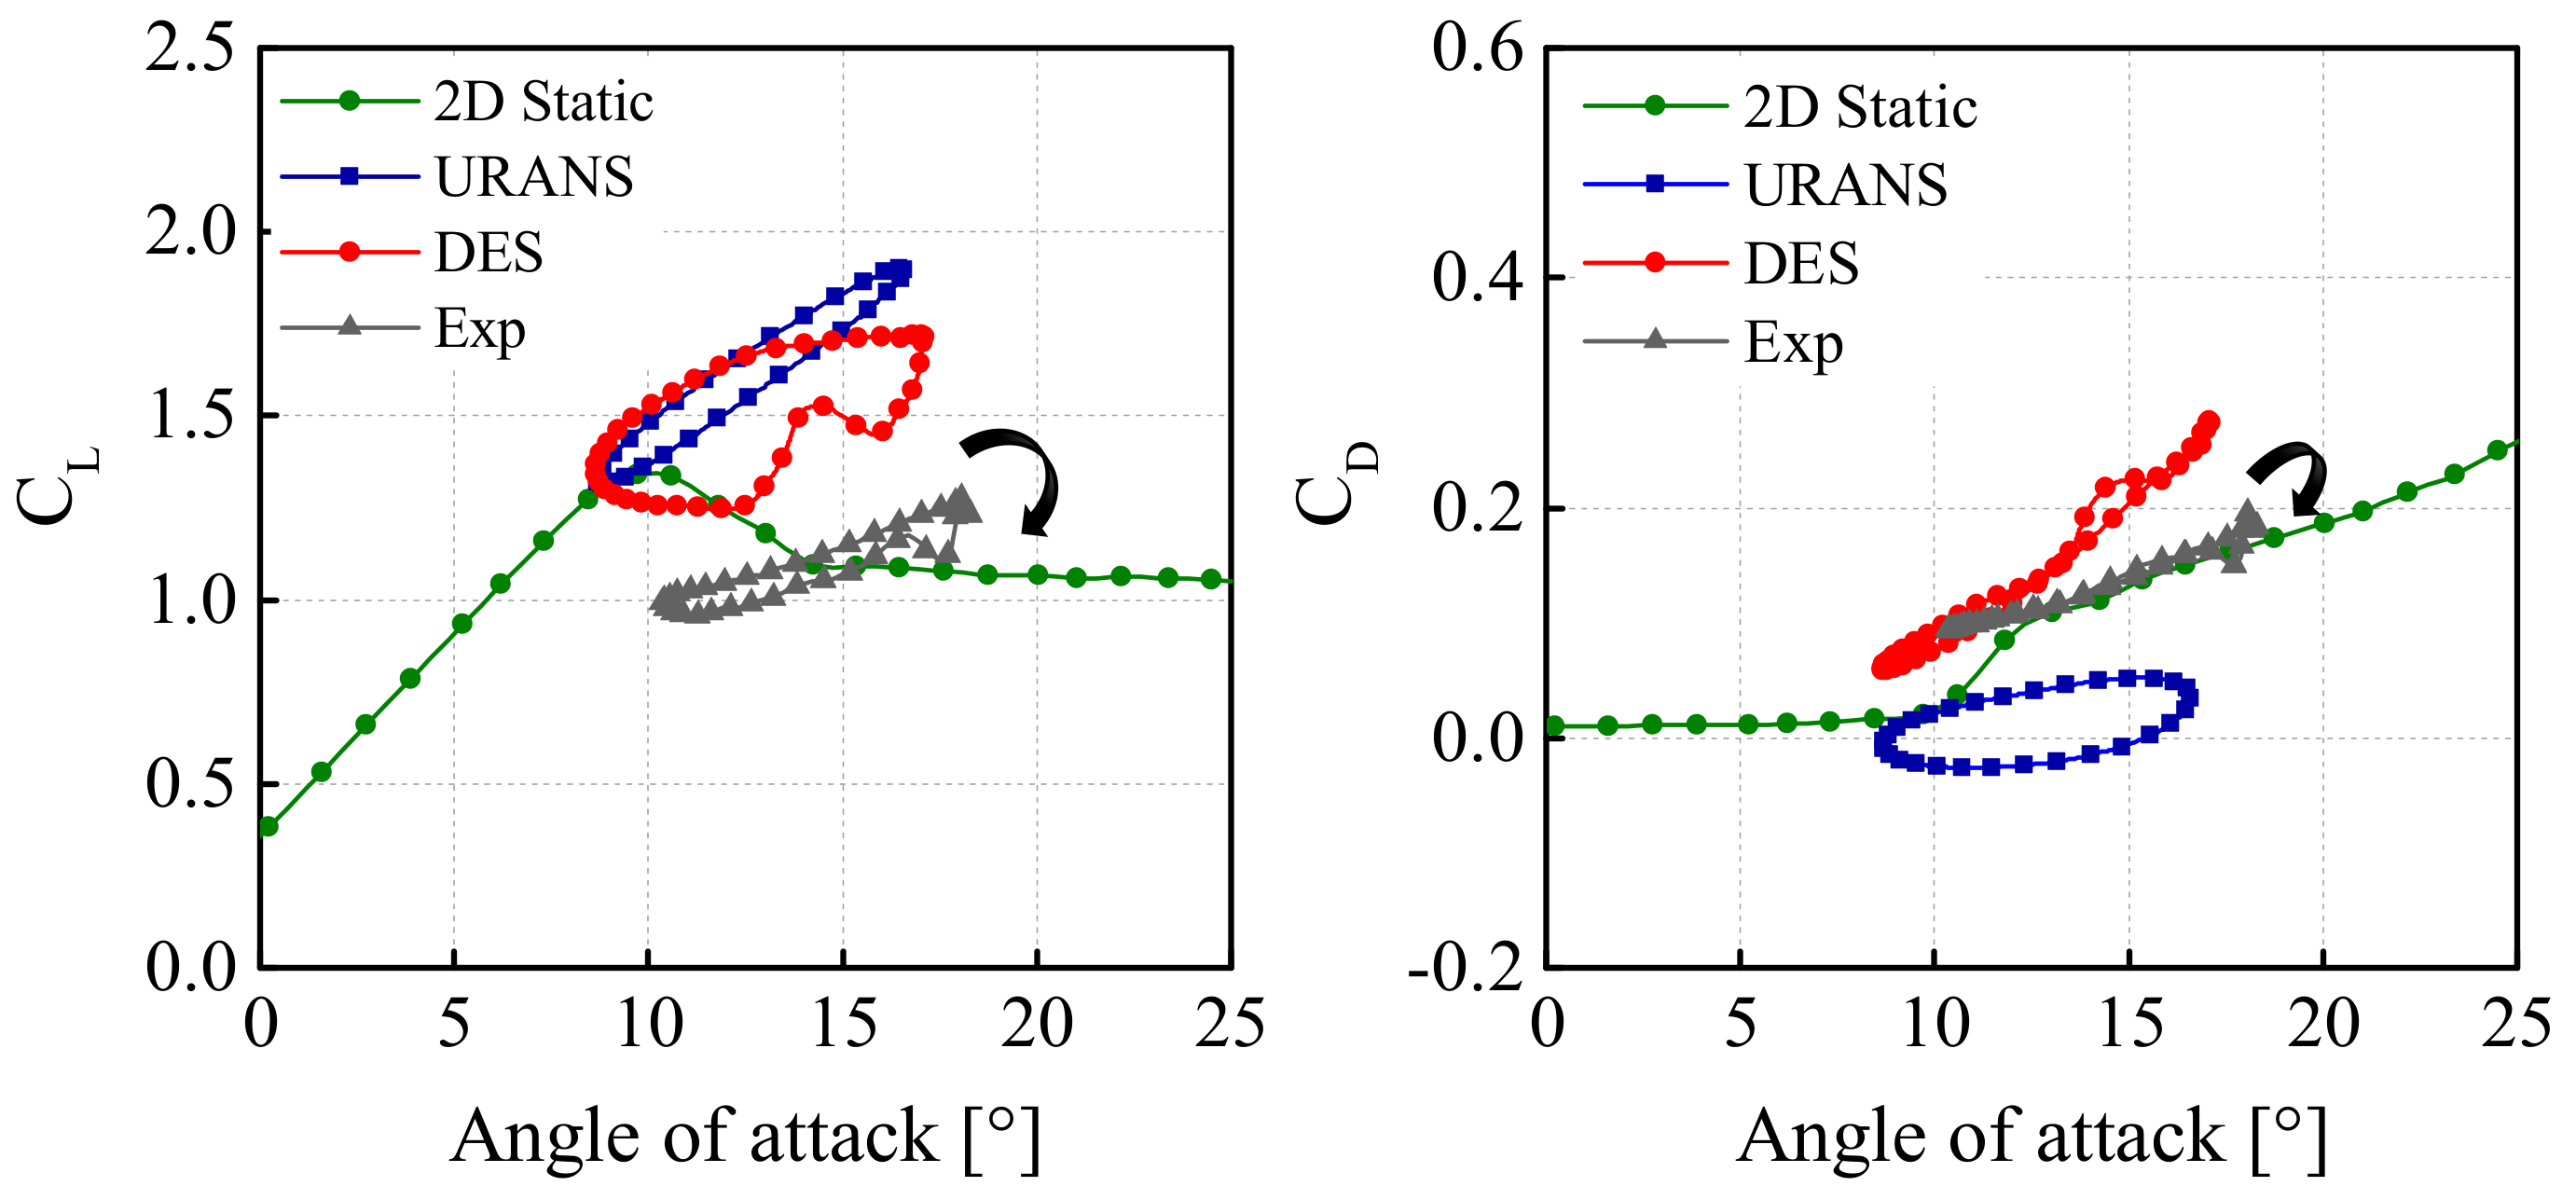
Figure 20.
Axial profile of velocity components at y = 1.5 m under wind speed of 10 m/s, TSR = 10.
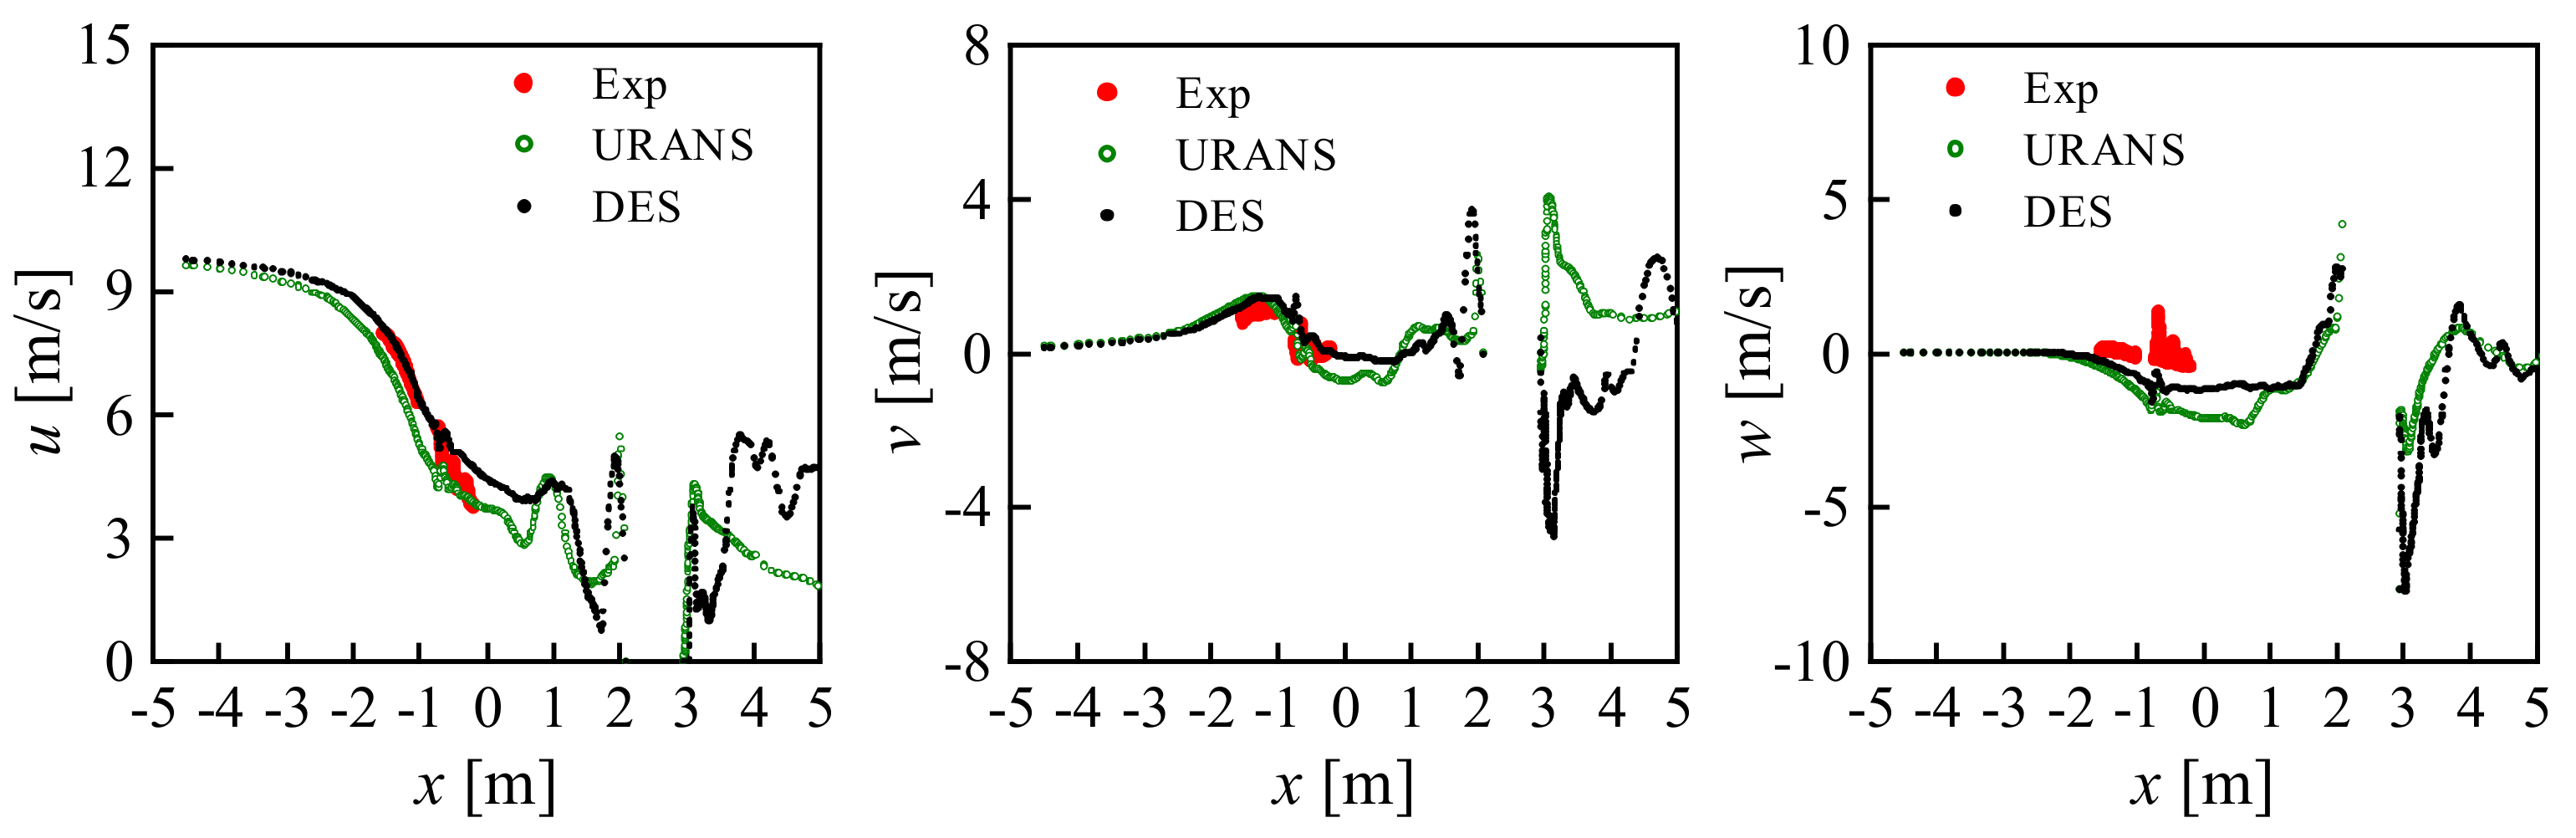
Figure 21.
Axial profile of velocity components at y = 1.5 m under wind speed of 15 m/s, TSR = 6.7.

Figure 22.
Axial profile of velocity components at y = 1.5 m under wind speed of 24 m/s, TSR = 4.2.
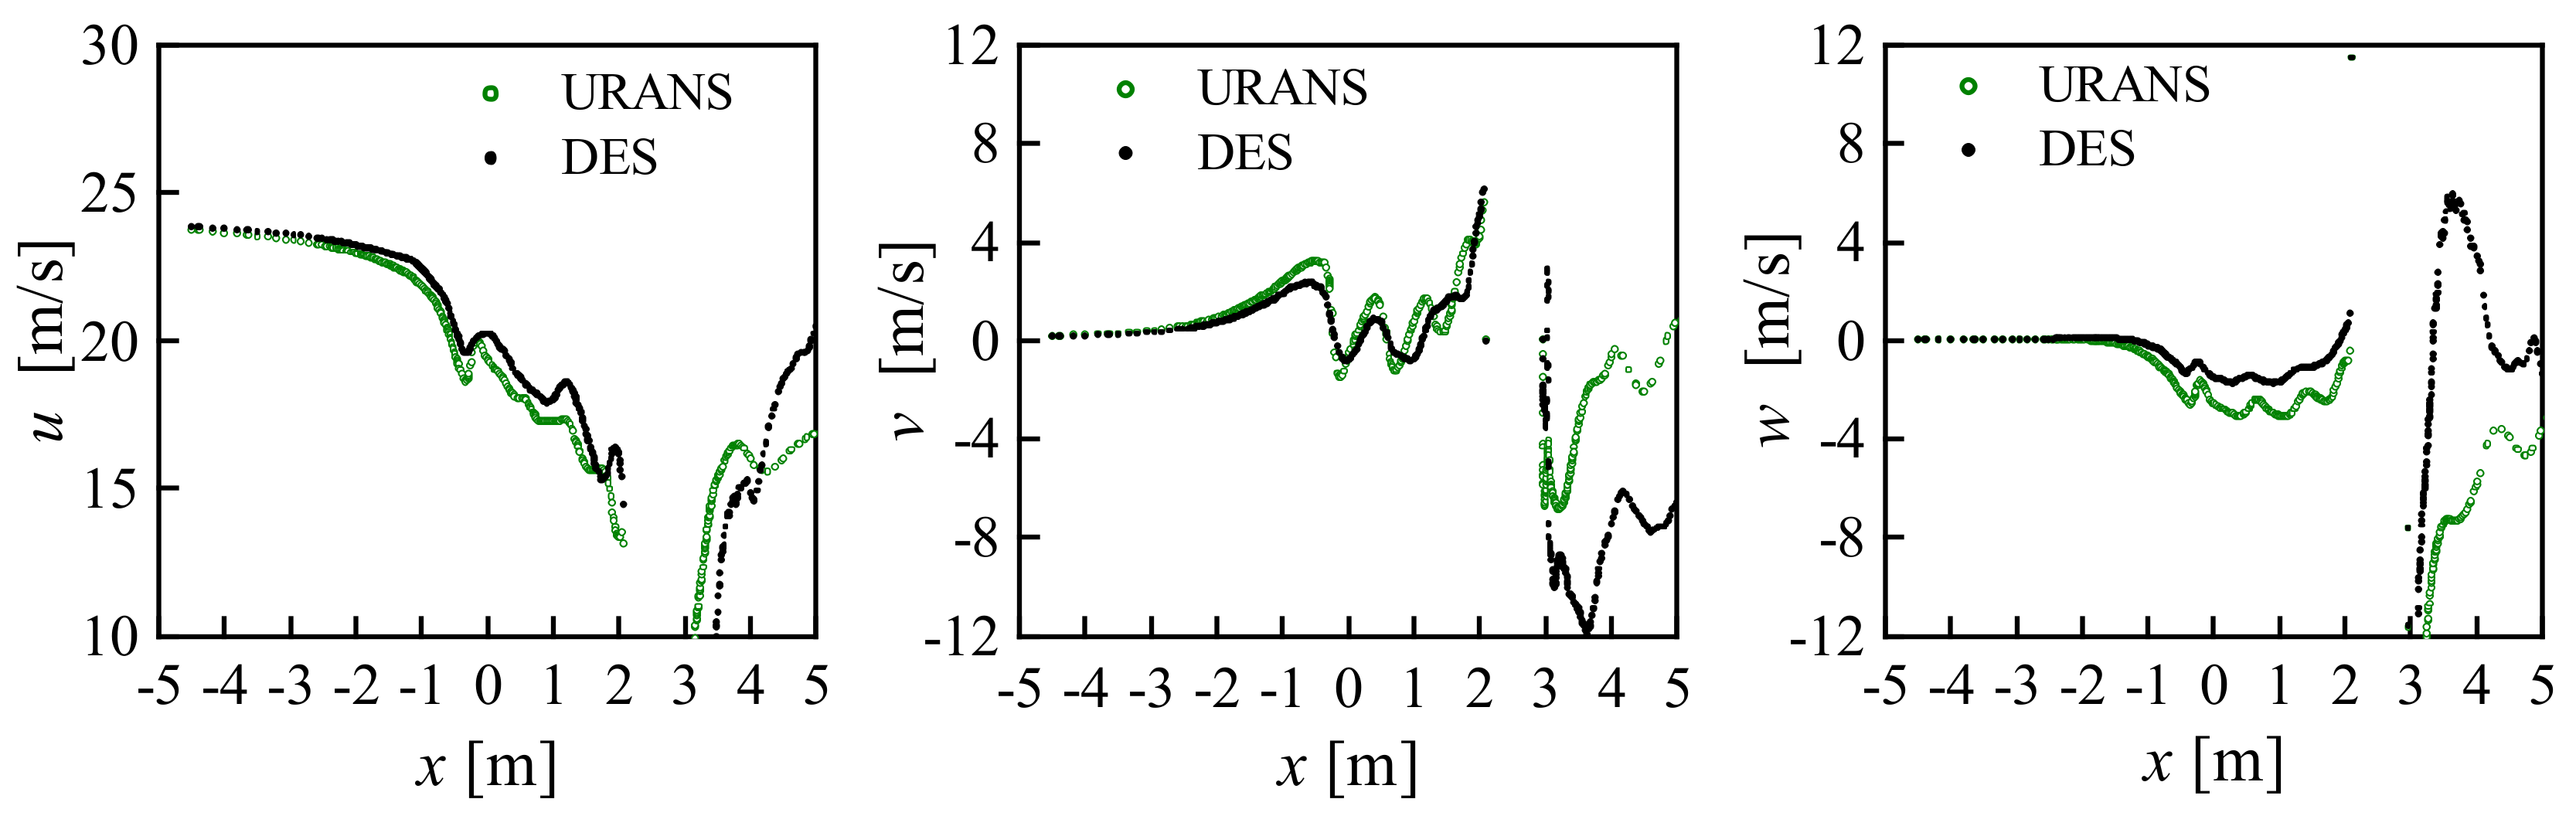
Figure 23.
Axial profile of velocity components at y = −1.5 m under wind speed of 15 m/s, TSR = 6.7.
Figure 23.
Axial profile of velocity components at y = −1.5 m under wind speed of 15 m/s, TSR = 6.7.

Figure 24.
Axial profile of velocity components at y = −1.5 m under wind speed of 10 m/s, TSR = 10.
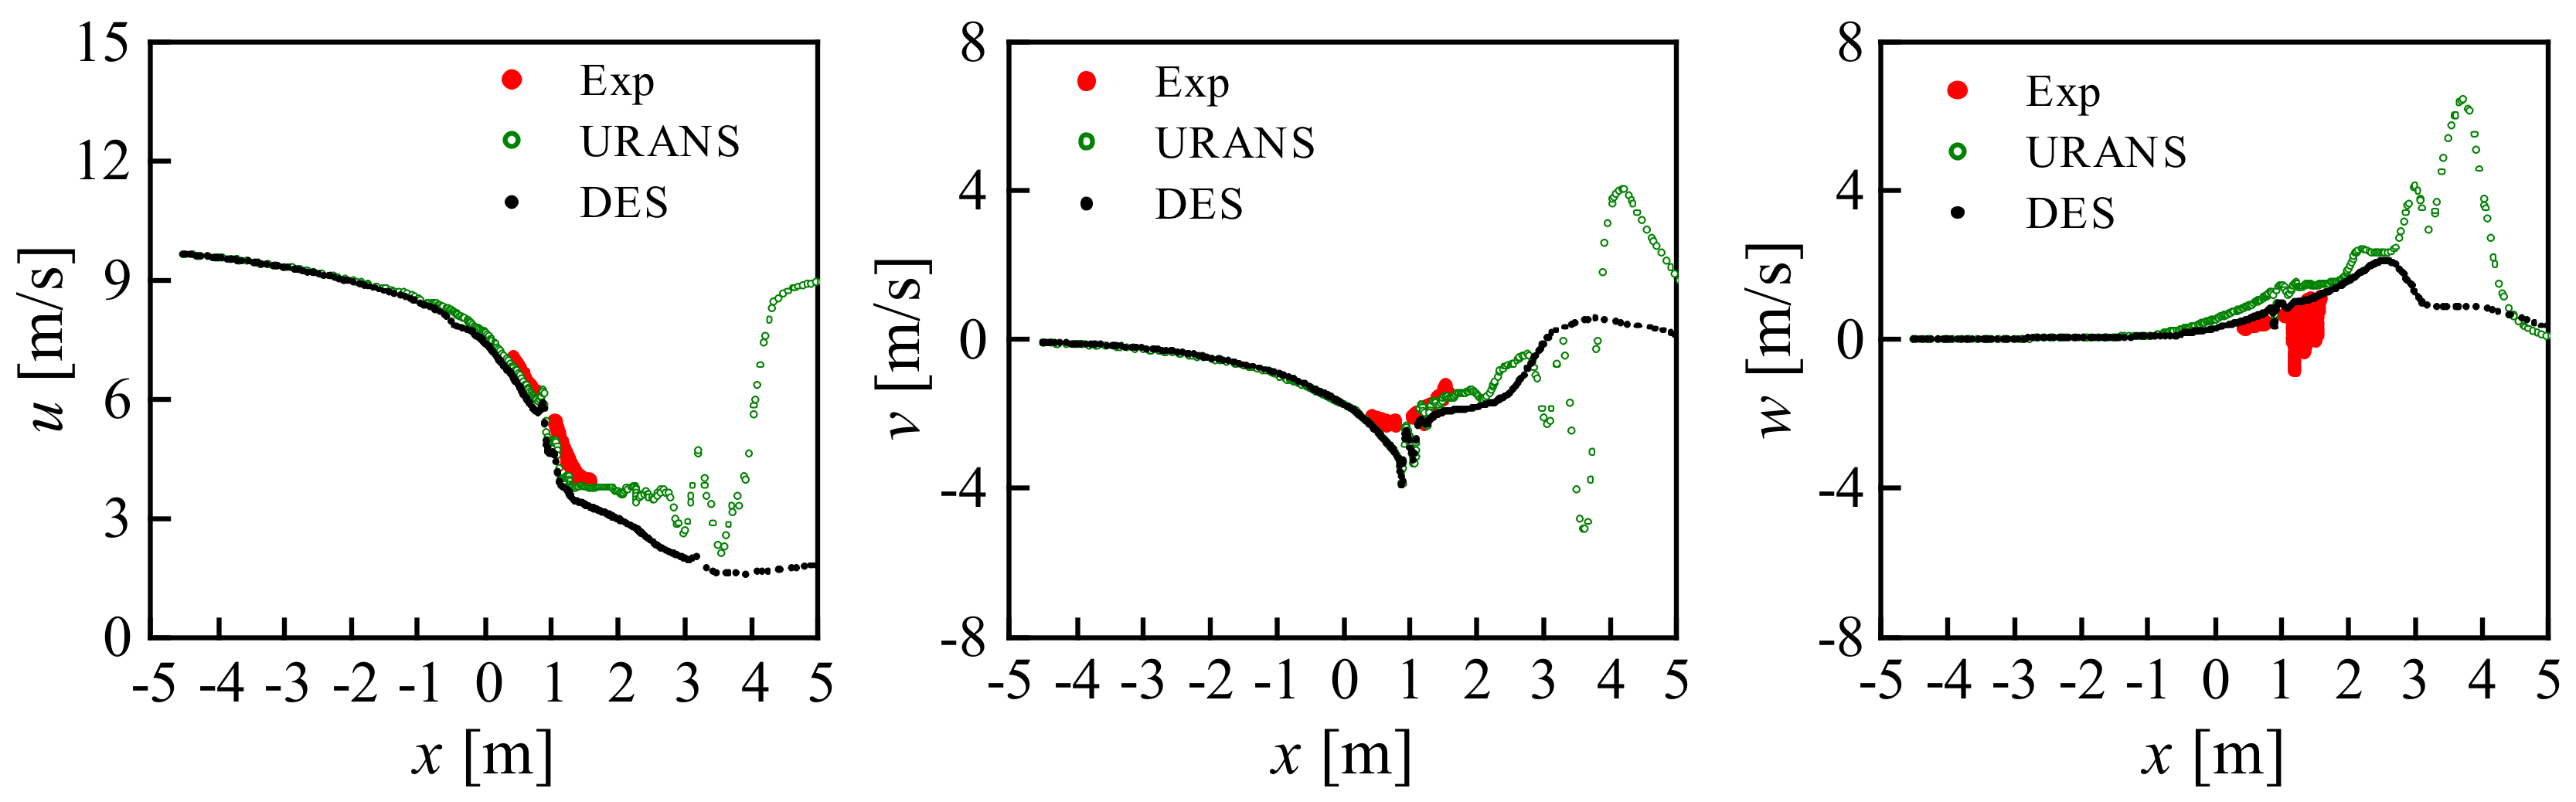
Figure 25.
Axial profile of velocity components at y = −1.5 m under wind speed of 24 m/s, TSR = 4.2.
Figure 25.
Axial profile of velocity components at y = −1.5 m under wind speed of 24 m/s, TSR = 4.2.

Table 1.
Blade geometry profile of MEXICO rotor.
| Radial Position r/R | Airfoil Type |
|---|---|
| 0.0–0.04 | Cylinder |
| 0.04–0.106 | Transition |
| 0.106–0.362 | DU91-W2-250 |
| 0.362–0.451 | Transition |
| 0.451–0.562 | RISØ-A1-21 |
| 0.562–0.651 | Transition |
| 0.651–1.0 | NACA64-418 |
Table 2.
Details of computational mesh for grid dependency study.
| Coarse | Medium | Fine | Finer | |
|---|---|---|---|---|
| Blade spanwise cell number | 95 | 147 | 211 | 272 |
| Blade chordwise cell number | 198 | 252 | 316 | 368 |
| Rotational cell number (million) | 12.16 | 21.86 | 32.93 | 39.74 |
| Stationary cell number (million) | 4.35 | 7.84 | 12.68 | 16.45 |
© 2018 by the authors. Licensee MDPI, Basel, Switzerland. This article is an open access article distributed under the terms and conditions of the Creative Commons Attribution (CC BY) license (http://creativecommons.org/licenses/by/4.0/).
Share and Cite
MDPI and ACS Style
Qian, Y.; Zhang, Z.; Wang, T. Comparative Study of the Aerodynamic Performance of the New MEXICO Rotor under Yaw Conditions. Energies 2018, 11, 833. https://doi.org/10.3390/en11040833
AMA Style
Qian Y, Zhang Z, Wang T. Comparative Study of the Aerodynamic Performance of the New MEXICO Rotor under Yaw Conditions. Energies. 2018; 11(4):833. https://doi.org/10.3390/en11040833
Chicago/Turabian StyleQian, Yaoru, Zhenyu Zhang, and Tongguang Wang. 2018. "Comparative Study of the Aerodynamic Performance of the New MEXICO Rotor under Yaw Conditions" Energies 11, no. 4: 833. https://doi.org/10.3390/en11040833
Note that from the first issue of 2016, this journal uses article numbers instead of page numbers. See further details here.