Cost-Based Design and Selection of Point Absorber Devices for the Mediterranean Sea


1
Department of Science and Technology, Centro Direzionale Isola C4, The University of Naples “Parthenope”, 80143 Naples, Italy
2
Department of Engineering, Centro Direzionale Isola C4, The University of Naples “Parthenope”, 80143 Naples, Italy
*
Author to whom correspondence should be addressed.
Energies 2018, 11(4), 946; https://doi.org/10.3390/en11040946
Submission received: 26 March 2018
/
Revised: 12 April 2018
/
Accepted: 13 April 2018
/
Published: 16 April 2018
(This article belongs to the Special Issue Wave Energy Potential, Behavior and Extraction)
Abstract
:Sea wave energy is one of the most promising renewable sources, even if relevant technology is not mature enough for the global energy market and is not yet competitive if compared with solar, wind and tidal current devices. Particularly, among the variety of wave energy converters developed in the last decade, heaving point absorbers represent one of the most feasible and studied technologies, as shown by the small-scale testing and full-scale prototypes, deployed in the last years throughout the world. Nevertheless, the need for further reduction of the energy production costs requires a specialized design of wave energy converters, accounting for the restraints provided by the power take-off unit and the device operational profile. Hence, actual analysis focuses on a new cost-based design procedure for heaving point absorbers. The device is equipped with a floating buoy with an optional fully submerged mass connected, by means of a tensioned line, to the power take-off unit. It consists of a permanent magnet linear generator, lying on the seabed and equipped with a gravity-based foundation. The proposed procedure is applied to several candidate deployment sites located in the Mediterranean Sea; the incidence of the power take-off restraint and the converter operational profile is fully investigated and some recommendations for preliminary design of wave energy converter devices are provided. Current results show that there is wide scope to make the wave energy sector more competitive on the international market, by properly selecting the main design parameters of point absorbers, on the basis of met-ocean conditions at the deployment site.
1. Introduction
In the last decade the interest in harnessing wave power has grown fast, thanks to several research activities funded by national administrations and private companies, with the main aim of facilitating and coordinating ocean energy research, development and demonstration, through international cooperation and information exchanges [1]. Starting from the first pioneering work by Salter [2], different wave energy conversion technologies have been developed and investigated [3,4,5,6], moving the research activities from small-scale testing to full-scale prototypes. Nevertheless, the wave energy sector actually experiences a moderate slow-down in the rate of progress, mainly due to the high investment needs, combined with challenging environmental conditions and technical risks [7]. In this respect, it is quite challenging to achieve the 7/8 Technology Readiness Level [8], with reference to system prototype demonstration in the operational environment, and move the sector towards competitive manufacturing systems, at least in the case of key enabling technologies.
The issue of moving the wave energy sector towards full effective systems, ready for the international market, is mainly due to technical and financial difficulties in increasing the rated power of wave energy converter (WEC) devices [7] and consistently slow-down the levelised cost of energy (). Hence, all these factors make the wave energy sector not yet competitive enough on the international market, if compared with other renewable sources, such as hydroelectric, solar, wind and tidal stream technologies. Nevertheless, it is predictable that in the future the wave energy sector will reach competitive levels, with the increase of the total installed capacity that will help to reduce uncertainties and costs, as well as improve system reliability and availability [7,9]. These targets comply with the EU Strategic Energy Technology Plan, according to which the LCoE of wave energy devices is expected to decrease up to 0.15 €/kWh by 2030 and 0.10 €/kWh by 2035.
One of the most promising pathway to reduce the consists of optimizing the hydrodynamic performances of WEC devices [3,4,9,10,11,12,13] by a proper design of the energy converter and the power take-off (PTO) unit. Furthermore, different motion control techniques, such as latching, unclutching or phase control methods [14], can be also applied in order to increase the power production. In this respect, the control strategies for optimum design of sea structures, widely applied in the last decade in the offshore wind energy sector among others [15,16,17], play a fundamental role also in the wave energy field, to reduce capital, operating and decommissioning costs. Hence, following the variety of attempts, devoted to making the wave energy sector competitive on the international market, a new cost-based design procedure of WEC devices, consisting of heaving point absorbers with an optional fully submerged mass and connected to a permanent magnet linear generator lying on the seabed, is outlined and investigated, focusing on the following main subjects:
- (i)
- Two point absorber configurations, mainly consisting of a floating buoy plus an optional fully submerged mass, required to properly tune the device heave natural frequency with dominant sea states at the candidate deployment site, are investigated by a purposely developed programme in Matlab [18]. Particularly, the hydrodynamic model of the floating buoy is developed accounting for the WEC operational profile and the PTO mechanical restraint, in terms of free stroke length, provided by the permanent magnet linear generator.
- (ii)
- A new procedure to select the optimum WEC design, that allows minimizing the , is outlined and applied to several candidate deployment sites, located in the Mediterranean Sea, to investigate the incidence of available energy and metocean conditions on the attained power production and cost.
- (iii)
- The incidence of PTO free stroke length and WEC operational profile on power production and is analysed, to investigate the impact on annual power production and costs.
- (iv)
- Some guidelines to select, in the preliminary design phase, the optimum point absorber configuration that allows minimizing the , are provided.
Actual efforts are undertaken to furnish a possible pathway to speed up the mass production of WEC devices and push the energy sector towards the commercial phase. In this respect, several cost reduction opportunities in the wave energy sector can arise from: (i) increasing scale/volume productions; (ii) improving experience in manufacturing and operational phases and (iii) providing innovative design strategies, resulting in increased device ratings and reduced capital costs.
2. Review of Point Absorber Technology
It is well-known that wave energy technologies vary widely in both mechanical and electrical conversion modes, mainly depending on relevant working principle [1]. In current analysis, the point absorber is assumed as a reference WEC device, provided that it represents one of the most promising technologies, as proved by the variety of concept designs and full scale prototypes, developed in the last decade by several research administrations and private companies. Anyway, it must be pointed out that even if the working principle of point absorbers is always the same and mainly consists of harnessing the heave motion of a floating buoy in a seaway, the overall layout may substantially differ. In fact, it mainly depends on the applied motion transmission and power conversion technologies, as proved by the PB3 PowerBuoy and the Uppsala wave energy converters, among others. The first device, with a nominal power equal to 3 kW, was developed by the Company “Ocean Power Technologies” and recently deployed off the New Jersey coastline, under the US Navy “Littoral Expeditionary Autonomous PowerBuoy (LEAP) Program”. It consists of a floating buoy with spar-type configuration and a damping heave plate on the bottom, connected to the seabed by means of mooring lines [19]. The plate maintains the spar in a stationary position, while the relative motion of the floating buoy drives a mechanical system that converts the linear motion into a rotary one, moving an electrical generator and producing electricity. The second device, with a nominal power of 10 kW, was developed by the Uppsala University and widely tested in open sea conditions at the Lysekil research site on the Swedish west coast. It mainly consists of a floating buoy connected, by means of a tensioned line, to a gravity-based foundation, lying on the seabed and equipped with a permanent magnet linear generator, converting the heave motion into electricity [20].
The conversion of wave energy into electrical power can be performed by means of commonly applied technologies, such as linear or rotary electrical generators, the latter in conjunction with oil-hydraulic transformer units [21]. In this respect, in the last decade several research activities have been also performed to optimize the PTO layout and maximize the power production, by means of active control techniques, such as latching or unclutching [14]. They are mainly based on putting the device velocity in phase with the incoming wave one by: (i) holding the floater at its extreme excursion and releasing it before the incoming wave occurs or (ii) switching on/off the PTO system [22]. Furthermore, different speed control techniques have been also investigated for oil-hydraulic PTO units, to minimize spring, oscillatory and transient effects due to valve operations, which could lead to possible damages of pipelines, pumps and accessories [23]. Finally, permanent magnet linear generators have been widely studied at Uppsala University [24], that deployed more than 10 WEC devices at the Lysekil site since 2006, to optimize the whole system and decrease the unit production costs.
Finally, a new point absorber type, with a fully submerged mass, has been recently proposed and investigated [3,12,25,26], to increase the power production by phase control. The method mainly consists of shifting the device heave natural frequency towards the incoming wave one, so that the WEC operates at near-resonance conditions. In this respect, several geometries have been also investigated [9], to increase the floating buoy hydrodynamic efficiency and maximize the power production. Hence, starting from actual state of art, in current analysis a new cost-based design and selection procedure of point absorber devices is outlined and applied based on the following main design data:
- (i)
- The WEC device consists of a floating buoy, with a bullet-type configuration, plus an optional fully submerged mass, connected by means of a tensioned line to a PTO unit, lying on the seabed and equipped with a gravity-based foundation;
- (ii)
- The PTO consists of a direct driven permanent magnet linear generator, modelled in the frequency domain by an additional damping and a spring stiffness;
- (iii)
- Phase control is applied, to properly tune the device heave natural frequency, maximize the power production and minimize the LCoE, with reference to dominant sea states at candidate deployment sites.
Finally, a preliminary cost analysis is also performed before carrying out the optimization procedure, to evaluate the incidence of buoy geometry and WEC size on capital, maintenance and decommissioning costs.
3. Method
3.1. Hydrodynamic Model
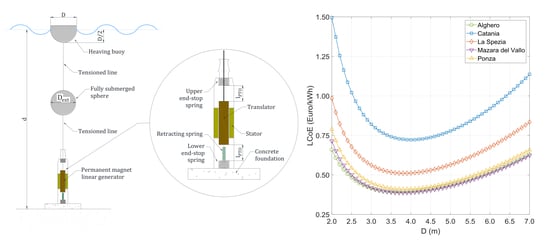
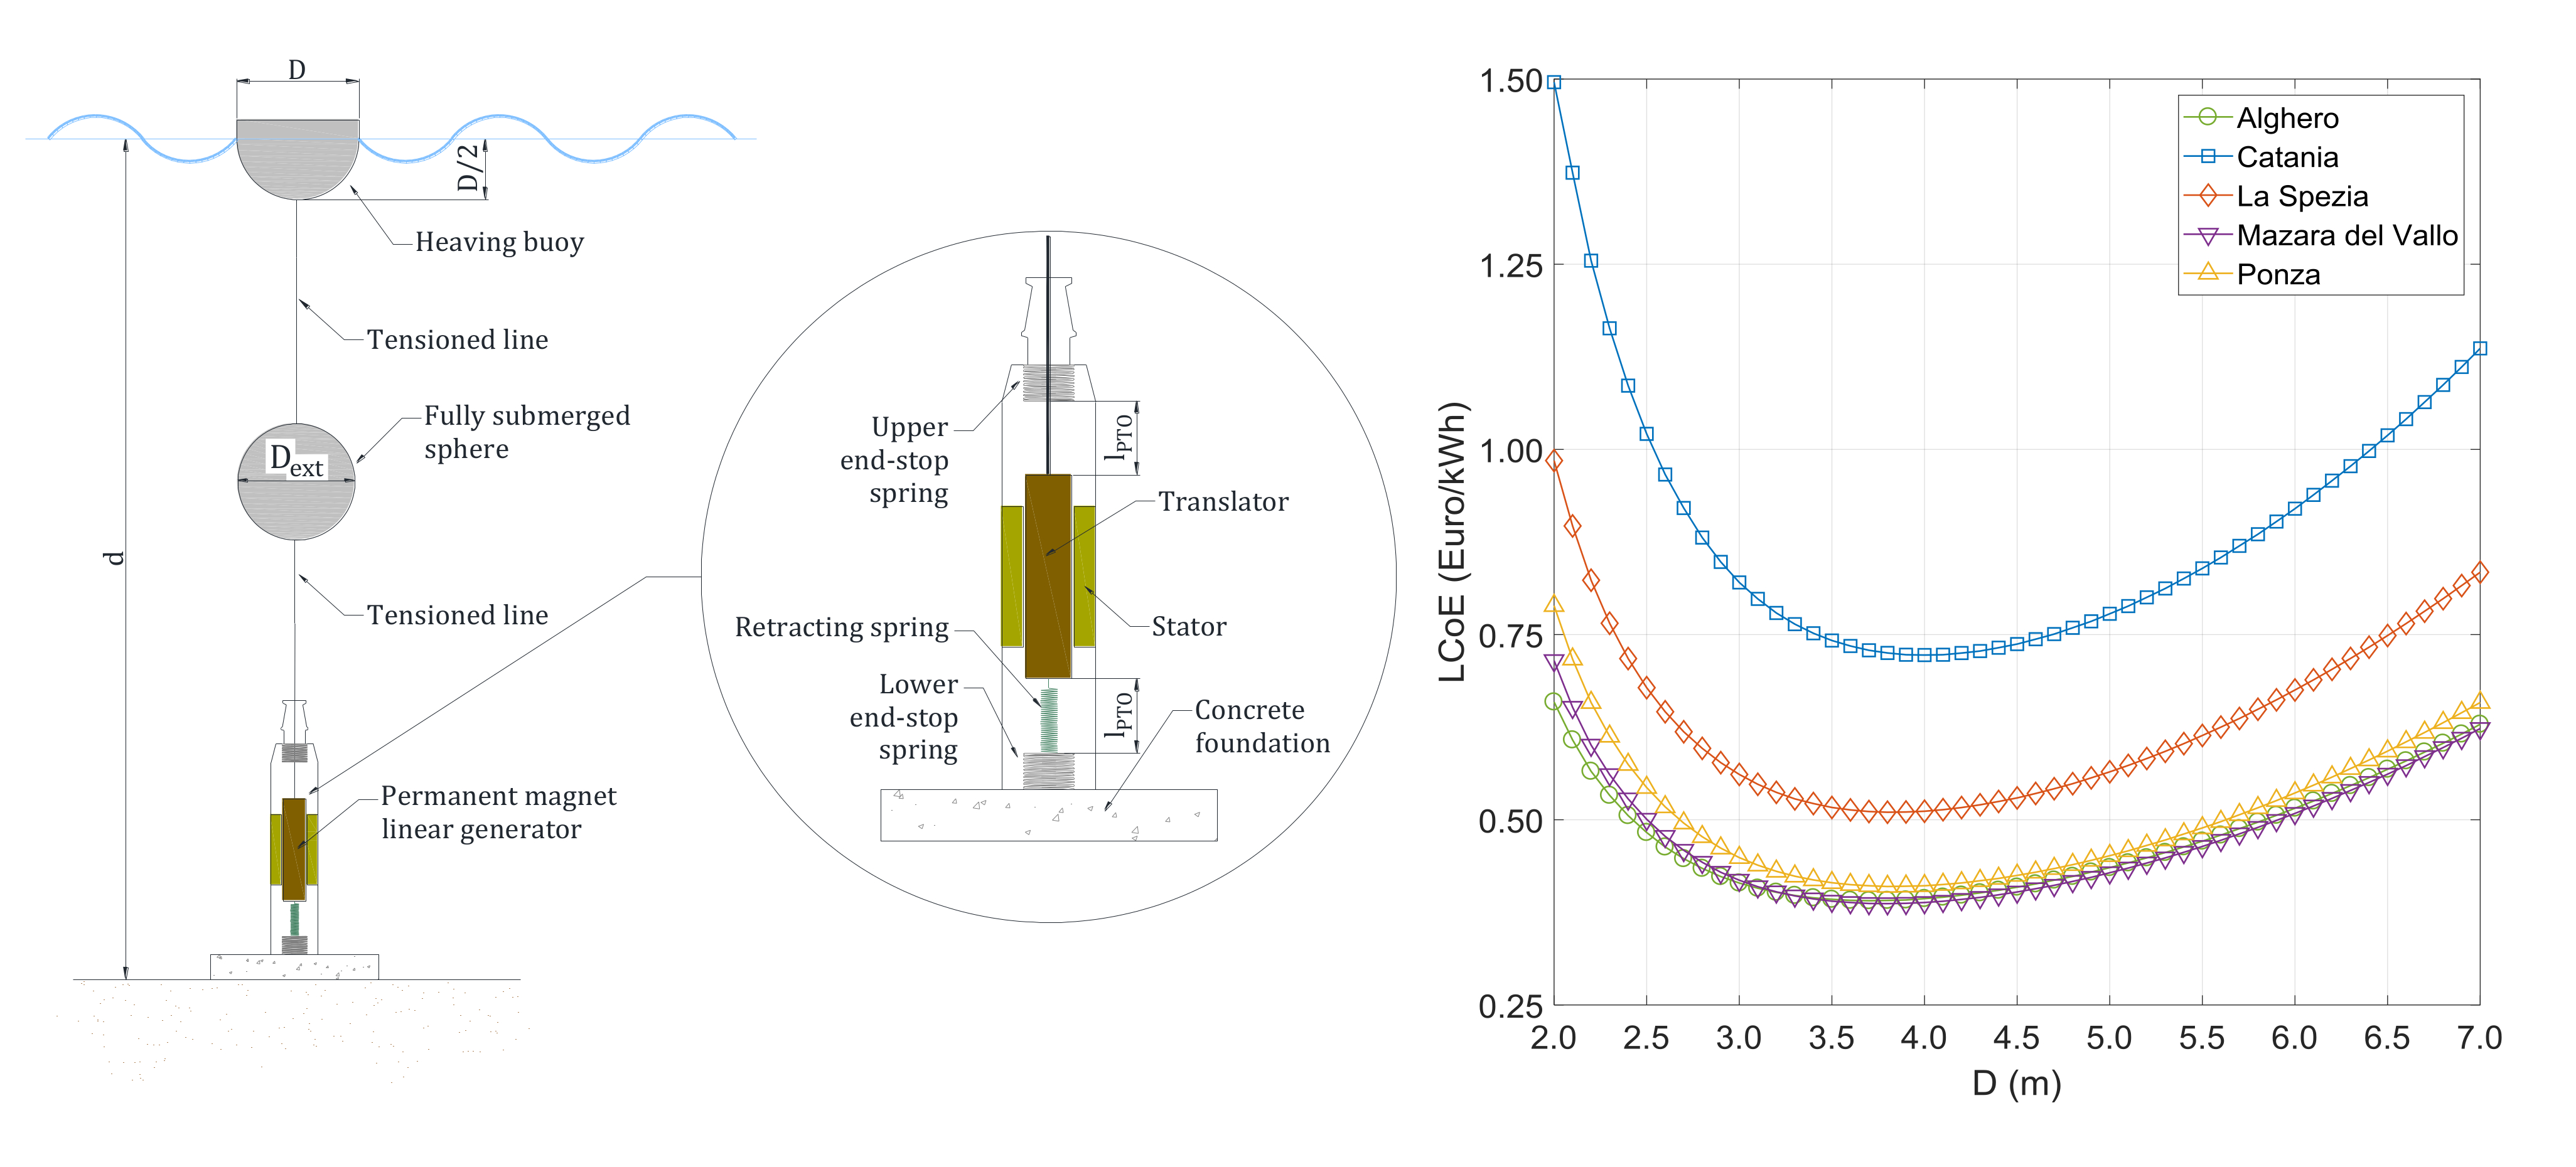
The point absorber, consisting of a floating buoy and an additional fully submerged mass as depicted in Figure 1, is connected by means of a tensioned line to a three-phase permanent magnet linear generator. It lies on the seabed and converts the relative motion between the stator and translator into electricity. The floating buoy is characterized by a bullet-type configuration, consisting of a submerged hemisphere with diameter , and a cylindrical body above the water line with height equal to 20% of relevant diameter. The fully submerged body, having a sphere-shaped configuration with diameter , allows properly tuning the device heave natural frequency, so that wave power extraction is maximum. In this respect, it must be pointed out that it allows increasing the heave mass, without varying the radiation damping and the heave exciting force of the floating buoy, if the draught of the fully submerged mass is sufficiently high, i.e., at least five times its diameter [26].
Besides, the permanent magnet linear generator provides additional damping and restoring stiffness , as further discussed in Section 3.2. The former mainly depends on the magnetic flux generated in the coils on the oscillating mass, the latter is required to keep tensioned the connection rope with the heaving buoy when the actuator moves downwards. Hence, the point absorber is modelled as a linear mass-spring-damper system in the frequency domain [3]:
having denoted by: (i) and the floating buoy mass and heave added mass respectively; (ii) the additional mass provided by the fully submerged sphere; (iii) the floating buoy radiation damping; (iv) the restoring stiffness and (v) the heave exciting force per unit wave amplitude . Based on Equation (1), non-linear heave drag forces, exerted by the floating buoy and the fully submerged mass, are not considered, provided that the WEC device is modelled as a linear mass-spring-damper system in the frequency domain [3,9,12,13]. If time-domain analysis is performed, non-linear drag forces can be simply added in the hydrodynamic model, as carried out by Lok et al. [27], among others. Nevertheless, the incidence of drag forces on power production is expected to be moderate and less than 5%, as gathered by a preliminary comparative analysis between frequency and time-domain codes. Based on current results, the frequency domain model reveals to be suitable at least in the preliminary design phase, when several alternative configurations need to be investigated and compared, in order to detect the optimum one for the candidate deployment site. Besides, the heave added mass and radiation damping are determined according to the theoretical solution provided by Hulme [28] for a floating hemisphere, while the heave exciting force per unit wave amplitude is assessed in compliance with the numerical solution provided by Chen et al. [29]. Hence, the heave motion of the floating buoy is determined as follows:
having denoted by the heave motion transfer function:
whose modulus is the response amplitude operator () of the WEC device. Finally, it is noticed that the additional mass provided by the fully submerged sphere is the sum of the displaced water and the heave added mass [30].
3.2. Permanent Magnet Linear Generator Model
As previously said, the three-phase permanent magnet linear generator is modelled in the frequency domain by a constant damping and a spring stiffness . The former is related to the electromechanical force exerted by the PTO, the latter is required to keep tensioned the connection line with the floating buoy during the downward motion of the translator mass. Hence, assuming that the inductive impedance of the generator equivalent circuit is negligible, as regards the resistive one in the range of wave frequencies [31], the damping exerted by any of the three coils can be easily determined. In fact, it mainly depends on: (i) the voltage , generated by Faraday’s law and opposite to the magnetic flux first time derivative; (ii) the circuit external resistance and (iii) the translator velocity , according to the following equation [32]:
If full overlap between translator and stator areas exists, the magnetic flux generated by each coil connected in parallel is a sinusoidal function of the translator vertical position [33], so that the total damping coefficient is the sum of three terms, each one with the same sinusoidal pattern and a phase leg equal to :
In Equation (5) is the generator polar pair width, namely the distance between one north pole to the next on the translator mass, and is the magnetic flux amplitude [33]. It depends on: (i) the magnetic field in a tooth ; (ii) the tooth width ; (iii) the width of stator side ; (iv) the total number of poles ; (v) the winding ratio and (vi) the number of cables in a slot . Hence, denoted by the linear generator reactive resistance, the electrical efficiency is determined as follows in order to account for copper/eddy current and hysteresis power losses [20,34]:
Finally, if partial overlapping between translator and stator areas occurs, a drop-off of the PTO damping, is caused [35]. Nevertheless, in current analysis the PTO damping dependence on the translator mass vertical position is not considered, provided that the Equation (1) would become non-linear and the frequency domain analysis would be no more applicable. Anyway, the negligence of this dependence does not significantly affect the analysis as, when partial overlapping occurs, the translator mass hits the upper/lower end-stop springs, with a drop-off of the instantaneous vertical velocity and, consequently, of the vertical force exerted by the PTO on the wave energy converter.
3.3. Power Production Assessment
In order to properly assess the WEC power production, relevant operational profile needs to be preliminarily assessed. In fact, beyond a certain sea state the device shifts to a survival mode, to avoid possible damages to the PTO system and excessive slamming loads, due to harsh weather conditions [36,37]. Based on previous studies, devoted to the hydrodynamic optimization of point absorbers with hydraulic PTOs [12], the maximum significant wave height is set equal to 3 m. This value allows achieving a good availability of the WEC device at the candidate deployment site, as further discussed in Section 6.2. Hence, the yearly available energy in kWh is determined on the basis of wave statistics at the deployment site, according to the following equation [9,37,38,39]:
having denoted by: (i) the probability of occurrence of the sea state obtained by combining the significant wave height with the peak period ; (ii) the wave group celerity and (iii) the wave spectrum. As concerns the point absorber power production, it is mainly limited by the linear generator free stroke length. In fact, when the translator mass hits the upper or lower end-stop springs, a sudden drop-off of the instantaneous velocity occurs that affects the power conversion. Hence, the choice of the most suitable stroke length is quite challenging and would be performed on the basis of a cost/benefit analysis [40], as further discussed in Section 6.1. In fact, a longer stroke requires a taller WEC, with increased economical and mechanical issues, while a shorter stroke may limit too much the power production. Hence, in current analysis the Annualised Energy Production (AEP) in kWh, with reference to a total amount of 8760 h in one year, is assessed by the following equation, that accounts for the heave motion restraint provided by the PTO unit, as further discussed in the Appendix A:
In Equation (8) is the upper/lower stroke length, namely the free spacing between the translator mass and the upper/lower end-stop springs, while the corrective function is discussed in the Appendix. Finally, the point absorber capacity factor , namely the ratio of effective to theoretical energy at rated power during one year, is determined. In this respect, it must be pointed out that electrical production is not significantly affected by the PTO rated power, as permanent magnet linear generators are capable of enduring long and short term overloads up to 5 and 10 times the rated power respectively. Particularly, long term overloads are mainly due to the most extreme wave conditions at the deployment site, while the short term ones are due to the sudden peaks of the translator’s instantaneous velocity, resulting from steep wave fronts [20].
Finally, it must be pointed out that Equation (8) furnishes the of the WEC device with no control strategy of the heave motion, provided that current research focuses on the selection of optimum buoy dimensions that allow to minimize the LCoE, depending on met-ocean conditions at the deployment site. Nevertheless, it is predictable that the expected power production can be further increased if the proper motion control strategy is applied, as investigated by Belmont [41] and Ringwood et al. [42], among others. In this respect, the average power output of the WEC device can be increased by simple control strategies, by determining the optimum velocity profile of the WEC device as a frequency-dependent function of the heave excitation force, or by more refined predictive control methods, such as latching or declutching among others.
3.4. Levelised Cost of Energy Assessment
The represents the most important factor to efficiently compare different energy sources and evaluate the economic feasibility of new investments in the renewable energy sector. It accounts for capital, operating and decommissioning costs, experienced from the preliminary design up to the end of the power production plant lifetime. It is mainly based on the “present value” approach that relates the risk perceived by the investors to the rate of return of the investment. Hence, projects perceived by the investors as having a high overspend risk, or a lower than predicted revenue, require a high rate of return to become attractive on the international market. Assuming that the yearly maintenance costs are constant during the plant lifetime, the is determined according to the following formula [9]:
having denoted by: (i) , and the ratios of capital, decommissioning and annual operating costs to the device rated power in €/kW; (ii) the discount rate; (iii) and the device expected lifetime and capacity factor, respectively. As concerns the capital costs, they are mainly related to material and manufacturing expenses required for assembling the linear generator and the floating buoy with the fully submerged mass. As concerns the linear generator, the translator is provided with Neodymium–Iron–Boron magnets, mounted on a steel plate between aluminium spacers, while the stator is made of non-oriented laminated electrical steel, with thin insulating coating to reduce eddy current losses [20].
In this respect, it must be pointed out that the unit cost of rare earth materials continues to show stability since the peaks of August 2011, caused by the high mismatch between supply and demand, coming from the high and clean technology sector. Besides, the re-design of many products, to reduce or eliminate the usage of rare earth materials, as well as the increased recycling efforts and the openings of new rare earth ore mines around the world, contributed to put downward the pressure on pricings in the last few years.
As concerns the stator winding, it is made of standard cables with circular cross-section, that can be purchased at relative low prices on the international market. Besides, the concrete foundation is realized by sea-water resistant materials, whose unit price on the international market is about twice higher than the one of ordinary materials used in the civil building sector. Furthermore, manufacturing costs are assessed on the basis of the average hourly total pay for a specialized assembler, inclusive of social and insurance fees [43]. Finally, the floating buoy and the fully submerged mass are assumed to be realised in normal strength steel, with a unit cost equal to 4 €/kg [42]. Hence, based on a comprehensive analysis of current prices on the international market, Table 1 reports the unit prices of the most significant item costs for the analysed WEC device, together with the expected range. In this respect, it must be pointed out that the unit cost of fabricated steel is assumed equal to 4 €/kg [44], even if a reduction up to 3 €/kg is certainly achievable, as suggested by Stansby et al. [45] on the basis of the 2016 UK construction rates for fabricated steel. Nevertheless, in current analysis the upper bound value of the unit cost range for fabricated steel is assumed on safe side, provided that it includes all manufacturing expenses that are characterized by a great variability on the international market.
As concerns the decommissioning expenses, it is assumed that both the linear electric generator and the floating buoy are not reusable, but rather recycled and sold for scrap. Hence, in current analysis decommissioning costs are taken equal to 20% of the capital ones, on safe side, provided that they have not been experienced for wave energy plants and a correct estimate is still challenging. Similarly, annual operating expenses are assumed equal to 5% of capital costs, which is a reasonable value for wave energy converters [9].
4. Main Data for Cost-Based Design
4.1. Selection of Candidate Deployment Sites
During the last years, several studies were performed to assess the wave energy potential in the Mediterranean Sea, along the Italian coastlines. Really, its wave climate is quite mild, if compared to the Atlantic Ocean, off the Spanish coastlines, and the North Sea. Nevertheless, it still represents an attractive choice for possible deployment of WEC devices. In fact, it is predictable that all technical issues, mainly related to the WEC survival in extreme sea state conditions, can be more easily solved, so that the power production is expected to be competitive, in terms of LCoE, on the international market [46]. Particularly, the most energetic sites are located in the Tyrrhenian Sea at Alghero, off the western coast of Sardinia, while the mean wave energy decreases in the Ionian and Adriatic Seas. Nevertheless, as highlighted by Liberti et al. [46], the mean wave power alone is not sufficient to identify the most promising areas for possible deployment of wave arrays. In fact, it arises from the contribution of individual sea states, distributed over a wide range of wave heights, periods and directions, so that contributions due to most energetic sea states cannot be efficiently harnessed, since relevant exploitation requires an over-sized WEC device.
Based on previous remarks, in current analysis five candidate locations are selected in the Mediterranean Sea along the Italian coastlines, as depicted in Figure 2. Besides, Table 2 reports: (i) the coordinates of candidate deployment sites; (ii) the JONSWAP spectrum peak enhancement factor ; (iii) the mean and available wave power per unit length of wave front. Particularly, the mean wave power accounts for all sea states at the deployment site, each one with a certain probability of occurrence. The available wave power per unit length, instead, accounts for all environmental conditions up to the cut-out sea state, corresponding in current analysis to a significant wave height equal to 3 m, as discussed in Section 3.3. Really, this parameter reveals to be very effective, as only part of the available wave power at the deployment site can be effectively harnessed, depending on the WEC operational profile. In fact, beyond the cut-out sea state the WEC device switches to the survival mode and the power production is stopped. Finally, the JONSWAP spectrum peak enhancement factor is site-dependent, as it ranges from 1.84 up to 2.20 with reference to the five candidate sites. In all cases, wave data were taken from the website of the Italian governmental institution ISPRA, namely “Istituto Superiore per la Protezione e la Ricerca Ambientale”.
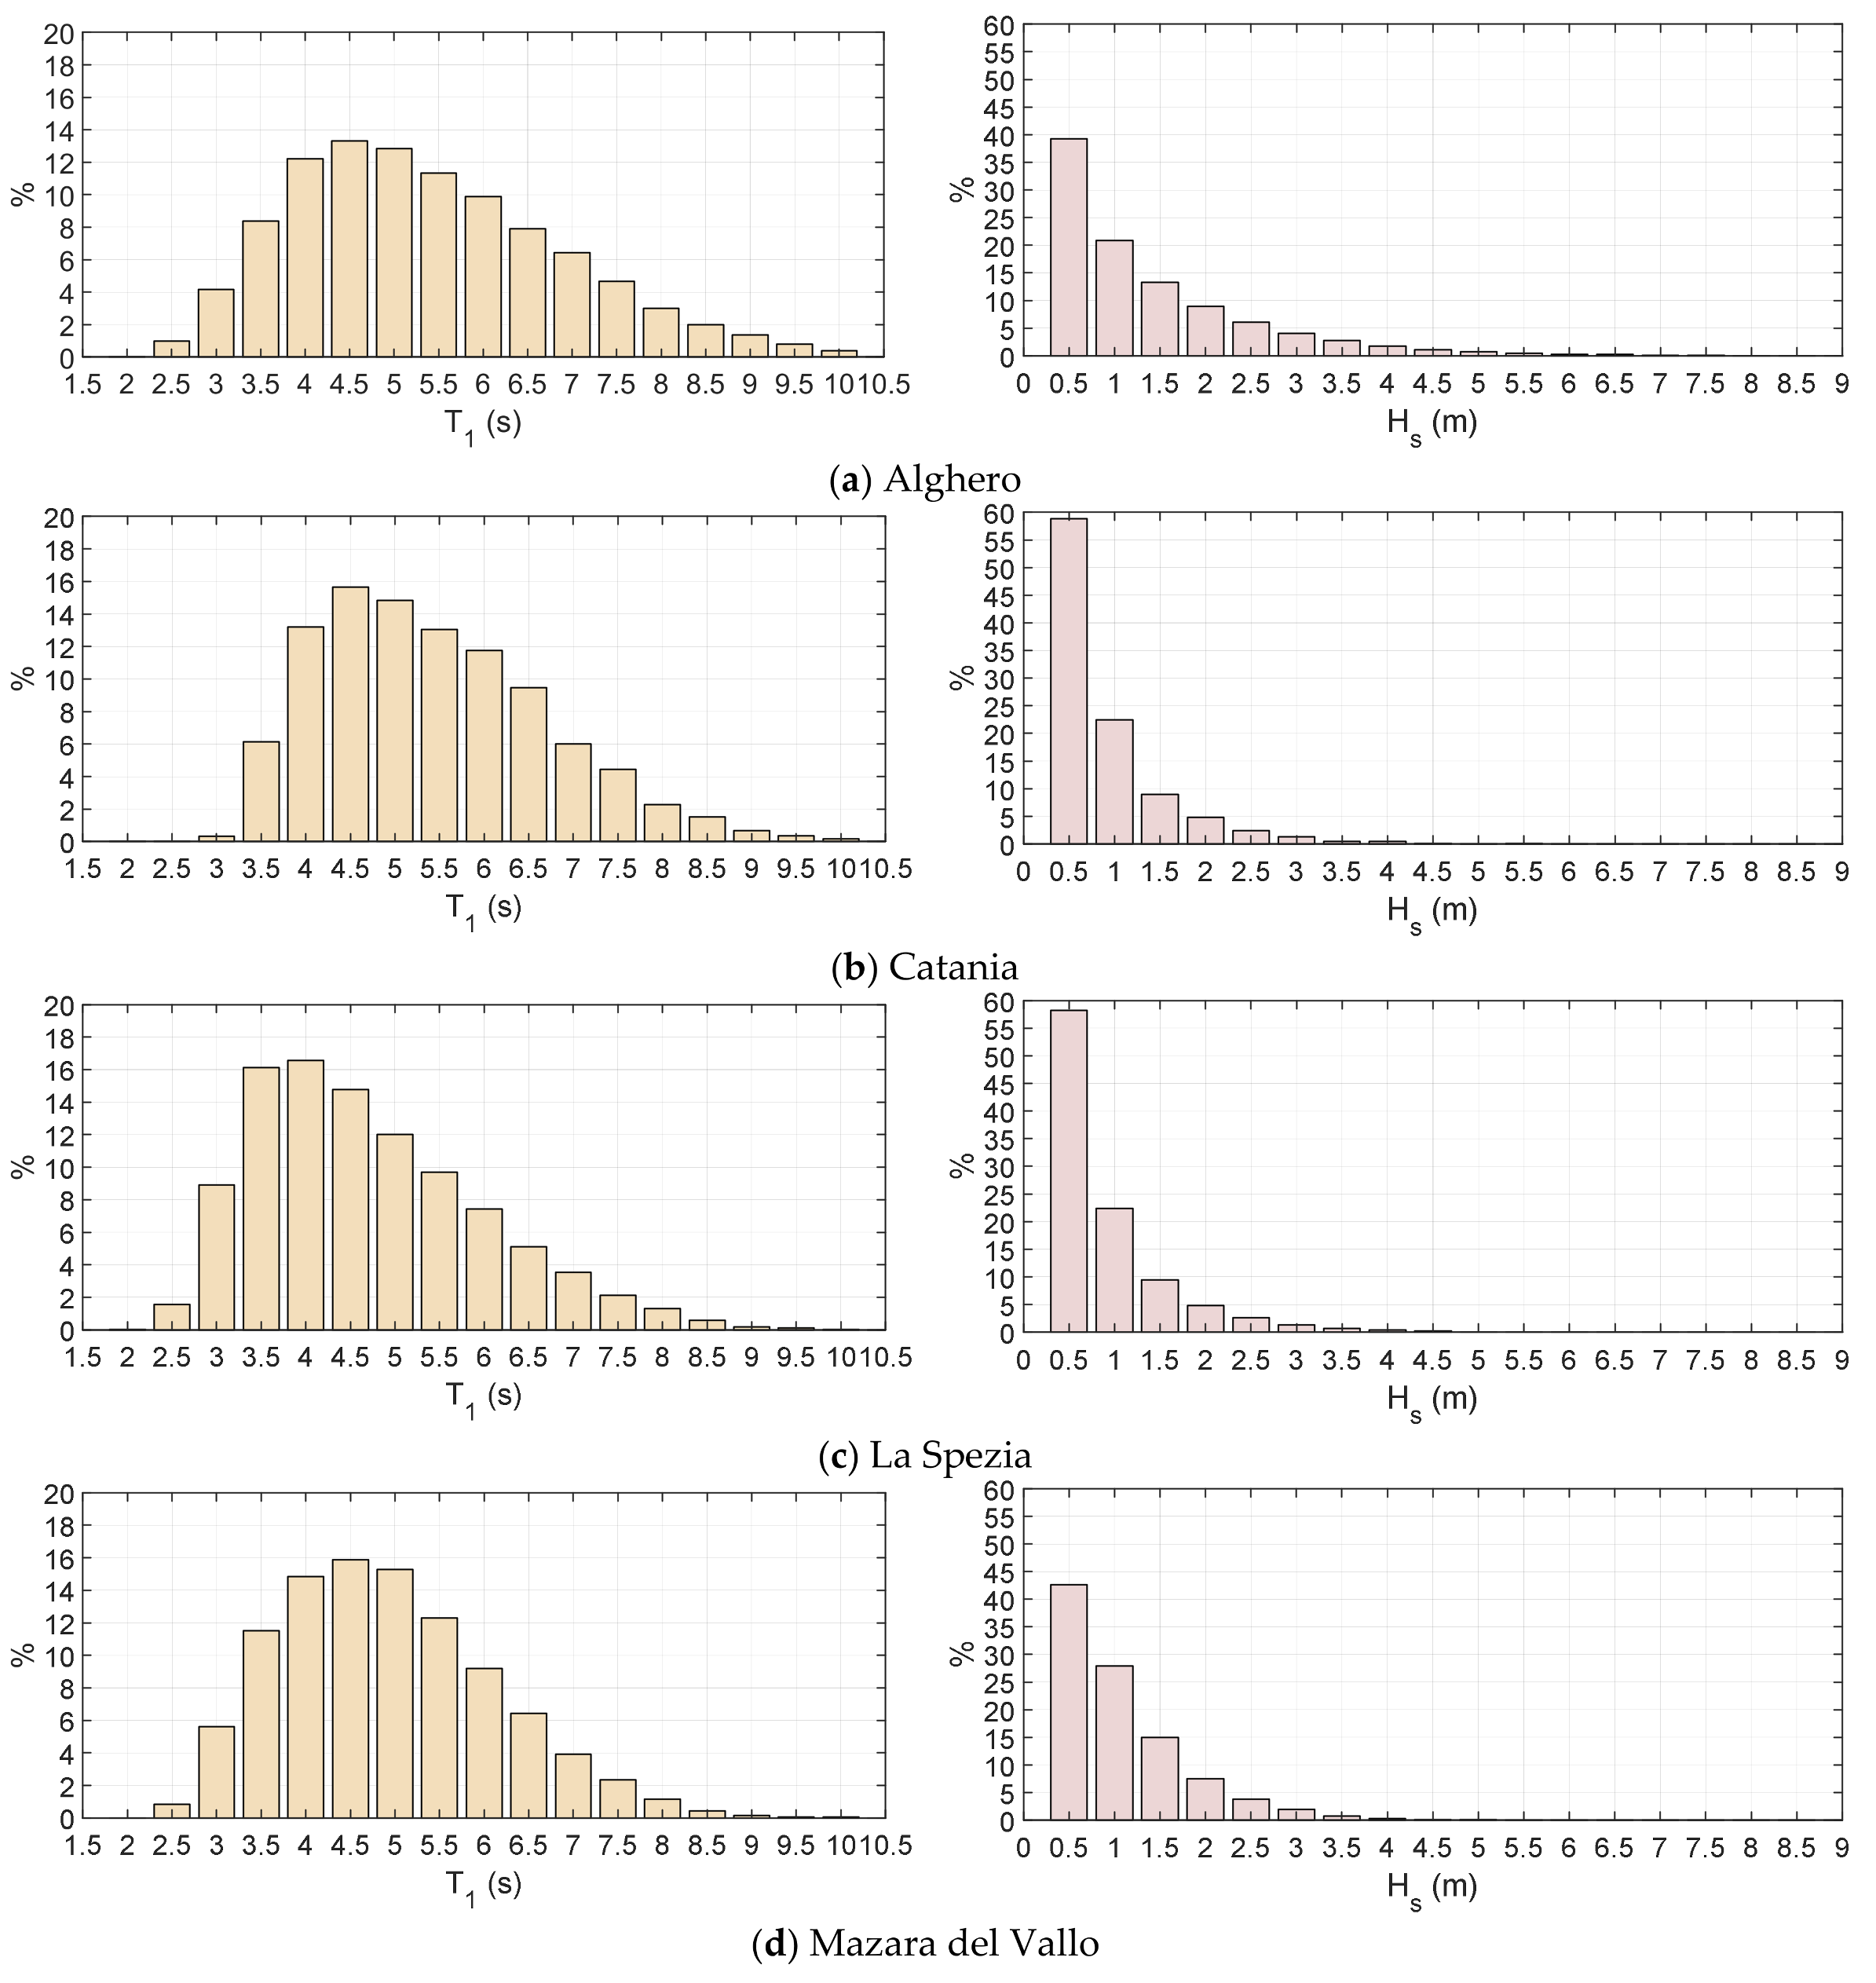
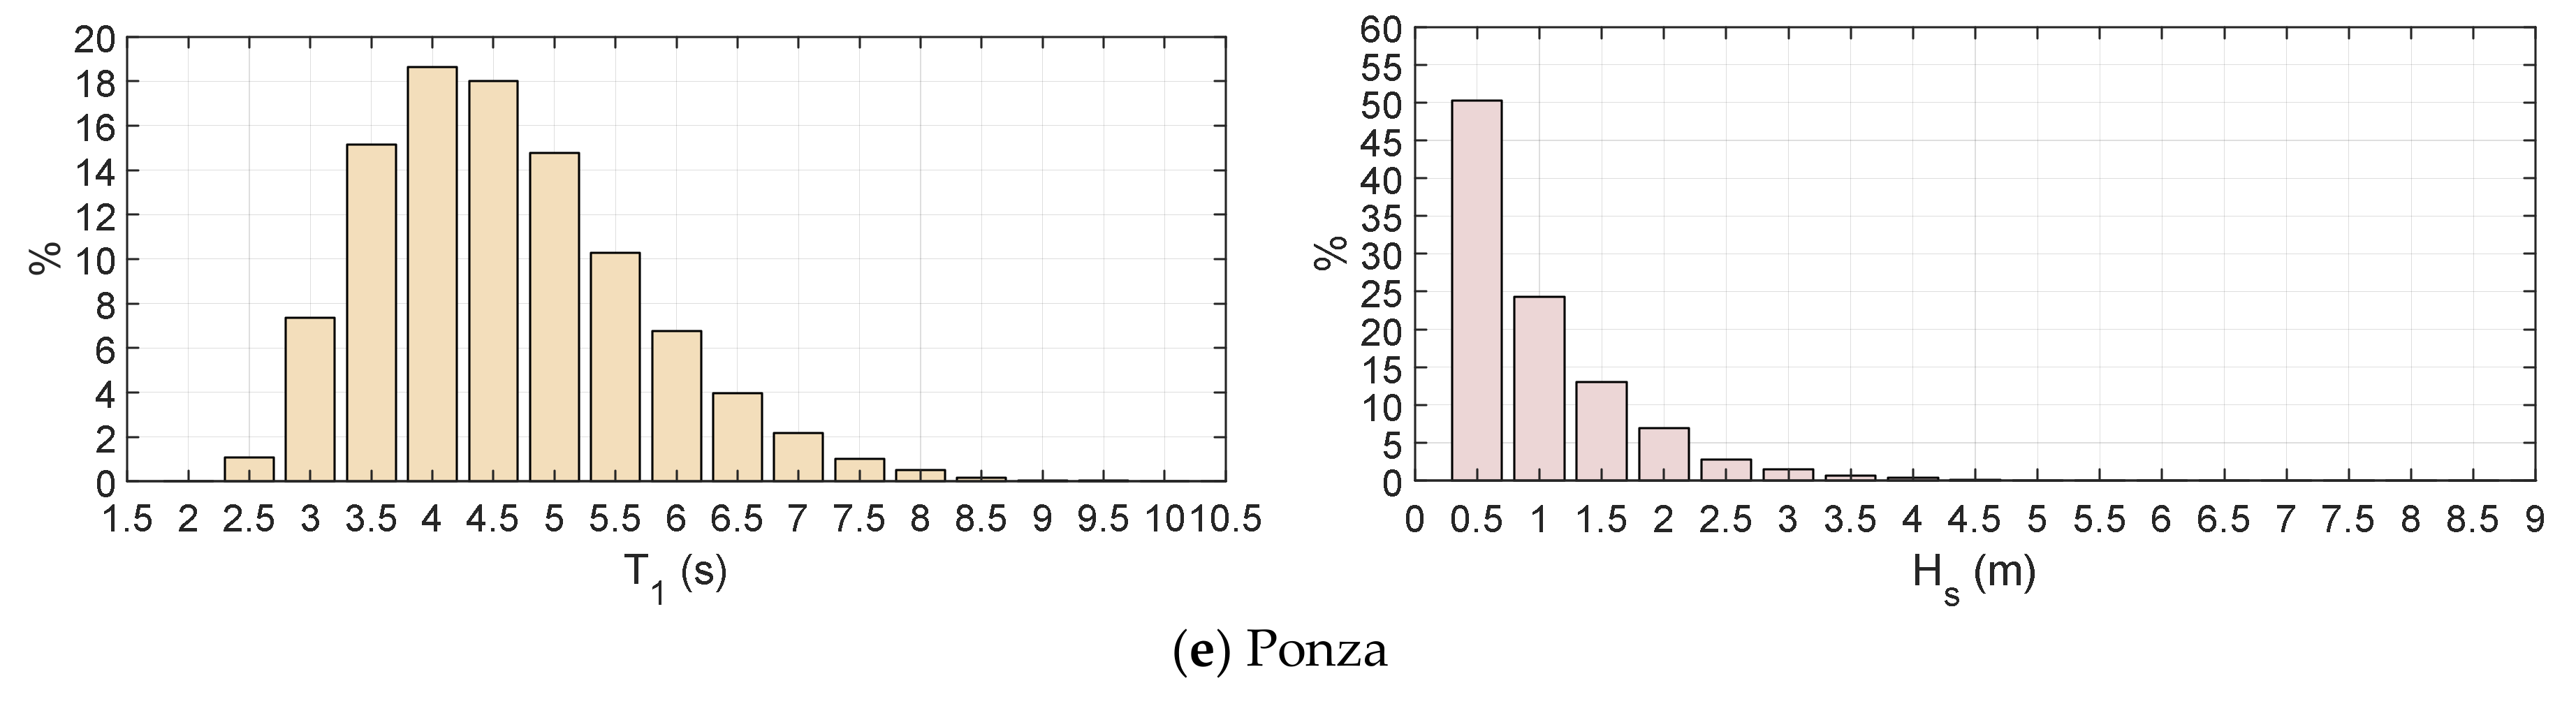
Based on the data reported in Table 2, Alghero is the most promising site, with a mean wave power per unit length of wave front equal to 12.53 kW/m. On the contrary, the remaining candidate sites, which are characterized by a lower wave energy potential ranging from 2.58 up to 5.25 kW/m, seem to represent a less attractive choice. Nevertheless, if the comparative analysis is performed on the basis of the available power up to 3 m significant wave height, the previous gap consistently reduces in favour of less energetic sites. Hence, the main outcomes of Liberti et al. [46] are confirmed, provided that the only mean wave power per unit length of wave front is not sufficient to compare different deployment sites, if the WEC operational profile is not taken into due consideration. Finally, wave histograms are reported in Figure 3, based on 0.5 s and 0.5 m mean wave period and significant wave height classes, respectively. It is noticed that is the ratio of 0-order to 1-order sea state spectral moments [47].
4.2. Capital, Maintenance and Decommisioning Costs
As discussed in Section 3.4, capital costs are mainly due to the linear generator and the floating buoy. In current analysis a 10 kW linear generator, with a mechanical damping and a spring stiffness equal to 23.75 kNs/m and 6.20 kN/m respectively [48], is assumed as a reference PTO unit. Relevant data are listed in Table 3, while Table 4 reports the list of material and manufacturing costs. Particularly, Table 3 reports all quantities required to assess the mechanical damping and the electrical efficiency of the permanent magnet linear generator based on Equations (5) and (6). In this respect, it provides: the magnetic field in a tooth , the width of stator side , the total number of poles , the winding ratio , the number of cables in a slot , the resistive load and the generator polar pair width . As concerns the manufacturing costs reported in Table 4, Danielson et al. [48] provide all material quantities required for the 10 kW generator, while the weight of the concrete foundation is assumed equal to 35 ton, corresponding to 15 m3 [24]. Finally, the total manufacturing effort, required for assembling the permanent magnet linear generator, is assumed to be about 100 h, even if some cost reductions are achievable in view of a PTO mass-production. According to the data reported in Table 4, the base-cost of the 10 kW linear generator is equal to about 25 k€, even if other expenditure items, mainly related to the profit of the manufacturing plant and additional expenses for minor mechanical parts, are likely to occur. Nevertheless, as point absorbers are still in a pre-commercial phase, it is quite challenging to carry out a reliable estimate of these additional cost items. Hence they are roughly assumed equal to 20% of the base-cost that, in turn, increases up to 35 k€. As concerns the cost of the floating buoy and the fully submerged mass, it is determined on the basis of the following assumptions: (i) all structures are made of 10 mm normal strength steel; (ii) the weight of the internal reinforcements is equal to 30% of the external platings’ one, which is a typical value for structures with spar-type configuration.
Finally, the deployment costs are equal to 5 k€, which is a reasonable value for chartering of small tug boats and barges, as there is no need for the employment of more expensive units, such as anchor handling vessels. Finally, decommissioning and annual operating costs are determined as a fraction of capital expenditures, in conjunction with a 7% discount rate and a 25-year lifetime of the WEC array [49], as listed in Table 5, where main data for the assessment of are reported.
5. Results
5.1. WEC Sizing without the Fully Submerged Mass
Optimum dimensions of the floating buoy at the deployment sites listed in Table 2 are preliminarily assessed without the fully submerged mass. Figure 4 reports the distribution versus the buoy diameter at the candidate deployment sites, varying the buoy diameter in the range from 2 up to 7 m. In all cases, the curves are characterized by a left descending and a right ascending branch. Main data of optimum configurations are further detailed in Table 6. Based on current results, it is gathered that: (i) maximum power production occurs at Alghero and Mazara del Vallo, where the is equal to about 0.60 €/kWh; (ii) the energy production cost increases by about 10% and 25% at Ponza and La Spezia respectively; (iii) the almost doubles at Catania, where a consistent decrease of power production occurs. As concerns the floating buoy dimensions, the diameter corresponding to the minimum LCoE is site-dependent and ranges from 3.7 m at Alghero up to 4.2 m at La Spezia.
5.2. WEC Sizing with the Fully Submerged Mass
Sizing of WEC devices is performed by adding the fully submerged mass, to properly tune the device heave natural frequency, on the basis of dominant sea states at the deployment site. The distribution versus the buoy diameter is plotted in Figure 5, while main data of optimum WECs are listed in Table 7. Hence, for each candidate configuration, the diameter of the fully submerged sphere is iteratively varied, with 0.1 m step, to detect for any dimension of the floating buoy, the optimum configuration, characterized by the minimum . Based on current results, the fully submerged sphere yields to a consistent increase of the and the WEC capacity factor. Besides, the optimum buoy diameter is equal to 3.8 m, with the only exception of Catania, where it is equal to 4.0 m. Concerning the fully submerged mass diameter, it lies in the range 3.7–4.2 m, depending on the dominant wave periods at the deployment site. Finally, from Table 7 it is also gathered that: (i) power production is comparable at Alghero, Mazara del Vallo and Ponza, where the is equal to about 0.40 €/kWh; (ii) the energy production cost increases by about 25% and 80% at La Spezia and Catania, respectively.
6. Discussion
6.1. Incidence of Fully Submerged Mass on Cost-Based Design
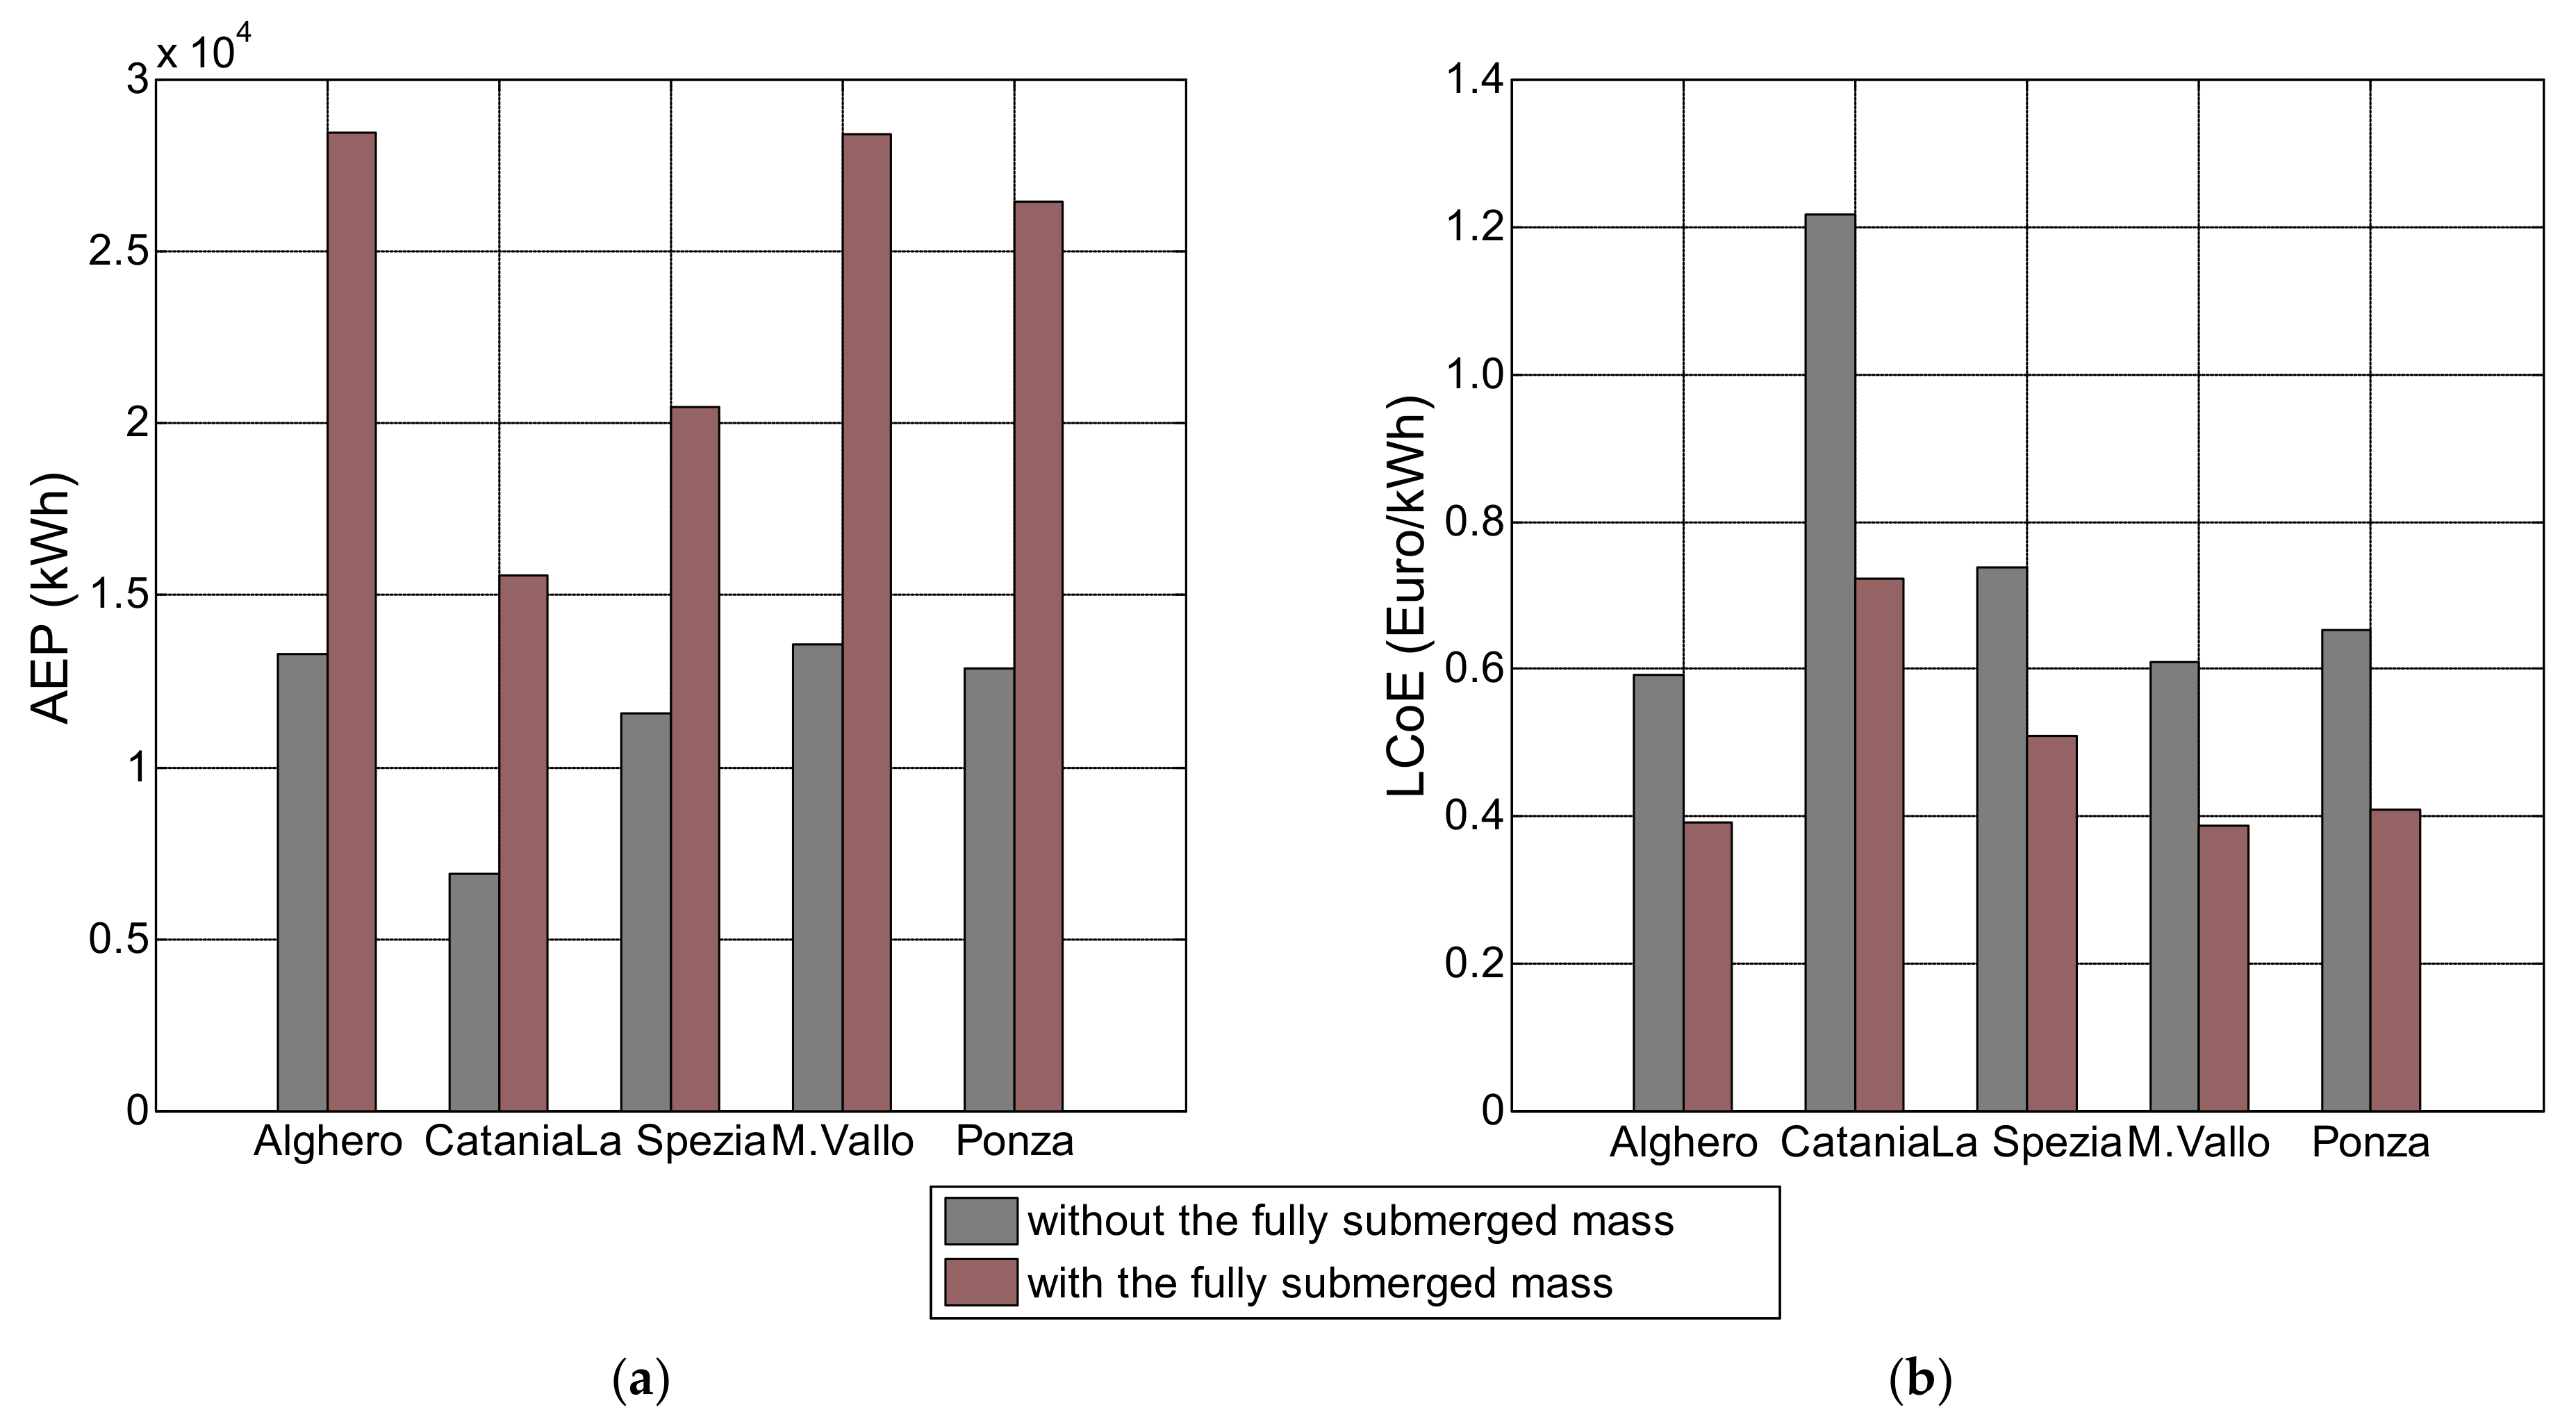
The incidence of the fully-submerged mass on the AEP and LCoE is preliminarily investigated. Figure 6a,b report the comparative analysis between the two WEC configurations, on the basis of the data listed in Table 6 and Table 7. Based on current results, the fully submerged mass allows to increase the AEP and decrease the LCoE. In fact, the almost doubles, while the decreases by about 30–40%, depending on the deployment site. This outcome is mainly due to the presence of the fully submerged mass, that allows properly tuning the device heave natural frequency, based on wave periods of dominant sea states at the deployment site. In this respect, the WEC device with the fully submerged mass operates closer to the resonance condition with the incoming waves, as regards the first configuration, so as a consistent increase of the AEP is gained. Nevertheless, the AEP increase is not counterbalanced by an equivalent decrease of the LCoE. This outcome is mainly due to the increase of capital costs, due to the fully submerged mass, as well as of operating and decommissioning expenses that, in turn, are expected to slightly increase as gathered from relevant values reported in Table 6 and Table 7.
6.2. PTO Free Stroke Length
Previous results show that power production can be consistently increased by adding a fully submerged mass to the floating buoy, that allows properly tuning the device heave natural frequency, with reference to dominant sea states at the candidate deployment site. Nevertheless, as discussed in Section 3.3, power production is mainly affected by the PTO free stroke length. In fact, in the most energetic sea states only part of the wave cycle is effective, provided that a sudden drop off of the instantaneous power production occurs, when the translator mass hits the PTO upper and lower end-stop springs. Hence, it is conceivable that if the PTO free stroke length increases, the AEP grows up, so yielding to a further decrease of the .
Assuming that the capital cost of the permanent magnet linear generator remains almost unchanged for small variations of the free stroke length, Figure 7 reports a comparative analysis between the of WECs without and with the fully submerged mass at Alghero. Particularly, the free stroke length ranges from 0.5 up to 2.0 m, with 0.5 m step. Based on current results, reported in Table 8 and Table 9, it is gathered that if increases from 0.8 m up to 2.0 m, the decreases by 8.6% and 40.7% for WECs without and with the fully submerged mass, respectively. This outcome is mainly due to the different operational profile of WEC devices. In fact it is overdamped without the additional sphere, while it operates at near resonance conditions if the fully submerged mass is provided. Hence, it is gathered that no variations of the PTO free stroke length are required for WECs without the fully submerged mass, as the expected decrease of is moderate. On the contrary, a new PTO design, with an increased free stroke length, can yield to a consistent decrease of for point absorbers equipped with the fully submerged mass.
6.3. WEC Operational Profile
It is well-known that survivability in extreme weather conditions represents a challenging issue for WECs [1,50] and that the selection of the most suitable survival mode mainly depends on the layout of the device and the PTO equipment [35]. In this respect, two different survival mode strategies can be applied. The former mainly consists of ballasting and submerging the floating buoy, so that no significant wave interactions occur; the latter is based on short-circuiting the permanent magnet linear generator [35], to increase its damping and reduce the heave motion amplitude of the WEC device. Nevertheless, independently of the selected survival mode, the choice of the “cut-out” sea state represents a basic issue for the reliable design of WEC devices, as both AEP and are affected by relevant operational profile.
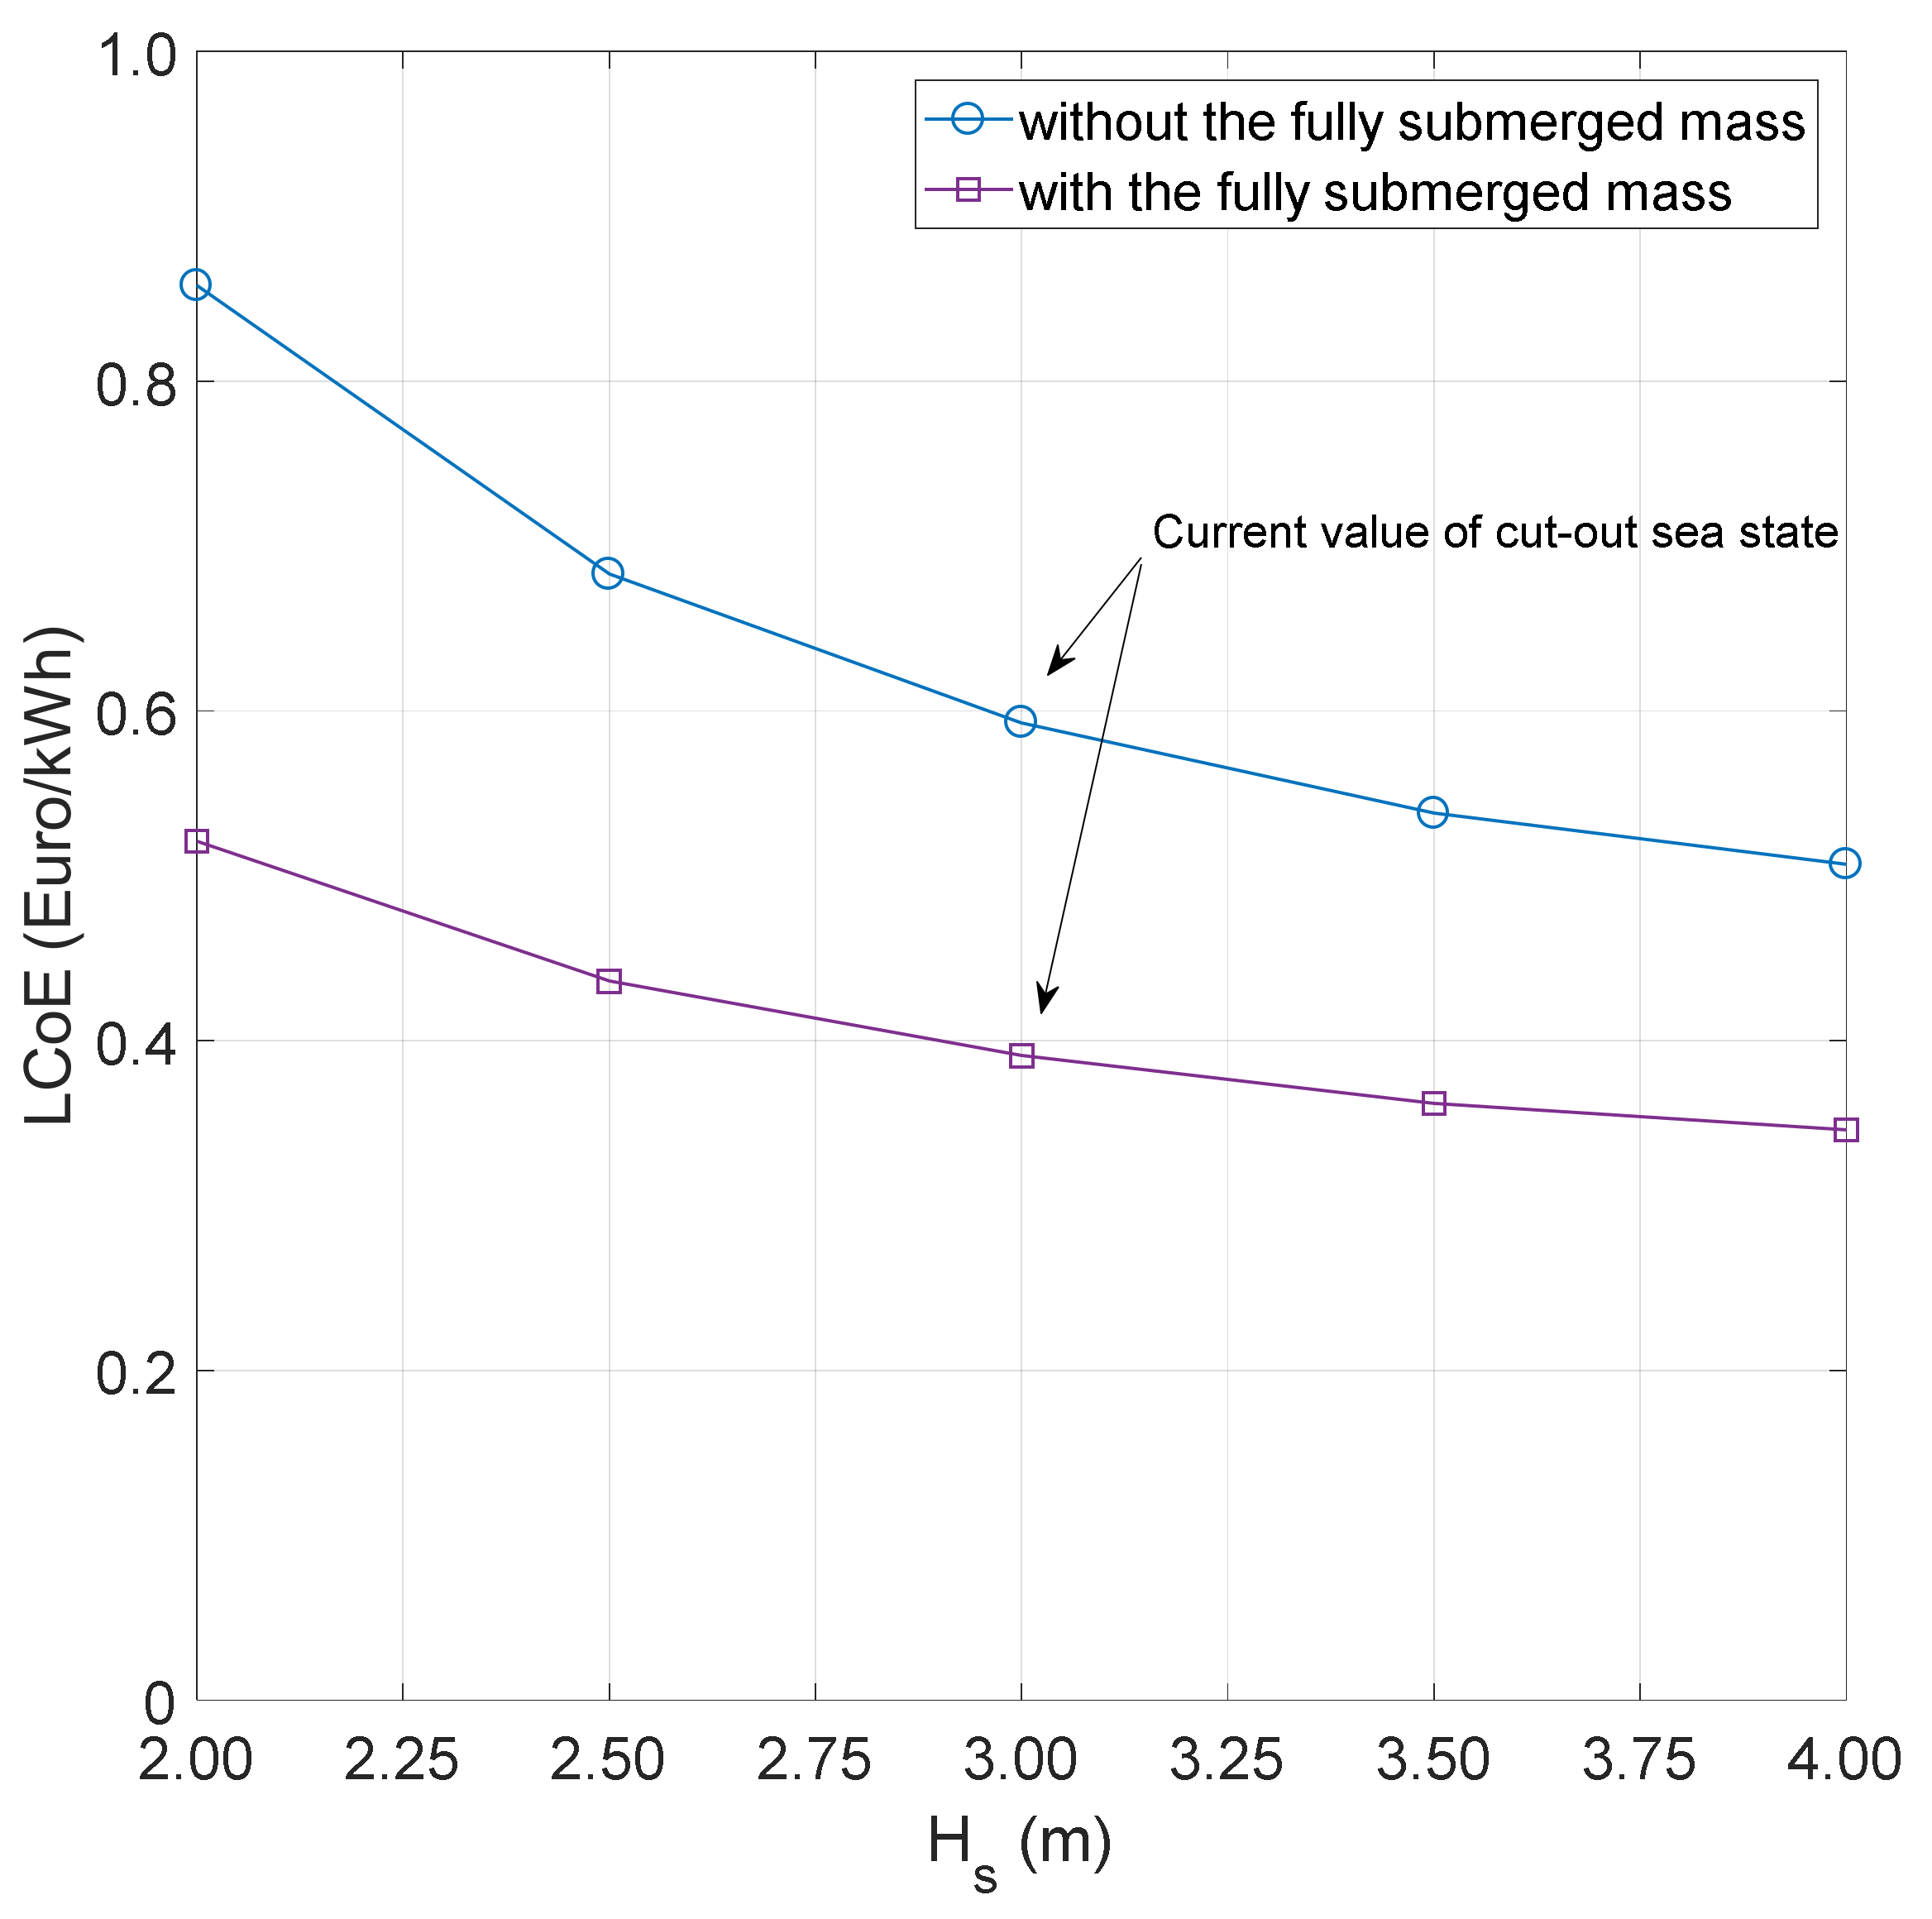
In the previous analysis, it was assumed that the point absorber switches to the survival mode when the significant wave height exceeds 3 m. Hence, Figure 8 reports a comparative analysis, in terms of , for WEC devices deployed at Alghero, where is varied in the range from 2.0 up to 4.0 m, with 0.5 m step. Current results, listed in Table 10 and Table 11, show that if increases from the design value of 3.0 m up to 4.0 m, the decreases by 14.5% and 11.5% for WEC devices without and with the fully submerged mass, respectively. On the contrary, the opposite holds true if decreases up to 2.0 m, so yielding to a corresponding increase of LCoE equal to 44.7% and 33.2% for the two WEC configurations. Current results confirm that the proper selection of the “cut-out” sea state represents a basic issue for the power production assessment. Really, it has to be selected in view of a proper balancing between the device availability and the occurrence of undesirable phenomena, such as slamming events, in harsh weather conditions. Hence, the 3 m “cut-out” sea state seems to be a reasonable choice at least for WEC devices deployed in the Mediterranean Sea.
6.4. Some Recommendations for WEC Design
Based on previous results, some recommendations for the preliminary design and optimization of the WEC device can be furnished:
- (i)
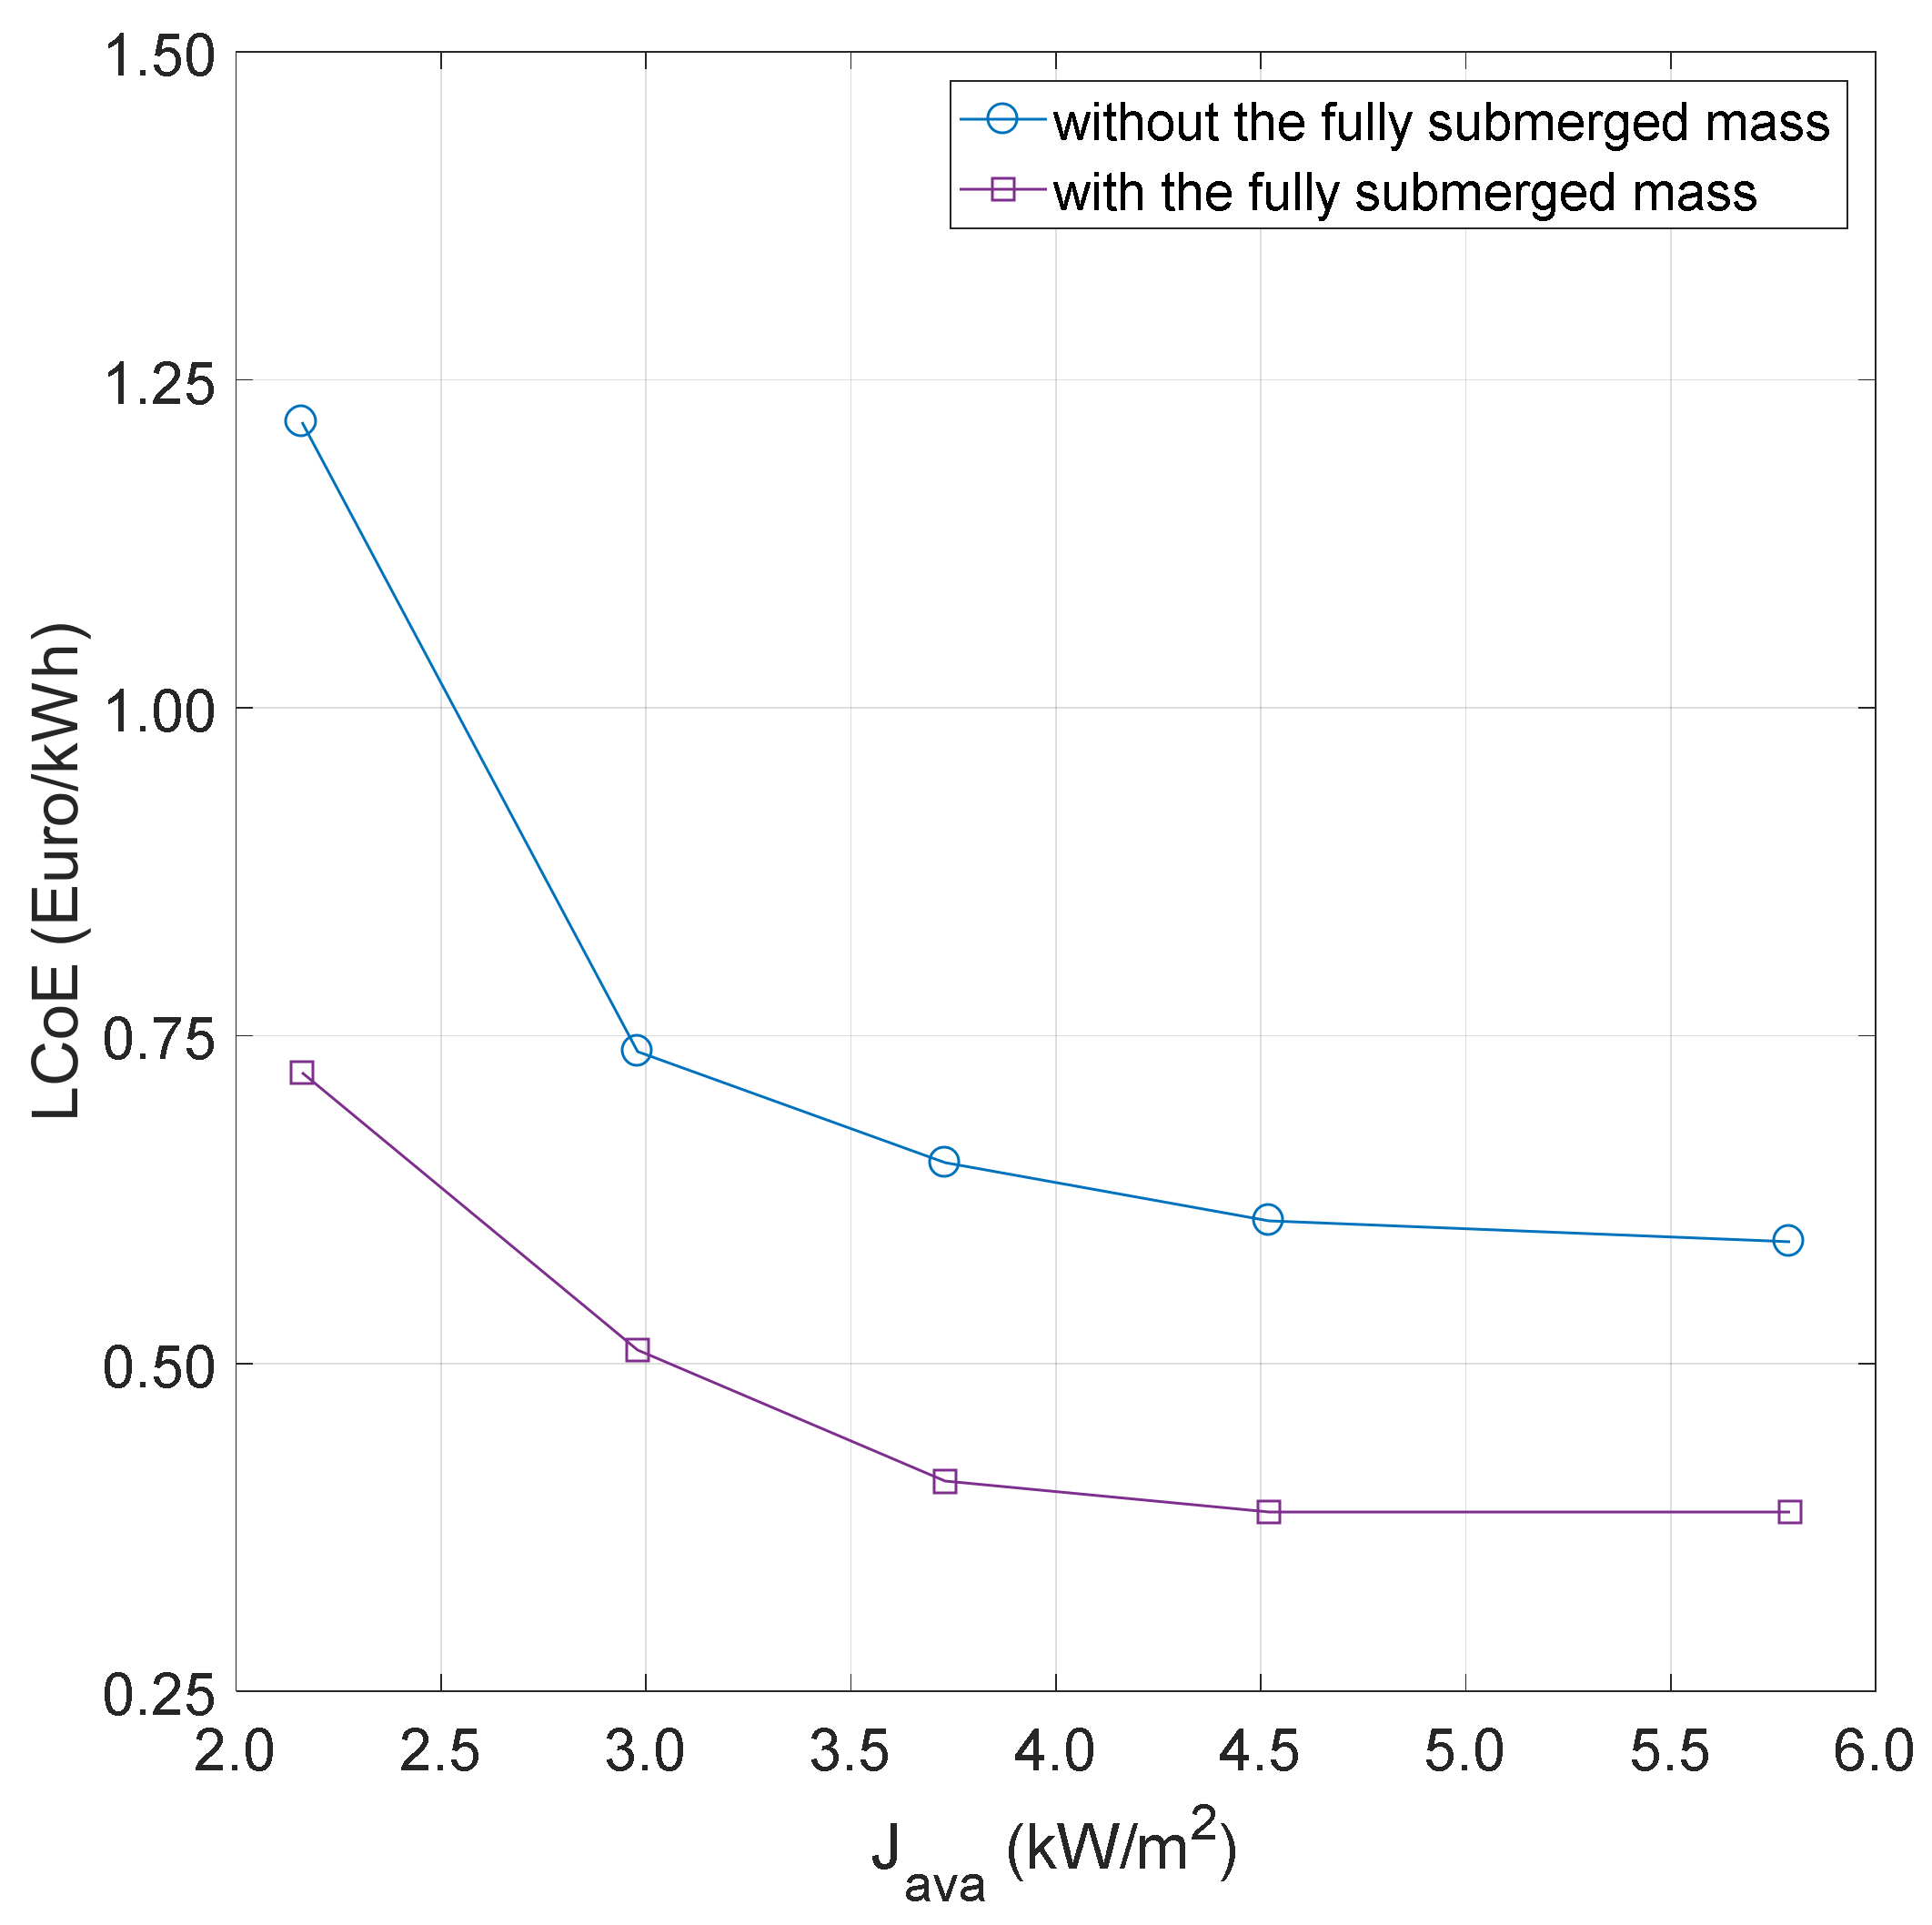
- Power production mainly depends on metocean conditions at the deployment site. Nevertheless, actual results show that the decrease rate of diminishes with the available wave power per unit length of wave front, as reported in Figure 9, with reference to WEC devices without and with the fully submerged mass. In fact, the LCoE is almost constant from 3.5 up to about 6.0 kW/m2, which implies that the expected cost of energy is almost comparable at Ponza, Mazara del Vallo and Alghero, even if ranges from 3.73 up to 5.79 kW/m2. This outcome is mainly due to the heave motion restraint provided by the PTO unit, so that the incoming wave energy cannot be completely harnessed in the most energetic sea states.
- (ii)
- Power production is mainly affected by the free stroke length of the permanent magnet linear generator, as in the most energetic sea states only part of the wave cycle is effective. In this respect, this vertical motion restraint has to be properly accounted in the most energetic sea states, as detailed in the Appendix, to correctly estimate the AEP and the .
- (iii)
- Floating buoy dimensions have to be properly selected by minimizing the , on the basis of wave statistics at the candidate deployment site. Particularly, the power production depends on the “cut-out” sea state that has to be selected by properly balancing the WEC operational profile and all technical issues related to the extreme loads in harsh weather conditions on the floating buoy, the mooring connection line and the PTO unit. Actual results show that a 3 m “cut-out” significant wave height is a reasonable design value for point absorbers in the Mediterranean Sea, as a further increase of the maximum significant wave height yields to a moderate decrease of the .
- (iv)
- There is a strong relation between the PTO free stroke length and the fully submerged mass. In fact, a low free stroke length of about 0.8 m is suitable for WEC devices without the fully submerged mass. On the contrary, if the floating buoy is equipped with a fully submerged mass, in order to properly tune the device heave natural frequency depending on dominant sea states at the deployment site, consistent reductions of can be achieved by increasing the PTO free stroke length. Current results show that for point absorbers equipped with the fully submerged mass and deployed in the Mediterranean Sea the free stroke length should be increased up to at least 1.5 m, i.e., one half the “cut-out” significant wave height.
- (v)
Current recommendations refer to WEC devices deployed in the Mediterranean Sea. Nevertheless, it is predictable that almost similar outcomes can be stressed for other deployment sites, with reference to the incidence of the PTO free stroke length and the WEC operational profile on the attained .
7. Conclusions
A new-cost based design procedure for point absorbers, equipped with an optional fully submerged mass and connected to a permanent magnet linear generator lying on the seabed, was developed to minimize the LCoE. Based on current results, the following main outcomes were achieved:
- (i)
- A new hydrodynamic model for point absorbers with a fully submerged mass was developed. It accounts for the WEC operational profile, in terms of “cut-out” sea state, and the heave motion restraint provided by the permanent magnet linear generator when the translator mass hits the upper/lower end-stop springs, as detailed in the Appendix A.
- (ii)
- The new procedure, devoted to select the most suitable WEC device, characterized by the minimum , was applied to several candidate deployment sites, verifying that the only wave power per unit length of wave front is not sufficient to correctly characterize the site, in terms of power production and costs.
- (iii)
- The incidence on the AEP and the of the PTO free stroke length and the WEC operational profile was investigated. It was found that current PTOs, with a free stroke length equal to 0.8 m, are suitable for point absorbers without the fully submerged mass. On the contrary, it is suggested to increase the free stroke length up to 1.5 m for WEC devices equipped with the fully submerged mass, due to the increased heave motion amplitude in harsh weather conditions.
- (iv)
- Some guidelines to reduce the , to properly tune the PTO mechanical properties and select, at least in a preliminary project phase, the most suitable point absorber configuration are provided.
Current outcomes, stressed for the Mediterranean Sea, need to be further investigated focusing on other deployment sites, in order to reduce the of WEC devices and make the wave energy sector more competitive on the international market, as regards other renewable sources.
Acknowledgments
The authors wish to thank the anonymous reviewers for their useful comments and insights. Besides, the research activities were partly financed by the Individual Research Programme—Year 2017—funded by the University of Naples “Parthenope”.
Author Contributions
All authors have contributed to the research. Vincenzo Piscopo developed, applied and discussed the mathematical model, while Guido Benassai, Renata Della Morte and Antonio Scamardella conceived the theoretical framework of the research activity. All authors took part in the writing of the paper.
Conflicts of Interest
The authors declare no conflict of interest.
Nomenclature
| List of Abbreviations | |
| AEP | Annualized Energy Production |
| LCoE | Levelised Cost of Energy |
| PTO | Power Take-Off |
| RAO | Response Amplitude Operator |
| WEC | Wave Energy Converter |
| List of Symbols | |
| Frequency-dependent hydrodynamic damping coefficient | |
| Power Take-Off damping coefficient | |
| d | Width of stator side |
| Magnetic field in a tooth | |
| Capacity factor | |
| Wave group celerity | |
| Floating buoy diameter | |
| Diameter of fully submerged mass | |
| Yearly available energy | |
| Voltage | |
| Heave exciting force | |
| Heave motion transfer function | |
| Significant wave height of the i-th sea state | |
| Wave power per unit length of wave front | |
| Available wave power per unit length of wave front | |
| Restoring stiffness | |
| Power Take-Off restoring stiffness | |
| Power Take-Off free stroke length | |
| Mass of floating buoy | |
| Frequency-dependent added mass of floating buoy | |
| Mass plus added mass of the fully submerged body | |
| Device expected lifetime | |
| Ratio of annual operating costs to device rated power | |
| Absorbed power | |
| Absorbed power if the entire wave cycle is effective | |
| Absorbed power if only part of the wave cycle is effective | |
| Total number of poles | |
| Probability of occurrence of the sea state | |
| Winding ratio | |
| Device rated power | |
| Real part of a complex number | |
| Generator reactive resistance | |
| Circuit external resistance | |
| Discount rate | |
| Ratio of capital costs to device rated power | |
| Ratio of decommissioning costs to device rated power | |
| Wave spectrum | |
| Peak period of the j-th sea state | |
| Mean wave period | |
| Time | |
| Generator polar pair width | |
| Tooth width | |
| Heave motion amplitude | |
| Heave motion velocity | |
| Heave motion acceleration | |
| List of Greek Symbols | |
| Peak enhancement factor of wave spectrum | |
| Sea surface elevation | |
| Wave amplitude | |
| Electrical efficiency | |
| Magnetic flux | |
| Magnetic flux amplitude | |
| Corrective factor of the absorber power | |
| Wave circular frequency | |
Appendix A. Power Production Assessment
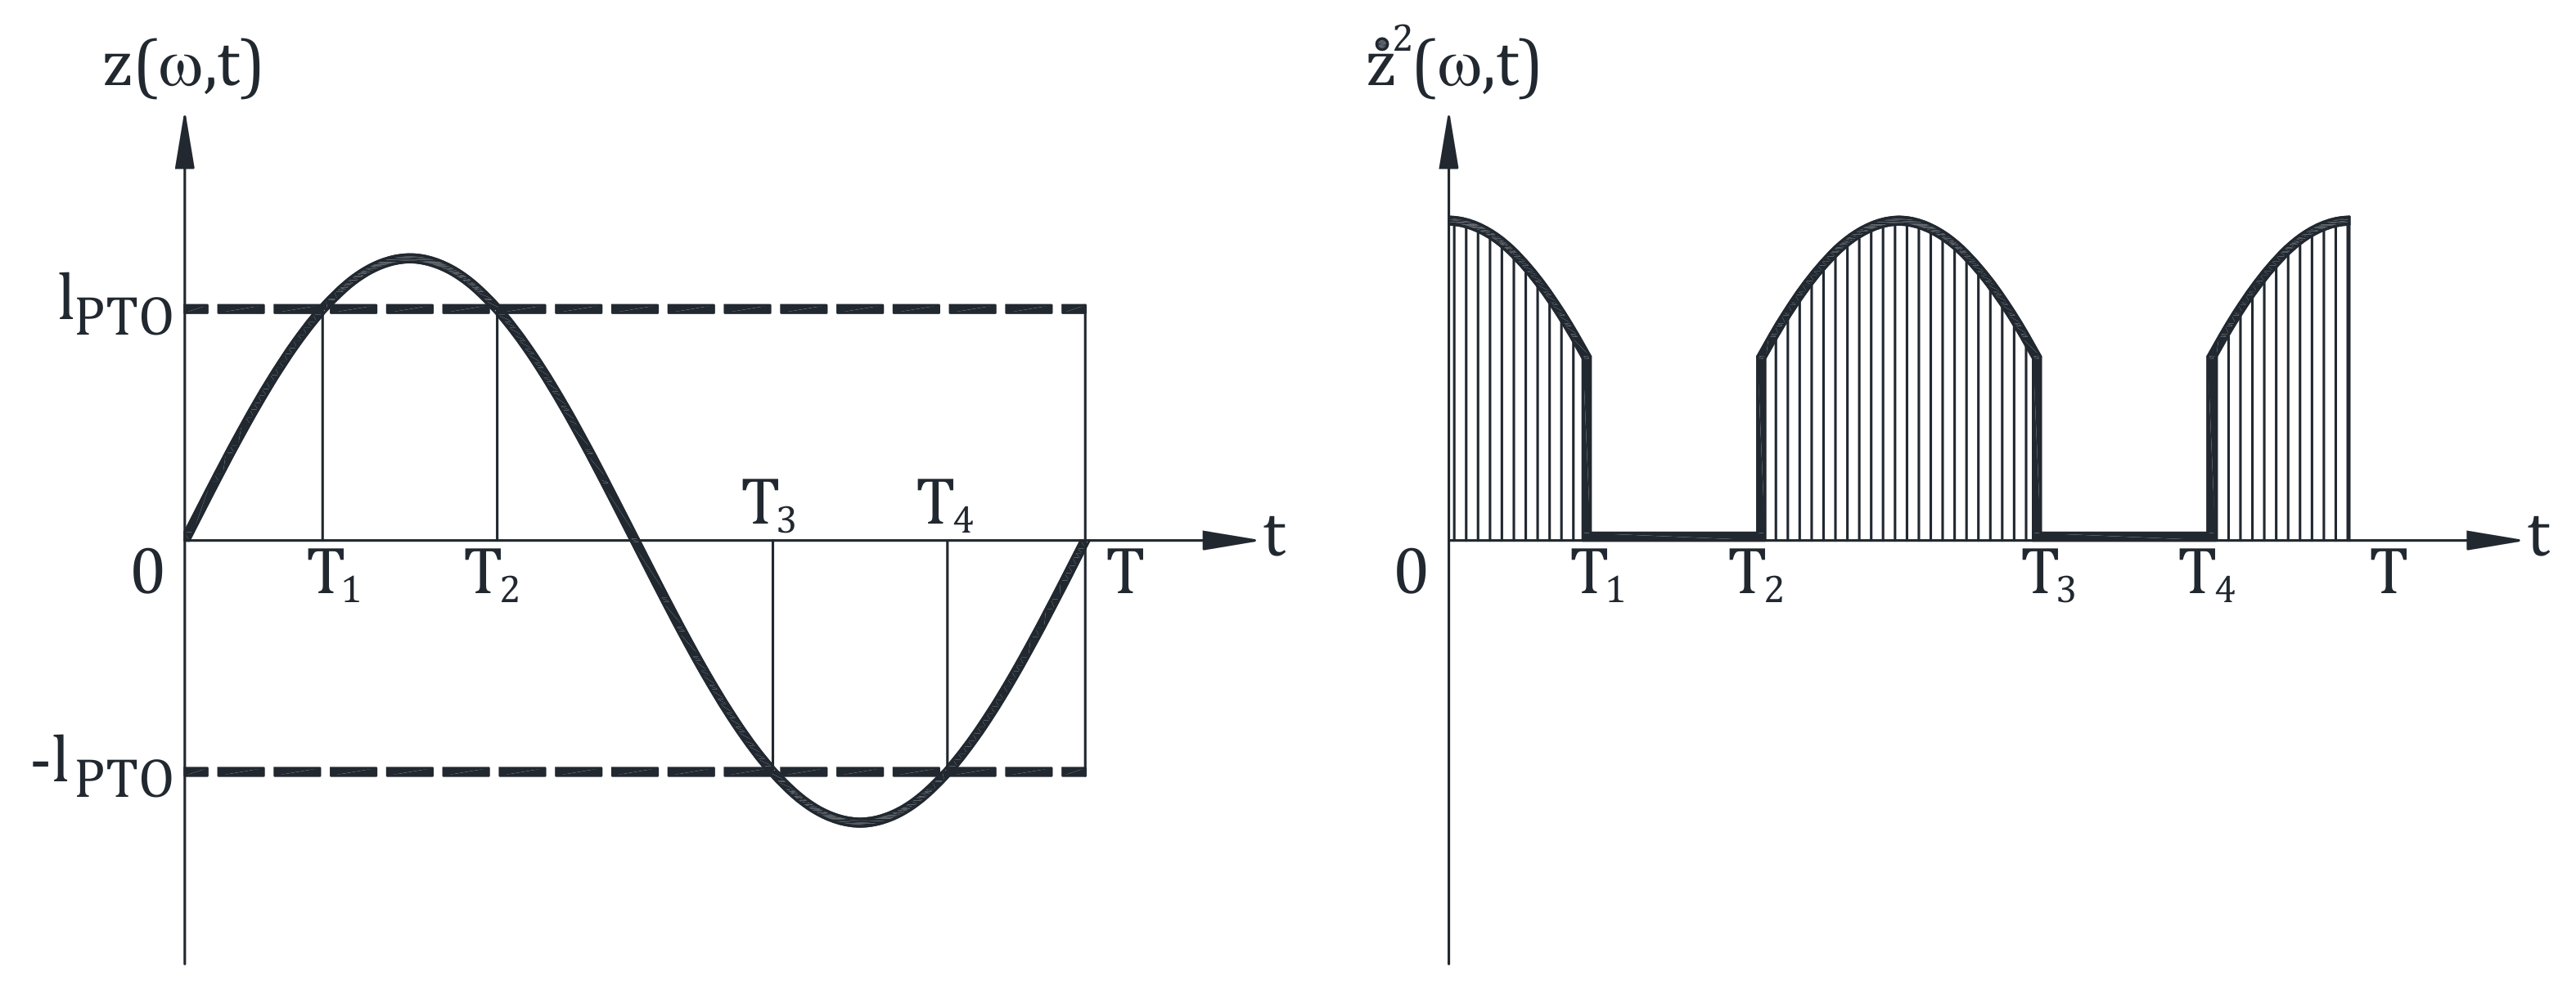
In the following a new procedure is outlined to evaluate the power production of a point absorber, when the heave motion of translator mass is restrained by the PTO free stroke length and only part of the wave cycle is effective. Let us consider a regular sea state with: (i) wave amplitude ; (ii) wave period and (iii) circular frequency . The sea surface elevation is expressed as follows:
Denoted by the WEC heave transfer function, the vertical motion and the squared velocity of the linear generator translator mass can be determined:
so that the instantaneous absorbed power is derived, as a function of PTO damping:
If the vertical motion amplitude of the translator mass is lower than the PTO free stroke length, as depicted in Figure A1, the wave cycle is fully effective and the mean absorber power is determined as follows:
Figure A1.
Power absorption without exceedance of PTO upper/lower stroke length (graphs are purely qualitative).
Figure A1.
Power absorption without exceedance of PTO upper/lower stroke length (graphs are purely qualitative).

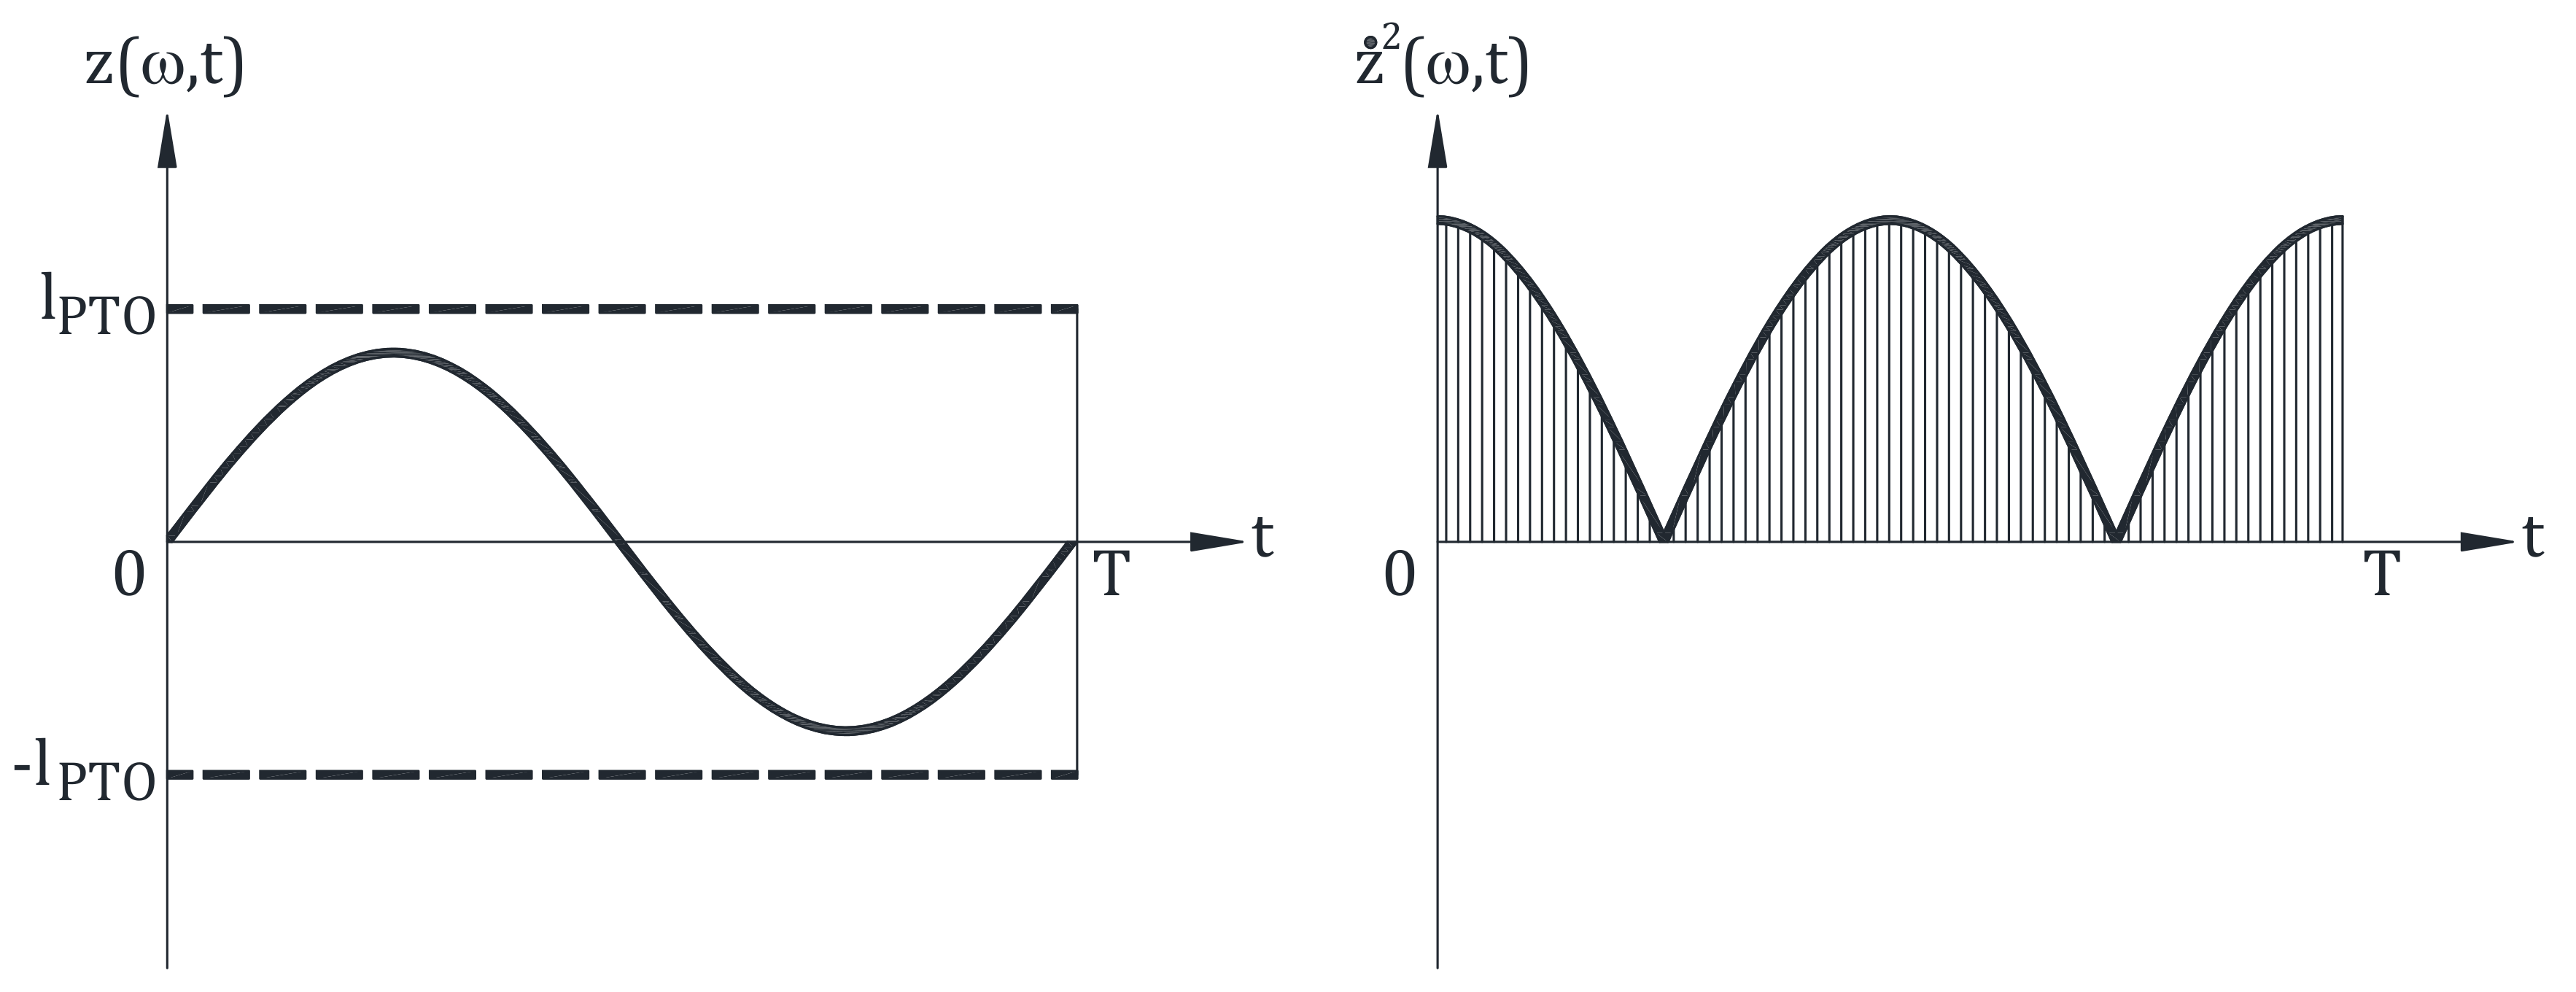
On the contrary, if the motion amplitude of translator mass is higher than the PTO free stroke length, as depicted in Figure A2, only part of the wave cycle is effective, as when the translator mass hits the upper or lower end-stop springs a sudden drop-off of the heave velocity occurs. Hence, if the end-stop spring stiffness is high enough, the heave velocity drop-off can be assumed almost instantaneous, so that no power production occurs in the time intervals and , as depicted in Figure A2. Hence, the absorbed power in is determined as follows:
and can be further simplified:
Based on previous results, the following corrective function can be introduced. It is unitary, if the heave motion amplitude of translator mass is lower than the , while it is equal to the ratio of partial to fully effective absorber power, if the translator mass heave motion amplitude exceeds the free stroke length:
Figure A2.
Power absorption with exceedance of PTO upper/lower stroke length (both graphs are purely qualitative).
Figure A2.
Power absorption with exceedance of PTO upper/lower stroke length (both graphs are purely qualitative).
After some manipulations, Equation (A8) is resembled by the following one:
so that the absorber power can be determined as follows, with reference to both full and partly effective wave cycles:
Similar results can be extended to a seaway, by means of the wave spectrum , so that the following equality holds:
Finally, the electrical power production depends on the efficiency of the permanent magnet linear generator and the absorbed power , based on Equation (A11).
References
- Falcão, A.F.O. Wave energy utilization: A review of the technologies. Renew. Sustain. Energy Rev. 2010, 14, 899–918. [Google Scholar] [CrossRef]
- Salter, S.H. Wave power. Nature 1974, 249, 720–724. [Google Scholar] [CrossRef]
- Vantorre, M.; Banasiak, R.; Verhoeven, R. Modelling of hydraulic performance and wave energy extraction by a point absorber in heave. Appl. Ocean Res. 2004, 26, 61–72. [Google Scholar] [CrossRef]
- Falnes, J. A review of wave-energy extraction. Mar. Struct. 2007, 20, 185–201. [Google Scholar] [CrossRef]
- Vicente, P.C.; António, F.D.; Gato, L.M.C.; Justino, P.A.P. Dynamics of arrays of floating point-absorber wave energy converters with inter-body and bottom slack-mooring connections. Appl. Ocean Res. 2009, 31, 267–281. [Google Scholar] [CrossRef]
- Nunes, G.; Valério, D.; Beirão, P.; Sá da Costa, J. Modelling and control of a wave energy converter. Renew. Energy 2011, 36, 1913–1921. [Google Scholar] [CrossRef]
- Ocean Energy Systems. International Levelised Cost of Energy for Ocean Energy Technologies; Report; International Energy Agency: Paris, France, 2015. [Google Scholar]
- European Commission. European Commission Decision C (2014) 4995; European Commission: Brussels, Belgium, 2014. [Google Scholar]
- De Backer, G. Hydrodynamic Design Optimization of Wave Energy Converters Consisting of Heaving Point Absorbers. Ph.D. Thesis, Ghent University, Ghent, Belgium, 2009. [Google Scholar]
- Bachynski, E.E.; Young, Y.L.; Yeung, R.W. Analysis and optimization of a tethered wave energy converter in irregular waves. Renew. Energy 2012, 48, 133–145. [Google Scholar] [CrossRef]
- Yu, Y.-H.; Li, Y.; Hallet, K.; Hotimsky, C. Design and Analysis for a Floating Oscillating Surge Wave Energy Converter; National Renewable Energy Laboratory Report NREL/CP-5000-61283; National Renewable Energy Laboratory: Golden, CO, USA, 2014; pp. 1–11.
- Piscopo, V.; Benassai, G.; Cozzolino, L.; Della Morte, R.; Scamardella, A. A new optimization procedure of heaving point absorber hydrodynamic performances. Ocean Eng. 2016, 116, 242–259. [Google Scholar] [CrossRef]
- Piscopo, V.; Benassai, G.; Della Morte, R.; Scamardella, A. Towards a cost-based design of heaving point absorbers. Int. J. Mar. Energy 2017, 18, 15–29. [Google Scholar] [CrossRef]
- Salter, S.H.; Taylor, J.R.M.; Caldwell, N.J. Power conversion mechanisms for wave energy. Proc. Inst. Mech. Eng. Part M J. Eng. Marit. Environ. 2002, 216, 1–27. [Google Scholar] [CrossRef]
- Benassai, G.; Campanile, A.; Piscopo, V.; Scamardella, A. Mooring control of semi-submersible structures for wind turbines. Procedia Eng. 2014, 70, 132–141. [Google Scholar] [CrossRef]
- Benassai, G.; Campanile, A.; Piscopo, V.; Scamardella, A. Ultimate and accidental limit state design for mooring systems of floating wind turbines. Ocean. Eng. 2014, 92, 64–74. [Google Scholar] [CrossRef]
- Benassai, G.; Campanile, A.; Piscopo, V.; Scamardella, A. Optimization of Mooring Systems for Floating Offshore Wind Turbines. Coast. Eng. J. 2015, 57, 1550021-1–1550021-19. [Google Scholar] [CrossRef]
- MathWorks. Matlab User Guide R2017b. Available online: www.mathworks.com (accessed on 4 December 2017).
- Mekhiche, M.; Edwards, K.A. Ocean power technologies PowerBuoy®: System-level design, development and validation methodology. In Proceedings of the 2nd Marine Energy Technology Symposium, Seattle, WA, USA, 15–18 April 2014; pp. 1–9. [Google Scholar]
- Danielson, O. Wave Energy Conversion—Linear Synchronous Permanent Magnet Generator. Ph.D. Thesis, Acta Universitatis Upsaliensis, Uppsala, Sweden, 2006. [Google Scholar]
- Drew, B.; Plummer, A.R.; Sahinkaya, M.N. A review of wave energy converter technology. Proc. Inst. Mech. Eng. A J. Power Energy 2009, 223, 887–902. [Google Scholar] [CrossRef]
- Falnes, J.; Budal, K. Wave-power conversion by point absorbers. Norw. Mar. Res. 1978, 6, 2–11. [Google Scholar]
- Gaspar, J.F.; Calvário, M.; Kamarlouei, M.; Guedes Soares, C. Power take-off concept for wave energy converters based on oil-hydraulic transformer units. Renew. Energy 2016, 86, 1232–1246. [Google Scholar] [CrossRef]
- Lejerskog, E.; Boström, C.; Hai, L.; Waters, R.; Leijon, M. Experimental results on power absorption from a wave energy converter at Lysekil wave energy research site. Renew. Energy 2015, 77, 9–14. [Google Scholar] [CrossRef]
- Bozzi, S.; Moreno Miquel, A.; Antonini, A.; Passoni, G.; Archetti, R. Modelling of a Point Absorber for Energy Conversion in Italian Seas. Energies 2013, 6, 3033–3051. [Google Scholar] [CrossRef] [Green Version]
- Archetti, R.; Moreno Miquel, A.; Antonini, A.; Passoni, G.; Bozzi, S.; Gruosso, G.; Scarpa, F.; Bizzozero, F.; Giassi, M. Designing a point-absorber wave energy converter for the Mediterranean Sea. In Energia, Ambiente e Innovazione—Speciale Ocean Energy: Ongoing Research in Italy; ENEA Agenzia Nazionale per le Nuove Tecnologie, L’energia e lo Sviluppo Economico Sostenibile: Rome, Italy, 2015; pp. 76–85. [Google Scholar]
- Lok, K.; Stallard, T.; Stansby, P.; Jenkins, N. Optimisation of a Clutch-Rectified Power Take Off System for a Heaving Wave Energy Device in Irregular Waves with Experimental Comparison. Int. J. Mar. Energy 2014, 8, 1–16. [Google Scholar] [CrossRef]
- Hulme, A. The wave forces acting on a floating hemisphere undergoing forced periodic oscillations. J. Fluid. Mech. 1982, 121, 443–463. [Google Scholar] [CrossRef]
- Chen, X.B.; Diebold, L.; Doutreleau, Y. New Green-Function Method to Predict Wave-Induced Ship Motions and Loads. In Proceedings of the Twenty-Third Symposium on Naval Hydrodynamics, Val de Reuil, France, 17–22 September 2000; pp. 66–81. [Google Scholar]
- Newman, J.N. Marine Hydrodynamics; MIT Press: Cambridge, MA, USA, 1977. [Google Scholar]
- El-hami, M.; Glynne-Jones, P.; White, N.M.; Hill, M.; Beeby, S.; James, E.; Brwon, A.D.; Ross, J.N. Design and fabrication of a new vibration-based electromechanical power generator. Sensor. Actuator A Phys. 2001, 92, 335–342. [Google Scholar] [CrossRef]
- Guizzi, G.L.; Manno, M.; Manzi, G.; Salvatori, M.; Serpella, D. Preliminary study on a kinetic energy recovery system for sailing yachts. Renew. Energy 2014, 62, 216–225. [Google Scholar] [CrossRef] [Green Version]
- Thorburn, K.; Leijon, M. Farm size comparison with analytical model of linear generator wave energy converters. Ocean. Eng. 2007, 34, 908–916. [Google Scholar] [CrossRef]
- Ekström, R.; Ekergård, B.; Leijon, M. Electrical damping of linear generators for wave energy converters—A review. Renew. Sustain. Energy Rev. 2015, 42, 116–128. [Google Scholar] [CrossRef]
- Ulvgård, L.; Sjökvist, L.; Göteman, M.; Leijon, M. Line Force and Damping at Full and Partial Stator Overlap in a Linear Generator for Wave Power. J. Mar. Sci. Eng. 2016, 4, 81. [Google Scholar] [CrossRef]
- Bachynski, E.E.; Moan, T. Point absorber design for a combined wind and wave energy converter on a tension-leg support structure. In Proceedings of the 32nd ASME International Conference on Ocean, Offshore and Arctic Engineering, Nantes, France, 9–14 June 2013; pp. 1–10. [Google Scholar]
- Blanco, M.; Moreno-Torres, P.; Lafoz, M.; Ramírez, D. Design Parameter Analysis of Point Absorber WEC via an Evolutionary-Algorithm-Based Dimensioning Tool. Energies 2015, 8, 11203–11233. [Google Scholar] [CrossRef] [Green Version]
- Crabb, J. Synthesis of a directional wave climate. In Power from Sea Waves; Academic Press: London, UK, 2000; pp. 41–74. [Google Scholar]
- Rusu, E. Evaluation of the Wave Energy Conversion Efficiency in Various Coastal Environments. Energies 2014, 7, 4002–4018. [Google Scholar] [CrossRef]
- Hong, Y.; Eriksson, M.; Boström, C.; Waters, R. Impact of generator stroke length on energy production of a direct drive wave energy converter. Energies 2016, 9, 730. [Google Scholar] [CrossRef]
- Belmont, M.R. Increases in the average power output of wave energy converters using quiescent period predictive control. Renew. Energy 2010, 35, 2812–2820. [Google Scholar] [CrossRef]
- Ringwood, J.V.; Bacelli, G.; Fusco, F. Energy-maximizing control of wave-energy converters: The development of control system technology to optimize their operation. IEEE Contr. Syst. Mag. 2014, 34, 30–55. [Google Scholar] [CrossRef]
- Hultman, E.; Ekergård, B.; Tobias, K.; Salar, D.; Leijon, M. Preparing the Uppsala University Wave Energy Converter Generator for Large-Scale Production. In Proceedings of the 5th International Conference on Ocean Energy, Halifax, NS, Canada, 4–6 November 2014; pp. 1–12. [Google Scholar]
- Myhr, A.; Bjerkseter, C.; Ågotnes, A.; Nygaard, T.A. Levelised cost of energy for offshore wind turbines in a life cycle perspective. Renew. Energy 2014, 66, 714–728. [Google Scholar] [CrossRef]
- Stansby, P.K.; Carpintero, E.; Moreno, T.; Stallard, T. Large capacity multi-float configurations for the wave energy converter M4 using a time-domain linear diffraction model. Appl. Ocean Res. 2017, 68, 53–64. [Google Scholar] [CrossRef]
- Liberti, L.; Carillo, A.; Sannino, G. Wave energy resource assessment in the Mediterranean, the Italian perspective. Renew. Energy 2013, 50, 938–949. [Google Scholar] [CrossRef]
- Det Norske Veritas. Recommended Practice DNV-RP-C205 Environmental Conditions and Environmental Loads; Det Norske Veritas: Hamburg, Germany, 2010. [Google Scholar]
- Danielson, O.; Erikkson, M.; Leijon, M. Study of a longitudinal flux permanent magnet linear generator for wave energy converter. Int. J. Energy Res. 2006, 30, 1130–1145. [Google Scholar] [CrossRef]
- Previsic, M. The Future Potential of Wave Power in the United States; United States Department of Energy: Washington, DC, USA, 2012.
- Falcão, A.F.O. Modelling and control of oscillating-body wave energy converters with hydraulic power take-off and gas accumulator. Ocean Eng. 2007, 34, 2021–2032. [Google Scholar] [CrossRef]
Figure 1.
Heaving point absorber with permanent magnet linear generator.
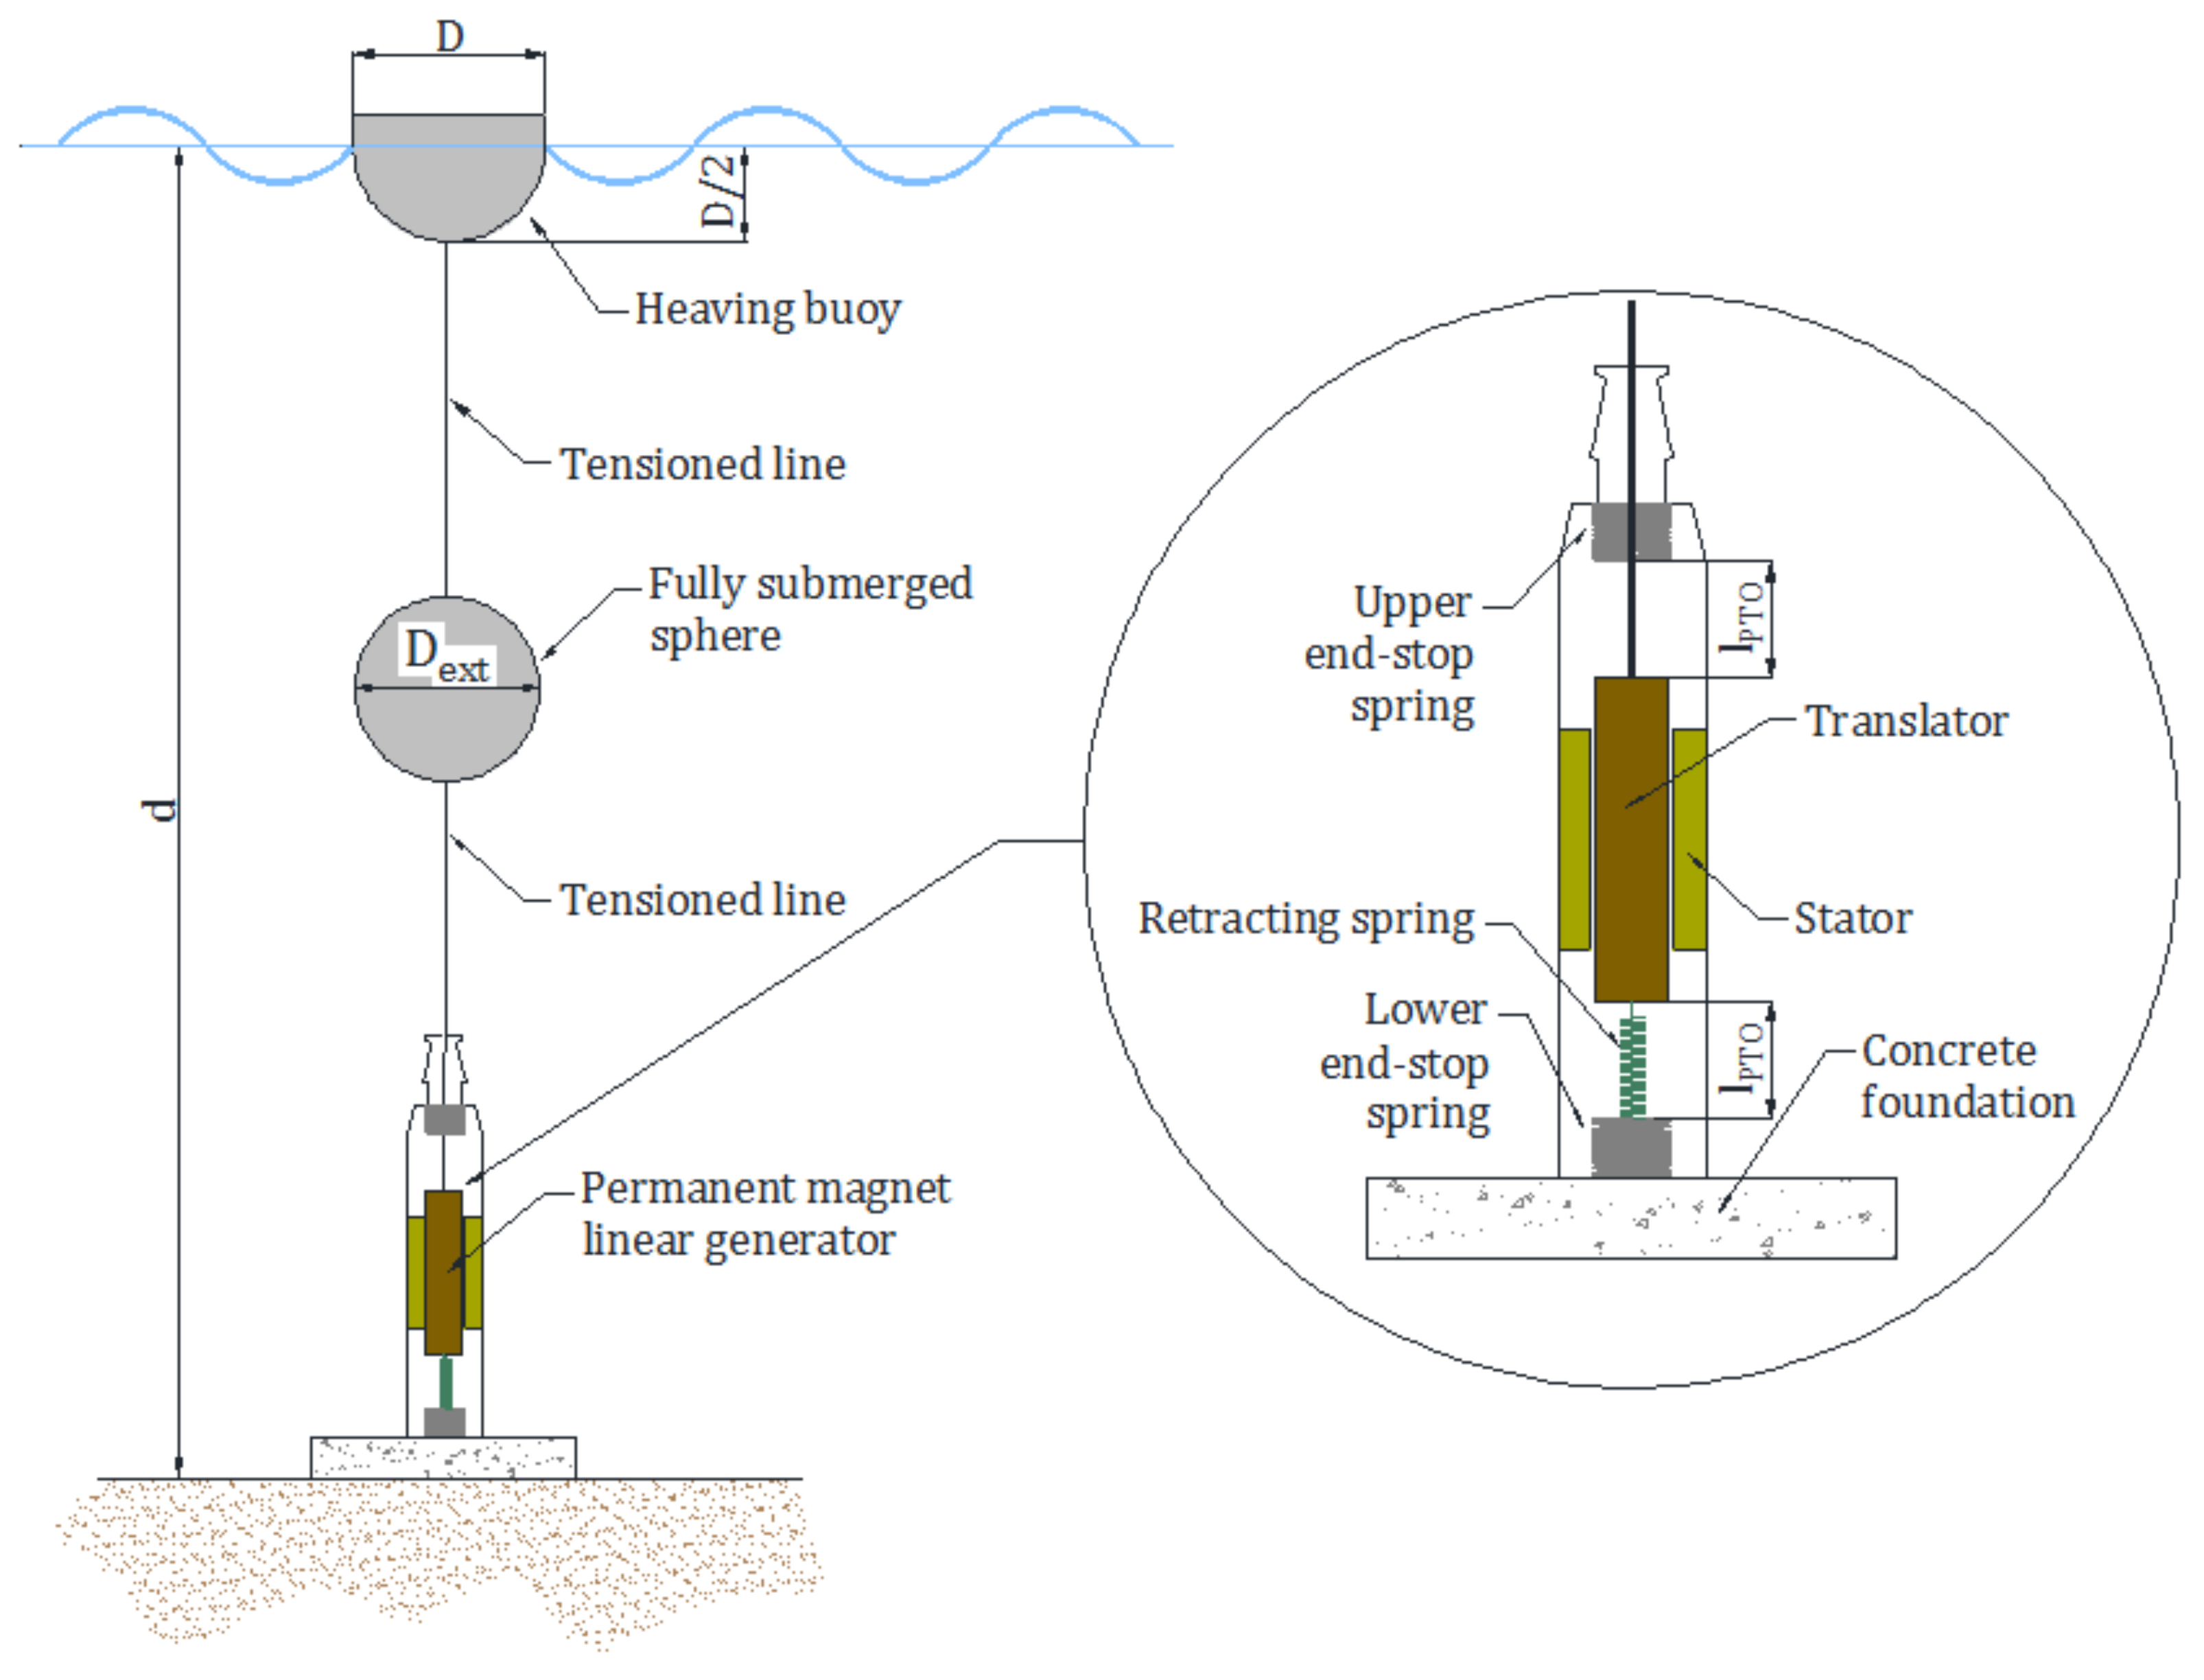
Figure 2.
Location of candidate deployment sites in the central Mediterranean Sea.
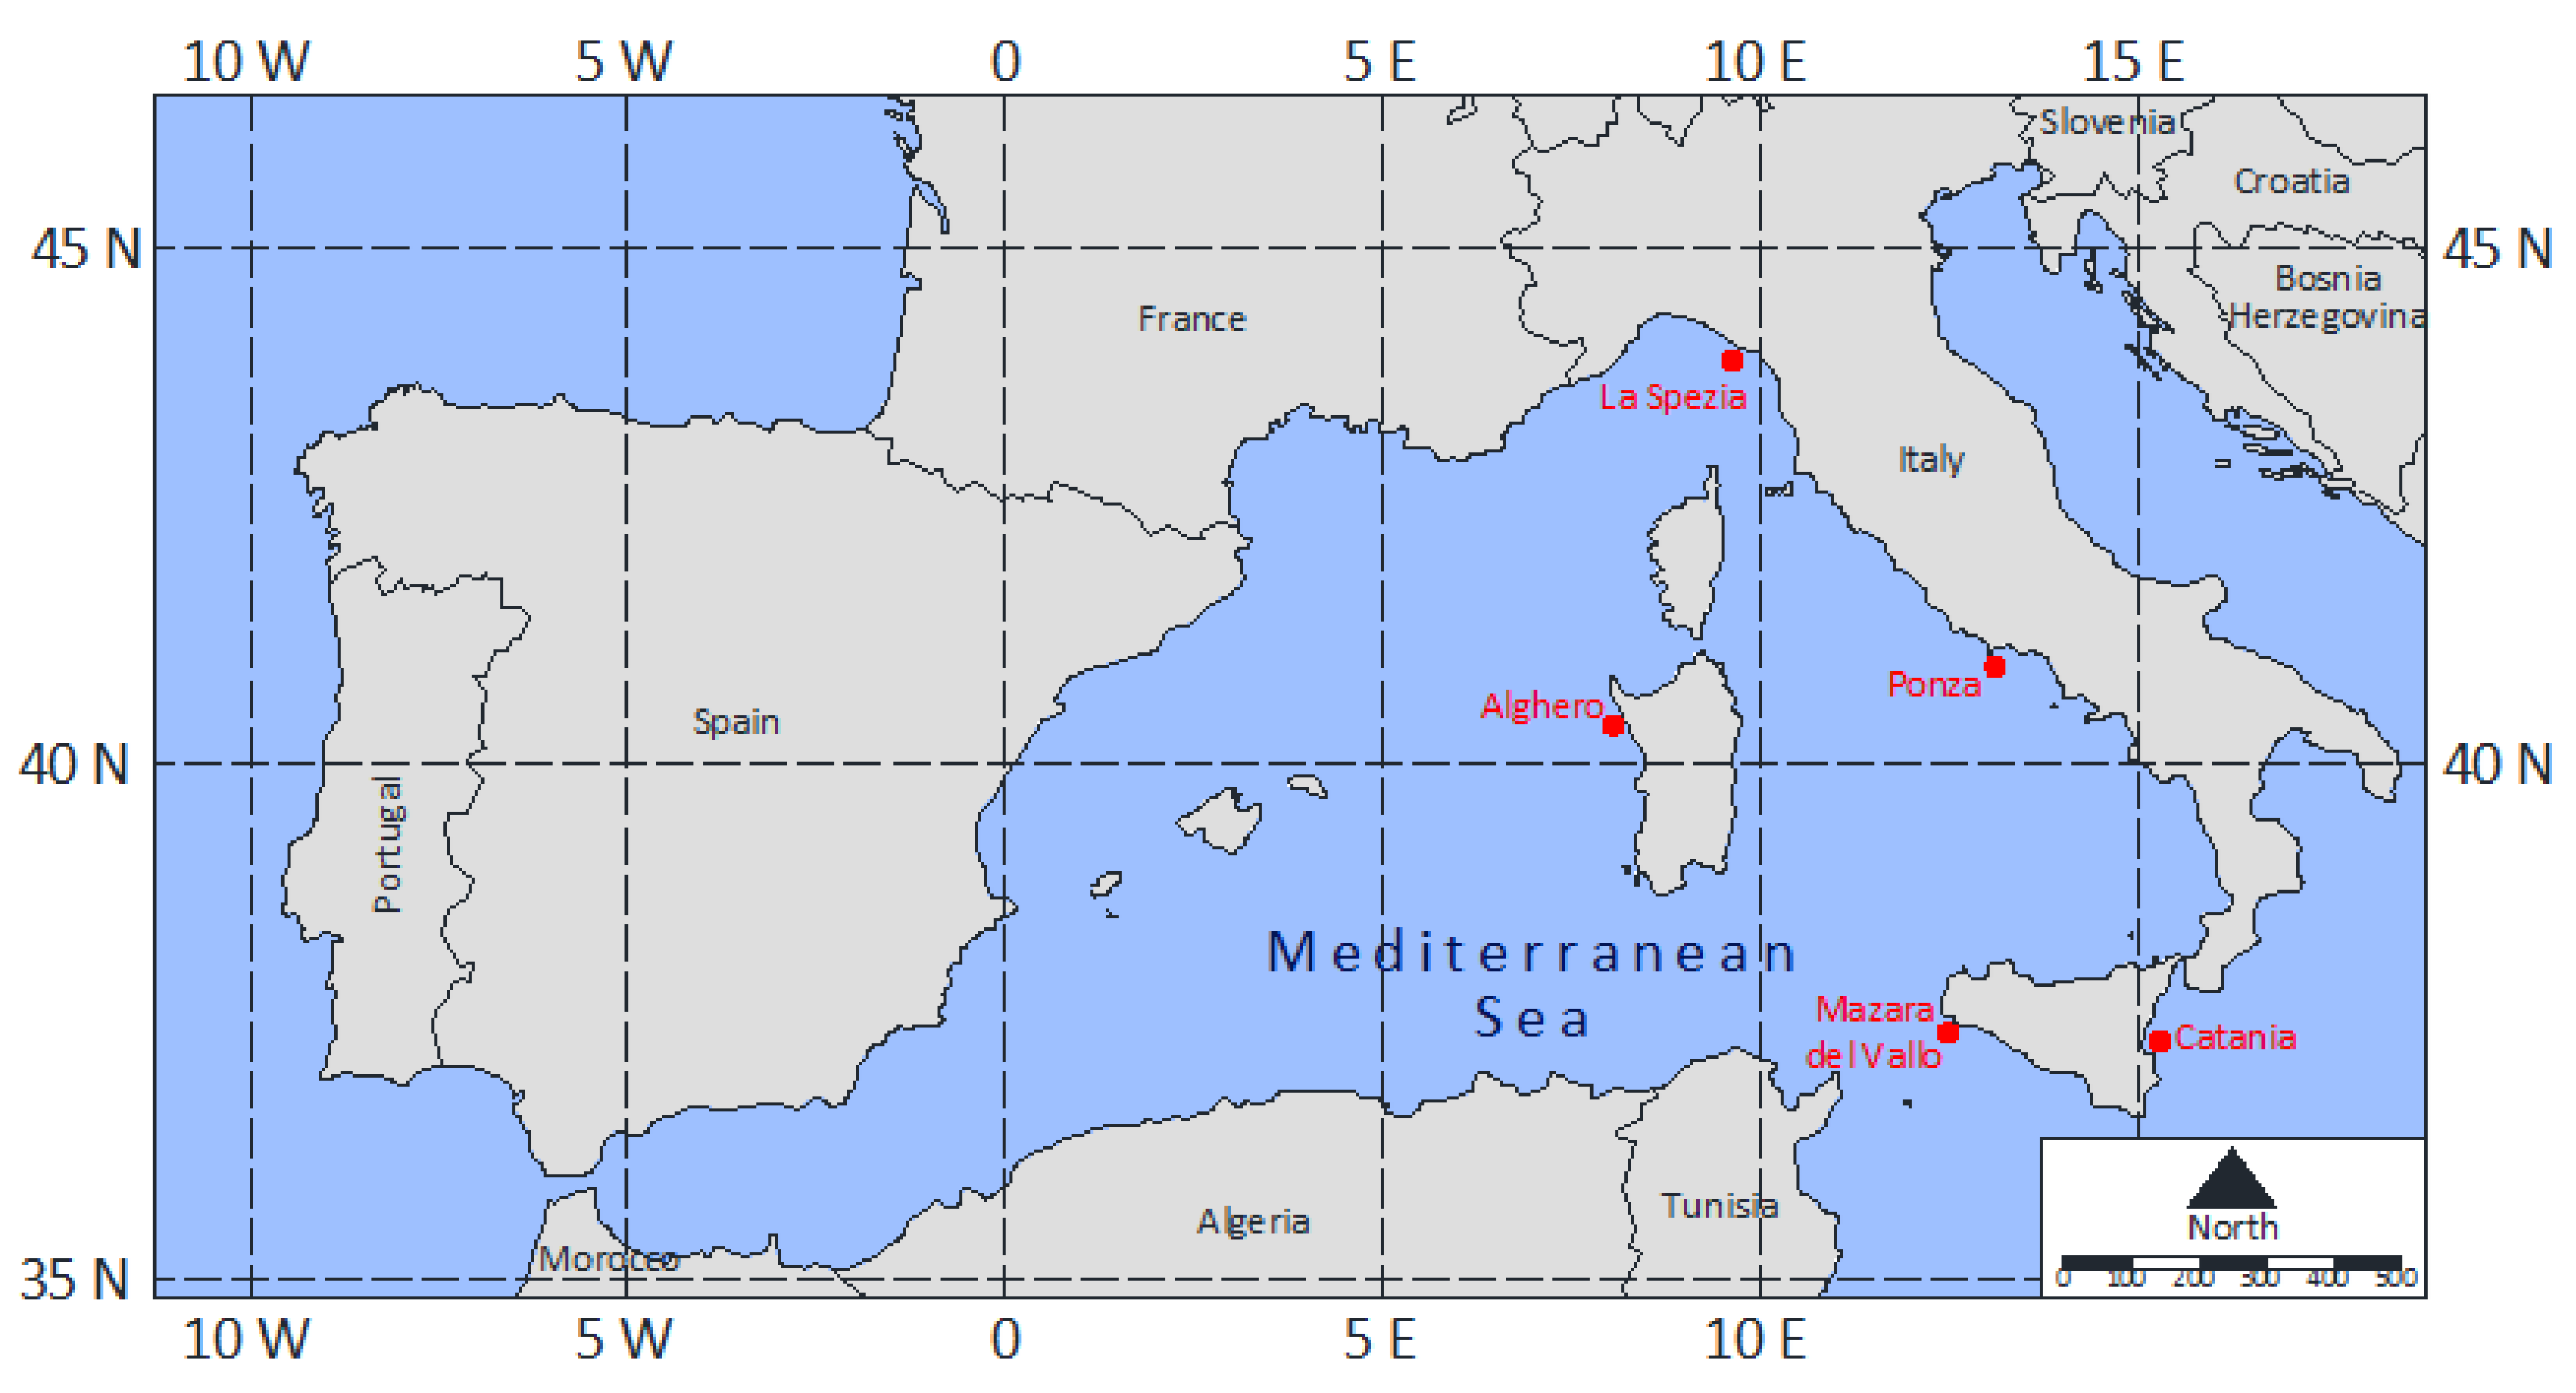
Figure 3.
Frequency histograms of wave heights and periods at candidate deployment sites.


Figure 4.
distribution versus the diameter of the buoy without the fully submerged mass.
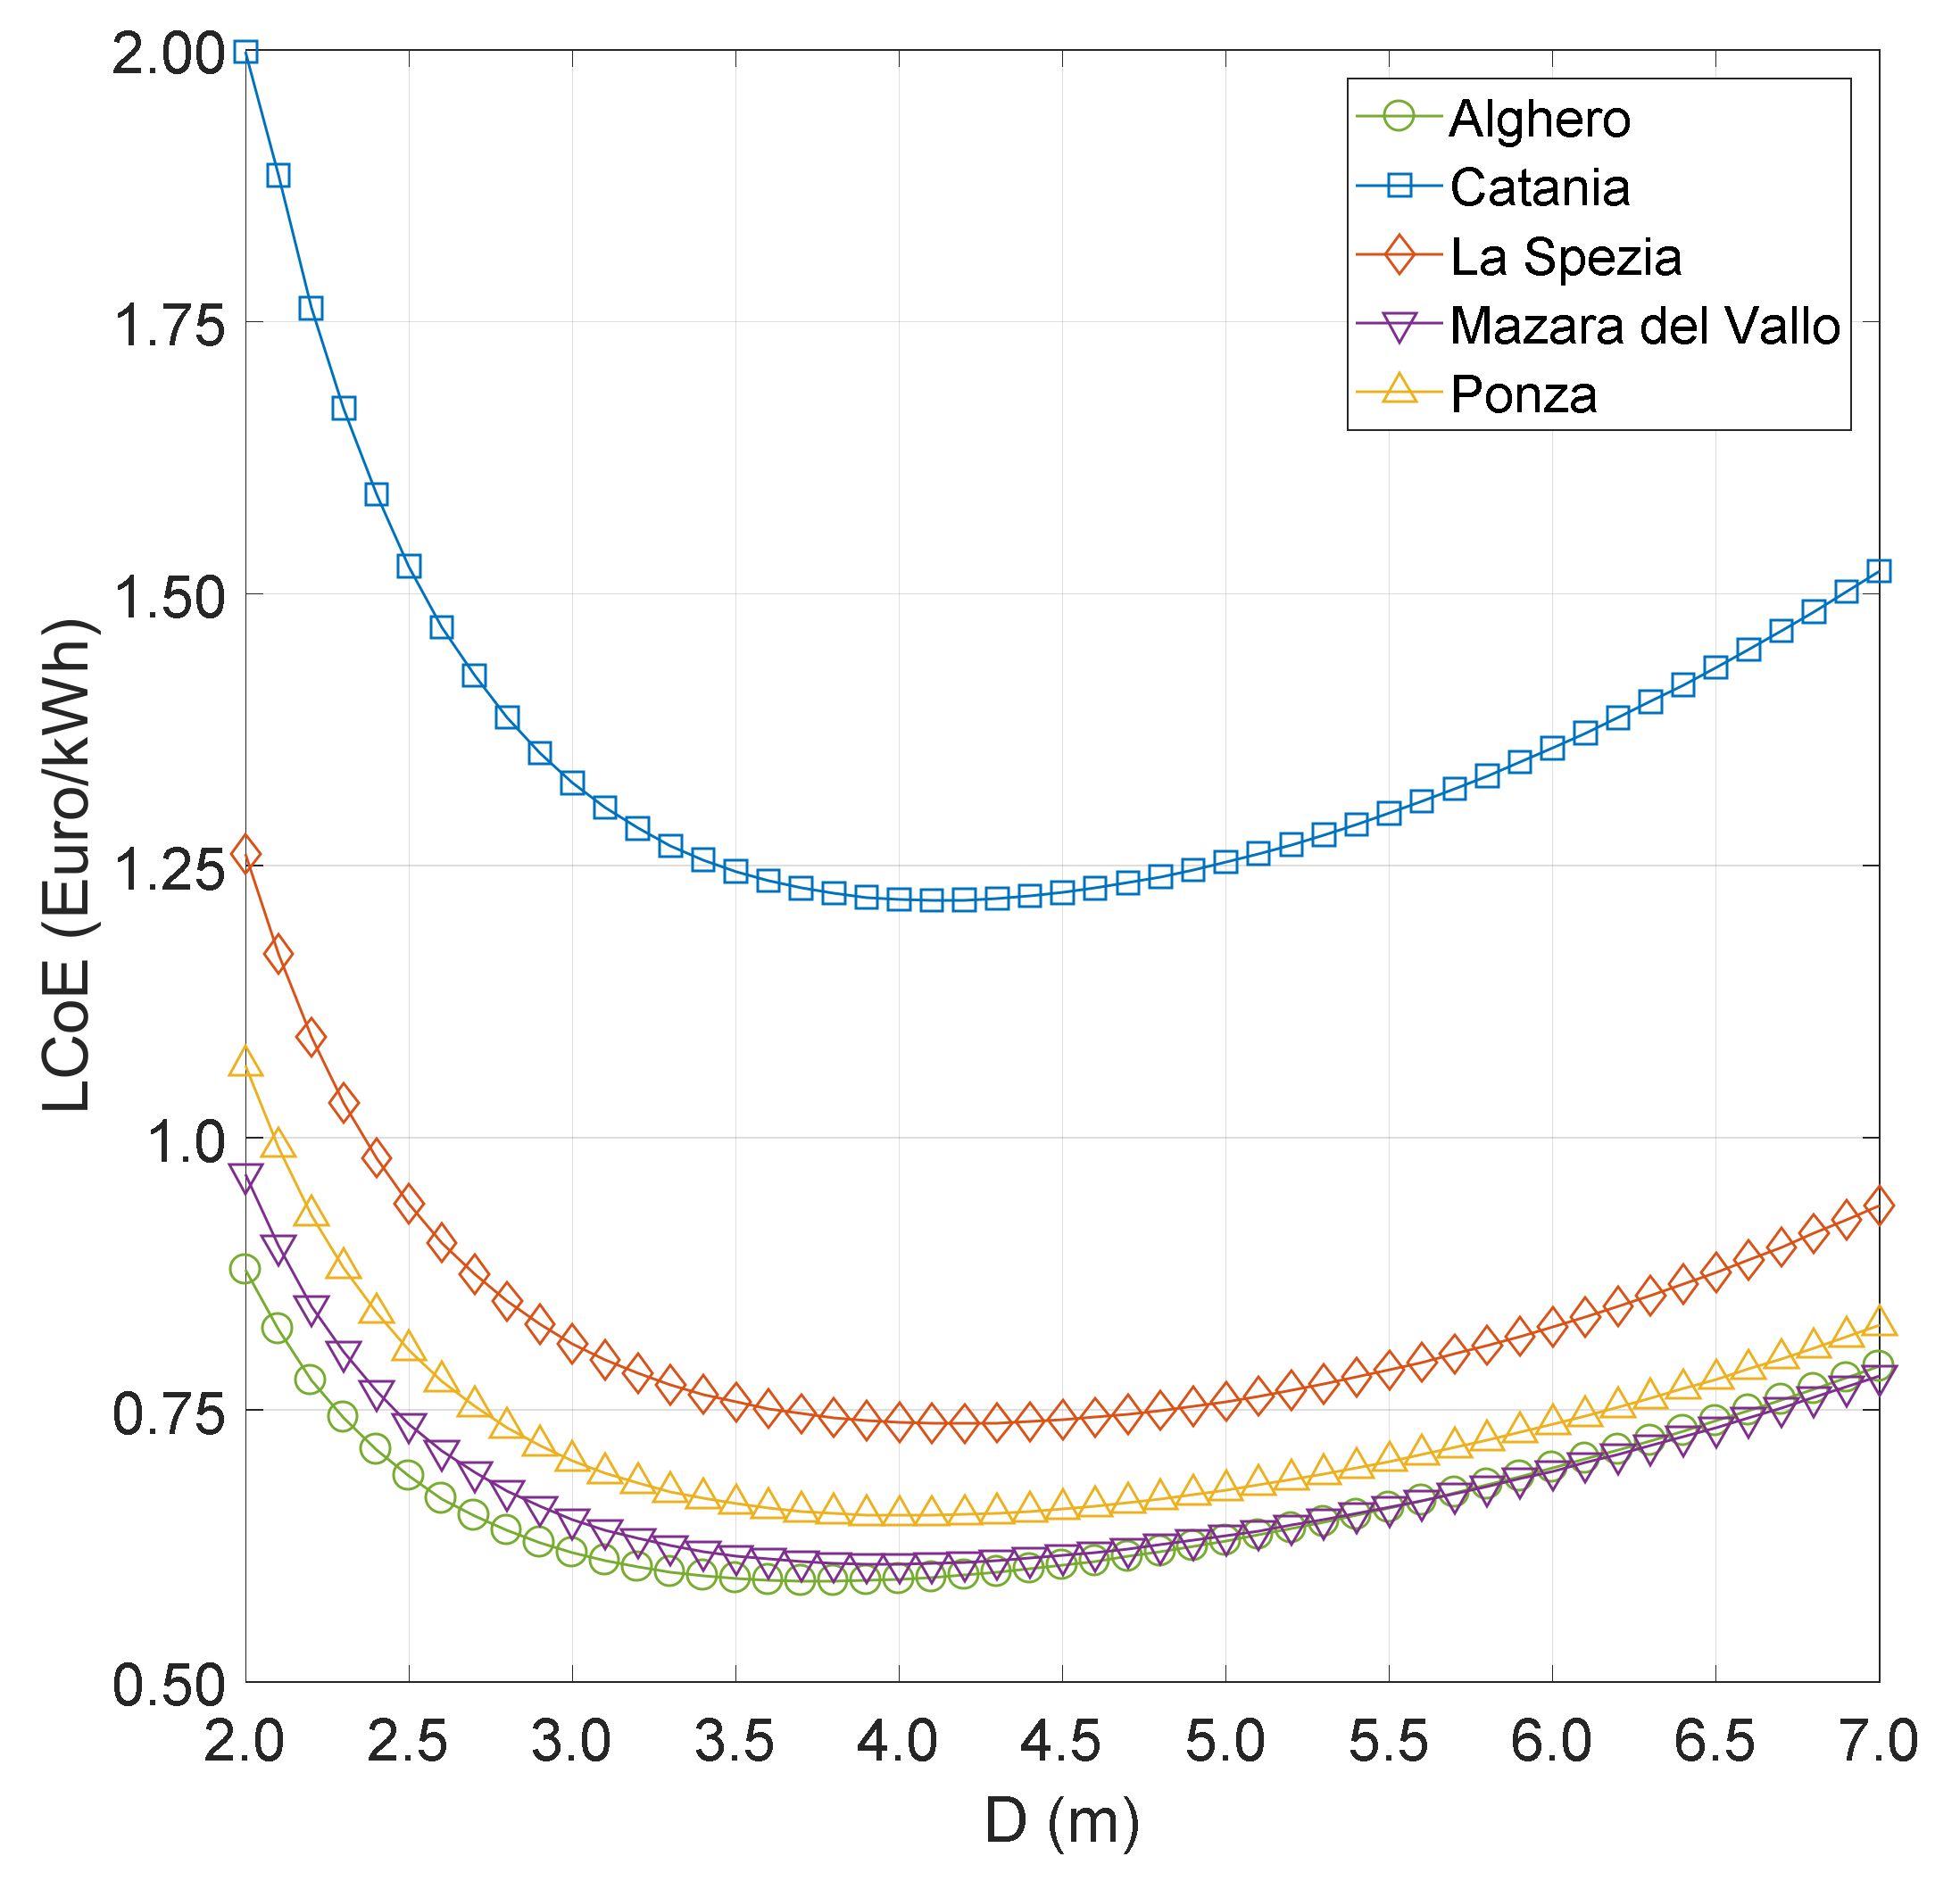
Figure 5.
distribution versus the diameter of the buoy with the fully submerged mass.
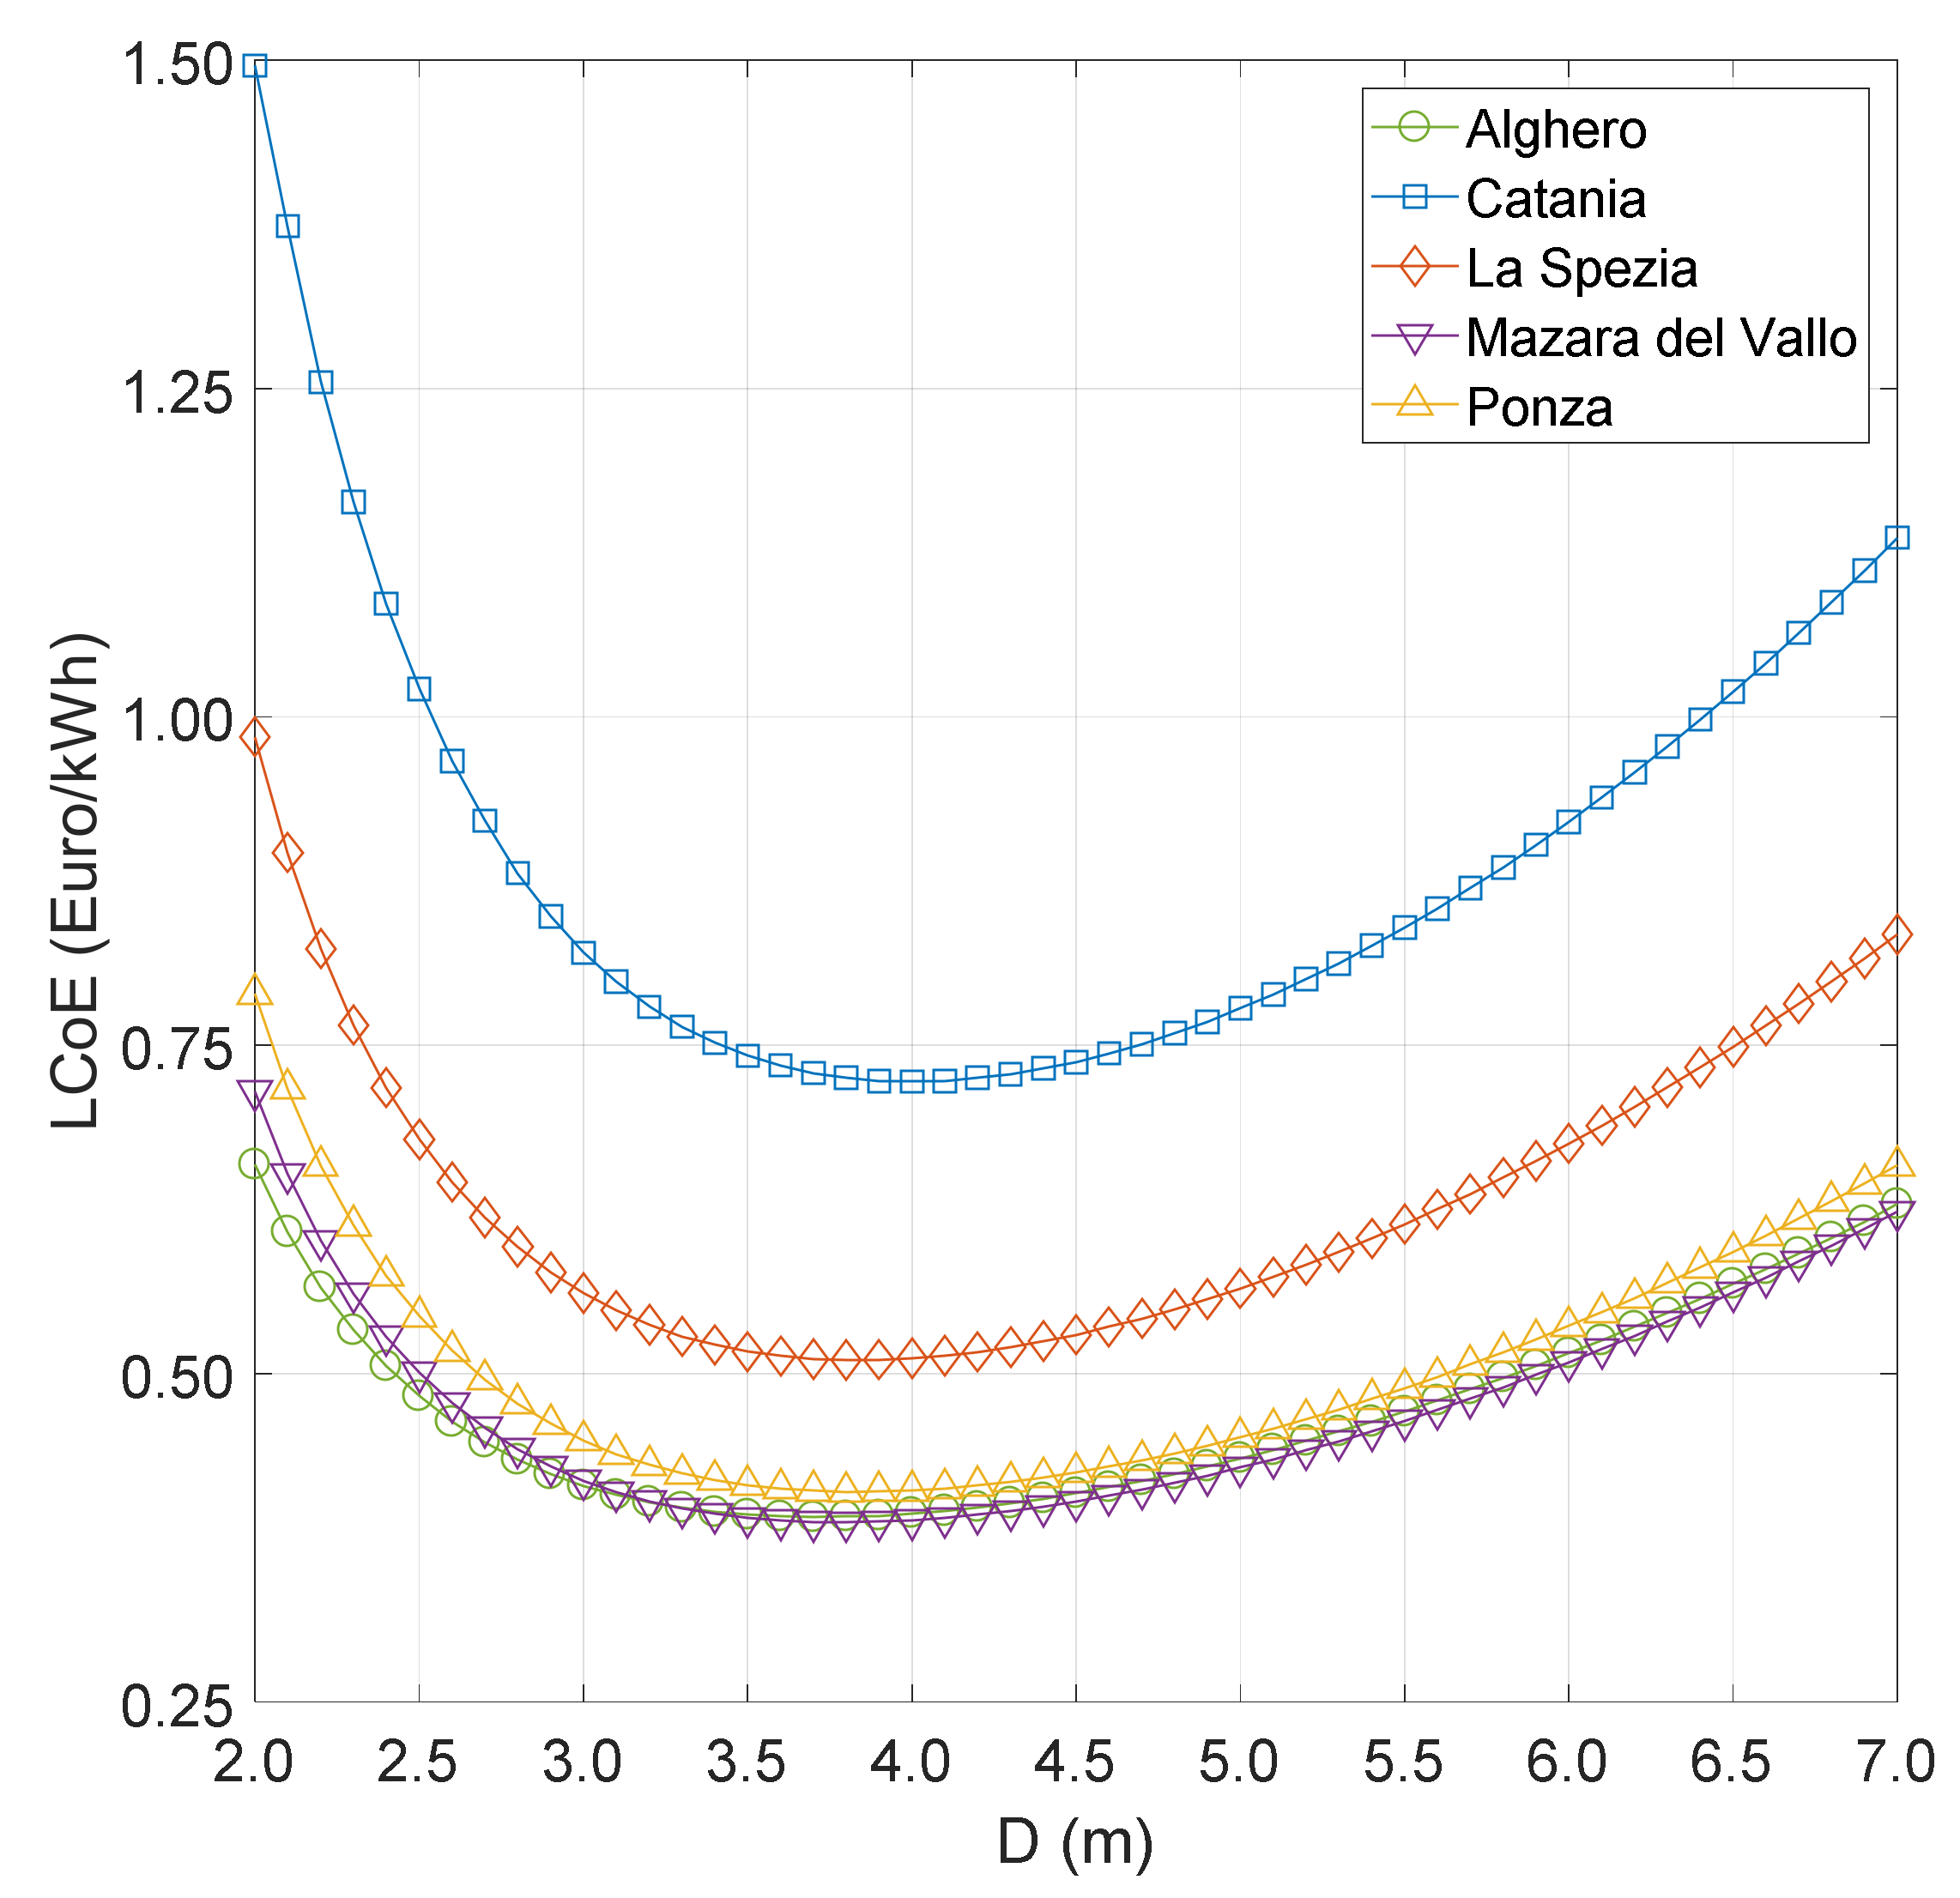
Figure 6.
Comparative analysis among optimum WEC configurations. (a) at candidate deployment sites; (b) at candidate deployment sites.
Figure 6.
Comparative analysis among optimum WEC configurations. (a) at candidate deployment sites; (b) at candidate deployment sites.

Figure 7.
distribution versus the PTO free stroke length at Alghero.
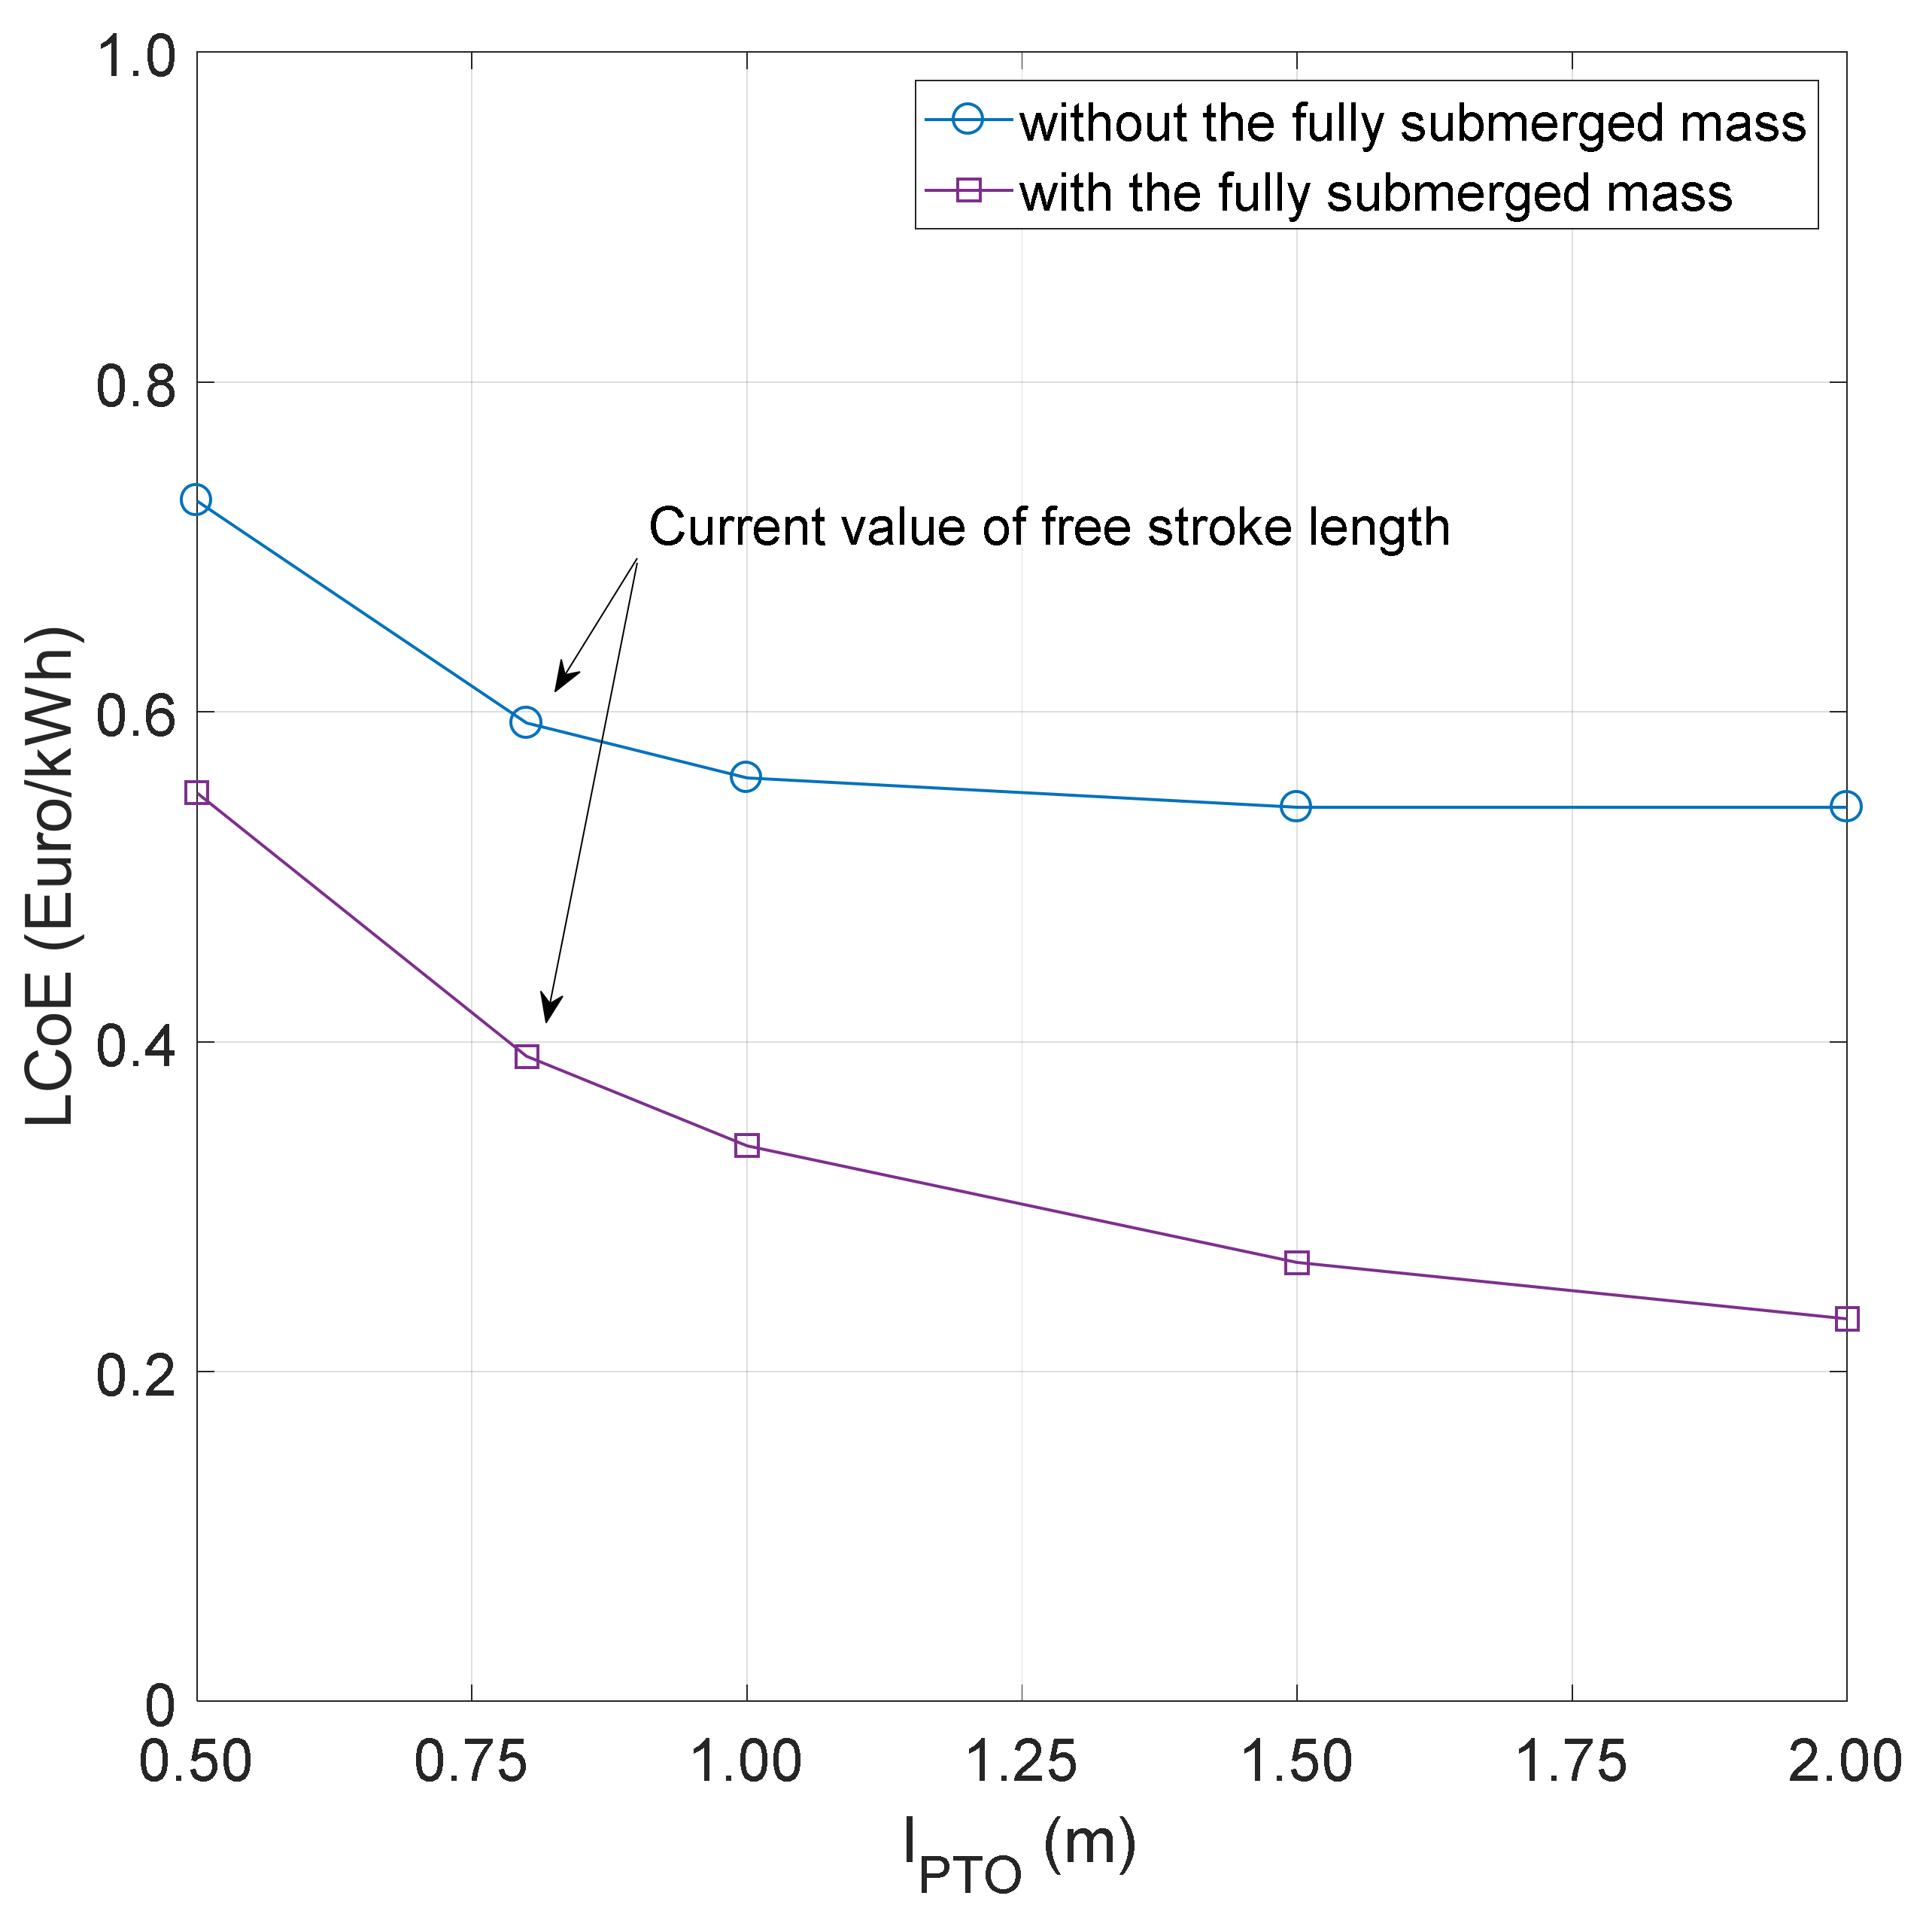
Figure 8.
distribution versus maximum significant wave height at Alghero.

Figure 9.
distribution versus .


Table 1.
Material and manufacturing costs.
| Item | Material | Current Unit Cost | Unit Cost Range |
|---|---|---|---|
| Permanent magnets | Neodymium-Iron-Boron | 80 €/kg | 60–100 €/kg |
| Stator | Electrical steel | 2 €/kg | 1.5–2.5 €/kg |
| Translator | Electrical steel | 2 €/kg | 1.5–2.5 €/kg |
| Rim | Aluminium alloy | 5 €/kg | 4–6 €/kg |
| Cables (16 mm2) | Electrical copper | 5 €/m | 4–6 €/m |
| Foundation | Marine concrete | 300 €/m3 | 200–400 €/m3 |
| Manufacturing 1 | -- | 25 €/h | --- |
| Floating buoy 2 | Normal Strength Steel | 4 €/kg | 3–4 €/kg |
1 It refers to the only assembly costs of the linear generator; 2 It includes manufacturing costs.
Table 2.
Main data of candidate sites along the Italian coastlines.
| Deployment Site | Latitude | Longitude | γ (---) | J (kW/m) | Java (kW/m) |
|---|---|---|---|---|---|
| Alghero | 40°32′54″ N | 08°06′24″ N | 1.86 | 12.53 | 5.79 |
| Catania | 37°26′18″ N | 15°08′48″ N | 2.20 | 2.58 | 2.16 |
| La Spezia | 43°55′12″ N | 09°49′06″ N | 2.02 | 3.75 | 2.98 |
| Mazara del Vallo | 37°31′00″ N | 12°32′00″ N | 1.84 | 5.25 | 4.52 |
| Ponza | 40°52′00″ N | 12°57′00″ N | 2.15 | 4.46 | 3.73 |
Table 3.
Linear generator main data.
| Rated power | 10 | kW | |
| Design speed | 0.70 | m/s | |
| Efficiency | 0.86 | --- | |
| Upper/lower stroke length | 0.8 | m | |
| Magnetic field in a tooth | 1.76 | T | |
| Tooth width | 8 | mm | |
| Width of stator side | 400 | mm | |
| Total number of poles | 100 | --- | |
| Winding ratio | 1.2 | --- | |
| Number of cables in a slot | 6 | --- | |
| Resistive load | 4.1 | Ω | |
| Generator polar pair width | 100 | mm |
Table 4.
Linear generator preliminary cost analysis.
| Item | Material | Quantity | Unit Cost | Cost (€) |
|---|---|---|---|---|
| Permanent magnets | Neodymium-Iron-Boron | 115 kg | 80 €/kg | 9200 |
| Stator | Electrical steel | 766 kg | 2 €/kg | 1532 |
| Translator | Electrical steel | 432 kg | 2 €/kg | 864 |
| Rim | Aluminium alloy | 13 kg | 15 €/kg | 195 |
| Cables (16 mm2) | Electrical copper | 1096 m | 5 €/m | 5480 |
| Foundation | Marine concrete | 15 m3 | 300 €/m3 | 4500 |
| Manufacturing | --- | 100 h | 25 €/h | 2500 |
Table 5.
Main data for LCoE assessment.
| Item | Symbol | Equation/Value | Unit |
|---|---|---|---|
| Capital cost to power ratio | €/kW | ||
| Decommissioning cost to power ratio | €/kW | ||
| Annual operating cost to power ratio | €/kW | ||
| Discount rate | 0.07 | --- | |
| Device expected lifetime | years |
Table 6.
Main data of WEC devices without the fully submerged mass.
| Location | D (m) | AEP (kWh) | CF (---) | SCI (€/kWh) | SDC (€/kWh) | OM (€/kWh) | LCoE (€/kWh) |
|---|---|---|---|---|---|---|---|
| Alghero | 3.7 | 13,289 | 0.152 | 5668 | 1134 | 283 | 0.593 |
| Catania | 4.1 | 6900 | 0.079 | 6048 | 1210 | 302 | 1.218 |
| La Spezia | 4.2 | 11,587 | 0.132 | 6149 | 1230 | 307 | 0.738 |
| Mazara del Vallo | 4.0 | 13,587 | 0.155 | 5949 | 1190 | 297 | 0.609 |
| Ponza | 4.1 | 12,871 | 0.147 | 6048 | 1210 | 302 | 0.653 |
Table 7.
Main data of WEC devices with the fully submerged mass.
| Location | D (m) | AEP (kWh) | CF (---) | SCI (€/kWh) | SDC (€/kWh) | OM (€/kWh) | LCoE (€/kWh) | Dext (m) |
|---|---|---|---|---|---|---|---|---|
| Alghero | 3.8 | 28,501 | 0.325 | 8021 | 1604 | 401 | 0.387 | 4.2 |
| Catania | 4.0 | 15,592 | 0.178 | 8105 | 1621 | 405 | 0.722 | 4.1 |
| La Spezia | 3.8 | 20,468 | 0.234 | 7515 | 1503 | 376 | 0.510 | 3.7 |
| Mazara del Vallo | 3.8 | 28,437 | 0.325 | 7915 | 1583 | 396 | 0.387 | 4.1 |
| Ponza | 3.8 | 26,480 | 0.302 | 7811 | 1562 | 391 | 0.410 | 4.0 |
Table 8.
Incidence of PTO free stroke length on main data of WEC devices without the fully submerged mass at Alghero.
Table 8.
Incidence of PTO free stroke length on main data of WEC devices without the fully submerged mass at Alghero.
| lPTO (m) | D (m) | AEP (kWh) | CF (---) | SCI (€/kWh) | SDC (€/kWh) | OM (€/kWh) | LCoE (€/kWh) |
|---|---|---|---|---|---|---|---|
| 0.5 | 3.8 | 10,652 | 0.122 | 5579 | 1116 | 279 | 0.728 |
| 0.8 | 4.0 | 13,289 | 0.152 | 5668 | 1134 | 283 | 0.593 |
| 1.0 | 3.8 | 14,521 | 0.166 | 5853 | 1171 | 293 | 0.560 |
| 1.5 | 3.8 | 14,997 | 0.171 | 5853 | 1171 | 293 | 0.542 |
| 2.0 | 3.8 | 14,997 | 0.171 | 5853 | 1171 | 293 | 0.542 |
Table 9.
Incidence of PTO free stroke length on main data of WEC devices with the fully submerged mass at Alghero.
Table 9.
Incidence of PTO free stroke length on main data of WEC devices with the fully submerged mass at Alghero.
| lPTO (m) | D (m) | AEP (kWh) | CF (---) | SCI (€/kWh) | SDC (€/kWh) | OM (€/kWh) | LCoE (€/kWh) | Dext (m) |
|---|---|---|---|---|---|---|---|---|
| 0.5 | 3.6 | 18,997 | 0.217 | 7529 | 1506 | 376 | 0.551 | 3.9 |
| 0.8 | 3.8 | 28,501 | 0.325 | 8021 | 1604 | 401 | 0.387 | 4.2 |
| 1.0 | 3.8 | 34,002 | 0.388 | 8242 | 1648 | 412 | 0.337 | 4.4 |
| 1.5 | 4.0 | 46,479 | 0.531 | 8904 | 1781 | 445 | 0.266 | 4.8 |
| 2.0 | 4.1 | 55,356 | 0.632 | 9254 | 1851 | 463 | 0.232 | 5.0 |
Table 10.
Incidence of maximum significant wave height on main data of WEC devices without the fully submerged mass at Alghero.
Table 10.
Incidence of maximum significant wave height on main data of WEC devices without the fully submerged mass at Alghero.
| HS (m) | D (m) | AEP (kWh) | CF (---) | SCI (€/kWh) | SDC (€/kWh) | OM (€/kWh) | LCoE (€/kWh) |
|---|---|---|---|---|---|---|---|
| 2.0 | 4.0 | 9636 | 0.110 | 5949 | 1190 | 297 | 0.858 |
| 2.5 | 3.9 | 11,910 | 0.136 | 5853 | 1171 | 293 | 0.683 |
| 3.0 | 3.7 | 13,289 | 0.152 | 5668 | 1134 | 283 | 0.593 |
| 3.5 | 3.7 | 14,640 | 0.167 | 5668 | 1134 | 283 | 0.538 |
| 4.0 | 3.7 | 15,527 | 0.177 | 5668 | 1134 | 283 | 0.507 |
Table 11.
Incidence of maximum significant wave height on main data of WEC devices with the fully submerged mass at Alghero.
Table 11.
Incidence of maximum significant wave height on main data of WEC devices with the fully submerged mass at Alghero.
| HS (m) | D (m) | AEP (kWh) | CF (---) | SCI (€/kWh) | SDC (€/kWh) | OM (€/kWh) | LCoE (€/kWh) | Dext (m) |
|---|---|---|---|---|---|---|---|---|
| 2.0 | 3.8 | 21,401 | 0.244 | 8021 | 1604 | 401 | 0.521 | 4.2 |
| 2.5 | 3.8 | 25,545 | 0.292 | 8021 | 1604 | 401 | 0.436 | 4.2 |
| 3.0 | 3.8 | 28,501 | 0.325 | 8021 | 1604 | 401 | 0.387 | 4.2 |
| 3.5 | 3.7 | 30,407 | 0.347 | 7930 | 1586 | 396 | 0.362 | 4.2 |
| 4.0 | 3.7 | 31,821 | 0.363 | 7930 | 1586 | 396 | 0.346 | 4.2 |
© 2018 by the authors. Licensee MDPI, Basel, Switzerland. This article is an open access article distributed under the terms and conditions of the Creative Commons Attribution (CC BY) license (http://creativecommons.org/licenses/by/4.0/).
Share and Cite
MDPI and ACS Style
Piscopo, V.; Benassai, G.; Della Morte, R.; Scamardella, A. Cost-Based Design and Selection of Point Absorber Devices for the Mediterranean Sea. Energies 2018, 11, 946. https://doi.org/10.3390/en11040946
AMA Style
Piscopo V, Benassai G, Della Morte R, Scamardella A. Cost-Based Design and Selection of Point Absorber Devices for the Mediterranean Sea. Energies. 2018; 11(4):946. https://doi.org/10.3390/en11040946
Chicago/Turabian StylePiscopo, Vincenzo, Guido Benassai, Renata Della Morte, and Antonio Scamardella. 2018. "Cost-Based Design and Selection of Point Absorber Devices for the Mediterranean Sea" Energies 11, no. 4: 946. https://doi.org/10.3390/en11040946
Note that from the first issue of 2016, this journal uses article numbers instead of page numbers. See further details here.