Energy-Saving Potential of China’s Steel Industry According to Its Development Plan

1
School of Energy and Environmental Engineering, University of Science and Technology Beijing, Beijing 100083, China
2
Beijing Engineering Research Center for Energy Saving & Environmental Protection, Beijing 100083, China
3
Hanbao Steel Energy Center, Handan 056015, China
4
Birmingham Centre for Energy Storage, School of Chemical Engineering, University of Birmingham, Birmingham B15 2TT, UK
*
Author to whom correspondence should be addressed.
Energies 2018, 11(4), 948; https://doi.org/10.3390/en11040948
Submission received: 13 March 2018
/
Revised: 7 April 2018
/
Accepted: 8 April 2018
/
Published: 16 April 2018
(This article belongs to the Section I: Energy Fundamentals and Conversion)
Abstract
:The energy consumption of China’s steel industry accounted for 53% of the global steel industry energy consumption in 2014. This paper aims to analyze the energy saving potential of China’s steel industry, according to its development plan of the next decade, and find the key of energy conservation. A multivariate energy intensity (MEI) model is developed for energy saving potential analysis based on the research on China’s energy statistics indexes and methods, which is able to capture the impacts of production routes, technology progress, industrial concentration, energy structure, and electricity (proportion and generation efficiency). Different scenarios have been set to describe future policy measures in relation to the development of the iron and steel industry. Results show that an increasing scrap ratio (SR) has the greatest energy saving effect of 16.8% when compared with 2014, and the maximum energy saving potential reaches 23.7% after counting other factors. When considering coal consumption of power generation, the energy saving effect of increasing SR drops to 7.9%, due to the increase on the proportion of electricity in total energy consumption, and the maximum energy saving potential is 15.5%, and they can increase to 10.1% and 17.5%, respectively, with improving China’s power generation technology level.
1. Introduction
China is currently the world’s largest steel producer, and the energy consumption of China’s steel industry accounted for 53% of the total energy consumption of the world’s iron and steel industry [1,2]. The energy intensity (EI) of China’s steel industry has a direct effect on the overall energy utilization. It is therefore important to analyze the future energy consumption and to find the key of energy saving to improve energy efficiency of China’s steel industry.
As the world’s largest steel producing country, China is a prominent and important global and national case study for scenario analysis, and a number of energy-modeling approaches have been used to analyze its future energy intensity trends and to assess policy support for energy-saving [2,3,4,5,6,7,8]. These can be categorized into two types: bottom-up (BU) and top-down (TD) models. BU type model has a detailed representation of energy technologies in a partial equilibrium framework and assess the trends and financial costs of different technological options. However, due to their structure, BU models are unable to capture the full macro impacts of energy policies. By contrast, TD models are able to calculate macro-economic costs and the impacts of energy policies, however at the expense of specific sectoral or technological details [9].
The advantages of BU models are the disadvantages of TD models and vice versa. Due to disciplinary and structural differences, these two types of models cannot demonstrate wide ranges of future projection of energy trajectories at both the macroscopic and technical levels. Ref. [10] tried to complement each type model’s advantages and disadvantages by exchanging information between a detailed BU model with simplified macroeconomic module; Proença and Aubyn [11] integrated TD and BU models by representing detailed energy technologies within the TD framework; Fujimori etc. Ref. [12] developed an Integrated Assessment Models (IAM)/computable general equilibrium (CGE) model that was integrating detailed energy end-use technologies.
These studies focused on coupling existing models without exploring the calculation approach or EI impact factors of the steel industry besides existing ones. According to the development plan issued by the Chinese government in recent years, the production situation of China’s steel industry will change significantly by in next decade, including both macro and technical impact factors, such as raw materials, production routes, technology progress, industrial concentration, energy structure, and electricity (proportion in energy consumption and generation efficiency). However, using existing models in early studies cannot comprehensively analyze the future energy consumption trends of China’s steel industry, as no existing models are able to capture the influence of all these factors. Furthermore, the energy statistics system are the basis of energy related analysis and research, and data calculated according to their definition and statistical method is the most reasonable; however, to the best of our knowledge, no detail exercise with focus on the energy statistics system of China’s steel industry was carried out yet.
The work presented in this paper is a unique study for China’s steel industry, as it focused on the main factors that impact on EI of China’s steel industry through detailed research of China’s energy statistical system, and predicted production situation of China’s iron and steel industry in the next decade according to its development plan. On this basis, a multivariate energy intensity (MEI) calculation approach is developed to analyze the future energy consumption of China’s steel industry based on energy statistics methods and indexes of China’s steel industry, in which macro impact factors and technical factors are both considered to assess a wide range of energy related policies. Different scenarios have been set to analyze the energy saving potential of each impact factors, which aim to find the key point of energy conservation of China’s steel industry.
In addition, the results are calculated using two methods, namely, calorific value calculation (CVC) and coal equivalent calculation (CEC) methods, so the influence of electricity (proportion in energy consumption and generation efficiency) can also be considered.
2. Boundary and Description
There are many factors that impact on EI of steel industry; in this paper, according to development plan of next decade that was issued by the Chinese government, we mainly focus on raw materials, technology, production routes, industrial structure, energy structure (electricity and natural gas), and coal consumption of power generation (Figure 1).
2.1. Raw Materials
The global iron and steel industry has two main iron sources: iron ore and scrap. The former is a natural resource, and the latter is a reclaimed renewable resource. In 2014, about 65% of the global steel production was from iron ore, and 35% was from scrap steel [13]. In steel industry, scrap ratio (SR) is used to define scrap consumption situation:
The SR of China’s steel industry is 10.7% in 2014, which is significantly lower than the world average level of 35.1%. SR has a critical impact on the steel industry of a country or region, including production structure and energy structure.
“Use more steel scraps and concentrate materials in the furnace” is the development direction of China’s steel industry. After years of accumulation, China’s current scrap storage is sufficient, and China is stepping up its efforts to improve its scrap recycling and utilization system, so more scrap steel resources will be recycled in the future [14]. According to the prediction, China’s recyclable scrap resources will be 150 million tons in 2020, and the scrap ratio of steel enterprises should not be less than 30% by 2025 [15].
2.1.1. Influence of SR on Production Routes
Globally, steel is produced via two main routes, namely, the blast furnace– basic oxygen furnace (BF-BOF) and electric arc furnace (EAF) routes. The key difference between the two routes is the type of raw materials they consume. The BF-BOF route, which utilizes iron ore and scrap, uses between 70% and 100% of iron ore, with the balance being made up of scrap. The EAF route, which utilizes direct reduced iron (DRI), scrap, and cast iron, uses between 70% and 100% scrap material, with the balance being made up of ore-based materials.
The scrap/EAF route is less energy-intensive (which uses 4–6 GJ/t of iron that is produced when using 100% scrap) than the BF-BOF route (which uses 13–14 GJ/t of iron produced) [16]. So, significant energy conservation and emission reduction effects can be achieved by converting the BF-BOF route to the EAF route. However, the biggest obstacle to achieving this transformation is the availability of scrap, especially in countries where scrap resources are scarce. The EAF steel ratio is China is lagging those of Japan, Unites States (US), and the world’s average (Table 1) due to the scarcity of scrap, which seriously affects the EI of China’s iron and steel industry [17,18].
When the SR of China’s steel industry increases, considerable scrap can be used for the EAF route. Thus, the proportion of EAF steel in the total steel production will increase. According to the scrap balance in the steel industry, the share of EAF route can be calculated, as follows:
where and are the production proportions of the BF-BOF and EAF routes, respectively; and are the SRs in the BF-BOF and EAF routes.
The SRs in the BF-BOF and EAF routes will all increase with that of SR of China’s steel industry. According to world best practice in steel production, in the BF-BOF route, when the SR is 10%, the energy consumption can be reduced to lowest; whereas, in the EAF route, when the SR is 100%, the energy consumption can be reduced to lowest [19].
2.1.2. Influence of SR on Energy Structure
The main energy source of the BF-BOF route is coal, and that of the EAF route is electricity. In 2014, only 6.1% of steel was produced via the EAF route in China. Thus, only 10.2% of the total energy consumption of the steel industry was from electricity [20]. When the SR of China’s steel industry increases, the proportion of electricity consumption increases with that of the EAF route. The proportion of electricity consumption in the total energy consumption can be calculated by the following formula:
where and are the proportions of electricity in the energy consumption of the BF-BOF and EAF routes, respectively; is the proportion of electricity in the steel industry.
In the BF-BOF route, when the SR is 10%, is about 5%; whereas, in the EAF route, when the SR is 100%, is about 65% [19].
2.2. Technology
The production of iron and steel consists of multiple complex processes, such as sintering, coking, iron making, steelmaking, and rolling (Figure 1). The level of energy-saving technology in steel production affects the energy consumption of each process, and the energy consumption of each process affects the overall energy consumption of steel production. In addition, electricity also has a great influence on primary energy consumption, so the power generation technology is also studied by designing different scenarios.
2.3. Industry Concentration
In China’s steel industry, steel enterprises are divided into key steel enterprises and mall-scale steel enterprises. In 2014, the production of key steel enterprises accounted for 82.5% of China’s total steel production, and the other 17.5% was from small-scale steel enterprises [18]. In China, EI varies among steel enterprises of different scales, and the EI of small steel enterprises is generally higher than that of key steel enterprises, due to small size production equipment being mostly used in small steel enterprises, which are of high production energy consumption [21,22].
In this study, the change of proportion of key steel enterprises is considered into two cases: (a) small enterprises upgraded to key enterprises; (b) remain unchanged. In addition, China’s key steel enterprises are further divided into CR10 enterprises (industrial concentration of top 10 steel enterprises) and medium-scale enterprises (the other key enterprises). In 2014, CR10 of China’s steeel industry is 36.6%, and there is a wide gap of industry concentration when compared with Japanese steel industries, whose CR5 is over 80% [23].
In the background of overcapacity in the global steel industry, China also announced that steel production capacity will not increase in the future, and focus on the adjustment of the industrial structure of the steel industry and encourages steel enterprises to merge and restructure to the large-scale development of enterprises. According to the development plan of China’s iron and steel industry, the CR10 of China’s steeel industry will rise to over 60% in 2025 [15,24].
2.4. Proportion of Natural Gas in Energy Consumption
The high proportion of coal in energy consumption is another factor that affects the energy efficiency of China’s steel industry. In 2014, the proportion of coal usage in the total energy consumption of China’s steel industry was 78%, which is much higher than the 24% of the United States and 55% of Japan; the proportion of natural gas in the total energy consumption of China’s steel industry was only 1%, which is lagging the 53% of the United States and 24% of Japan.
In industrial production, the efficiency of natural gas is higher than that of coal. In China, 1 m3 of natural gas can save 0.16–0.41 kg of standard coal when being used as an industrial fuel to produce the same amount of heat as coal [25]. Therefore, the use of natural gas instead of coal in the industry can increase energy efficiency.
In recent years, China has published several policies to promote the use of natural gas, and reduce coal consumption in steel production [26,27]. According to the development plan of China’s iron and steel industry, the proportion of natural gas in primary energy consumption will rise to over 10% in 2020 [27], and the energy saving efficiency of natural gas replacing coal in steel production is calculated as:
where is the increase proportion of natural gas in energy consumption of steel production; is the energy saving rate of replacing coal by natural gas, which is about 20% when being used as an industrial fuel to produce the same amount of heat [25].
3. Methodology
The above factors affect the EI of China’s steel industry in different ways. In order to estimate the energy saving potential and find the key point of energy conservation of China’s steel industry, influence of each factors on the EI of China’s steel industry should be analyzed in a unified EI calculation system, so a MEI approach is developed based on the research on China’s energy statistics methods and indexes, in which all the factors above are considered.
3.1. Conversion Formula between Different Energy Statistical Methods
In China energy statistics system, the statistical methods of energy consumption can be divided into calorific value calculation (CVC) method and coal equivalent calculation (CEC) method.
The difference between the CVC and CEC methods is their conversion coefficients of power. In the CVC method, the conversion factors from electricity to standard coal is 0.123 kgce/kwh; in the CEC method, the conversion factors from the electricity to coal equivalent is the standard coal consumption of thermal power generation in the corresponding year, which was 0.300 kgce/kwh in 2014 [20].
In this study, in order to analyze the influence of electricity (proportion in energy consumption and coal consumption of power generation), data from the CVC and CEC methods are both discussed, and the conversion formulas for the two methods are created according to their difference:
where is the proportion of electricity in the total energy consumption of the steel industry, %; C is the coal consumption rate of thermal power generation, kgce/kwh; is the conversion factor from electricity to coal equivalent, which is 0.123 kgce/kwh, according to China’s energy statistical system.
3.2. EI Calculation Model
3.2.1. EI Index for China’s Steel Industry
Presently, two EI indexes are used for China’s steel industry: comprehensive EI and comparable EI.
Comprehensive EI: The ratio of total energy consumption to steel production in a certain statistical period, that is, the energy consumption that produces 1 ton of steel [28]:
where is the energy consumption of the i category energy (coal, electricity, natural gas and oil, etc.), kgce; P is the total steel production, t.
The comprehensive EI is mainly used for the assessment and analysis the energy consumption level of a steel enterprise over the years, it reflects the change of overall energy consumption and utilization efficiency, and this index mainly serves the energy statistics and management of iron and steel industry.
Comparable EI: The average energy consumption of steel production processes (including coking, sintering, pelletizing, ironmaking, steel making, and steel processing), processing and transportation of fuel, locomotive transportation, and changes in enterprise energy stock producing per ton of steel [28]:
where is the production of i process, t; is the average energy consumption of the i process, kgce/t product; I, J, and K are the energy consumption for processing and transportation of fuel, energy consumption of locomotive transportation, and changes in enterprise energy stock, respectively.
The Comparable EI is defined to compare the energy consumption levels between different steel enterprises, and it is actually a superposition of energy consumption in each production process, and is used as an indicator for energy consumption comparison of steel production in different enterprises or countries, but it cannot be used as the basis of total energy consumption calculation of steel enterprises [29].
This paper mainly focuses on the total energy saving potential of China’s steel industry, so the comprehensive EI index is chosen as the final evaluation index.
3.2.2. Auxiliary System Energy Consumption Ratio
Formula (7) shows that the influence of energy structure and industry concentration on EI can be reflected by the comprehensive EI, while the influence of technology, production route can be reflected by the comparable EI, according to Formula (8). In this paper, the relationship between the comprehensive and comparable EIs should be further studied to conduct a comprehensive analysis of all the factors.
From the perspective of the range of two EI indexes, the range of comprehensive EI is wider than that of comparable EI. The range of comprehensive EI includes the energy consumption of steel production and the auxiliary and subsidiary systems of steel production, whereas the range of comparable EI only includes the energy consumption of steel production [29].
In this study, the auxiliary system energy consumption ratio is defined as , and the relationship between comprehensive EI and comparable EI is as follows:
where includes the energy consumption of mines, ore dressing, ferroalloy, refractory materials, carbon products, coking products recycling, refined, production of other products, machine repair, and power production.
3.2.3. Non-Major Process Energy Consumption Ratio
On the basis of Formula (8), ratios , and are merged into , which is called the steel coefficient ratio of the i process [30]; and, in this paper, only the energy consumption of major production processes is considered, and the non-major process energy consumption ratio is defined as . Then, Formula (8) is transformed into to:
where i is the major production process, which includes sintering, pelletizing, coking, iron making, steel making, and steel rolling; is the energy consumption of non-major processes, including processing and transportation of fuel, locomotive transportation, and changes in enterprise energy stock.
3.2.4. Calculation Formula
When considering the industrial structure, the calculation formula of comprehensive EI is
where is the comprehensive EI of scale enterprises; is the production proportion of scale enterprises.
By combining Formulas (9) and (10), two forms calculation formula of comprehensive EI are provided:
Major-process calculation form of comprehensive EI is calculated according to production and energy consumption data of major steel production processes (including coking, sintering, pelletizing, ironmaking, steel making, and steel processing):
When considering the industrial structure:
where and are the steel coefficient ratio and EI of the i process in scale enterprises, respectively.
Production route calculation form of comprehensive EI is calculated according to the production and energy consumption data of EAF and BF-BOF routes:
Consider the industrial structure:
where and are the steel coefficient ratio and EI of the j route in scale enterprises, respectively.
3.3. Calculation Parameter
According to the statistics of production of the major processes of Chinese key steel enterprises from 2007 to 2014, the steel coefficient ratio (production of i process/total steel production) for major processes can be calculated, which is shown in Table 2, and the EI of each production process is shown in Table 3.
4. Results and Discussion
4.1. Parameter Determination and Accuracy Verification
4.1.1. Parameter Determination
Auxiliary System of Energy Consumption Ratio
The comprehensive and comparable EIs of China’s key steel enterprises from 2007 to 2014 are shown in Table 4. The auxiliary system of energy consumption ratio can be calculated by Formula (9), and it fluctuated between 2.18% and 7.62% from 2007 to 2014, as seen from Table 4, and the average value of 4.38% is used as the calculation parameter for the comprehensive EI calculation model.
Non-Major Process of Energy Consumption Ratio
After the value of is determined, the only unknown value in Formula (12) is . When combining the EI of major processes in Table 3 and the steel coefficient ratio in Table 2, the non-major process energy consumption ratio of China’s steel industry from 2007 to 2014 can be calculated from Formula (12) (Table 5). It can be seen that fluctuated between 3.11% and 8.66% from 2007 to 2014, and the average value of 6.43% is used as the calculation parameter for the comprehensive EI calculation model.
4.1.2. Accuracy Verification
According to the calculation, the value and fluctuated within a certain range from 2007 to 2014, and the calculation parameters of MEI model are determined by the adoption of average and values. In this part, after determining the value and , the accuracy of the MEI approach is validated, according to the data in Table 2, Table 3 and Table 4. The result shows the error calculated from the comprehensive EI calculation model of China’s steel industry from 2007 to 2014 is between 0.11% and 1.66%, and the average error rate is 0.66%, which indicates the high credibility of the adoption of average and values in the MEI model.
4.2. China’s Steel Industry in 2025
4.2.1. Production Situation
According to the planning, the SR of the steel industry should rise to 30% by 2025. On this basis, the production proportions of the BF-BOF and EAF routes are 78% and 22%, respectively (the SRs of the BOF and EAF routes are 10% and 100%, respectively), which are calculated by Formulas (2) and (3). According to Formula (4), the proportion of electricity in the total energy consumption of the steel industry will rise to 18.2%. At the same time, the proportion of natural gas in the total energy consumption will rise from 0.7 to 10%, according to the policy planning. In the case of other unchanged energy consumption proportions, the proportion of coal in the total energy consumption will drop to 59%.
4.2.2. EI Analysis
EI of Different Scale Steel Enterprises in 2014
In 2014, the comprehensive EI of Chinese key steel enterprises in 2014 is 588.13 kgce/t, but the EI of small-scale steel enterprises is not counted in China’s statistical system and it should be calculated by the EI calculation model.
China published the EI standard of steel production in 2010 and 2014 [34,35], which defined the maximum EI of major processes in steel production, and the limit value of EI of sintering, pelletizing, coking, blast furnace, BOF, and EAF processes are, respectively, 56 kgce/t, 36 kgce/t, 155 kgce/t, 446 kgce/t, 0 kgce/t, and 92 kgce/t. According to the EI limit for major processes, combining the steel coefficient ratio shown of major processes in Table 2, the comparable EI of small-scale steel enterprises can be calculated using Formula (12) (shown in Figure 2).
Seen from Figure 2, the comprehensive EI of small-scale steel enterprises in 2014 was 685.04 kgce/t, which was 16.48% higher than that of the key enterprises. On this basis, as calculated from Formula (14), the comprehensive EI of total Chinese steel enterprises in 2014 is 605.08 kgce/t.
Data from CEC Method
In 2014, the proportion of electricity in the total energy consumption of the steel industry was 10.2% in CVC method, and the coal consumption rate of fossil-fired power plant in 2014 was 300 kgce/kwh. Converted by Formula (11), in CEC method, the comprehensive EI of China’s steel industry in 2014 was 694.01 kgce/t.
EI of Different Scale Steel Enterprises in 2025
In steel production, 1 ton of scrap can produce about 1 ton of steel [36]. The SR of China’s steel industry in 2014 is 10.7%, so, when producing 1 ton steel, 0.893 ton steel is produced by the iron-making system. When the SR of China’s steel industry increased to 30% in 2025, 0.7 t steel is produced by the iron-making system, so the steel coefficient ratio of the iron-making system in 2025 is 78.39% of that in 2014.
At the technical production level in 2014, according to Formula (12), the comprehensive EI of China’s key steel enterprises will be 489.60 kgce/t (Figure 2), which is 16.8% lower than that in 2014; and the comprehensive EI of small enterprises will be 570.62 kgce/t, which is 16.2% lower than that in 2014.
In addition to increasing the SR, the situation of technology progress in large enterprises is also considered. The advanced EI level of steel production worldwide indicates that, in the BF-BOF route, when SR is 10%, then the EI of major processes can be reduced to 504 kgce/t, whereas in the EAF route, when the SR is 100%, the EI of major processes can be reduced to 87.5 kgce/t [19]. On this basis, when the SR of steel production rises to 30%, the comprehensive EI of large enterprise will be 458.11 kgce/t, according to Formula (14) (Figure 2).
4.3. Energy-Saving Potential in 2025
4.3.1. Scenario Design
Influence of Each Main Influence Factor
As many changes are involved when estimating energy saving potential, so the energy saving potential of each change is calculated first in order to analyze the influence of each factor on EI (Table 6).
As shown in Table 6, increasing the SR has the greatest energy saving effect, which is 16.8%; and the technical progress of CR10 enterprises can reduce the comprehensive EI by 5.1%, and on this basis, increasing the concentration of CR10 increased to 60% can further decrease the comprehensive EI by 8.3%.
Scenario Design
In this study, five different scenarios are explored in estimation of energy-saving potential of China’s steel industry in 2025:
- Scenario A: Only consider the impact of increased SR, which would reach 30% in 2025 (SR of China’s steel industry in 2014 is 10.7%).
- Scenario B: Consider the impact of increased SR and proportion of natural gas (from 1% in 2014 to 10% in 2025).
- Scenario C: Consider the impact of increased SR and proportion of natural gas, and the technical progress of small-scale enterprises (reach the level of key enterprises).
- Scenario D: Consider the impact of increased SR and proportion of natural gas, and the technical progress of CR10 (reach the advanced level of the world).
- Scenario E: Impact of all the factors are considered, including increased SR and proportion of natural gas, and the technical progress of CR10, and technical progress of small-scale enterprises.
4.3.2. Energy-Saving Potential the CVC Method
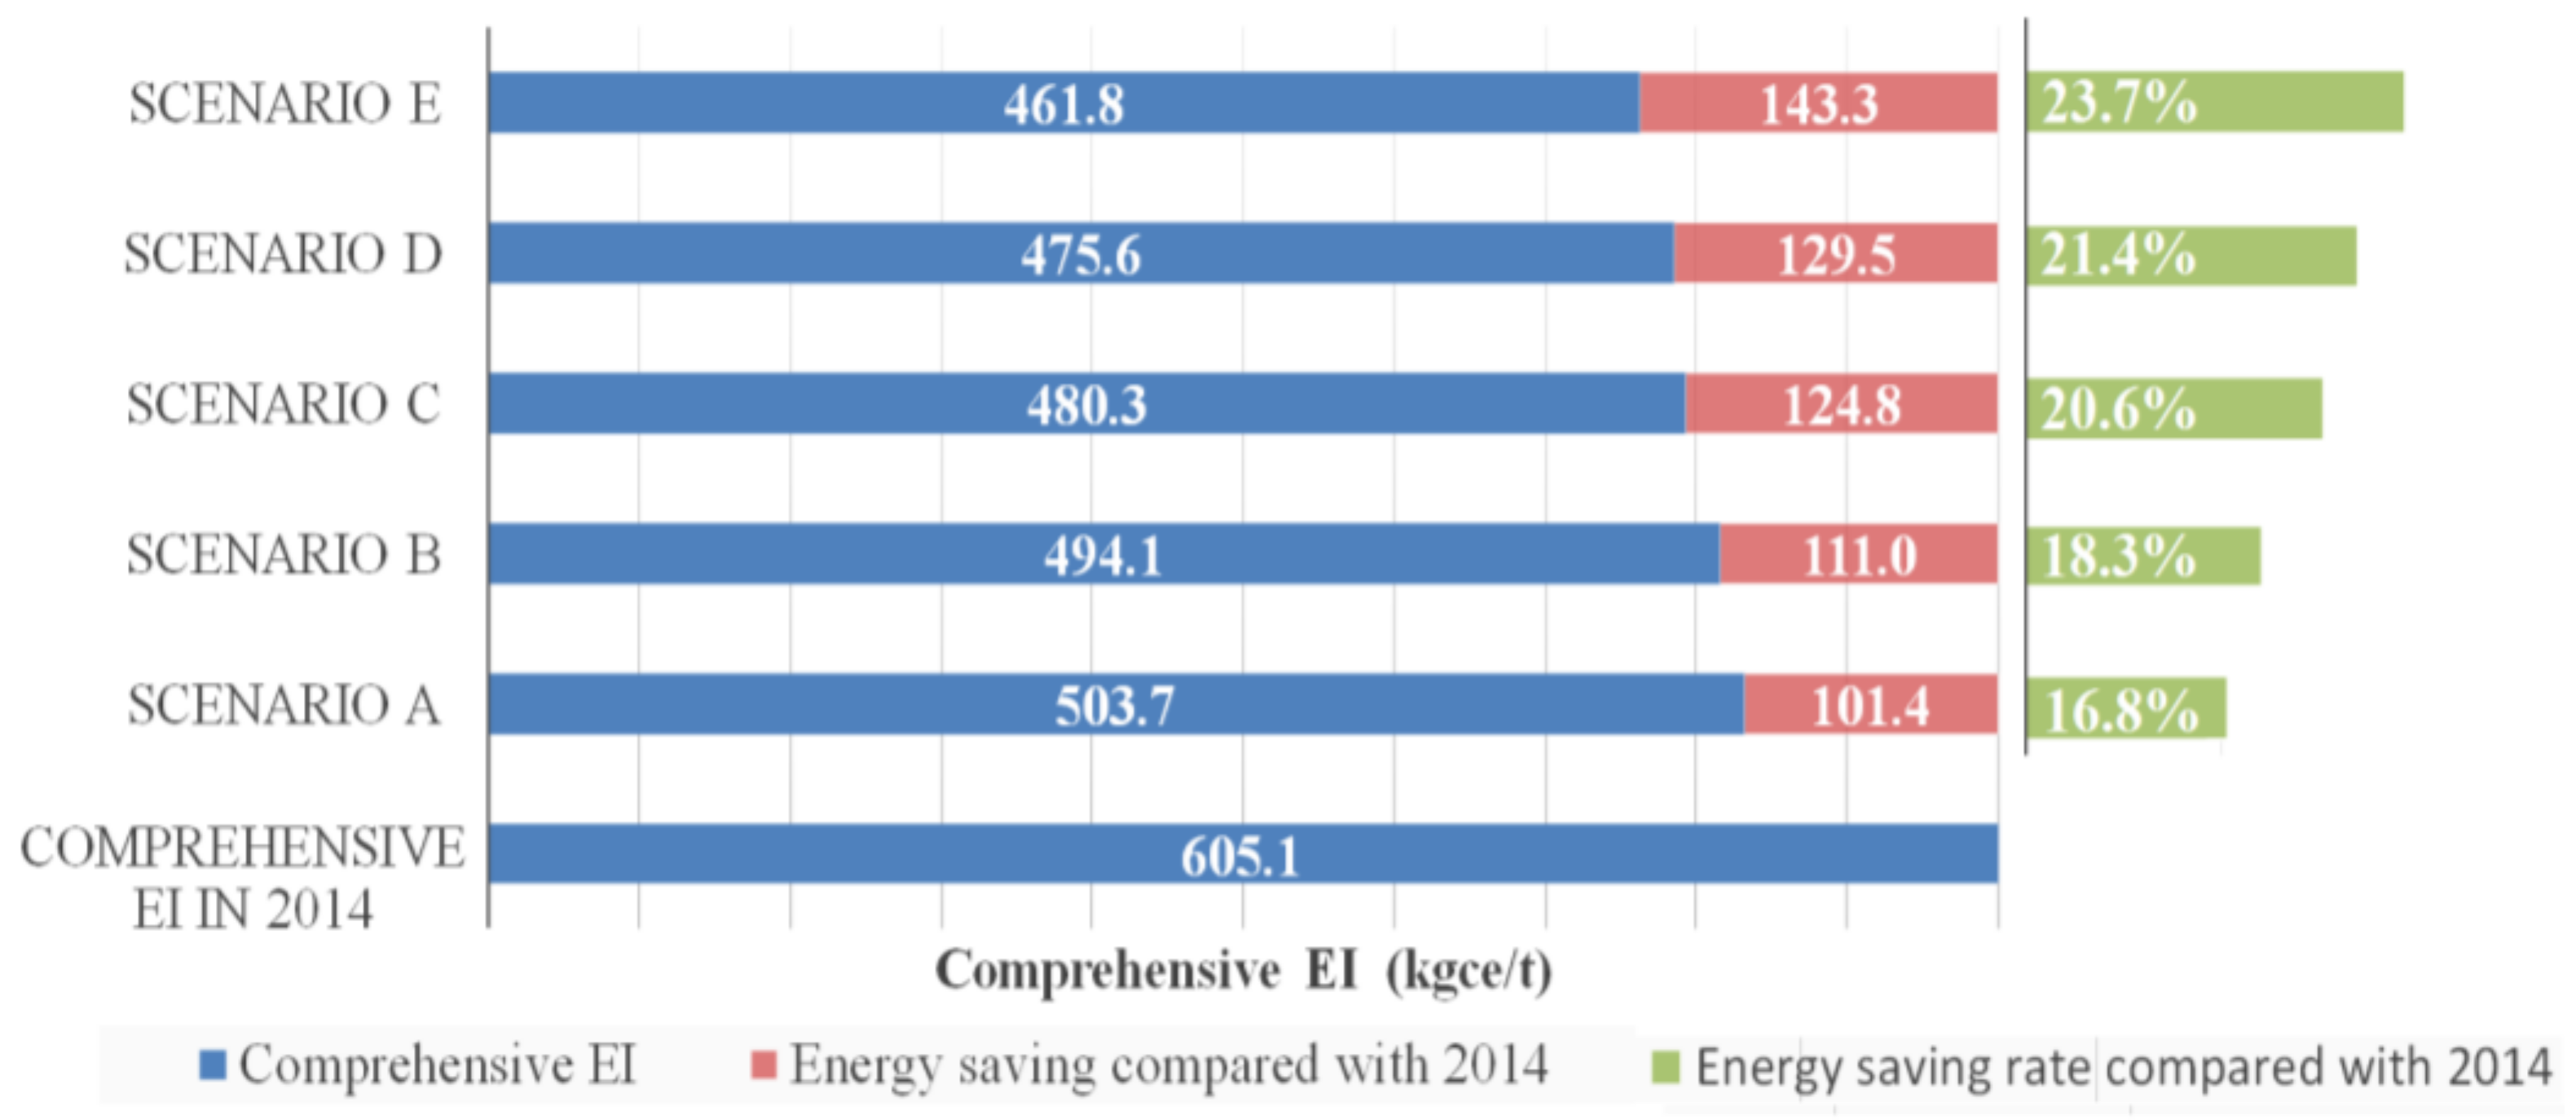
In this part, according to EI different scale steel enterprises in Figure 2. The energy-saving potential of China’s steel industry in 2025 in different scenarios is calculated by Formulas (5) and (15). When considering the effect of SR change, technological progress, industrial concentration changes, and energy structure change, the energy saving potential in different scenarios is shown in Figure 3.
In 2025, the comprehensive EI of China’s steel industry will be between 461.8 kgce/t and 503.7 kgce/t, which is 101.4–143.3 kgce/t lower than that in 2014, and the energy saving rate will be between 16.8% and 23.7% as compared with 2014.
Through comparison of energy-saving potential of different scenarios, increasing SR has the greatest energy saving effect, which is 16.8%; on the basis of increasing SR, increasing proportion of natural gas and technical progress of CR10, and technical progress of small-scale enterprises can further decrease the comprehensive EI of China’s steel industry by 23.7%.
4.3.3. Result Analysis under the CEC Method
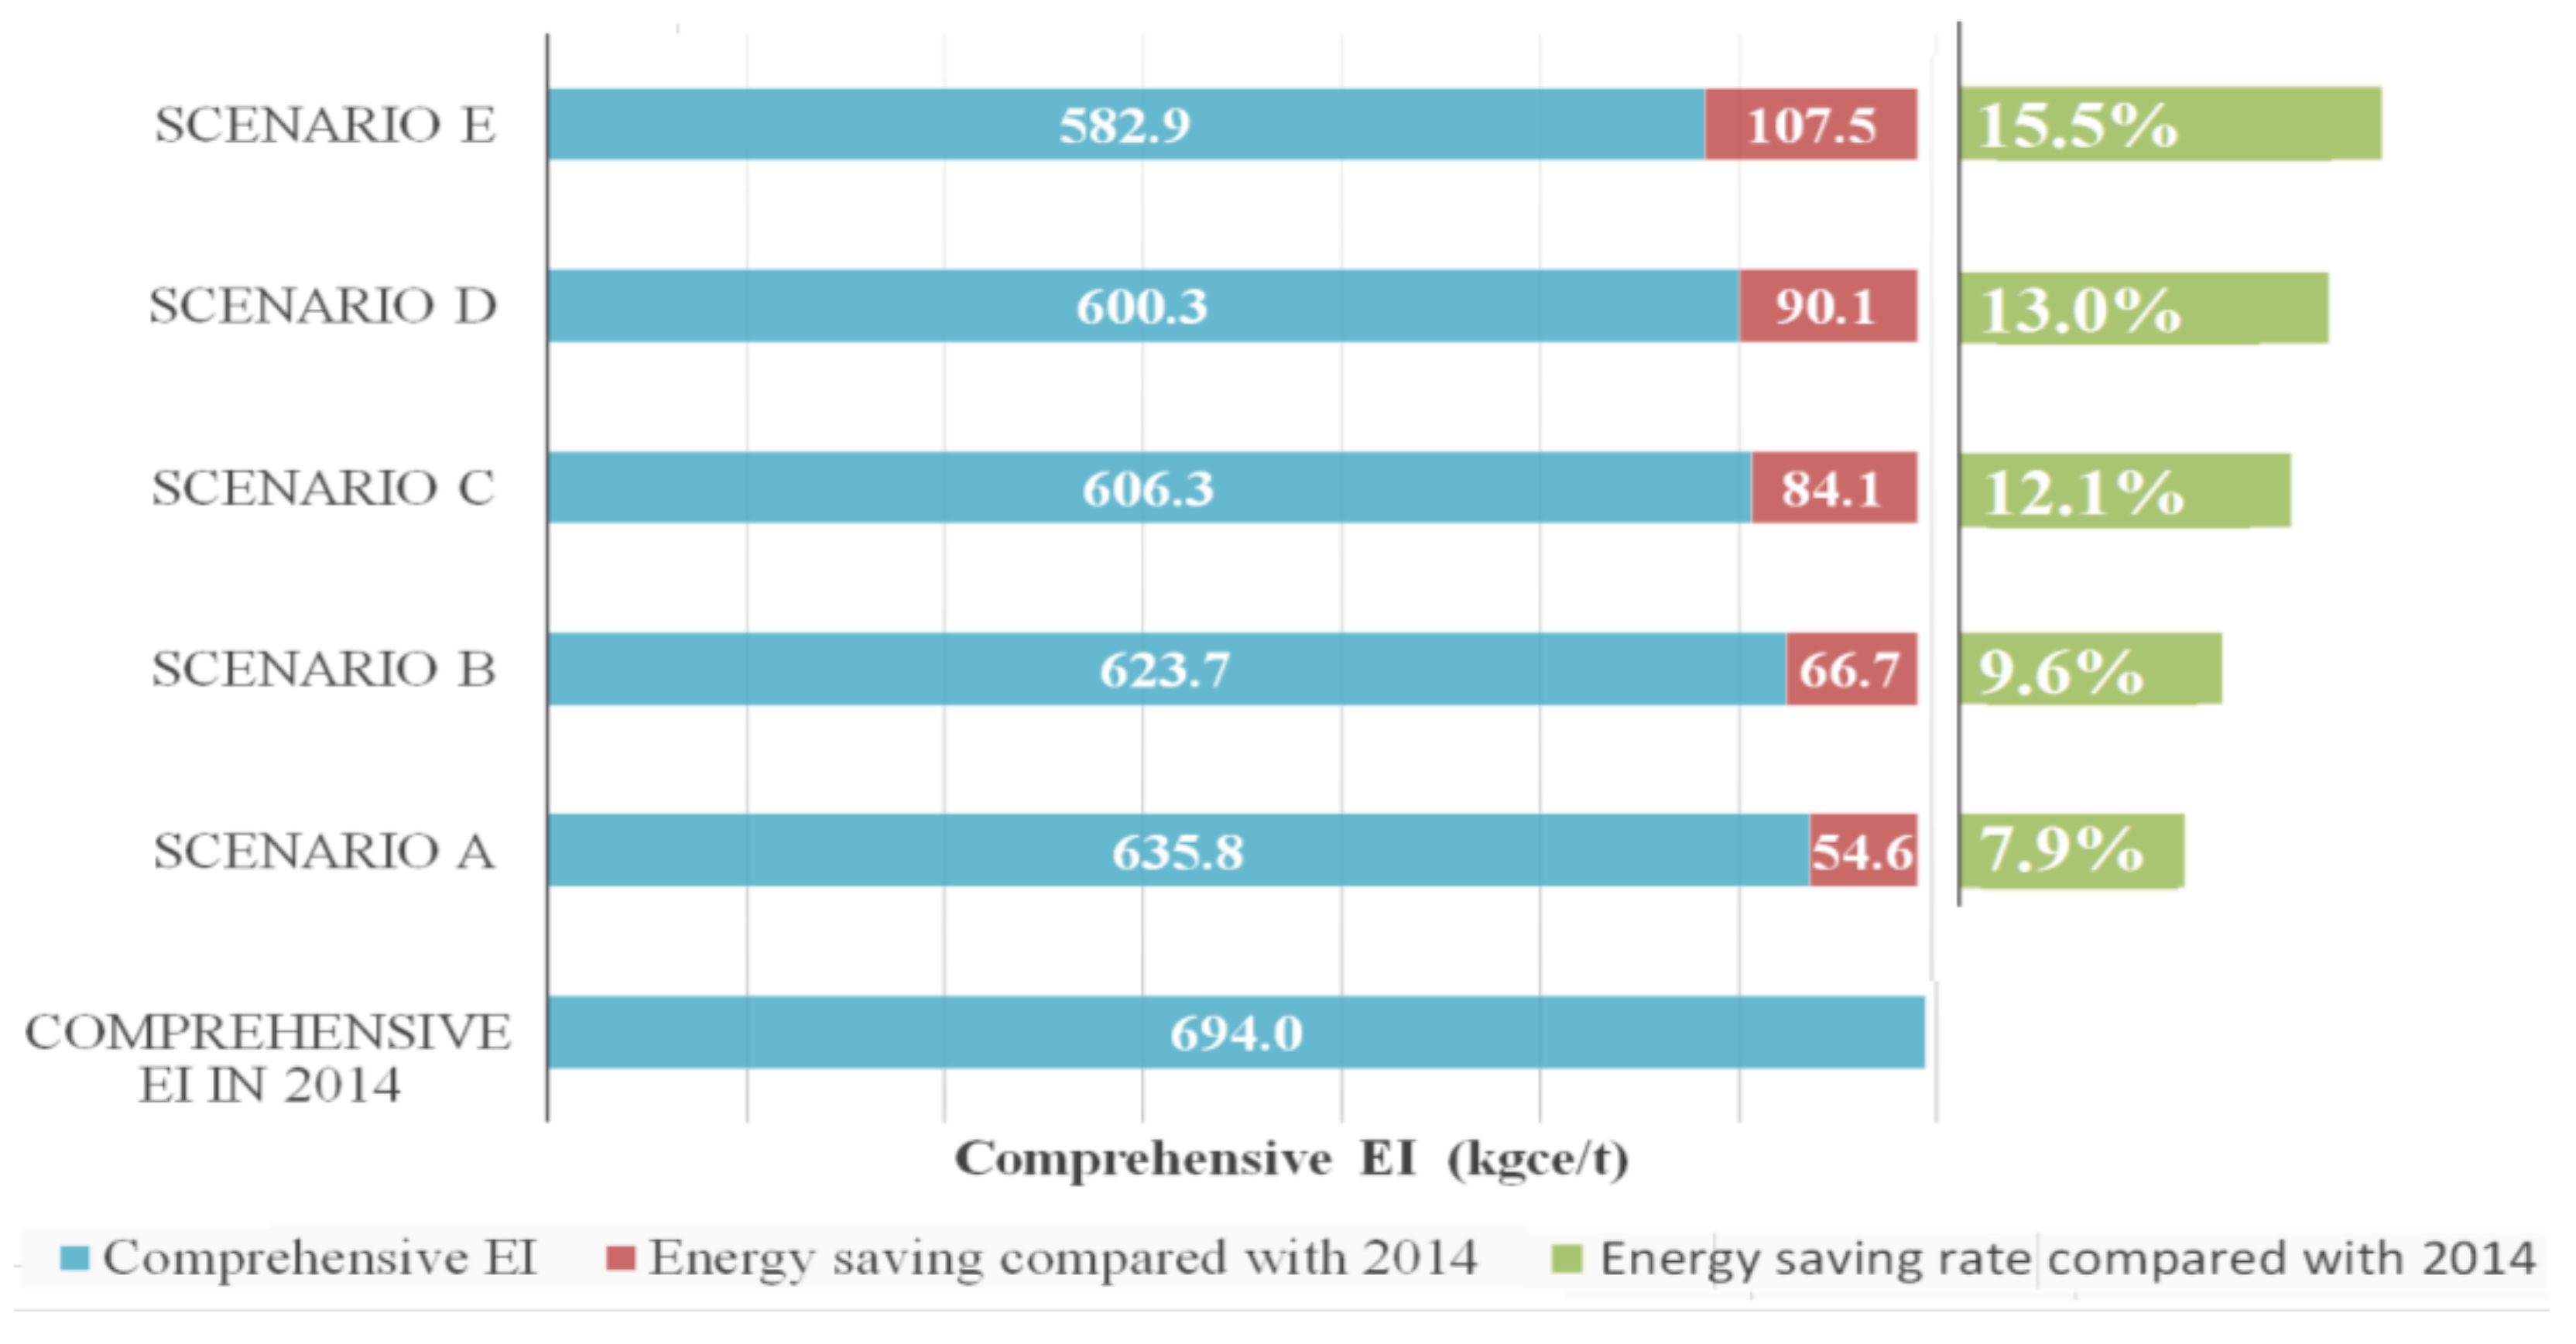
In this part, the comprehensive EI is further calculated using the CEC method for in-depth analysis, as the proportion of electricity in the total energy consumption of the steel industry will rise to 18.2% when SR increases to 30%, and the influence of the coal consumption of power generation will increase according to the analysis in this study. According to the results that are shown in Figure 3, the comprehensive EI can be converted to the CEC method by Formula 6 under the power generation technology level of China in 2014 (300 gce/kwh) (Figure 4).
As shown in Figure 4, the comprehensive EI from the CEC method is between 582.9 kgce/t and 635.8 kgce/t, and the energy saving effect is between 54.6 kgce/t and 107.5 kgce/t, and the energy saving rate is 7.9~15.5% as compared with those of 2014.
The comparison of data under the CEC and CVC methods shows that the energy saving effect that was calculated from the CEC method is lower than that calculated from the CVC method due to the increase on the proportion of electricity in total energy consumption. From the perspective of the overall energy consumption of the country, the data calculated from CEC method are more accurate when evaluating the energy-saving effect of the steel industry, especially the energy-saving effect of the EAF route development.
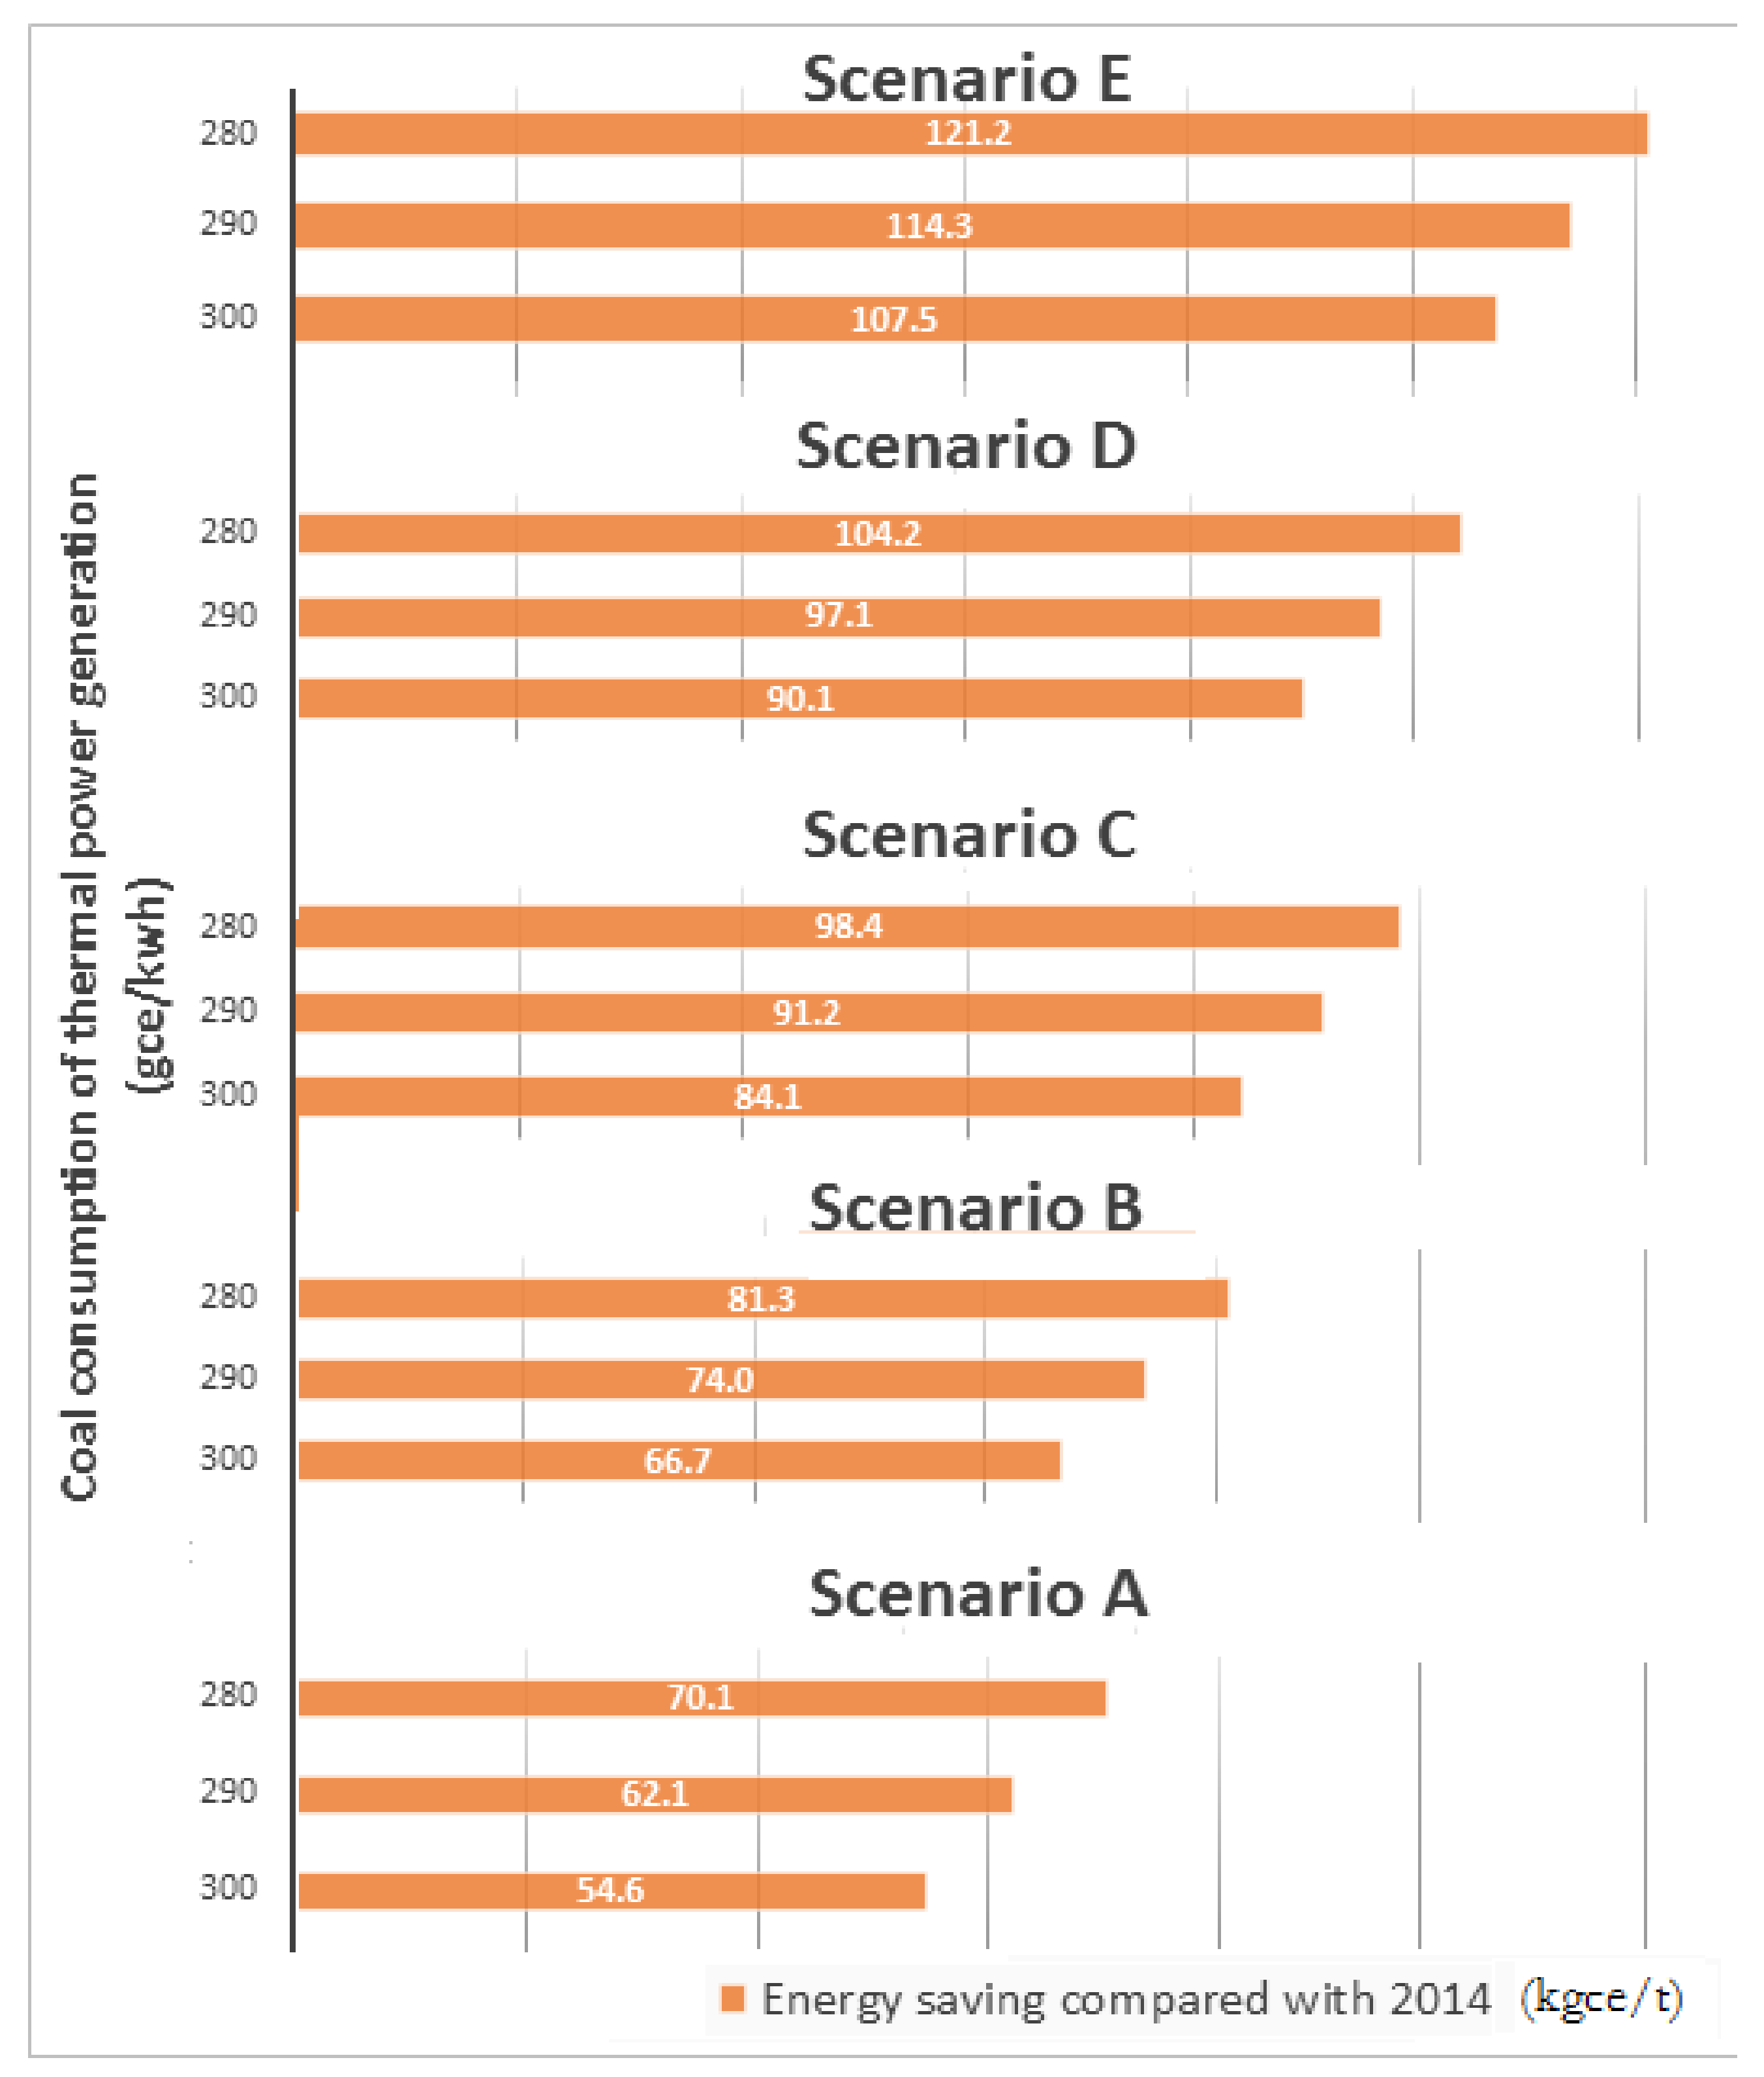
In addition, in this paper, the influence of the power industry progress is also considered. Thus, the scenarios of coal consumption of thermal power generation of 290 gce/kwh and 280 gce/kwh are also considered, and results are calculated by Formula (6) (shown in Figure 5).
The energy saving potential can be increased to 10.1~17.5% by improving China’s power generation technology level. When comparing the results that were calculated under different power generation technology level, the comprehensive EI from the CEC method decreases by approximately 1% when the coal consumption rate for fossil-fired power plant decreases by approximately 3%, which shows that the power generation technology level of China had a huge influence on the comprehensive EI of steel industry. Therefore, the national power generation technology should be improved in the development of the steel industry, especially in the development of the EAF route, to achieve a better energy-saving effect.
5. Conclusions
This paper focuses on the factors that impact on EI of China’s steel industry according to its development plan. The energy conservation potential of China’s steel industry in 2025 is estimated by using a multivariate energy intensity (MEI) model, in which factors, like raw materials, technology progress, production routes, industrial structure, energy structure (electricity and natural gas), and coal consumption of power generation are synthetically considered. Different scenarios have been set to analyze the influence of different factor on energy saving potential.
Results show that increasing SR of China’s steel industry to 30% has the greatest energy saving effect, which is 16.8% in CVC method when compared with 2014 (SR in 2014 is10.7%), and it is the key of energy saving method of China’s steel industry in the future. On the basis of promoting SR, increasing proportion of natural gas, technical progress of CR10, and technical progress of small-scale enterprises can further decrease the comprehensive EI of China’s steel industry by 23.7%.
However, with CEC method, the energy saving rate is only 7.9~15.5% when compared with that in 2014, which is lower than that predicted with CVC method, due to the increase of the proportion of electricity in total energy consumption; but, the energy saving potential can increase to 10.1~17.5% by improving China’s power generation technology level. Therefore, the national power generation technology progress will greatly improve the energy efficiency of China’s steel industry, especially for the EAF production route, to achieve a better energy-saving effect.
From the perspective of the overall energy consumption of China, the CEC method are more accurate when evaluating the energy-saving effect of the steel industry, especially for the energy-saving effect of the EAF route development.
Acknowledgments
The authors are grateful for the support of the National Key R&D Program of China (Grant No. 2016YFB0601101).
Author Contributions
Kun He and Li Wang developed the theory and performed the computations, and verified the analytical methods. Hongliang Ding and Yulong Zhu supervised the findings of this work. All authors discussed the results and contributed to the final manuscript.
Conflicts of Interest
The authors declare no conflict of interest.
References
- International Energy Agency (IEA). Energy Balance Flows 2015. Available online: http://www.iea.org/Sankey/index.html (accessed on 11 April 2018).
- World Steel Association. Steel Statistics Yearbook 2015. Available online: https://www.worldsteel.org/ (accessed on 11 April 2018).
- Duan, Y.; Li, N.; Mu, H.; Gui, S. Research on CO2 Emission Reduction Mechanism of China’s Iron and Steel Industry under Various Emission Reduction Policies. Energies 2017, 10, 2026. [Google Scholar] [CrossRef]
- Zhang, S.; Worrell, E.; Crijns-Graus, W.; Wagner, F.; Cofala, J. Co-benefits of energy efficiency improvement and air pollution abatement in the Chinese iron and steel industry. Energy 2014, 78, 333–345. [Google Scholar] [CrossRef]
- Hasanbeigi, A.; Morrow, W.; Sathaye, J.; Masanet, E.; Xu, T. A bottom-up model to estimate the energy efficiency improvement and CO2 emission reduction potentials in the Chinese iron and steel industry. Energy 2013, 50, 315–325. [Google Scholar] [CrossRef]
- He, F.; Zhang, Q.; Lei, J.; Fu, W.; Xu, X. Energy efficiency and productivity change of China’s iron and steel industry: Accounting for undesirable outputs. Energy Policy 2013, 54, 204–213. [Google Scholar] [CrossRef]
- Wen, Z.; Meng, F.; Chen, M. Estimates of the potential for energy conservation and CO2 emissions mitigation based on Asian-Pacific Integrated Model (AIM): The case of the iron and steel industry in China. J. Clean. Prod. 2014, 65, 120–130. [Google Scholar] [CrossRef]
- Nabernegg, S.; Bednar-Friedl, B.; Wagner, F.; Schinko, T.; Cofala, J.; Clement, Y.M. The Deployment of Low Carbon Technologies in Energy Intensive Industries: A Macroeconomic Analysis for Europe, China and India. Energies 2017, 10, 360. [Google Scholar] [CrossRef]
- Dai, H.; Mischke, P.; Xie, X.; Xie, Y.; Masui, T. Closing the gap? Top-down versus bottom-up projections of China’s regional energy use and CO2 emissions. Appl. Energy 2016, 162, 1355–1373. [Google Scholar] [CrossRef]
- Murphy, R.; Jaccard, M. Energy efficiency and the cost of GHG abatement: A comparison of bottom-up and hybrid models for the US. Energy Policy 2011, 39, 7146–7155. [Google Scholar] [CrossRef]
- Proença, S.; Aubyn, M.S. Hybrid modeling to support energy-climate policy: Effects of feed-in tariffs to promote renewable energy in Portugal. Energy Econ. 2013, 38, 176–185. [Google Scholar] [CrossRef]
- Fujimori, S.; Masui, T.; Matsuoka, Y. Development of a global computable general equilibrium model coupled with detailed energy end-use technology. Appl. Energy 2014, 128, 296–306. [Google Scholar] [CrossRef]
- Bureau of International Recycling. World Steel Recycling in Figures 2010–2014. Available online: http://bdsv.org/downloads/weltstatistik_2010_2014.pdf (accessed on 11 April 2018).
- China Association of Metal Scrap Utilization (CAMU). Increase the Proportion of Scrap Steel Recycling. 2017. Available online: http://www.camu.org.cn/msg.aspx?msg_id=6624 (accessed on 11 April 2018).
- Ministry of Industry and Information Technology of People’s Republic of China. The Adjustment Policy of Iron and Steel Industry 2015. Available online: http://www.miit.gov.cn/n1146295/n1652858/n1653100/n3767755/c3776799/content.html (accessed on 25 July 2017).
- International Energy Agency (IEA). Energy Technology Perspectives 2010. Available online: http://www.iea.org/publications/freepublications/publication/energy-technology-perspectives-2010.html (accessed on 11 April 2018).
- He, K.; Wang, L. A review of energy use and energy-efficient technologies for the iron and steel industry. Renew. Sustain. Energy Rev. 2016, 70, 1022–1039. [Google Scholar] [CrossRef]
- The Editorial Board of China Steel Yearbook. China Steel Yearbook; Metallurgical Industry Press: Beijing, China, 2015. [Google Scholar]
- Worrell, E.; Price, L.; Neelis, M.; Galitsky, C.; Nan, Z. World Best Practice Energy Intensity Values for Selected Industrial Sectors 2008. Available online: https://eaei.lbl.gov/sites/all/files/industrial_best_practice_en.pdf (accessed on 11 April 2018).
- National Bureau of Statistics of China. China Statistical Yearbook 2015; China Statistics Press: Beijing, China, 2015.
- Wang, W. Energy consumption situation and energy saving potential analysis of iron and steel industry. Chin. Steel 2011, 4, 19–22. [Google Scholar]
- Yuan, Y.; Xi, Q.; Sun, T.; Li, G. An Empirical Study of Industrial Concentration on the Impact of Energy Consumption of the Iron and Steel Industry in China. J. Ind. Technol. Econ. 2011, 10, 8. [Google Scholar]
- Lin, B.; Wu, Y.; Zhang, L. Estimates of the potential for energy conservation in the Chinese steel industry. Energy Policy 2011, 39, 3680–3689. [Google Scholar] [CrossRef]
- Ministry of Industry and Information Technology of the People’s Republic of China. Plan for Adjustment and Upgrading of Iron and Steel Industry (2016–2020 Years). Available online: http://www.miit.gov.cn/n1146295/n1652858/n1652930/n3757016/c5353943/content.html (accessed on 11 April 2018).
- Sun, H.; Li, W. Natural Gas Play an Important Role in the Energy Conservation and Emissions Reduction. Pet. Plan. Eng. 2009, 20, 7–9. [Google Scholar]
- The Central People’s Government of the People’s Republic of China. Natural Gas Utilization Policy 2012. Available online: http://www.gov.cn/flfg/2012-10/31/content_2254647.htm (accessed on 25 July 2017).
- The State Council of the People’s Republic of China. Energy Development Strategy Plan (2014–2020 Years). Available online: http://www.gov.cn/zhengce/content/2014-11/19/content_9222.htm (accessed on 11 April 2018).
- National Bureau of Statistics. Handbook of Energy Statistics; China Statistics Press: Beijing, China, 2010.
- Zhang, G. Research and Application of Index System for Evaluating Energy Consumption in Iron and Steel Enterprises. Ph.D. Dissertation, Northeastern University, Shenyang, China, 2013. [Google Scholar]
- Cai, J. Energy consumption analysis and energy saving countermeasure research for integrated steel works. Angang Technol. 2009, 2, 1–6. [Google Scholar]
- National Bureau of Statistics of the People’s Republic of China. National Data 2015. Available online: http://www.stats.gov.cn/ (accessed on 25 July 2017).
- China Iron and Steel Industry Association. Energy-Saving and Emission-Reduction 2016. Available online: http://www.chinaisa.org.cn/gxportal/login.jsp (accessed on 11 April 2018).
- Hao, Y. Study on Machanism and Modelof Circular Economy in China’s Iron and Steel Industry. Ph.D. Dissertation, University of Science and Technology, Beijing, China, 2014. [Google Scholar]
- Ministry of Industry and Information Technology of the People’s Republic of China. Requirements of Energy Consumption and Environmental Protection in Iron and Steel Industry. 2010. Available online: http://www.miit.gov.cn/n1146285/n1146352/n3054355/n3057542/n3057545/c3545221/part/3545223.pdf (accessed on 11 April 2018).
- National Energy Conservation Center of China. Technical Efficiency Evaluation Standard—Iron and Steel Industry 2014. Available online: http://www.chinanecc.cn/website/News!view.shtml?id=144711 (accessed on 11 April 2018).
- Zang, Y.; Liu, W.; Zhang, J. Accelerating the utilization of scrap to promote energy-saving and emission-reduction of China’s iron and steel industry. Res. Iron Steel 2010, 38, 43–46. [Google Scholar]
Figure 1.
Structure of impact factors that influence on energy intensity (EI) on China’s steel industry.
Figure 1.
Structure of impact factors that influence on energy intensity (EI) on China’s steel industry.
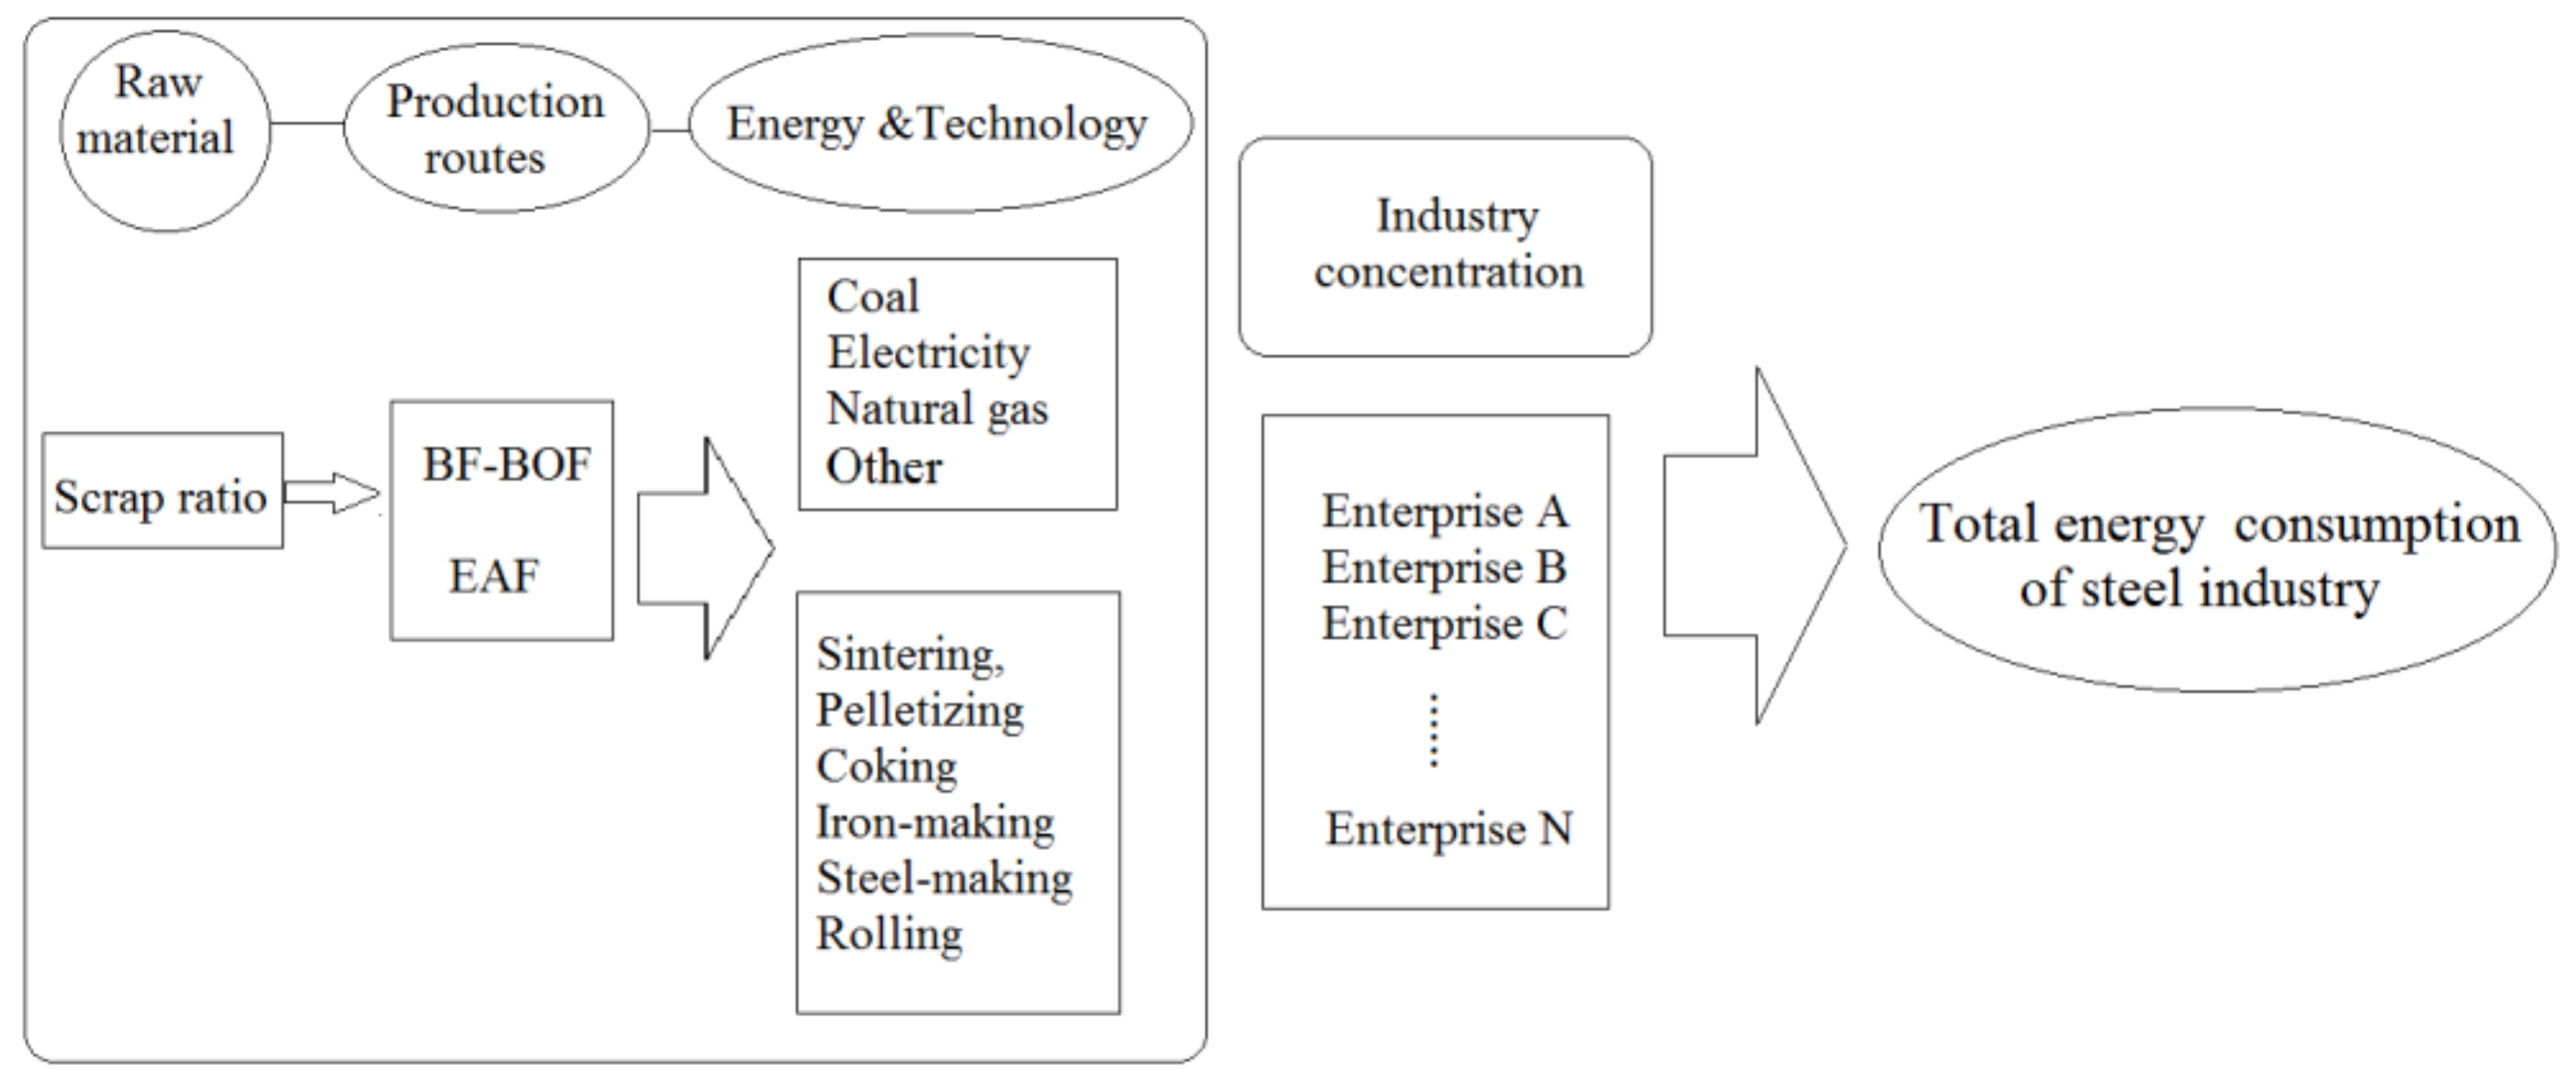
Figure 2.
EI of different scale steel enterprises in China in 2014 and 2025.
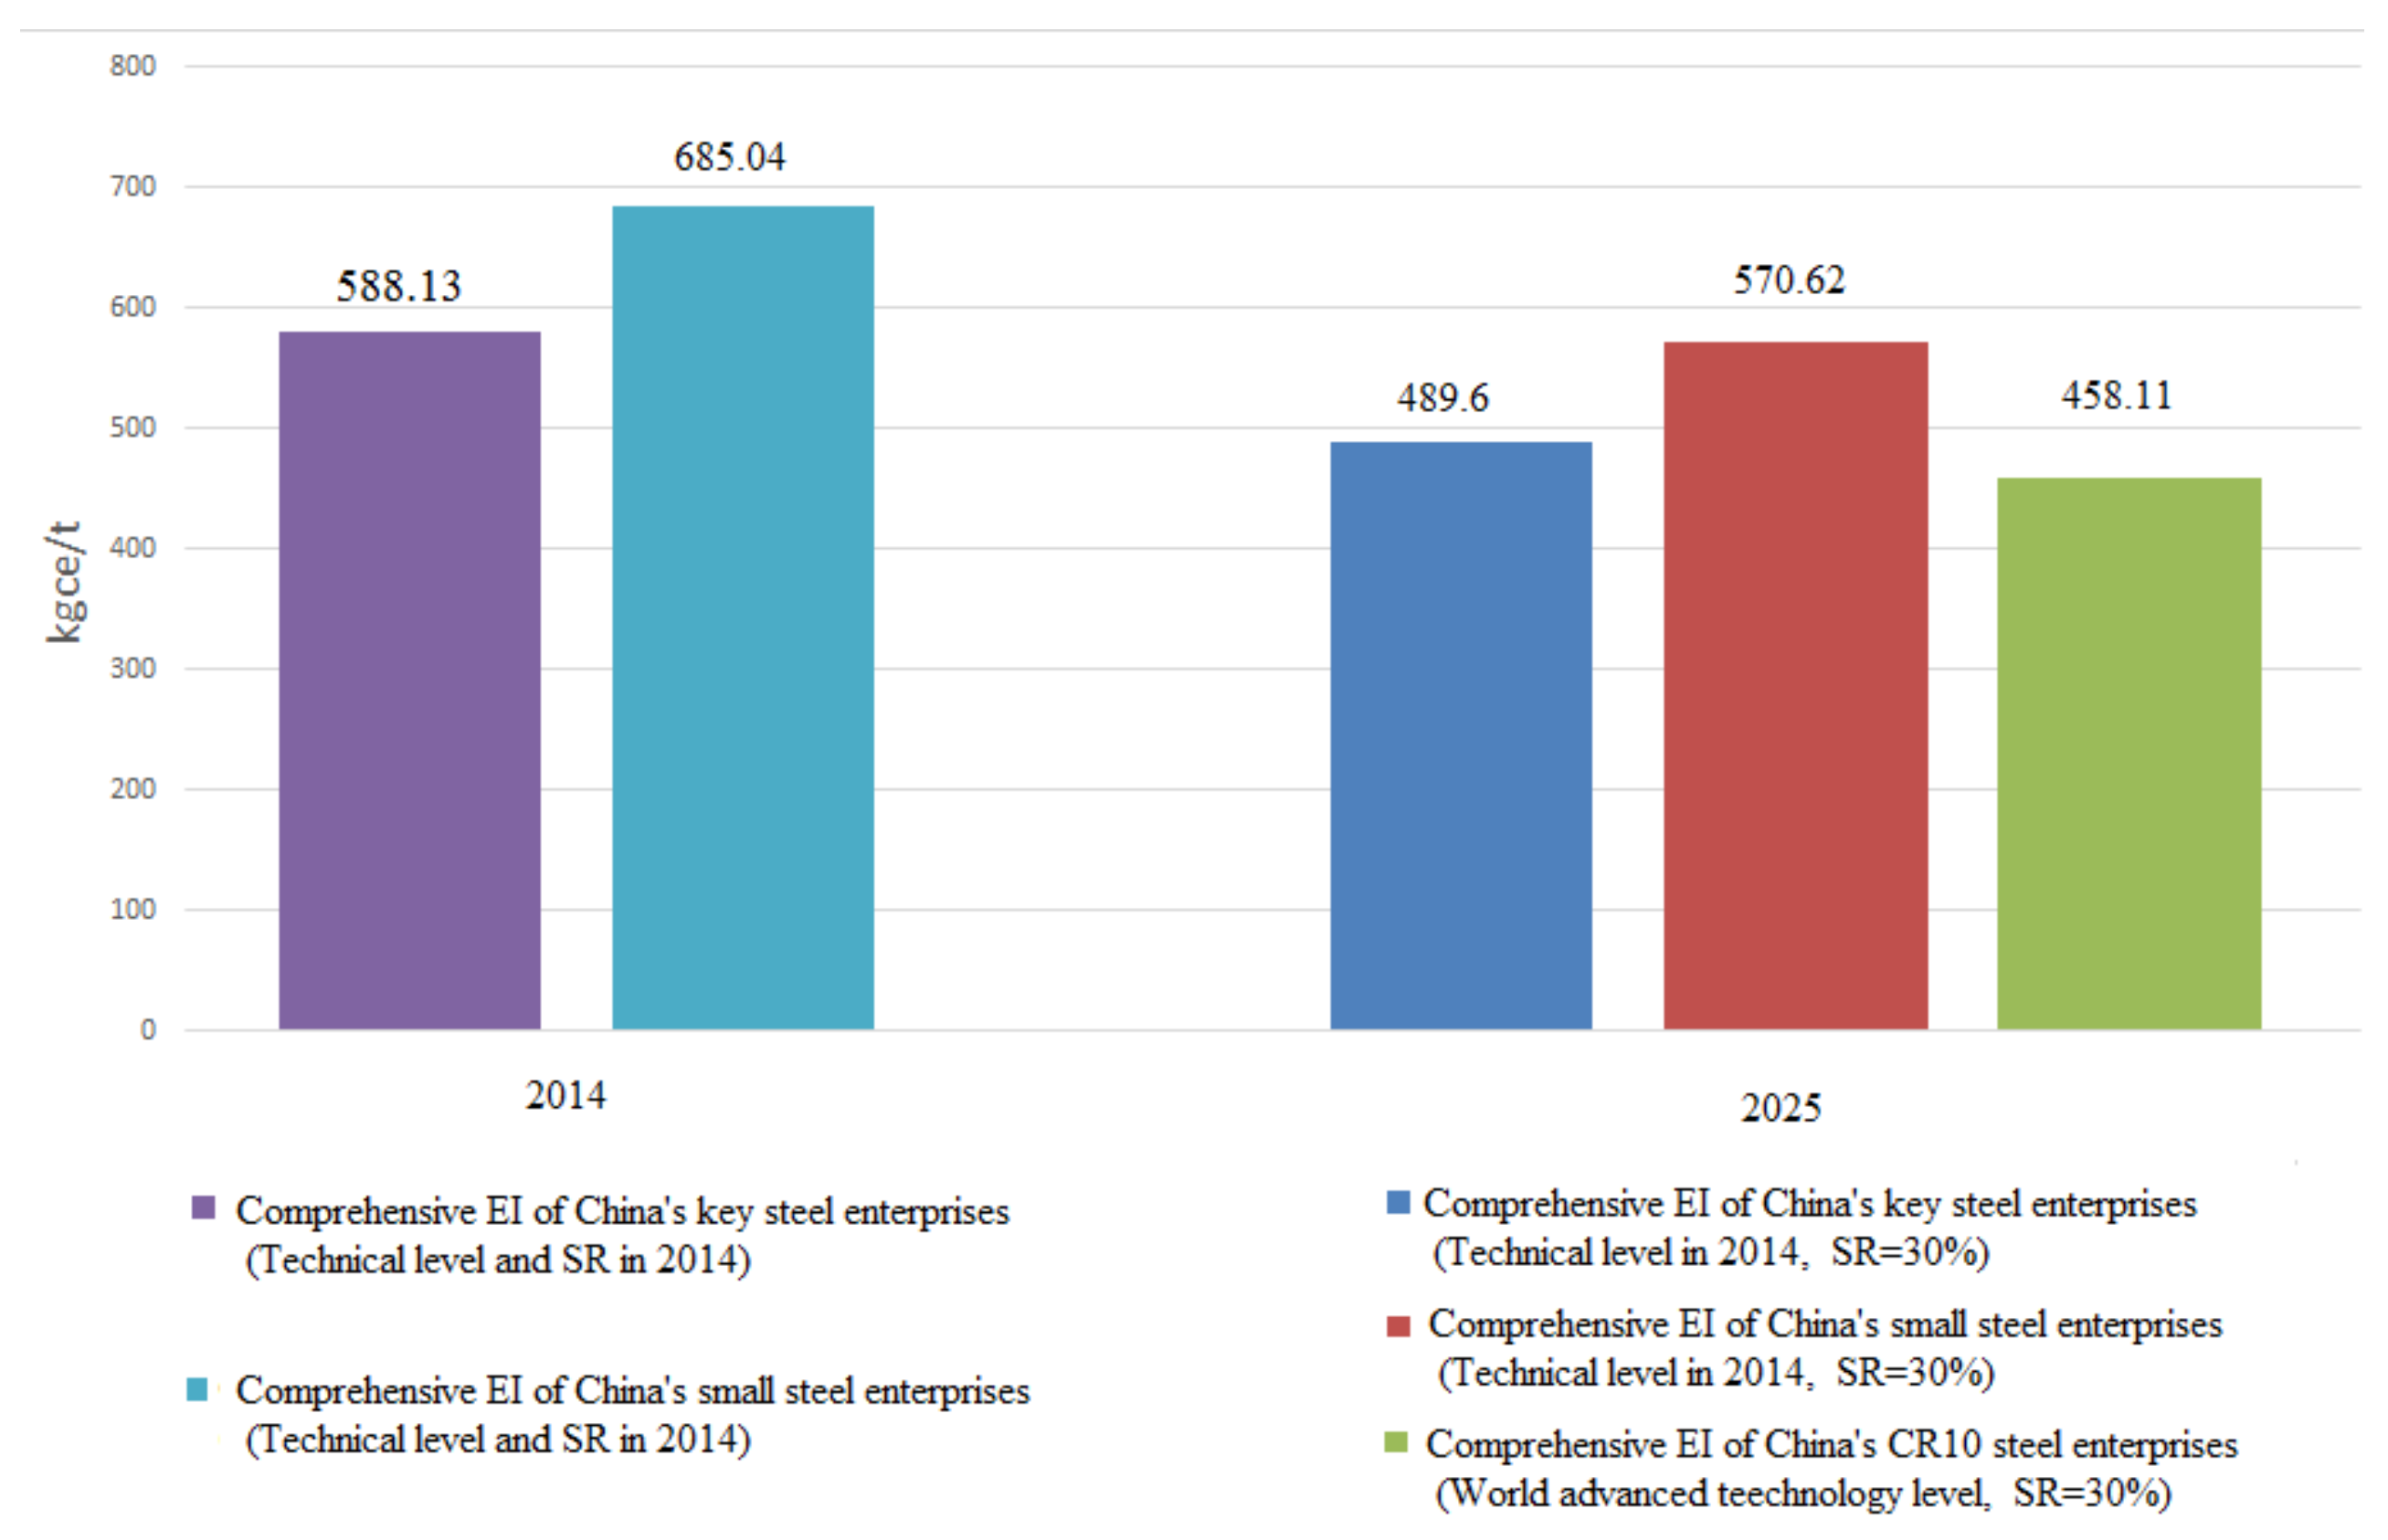
Figure 3.
Energy saving potential in different scenarios (without considering coal consumption of power generation).
Figure 3.
Energy saving potential in different scenarios (without considering coal consumption of power generation).

Figure 4.
Energy saving potential in different scenarios (considering coal consumption of power generation).
Figure 4.
Energy saving potential in different scenarios (considering coal consumption of power generation).

Figure 5.
Energy saving potential of different power generation coal consumption.

Table 1.
Crude steel production by different routes in 2014.
| Country or Region | Production | Scrap Ratio | Production Route | ||
|---|---|---|---|---|---|
| (Scrap/Crude Steel) | BOF | EAF | |||
| Mt | % | % | % | % | |
| China | 822.7 | 49.4 | 10.7 | 93.9 | 6.1 |
| Japan | 110.7 | 6.6 | 33.3 | 76.8 | 23.2 |
| United States | 88.2 | 5.3 | 70.3 | 37.4 | 62.6 |
| EU-28 | 169.3 | 10.1 | 53.9 | 61.0 | 39.0 |
| World | 1665 | 100% | 35.1 | 73.2 | 25.8 |
| Year | Sinter | Pellet | Coke | Iron | ||||
|---|---|---|---|---|---|---|---|---|
| Production (Mt) | Production (Mt) | Production (Mt) | Production (Mt) | |||||
| 2007 | 494.05 | 1.222 | 90.43 | 0.224 | 99.57 | 0.246 | 365.35 | 0.904 |
| 2008 | 531.56 | 1.281 | 94.20 | 0.227 | 106.87 | 0.258 | 381.70 | 0.920 |
| 2009 | 583.81 | 1.210 | 94.96 | 0.197 | 119.45 | 0.248 | 458.14 | 0.949 |
| 2010 | 674.23 | 1.216 | 120.45 | 0.217 | 142.34 | 0.257 | 519.85 | 0.938 |
| 2011 | 715.55 | 1.195 | 142.43 | 0.238 | 133.59 | 0.223 | 565.12 | 0.942 |
| 2012 | 790.68 | 1.284 | 134.95 | 0.219 | 126.23 | 0.205 | 588.96 | 0.957 |
| 2013 | 868.80 | 1.313 | 159.06 | 0.240 | 124.39 | 0.188 | 646.21 | 0.977 |
| 2014 | 901.29 | 1.328 | 139.32 | 0.205 | 120.98 | 0.178 | 668.04 | 0.985 |
| Year | Sintering (kgce/t Sinter) | Pelletizing (kgce/t Pellet) | Coking (kgce/t Coke) | Blast Furnace (kgce/t Iron) | BOF (kgce/t Steel) | EAF (kgce/t Steel) | Rolling (kgce/t Product) |
|---|---|---|---|---|---|---|---|
| 2007 | 55.21 | 30.12 | 121.72 | 426.84 | 6.03 | 81.34 | 63.08 |
| 2008 | 55.49 | 30.49 | 119.97 | 427.72 | 5.74 | 81.52 | 59.58 |
| 2009 | 54.52 | 29.96 | 113.97 | 410.55 | 2.78 | 73.44 | 57.66 |
| 2010 | 52.65 | 29.39 | 105.89 | 407.76 | −0.16 | 73.98 | 61.69 |
| 2011 | 54.34 | 29.60 | 106.65 | 404.07 | −3.21 | 69.00 | 60.93 |
| 2012 | 50.60 | 28.75 | 102.72 | 401.82 | −6.08 | 67.53 | 57.31 |
| 2013 | 49.76 | 28.58 | 99.87 | 399.88 | −7.81 | 62.38 | 60.32 |
| 2014 | 49.48 | 27.12 | 98.15 | 388.70 | −8.73 | 66.06 | 63.30 |
Table 4.
Comprehensive and comparable EIs of China’s key steel enterprises from 2007 to 2014 [21,31,32].
| Year | Steel Production | Comprehensive EI (kgce/t) | Comparable EI (kgce/t) | (kgce/t) | |||
|---|---|---|---|---|---|---|---|
| Production (Mt) | BF-BOF (%) | EAF (%) | |||||
| 2007 | 404.13 | 90.4 | 9.6 | 628 | 614.61 | 13.39 | 2.18% |
| 2008 | 414.92 | 91.1 | 8.8 | 629.93 | 609.61 | 20.32 | 3.33% |
| 2009 | 482.49 | 92.9 | 7.1 | 619.43 | 595.38 | 24.05 | 4.04% |
| 2010 | 554.31 | 92.9 | 7.1 | 604.60 | 581.14 | 23.46 | 4.04% |
| 2011 | 598.62 | 93.7 | 6.2 | 600.04 | 572.04 | 28.00 | 4.90% |
| 2012 | 615.66 | 95.1 | 4.9 | 600.5 | 577.74 | 22.76 | 3.94% |
| 2013 | 661.68 | 94.9 | 5.1 | 593.10 | 564.84 | 28.26 | 5.00% |
| 2014 | 678.51 | 93.9 | 6.1 | 588.13 | 546.45 | 41.65 | 7.62% |
Table 5.
and of Chinese key steel enterprises from 2007 to 2014.
| Year | (kgce/t) | Comparable EI (kgce/t) | (kgce/t) | |
|---|---|---|---|---|
| 2007 | 566.24 | 614.61 | 48.37 | 8.54% |
| 2008 | 574.38 | 609.61 | 35.23 | 6.13% |
| 2009 | 555.57 | 595.38 | 39.81 | 7.17% |
| 2010 | 546.96 | 581.14 | 34.18 | 6.25% |
| 2011 | 537.10 | 572.04 | 34.94 | 6.51% |
| 2012 | 531.7 | 577.74 | 46.04 | 8.66% |
| 2013 | 537.74 | 564.84 | 27.1 | 5.04% |
| 2014 | 529.99 | 546.45 | 16.46 | 3.11% |
Table 6.
Energy saving potential of each main influence factors.
| Influence Factor | Comprehensive EI (kgce/t) | Energy Saving Rate Compared with 20014 | Calculation Formula | |
|---|---|---|---|---|
| SR increased from 10.7 to 30% | 503.7 | 16.8% | Formulas (8), (13) and (15) | |
| Proportion of natural gas increased from 1 to 10% | 594.2 | 1.8% | Formulas (5) | |
| Technical progress of small-scale enterprises (reach the level of key enterprises) | 588.1 | 2.8% | Formulas (11) | |
| Technical progress of CR10 enterprises (reach the world’s advanced level) | Concentration of CR10 remained at 36.6% | 574.3 | 5.1% | Formulas (11) and (13)–(15) |
| Concentration of CR10 increased to 60% | 554.6 | 8.3% | Formulas (11) and (13)–(15) | |
© 2018 by the authors. Licensee MDPI, Basel, Switzerland. This article is an open access article distributed under the terms and conditions of the Creative Commons Attribution (CC BY) license (http://creativecommons.org/licenses/by/4.0/).
Share and Cite
MDPI and ACS Style
He, K.; Wang, L.; Zhu, H.; Ding, Y. Energy-Saving Potential of China’s Steel Industry According to Its Development Plan. Energies 2018, 11, 948. https://doi.org/10.3390/en11040948
AMA Style
He K, Wang L, Zhu H, Ding Y. Energy-Saving Potential of China’s Steel Industry According to Its Development Plan. Energies. 2018; 11(4):948. https://doi.org/10.3390/en11040948
Chicago/Turabian StyleHe, Kun, Li Wang, Hongliang Zhu, and Yulong Ding. 2018. "Energy-Saving Potential of China’s Steel Industry According to Its Development Plan" Energies 11, no. 4: 948. https://doi.org/10.3390/en11040948
Note that from the first issue of 2016, this journal uses article numbers instead of page numbers. See further details here.