Optimizing Waste Heat Utilization in Vehicle Bio-Methane Plants


1
Guangzhou Institute of Energy Conversion, Chinese Academy of Sciences, NO. 2 Nengyuan Road, Tianhe District, Guangzhou 510640, China
2
CAS Key Laboratory of Renewable Energy, Guangzhou 510640, China
3
Guangdong Provincial Key Laboratory of New and Renewable Energy Research and Development, Guangzhou 510640, China
4
College of Engineering, Northeast Agricultural University, Harbin 150030, China
5
Guangzhou Special Pressure Equipment Inspection and Research Institute, Guangzhou 510000, China
*
Author to whom correspondence should be addressed.
Energies 2018, 11(6), 1518; https://doi.org/10.3390/en11061518
Submission received: 5 May 2018
/
Revised: 5 June 2018
/
Accepted: 6 June 2018
/
Published: 11 June 2018
(This article belongs to the Collection Bioenergy and Biofuel)
Abstract
:Current vehicle bio-methane plants have drawbacks associated with high energy consumption and low recovery levels of waste heat produced during the gasification process. In this paper, we have optimized the performance of heat exchange networks using pinch analysis and through the introduction of heat pump integration technology. Optimal results for the heat exchange network of a bio-gas system producing 10,000 cubic meters have been calculated using a pinch point temperature of 50 °C, a minimum heating utility load of 234.02 kW and a minimum cooling utility load of 201.25 kW. These optimal parameters are predicted to result in energy savings of 116.08 kW (19.75%), whilst the introduction of new heat pump integration technology would afford further energy savings of 95.55 kW (16.25%). The combined energy saving value of 211.63 kW corresponds to a total energy saving of 36%, with economic analysis revealing that these reforms would give annual savings of 103,300 USD. The installation costs required to introduce these process modifications are predicted to require an initial investment of 423,200 USD, which would take 4.1 years to reach payout time based on predicted annual energy savings.
1. Introduction
With the fast development of the biogas industry, using biogas to achieve greater economic benefits is one of key factors affecting the development model shift of large scale biogas plants from environment protection mode to energy generation mode. The usage of biogas is changing from fueling combined heat and power generator engines to upgrading biogas to bio-methane. Vehicle bio-methane is one of the high value applications of biogas [1,2]. Investment in vehicle bio-methane plants has attracted widespread attention; for example, China’s 13th Five-year Plan for the biogas industry involves completion of 192 large-scale biogas projects by 2020 [3]. Although many vehicle bio-methane projects are underway, their relatively high operating costs and high energy consumption levels are still a major concern. Previous studies have shown that 10–30% of the total energy consumed in typical biogas processes involve heat production [4,5,6], with current process plants being inefficient at recovering waste heat losses. Therefore, the introduction of new processes or technologies that enable the efficient recycling of waste heat is important for improving the economic and environmental efficiency of biogas processes.
The energy required for the production of vehicle bio-methane results in a large amount of waste heat being produced that could potentially be recovered and recycled [7,8]. Zupancic et al. have shown that waste heat could be recovered from a high temperature anaerobic fermenter at 55 °C, which was used to heat the biomass feedstock from 11–32 °C, representing an energy saving of around 50% [9]. Zhang et al. applied heat recovery methods to the sterilization, purification and production stages, resulting in 64–100% of the total input energy being recovered, which enabled net biogas production to be increased by 5.3–17.4% [10]. These studies reveal that recovery of waste heat can effectively reduce energy consumption, increase biogas production levels, and produce significant cost savings. However, most of these studies have focused primarily on recovering heat from a single source, with recovery methods concentrating on simple heat exchange processes [11]. Vehicle bio-methane plant systems generate multiple kinds of waste heat, and so this study has used pinch analysis to determine how new heat pump technology might be used for global recovery of heat energy in a vehicle bio-methane plant [12,13]. We anticipate that the results described herein will encourage more efficient use of waste heat in biogas engineering plants, thus enabling their economic efficiency to be improved and their environmental impact reduced.
2. Research System
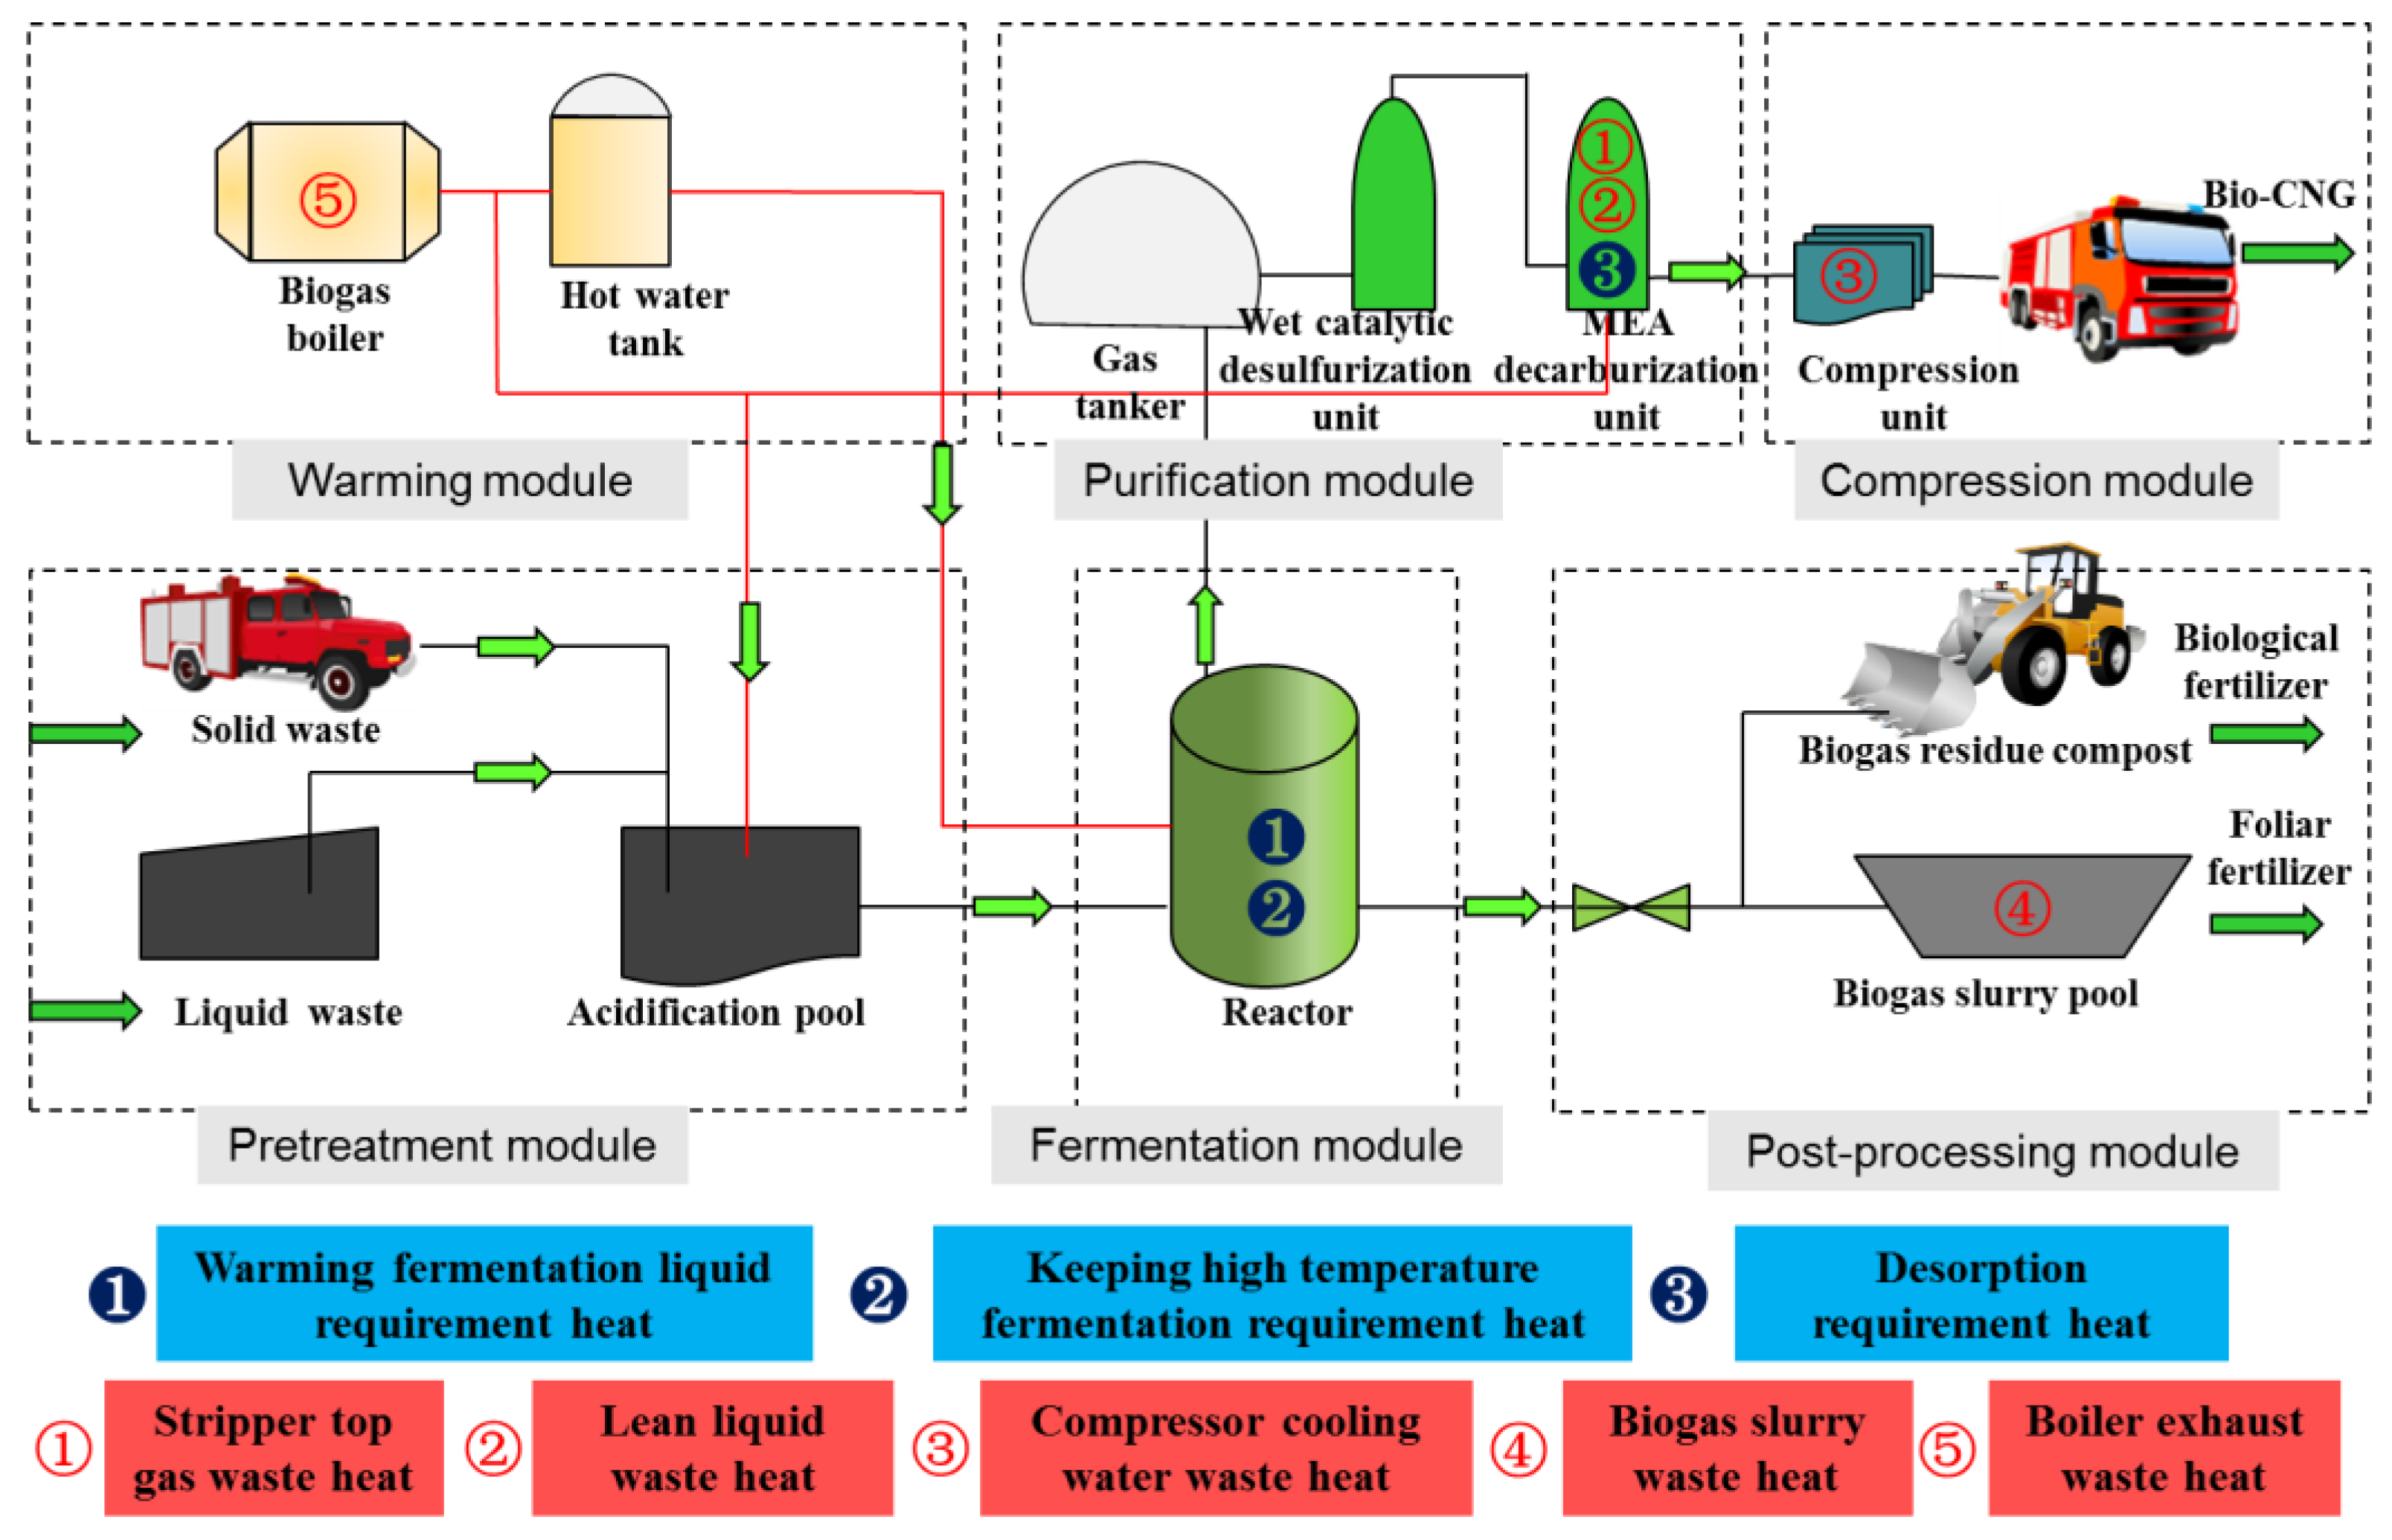
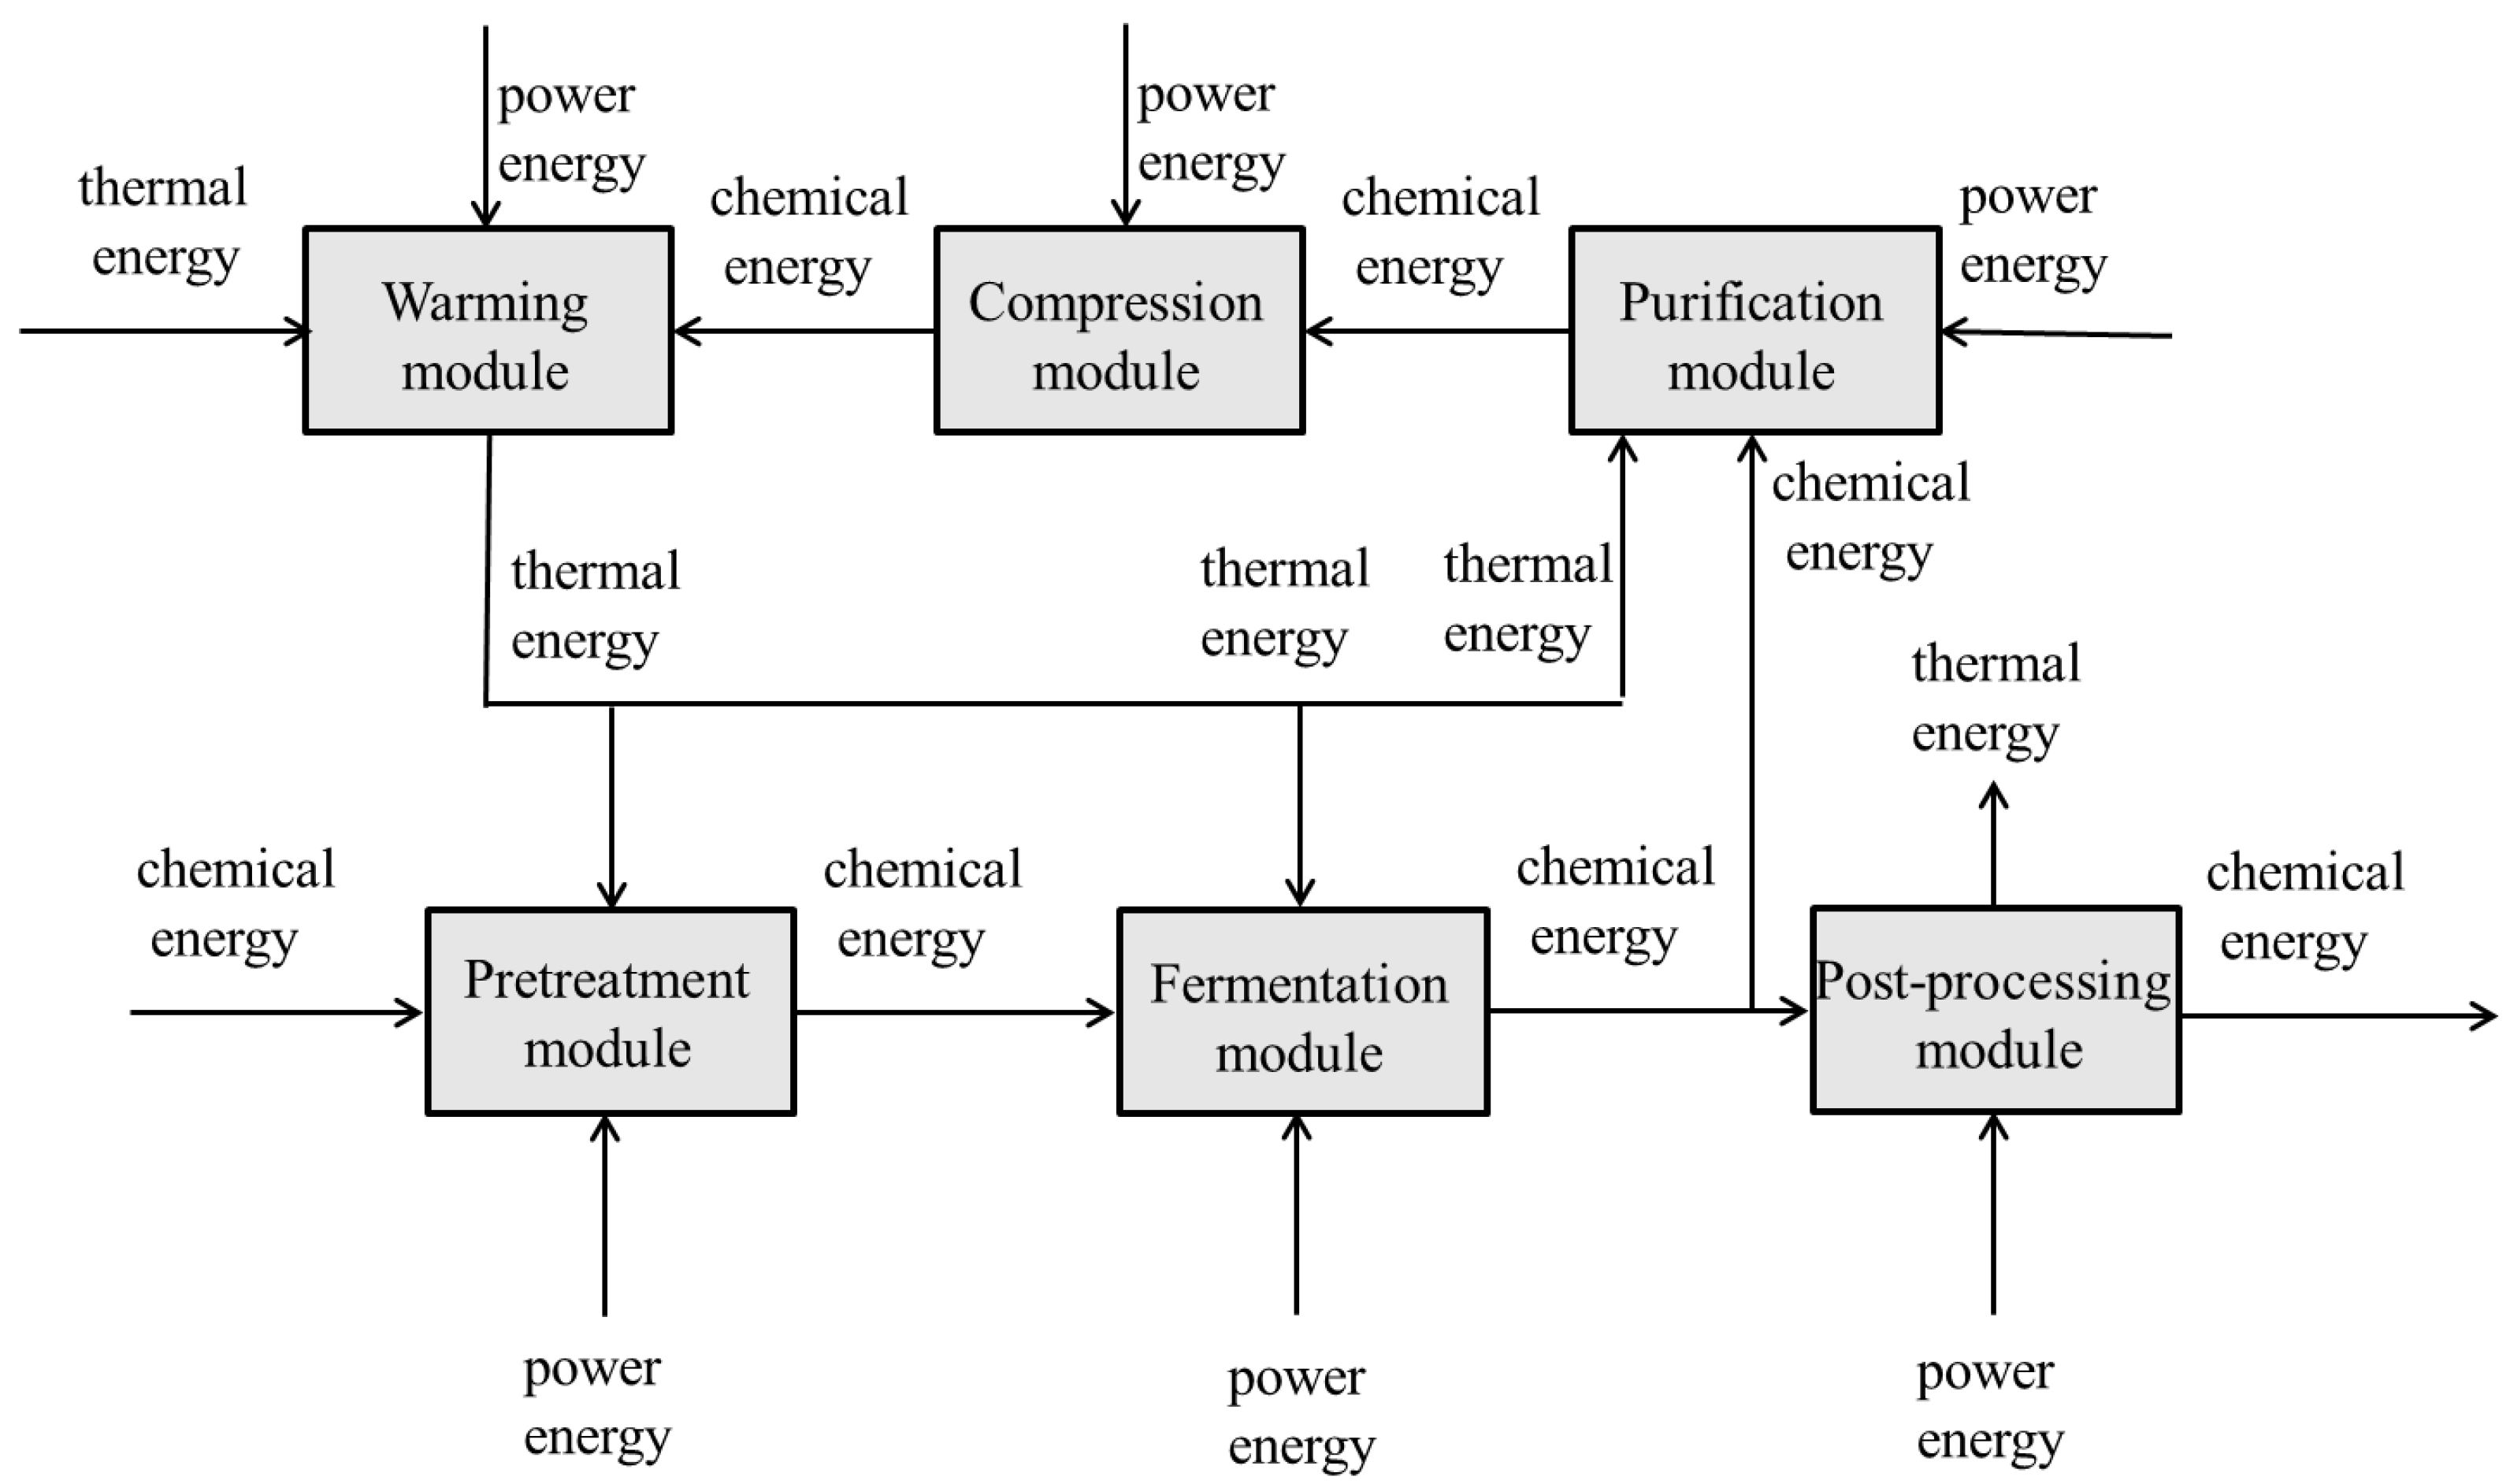
Figure 1 shows a diagram of a typical vehicle bio-methane process plant which can process 120 tons of raw feedstock to afford 10,000 m3 of biogas daily, with 8000 m3 being processed into 4800 m3 of compressed natural gas (CNG) and the remaining 2000 m3 being used for heat production. The range of energy consuming techniques present in the biogas process include mechanical pretreatment, high temperature anaerobic fermentation, wet catalytic desulfurization processes, alcohol amine decarburization (MEA), four stage compression technology, addition of biological fertilizer, and boiler heating technology. The main technical parameters of the fermentation process involve maintaining the fermentation liquid concentration at 8%, maintaining the digestion temperature at 55 °C and ensuring that the concentration of CH4 is 60% in biogas, and 97% in CNG. The waste heat produced by this system originates from top gas present in the decarburization tower, the lean fermentation liquor, the air compressor used for cooling water, the biogas slurry, and the boiler exhaust gas. The input heat used for this system is mainly used to heat and maintain the temperature of the fermentation liquid at 55 °C, and to carry out the decarburization desorption process. Figure 2 shows the energy balance diagram used to describe the vehicle bio-methane process.
3. Pinch Analysis of Research System
3.1. Logistical Parameters Used for Pinch Analysis Process
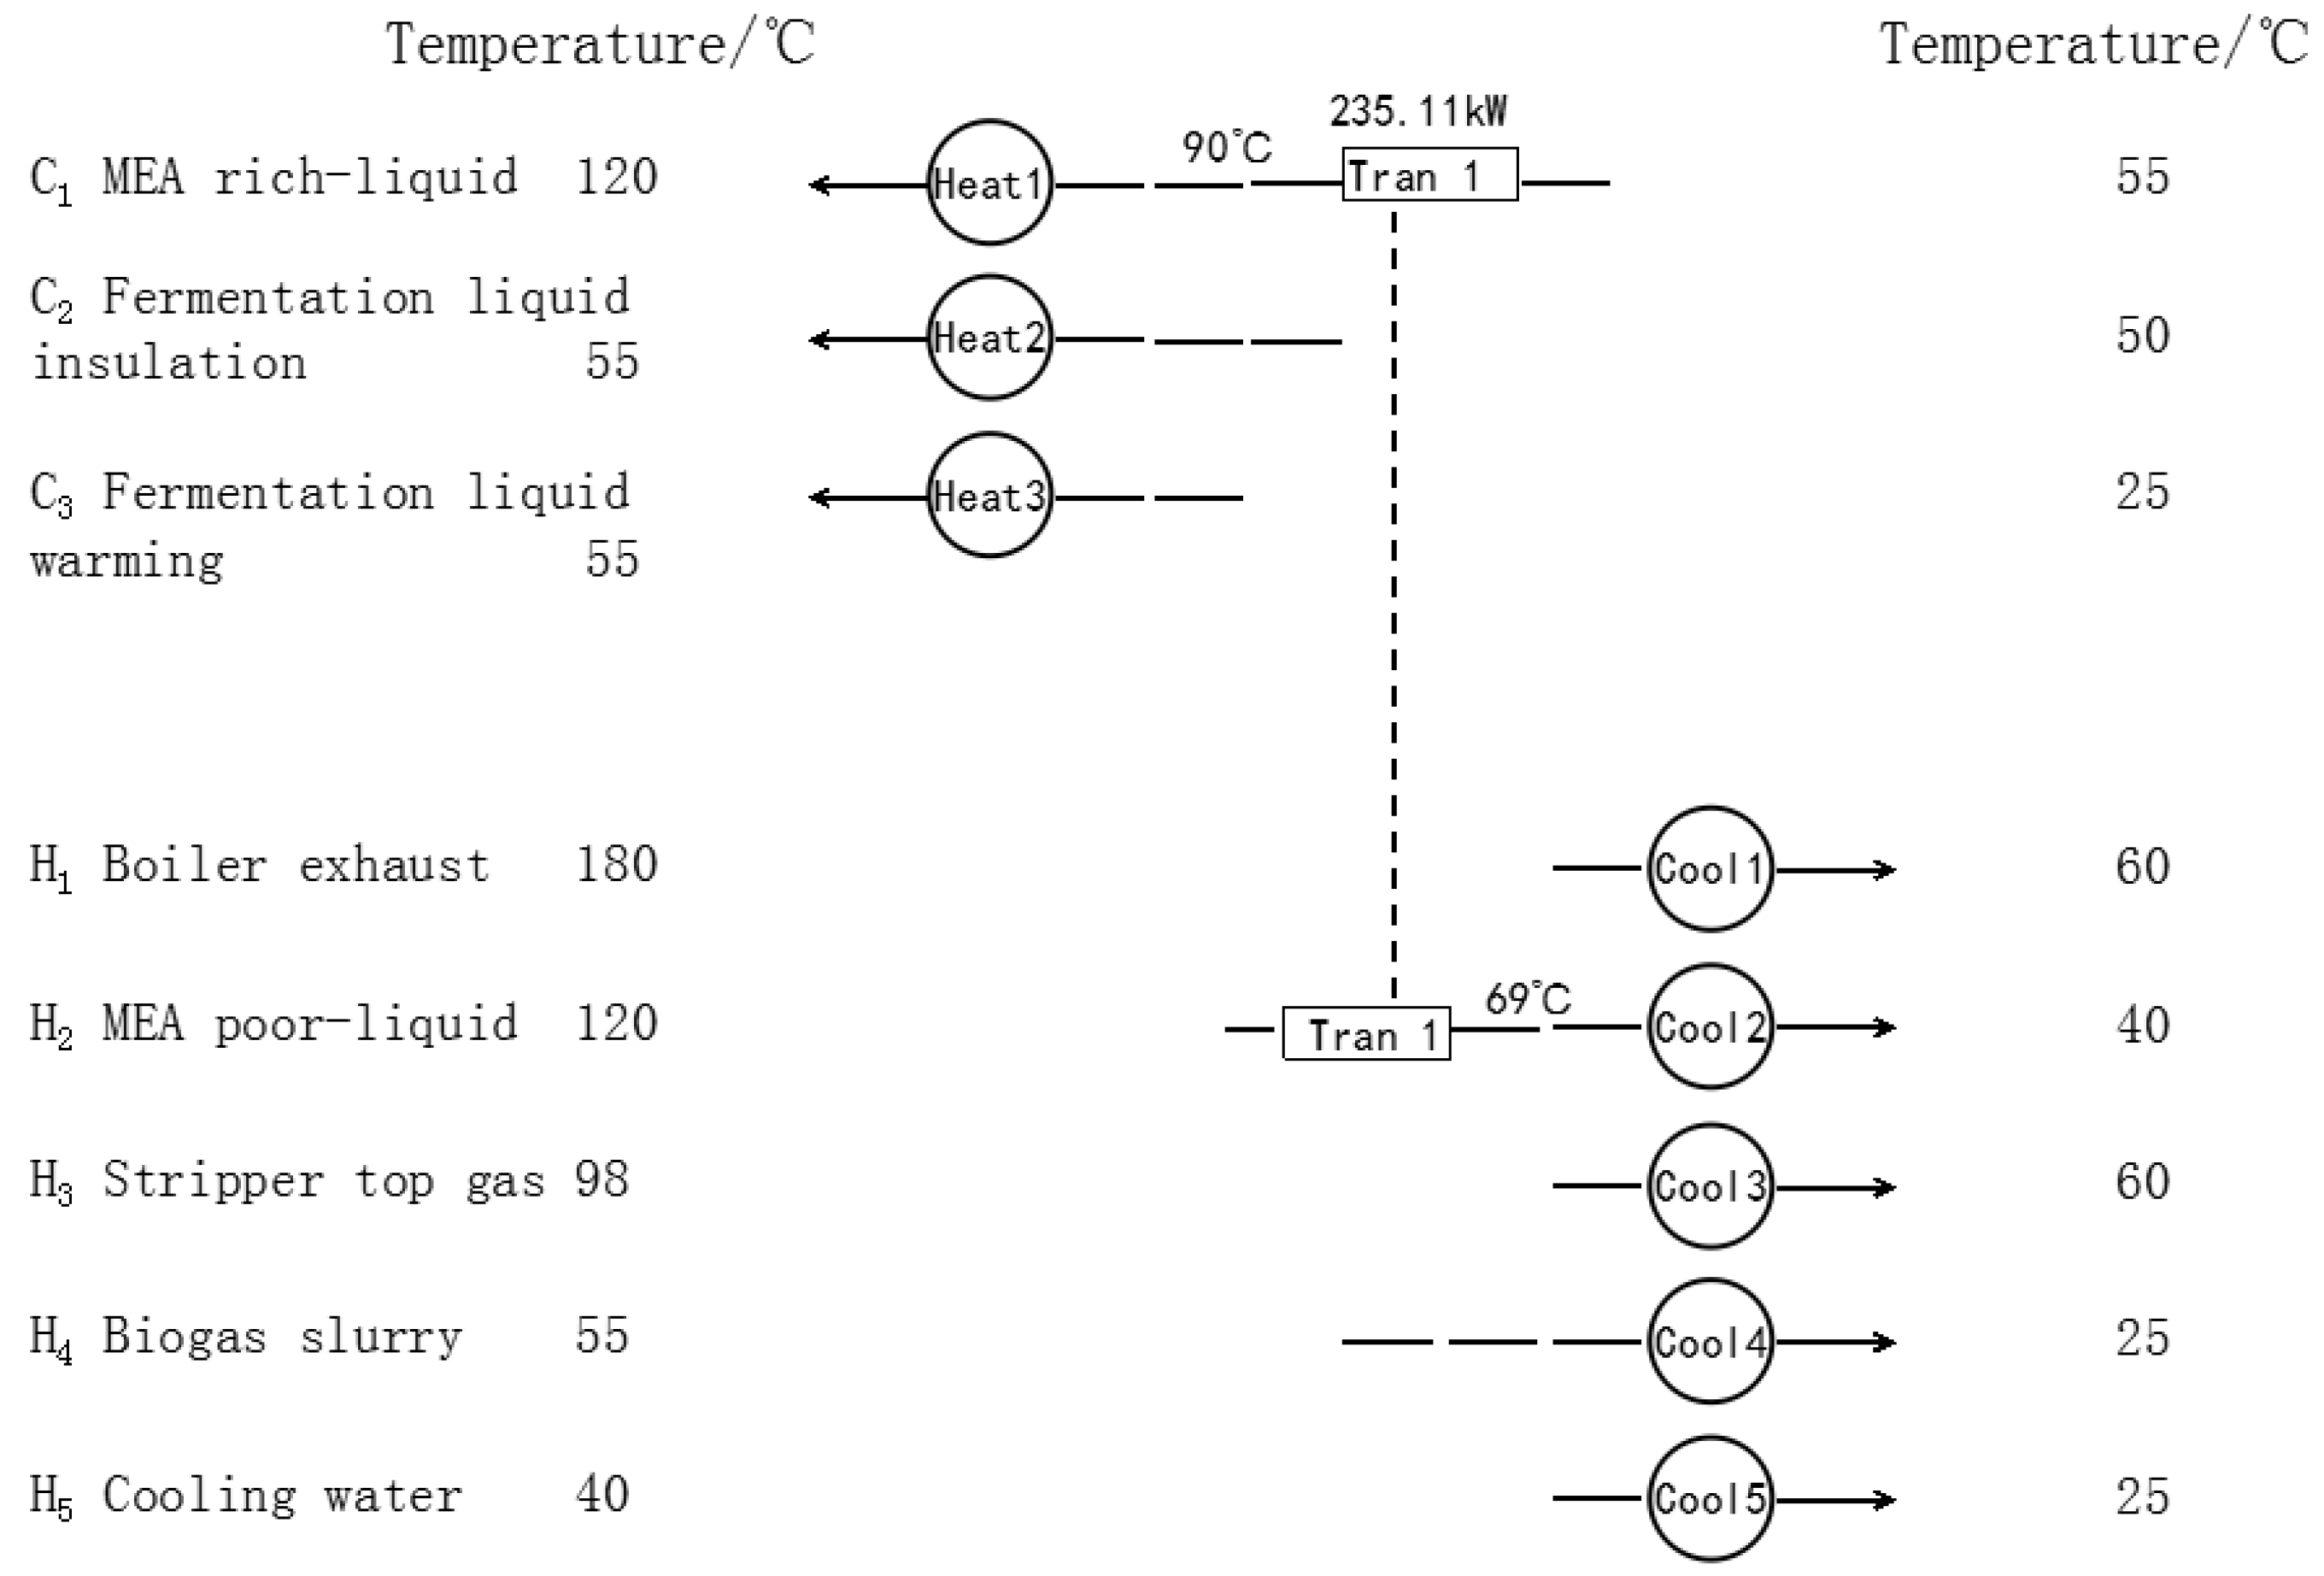
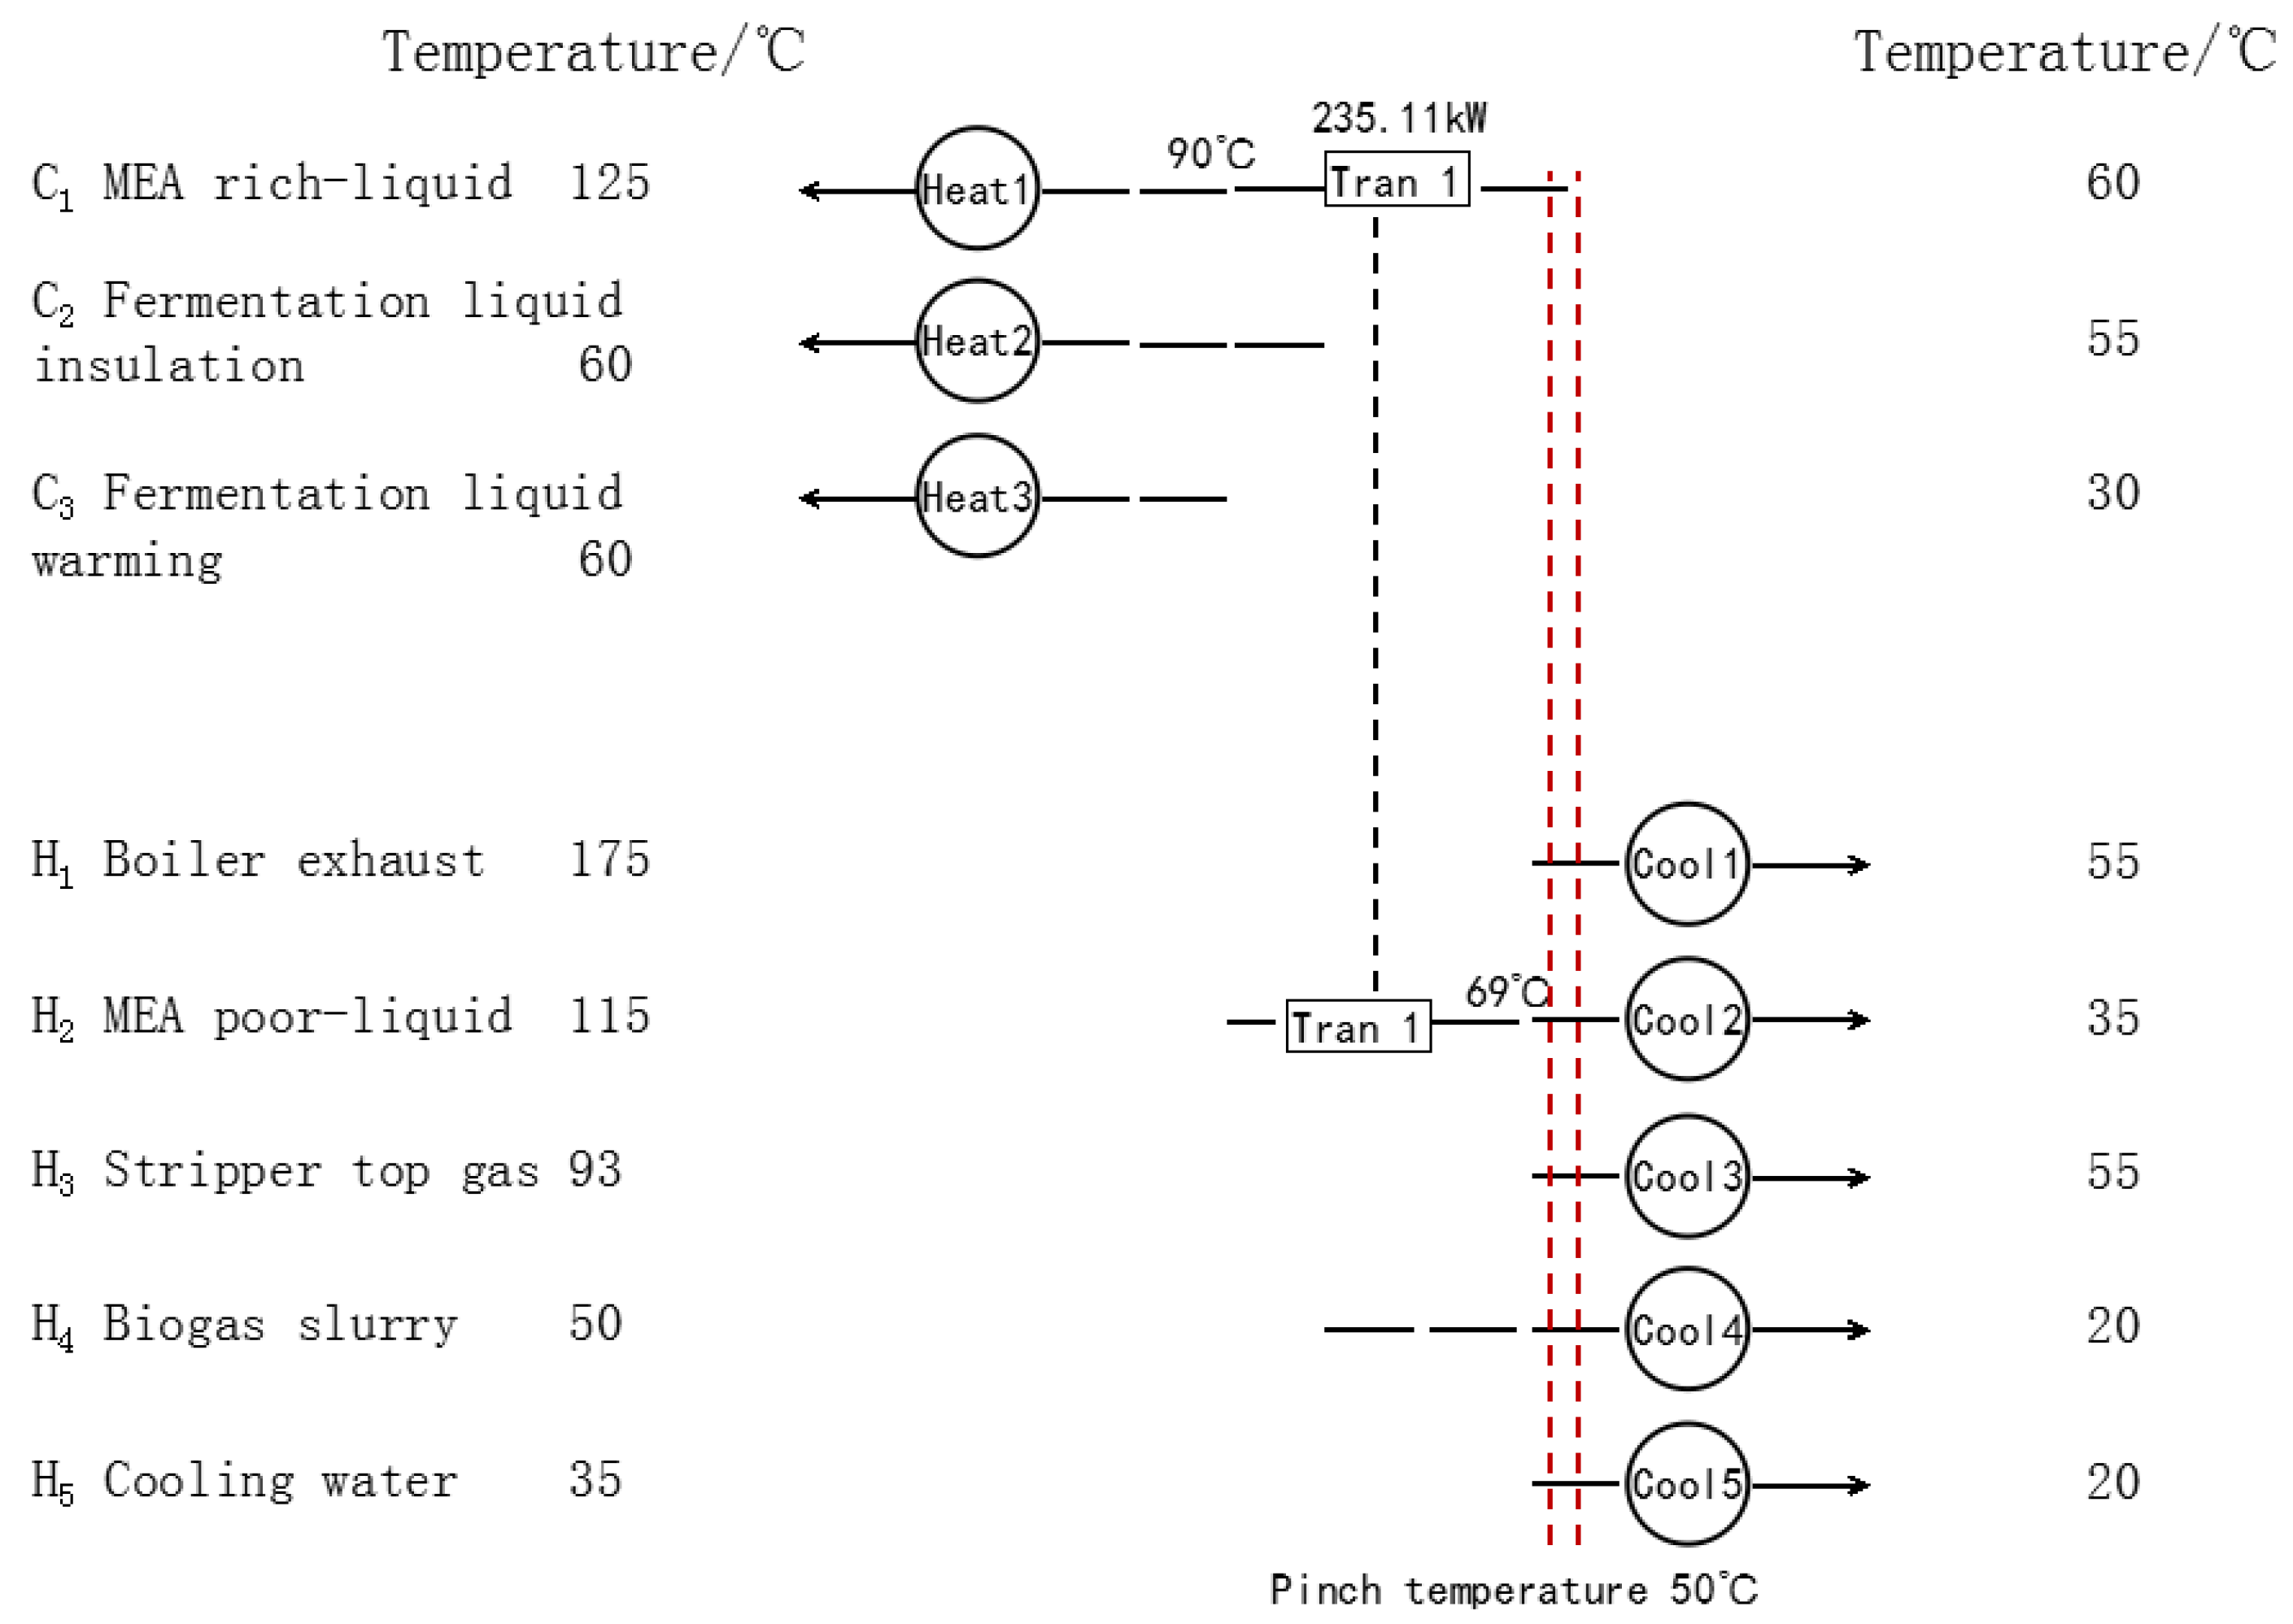
The process and design data produced by 8 vehicle bio-methane projects with daily productivities of 10,000 cubic meter biogas (5 hot flows and 3 cold flows) were analyzed (See Table 1), with hot fluxes (H1~H5) requiring cooling, and cold fluxes (C1~C3) requiring heating. The plant operating the C1 process incorporates rich liquid heating processes, facilitates heat desorption from chemical reactions, and contains a rehydration tower that consumes extra heat. The plant operating the C2 process results in heat loss from the fermentation tank, the biogas, evaporation of water vapor and from pipelines. The initial heat exchange network employed in this project is shown in Figure 3, which only has partial heat exchange between the MEA lean liquid and the MEA rich liquid. The heat exchange of the MEA lean liquid was 235.11 kW, the heating load of the cold logistics was 587.86 kW and the cooling load of the hot logistics was 567.79 kW.
3.2. Methods Used to Determine Pinch Point Location
3.2.1. Division of Temperature Zones
Since the temperature differences for heat transfer between hot and cold fluxes in the system were different from each other, the minimum temperature difference (ΔTmin) of the whole process could not be used for pinch analysis. To address this problem, a “virtual temperature method” was used for pinch analysis [13,16]. As shown in Table 1, it was assumed that ΔTmin= 10 °C, with heat fluxes being cooled by 5 °C and cold fluxes being heated by 5 °C [17]. The network was then divided into 9 regions based on segmentation of a virtual temperature zone, as shown in Figure 4.
3.2.2. Determining the Heat Balance of Temperature Zones
The heat balance of each temperature zone was calculated according to Equations (1) and (2) [18]:
where, n is the temperature zone number, with n = 1, 2, …9; being the extra heat required by a temperature zone (n in kW); is the sum of the heat capacities of all the cold fluxes in a temperature zone (n in kW/°C); is the sum of the heat capacity of all the hot fluxes in a temperature zone (n in kW/°C); , is the input and output temperature of a temperature zone (n in °C); is the input heat of the temperature zone n (in kW); is the output heat ofthe temperature zone (n in kW).
A question table was then constructed, based on the heat balance values calculated for each temperature zone (see Table 2).
The pinch point where the heat flux between temperature zones 6 and 7 were found to be zero occurred at an average virtual temperature of 50 °C, corresponding to a minimum heating utility heat load of 234.02 kW and a minimum cooling utility heat load of 234.02 kW, respectively.
3.3. Total Load Curve of Heat Exchange Network
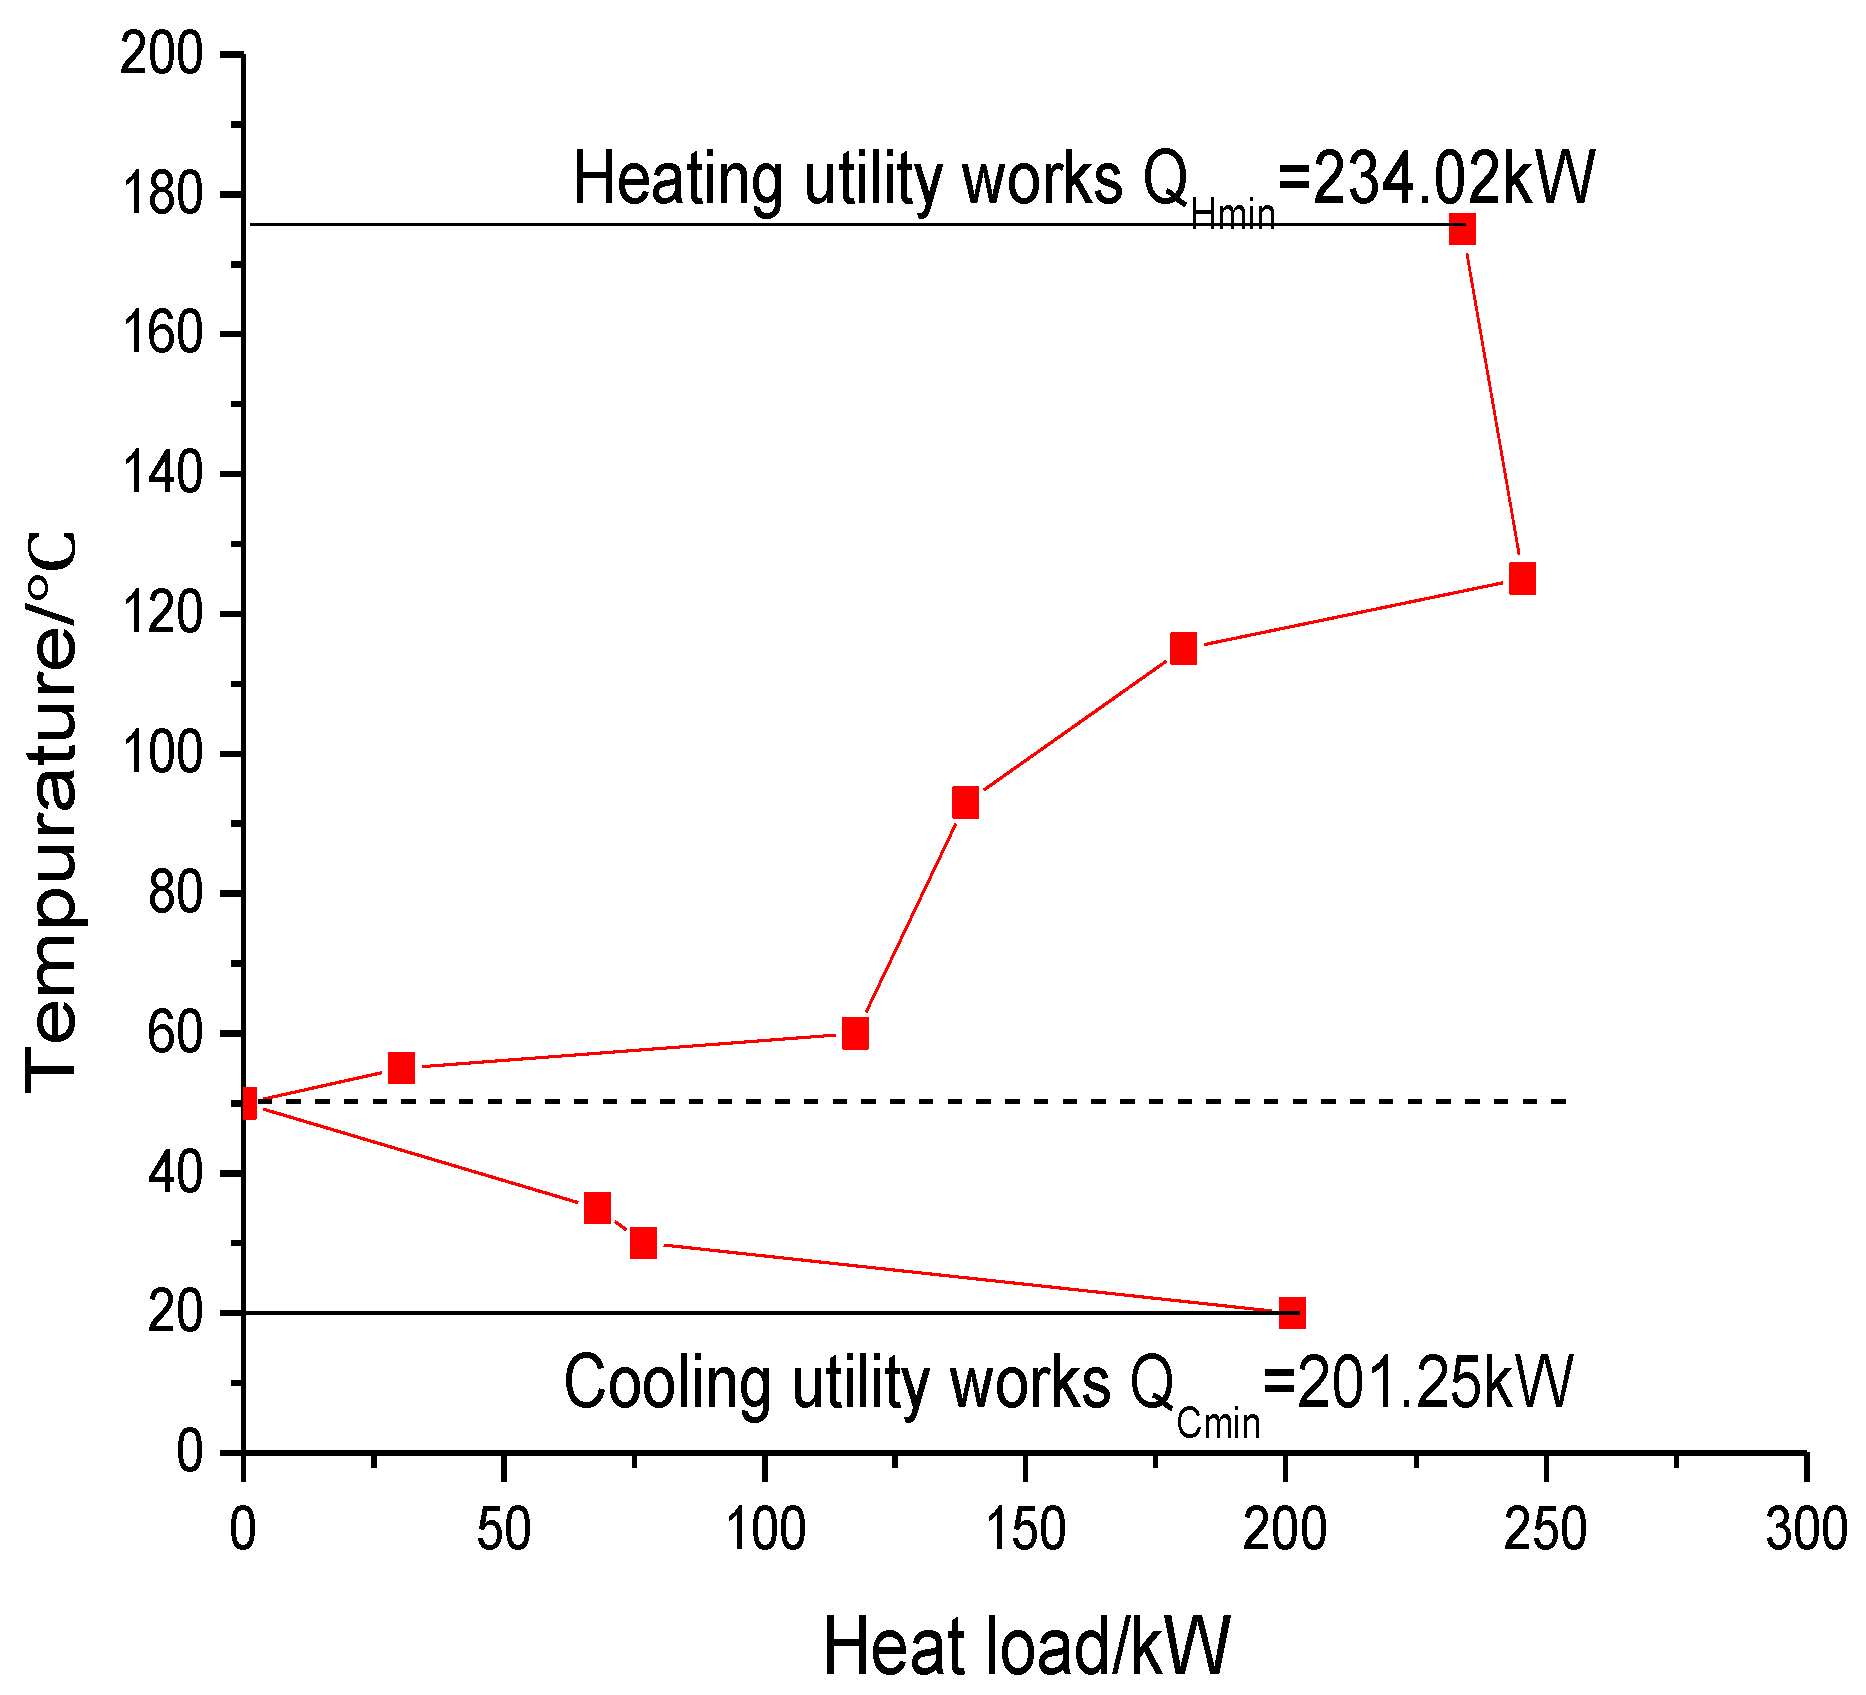
A cascade diagram for heat flux was constructed using data from Table 2, with the numbers in each rectangle representing the amount of external heat supplied (see Figure 5). The average temperatures of hot and cold fluids around the border of the cascade diagram for all fluxes were marked as points on the total composite curve (average temperature for the vertical axis; heat flux for horizontal axis) (see Figure 5). Subsequently, adjacent points were connected by a series of lines, resulting in the construction of a total load curve that was used to optimize the performance of the heat exchange network (see Figure 6) [19].
Total load curves were used to describe the relationship between the systematic heat flux and average temperature using a T-Q chart. The region above the pinch point can be used to represent the relationship between external heating energy and the average temperature, whilst the region below the pinch point represents the relationship between external cooling energy and the average temperature [20]. The pinch point of 50 °C is the temperature where the balance of heating/cooling energy required to maintain an optimal process is zero, with the total load curve providing a tool to guide optimization of the heat exchange network [21].
3.4. Diagnosis and Analysis of Heat Exchange Network
3.4.1. Energy Saving Potential of the Heat Exchange Network
The original heat transfer network had a minimum temperature difference of 10 °C, an actual heating utility value of 587.86 kW, and a minimum heating utility value of 234.02 kW. This corresponds to a maximum energy saving potential for the heat exchange network of 353.84 kW, representing an overall energy saving potential of 60.19%.
3.4.2. Irrationality of the Heat Exchange Network
Pinch points were used to construct lattice diagrams for the design and diagnosis of the biogas heat exchange network [22], with a 60.19% value indicating that its initial performance was very irrational. Therefore, it was necessary to optimize the performance of the heat exchange network further (See Figure 7), with analyses carried out to evaluate whether: (a) a heat exchanger was passing through the pinch point; (b) there was a cooler exchanger above the pinch point; or (c) there was a heat exchanger below the pinch point [23,24].Two irrationalities in the vehicle bio-methane plant system were identified, the nature of which are described below:
- (1)
- A cooler exchanger existed above the pinch point, with a H2 lean liquid source at 115–64–35 °C and a lean liquid source at 50–64 °C, both being above the pinch point. This irrationality could be corrected using cold logistics to decrease and maintain the temperature of the fermentation broth at 50 °C.
- (2)
- A heater exchanger existed below the pinch point, which occurred when the temperature of the fermentation reaction (C3) lay in the 30–50 °C region, which resulted in an increase in the amount of heat being transferred to the heating unit. This pinch point rule violation was corrected by rapidly heating the fermentation liquid to the pinch point temperature (50 °C) using a series of hot fluxes, with the required temperature then being maintained using a series of heating/cooling units.
3.5. Optimization of the Heat Exchange Network
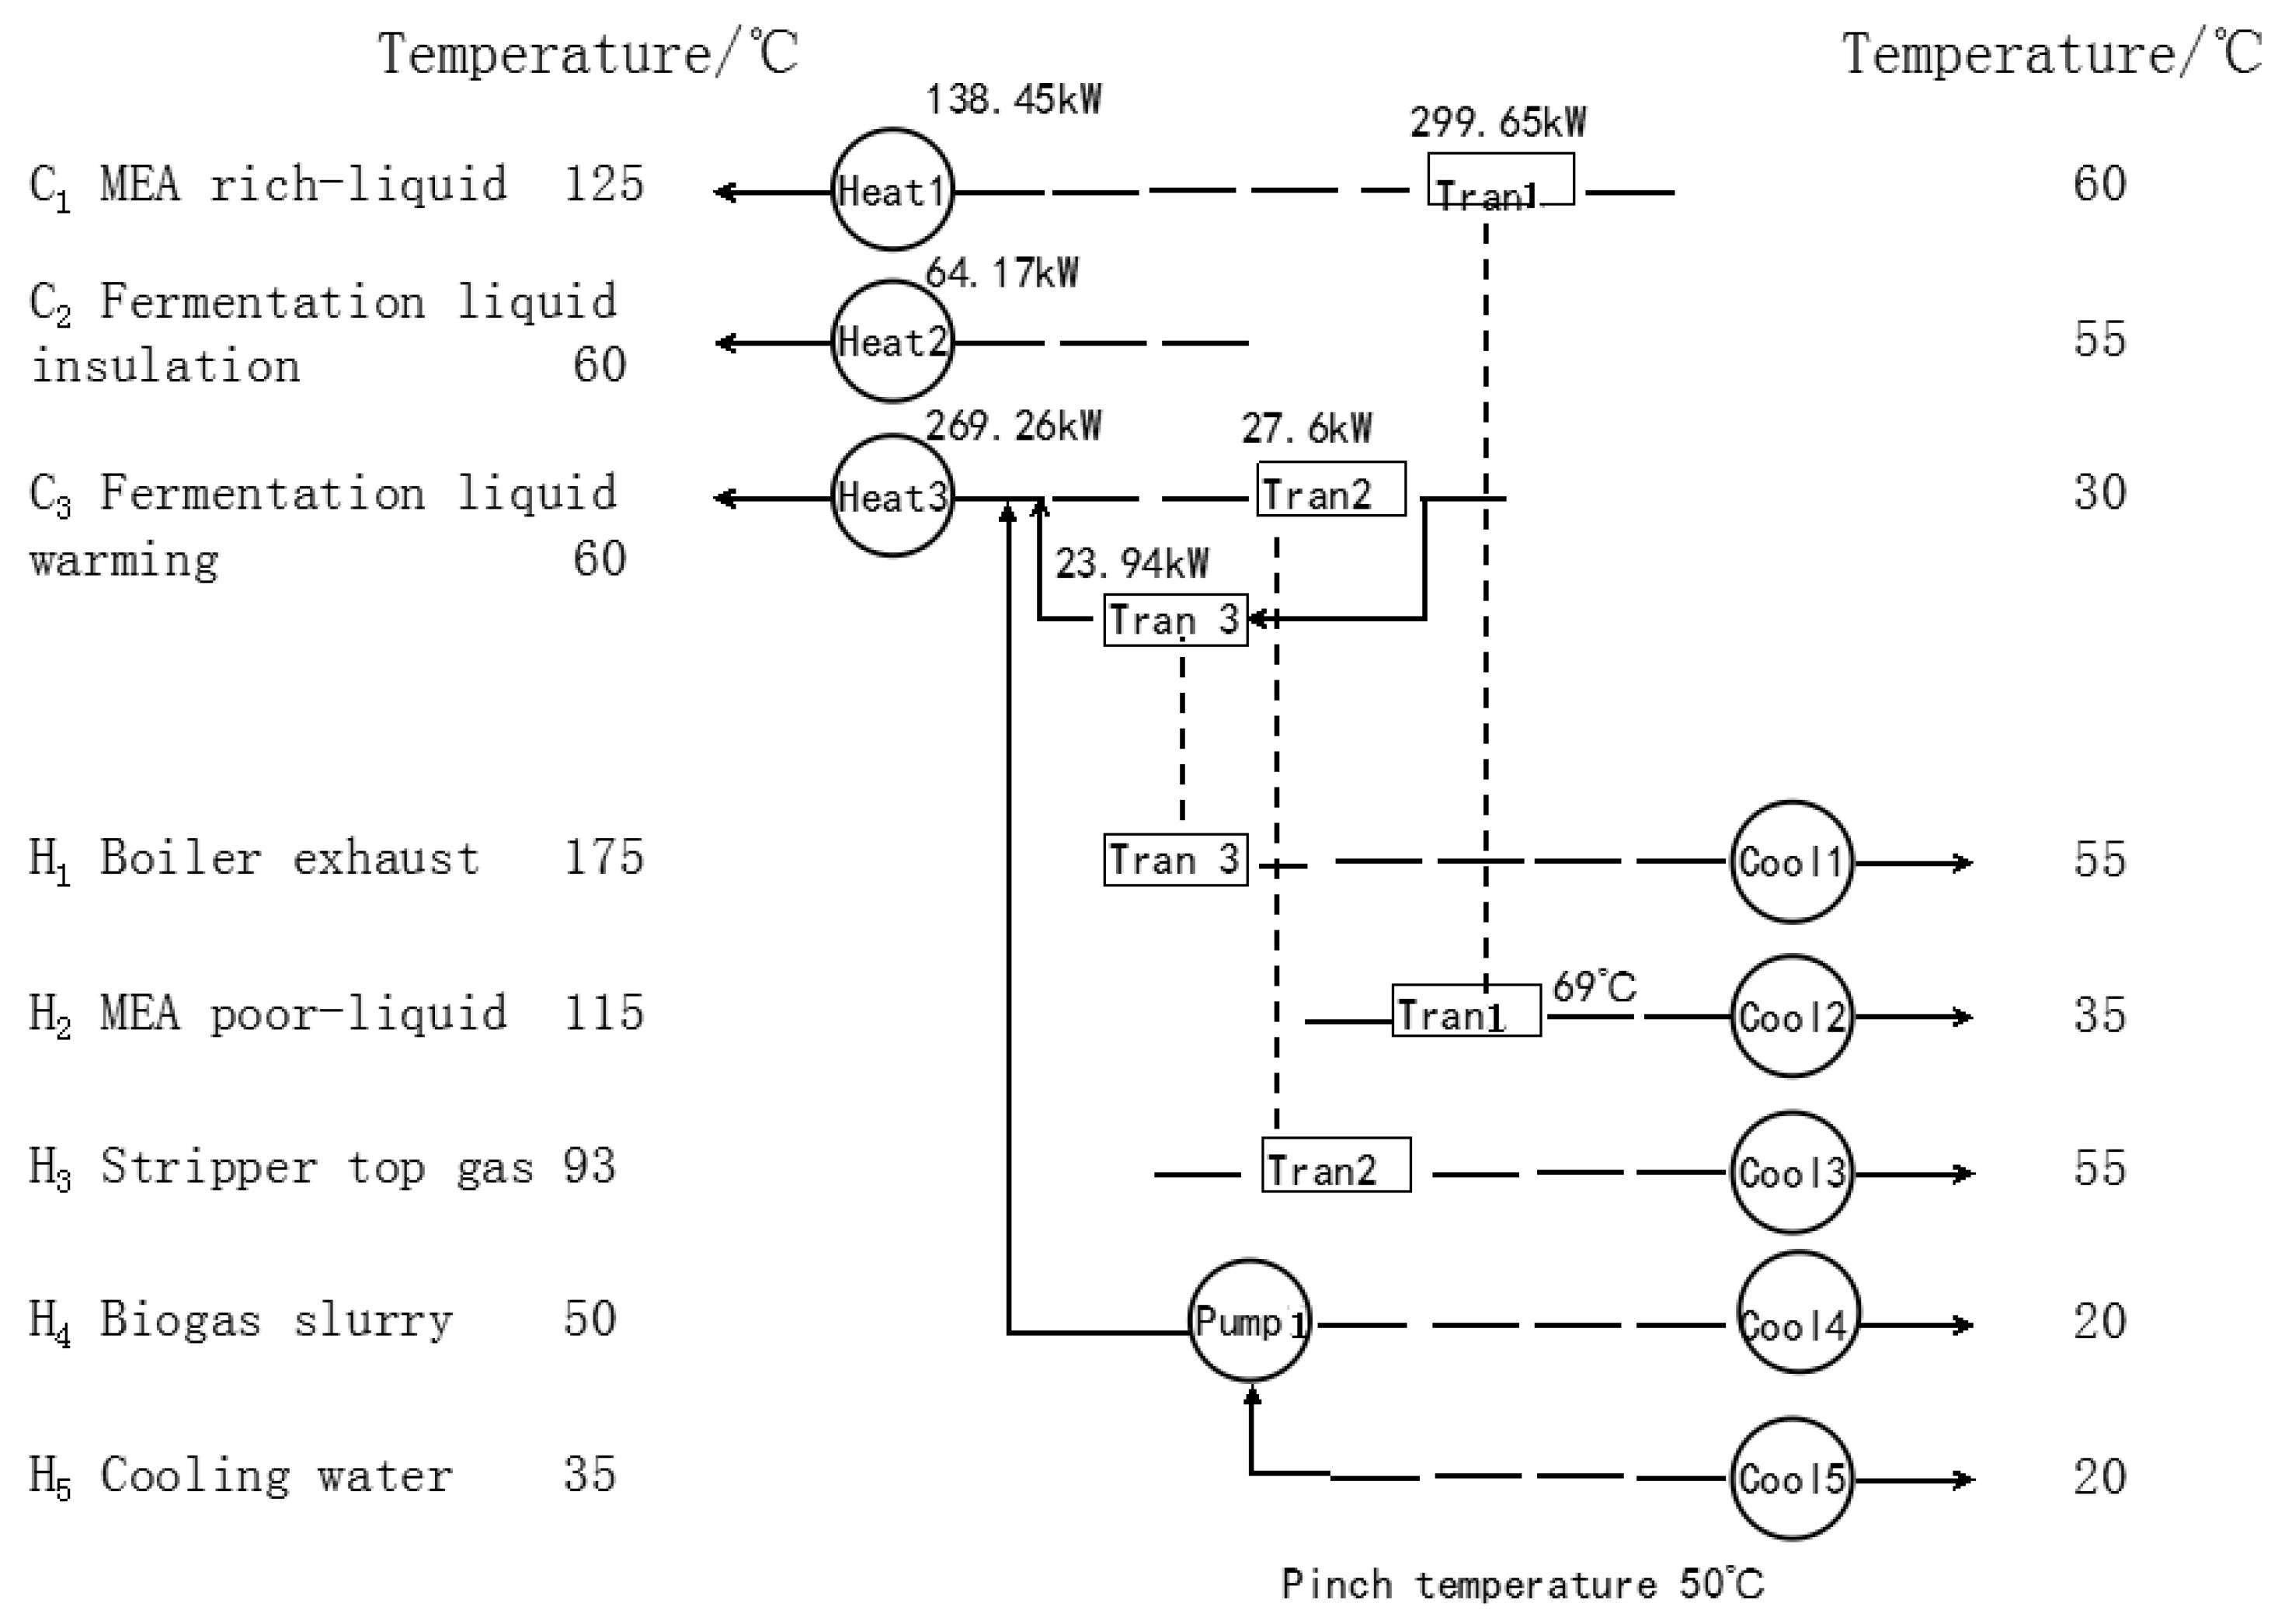
The pinch design method was then used to optimize the number of heaters and coolers required to obtain an optimal heat exchange system, using the network shown in Figure 8. The cold logistics are presented at the top of the diagram (from right to left), whilst the heat logistics are located at the bottom of the diagram (from left to right). Matched heat exchanges between the two logistics were represented using connected virtual lines, with a comprehensive optimization process then used to carry out the following changes to the heat exchange network:
- (1)
- The surface area of the first heat exchanger was increased to improve the rate of heat exchange from the MEA lean liquid to the MEA rich liquid, with the MEA lean liquid being recovered at 50 °C with a heat transfer capacity of 64.54 kW.
- (2)
- Two additional heat exchangers (2 and 3) were introduced to match the temperature of the boiler exhaust and the tower top gas to the fermentation liquid. This enabled 27.6 kW of extra energy to be potentially recovered from the boiler exhaust, whilst 23.94 kW could be recovered from the tower top gas-stream.
Therefore, the addition of two additional heat exchangers to the process would enable better thermal energy recovery which would only require relatively minor changes to the infrastructure of the thermal exchange network. These changes would enable a reduction in the amount of heat input required in the fermentation process, corresponding to a decreased heat load of 116.08 kW and an energy saving ratio of 19.75%. This is much less than the total energy saving that could potentially be achieved by global pinch analysis of this process, mainly because the waste heat lost from the biogas slurry and the compressor are still not being recovered.
4. Systematic Integration of a Hot Pumping Unit
Energy saving rates could be further improved by optimizing the current heat exchange network using pinch analysis, however, pinch analysis could only be carried out at the same level between cold and hot fluxes, with some low-grade waste heat remaining unrecovered. Heat pump integration technology could potentially recover low-grade waste heat [25,26], with two types of absorption heat pump technology commonly employed in vehicle bio-methane plants [27]. The first type of absorption heat pump consumes small amounts of high-grade energy to recover waste heat produced by high-grade or low-grade waste heat sources [28]. The second type of absorption heat pump is used to increase temperature, with its coefficient of performance generally lying between 0.4 and 0.5, and the temperature of the heat source not normally <75 °C [29].
4.1. Hot Pump Integration
In pinch analysis, the heat pump is generally set across the pinch point, with external inputs from hot fluxes below the pinch point being transferred to cold fluxes above the pinch point to reduce external energy consumption [30]. Systematic pinch analysis revealed that the waste heat from the biogas slurry and the cooling water of the compressor was not being utilized efficiently. This is because the temperatures of the biogas slurry and cooling water were lower than the pinch point temperature and so this waste heat component was not being recovered by heat exchange. However, this heat source could potentially be recovered using a first type absorption heat pump to heat the fermentation broth, using the potential process design plan shown in Figure 9.
4.2. Calculation of the Effect of Heat Pump Integration on the Biogas Process
The ambient temperature of a fermentation broth with a biogas slurry flow rate of 2.78 kg/s was found to be 25 °C, which was heated to a maximum temperature of 55 °C using a series of absorbers and condensers using an overall heat input of 320.83 kW. Conversely, maintaining the temperature of the biogas slurry at 55 °C at a flow rate of 2.64 kg/s, resulted in an overall residual heat output of 318.25 kW. The temperature of the cooling water from the compressor at a flow rate of 0.75 kg/s was maintained at 40 °C, which generated a secondary heat output of 27.57 kW.
If the pump power is ignored, then COP = (Qa + Qc)/Qg, with the energy required to heat the fermentation broth for the optimized process given by Qa + Qc = 269.29 kW. Therefore, increases in the COP value can result from an increase the Qe value, or decreases in the Qg value and/or the final temperature of the residual heat (tz). Therefore, the value of tz plays an important role in determining the amount of waste heat recovered from the biogas slurry and compressor, whilst also affecting the amount of input heat required as a heat source [31]. The final temperature of the biogas slurry and compressor cooling water were found to be 25~30 °C, which meant that the COP value for the heat pumps was around 1.541~1.557 [32]. For convenient analysis, the heat pump COP value was set at 1.55, which meant that the recoverable waste heat Qe = (COP − 1) × (318.25 + 27.56) = 95.55 kW, corresponding to an energy saving rate for the heat pump of 16.25%.
In summary, after optimizing the heat exchange network by pinch analysis, the energy saving potential was found to be 116.0 kW, which represents an energy saving rate of 19.75%. After optimizing a new heat pump integration system, the energy saving potential was 95.55 kW, corresponding to an energy saving rate of 16.25%. Therefore, combining these two processes should provide a total energy saving of 211.63 kW and a global energy saving rate of 36%.
5. Economic Analysis
5.1. Formula Used to Determine Economic Performance of New Heat Exchange Network
The maximum energy saving benefit for the new heat exchange network were calculated using Equation (3) [33,34]:
maxS = the benefit of steam and hot water saving
The minimum cost increase for the new heat exchange network were calculated using Equation (4):
minC = initial investment of equipment + operating costs
The minimum investment recovery period for the new heat exchange network were calculated using Equation (5):
N = minC/maxS
5.2. Target Analyses for the New Heat Exchange Process
(1) Energy savings benefit
Values for the annual energy saving of the new process were calculated using Equation (6) [35]:
where, maxS represents the annual energy savings in USD ($); τ is the annual heat running time of new equipment in hours; CH is the average annual gas price in $/m3; Qze is the energy saving potential in MW; qH is the heat value of gas in MJ.
maxS = 3600τCHQze/qH
Pinch analysis calculations based on heat pump integration revealed a potential annual energy saving for Qze of 211.63 kW, which would represent a yearly energy savings benefit of 103,300 USD.
(2) Cost analysis
Pinch analysis revealed that the new heat pump integration process would require three new heat exchangers (namely, exchangers 1, 2, and 3) and a new absorption heat pump. The costs of this new equipment were analyzed, including consideration of initial investment and operating costs that were calculated using Equation (7) [36]:
where, p1 is the cost of equipment and its installation (default value set at 1) [18]; α is the ratio between shell, installation and heat transfer costs; CA is the Unit area heat exchanger price (in $/m3); A1 is the increased area of heat exchanger 1 (in m3); A2 is the area of heat exchanger 2 (in m3); A3 is the area of heat exchanger 3 (in m3); CT is the cost of heat exchanger frame (in $/frame); n is the total number of heat exchangers.
C1 = p1[(1 + α)CA(A1 + A2 + A3) + CT·n]
The operating cost C2 of the heat exchanger operation was calculated using Equation (8) [36]:
where: τ is the annual running time for the heat exchangers in h; p2 is a value given to the devaluation of funds and the change in price of electricity (value taken as 9.52) [18]; CE is the cost of electricity in $/kW·h; PA is the value for power consumption in kW.
C2 = τp2CEPA(A1 + A2 + A3)
Calculations using data from Table 3 reveal that increasing the area of the heat exchanger by 166.5 m3 would require an initial investment of 35,900 USD, whilst heat exchanger operating costs would rise by 6600 USD.
The cost of purchasing a 100 kW lithium bromide absorption heat pump of 374,700 USD was estimated from quotes obtained from Guangzhou Hongrui Equipment Co., Ltd., Guangzhou, China. Since the power consumed by solution pumps are small, their operating costs can effectively be ignored. The power of a sewage pump is 11 kW, with an annual running time of 8760 h at an average electricity price of 0.062 $/kW·h giving annual electricity costs of around 6000 USD.
(3) Minimum period for recovery of investment
The annual energy saving benefit for the minimum investment recovery period maxS was calculated to be 103,300 USD per year. Cost analysis revealed that minC = 35,900 + 6600 + 374,700 + 6000 = 423,200 USD. Therefore, the minimum investment period required to recover capital outlay for this new network process could be calculated as N = 423,200 ÷ 103,300 = 4.1 years (see Table 4).
6. Conclusions
This research shows that it is possible to effectively recycle the systemic waste heat using the technologies of pinch analysis and heat pump integration. Pinch analysis was used to diagnose and optimize the heat exchange network, which would enable heating input levels to be reduced by 116.08 kW, corresponding to an energy saving rate of 19.75%. It was also predicted that the introduction of heat pump integration technology would allow a further 95.55 kW of waste heat to be recovered from biogas slurry and compressor cooling water, thus corresponding to a further energy saving rate of 16.25%. Therefore, these would result in a total system energy saving of 211.63 kW, representing a total energy saving rate of 36%.
Economic analysis revealed a minimum cost for this modification of 423,200 USD through the waste heat recovery, this modified plant would result in a potential saving on energy investment of around 103,300 USD per year, which would take 4.1 years to reach payout time.
Whilst this research has revealed that pinch point analysis and heat pump integration technology can potentially lead to significant saving in energy costs, we note that the amount of energy recovered is still far less than could potentially be recovered by a fully optimized heat exchange network. Therefore, the development of more efficient low grade waste heat recycling techniques and optimal waste heat recycling processes will be the key to future energy saving strategies in the biogas industry.
Author Contributions
Conceptualization, F.Z. and Y.S.; Data curation, F.Z. and J.Z.; Formal analysis, F.Z. and J.Z.; Funding acquisition, Y.S.; Investigation, F.Z.; Methodology, F.Z. and J.Z.; Supervision, W.L.; Writing—original draft, F.Z.; Writing—review & editing, Y.S. and X.K.
Acknowledgments
This work was supported by National key R&D program (2017FYD0800801), CAS International Partnership Program (182344175820170009), National Fund Project (51776208), Guangdong science and technology plan project (2013B010204053) and Natural Science Foundation of Guangdong Province (2016A030312007).
Conflicts of Interest
The authors declare no conflicts of interest.
References
- Li, M. The Strategic Analysis and Research for Civilian Biomethane Project in Nanning. Master’s Thesis, Guangxi University, Nanning, China, 2012. [Google Scholar]
- Singhal, S.; Agarwal, S.; Arora, S.; Sharma, P.; Singhal, N. Upgrading techniques for transformation of biogas to bio-CNG: A review. Int. J. Energy Res. 2017, 41, 1657–1669. [Google Scholar] [CrossRef]
- National Development and Reform Commission. “The 13th Five-Year Plan” of the National Rural Biogas Development; National Development and Reform Commission: Beijing, China, 2017.
- Wang, L.; Wang, Z.; Lu, H. Thermal balance analysis of northern large-scale biogas generating system based on system dynamics. Trans. Chin. Soc. Agric. Eng. 2011, 27, 26–31. [Google Scholar]
- Sui, X. Research on Energy Analysis of Biogas Projects in Cold Regions and Energy-Saving Technology. Master’s Thesis, Northeast Agricultural University, Harbin, China, 2015. [Google Scholar]
- Panepinto, D.; Fiore, S.; Zappone, M.; Genon, G.; Meucci, L. Evaluation of the energy efficiency of a large wastewater treatment plant in Italy. Appl. Energy 2016, 161, 404–411. [Google Scholar] [CrossRef]
- Suyu, L.; Shuyang, W.; Erping, L.; Wenying, T. Biogas refining system for obtaining vehicle fuel similar to natural gas. Trans. Chin. Soc. Agric. Eng. 2009, 210–213. [Google Scholar] [CrossRef]
- Pang, Y.; Li, X. Future development of biogas industrialization and key technologies in China. Trans. Chin. Soc. Agric. Eng. 2006, 22, 53–57. [Google Scholar]
- Roš, M.; Zupančič, G.D. Two Stage Thermophilic Anaerobic–Aerobic Mineralization–Stabilization of Excess Activated Sludge. J. Environ. Sci. Health Part A 2003, 38, 2381–2389. [Google Scholar] [CrossRef]
- Zhang, X.; Yan, J.; Li, H.; Chekani, S.; Liu, L. Investigation of thermal integration between biogas production and upgrading. Energy Convers. Manag. 2015, 102, 131–139. [Google Scholar] [CrossRef]
- Boissevain, B. Waste Heat Utilization in an Anaerobic Digestion System; Utah State University: Logan, UT, USA, 2012. [Google Scholar]
- Fu, Q. Thermodynamic Analysis of Energy System; Xi’an Jiaotong University Press: Xi’an, China, 2005. [Google Scholar]
- Shen, L. Study of the Pinch Design Method for Heat Exchanger Networks Based on the Oil Physical Properties. Master Thesis, Lanzhou University of Technology, Lanzhou, China, 2014. [Google Scholar]
- Fan, Y.; Wang, X. Research on technologies for the recovery of the flue gas waste heat in gas boilers. Eng. Technol. 2016, 11, 00233, (In Chinese with English Abstract). [Google Scholar]
- Zhao, X. Simulation and Optimization of Biogas Decarbonization by Activated MDEA Process. Master’s Thesis, Tianjin University, Tianjin, China, 2014. (In Chinese with English Abstract). [Google Scholar]
- Valiani, S.; Tahouni, N.; Panjeshahi, M.H. Optimization of pre-combustion capture for thermal power plants using Pinch Analysis. Energy 2017, 119, 950–960. [Google Scholar] [CrossRef]
- Savulescu, L.; Périn-Levasseur, Z.; Benali, M. Innovative. Visualization technique for energy flow analysis: Waste heat recovery and energy savings opportunities. Appl. Therm. Eng. 2013, 61, 143–148. [Google Scholar] [CrossRef]
- Zhang, K. Energy Analysis and Optimization of MEA-Absorption CO2 Capture Systems for Coal-Fired Power Plants. Ph.D. Thesis, Beijing University of Technology, Beijing, China, 2015. [Google Scholar]
- Garbs, M. Pinch Analysis and Process Integration: A User Guide on Process Integration for the Efficient Use of Energy. J. Clean. Prod. 2016, 110, 203. [Google Scholar] [CrossRef]
- Yu, Y.S.; Li, Y.; Lu, H.F.; Dong, R.F.; Zhang, Z.X.; Feng, X. Synergy Pinch Analysis of CO2 Desorption Process. Ind. Eng. Chem. Res. 2011, 50, 13997–14007. [Google Scholar] [CrossRef]
- Rozali, N.E.; Alwi, S.R.; Manan, Z.A.; Klemeš, J.J. Sensitivity analysis of hybrid power systems using Power Pinch Analysis considering Feed-in Tariff. Energy 2016, 116, 1260–1268. [Google Scholar] [CrossRef]
- Wang, Y. Process Integration for Energy Saving and Process Pinch Analysis. Master’s Thesis, China University of Petroleum (East China), Beijing, China, 2011. [Google Scholar]
- Olsen, D.; Liem, P.; Abdelouadoud, Y.; Wellig, B. Thermal Energy Storage Integration Based on Pinch Analysis–Methodology and Application. Chem. Ing. Tech. 2017, 89, 598–606. [Google Scholar] [CrossRef]
- Zhang, K.; Liu, Z.; Huang, S.; Li, Y. Process integration analysis and improved options for an MEA CO2, capture system based on the pinch analysis. Appl. Therm. Eng. 2015, 85, 214–224. [Google Scholar] [CrossRef]
- Klemeš, J.J.; Varbanov, P.S. Heat integration including heat exchangers, combined heat and power, heat pumps, separation processes and process control. Appl. Therm. Eng. 2012, 43, 1–6. [Google Scholar] [CrossRef]
- Soylemez, M.S. Optimum heat pump in drying systems with waste heat recovery. J. Food Eng. 2006, 74, 292–298. [Google Scholar] [CrossRef]
- Jia, B. Study on Application of Flue Gas Type Double-Effect Lithium Bromide Absorption Heat Pump in Wastewater Treatment Plant. Master’s Thesis, Qingdao Technological University, Qingdao, China, 2016. [Google Scholar]
- Zhai, J. Study on the First Kind of Absorption Heat Pump Is Applied in the Central Heating System. Ph.D. Thesis, Harbin Engineering University, Harbin, China, 2014. [Google Scholar]
- Wang, R.; Wang, L.; Cai, J.; Du, S.; Hu, B. Research Status and Trends on Industrial Heat Pump and Network Utilization of Waste Heat. J. Refrig. 2017, 38, 1–10. [Google Scholar]
- Chen, Y.G. Pinch point analysis and design considerations of CO2 gas cooler for heat pump water heaters. Int. J. Refrig. 2016, 69, 136–146. [Google Scholar] [CrossRef]
- Zhao, Q.; Wang, C.; Tan, Y. Study of reasonable heating range and energy-saving criterion of absorption heat pump district heating system. J. Hebei Univ. Sci. Technol. 2013, 34, 86–90. [Google Scholar]
- Pan, F.F.; Shi, E.S.; Yi, W.F.; Xu, Z.Y. Research and Application on On-Line Performance Inspection of Large Absorption Heat Pump Waste Heat Recovery System of Combined Cycle Plant. Power Gener. Air Cond. 2014, 10, 309–319. [Google Scholar]
- Ren, Y. The Management of Energy Engineering; China Electric Power Press/Electric Power Press of China: Beijing, China, 2004. [Google Scholar]
- Liu, B. Process Energy Saving Technology and Equipment; Chemical Industry Press: Beijing, China, 2012. [Google Scholar]
- Dong, S. Economic Benefit Evaluation of 2×350 MW Construction Project Investment in XY Thermal Power Plant. Ph.D. Thesis, Jilin University, Jilin, China, 2015. [Google Scholar]
- Zhou, J. Simulation and Optimization of Carbon Dioxide Capture System in Power Plant. Master’s Thesis, Southeast University, Nanjing, China, 2012. [Google Scholar]
Figure 1.
Systemic flow diagram of the vehicle bio-methane plant.

Figure 2.
Energy balance of the system.

Figure 3.
Heat exchanger network of the system.

Figure 4.
Temperature zone division.

Figure 5.
Heat cascade diagram.

Figure 6.
Grand composite curves.

Figure 7.
Grid diagram for the heat exchanger network.

Figure 8.
Heat exchanger network after retrofitting.

Figure 9.
Plan for waste heat utilization.


Table 1.
Process stream data.
| Stream Type | Number and Name | Temperature/°C | Target Temperature/°C | Average Heat Capacity kW/°C | Heat Load/kW |
|---|---|---|---|---|---|
| Hot stream | H1 Boiler exhaust | 180 | 60 [14] | 0.23 | 27.6 |
| H2 MEA poor-liquid | 120 | 40 | 4.61 | 368.8 | |
| H3 Stripper top gas | 98 | 60 [15] | 1.26 | 47.88 | |
| H4 Biogas slurry | 55 | 25 | 10.61 | 318.25 | |
| H5 Cooling water | 40 | 25 | 1.84 | 27.56 | |
| Cold stream | C1 MEA rich-liquid | 55 | 120 | 6.74 | 438.1 |
| C2 Fermentation liquid insulation | 50 | 55 | 12.83 | 64.17 | |
| C3 Fermentation liquid warming | 25 | 55 | 10.69 | 320.83 |
Table 2.
Question table used to optimize pinch point location.
| Temperature Zone | Input Heat Required (kW) | Heat Flux with no Heat Input (kW) | Heat Flux with Heat Input (kW) | ||
|---|---|---|---|---|---|
| Input | Output | Input | Output | ||
| Temperature Zone 1 | −11.5 | 0 | 11.5 | 234.02 | 245.52 |
| Temperature Zone 2 | 65.1 | 11.5 | −53.6 | 245.52 | 180.42 |
| Temperature Zone 3 | 41.8 | −53.6 | −95.4 | 180.42 | 138.62 |
| Temperature Zone 4 | 21.12 | −95.4 | −116.52 | 138.62 | 117.5 |
| Temperature Zone 5 | 87.1 | −116.52 | −203.62 | 117.5 | 30.4 |
| Temperature Zone 6 | 30.4 | −203.62 | −234.02 | 30.4 | 0 |
| Temperature Zone 7 | −67.95 | −234.02 | −166.07 | 0 | 67.95 |
| Temperature Zone 8 | −8.8 | −166.07 | −157.27 | 67.95 | 76.75 |
| Temperature Zone 9 | −124.5 | −157.27 | −32.77 | 76.75 | 201.25 |
Table 3.
Basic parameters.
| Name | Symbol | Unit | Value |
|---|---|---|---|
| Annual running time | T | h | 8760 |
| Gas price | CH | $/m3 | 0.556 |
| Energy saving potential | Qe | MW | 0.21163 |
| Gas calorific value | qH | MJ | 35.9 |
| Cost | p1 | — | 1 |
| Ratio | A | — | 0.2 |
| Heat exchange price per unit area | CA | $/m3 | 156.13 |
| Price of heat exchanger frame | CT | $ | 2342 |
| Number of heat exchangers | N | set | 2 |
| Cost | p2 | — | 3.7 |
| Price of coal | CE | $/kW·h | 0.062 |
| Power consumption per unit area | PA | kW | 0.76 |
| Total power consumption of sewage pump | PB | kW | 11 |
Table 4.
Results of economic analysis.
| Name | Maximum Benefit USD | Minimum Cost USD | Minimum Investment Recovery Period/Years |
|---|---|---|---|
| Data | 103,300 | 423,200 | 4.1 |
© 2018 by the authors. Licensee MDPI, Basel, Switzerland. This article is an open access article distributed under the terms and conditions of the Creative Commons Attribution (CC BY) license (http://creativecommons.org/licenses/by/4.0/).
Share and Cite
MDPI and ACS Style
Zhen, F.; Zhang, J.; Li, W.; Sun, Y.; Kong, X. Optimizing Waste Heat Utilization in Vehicle Bio-Methane Plants. Energies 2018, 11, 1518. https://doi.org/10.3390/en11061518
AMA Style
Zhen F, Zhang J, Li W, Sun Y, Kong X. Optimizing Waste Heat Utilization in Vehicle Bio-Methane Plants. Energies. 2018; 11(6):1518. https://doi.org/10.3390/en11061518
Chicago/Turabian StyleZhen, Feng, Jia Zhang, Wenzhe Li, Yongming Sun, and Xiaoying Kong. 2018. "Optimizing Waste Heat Utilization in Vehicle Bio-Methane Plants" Energies 11, no. 6: 1518. https://doi.org/10.3390/en11061518
Note that from the first issue of 2016, this journal uses article numbers instead of page numbers. See further details here.