Petrographic Controls on Pore and Fissure Characteristics of Coals from the Southern Junggar Coalfield, Northwest China


1
School of Energy Resource, China University of Geosciences (Beijing), Beijing 100083, China
2
Coal Reservoir Laboratory of National Engineering Research Center of CBM Development & Utilization, China University of Geosciences, Beijing 100083, China
3
John and Willie Leone Family Department of Energy and Mineral Engineering, Pennsylvania State University, State College, PA 16802, USA
*
Author to whom correspondence should be addressed.
Energies 2018, 11(6), 1556; https://doi.org/10.3390/en11061556
Submission received: 8 May 2018
/
Revised: 29 May 2018
/
Accepted: 11 June 2018
/
Published: 14 June 2018
(This article belongs to the Section L: Energy Sources)
Abstract
:The productive potential of coalbed methane projects is controlled by pore and fissure characteristics, which are intrinsically related to coal petrology. This work attempts to identify the influence of petrographic factors on the development of pore and fissure systems in the southern Junggar Coalfield, Northwest China. Here, Middle Jurassic coal (lignite and subbituminous) petrology in coal seam No. 45 of the southern Junggar Coalfield (SJC) is studied with respect to the characteristics of pore and fissure structure with the aid of optical microscopes, scanning electron microscopy, mercury intrusion porosimetry, and nuclear magnetic resonance analysis. Maceral analysis shows coals at the SJC are dominated by vitrinite (38–87 vol %), with moderate quantities of inertinite (1–28 vol %) and liptinite (0.5–30 vol %). Decomposition of plants occurs under slightly oxic–anoxic conditions, with good tissue retention. Four types of coal facies are classified using petrographic indices, comprising (1) lower delta plain marsh, (2) lower delta plain fen, (3) upper delta plain wet forest swamp; and (4) piedmont plain moor. Pores and fissures are generally observed in telinite, collotelinite, fusinite, and semifusinite in SJC coals, indicating that the generation of pores and fissures is strongly influenced by coal macerals. Pore and fissure structures of coals in coal facies (1) appear weakly connected, whereas those in coal facies (2) reveal good connectivity. Coals in coal facies (3) and (4) show moderate connectivity between pore and fissure structure. Therefore, pore and fissure structures are significantly controlled by coal facies. This work provides practical recommendations and implementation methods for petrological studies in future coalbed methane exploration/development in the SJC. This study also serves to predict the physical properties of pores and fissures and interpret the control mechanism of coalbed methane production using coal petrology.
1. Introduction
The productivity and recovery efficiency of methane in coal are primarily affected by physical properties of coal reservoirs [1,2], which in turn are controlled by the structural, physical, and chemical properties of maceral groups and coal ranks [3,4,5]. Variation in maceral groups depends on the depositional environment of the peat precursor and paleomire type [6], while coal rank is dependent upon the degree of coalification expressed by variation in fixed carbon and moisture [7]. Clarkson and Bustin [8] conclude that small pores are derived from the intermolecular spaces in coal macromolecular structures developed by the gelification of organic matter. The origin of larger pores is correlated with the initial cellular structures of the plant remains or primary pores, which stem from the precursor peat and its coal facies [9]. Many workers have proposed dual origins of fissures: (1) coalification with progressive loss of moisture [10]; and (2) multiple causes relating to geology, tectonic stress, and local structural conditions [11]. Consequently, coal petrographic characteristics (vitrinite reflectance, maceral and coal facies etc.) may be considered as the key factors controlling pore and fissure structures [12] for individual seams with a similar burial history and coalification processes in a coalfield [13].
Since the 1950s, many researchers have reported coal facies dependent upon the paleo-environmental conditions under which the precursor peats accumulated [14,15,16]. Coal facies can be determined by diverse methods which can be divided into six types of indices with respect to petrography, mineralogy, geochemistry, palaeopalynology, paleobotany, and sedimentology [17]. The primary emphasis is on the petrographic properties found in maceral and sub-maceral group analyses [13]. Maceral ratios, lithotypes, microlithotypes, and coal facies diagrams are widely used to estimate environmental conditions during precursor peat accumulation [18]. Coal facies diagrams mainly consist of Mukhopadhyay’s (1989) ternary diagram [19], the tissue preservation index (TPI) vs. gelification index (GI) diagram [20,21] and the vegetation index (VI) vs. ground water index (GWI) diagram [22]. The ternary diagram can characterize: (1) the precursor peat accumulating under oxic or anoxic conditions; (2) the peat-forming plants dominated by woody or herbaceous species; and (3) the contribution of fern or reed species during peat accumulation [23]. The TPI vs. GI and GWI vs. VI diagrams can effectively interpret the conditions during peat accumulation and the predominant peat-forming vegetation [24]. The western Ukraine coals formed in conditions of marsh swamp, watered forest swamp, dry forest swamp, and wet forest swamp [25]. Zhang et al. [13] distinguished four types of paleoenvironment (wet forest swamp, intergradation forest swamp, drained forest swamp, and fresh-water peat swamp) in medium-volatile bituminous seams 4, 8, and 9 in the Hedong coalfield, Ordos Basin. Hou et al. [2] determined four types of coal facies (wet forest swamp, intergradation forest swamp, drained forest swamp, and open water peat swamp) in highly-volatile bituminous seams from the Yuqia Coalfield in the northern Qaidam Basin. Little is known about the deposition environment of Middle Jurassic coals (lignite and subbituminous) in the southern Junggar Coalfield (SJC), NW China [26]. Knowledge of the petrographical composition of lignite and subbituminous coal is key to reconstructing and concluding the paleo-peat development within a coal basin [18,27]. However, a detailed relationship between coal facies and characteristics of pore and fissure has seldom been researched in low-rank coals.
In this research, macerals are distinguished and quantified by an optical microscope in the Middle Jurassic coals in coal seam No. 45 of the SJC. We detected spatial and temporal changes in maceral composition and changes in vegetation and depositional environment. The study discusses the critical role of pore fissure development in coal seams for CBM adsorption, storage, preferential migration pathways, and flow. The purpose of the study is to characterize the system of pores and fissures of Middle Jurassic lignite and subbituminous coals in the SJC using maceral petrology. Additionally, the study will assist in determining pores and fissures related to coal maceral and facies, and their specific milieu. The final aim is to find the best target areas for the coalbed methane exploration and exploitation in the SJC. It also serves to predict the physical properties of pores and fissure and interpret the control mechanism of coalbed methane production using coal petrology.
2. Geological Setting
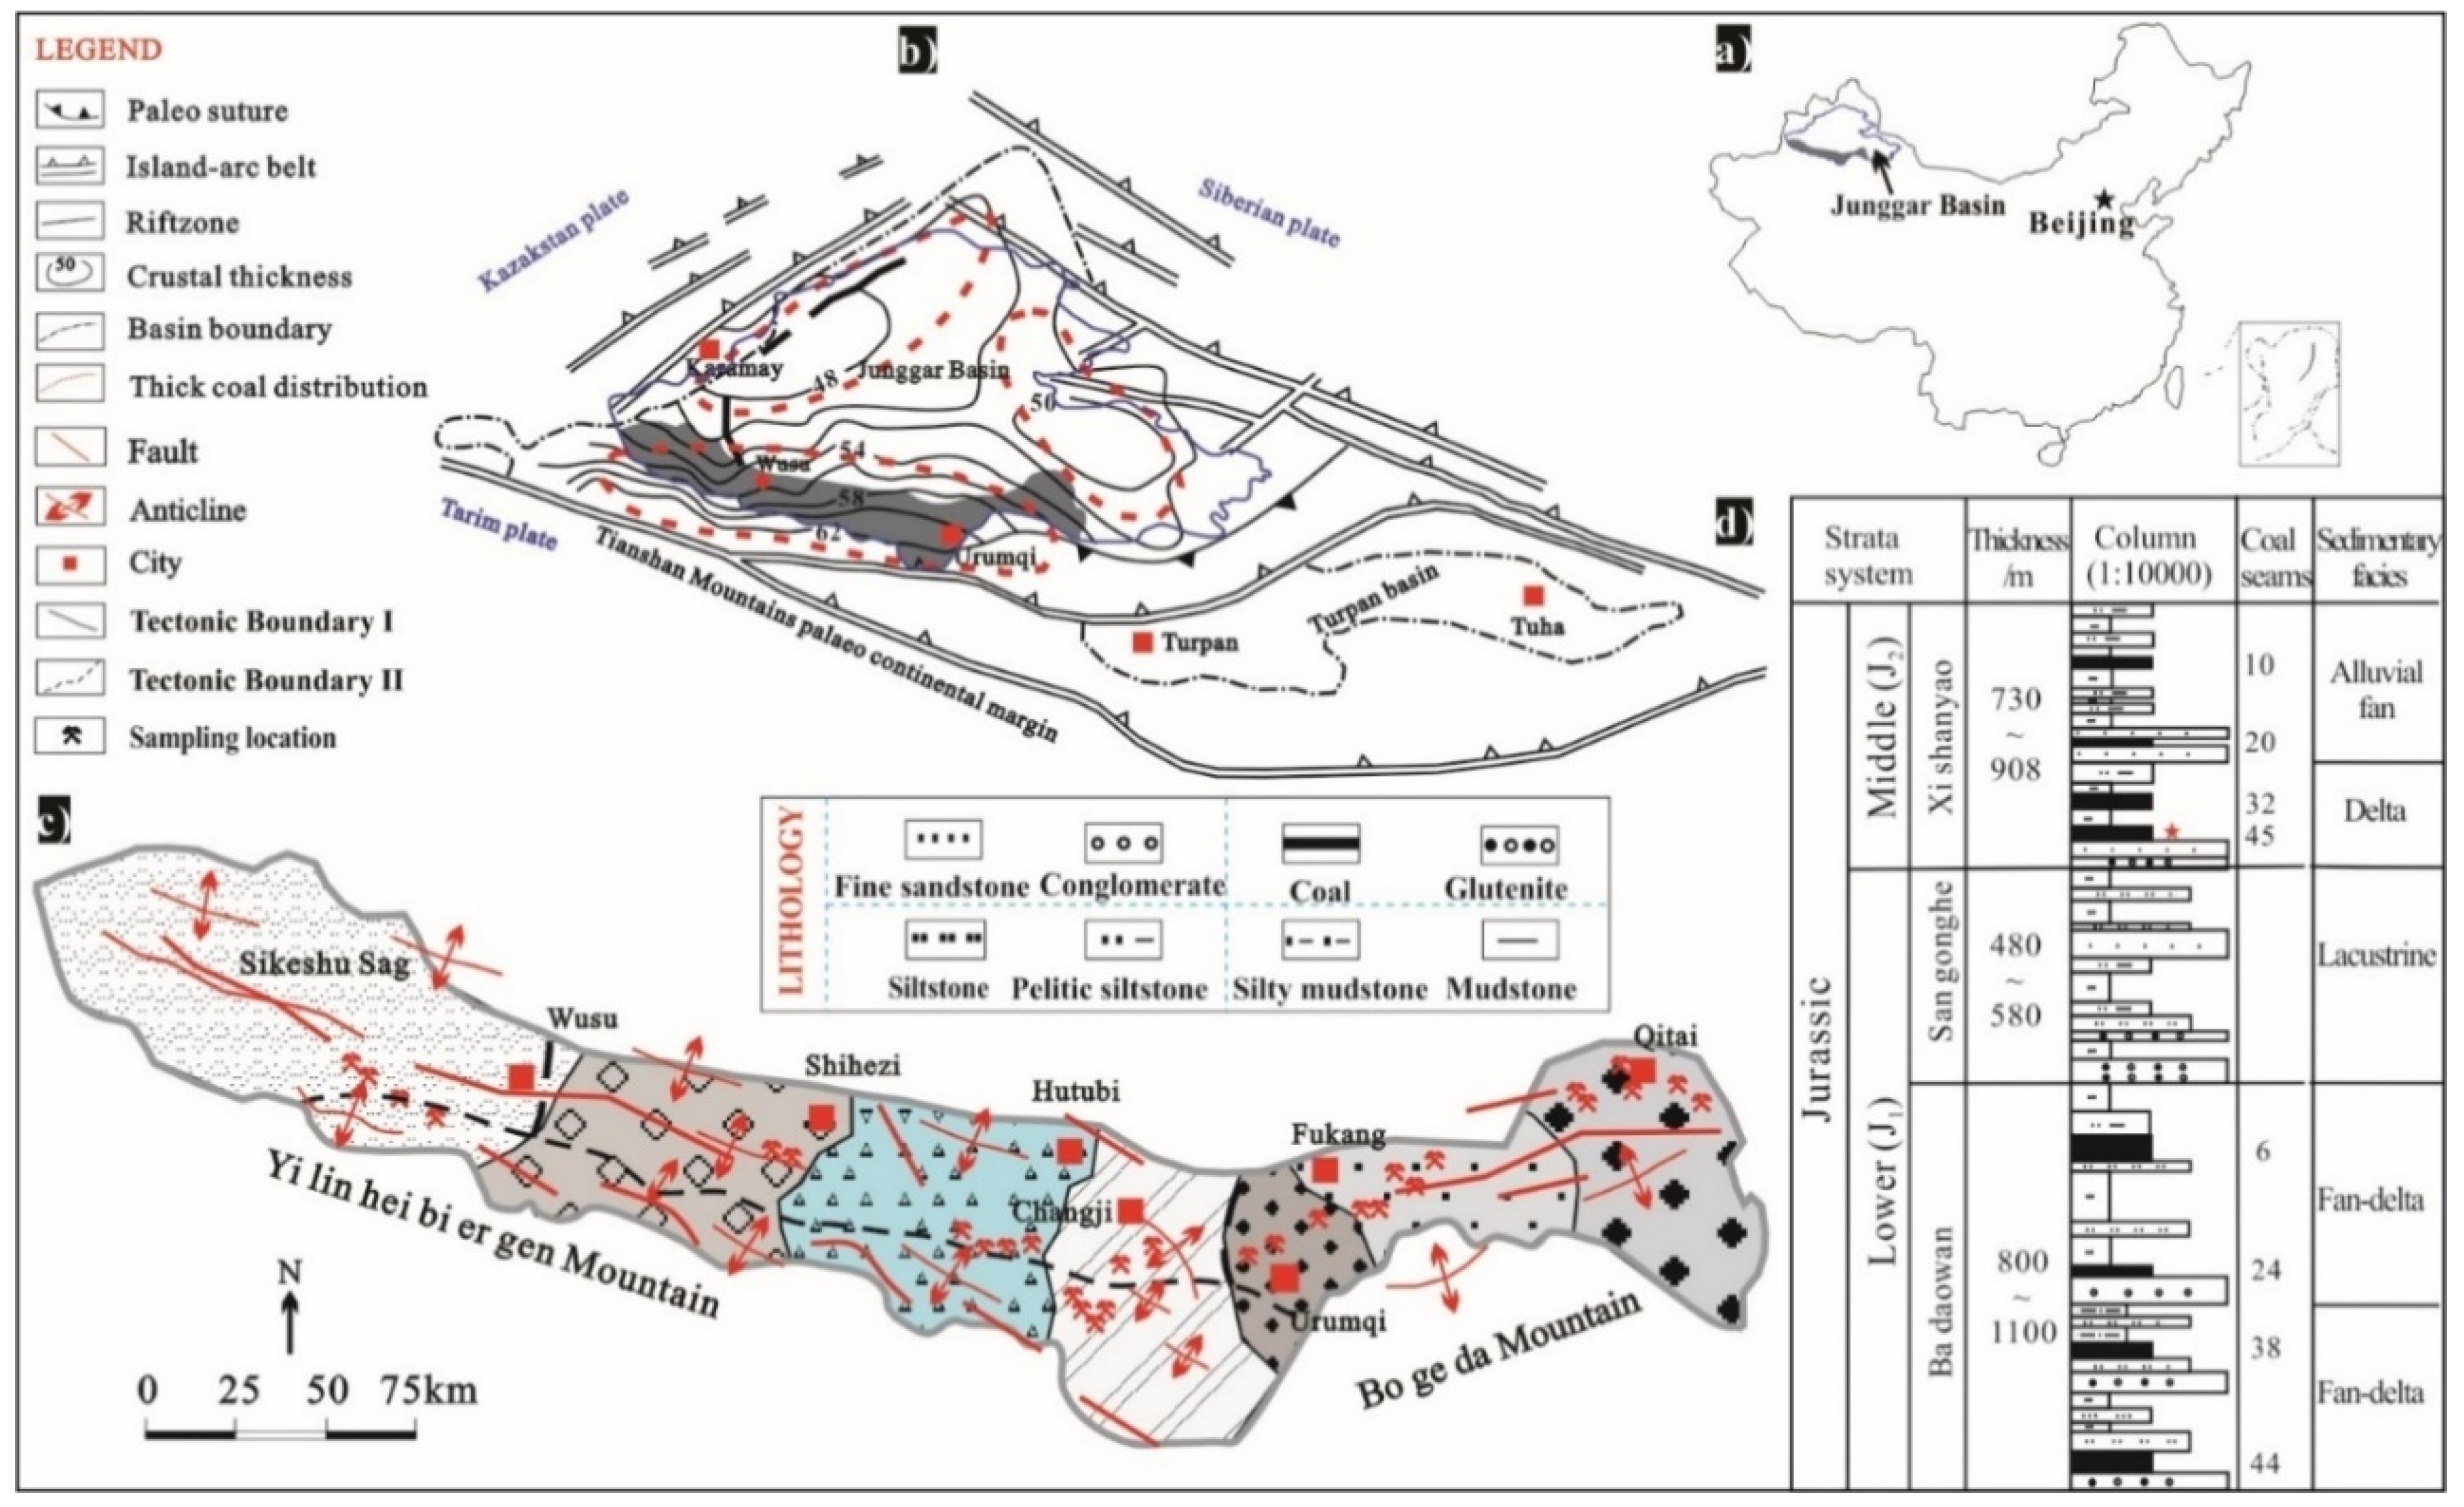
The Junggar coal basin, one of the largest coal-bearing basins in Xinjiang, NW China [28], is composed of coalfields in eastern Junggar, northern Junggar, and southern Junggar [26]. The SJC is a part of a foreland basin formed during the Jurassic age [29,30]. The SJC has an E–W trend, covering an area of approximately 6035.28 km2. It is ~500-km long and 40–90 km wide, and is a fault-fold-controlled coalfield in a depression in the southern margin of the Junggar Basin [31] (Figure 1a). The collision between the Tarim basin and Siberian plate during the Cenozoic and the following period was the cause of the second deformation phase in the Junggar basin [32] (Figure 1b), which led to deformation of both coal-bearing and cover formations. Thus, several anticlines and faults can be identified in the coalfield (Figure 1c).
The infill of the SJC began with conglomerates and sandstones that were deposited in a continental setup with the Upper Permian Xiachangfanggou group (P2cha) and the Middle-Upper Triassic Xiaoquangou group (T2-3xq) [26]. These sequences were overlain with alternations between conglomerate, grayish mudstone, fine-grained sandstone and siltstone, and thin coal seams that were deposited in fan-delta environments [33] (Figure 1d). This section contains the coal-bearing Badaowan formation (J1b) and the Sangonghe formation (J1s). In turn, this sequence was overlain by alternations of conglomerate, gray or grayish green fine-grain sandstone, siltstone, silty mudstones, mudstones, and coal seams that were deposited under lacustrine–deltaic conditions. This section is identified as containing the coal-bearing Xishanyao formation (J2x) and the Shishugou group (J2-3sh). The J2x and J1b formations host several coal layers and thick intercalations [26]. The thickness of individual coal seams within the J2x formation is variable and the cumulative thickness of coal beds can reach up to 66.3 m in the SJC [28]. The target coal seam—No. 45—includes a thickness of 4.2–9.5 m and is overlain with alternate layers of mudstone and siltstone [33]. Wang et al. [34] propose that the SJC coalbed methane (CBM) regions have large and thick coal seams with high gas content.
3. Materials and Methods
A total of 30 samples were collected in coalbed No.45 of the J2x formation from the seven target CBM blocks (including the Wusu, Sikeshu, Hutubi, Changji, Urumqi, Fukang, and Qitai blocks, from west to east, Figure 1c). The maximum reflectance of vitrinite (~60 point scanning) and coal mass composition analyses (500 test points) were measured on uniform polished sections of pulverized coals (0.5–1.0 mm) [35] using a Zeiss scope A1 microscope with an MPS 200 photo approach. These analyses were performed at the Coal Reservoir Laboratory of National Engineering Research Center of CBM Development and Utilization, Beijing, following standards International Organization for Standardization (ISO) 7404-3 [36] and ISO 7404-5 [37], respectively. The coal analysis was performed using incident light microscopy and oil immersion. Organic matter compositions were analyzed using reflection fluorescence with blue light excitation and reflection single polarization with oil immersion using the Nikon lv50 pol (Nikon, Tokyo, Japan) and Opton & Germany microscopes, respectively. Scanning electron microscopy (SEM) with a Quanta 200 rig was performed at the China University of Geosciences, Beijing. Mercury intrusion porosimetry (MIP) was performed with an Autopore 9520 Instrument (Micromeritics, Norcross, GA, US). The experimental and data processing procedures are the same as in previous research [31]. Nuclear magnetic resonance (NMR) measurements were conducted with a Reccore-04 NMR analysis meter (Niumag analytical Instrument, Suzhou, China), a Supra 22k centrifuge (BP Integrated Technologies Inc, Calamba, Philippines), and a DJ-V220A electronic scale (Electrotherm, Shanghai, China) at the Research Institute of Petroleum Exploration and Development, with the same experimental procedure as stated in previous studies [38]. The MIP, NMR, and SEM analyses were systematically determined to investigate pore and fissure characteristics of the SJC coal samples.
4. Results and Discussion
4.1. Maceral Characteristics
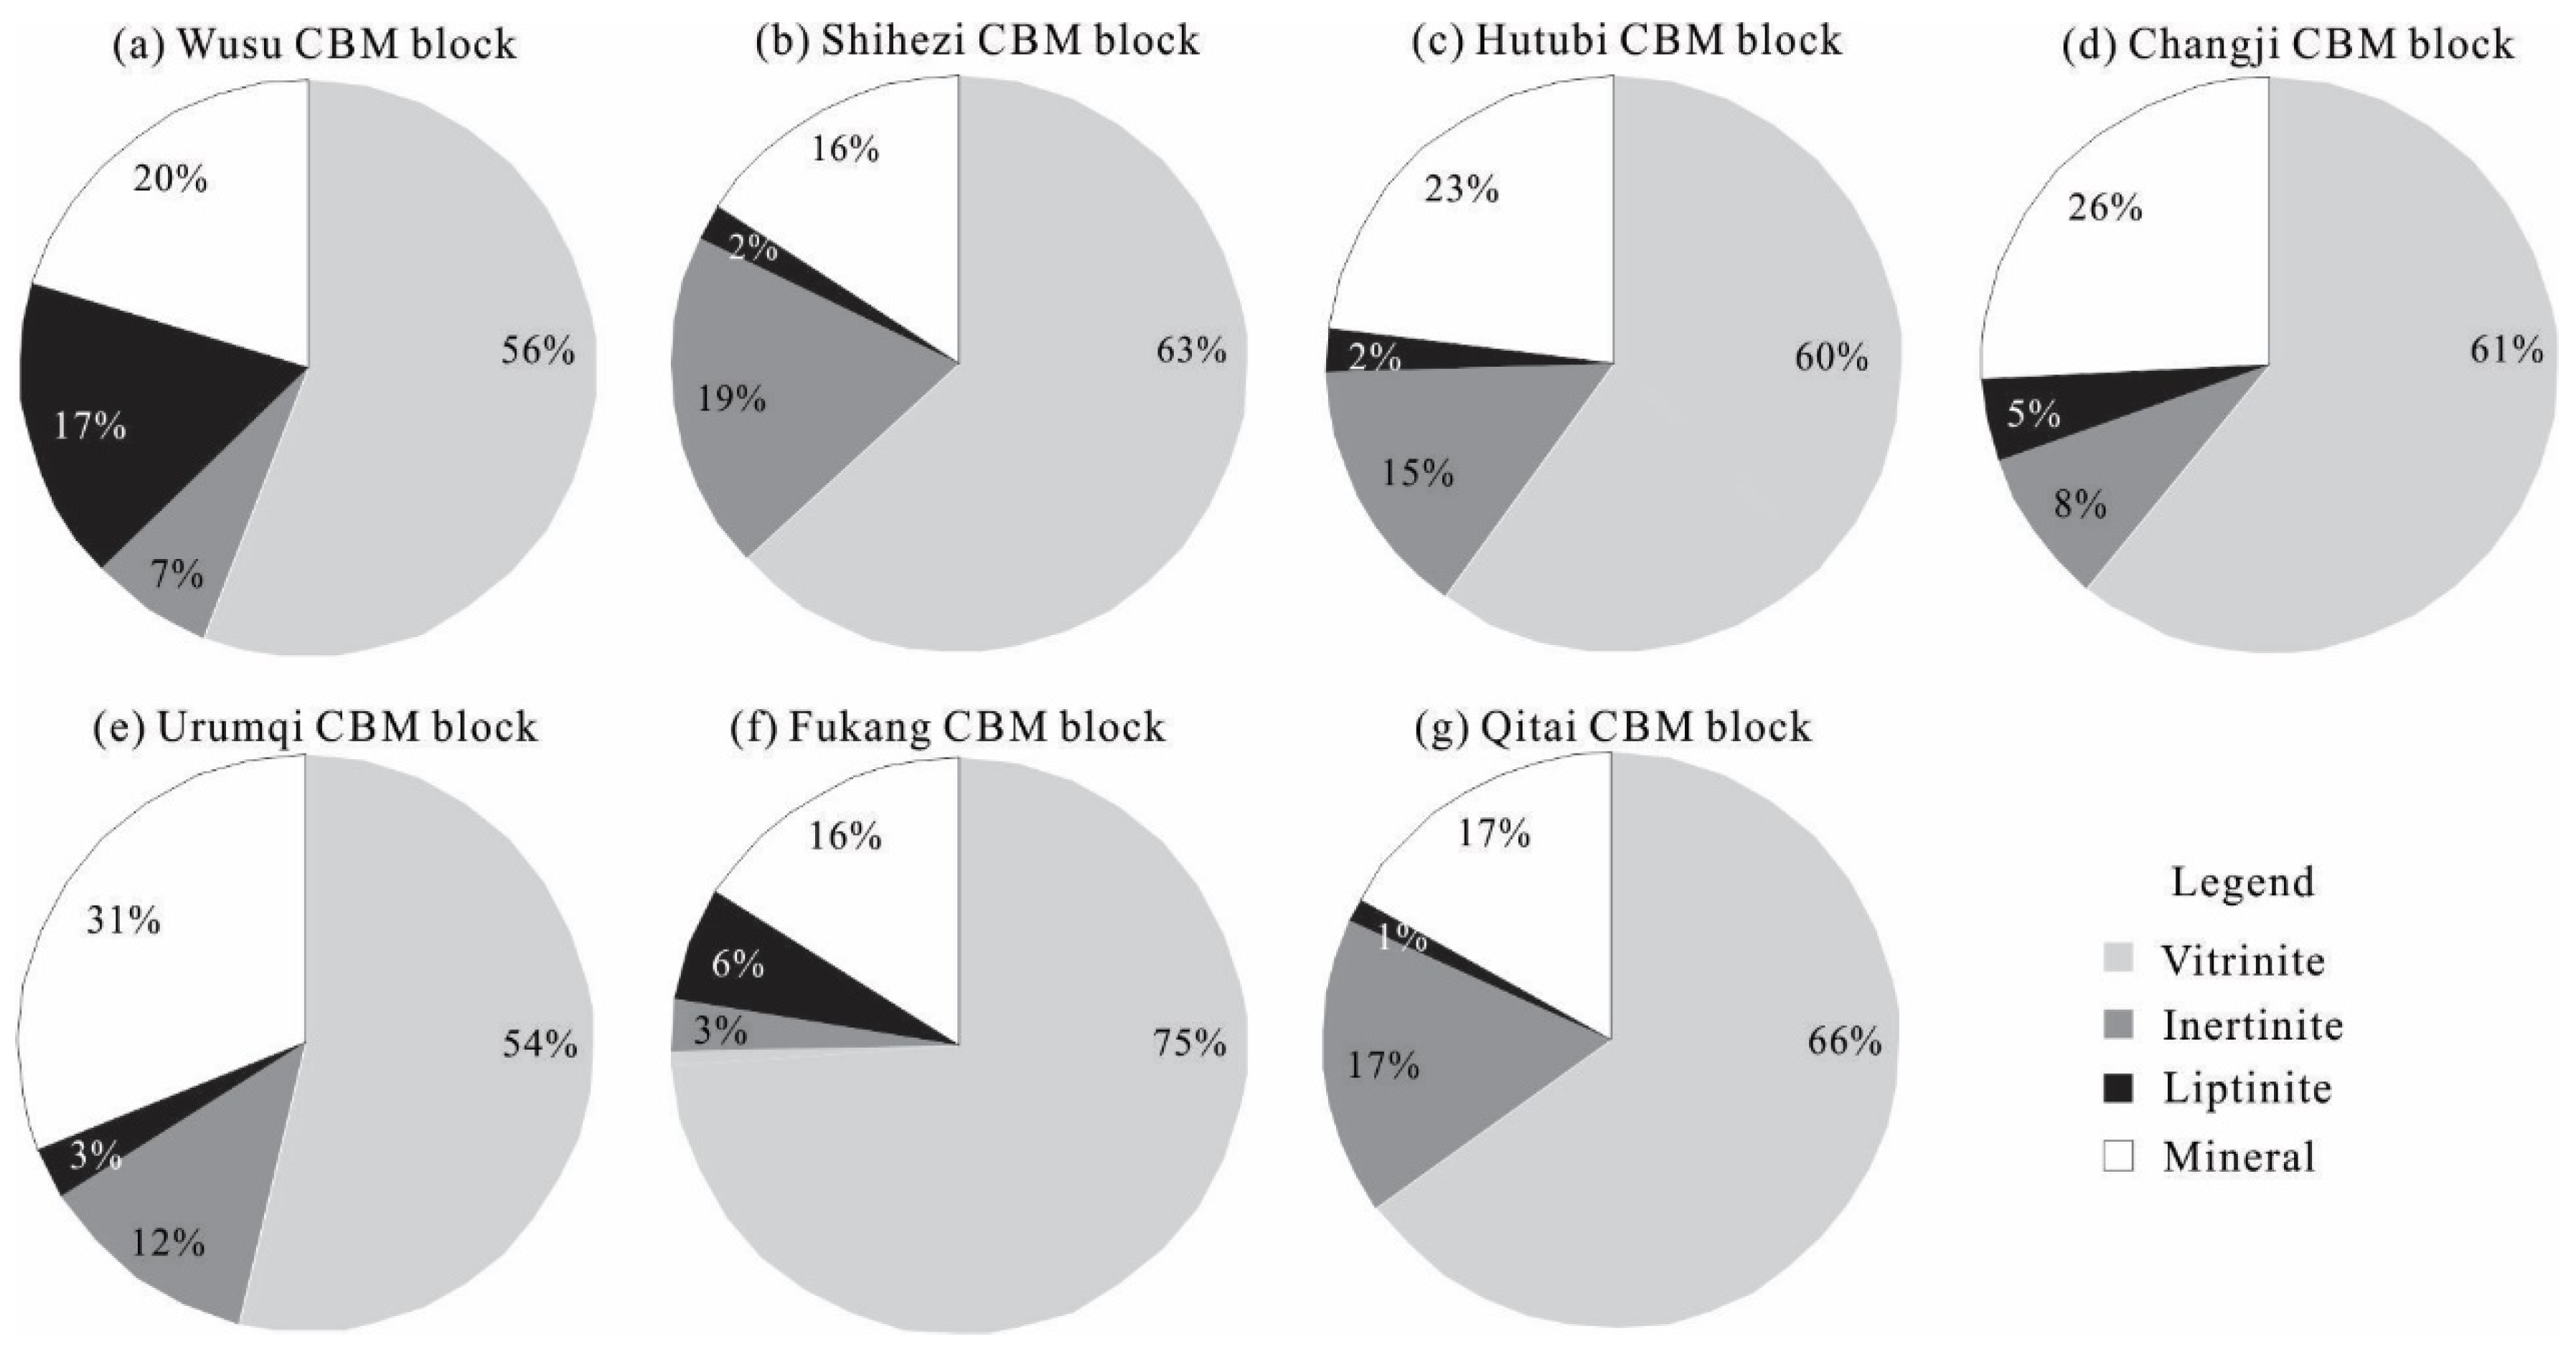
Samples had variable maceral groups (Table 1) and a maximum reflectance of vitrinite (VRmax) of 0.32–0.65%. These samples were considered to be of low-rank coals (Table 2). The maximum reflectance values of vitrinite indicate a lignite to subbituminous coal in rank. Figure 2 shows coal mass compositions (maceral groups and mineral matter) of seven CBM blocks from the SJC, which are summarized in detail in Table 2. For example, the coal compositions of the samples from the Wusu CBM block yield average percentages of 56 vol % vitrinite, 17 vol % liptinite, 7 vol % inertinite, and 20 vol % mineral matter (Figure 2a). The coal compositions of the samples from Qitai CBM block are as follows: 65 vol % vitrinite, 1 vol % liptinite, 17 vol % inertinite, and 17 vol % mineral matter (Figure 2g). The coals are generally characterized by a variable content of vitrinite (56–75 vol %, mineral matter-free basis (mmf)), followed by minerals (16–31 vol %), inertinite (7–19 vol %), and liptinite (1–17 vol %) for each block (Figure 2a–g). Due to the large variation of macerals in one CBM block, comparisons are made by maceral group and mineral matter instead of spatial location. Accordingly, we present three maceral types as representative sub-macerals in low-rank coals from the SJC.
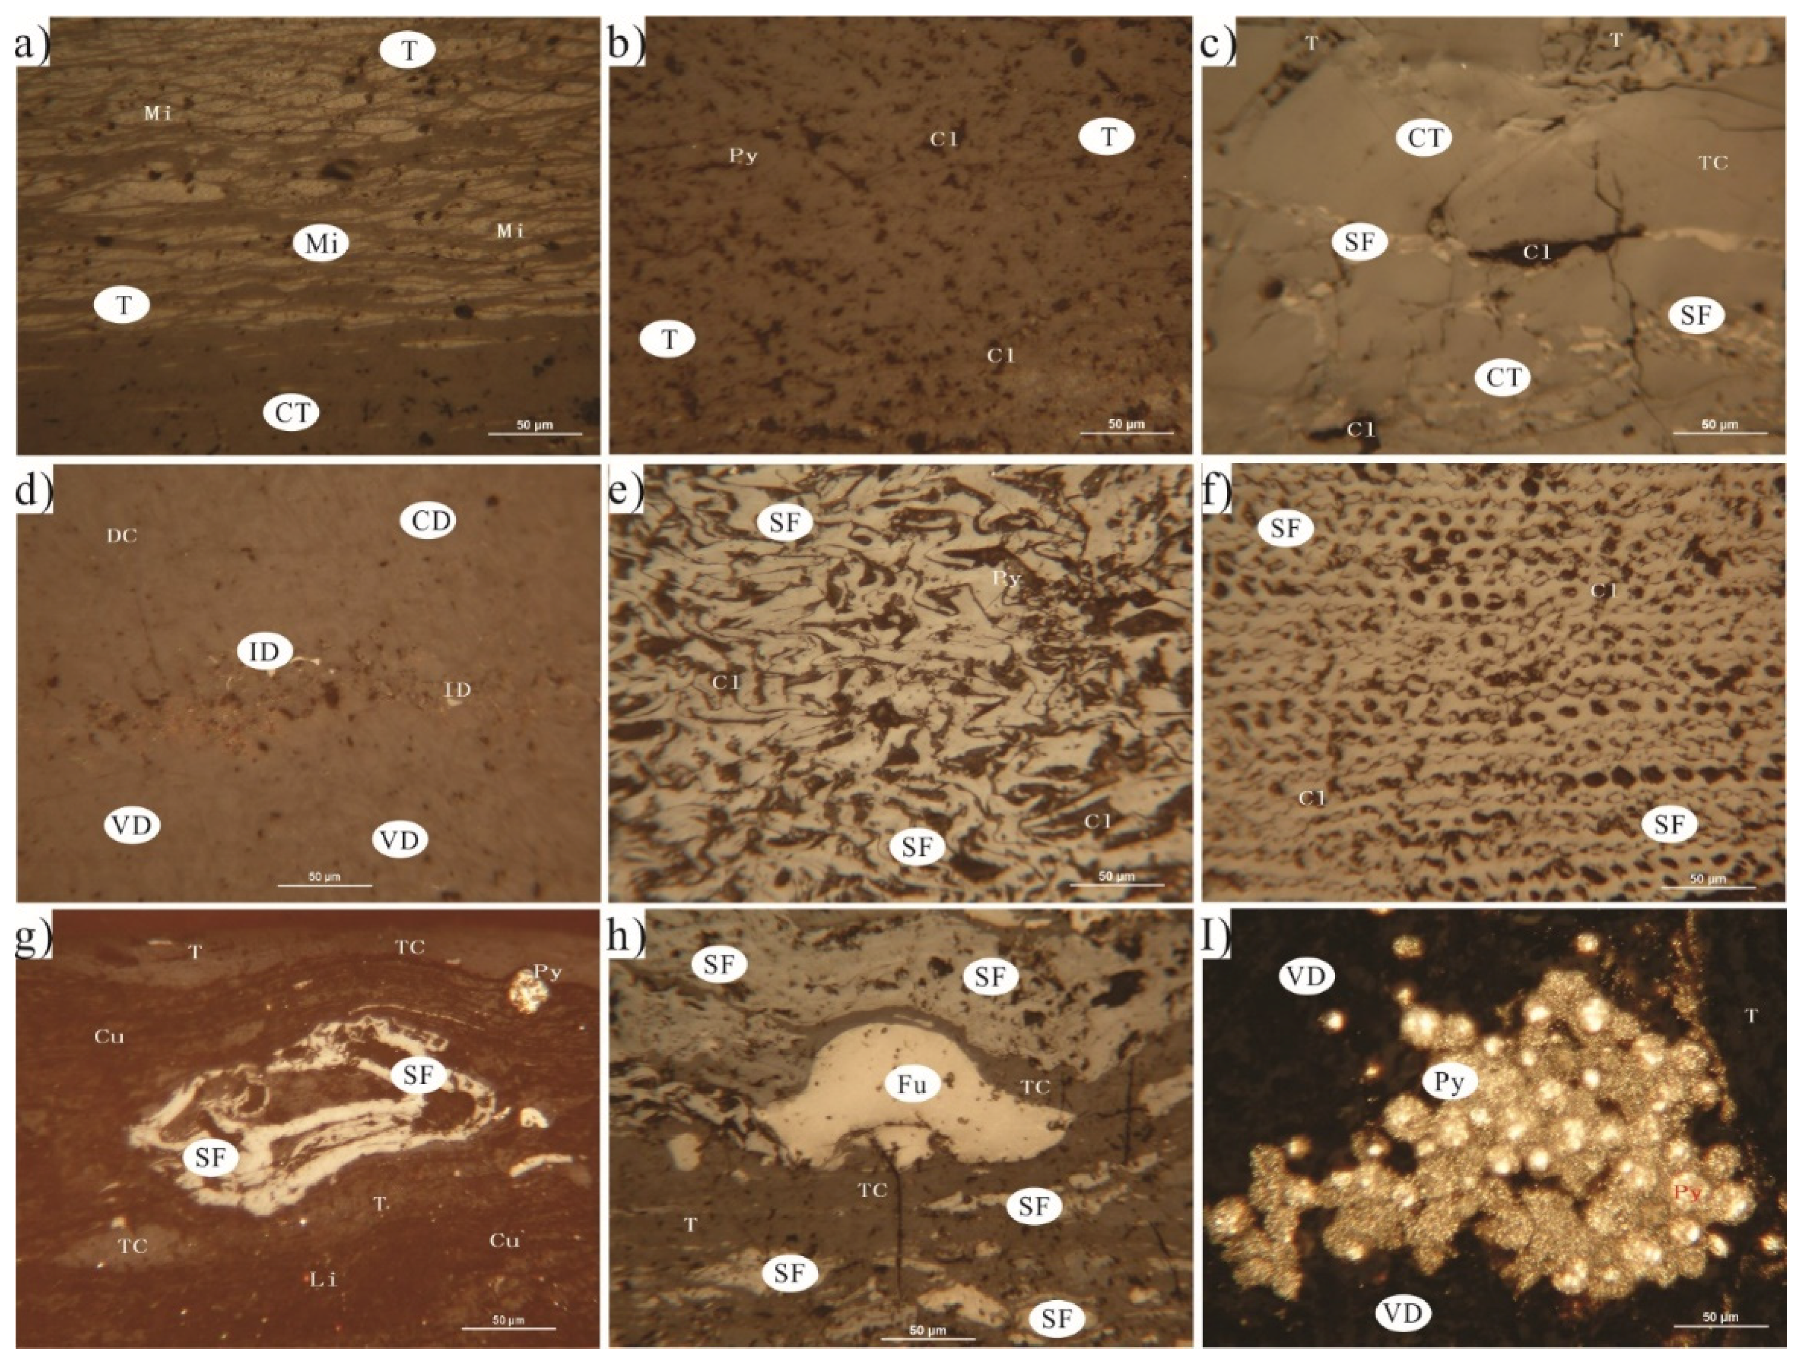
Vitrinite group: The vitrinite group maceral (avg. 62.1 vol %, Table 2) dominates in the selected seven CBM blocks in comparison to the other maceral groups, inertinite and liptinite. This group is characterized by light-grey color when compared with the darker liptinite and lighter inertinite groups [39]. Of the vitrinite group in the seven coal samples analyzed, telinite (avg. 19 vol %) and collotelinite (avg. 23.2 vol %) are the dominant macerals, followed by vitrodetrinite (avg. 19.7 vol %), and collodetrinite (avg. 6 vol %), with only minor amounts of corpocollinite (avg. 2.9 vol %) (Table 1). Figure 3 and Figure 4 exhibit the characteristics of vitrinite, inertinite, and liptinite groups under the oil immersion-reflected light and fluorescence-inducing blue light. Telinite, collotelinite, collodetrinite, and vitrodetrinite are constituted by vascular land plant remains such as cell walls, cell structures, cell fillings, tissues, fragments, and amorphous gel (Figure 3a–d). Telinite and collotelinite are distributed in a parallel manner (Figure 3a). Micrinite fills in the telinite cellular cavity (Figure 3a). Woody structures are preserved and the cell wall is highly swollen in the lentoid telinite (Figure 3b). Collotelinite, with uniform structures, is broken in bulk (Figure 3c). Vitrodetrinite is tightly packed with an epigranular distribution. Collodetrinite and a little inertodetrinite appear between the granules (Figure 3d).
Inertinite group: In the analyzed coals, the macerals of the inertinite group are recognized through their unique higher reflectance in white light and the paucity of fluorescence in ultraviolet light in comparison to the vitrinite and/or liptinite [40]. Semifusinite (avg. 17 vol %) is the most dominant maceral in this group (Table 1), followed by fusinite, micrinite, and inertodetrinite. Micrinite was occasionally found under the microscope. The inertinite group of macerals is composed primarily of charred remains originating from peat fires and bacterial surface oxidation [41]. Fusinite, semifusinite, and inertodetrinite arise from highly oxidized wood, less-oxidized wood, and oxidized fragments of inertinites, respectively (Figure 3e–h). Inertodetrinite is generated in a limnotelmatic environment or by a fluctuating water table in terrestrial facies. It is enriched by aerobic decay at the top of domed peat. Semifusinite has been found to be diverse, and can be found for example in lentoid (Figure 3e,f) and ring (Figure 3g) forms. In the lentoid semifusinite, the leaf structure is severely damaged, and cell wall is rod-like in sample UT1 (Figure 3e). In contrast, the woody structure is preserved and the cell wall is mildly swollen in sample QH2 (Figure 3f). Semifusinite often shows irregular anisotropy and appears during the peat stage by weak humification, dehydration, and redox processes [41]. It may lose volatiles and generate fissures. Extensive fusinite and semifusinite can appear between telinite and collotelinite (Figure 3h). Fusinite appears in well-preserved tissues with the aid of fungi and bacteria and presents swollen cell walls [41].
Liptinite group: This group is defined by a darker color in comparison to other maceral groups and multifarious fluorescence in ultraviolet light. In the studied Middle Jurassic coals, the most predominant submacerals are structured liptinite macerals, including cutinite (avg. 5.1 vol %), sporinite, resinite, and liptodetrinite. However, unstructured liptinites (i.e., fluorinite) were occasionally found under the microscope (Table 1).
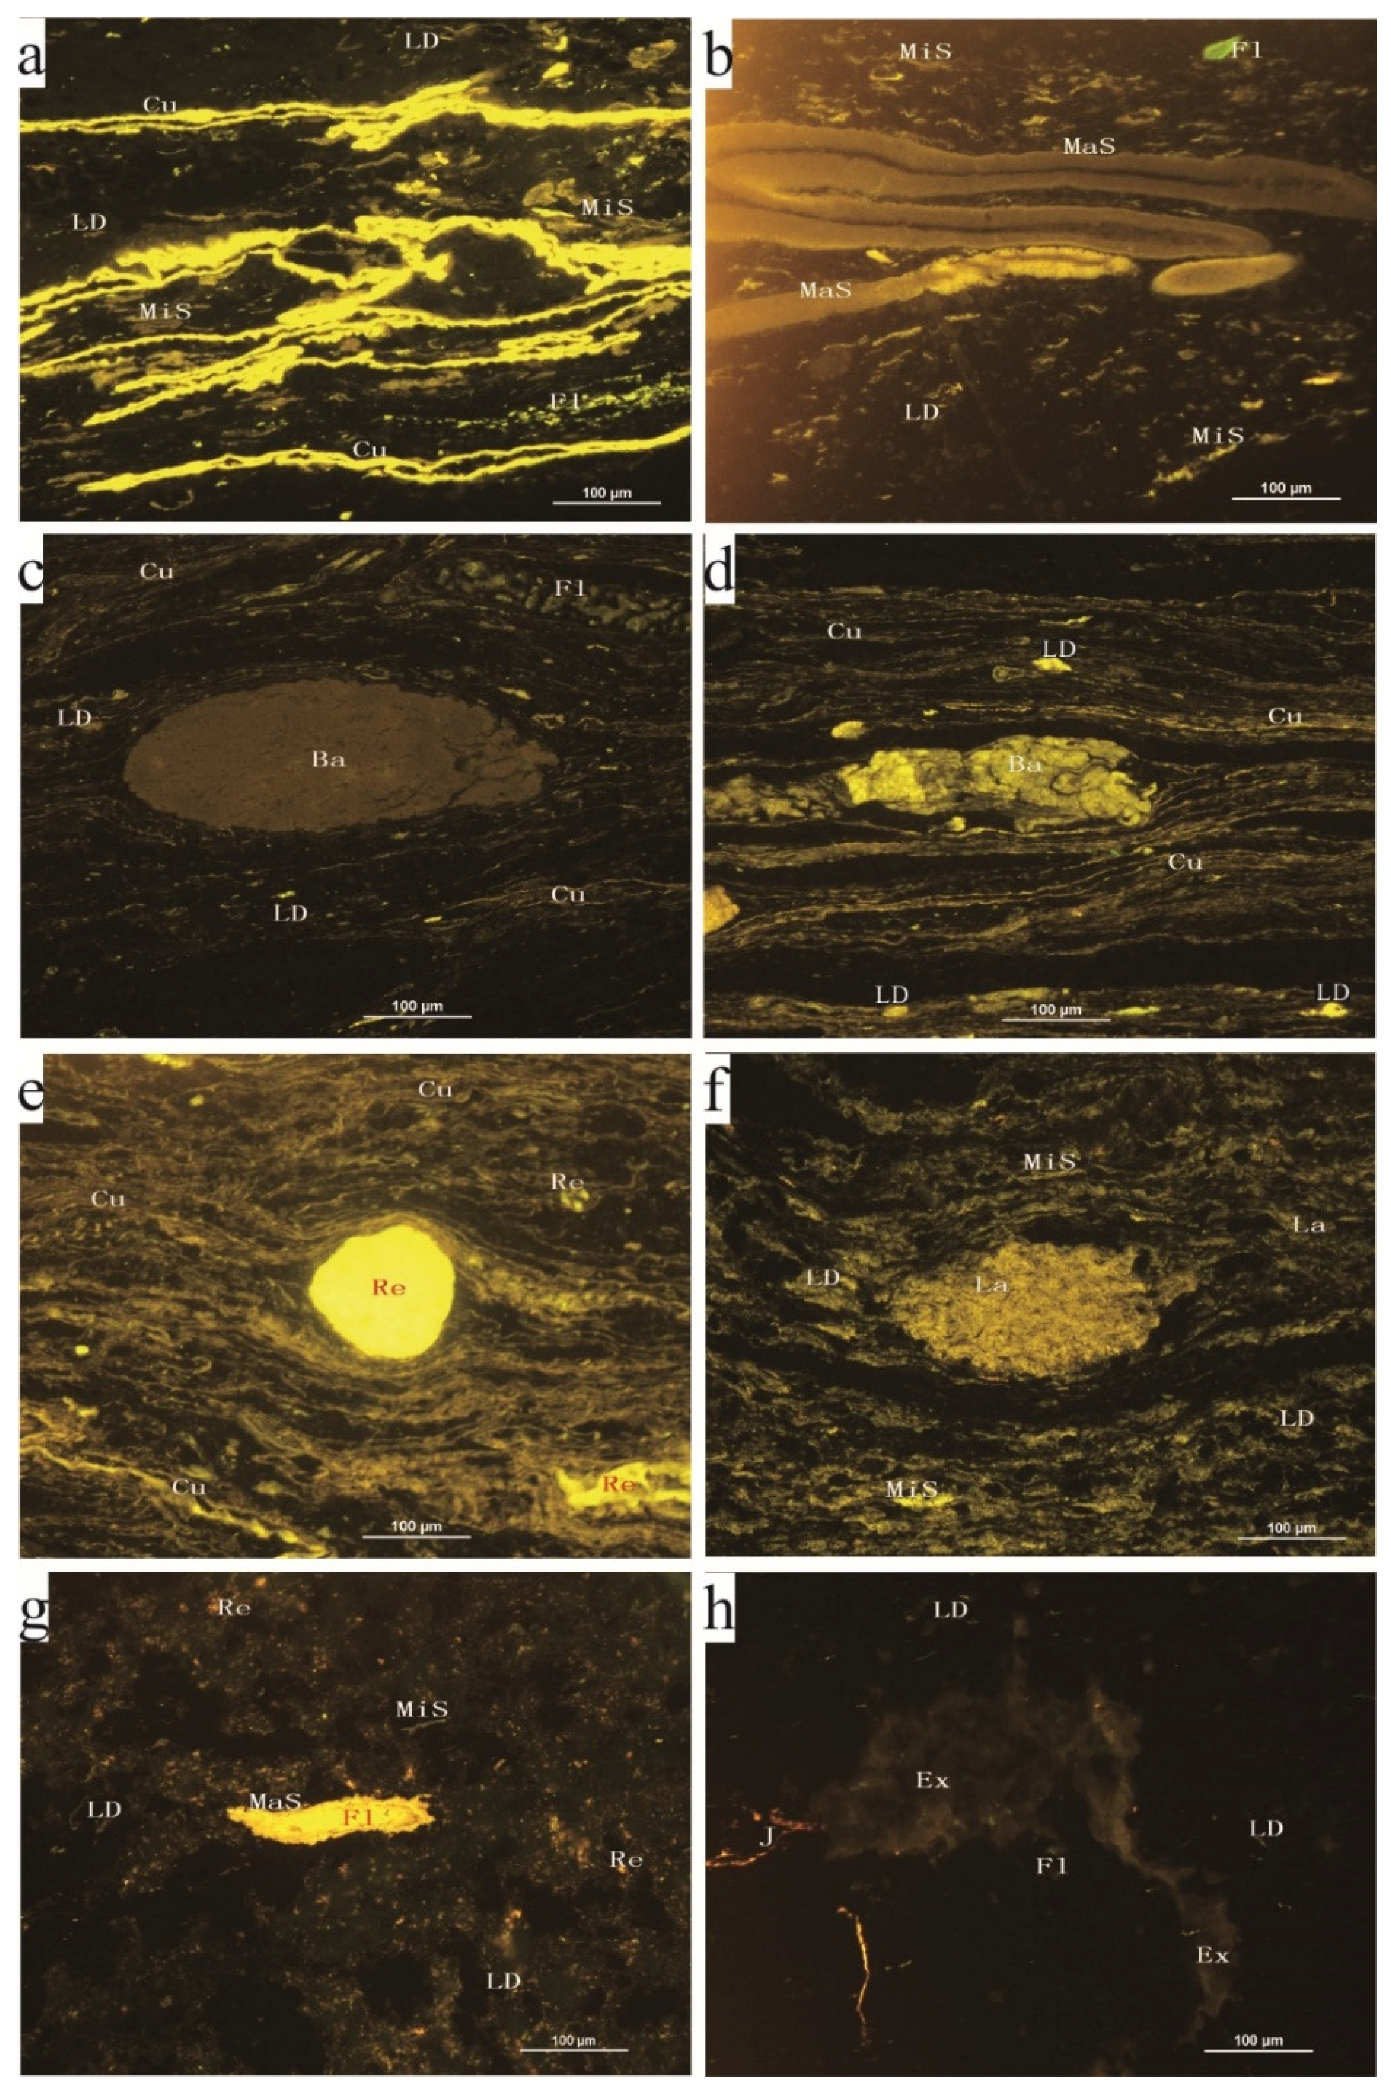
The liptinite group of macerals are made up of variable plant and animal remains originating from algae, bacteria, cuticles, spores, pollen, plant resins, waxes, chlorophyll, and detritus (Figure 4a–h). It plays a significant role in the evaluation of coal facies and stratigraphic research [42,43]. Cutinite has a parallel distribution within collinite (Figure 4a,e) and is yellow (blue-light excitation). It appears in the form of narrow bands, one edge of which is serrated, and the cellulose walls of the epidermis are observed (Figure 4a). Cutinite may assist in the reconstruction of plant communities of brown-coal paleo mires [44]. Macrosporinite, microsporophyte, and liptodetrinite are distributed in parallel, as shown in Figure 4b. Sporines (macrosporinite and microsporophyte) are derived through dehydration and dehydrogenation of recent sporopollenin [43], which in turn is composed of elemental carbon, hydrogen, and oxygen. Moreover, sporines are of significance as coalfacies indicators, stratigraphic studies and seam correlation [42,43]. Barkinite is generally distributed with lenticel. Its length is ~400 μm and its width is ~125 μm (Figure 4c). It has a rich aliphatic structure concentration, although it is dominated by an aromatic structure [45]. Barkinite has an unusual liptinitic component apparently found only in Chinese coal and has not been accepted by the International Committee for Coal and Organic Petrology (ICCP) [46]. Fluorinite occurs in a heavily concentrated manner (Figure 4c) and fills the cellular cavities (Figure 4a,g). It shows a greenish-yellow fluorescence, while liptodetrinite appears in a promiscuous structure (Figure 4c). Fluorinite is regarded as a variety of resinite [47]. Resinite has a round structure and is found in cross sections with a diameter of ~100 μm; part of it observes irregular graininess (Figure 4e). Resinite can contribute considerably to liquid hydrocarbon production in relatively early stages of diagenesis and can be useful in seam correlation [43]. Lamalginite and microsporophyte have a parallel distribution within collinite. The former presents an elliptical structure with a length of ~220 μm and width of ~120 μm (Figure 4f). Lamalginite arises from planktonic algae and is a prominent component of petroleum source rocks and retort yields of shale oils [48]. Exsudatinite is distributed irregularly, and is rarely found (Figure 4h). Exsudatinite is generated during coalification and intrudes into fissures and other cavities [47].
Mineral matter: The minerals are recognized by their black appearance with no reflected white light (with the exception of quartz). The mineral matter is mostly observed as cellula/cavity fillings of vitrinite, liptinite, and inertinite bands [3]. Each CBM block presents ~20 vol % of mineral matter content, with significant amounts of clay mineral (5.3–38.2 vol %, avg. of 19.9 vol %) that can be determined under a coal-petrography microscope (Figure 2a–g).
4.2. Characteristics of Coal Facies
4.2.1. Coal Facies Indices
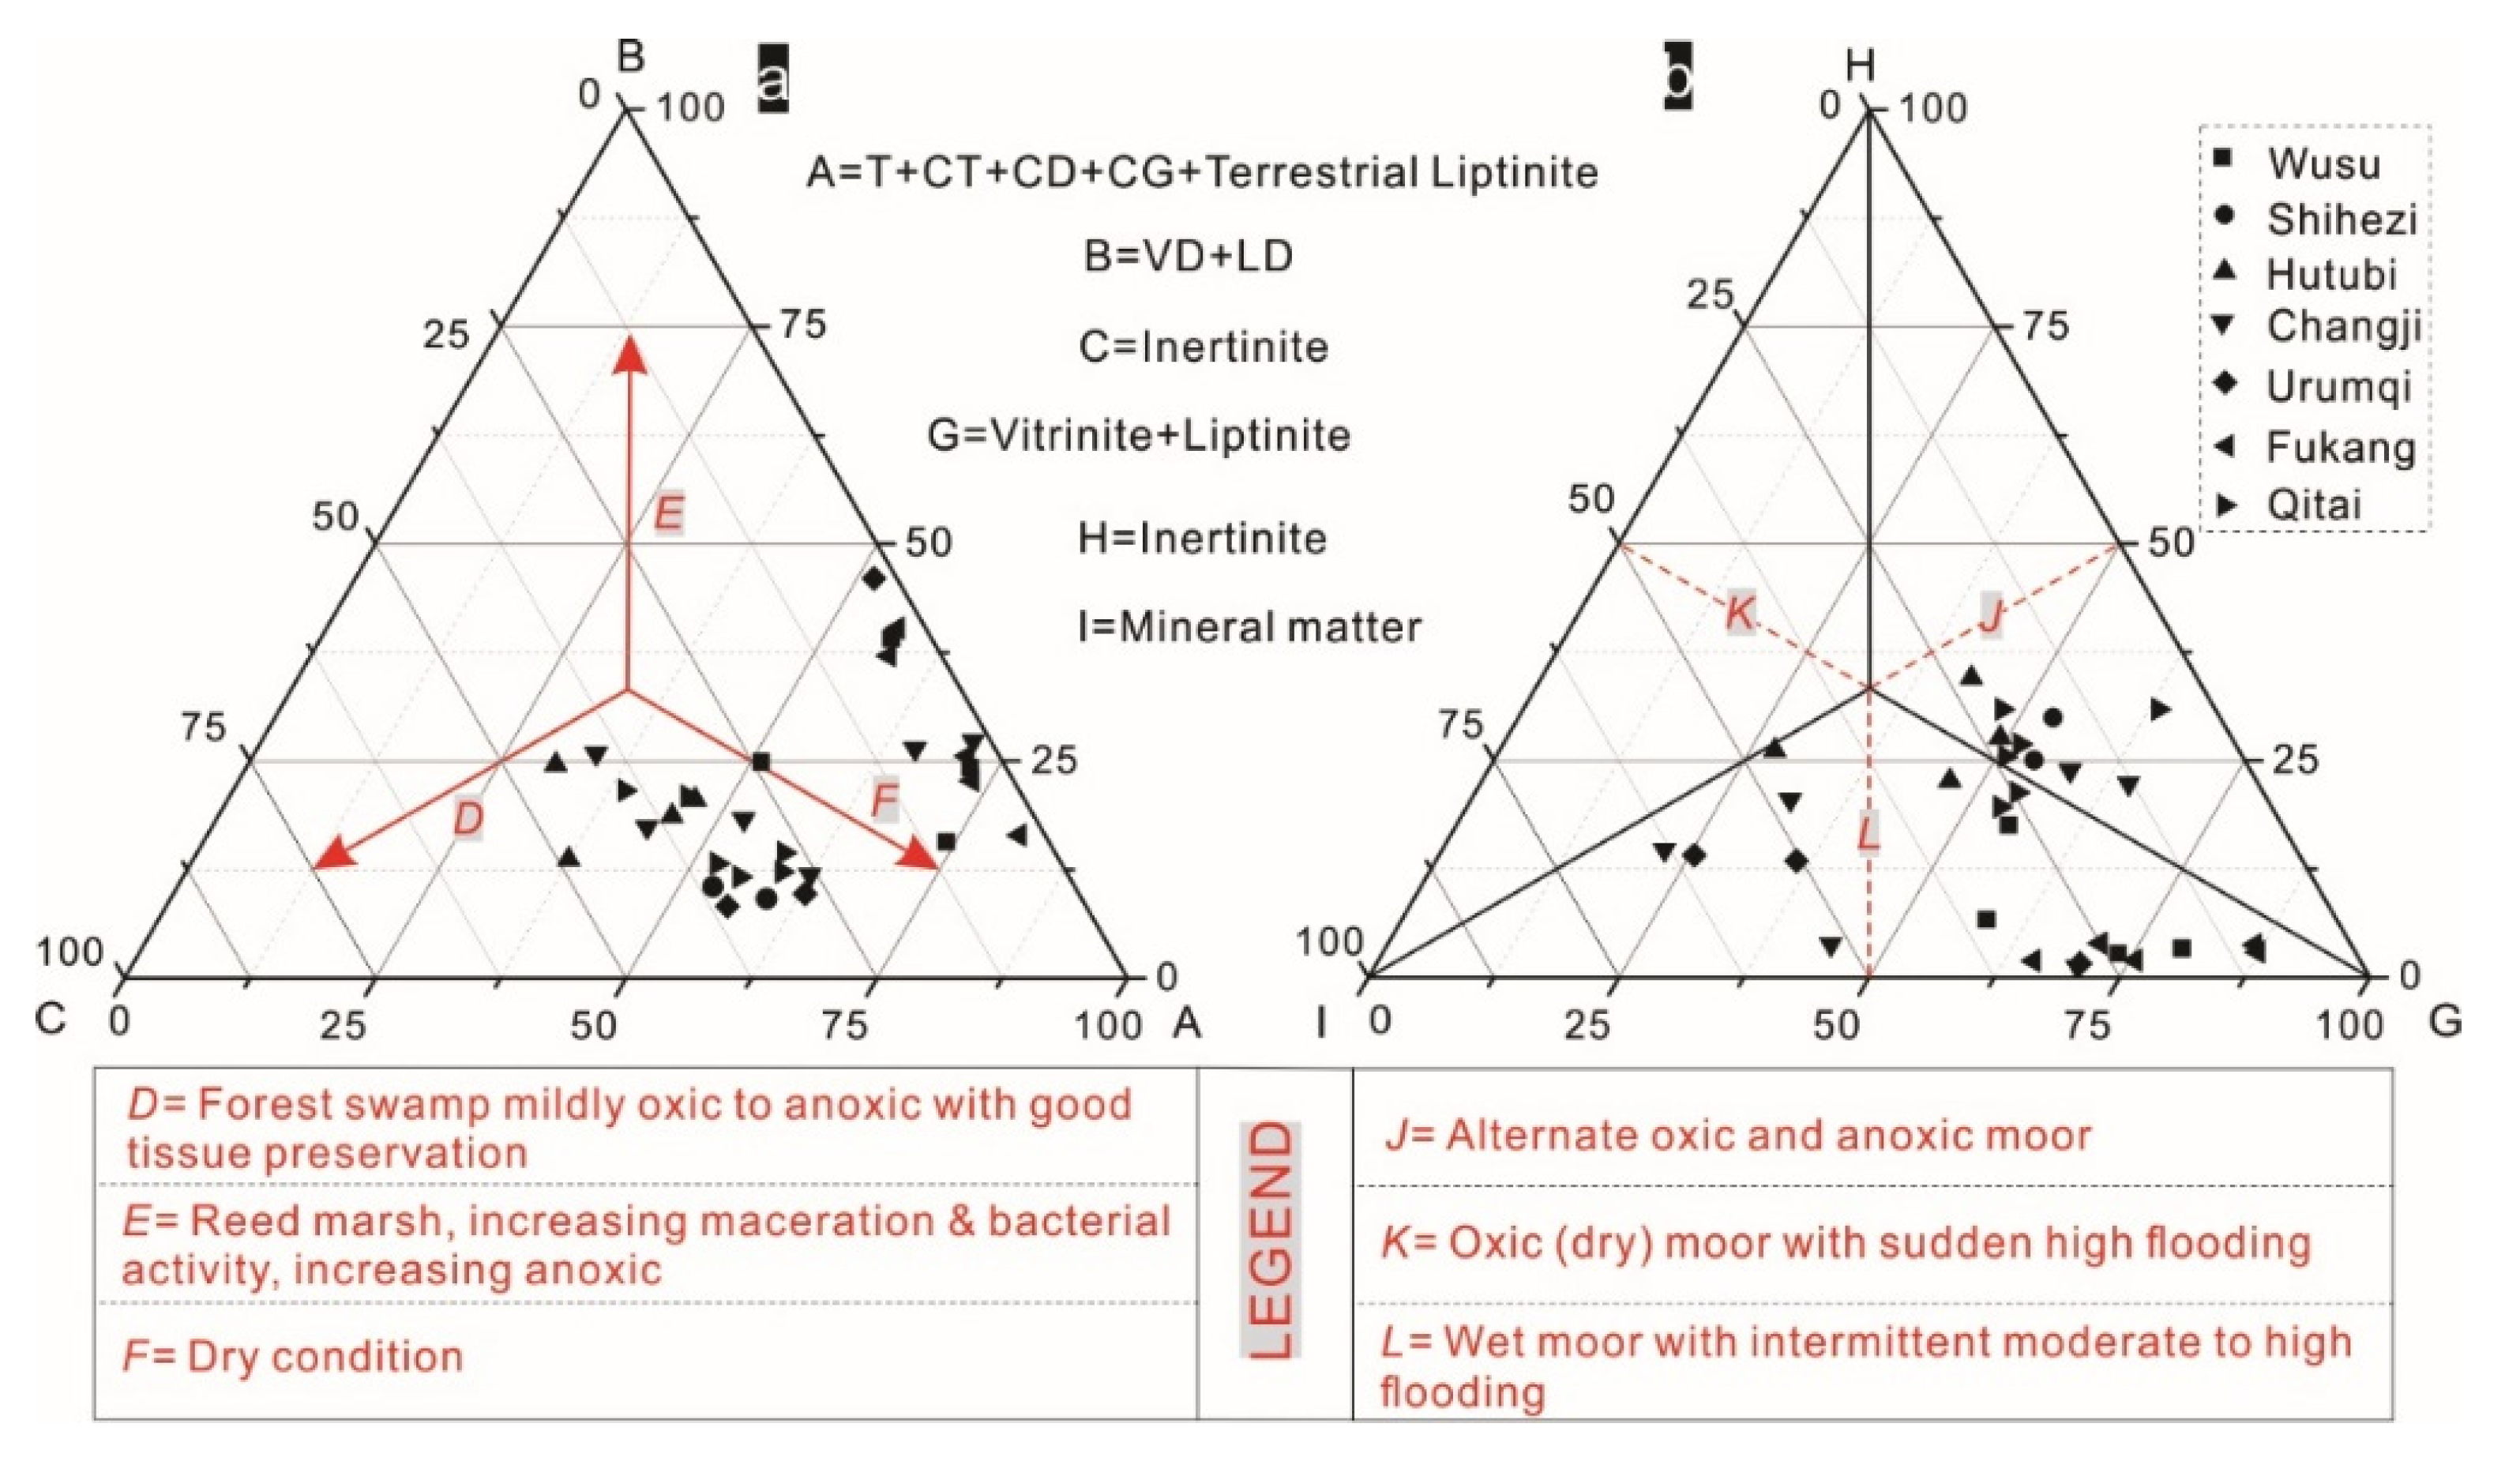
Based on the above studies of various maceral groups, we modified the Mukhopadhyay (1986) facies model [19] and established a ternary diagram (Figure 5a). The selected Middle Jurassic coals in coal seam No. 45 from the SJC are plotted and analyzed utilizing this model, which determines the predominant vegetation types in the paleo-mire and the oxic or anoxic conditions during peat deposition. The coals in the SJC generally stem from forest swamp of slightly oxic–anoxic conditions, with good tissue preservation. Previous researchers (i.e., [49,50]) proposed a triangular diagram that can illustrate the environmental reconstruction based on maceral and mineral assemblages. The mineral matter contents are significant for explaining the extent of wet and dry conditions and to index the rate of subsidence [49]. The SJC samples are subjected to two moors (wet or dry) (Figure 5b). Two-thirds coals fall within a wet moor with intermittent moderate to high flooding. One-third of the coals represent an oxic (dry) moor with sudden high flooding. These results may be attributed to fluctuating water cover in the SJC.
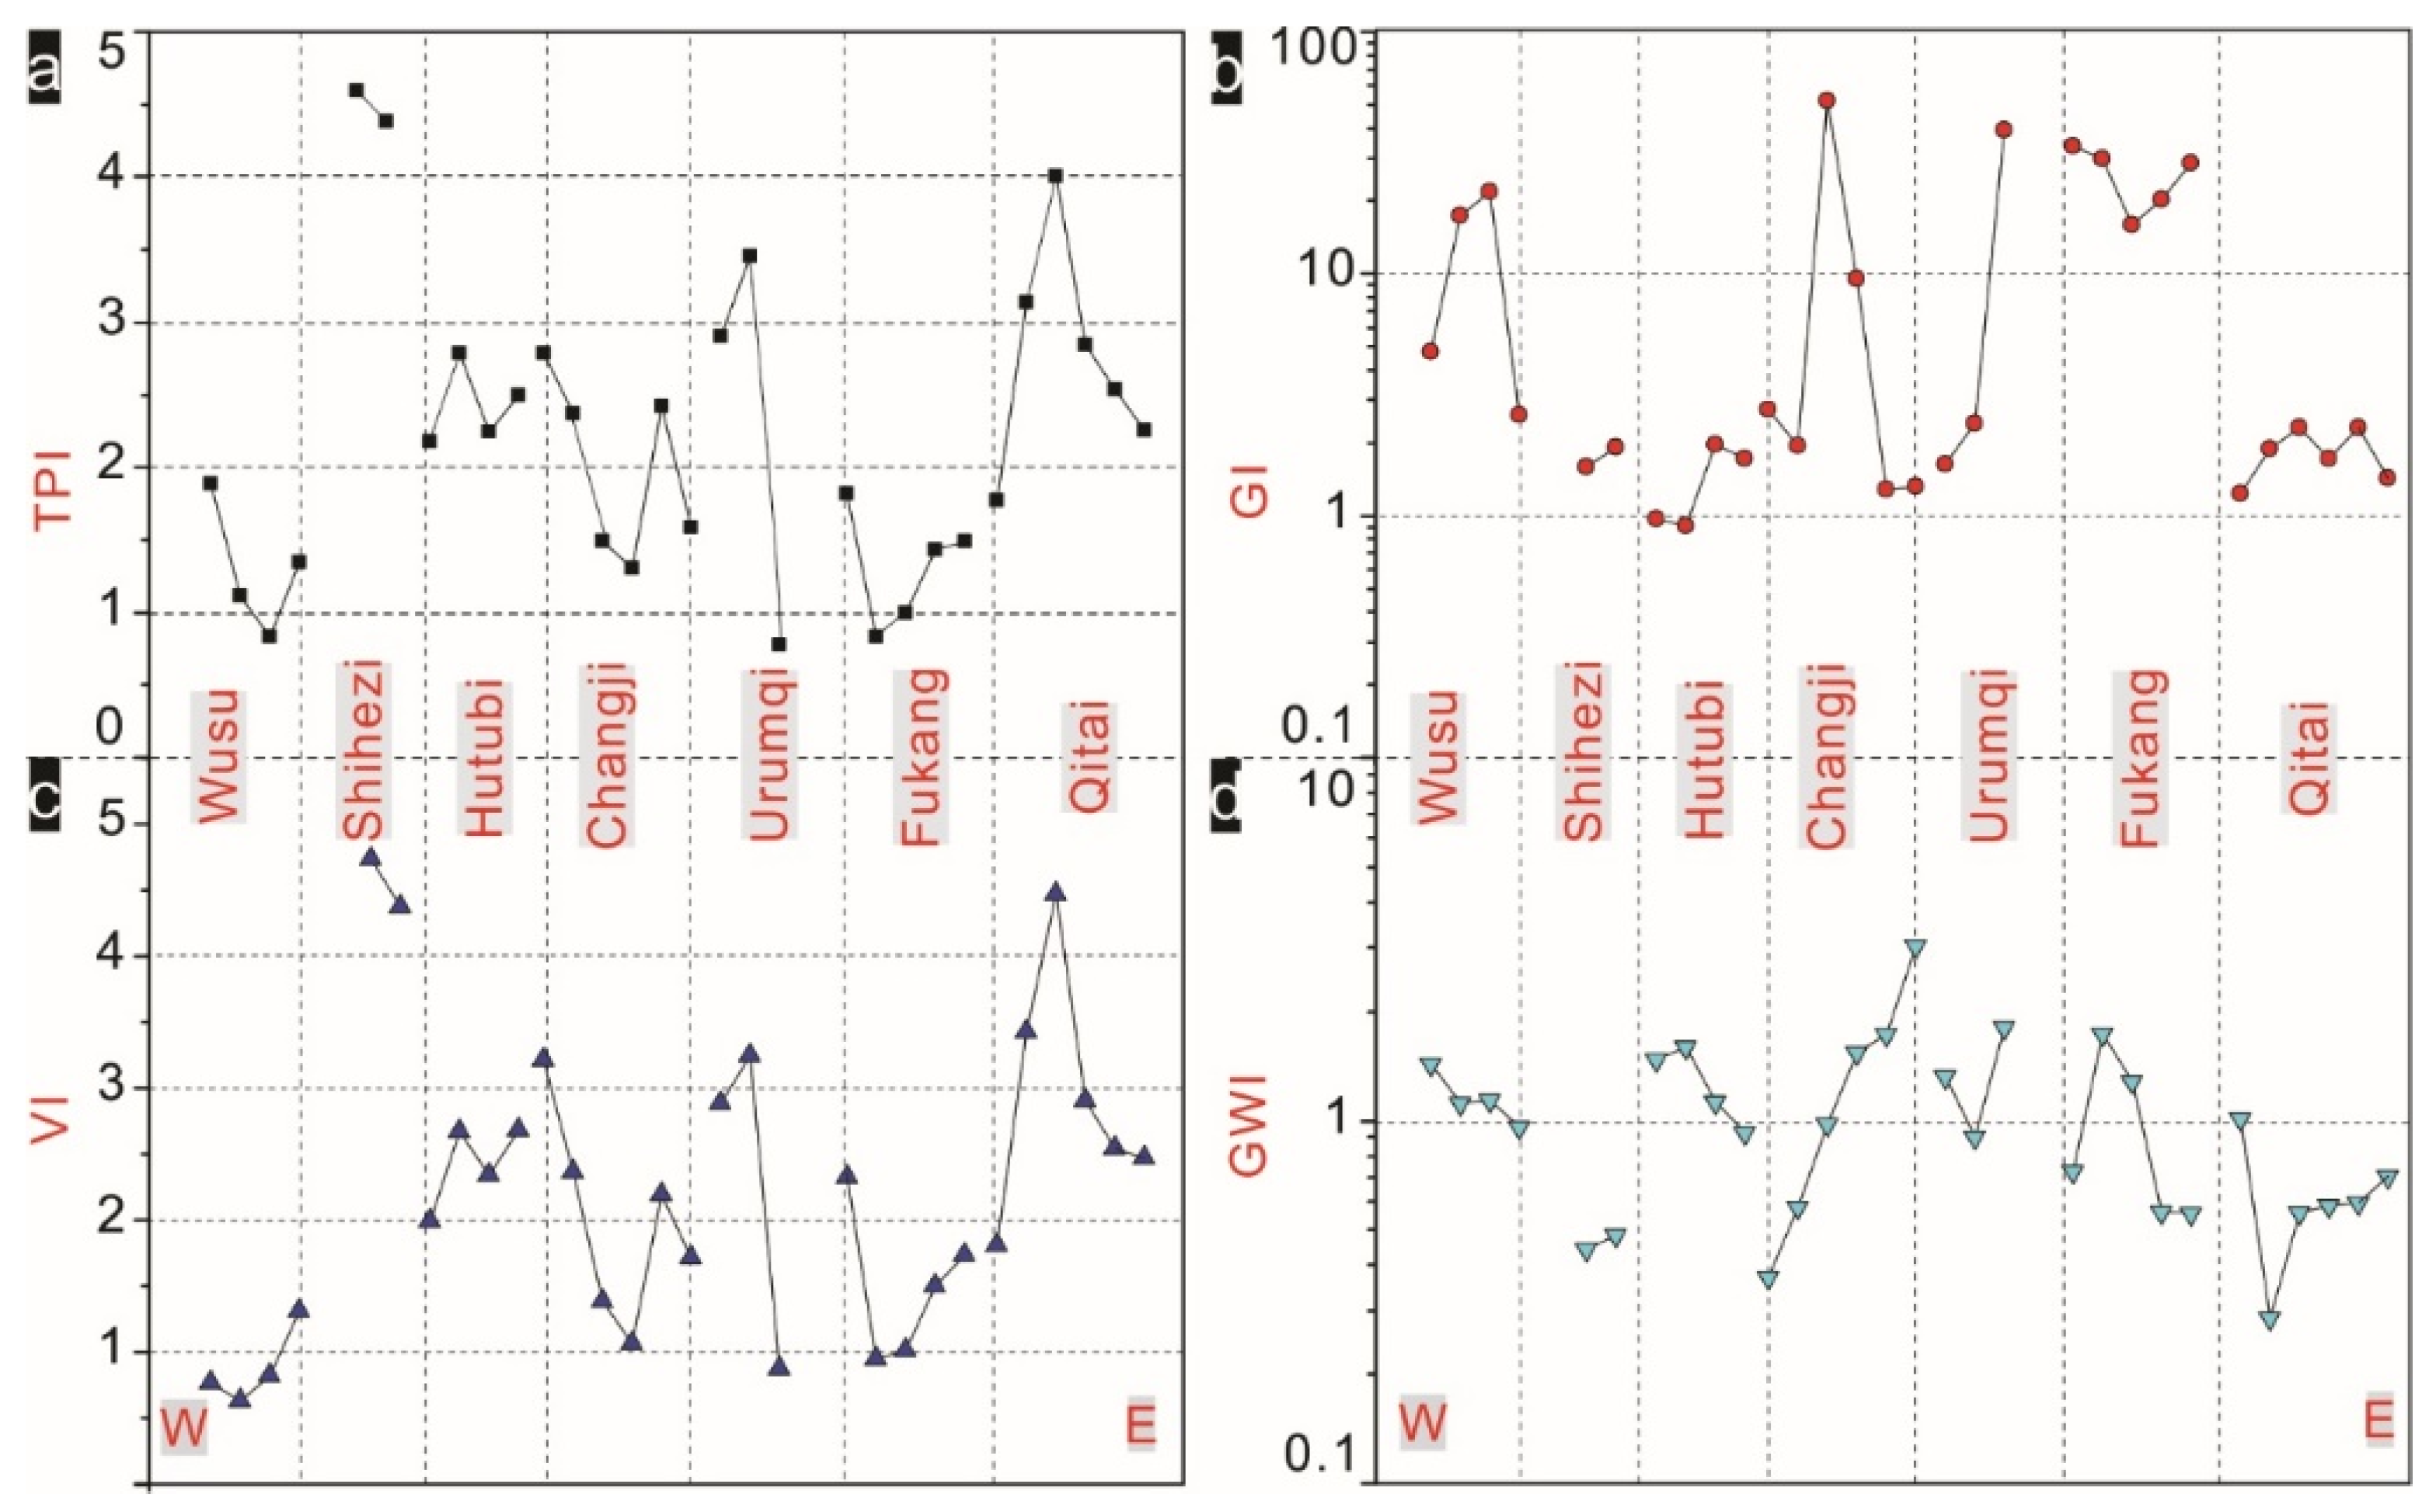
Numerous scholars have reported the paleo-environmental conditions according to the quantitative relations between the tissue and non-tissue-derived components [1,40]. Diessel [20] described a coal facies model based on two indices, including the tissue preservation index (TPI) and gelification index (GI). The TPI represents tissue degradation and the ratio of wood in coal-forming plants. Specifically, the TPI can indicate the degree of humification and plant cell tissue destruction. Increased TPI values are generally attributed to some dominant arborescent plants in the original paleomire. The GI is defined as the ratio of gelation constitutions to fusainization macerals and is regarded as reflecting the wetness degree and duration of peat mire during peat accumulation. High GI values usually characterize wet conditions of paludification, whereas low GI values generally distinguish to dry conditions of paludification. The GI is considered to an oxidation target in the mire; a decrease in GI values signals an increase in oxidation [15,16]. The two measures in this study are calculated as follows:
The TPI values of the samples from the SJC range between 0.8 and 4.6 (Figure 6a; Table 2); these values signal that organic matter retention is moderate to reasonably high and there exists a lateral gain in the rate of subsidence. Combined with the ~20 vol % mineral content, certain coals may occur in intermittently dry forest swamps. The GI values of the SJC coals vary between 0.9 and 51.6 (Figure 6a; Table 2), which indicates medium–high gelification of the organic matter and relatively wet conditions during peat accumulation. The varied GI values imply water level variations during peat formation without any visible law in the SJC [51], though the water level is high.
Calder et al. [52] proposed another widespread method using a diagram of the vegetation index (VI) and ground water index (GWI) in order to evaluate the coal’s depositional environment. The VI is the ratio of macerals originating from arboreal vegetation vs. that originating from herbaceous peat-forming plants; it is calculated as the ratio of material with a remnant botanical cellular structure with respect to the matrix, detrital, and granular macerals [53]. High VI values suggest forested mires, whereas low-VI values represent peats that deposit in the lacustrine facies and mainly originate from herbaceous sources. The GWI is defined as the ratio of strongly vs. weakly gelified tissues and is a measure of hydrological conditions (rheotrophic, mesotrophic, and ombrotrophic) in the palaeomire. High GWI values represent a comparatively high water level in the prime mires. In this study, the VI and GWI are determined by equations as follows:
The moderate values of the VI (0.6–4.7, avg. 2.2) and the moderate values of the GWI (0.3–3, avg. 1.1) suggest (Figure 6b) that the peat formed under mesotrophic conditions (merging moderate nutrient levels for plant development), including herbaceous plants. Meanwhile, variations in GWI values interpret that water level may fluctuate during peat formation. They further support the argument of the model by Goodarzi [49] that the water table frequently fluctuates during peat accumulation. This explanation is also in agreement with the wet forest swamp to piedmont plain depositional conditions (i.e., slightly oxic–anoxic) supported by the GI-TPI plot.
4.2.2. Depositional Environment of the Middle Jurassic Coals in Coal Seam No. 45
Based on synthetic triangular diagrams and the facies model of Calder et al. (1991) [52] above, four types of coal facies are determined in the SJC, including: (1)—lower delta plain marsh, (2)—lower delta plain fen, (3)—upper delta plain wet forest swamp; and (4)—piedmont plain moor (Figure 6b; Table 2).
Coals in the Wusu CBM block formed the lower delta plain marsh, which predominantly shows herbage planted in the shadow of water and an absence of arborescent plants. The botanical tissues were forcefully decomposed. The macerals were predominantly composed of telinite, collotelinite, vitrodetrinite, and cutinite (Table 1). The vitrinite and liptinite groups in the coal facies are richer than the other three types. Frequent extraneous transport by the distributary channels or the sea may bring some mineral matter into the bog and result in a relatively high ash yield [1]. Coals in Hutubi and Urumqi CBM blocks formed the lower delta plain fen (Table 2), which is considered as a mid-point between the herbaceous and forest swamp [20], with the peat originating from the synthesis of herbaceous and arborescent plants under wet conditions. The botanical tissues in herbaceous plants are weakly preserved. The extraneous mineral matter in the mire may come from the incidental crevasses and overflows, leading to the richer mineral content of the Urumqi CBM blocks.
Coals in the Changji, Fukang, and Qitian CBM blocks, forming the upper delta plain wet forest swamp (Table 2), are found in the bog occurring in the area of phytogenic sedimentation on the delta far from the sea [20]. The paleomire is basically derived from arborescent plants, especially the huge perennial plants; collotelinite is the richest among the four types. The coals are deposited in wet and mesotrophic conditions, with moderate nutrient levels for plant development [53]. The botanical cellular structures are strongly preserved due to the rapid burial of paleomire and the absence of effects in distributary channels and crevasses. Coals in Fukang and the Qitai CBM blocks have relatively low mineral content (~16 vol %), resulting from fewer extraneous minerals in the peat without frequent disturbances. The variations on TPI and VI values interpret changes in plant species composition, though the primary species are arborescent plants. Coals in the Sikeshu CBM blocks, forming the piedmont plain moor (Table 2), are dominated by arborescent plants uncovered by water. The inertinite group in the coal facies is the richest among the four types. High TPI and VI values indicate that botanical cellular structures are retained [52].
Figure 7 shows the lateral W–E variation of coal facies indices from each CBM blocks in the SJC. The evolution of paleomire is related to the prime matter, water and ion supplements, acid–base properties, and redox conditions [22]. The evolution of TPI and VI are generally consistent (Figure 7a,c), showing the degree of arborescent plants suppling peat formation. The hydrodynamic condition is stronger (larger value in Figure 7d), and more terrigenous substances are presented in the paleomire. The variation of GI can show water level variations and redox conditions of paludification (Figure 7b). From west to east, the SJC presents series of coal facies as (1)-(4)-(3 + 2)-(2)-(2)-(2)-(3) for the Wusu, Shihezi, Hutubi, Changji, Urumqi, Fukang, and Qitai CBM blocks, respectively. In general, lower delta plain fen facies and upper delta plain wet forest swamp are the dominant facies in the Middle Jurassic coals from the SJC. The results fit in with the sedimentary data (Figure 1d), implying a delta depositional environment. It should be noted that determining the coal-forming environments would better combine with geochemistry, palaeobotany, and palynology.
4.3. Pore and Fissure Structures Controlled by Coal Petrology
4.3.1. Control of Coal Macerals on Pore and Fissure Characteristics
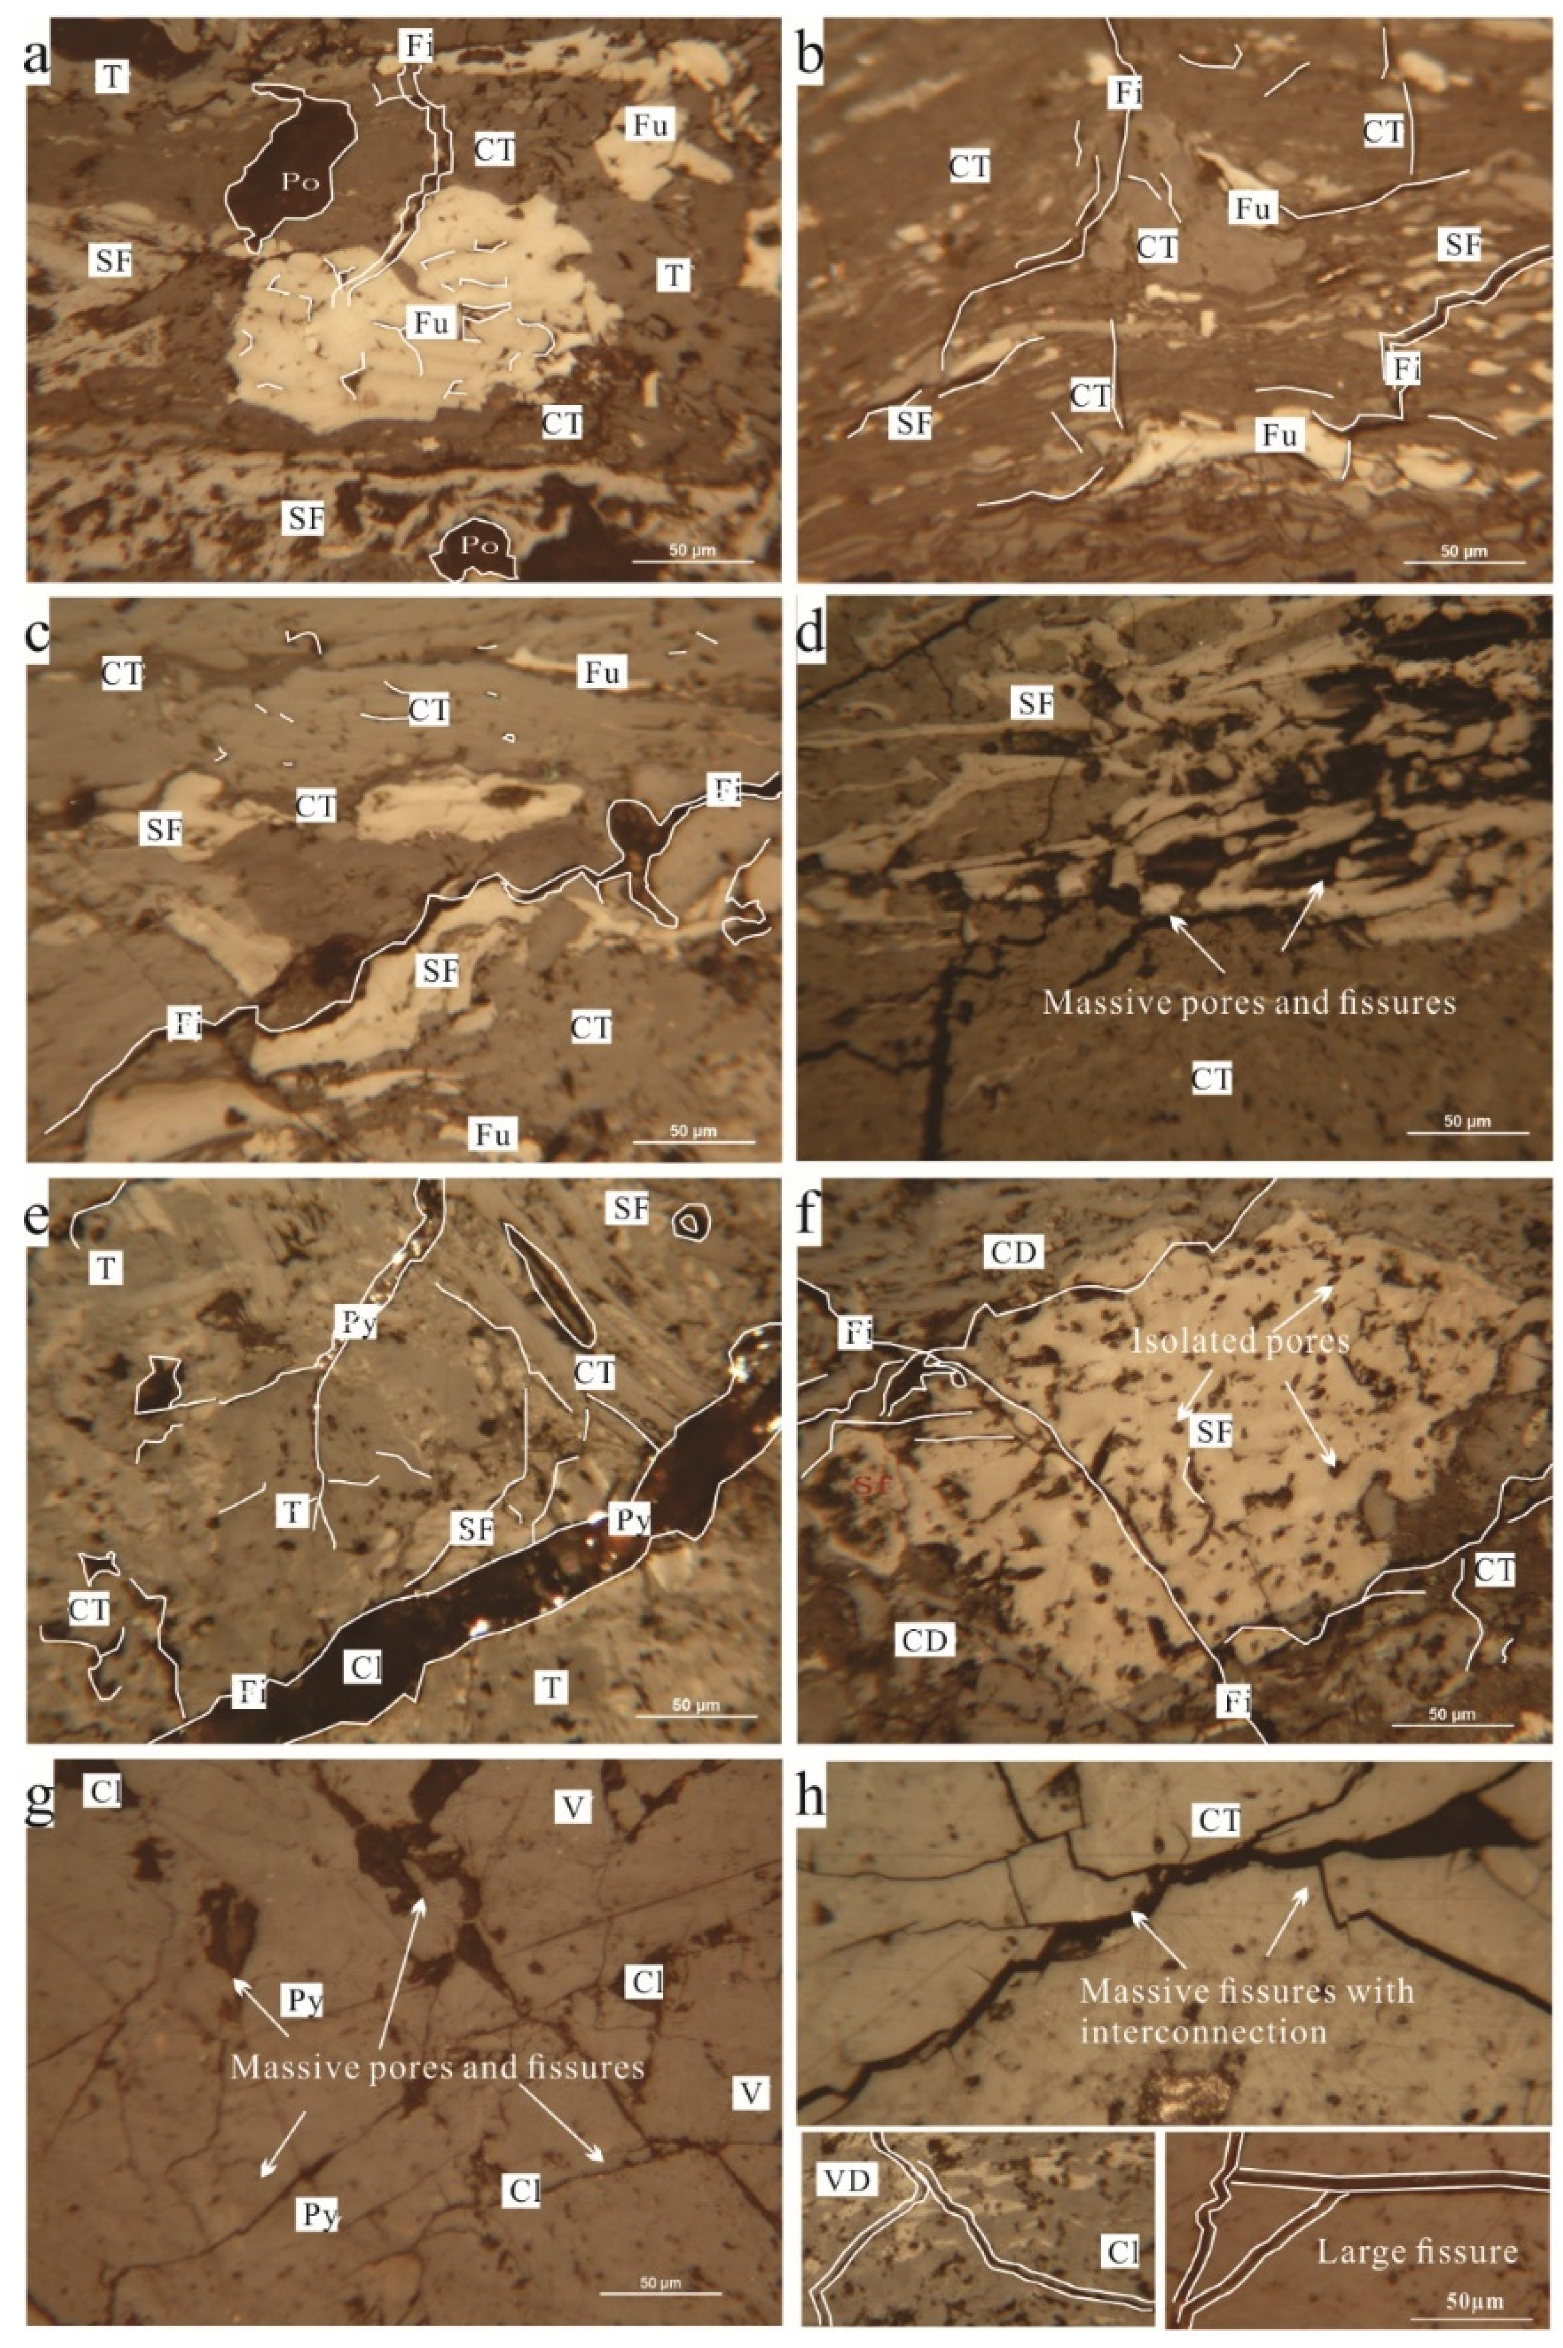
Figure 8 shows the structures of pore and fissure of micrometer scale in submacerals. Multiple pores are observed within collotelinite, semifusinite, and fusinite; several pores reach a diameter of 50 μm (Figure 8a). Cluttered fissures are found in fusinite during fusainization in an oxidizing environment (Figure 8a). Fissures with the length of ~100 μm are irregularly distributed and basically run through collotelinite and semifusinite (Figure 8b). Fissures also occur at the edges of semifusinite (Figure 8c). Massive pores and fissures are presented in semifusinite (Figure 8d,f). It was found that clays and pyrites fill in some fissures (Figure 8e,g). The apertures of fissures reach 10 μm and the fissures are orthogonal (named as the face and butt cleats) (Figure 8h). Pores and fissures are basically developed in telinite, collotelinite, fusinite, and semifusinite. It should be noted that pores at a nanometer-scale level are not considered due to limited resolution.
4.3.2. Control of Coal Facies on Pore and Fissure Structures
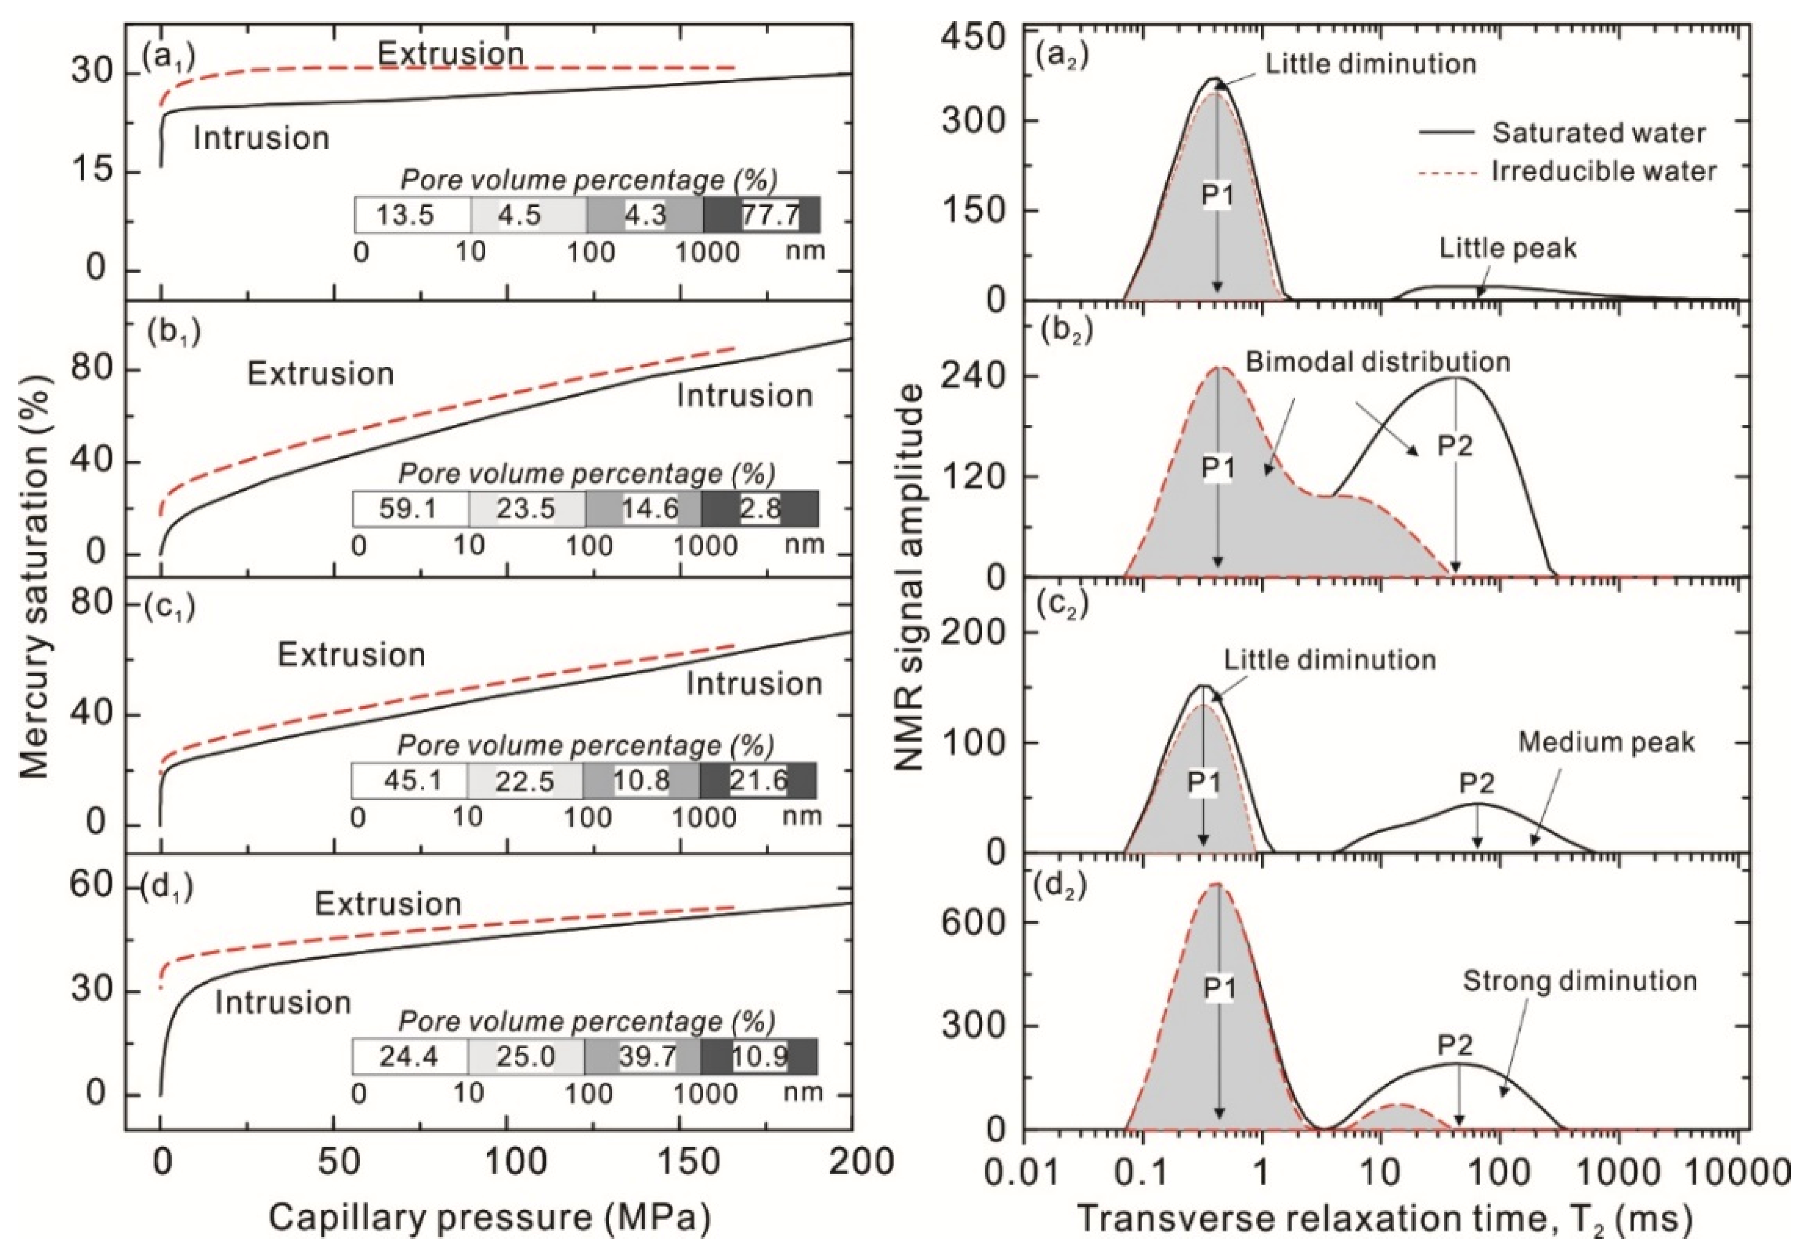
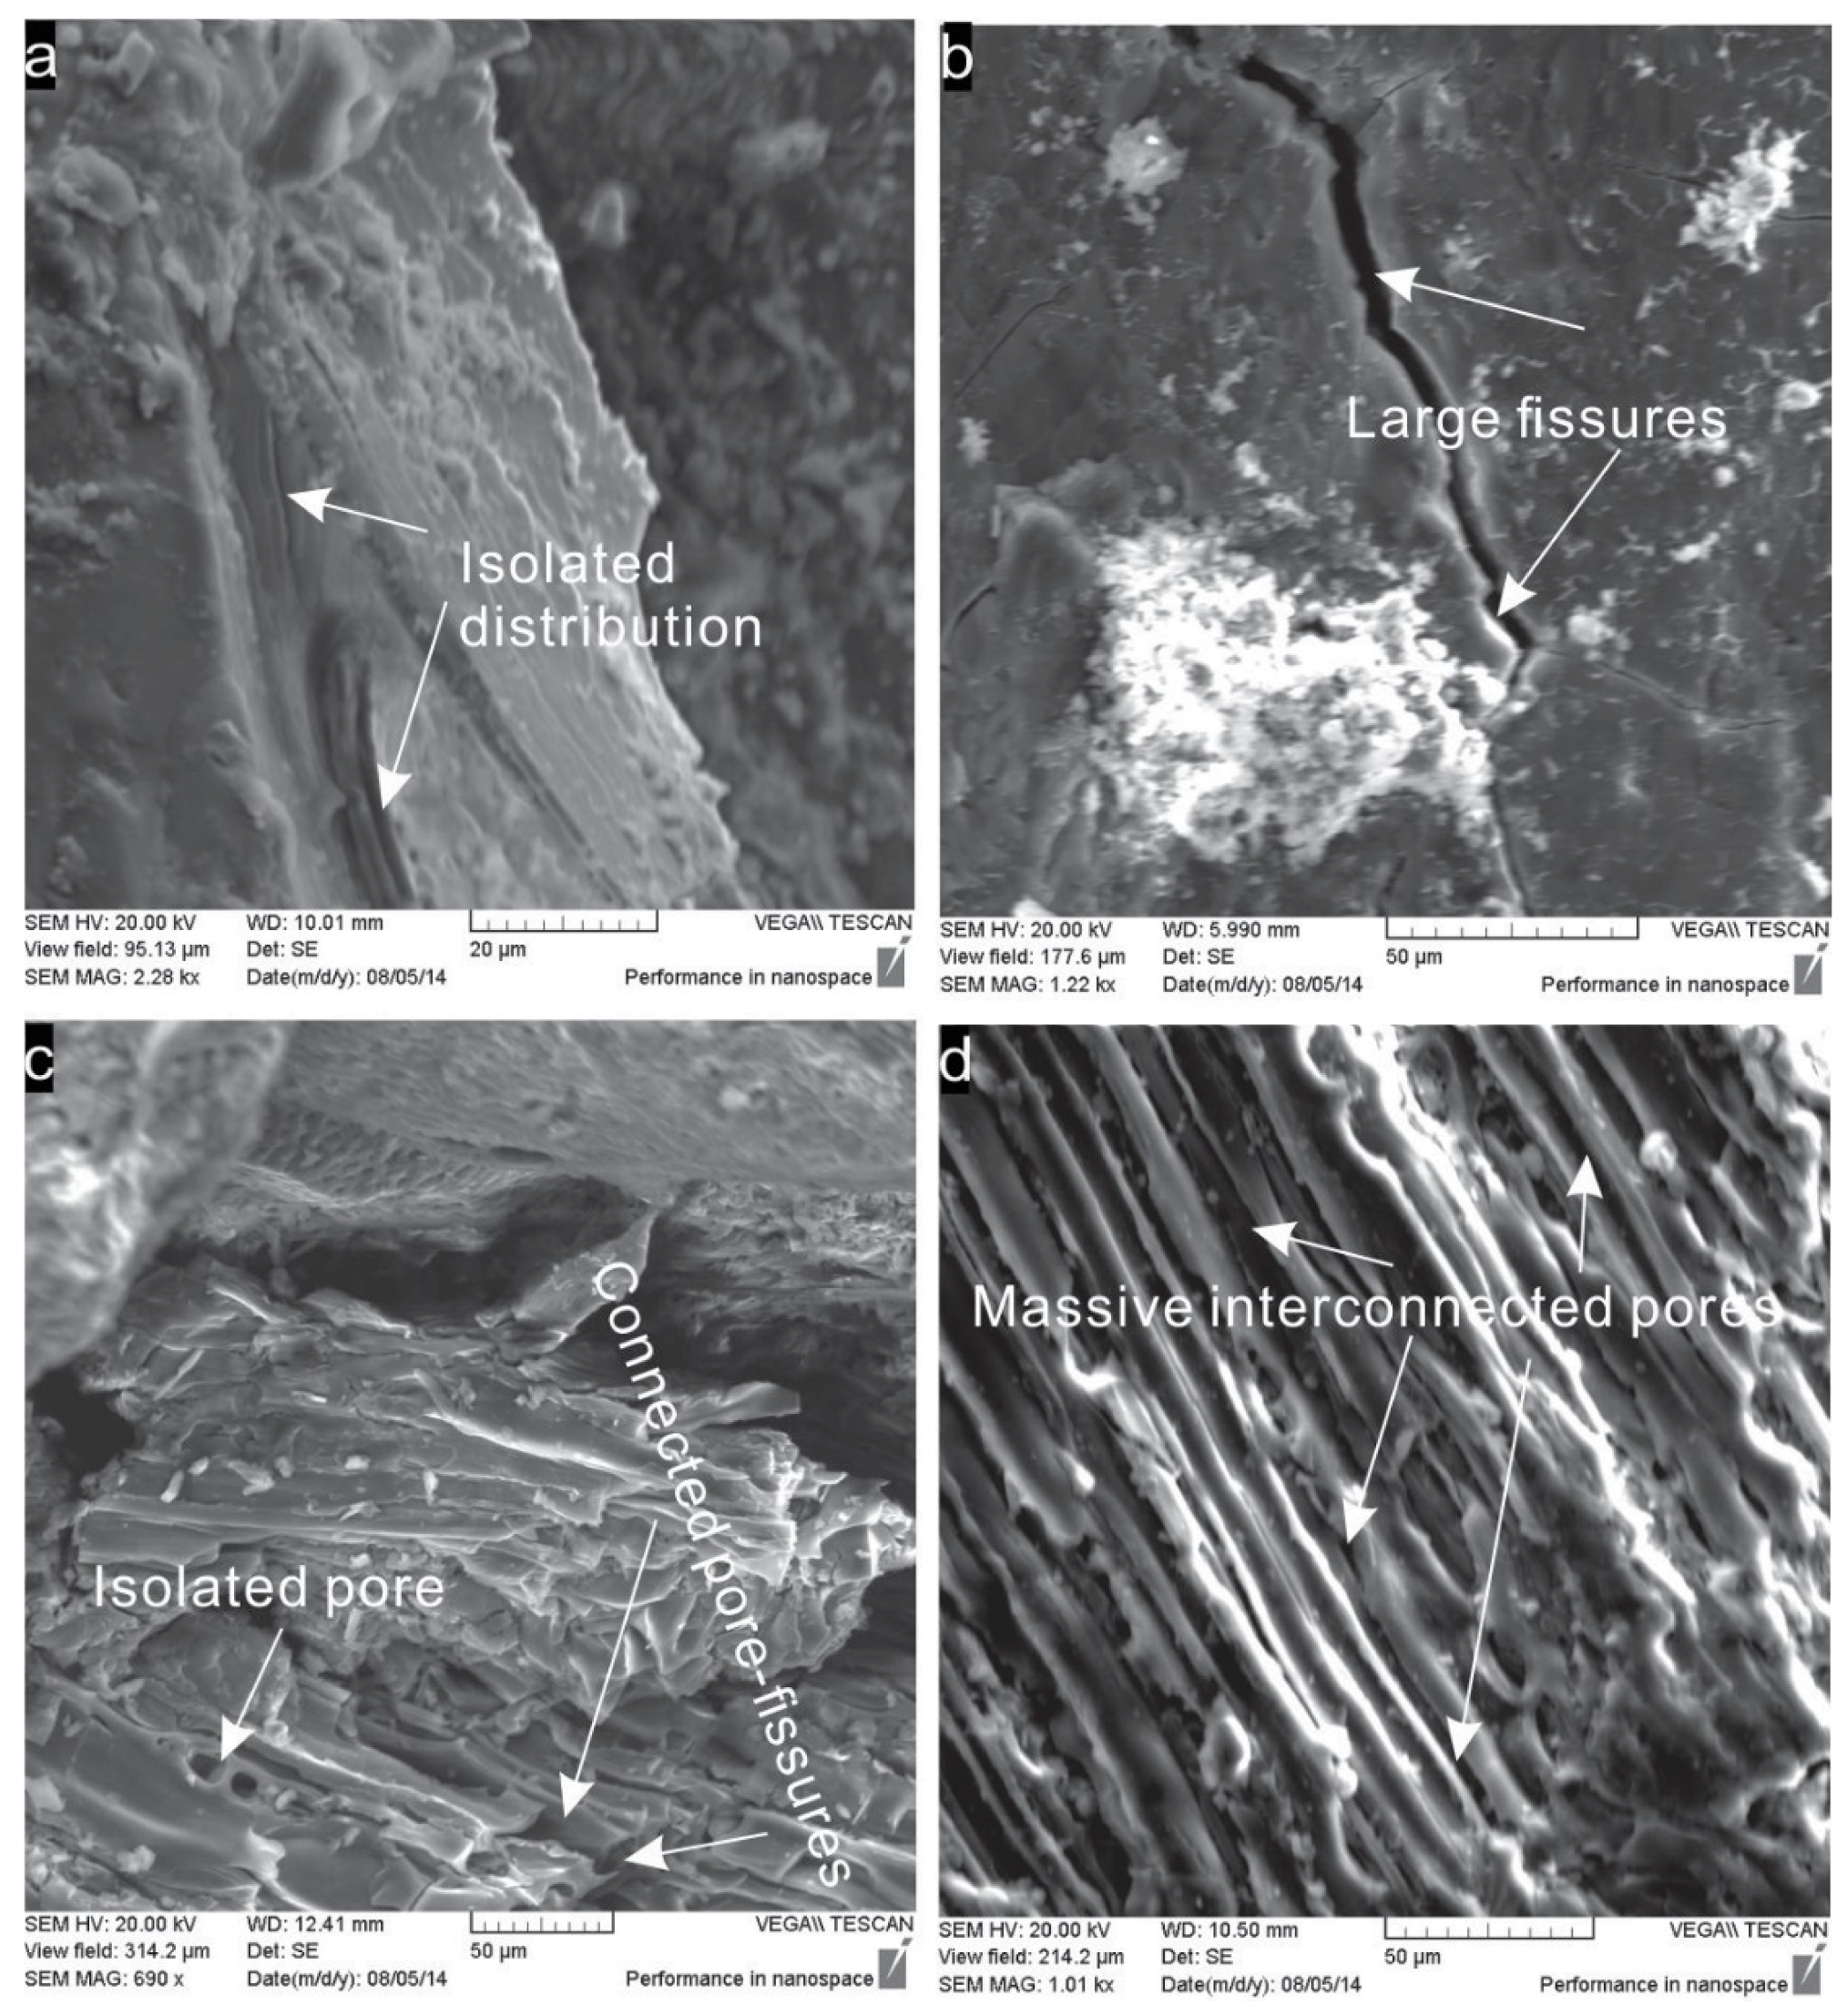
Figure 9 demonstrates that pore and fissure structures acquired by MIP and NMR are controlled by coal facies ((1)–(4)). The coal pores in coal facies (1) are dominated by macropores (>1000 nm) with low efficiency of mercury withdrawal (EMW) and injection of mercury saturation (IMS) (Figure 9a1), implying that coal pores are scarcely interconnected, in agreement with the NMR results (Figure 9a2). In the coal facies (1), the botanical tissues were crushed into small pieces, resulting in massive macropores with isolated distribution [1]. The coal pores in coal facies (2) are predominantly composed of micropores (<10 nm), followed by transition pores (10–100 nm) and mesopores (100–1000 nm) with an IMS of 95% and EMW of 80.7% (Figure 9b1). The NMR amplitudes are greatly decreased in the second peak after centrifuging, which suggests that the coal reservoir has good connections between pores (<100 nm) and mesopores or fissures in facies (2) (Figure 9b2). The extraneous mineral matter can be attributed to massive micropores [51]. The coal pores in coal facies (3) and (4) have mean multi-scale pores with medium IMS and EMW values (Figure 9c1,d1). The EMW of coal pores (72%) in facies (3) is higher compared to that (41.7%) in facies (4). This phenomenon results in the former NMR second peak entirely vanishing (Figure 9c2), showing that pores and fissures are well-connected. The botanical structures are slightly damaged, making less of a contribution to the macropores. The small diminution in the first NMR peak shows that the micropores are partly interconnected (Figure 9a2 and c2). The residual amplitude after centrifuging implies pores and fissures are isolated (Figure 9d2), resulting in the comparatively low EMW values in coal facies (4). Further, Figure 10 presents microscopic features of pore and fissure of coal samples in four coal facies. Pore and fissure structures of coals in coal facies (1) present low connectivity (Figure 10a), whereas those in coal facies (2) are strongly connected due to large connected fissures (Figure 10b). Coals in coal facies (3) and (4) have multiscale pores and fissures, with medium connectivity (Figure 10c,d). It can be found that the connectivity of pores and fissure by SEM is in good accordance with that obtained through MIP and NMR measurement. Overall, these results can reveal the connection of microcosmic pore and fissure characteristics with macroscopical coal petrology. However, the coal petrology-controlling mechanism with respect to CBM exploitation remains undiscovered. It is significant to validate further applications of this finding to other coal seams and diverse coal basins.
4.3.3. Application to Coalbed Methane
On the above basis, the system of pores and fissures in the delta plain coals is strongly influenced by petrographic characteristics. This study discusses the critical role of development of pore and fissure structures in coal seams for CBM adsorption, accumulation, preferential migration pathways, and flow. Firstly, gas content is higher in subbituminous coal than lignite [7], which is related in part to vitrinite content. Lignite in the Wusu CBM block should have the lowest methane content from the perspective of methane adsorption capacity. The gas content of low rank coals is influenced by ash content; greater ash content means lower gas adsorption [2]. Each CBM blocks presents ~20 vol % mineral matter content, which means methane adsorption capacity is lower in the SJC than other coalfields [1,2,3]. Secondly, although, lignite is too low in rank for CBM accumulation compared to subbituminous coal, it is still useful for coal maceral groups and facies characterization of Xishanyao coals. Coals in the Hutubi and Urumqi CBM blocks are suggested to have the highest storage capacity. Thirdly, pore and fissure structures of coals in coal facies (1) show low connectivity, whereas those in coal facies (2) are strongly interconnected. Coals in coal facies (3) and (4) have multiscale pores and fissures with medium connectivity. The SJC presents series of coal facies as (1)-(4)-(3 + 2)-(2)-(2)-(2)-(3) for the Wusu, Shihezi, Hutubi, Changji, Urumqi, Fukang, and Qitai CBM blocks, respectively. Therefore, coals from the Changji, Urumqi, and Fukang CBM blocks should have the best migration pathways. Finally, the cleat spacing decreases with increasing coal rank; the cleat spacing is higher in subbituminous coal than in lignite. Also, macrolithotype layers with high vitrain/virtinite contain narrower cleat spacing compared to those with low vitrain/vitrinite layers [11]. Thus, cleat spacing is lower in semi-bright coal than semi-dull and dull coal. These two aspects combined, coals in the Urumqi CBM block should have higher flow capacity due to the larger cleat spacing. Therefore, coals in Hutubi and Urumqi CBM blocks, with the highest gas content and storage capacity and the largest cleat spacing, have the best CBM drainage potential. It is suggested that the Wusu block forms the poorest target area for CBM exploration. These findings can provide practical measures and guidelines for the application of petrographic study for future CBM exploration/development in the SJC.
5. Conclusions
Maceral analysis showed that coals at the SJC are dominated by vitrinite (38–87 vol %), with less abundant inertinite (1–28 vol %) and liptinite (0.5–30 vol %). Each CBM block had ~20 vol % mineral content. Cutinite, macrosporinite, microsporophyte, lamalginite, fluorinite, resinite, and exsudatinite from the SJC were fully observed under the microscope. Barkinite was present with lenticels, which was an unusual liptinitic component apparently found mainly in Chinese coal.
We validated four coal facies indices to determine the evolution of peat-forming depositional environments in Middle Jurassic coals in coal seam No. 45. Based on the triangular diagrams, it can be said that the decomposition of plants occurred under slightly oxic–anoxic conditions, with good tissue preservation and a generally high but variable water table. The indices (TPI vs. GI and VI vs. GWI) reveal that the coal facies in the SJC are generally found in (1) lower delta plain marsh; (2) lower delta plain fen; (3) upper delta plain wet forest swamp; and (4) piedmont plain moor. From west to east, the SJC presents series of coal facies as (1)-(4)-(3 + 2)-(2)-(2)-(2)-(3) for the Wusu, Shihezi, Hutubi, Changji, Urumqi, Fukang. and Qitai CBM blocks, respectively.
Pores and fissures were basically generated within telinite, collotelinite, fusinite, and semifusinite. Pore and fissure structures of coals in coal facies (2) demonstrate good connectivity, whereas those in coal facies (1) were weakly connected. Coals in coal facies (3) and (4) had medium connectivity of pore and fissure structures. Thus, pore and fissure structures were found to be significantly controlled by coal petrology (macerals and coal facies) from the SJC coals. Coals in Hutubi and Urumqi CBM blocks, with the greatest gas content and storage capacity and the largest cleat spacing, have the best CBM drainage potential, while the Wusu block may be the poorest target for CBM exploration.
For further study is the identification of pores originating from sub-macerals at the nano-scale level using scanning electron microscopes, and the determination of the influence of coal petrology (such as lithotype, macerals and coal facies) on diffusion using permeability anisotropies with R-type cluster analysis. We will explore how to shed light on the microcosmic interactions of gas, water, and nanoparticles during gas sorption, desorption, diffusion, and flow behaviors in different coal facies.
Author Contributions
S.Z. and D.L. together conceived and designed the experiments; S.Z. analyzed the data and wrote the paper; D.L. and Z.K. revised the paper and provided language support; Y.C. and Y.Y. provided technical support.
Funding
This research was funded by the Fundamental Research Funds for the Central Universities (2652017302), the National Natural Science Foundation of China (41772160; 41602170) and the China Scholarship Council (No. 201706400009).
Acknowledgments
We would like to thank Damao Wu for his support with maceral group experiments and fruitful discussion.
Conflicts of Interest
The authors declare no conflict of interest.
Nomenclature
| Ba | barkinite |
| CD | collodetrinite |
| CG | corpogelinite |
| Cu | cutinite |
| CT | collotelinite |
| Fl | flourinite |
| Fu | fusinite |
| GI | gelification index |
| GWI | ground water index |
| I | inertinite |
| ID | inertodetrinite |
| J1b | Badaowan formation |
| J1s | Sangonghe formation |
| J2-3sh | Shishugou group |
| J2x | Xishanyao formation |
| L | liptinite |
| LD | liptodetrinite |
| Mi | micrinite |
| mmf | mineral matter-free basis |
| Om | other minerals |
| P | pyrite |
| P2cha | Xiachangfanggou group |
| Re | resinite |
| SF | semifusinite |
| SJC | southern Junggar Coalfield |
| Sp | sporinite |
| T | telinite |
| T2-3xq | Xiaoquangou group |
| TPI | tissue preservation index |
| V | vitrinite |
| VD | vitrodetrinite |
| VI | vegetation index |
| Vol | volume |
| VRmax | maximum reflectance of vitrinite |
References
- Zhao, L.; Qin, Y.; Cai, C.; Xie, Y.; Wang, G.; Huang, B.; Xu, C. Control of coal facies to adsorption-desorption divergence of coals: A case from the Xiqu Drainage Area, Gujiao CBM Block, North China. Int. J. Coal Geol. 2017, 171, 169–184. [Google Scholar] [CrossRef]
- Hou, H.; Shao, L.; Li, Y.; Li, Z.; Wang, S.; Zhang, W.; Wang, X. Influence of coal petrology on methane adsorption capacity of the Middle Jurassic coal in the Yuqia coalfield, northern Qaidam Basin, China. J. Petrol. Sci. Eng. 2017, 149, 218–227. [Google Scholar] [CrossRef]
- Cai, Y.; Liu, D.; Liu, Z.; Zhou, Y.; Che, Y. Evolution of pore structure, submaceral composition and produced gases of two Chinese coals during thermal treatment. Fuel Process. Technol. 2016, 156, 298–309. [Google Scholar] [CrossRef]
- Hackley, P.C.; Warwick, P.D.; Breland, F.C., Jr. Organic petrology and coalbed gas content, Wilcox group (Paleocene-Eocene), northern Louisiana. Int. J. Coal Geol. 2007, 71, 54–71. [Google Scholar] [CrossRef]
- Suárez-Ruiz, I.; Flores, D.; Mendonça Filho, J.G.; Hackley, P.C. Review and update of the applications of organic petrology: Part 1, Geological Applications. Int. J. Coal Geol. 2012, 99, 54–112. [Google Scholar] [CrossRef]
- Mardon, S.M.; Eble, C.F.; Hower, J.C.; Takacs, K.; Mastalerz, M.; Bustin, R.M. Organic petrology, geochemistry, gas content and gas composition of Middle Pennsylvanian age coal beds in the Eastern Interior (Illinois) Basin: Implications for CBM development and carbon sequestration. Int. J. Coal Geol. 2014, 127, 56–74. [Google Scholar] [CrossRef]
- Flores, R.M. Coal and Coalbed Gas: Fueling the Future: Chapter 4-Coalification, Gasification, and Gas Storage; Elsevier: Waltham, MA, USA, 2014; pp. 167–233. [Google Scholar] [CrossRef]
- Clarkson, C.R.; Bustin, R.M. Variation in micropore capacity and size distribution with composition in bituminous coal of the Western Canadian Sedimentary Basin. Fuel 1996, 75, 1483–1498. [Google Scholar] [CrossRef]
- Cui, X.; Bustin, M.; Dipple, G. Differential transport of CO2 and CH4 in coalbed aquifers: Implications for coalbed gas distribution and composition. Int. J. Coal Geol. 2004, 88, 1149–1161. [Google Scholar] [CrossRef]
- Solano-Acosta, W.; Mastalerz, M.; Schimmelmann, A. Cleats and their relation to geologic lineaments and coalbed methane potential in Pennsylvanian coals in Indiana. Int. J. Coal Geol. 2007, 72, 187–208. [Google Scholar] [CrossRef]
- Dawson, G.K.W.; Esterle, J.S. Controls on coal cleat spacing. Int. J. Coal Geol. 2010, 82, 213–218. [Google Scholar] [CrossRef]
- Cardott, B.J.; Curtis, M.E. Identification and nanoporosity of macerals in coal by scanning electron microscopy. Int. J. Coal Geol. 2018, 190, 205–217. [Google Scholar] [CrossRef]
- Zhang, S.; Tang, S.; Tang, D.; Pan, Z.; Yang, F. The characteristics of coal reservoir pores and coal facies in Liulin district, Hedong coal field of China. Int. J. Coal Geol. 2010, 81, 117–127. [Google Scholar] [CrossRef]
- Dai, S.; Ren, D.; Li, S.; Zhao, L.; Zhang, Y. Coal facies evolution of the main minable coal-bed in the Heidaigou Mine, Jungar Coalfield, Inner Mongolia, northern China. Sci. China Ser. D Earth Sci. 2007, 50, 144–152. [Google Scholar] [CrossRef]
- Karayiğit, A.I.; Bircan, C.; Mastalerz, M.; Oskay, R.G.; Querol, X.; Lieberman, N.R.; Türkmen, I. Coal characteristics, elemental composition and modes of occurrence of some elements in the İsaalan coal (Balıkesir, NW Turkey). Int. J. Coal Geol. 2017, 172, 43–59. [Google Scholar] [CrossRef]
- Karayiğit, A.İ.; Mastalerz, M.; Oskay, R.G.; Gayer, R.A. Coal petrography, mineralogy, elemental compositions and palaeoenvironmental interpretation of Late Carboniferous coal seams in three wells from the Kozlu coalfield (Zonguldak Basin, NW Turkey). Int. J. Coal Geol. 2018, 187, 54–70. [Google Scholar] [CrossRef]
- Çelik, Y.; Karayiğit, A.İ.; Querol, X.; Oskay, R.G.; Mastalerz, M.; Kayseri Özer, M.S. Coal characteristics, palynology, and palaeoenvironmental interpretation of the Yeniköy coal of Late Oligocene age in the Thrace Basin (NW Turkey). Int. J. Coal Geol. 2017, 181, 103–123. [Google Scholar] [CrossRef]
- Baboolal, A.A.; Littke, R.; Wilson, B.; Stock, A.T.; Knight, J. Petrographical and geochemical characterization of lignites, sub-bituminous coals and carbonaceous sediments from the Erin Formation, Southern Basin, Trinidad—Implications on microfacies, depositional environment and organic matter alteration. Int. J. Coal Geol. 2016, 163, 112–122. [Google Scholar] [CrossRef]
- Mukhopadhyay, P.K. Petrography of selected Wilcox and Jockson Group lignites from Tertiary of Texas. In Geology of Gulf Coast Lignites; Finkelman, R.B., Casagrande, D.J., Eds.; Geological Society of America: Boulder, CO, USA, 1986; pp. 126–145. [Google Scholar]
- Diessel, C.F.K. The correlation between coal facies and depositional environments. In Advances in the study of the Sydney Basin; The University of Newcastle: Newcastle, UK, 1986; pp. 19–22. [Google Scholar]
- Oskay, R.G.; Christanis, K.; Inaner, H.; Salman, M.; Taka, M. Palaeoenvironmental reconstruction of the eastern part of the Karapınar-Ayrancı coal deposit (Central Turkey). Int. J. Coal Geol. 2016, 163, 100–111. [Google Scholar] [CrossRef]
- Gürdal, G.; Bozcu, M. Petrographic characteristics and depositional environment of Miocene Çan coals, Çanakkale-Turkey. Int. J. Coal Geol. 2011, 85, 143–160. [Google Scholar] [CrossRef]
- Sen, S.; Naskar, S.; Das, S. Discussion on the concepts in paleoenvironmental reconstruction from coal macerals and petrographic indices. Mar. Petrol. Geol. 2016, 73, 371–391. [Google Scholar] [CrossRef]
- Karayiğit, A.İ.; Littke, R.; Querol, X.; Jones, T.; Oskay, R.G.; Christanis, K. The Miocene coal seams in the Soma Basin (W. Turkey): Insights from coal petrography, mineralogy and geochemistry. Int. J. Coal Geol. 2017, 173, 110–128. [Google Scholar] [Green Version]
- Ivanova, A.; Zaitseva, L. Studies of the coal facies in Western Ukraine (the Lvov-Volyn basin). Int. J. Coal Geol. 2004, 58, 67–73. [Google Scholar] [CrossRef]
- Li, J.; Zhuang, X.; Querol, X.; Font, O.; Moreno, N.; Zhou, J.; Lei, G. High quality of Jurassic Coals in the Southern and Eastern Junggar Coalfields, Xinjiang, NW China: Geochemical and mineralogical characteristics. Int. J. Coal Geol. 2012, 99, 1–15. [Google Scholar] [CrossRef]
- Shen, J.; Qin, Y.; Wang, J.; Shen, Y.; Wang, G. Peat-Forming Environments and Evolution of Thick Coal Seam in Shengli Coalfield, China: Evidence from Geochemistry, Coal Petrology, and Palynology. Minerals 2018, 8, 82. [Google Scholar] [CrossRef]
- Zhou, J.; Zhuang, X.; Alastuey, A.; Querol, X.; Li, J. Geochemistry and mineralogy of coal in the recently explored Zhundong large coal field in the Junggar Basin, Xinjiang province, China. Int. J. Coal Geol. 2010, 82, 51–67. [Google Scholar] [CrossRef]
- Li, B.; Guan, S.; Chen, Z.; He, D.; Shawe, J.; Lei, Y.; Shi, X.; Zhang, C. Fault-Related Fold Theory and Application: Case Study on Structural Geology in South Jungger Basin; Petroleum Industry Press: Beijing, China, 2010; pp. 47–110. [Google Scholar]
- Zhou, S.; Liu, D.; Cai, Y.; Yao, Y. Fractal characterization of pore-fracture in low-rank coals using a low-field NMR relaxation method. Fuel 2016, 181, 218–226. [Google Scholar] [CrossRef]
- Zhou, S.; Liu, D.; Cai, Y.; Yao, Y. Gas sorption and flow capabilities of lignite, subbituminous and high-volatile bituminous coals in the Southern Junggar Basin, NW China. J. Nat. Gas Sci. Eng. 2016, 34, 6–21. [Google Scholar] [CrossRef]
- Ji, L.; Zhang, M.; Ma, X.; Xu, W.; Zheng, G. Characteristics of mixed sporopollen assemblage from sediments of Dushanzi mud volcano in southern Junggar Basin and indication to the source of mud and debris ejecta. Mar. Petrol. Geol. 2017, 89, 194–201. [Google Scholar] [CrossRef]
- Shao, L.; Zhang, P.; Hilton, J.; Gayer, R.; Wang, Y.; Zhao, C.; Luo, Z. Paleoenvironments and paleogeography of the Lower and lower Middle Jurassic coal measures in the Turpan-Hami oil-prone coal basin, northwestern Ghina. AAPG Bull. 2003, 87, 335–355. [Google Scholar] [CrossRef]
- Wang, A.; Wei, Y.; Yuan, Y.; Li, C.; Li, Y.; Cao, D. Coalbed methane reservoirs’ pore-structure characterization of different macrolithotypes in the southern Junggar Basin of Northwest China. Mar. Petrol. Geol. 2017, 86, 675–688. [Google Scholar] [CrossRef]
- ISO. Methods for the Petrographic Analysis of Coals-Part 2: Methods of Preparing Coal Samples; ISO 7404-2; ISO: Geneva, Switzerland, 2009. [Google Scholar]
- ISO. Methods for the Petrographic Analysis of Coals-Part 3: Method of Determining Maceral Group Composition; ISO 7404-3; ISO: Geneva, Switzerland, 2009. [Google Scholar]
- ISO. Method for the Petrographic Analysis of Coals-Part 5: Method of Determining Microscopically the Reflectance of Vitrinite; ISO 7404-5; ISO: Geneva, Switzerland, 2009. [Google Scholar]
- Zhou, S.; Liu, D.; Cai, Y.; Yao, Y. Effects of the coalification jump on the petrophysical properties of lignite, subbituminous and high-volatile bituminous coals. Fuel 2017, 199, 219–228. [Google Scholar] [CrossRef]
- International Committee for Coal and Organic Petrology (ICCP). The new vitrinite classification (ICCP System 1994). Fuel 1998, 77, 349–358. [Google Scholar]
- Farhaduzzaman, M.; Wan, H.A.; Islam, M.A. Petrographic characteristics and palaeoenvironment of the Permian coal resources of the Barapukuria and Dighipara Basins, Bangladesh. J. Asian Earth Sci. 2013, 64, 272–287. [Google Scholar] [CrossRef]
- International Committee for Coal and Organic Petrology (ICCP). The new inertinite classification (ICCP system 1994). Fuel 2001, 80, 459–471. [Google Scholar]
- International Committee for Coal and Organic Petrology (ICCP). International Handbook of Coal Petrography, 2nd ed.; University of Newcastle upon Tyne: Newcastle, UK, 1993. [Google Scholar]
- Pickel, W.; Kus, J.; Flores, D.; Kalaitzidis, S.; Christanis, K.; Cardott, B.J.; Misz-Kennan, M.; Rodrigues, S.; Hentschel, A.; Hamor-Vido, M.; et al. Classification of liptinite—ICCP System 1994. Int. J. Coal Geol. 2017, 169, 40–61. [Google Scholar] [CrossRef]
- Weyland, H. Kritische Untersuchungen zur Kutikularanalyse tertiaerer Blaetter. Blatt V. Palaeontogr. Abt. B 1960, 106, 1–10. [Google Scholar]
- Wang, S.; Tang, Y.; Schobert, H.H.; Jiang, D.; Guo, X.; Huang, F.; Guo, Y.; Su, Y. Chemical compositional and structural characteristics of Late Permian bark coals from Southern China. Fuel 2014, 126, 116–121. [Google Scholar] [CrossRef]
- Sun, X. The optical features and hydrocarbon-generating model of “barkinite” from Late Permian coals in South China. Int. J. Coal Geol. 2002, 51, 251–261. [Google Scholar] [CrossRef]
- Taylor, G.H.; Teichmüller, M. Observations on fluorinite and fluorescent vitrinite with the transmission electron microscope (TEM). Int. J. Coal Geol. 1993, 22, 61–82. [Google Scholar] [CrossRef]
- Hutton, A.C.; Kantsler, A.J.; Cook, A.C.; McKirdy, D.M. Organic matter in oil shales. Aust. Petrol. Explor. Assoc. J. 1980, 20, 44–67. [Google Scholar] [CrossRef]
- Goodarzi, F. Organic petrology of Hat Creek Coal deposit No 1, British Columbia. Int. J. Coal Geol. 1985, 5, 377–396. [Google Scholar] [CrossRef]
- Singh, M.P.; Singh, P.K. Petrographic characterization and evolution of the Permian coal deposits of the Rajmahal basin, Bihar, India. Int. J. Coal Geol. 1996, 29, 93–118. [Google Scholar] [CrossRef]
- Bechtel, A.; Karayiğit, A.I.; Sachsenhofer, R.F.; İnaner, H.; Christanis, K.; Gratzer, R. Spatial and temporal variability in vegetation and coal facies as reflected by organic petrological and geochemical data in the Middle Miocene Çayirhan coal field (Turkey). Int. J. Coal Geol. 2014, 134, 46–60. [Google Scholar] [CrossRef]
- Calder, J.H.; Gibling, M.R.; Mukhopadhyay, P.K. Peat formation in a Westphalian B piedmont setting, Cumberland Basin, Nova Scotia: Implications for the maceralbased interpretation of rheotrophic and raised paleomires. Bull. Soc. Géol. Fr. 1991, 162, 283–298. [Google Scholar]
- Yang, Q.; Liu, D.; Huang, W.; Che, Y.; Hu, B.; Wei, Y. Coalbed Methane Geology and Resources Comprehensive Evaluation in Northwest China; Geological Publishing House: Beijing, China, 2005; pp. 77–151. (In Chinese) [Google Scholar]
Figure 1.
Geological map, sampling locations, and the generalized stratigraphic sequence of the southern Junggar Coalfield, NW China. (a) Geographic site of the Junggar Basin; (b) structural architecture of the Junggar basin; (c) locations of 30 coal samples and seven coalbed methane (CBM) blocks in the southern Junggar Coalfield; and (d) coal stratigraphy for geologic age, coal seams, and thickness of coal seams as well as coal sample siting. The target coal seam is No. 45 and all samples were collected from this coalbed.

Figure 2.
Pie charts illustrating coal mass compositions in the Middle Jurassic coals from the southern Junggar Coalfield. (a–g) represent the Wusu, Shihezi, Hutubi, Changji, Urumqi, Fukang, and Qitai CBM blocks, respectively. Each CBM block has a ~20 vol % of mineral matter content.
Figure 2.
Pie charts illustrating coal mass compositions in the Middle Jurassic coals from the southern Junggar Coalfield. (a–g) represent the Wusu, Shihezi, Hutubi, Changji, Urumqi, Fukang, and Qitai CBM blocks, respectively. Each CBM block has a ~20 vol % of mineral matter content.

Figure 3.
Photomicrographs of vitrinite and inertinite, polished surface, oil immersion, and reflected light. (a) Sample CL1. Telinite (T) and collotelinite (CT) have a parallel distribution and are in transformation. Micrinite (Mi) fills in the telinite cellular cavity. (b) Sample QB2. The woody structure is preserved and the cell wall is highly swollen in the lentoid telinite (T). Clay is widely distributed within telinite (T). (c) Sample CL2. Collotelinite (CT) with a uniform structure is broken in bulk. Telinite (T) or clay (Cl) exists between bulks. Fissures are distributed in a disorderly manner within collotelinite (CT). (d) Sample WS2. Vitrodetrinite (VD) is tightly packed, with an epigranular distribution. Collodetrinite (CD) and some inertodetrinite (ID) appear between granules. (e) Sample UT1. The leaf structure is acutely destructed and cell wall is rod-like in the lentoid semifusinite (SF). Clay fills the cellular cavity. (f) Sample QH2. The woody structure is preserved and the cell wall is mildly swollen in the lentoid semifusinite (SF). Enormous pores exist in semifusinite (SF). The cellular cavity is neatly arranged and reveals annual rings. (g) Sample WQ1. Infrequently, semifusinite (SF) with rings and massive cutinite (Cu) with bands are found. Telinite (T) and collotelinite (CT) have a parallel distribution. (h) Sample HX1. Telinite (T) and collotelinite (CT) are banded and found in the transformation. Massive fusinite (Fu) and semifusinite (SF) was found between them. The length of fusinite (Fu) is ~150 μm and its width is ~75 μm. (I) Sample CL4. Pyrite (Py) framboids exist in bulk between telinite (T) and vitrodetrinite (VD). The total length of pyrite (Py) is ~200 μm and its width is ~150 μm.

Figure 4.
Photomicrographs of representative liptinite with fluorescence-inducing blue light in the Middle Jurassic coals from the southern Junggar Coalfield. (a) Sample CL4. Cutinite (Cu) has a parallel distribution within collinite (C). Microsporophyte (MiS), liptodetrinite (LD), and sparse flourinite (Fl) exist. (b) Sample CT1. Macrosporinite (MaS), microsporophyte (MiS), and liptodetrinite (LD) have a parallel distribution. The fluorescent color of LD turns a sepia color. (c) Sample WQ1. Barkinite (Ba) is distributed with lenticel, with a length of ~400 μm and a width of ~125 μm. Flourinite (Fl) has a relatively centralized structure and liptodetrinite (LD) presents with a promiscuous structure. (d) Sample WQ1. Barkinite (Ba) is distributed within band cutinite (Cu). Liptodetrinite (LD) originating from Ba is distributed sporadically. (e) Sample WQ2. Cutinite (Cu) has a parallel distribution within collinite (C). Resinite (Re) has globular shape with a diameter of ~100 μm and part of it shows irregular graininess; (f) Sample HX1. Lamalginite (La), microsporophyte (MiS), and liptodetrinite (LD) have a parallel distribution within collinite (C). La presents in an elliptical structure with a length of ~220 μm and a width of ~120 μm. (g) Sample UT1. Fluorinite (Fl) fills the cellular cavity. (h) Sample CL1. Exsudatinite (Ex) is distributed irregularly. The fluorescence in pores and fissures comes from gelatin (J).

Figure 5.
Triangular diagram illustrating peat-forming depositional environments of the southern Junggar Coalfield (base map modified from [19,49]). Based on maceral assemblages (a) the investigated samples basically derive from forest swamp with slightly oxic to anoxic conditions, with good tissue preservation. Based on coal mass compositions (b) the SJC samples were subjected to two moors. Two-thirds of the coals represented a wet moor with intermittent moderate to high flooding. One-third of the coals represent an oxic (dry) moor with sudden high flooding.

Figure 6.
Coal facies indices considering the pseudovitrinite for the selected samples from the southern Junggar coalfield. (a) A gelification index (GI) vs. tissue preservation index (TPI) plot (base map modified from [20]); (b) a ground water index (GWI) vs. vegetation index (VI) plot (base map modified from [52]).

Figure 7.
Lateral W–E variation of coal facies indices ((a) TPI, (b) GI, (c) VI, (d) GWI) within the coal seams of the southern Junggar Coalfield.
Figure 7.
Lateral W–E variation of coal facies indices ((a) TPI, (b) GI, (c) VI, (d) GWI) within the coal seams of the southern Junggar Coalfield.

Figure 8.
Photomicrographs of pore and fissure characteristic in the maceral group. (a–c) Sample QH1; (d) Sample CL1; (e) Sample CL2; (f) Sample QY2; (g) Sample SS1; (h) Sample HD1. T = telinite; SF = semifusinite; Fu = fusinite; CT = collotelinite; CD = collodetrinite; V = vitrinite; VD = vitrodetrinite; Po = pore; Fi = fissure; P =pyrite; Cl = clay.

Figure 9.
Coal facies and pore and fissure structures of the selected samples from the southern Junggar Coalfield. (a1,a2) average values of coal facies (1) samples; (b1,b2) average values of coal facies (2) samples; (c1,c2) average values of coal facies (3) samples; (d1,d2) average values of coal facies (4) samples.

Figure 10.
Microscopic characteristic of pore and fissure in the selected samples from the southern Junggar Coalfield. (a) Sample CL1 in coal facies (1); (b) Sample CL3 in coal facies (2); (c) Sample CL2 in coal facies (3); (d) Sample QY1 in coal facies (4).
Figure 10.
Microscopic characteristic of pore and fissure in the selected samples from the southern Junggar Coalfield. (a) Sample CL1 in coal facies (1); (b) Sample CL3 in coal facies (2); (c) Sample CL2 in coal facies (3); (d) Sample QY1 in coal facies (4).


Table 1.
Maceral compositions of Middle Jurassic coals in coal seam No. 45 from the southern Junggar Coalfield, NW China.
Table 1.
Maceral compositions of Middle Jurassic coals in coal seam No. 45 from the southern Junggar Coalfield, NW China.
| CBM Blocks | Sample No. | Vitrinite (vol %, mmf) | Inertinite (vol %, mmf) | Liptinite (vol %, mmf) | ||||||||||||
|---|---|---|---|---|---|---|---|---|---|---|---|---|---|---|---|---|
| T | CT | CD | CG | VD | Fu | SF | Mi | ID | Sp | Cu | Ba | Re | Fl | LD | ||
| Wusu | WQ1 | 18.6 | 11.4 | 4.4 | 2.8 | 12.3 | 4.1 | 4.9 | - | 1.2 | 2.1 | 31.7 | 2.8 | 0.3 | - | 3.4 |
| WQ2 | 14.9 | 17.1 | 8.6 | 1.3 | 20.9 | 1.2 | 1.7 | - | 0.7 | 1.8 | 24.6 | 2.4 | 1.5 | - | 3.3 | |
| WS1 | 17.7 | 20.6 | 10.5 | 2.7 | 36.4 | 1.5 | 2 | - | 0.5 | 1.8 | 3.2 | 0.4 | - | 2.7 | ||
| WS2 | 15.9 | 21.1 | 8.7 | 1.8 | 23.5 | 2.4 | 15 | - | 6.6 | 1.4 | 1.7 | 0.3 | 0.2 | 0.1 | 1.3 | |
| Shihezi | SS1 | 18.7 | 29.9 | 2.7 | 1.4 | 9.9 | 3.8 | 28.5 | - | 3.6 | 0.7 | - | - | 0.1 | - | 0.5 |
| SS2 | 16.9 | 35 | 3.4 | 2.3 | 7.6 | 5.7 | 21.3 | - | 4.7 | 1.2 | 0.2 | - | 0.2 | - | 1.5 | |
| Hutubi | HX1 | 17.2 | 6.3 | 3.0 | 1.6 | 21.6 | 2.4 | 38.7 | - | 3.5 | 2.2 | - | - | 0.2 | 0.2 | 3.1 |
| HX2 | 13.2 | 16.5 | 5.3 | 1.2 | 12 | 3.8 | 37.9 | - | 7.1 | 0.3 | 0.7 | - | 0.1 | 0.1 | 1.8 | |
| HD1 | 25.7 | 14.2 | 3.7 | 2.3 | 18.9 | 2.2 | 24.4 | 1.2 | 4.8 | 0.3 | - | - | 0.1 | 0.1 | 1.7 | |
| HD2 | 27.4 | 13.5 | 1.6 | 2.0 | 18.3 | 1.4 | 26.9 | 1.9 | 5.8 | 0.2 | 0.2 | - | 0.2 | 0.1 | 0.5 | |
| Changji | CL1 | 17.6 | 32 | 8.1 | 3.7 | 11.2 | 2.1 | 19.4 | 1.7 | 2.5 | 0.8 | - | - | - | 0.2 | 0.7 |
| CL2 | 24.2 | 17.5 | 5.7 | 2.4 | 17.5 | 1.8 | 24.3 | - | 3 | 1.5 | 1.2 | - | 0.1 | - | 0.8 | |
| CL3 | 41.4 | 16.7 | 6.9 | 4.0 | 29.1 | 0.5 | 1.2 | - | 0.2 | 2.4 | 6.7 | - | - | 0.2 | 1.0 | |
| CL4 | 40.1 | 3 | 7.6 | 2.4 | 25.5 | 2.6 | 3.3 | - | 2.1 | 4.3 | 7.9 | - | - | 0.3 | 0.9 | |
| CT1 | 28.6 | 2.7 | 4.5 | 1.6 | 15.6 | 3.7 | 30.2 | - | 5.3 | 3.1 | 0.2 | 2.4 | 0.2 | 0.1 | 1.8 | |
| CT2 | 24.9 | 1.2 | 2.6 | 3.4 | 24.7 | 4.0 | 29.3 | - | 6.7 | 1.5 | 0.1 | 0.2 | 0.2 | 1.2 | ||
| Urumqi | UT1 | 3.4 | 36 | 11.6 | 2.5 | 7.2 | 3.8 | 28.4 | 0.2 | 3.4 | 2.4 | - | - | 0.1 | - | 1.1 |
| UT2 | 12.6 | 41 | 7.1 | 0.7 | 8.7 | 2.6 | 19.1 | 0.3 | 5.3 | 1.4 | - | - | 0.2 | - | 1.0 | |
| UX1 | 27.5 | 12.1 | 2.4 | 5.4 | 44.8 | 0.3 | 1.3 | - | 0.7 | 1.8 | 2.4 | - | 0.1 | - | 1.2 | |
| Fukang | FF1 | 20.3 | 38.7 | 5.1 | 10.3 | 14.8 | - | 0.2 | - | 2.4 | 2.6 | 3.2 | 0.2 | 0.2 | - | 1.5 |
| FF2 | 25.4 | 14.1 | 4.3 | 6.4 | 38.9 | - | 2.4 | - | 0.5 | 2.7 | 3.5 | 0.3 | 0.1 | - | 1.2 | |
| FJ1 | 30.6 | 10.5 | 7.1 | 4.1 | 35 | 0.2 | 4.8 | - | 0.3 | 2.1 | 3.0 | 0.2 | 0.1 | - | 2.1 | |
| FJ2 | 24.3 | 26.1 | 11.4 | 5.6 | 20.2 | 1.7 | 2 | - | 0.5 | 1.7 | 3.6 | 0.2 | 0.2 | - | 2.5 | |
| FW1 | 21.6 | 39.7 | 11.2 | 3.7 | 27.3 | 1.0 | 1.8 | - | 0.7 | - | - | - | - | - | - | |
| Qitai | QH1 | 4.2 | 27.7 | 2.8 | 2.7 | 19.9 | 2.8 | 27 | - | 9.5 | - | 1.6 | - | - | - | 1.8 |
| QH2 | 2.6 | 44.8 | 5.6 | 2.0 | 11.7 | 5.4 | 22.6 | - | 4.8 | - | 0.5 | - | - | - | - | |
| QY1 | 3.1 | 50.6 | 4.0 | 1.7 | 12.3 | 3.3 | 23 | - | 2.0 | - | - | - | - | - | - | |
| QY2 | 5.8 | 36.7 | 8.4 | 1.0 | 12.7 | 5.0 | 25.6 | - | 3.6 | 0.3 | - | 0.1 | - | - | 0.5 | |
| QB1 | 16.5 | 32.6 | 7.0 | 1.4 | 13.5 | 4.3 | 16.9 | - | 5.8 | 0.9 | - | 0.1 | - | - | 1.0 | |
| QB2 | 10.4 | 27.3 | 4.4 | 2.6 | 20.7 | 3.0 | 27.7 | - | 2.7 | 0.7 | - | 0.2 | - | - | 0.3 | |
Notes: mmf = mineral matter-free basis; T = telinite; CT = collotelinite; CD = collodetrinite; CG = corpogelinite; VD = vitrodetrinite; Fu = fusinite; SF = semifusinite; Mi = micrinite; ID = inertodetrinite; Sp = sporinite; Cu = cutinite; Ba = barkinite; Re = resinite; Fl = flourinite; LD = liptodetrinite.
Table 2.
The coal mass compositions, maximum reflectance of vitrinite and coal facies indices (tissue preservation index (TPI), gelification index (GI), vegetation index (VI), and ground water index (GWI)).
Table 2.
The coal mass compositions, maximum reflectance of vitrinite and coal facies indices (tissue preservation index (TPI), gelification index (GI), vegetation index (VI), and ground water index (GWI)).
| Sample No. | Lithotype | VRmax (%) | Coal Mass Compositions (vol %) | Coal Facies Indices | Coal Facies Type | |||||||
|---|---|---|---|---|---|---|---|---|---|---|---|---|
| V | I | L | P | Om | TPI | GI | VI | GWI | ||||
| WQ1 | Dull | 0.33 | 38.4 | 5.9 | 29.9 | 0.7 | 25.2 | 1.9 | 4.8 | 0.8 | 1.4 | 1 |
| WQ2 | Dull | 0.32 | 50.7 | 2.9 | 27.1 | 0.5 | 18.7 | 1.1 | 17.3 | 0.6 | 1.1 | 1 |
| WS1 | Semi-bright | 0.45 | 75.1 | 3.4 | 6.9 | 0.3 | 14.3 | 0.8 | 21.8 | 0.8 | 1.1 | 1 |
| WS2 | Semi-bright | 0.42 | 59.5 | 15.1 | 3.9 | 0.3 | 21.1 | 1.3 | 2.6 | 1.3 | 1 | 1 |
| SS1 | Semi-bright | 0.62 | 65.9 | 18.5 | 1.3 | 1.5 | 12.8 | 4.6 | 1.6 | 4.7 | 0.4 | 4 |
| SS2 | Semi-bright | 0.58 | 60.6 | 19.4 | 2.6 | 1.2 | 16.2 | 4.4 | 1.9 | 4.4 | 0.5 | 4 |
| HX1 | Semi-bright | 0.63 | 62.1 | 14.9 | 4.7 | 0.2 | 18.2 | 2.2 | 1 | 2 | 1.5 | 2 |
| HX2 | Semi-bright | 0.65 | 47.6 | 18.6 | 2 | 0.2 | 31.5 | 2.8 | 0.9 | 2.7 | 1.6 | 2 |
| HD1 | Semi-bright | 0.65 | 62.8 | 12.1 | 1.7 | 0.1 | 23.3 | 2.2 | 2 | 2.3 | 1.1 | 2 |
| HD2 | Semi-bright | 0.63 | 67.5 | 12.7 | 1.0 | 0.2 | 18.6 | 2.5 | 1.7 | 2.7 | 0.9 | 2 |
| CL1 | Semi-dull | 0.63 | 77.5 | 9.6 | 1.5 | 0.4 | 11.1 | 2.8 | 2.8 | 3.2 | 0.4 | 3 |
| CL2 | Semi-bright | 0.49 | 40.5 | 10.2 | 3 | 0.5 | 14.8 | 2.4 | 1.9 | 2.4 | 0.6 | 3 |
| CL3 | Semi-dull | 0.39 | 75 | 1.5 | 7.9 | 2.1 | 21.4 | 1.5 | 51.6 | 1.4 | 1 | 2 |
| CL4 | Semi-dull | 0.46 | 51.7 | 5.3 | 8.8 | 4.0 | 30.2 | 1.3 | 9.6 | 1.1 | 1.5 | 1 |
| CT1 | Semi-dull | 0.44 | 50.8 | 12.1 | 5.3 | 0.4 | 31.9 | 2.4 | 1.3 | 2.2 | 1.7 | 2 |
| CT2 | Semi-dull | 0.41 | 46.2 | 13.1 | 2 | 0.5 | 38.2 | 1.6 | 1.3 | 1.7 | 3 | 2 |
| UT1 | Semi-dull | 0.6 | 41.2 | 18.9 | 2.2 | 0.7 | 37 | 2.9 | 1.6 | 2.9 | 1.3 | 2 |
| UT2 | Semi-dull | 0.64 | 47.7 | 16.9 | 1.7 | 0.5 | 33.1 | 3.5 | 2.4 | 3.2 | 0.9 | 2 |
| UX1 | Semi-bright | 0.51 | 72.4 | 1.2 | 4.3 | 10.6 | 11.4 | 0.8 | 39 | 0.9 | 1.8 | 1 |
| FF1 | Semi-bright | 0.53 | 72.9 | 2.1 | 6.3 | 4.3 | 14.0 | 1.8 | 34.2 | 2.4 | 0.7 | 3 |
| FF2 | Semi-bright | 0.46 | 67.2 | 2.3 | 5.9 | 3.6 | 21.0 | 0.8 | 30.5 | 0.9 | 1.8 | 1 |
| FJ1 | Semi-bright | 0.53 | 69.8 | 4.2 | 6 | 2.2 | 17.8 | 1 | 16.2 | 1 | 1.3 | 1 |
| FJ2 | Semi-bright | 0.51 | 80.8 | 2.9 | 7.5 | 1.3 | 7.5 | 1.4 | 20.8 | 1.5 | 0.6 | 3 |
| FW1 | Semi-bright | 0.51 | 86.8 | 2.7 | - | 0.2 | 9.2 | 1.5 | 29.4 | 1.7 | 0.6 | 3 |
| QH1 | Dull | 0.49 | 51.9 | 27.8 | 2.8 | 0.1 | 17.5 | 1.8 | 1.2 | 1.8 | 1 | 3 |
| QH2 | Semi-bright | 0.49 | 72.5 | 20.7 | 0.5 | 0.1 | 5.3 | 3.1 | 1.9 | 3.4 | 0.3 | 3 |
| QY1 | Semi-dull | 0.4 | 68.8 | 11.4 | - | 1.2 | 18.6 | 4 | 2.3 | 4.5 | 0.6 | 4 |
| QY2 | Dull | 0.46 | 62.8 | 18.5 | 1 | 0.2 | 17.5 | 2.8 | 1.7 | 2.9 | 0.6 | 3 |
| QB1 | Semi-dull | 0.41 | 64 | 13.0 | 1.6 | 0.8 | 20.6 | 2.5 | 2.3 | 2.5 | 0.6 | 3 |
| QB2 | Dull | 0.51 | 71.5 | 8.3 | 1 | 0.3 | 18.9 | 2.3 | 1.4 | 2.5 | 0.7 | 3 |
| Average | - | 0.51 | 62.1 | 10.9 | 5.4 | 1.3 | 19.9 | 2.2 | 10.3 | 2.2 | 1.1 | - |
Note: VRmax = maximum reflectance of vitrinite; V = vitrinite; I = inertinite; L = liptinite; P = pyrite; Om = other minerals; (1) = lower delta plain marsh; (2) = lower delta plain fen; (3) = delta plain wet forest swamp; and (4) = piedmont plain moor.
© 2018 by the authors. Licensee MDPI, Basel, Switzerland. This article is an open access article distributed under the terms and conditions of the Creative Commons Attribution (CC BY) license (http://creativecommons.org/licenses/by/4.0/).
Share and Cite
MDPI and ACS Style
Zhou, S.; Liu, D.; Cai, Y.; Karpyn, Z.; Yao, Y. Petrographic Controls on Pore and Fissure Characteristics of Coals from the Southern Junggar Coalfield, Northwest China. Energies 2018, 11, 1556. https://doi.org/10.3390/en11061556
AMA Style
Zhou S, Liu D, Cai Y, Karpyn Z, Yao Y. Petrographic Controls on Pore and Fissure Characteristics of Coals from the Southern Junggar Coalfield, Northwest China. Energies. 2018; 11(6):1556. https://doi.org/10.3390/en11061556
Chicago/Turabian StyleZhou, Sandong, Dameng Liu, Yidong Cai, Zuleima Karpyn, and Yanbin Yao. 2018. "Petrographic Controls on Pore and Fissure Characteristics of Coals from the Southern Junggar Coalfield, Northwest China" Energies 11, no. 6: 1556. https://doi.org/10.3390/en11061556
Note that from the first issue of 2016, this journal uses article numbers instead of page numbers. See further details here.