Approaches for Safety Analysis of Gas-Pipeline Functionality in Terms of Failure Occurrence: A Case Study

Faculty of Civil and Environmental Engineering, Rzeszow University of Technology, 35-959 Rzeszow, Poland
*
Author to whom correspondence should be addressed.
Energies 2018, 11(6), 1589; https://doi.org/10.3390/en11061589
Submission received: 24 May 2018
/
Revised: 9 June 2018
/
Accepted: 15 June 2018
/
Published: 17 June 2018
(This article belongs to the Section D: Energy Storage and Application)
Abstract
:The development of appropriate assessment methods of gas-pipeline functionality contributes to the reduction of failure consequences and helps engineers to make the right decisions as to the optimal solution choice for technical facilities, as well as provides procedures to protect their users and the surrounding environment. This paper presents methods for the assessment of gas network operation. Pipe failure data were collected from a gas distribution network. A statistical analysis of the failure of gas networks was made. An attempt was made to isolate seasonal and accidental fluctuations in the tested failure stream. The Poisson distribution was proposed as a model of failure distribution of gas networks. The conducted analysis allowed us to propose the forecasting method of acceptable failure consequences using the homogeneous Markov chain. The obtained results are valuable for supporting the management of urban gas networks, mainly in terms of the strategic modernization plans and the rehabilitation techniques.
1. Introduction
The operation of technical systems should be reliable in terms of functionality and safety [1,2]. This also applies to gas systems, the unreliability of which can cause not only breaks in the supply of gas to users, but also a serious threat to the environment and people’s lives. The basic element of a natural gas distribution system is the gas pipeline, treated as a repairable element (renewable) [3]. The process of failures in gas pipelines is random. Damage or failure can be called a partial or full loss of such properties of a technical system element that significantly reduce the system’s efficiency or may pose a threat to environmental safety if inoperative [4,5,6].
Natural gas has become a very popular source of energy in recent times; the amount of gas distributed is systematically increasing, and thus as is the length of gas networks. The introduced environmental protection regulations stimulate the development of heating and power engineering based on natural gas. Natural gas is often described as ecologically clean or environmentally friendly [7]. As a result of controlled natural gas combustion, there is practically no dust emission, and the gas emissions in relation to the units of chemical energy of fuel are much lower compared to those of solid and liquid fuels [8,9,10].
General technical progress and civilization development have caused the requirements for technical systems to increase [11,12,13,14,15,16]. The construction of gas pipelines and the associated facilities is associated with deep interference in the environment and creates many threats for it. The escaping of natural gas into the atmosphere during failures or repairs or in leaking gas networks poses the risk of explosion and fire [17,18,19,20]. In view of these facts, the recipients’ requirements regarding reliability of operation and reliability of communal system security is increasing [21,22,23,24,25]. The occurrence of losses caused by interruptions in gas supply or supplying gas with reduced parameters will cause protests of users. In extreme cases, it may result in the loss of both individual and industrial customers, particularly as the offer of alternative energy sources becomes cheaper and more available. Methane emission, which accompanies the majority of gas network failures, poses a threat to the environment and is often the cause of fatal accidents caused by fire and gas explosions. Victims may be both people accidentally present and gas-plant employees. Losses may concern both the lack of revenues for undelivered gas and possible compensation for recipients or potential victims of failures. Losses incur expenses and are associated with costs, thus affecting the reduction in profit. For this reason, gas network operators should be interested in a possibly accurate risk assessment [26].
Examples of construction disasters, fires, and gas outbursts caused by the failure of external networks prove that natural gas, despite its advantages, can be very dangerous. It can be seen that the majority of documented accidents during the operation of gas networks are the result of a human being, for example, as a result of mechanical damage. Introducing new methods for monitoring and automation, security methods, or technical rehabilitation of gas networks increases the safety of gas network operation to a large extent. The development of appropriate methods for estimating failures during the operation of technical systems should be a priority activity; this will contribute to reducing the possible consequences of accidents, as well as help engineers, designers, and public officials in making decisions about the choice of methods for securing users. A very crucial role in the procedures of failure analysis involves constituting the right failure record as well as opinions and assessments of experts and users. The proposed approach can define the safety level of gas supply systems.
Everyday operation of natural gas supply systems is connected with the occurrence of fire and explosion hazards. Many years of statistics for failures, explosions, and fires compiled by the gas service and organizational units of the State Fire Service indicate that despite the continuous increase in the level of safety of natural gas supply systems and a number of activities undertaken in this area, failures are still being reported, often posing a serious threat to the external and internal environments of people, as well as posing a threat to human health and life [27,28,29,30,31,32]. The most dangerous, particularly for natural gas users, is the escaping and spreading of natural gas through leaks in the distribution gas pipelines of urban gas supply subsystems. It is also important to mention the numerous methods for detecting leaks in distribution networks; the implementation of effective strategies to manage leaks is an essential goal for utilities involved with gas supply so as to reduce gas losses in urban distribution networks using vibroacoustic measurements [33] and acoustic emission measurements [34,35]. The method proposed in [36] is suitable to be implemented on an actual measuring device featuring rather affordable electronics for achieving automatic leak detection and a reliable monitoring tool for the piping systems. Such approaches to the early detection of leaks were proven to be effective for gas pipelines as well to achieve improved safety [37]. The operation of gas networks should take into account the minimization of gas losses as well as operational and safety reliability. The procedures of correct gas network design, construction, and operation should be completed with detailed subsystem failure analyses, which are a base on which to estimate the subsystem reliability in an appropriate way.
Fires, which may be a consequence of releasing natural gas into the atmosphere, each time pose a threat to the environment. Consequences of failures that result in the releasing and spreading of natural gas depend on the failure type, nature, and causes, as well as on the efficiency of failure removal. The random nature of failure makes research in this area complex, and it is based primarily on the analysis of operational data. This gives the opportunity to determine the probability of failure, which is the possibility of determining the probability of failure consequences. The framework of our research consists of the following sections: (a) analysis of gas network failure for the urban agglomeration in the southeastern part of Poland; (b) research on the failure stream in the gas network, including separation of seasonal and random fluctuations; (c) determination of the failure stream for distribution gas networks using the Poisson distribution; and (d) on the basis of the previously performed analysis in the aforementioned points, forecasting the method of acceptable failure consequences using the homogeneous Markov chain. The specific goals intended to be attained focus on defining the probability of failure, the possibility of determining the probability of failure consequences. So as to perform these actions, the analysis of a typical gas network is presented in this work, the aim of which was to eliminate failure or serious pipeline incidents. The aim of the work was also the possibility of forecasting failures so as to minimize their possible impact, which is very important for safety reasons for users of natural gas supply subsystems. For this purpose, the homogeneous Markov chain simulation method was implemented, on the basis of the previously performed analysis of the gas network failure. A gas network for the urban agglomeration in the southeastern part of Poland demonstrates the chosen approaches.
2. Materials
Analysis of Gas Network Failure for the Urban Agglomeration in the Southeastern Part of Poland
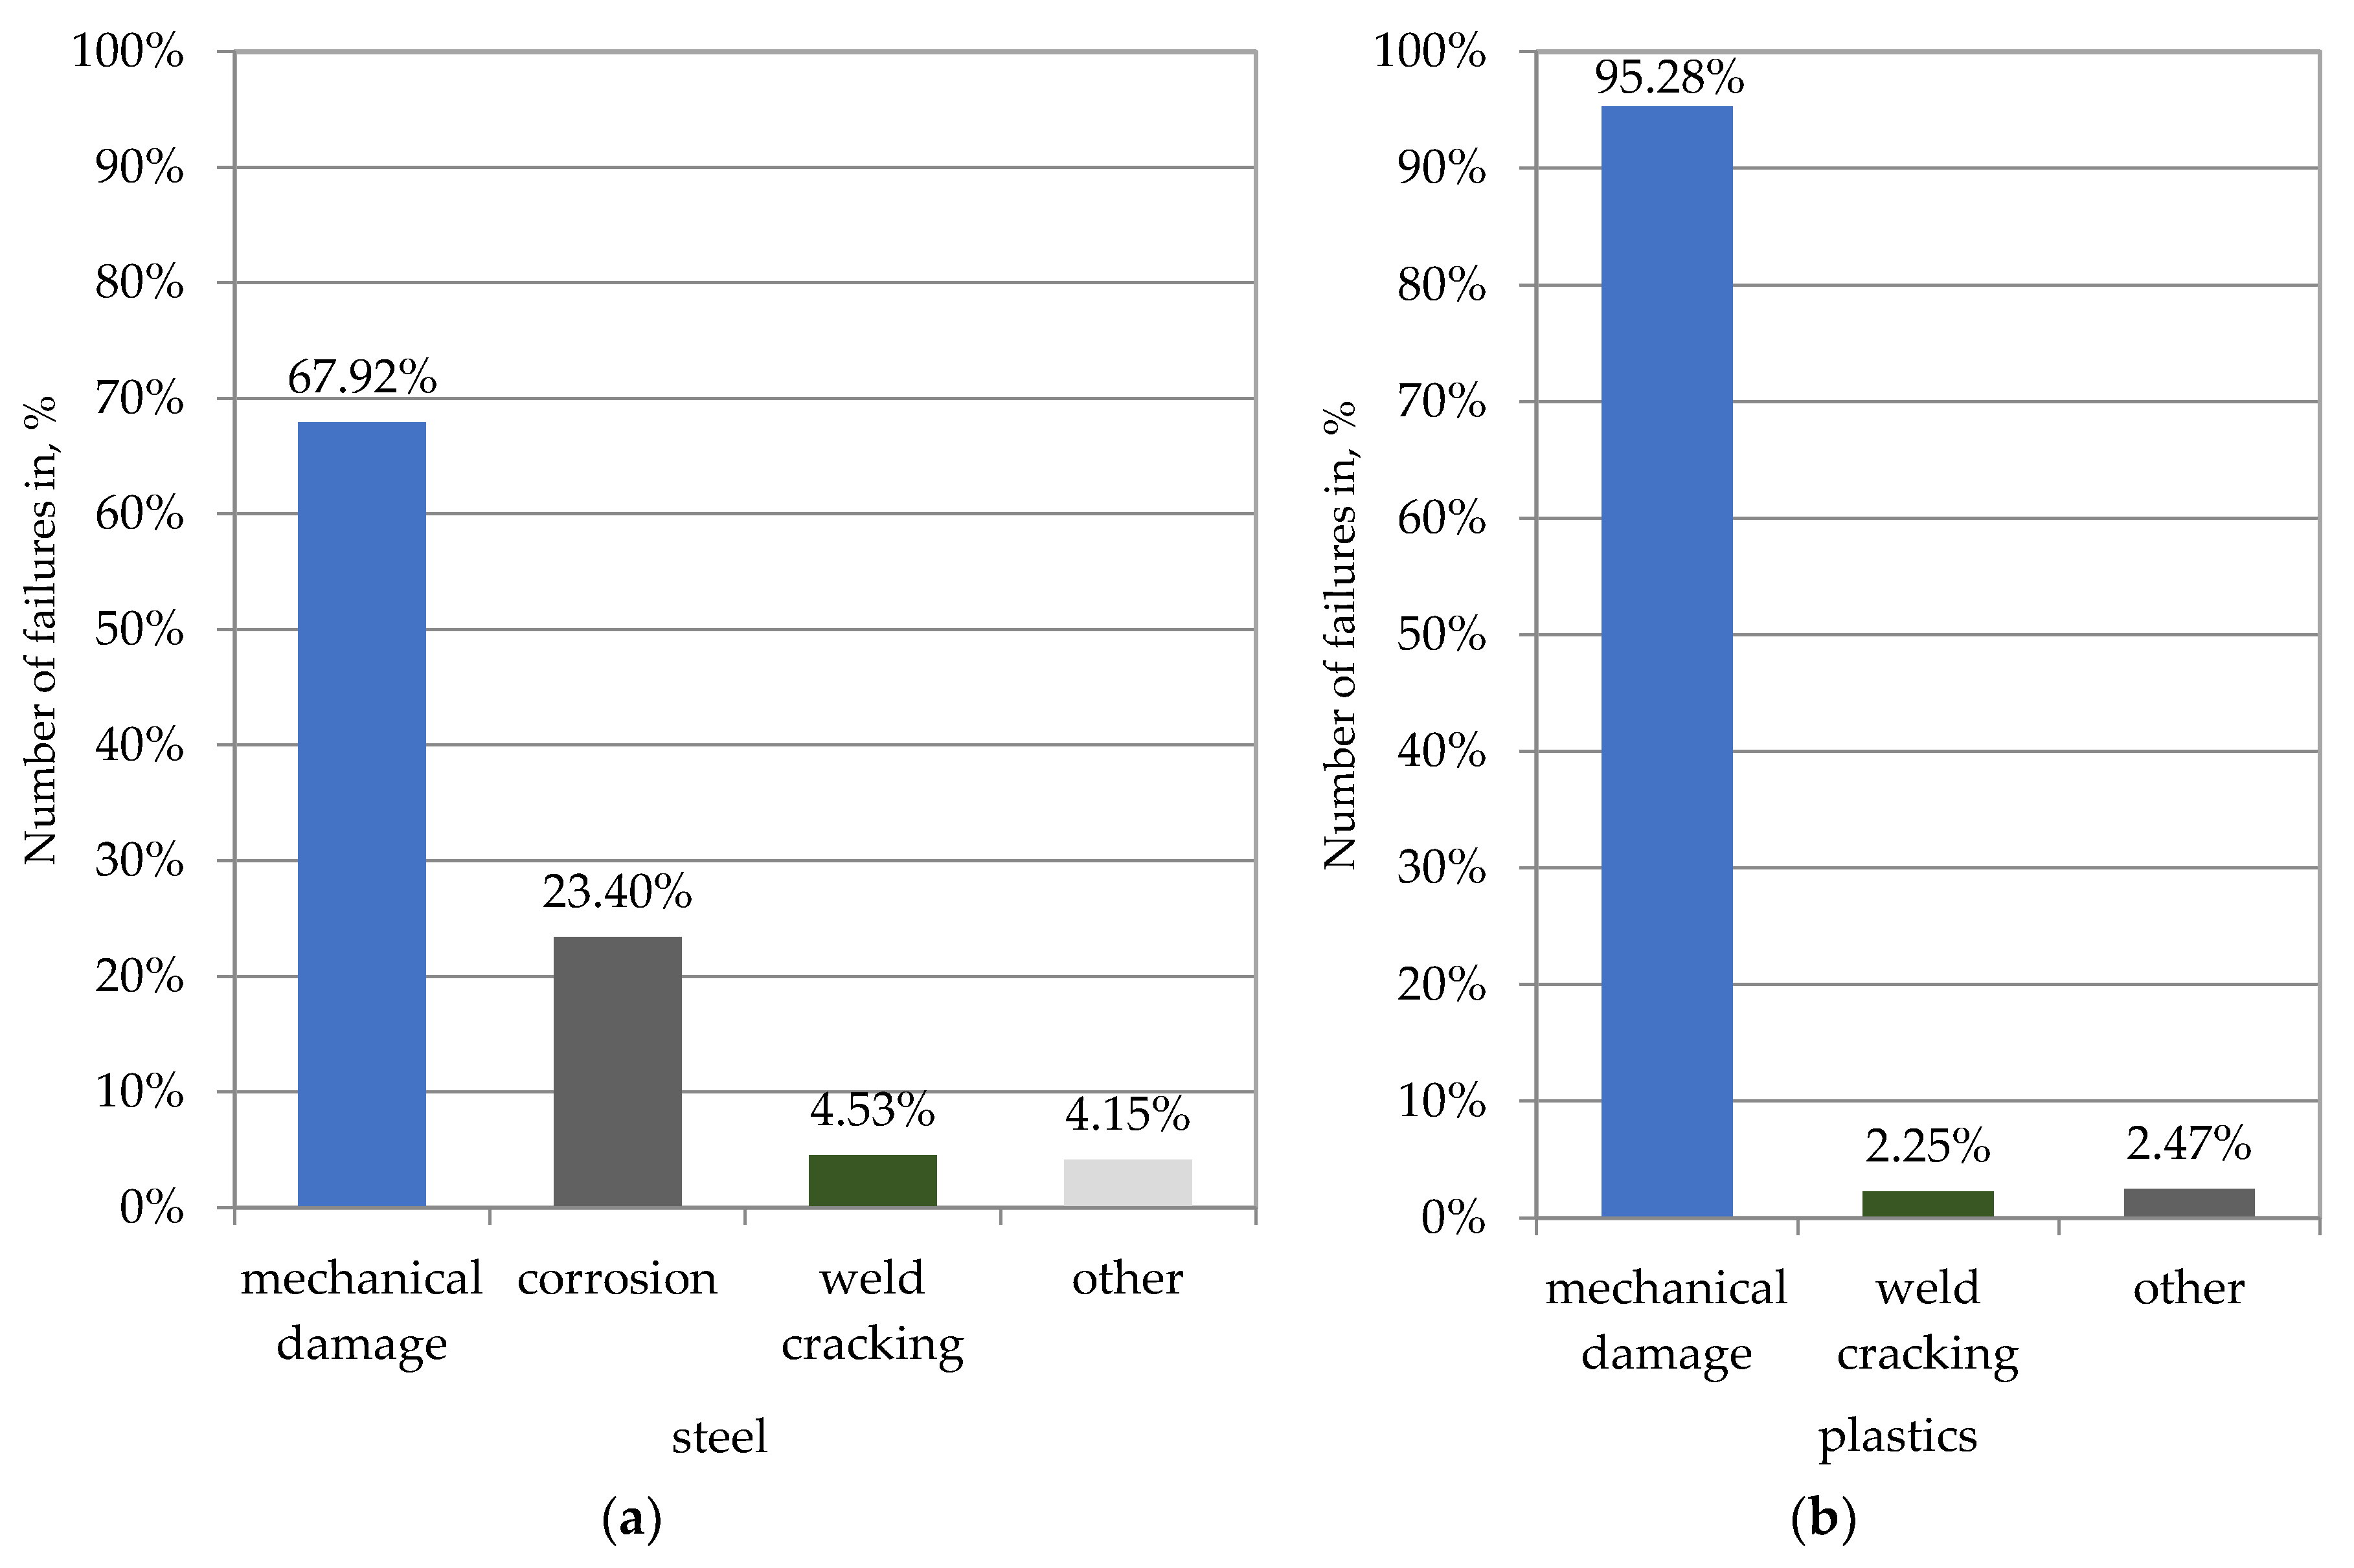
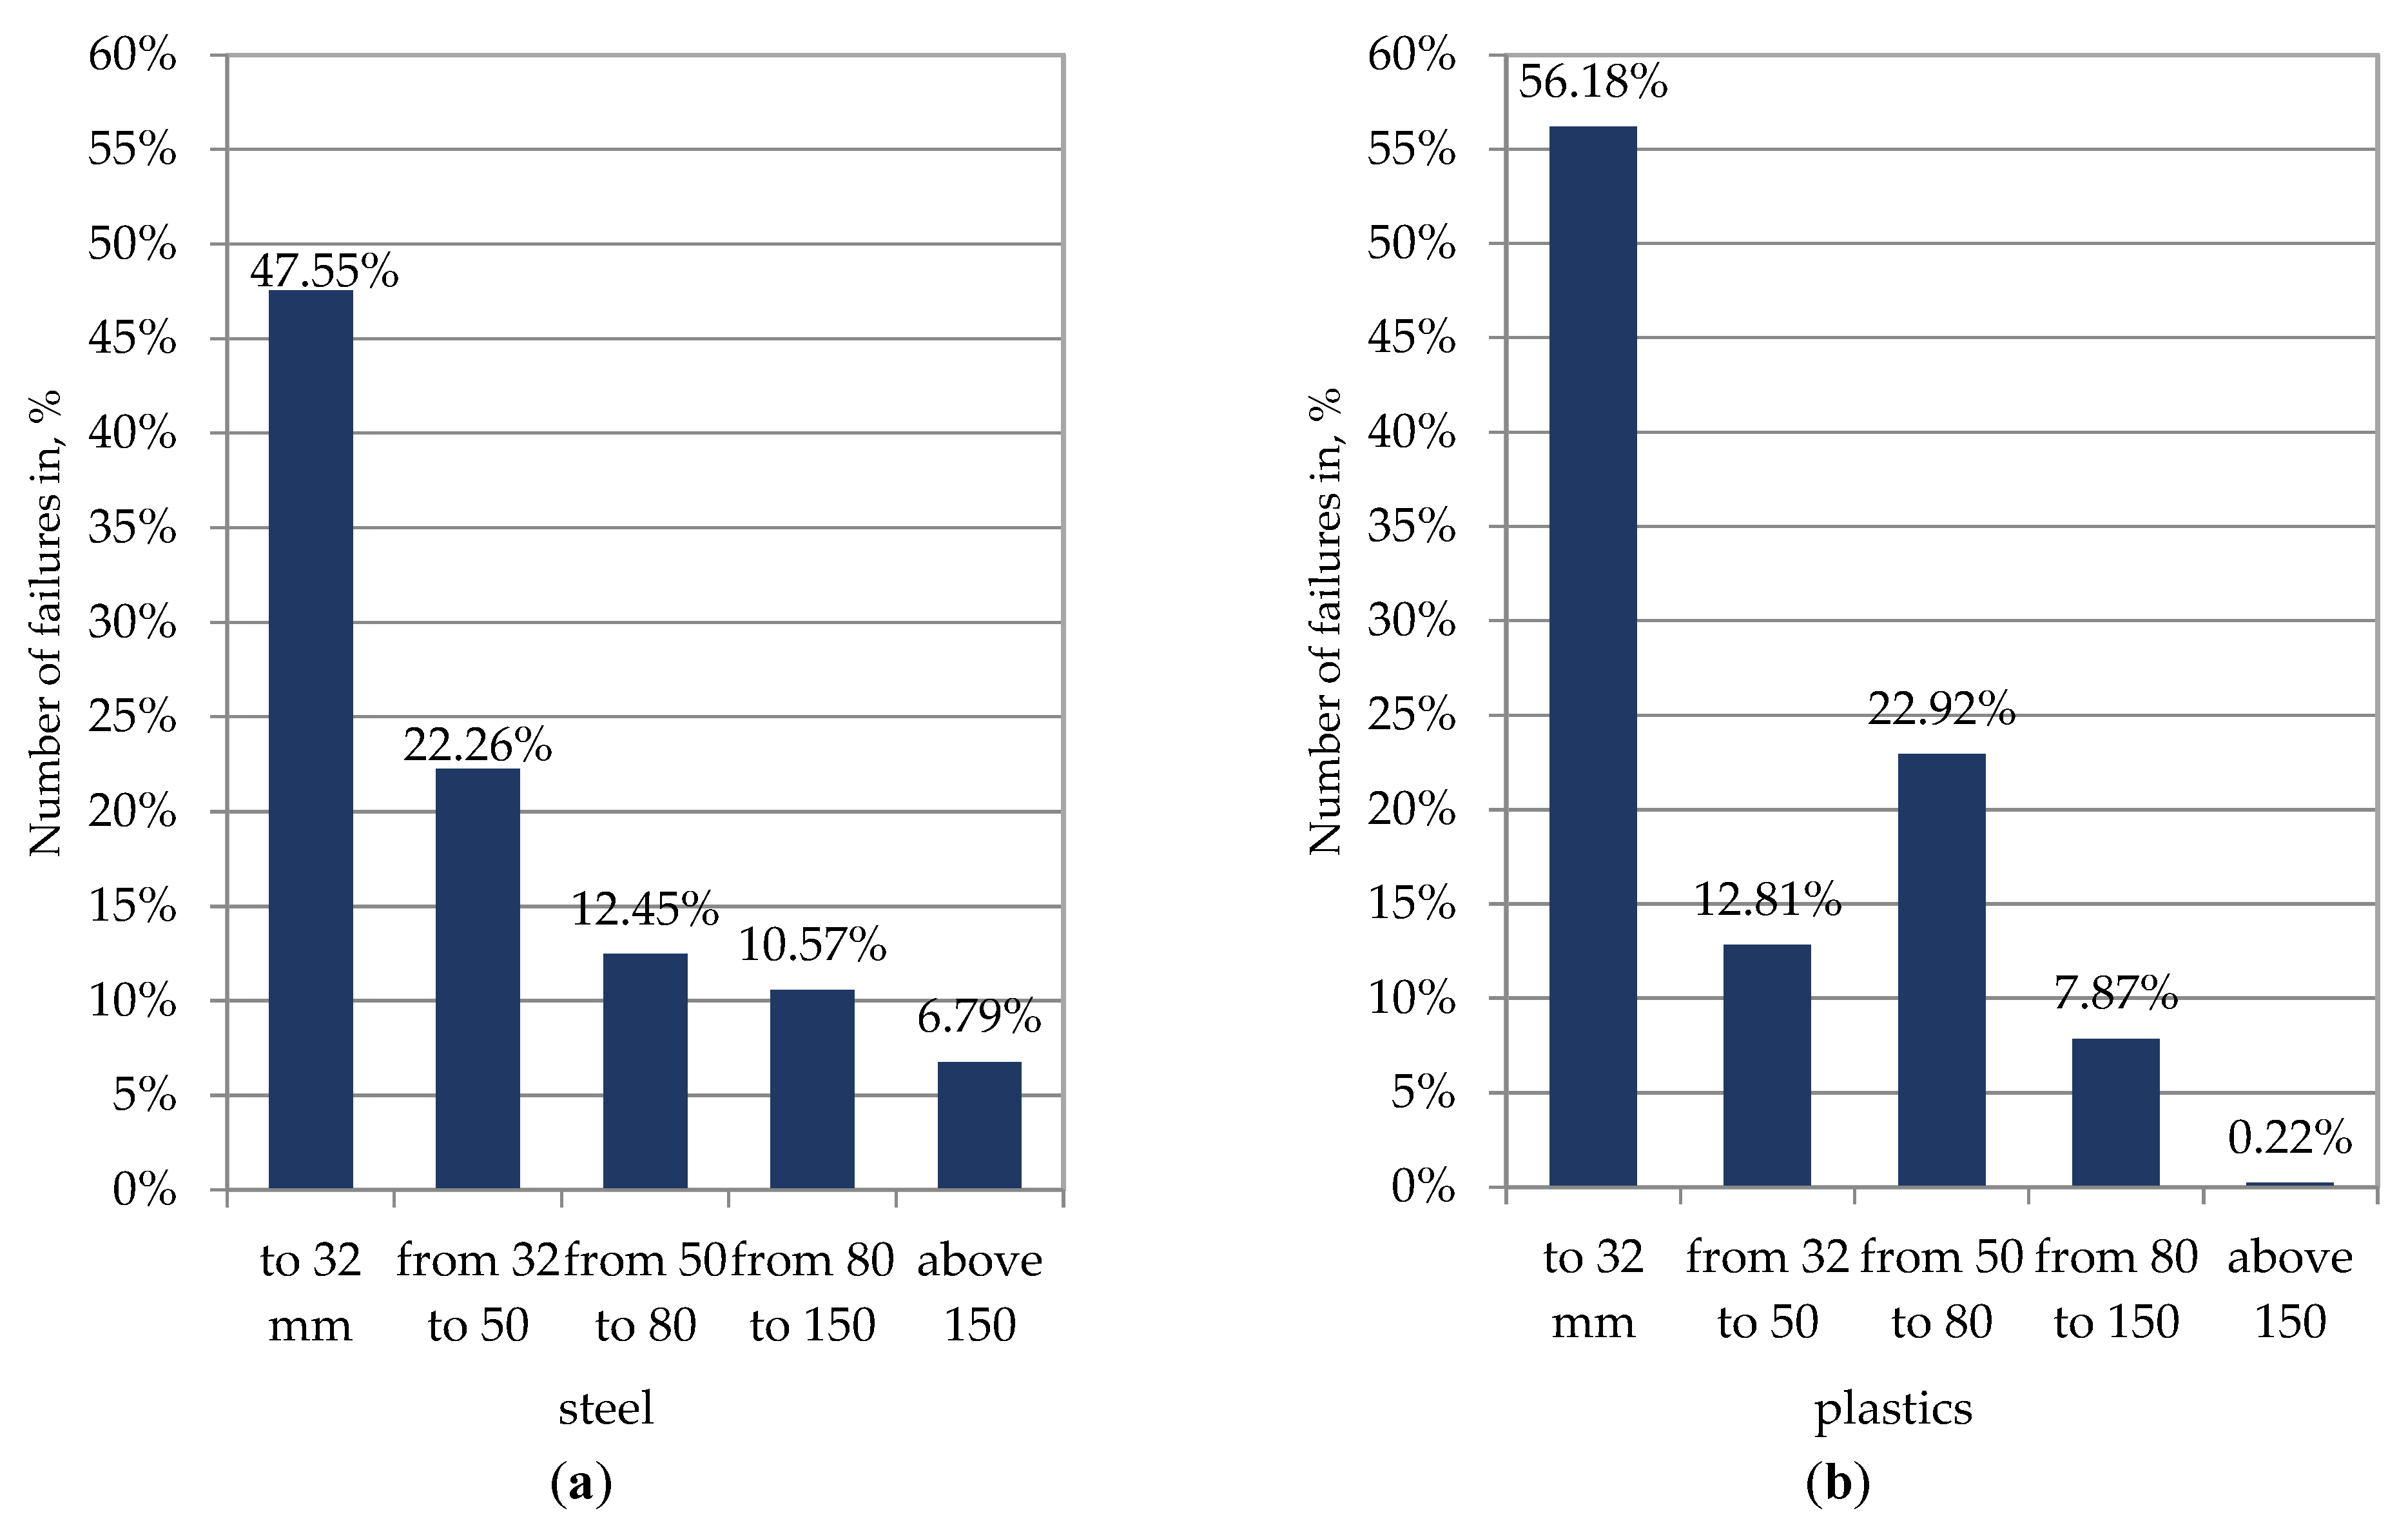
The analysis was based on data obtained from one of the gas companies in a Polish city. The failure rate (number of failures) of the low- and medium-pressure networks, depending on the causes of their occurrences, is presented in Figure 1, and the failure rate of the network according to diameters is shown in Figure 2. Similar values were obtained for both the low- and medium-pressure networks, depending on the causes of failure occurrences. In the presented analysis, mechanical damage was regarded as a break in the continuity of the material caused by the impact of another object. In the article, damages caused as a result of human activity were considered as mechanical damages, for example, improper repairs or construction of gas pipelines; intentional damage (sabotage); damage during construction of other infrastructure such as water supply or road excavations; inaccurate and/or out-of-date spatial development plans; and damage caused as a result of environmental impact, such as from landslides.
The failure rate was calculated according to Equation (1):
where k is the number of failures per year, L is the average network length during the year, and λavg is the average failure rate for 4 years of network operation (km−1·a−1). The results of calculations are presented in Figure 3.
The analysis shows that the main causes of failures were mechanical, both in the steel pipelines and the gas pipelines made of plastic such as polyethylene (PE). Failure analysis confirmed their random nature.
The average values of the indexes for gas pipes are the following:
- Failure rate for pipelines made of steel: λsteel = 0.075 km−1·a−1.
- Failure rate for pipelines made of plastics: λp = 0.18 km−1·a−1.
The values of the failure rate for gas pipelines correspond to tendencies in other systems [20]. In the future, the conducted research will help in proposing criteria values, which will help for comparing different systems.
3. Research of the Failure Stream in the Gas Network
3.1. Separation of Seasonal Fluctuations
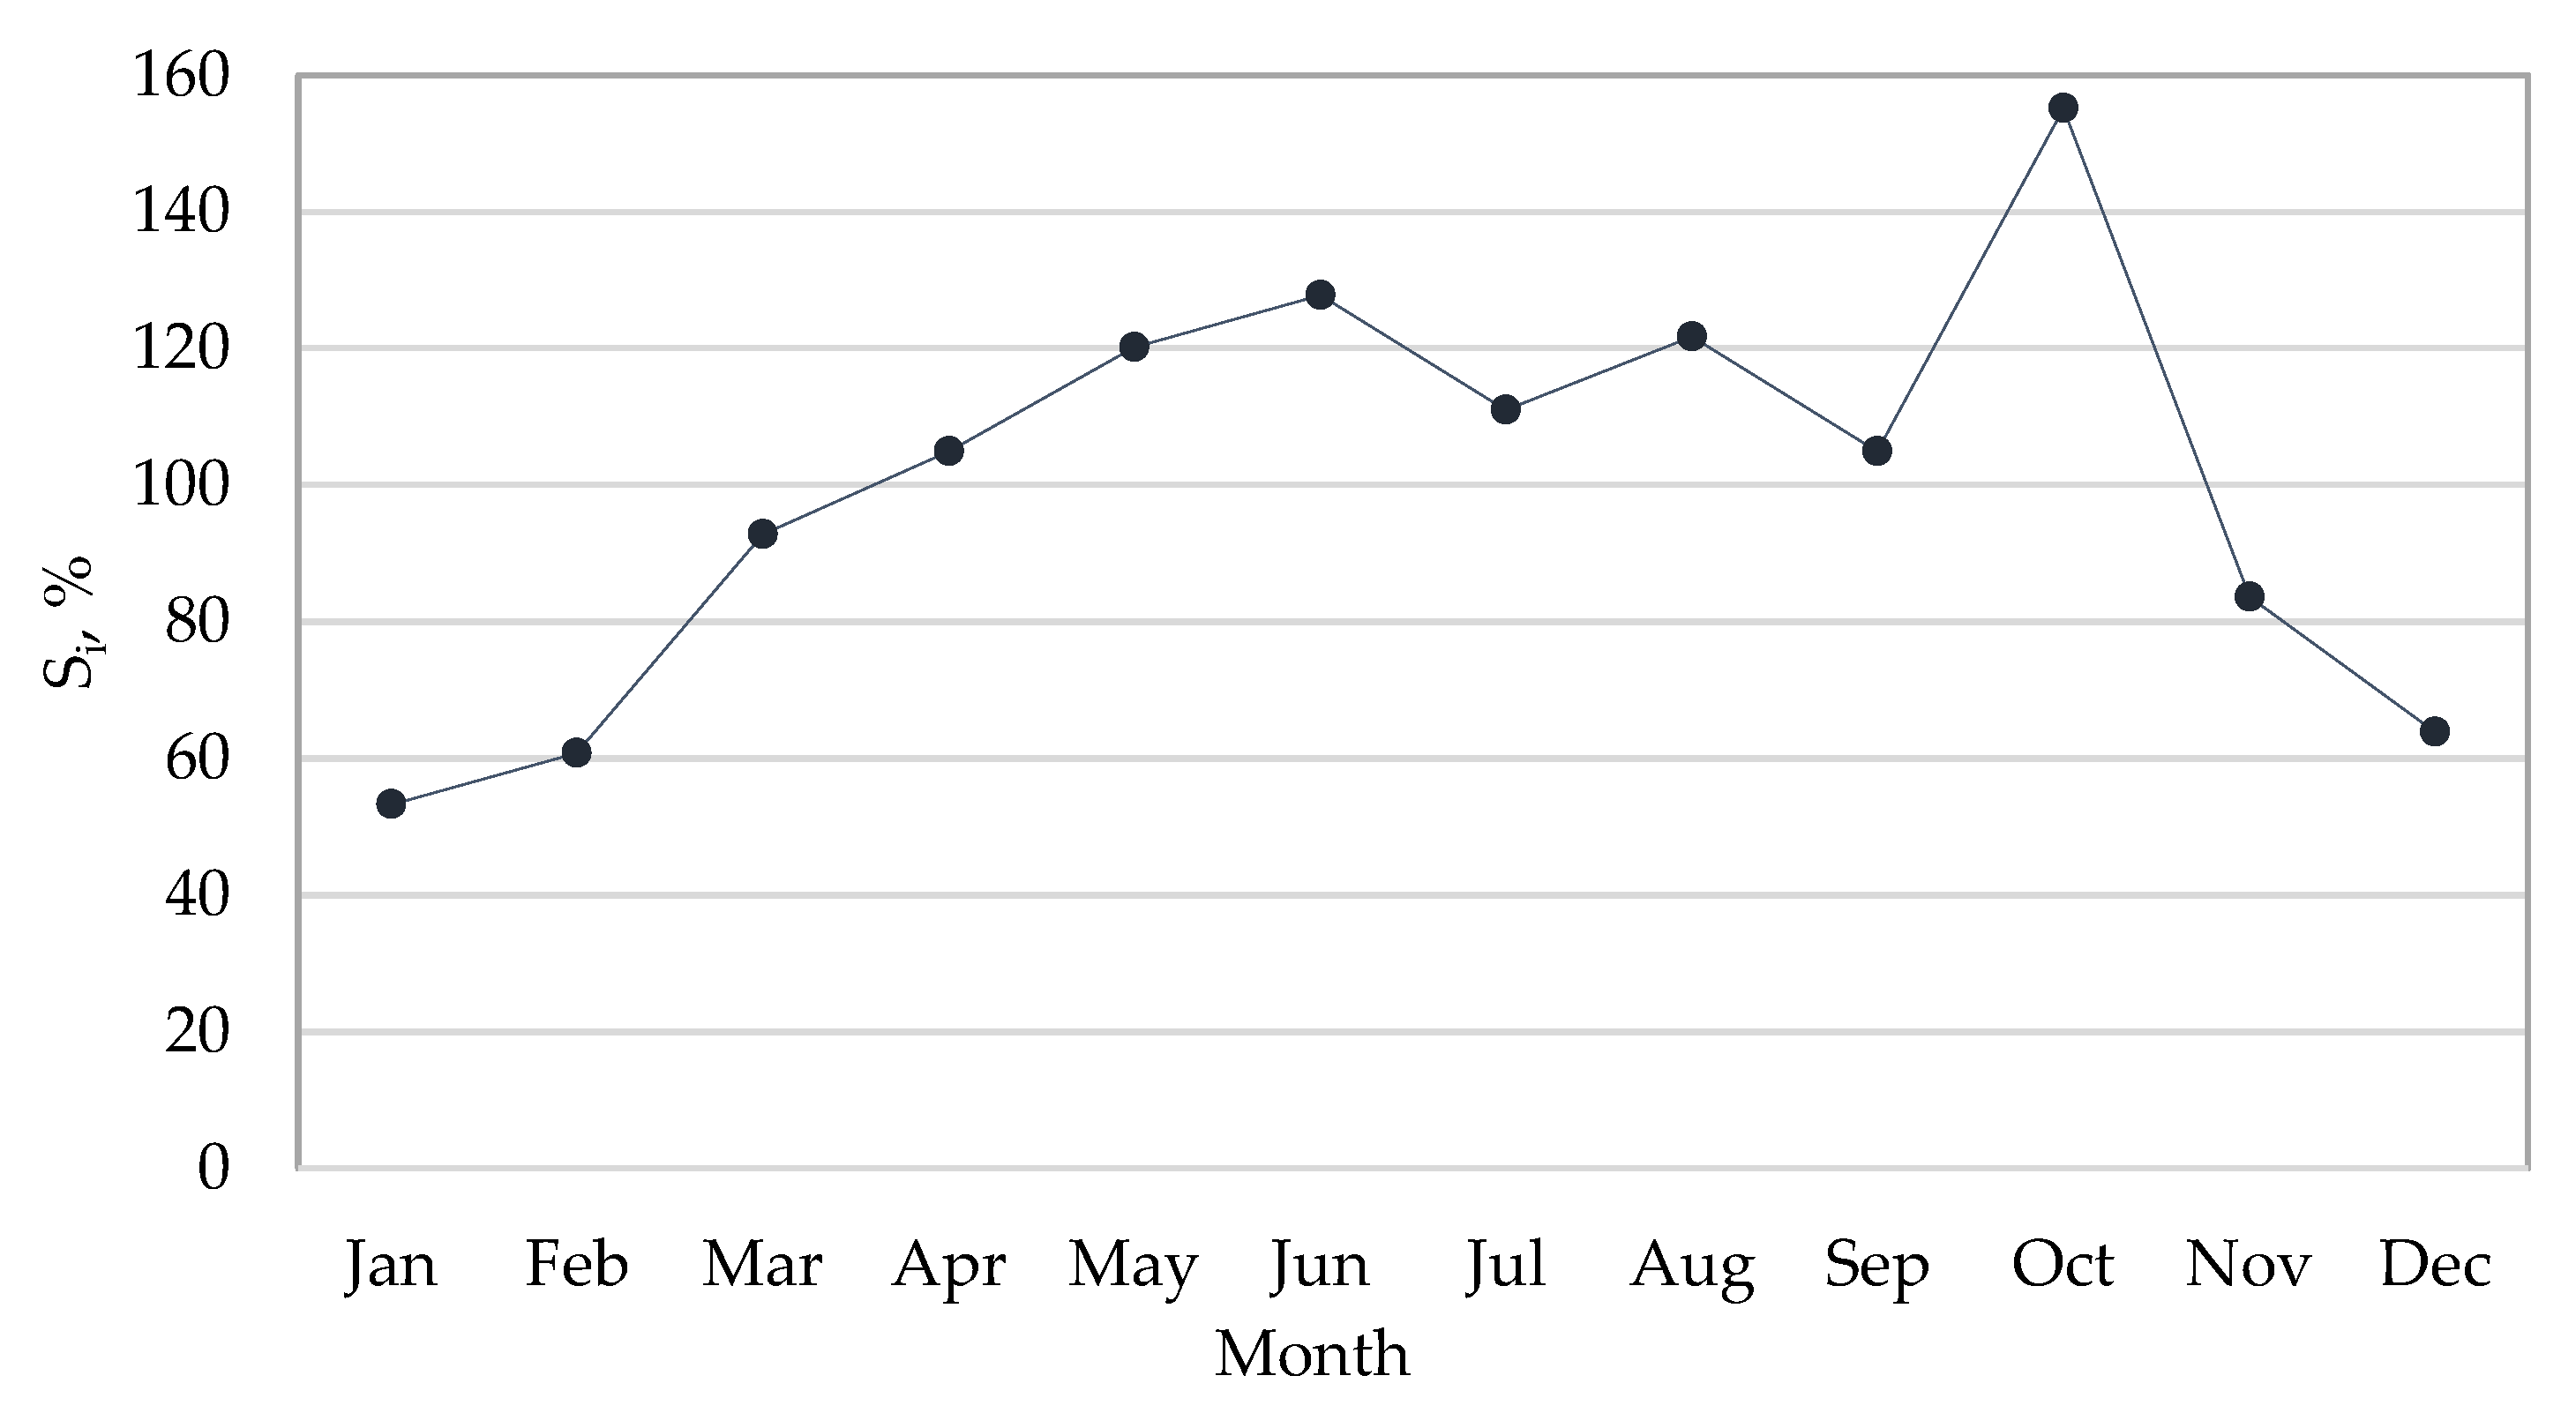
Many phenomena are characterized by unevenness and variability in time; these refer to periodic fluctuations, of which seasonal variations are a special case. Natural gas consumption is characterized by unevenness during a day and during a year. In the winter months, gas consumption is much higher than in the summer months, because of the use of natural gas for heating buildings [38]. By analyzing the failure rate of gas networks, and in particular when aiming to find the mechanisms of failure occurrence, this unevenness cannot be ignored. Taking the above into account, an attempt was made to examine seasonal fluctuations in the process of failure occurrences in gas networks. A simple method for separating seasonal fluctuations is based on average 1 min periods. The seasonal index Si can be calculated according to the following formula [39]:
where is given as
Here, Si is the index of seasonality for the ith subperiod, is the arithmetic mean of the size of the studied phenomenon in homonymous subperiods (January, February, …, December), d is the annual cycle of fluctuations within the monthly subperiods (d = 12, e.g., in January, February, etc.), and ki is the number of failures in a given year and month.
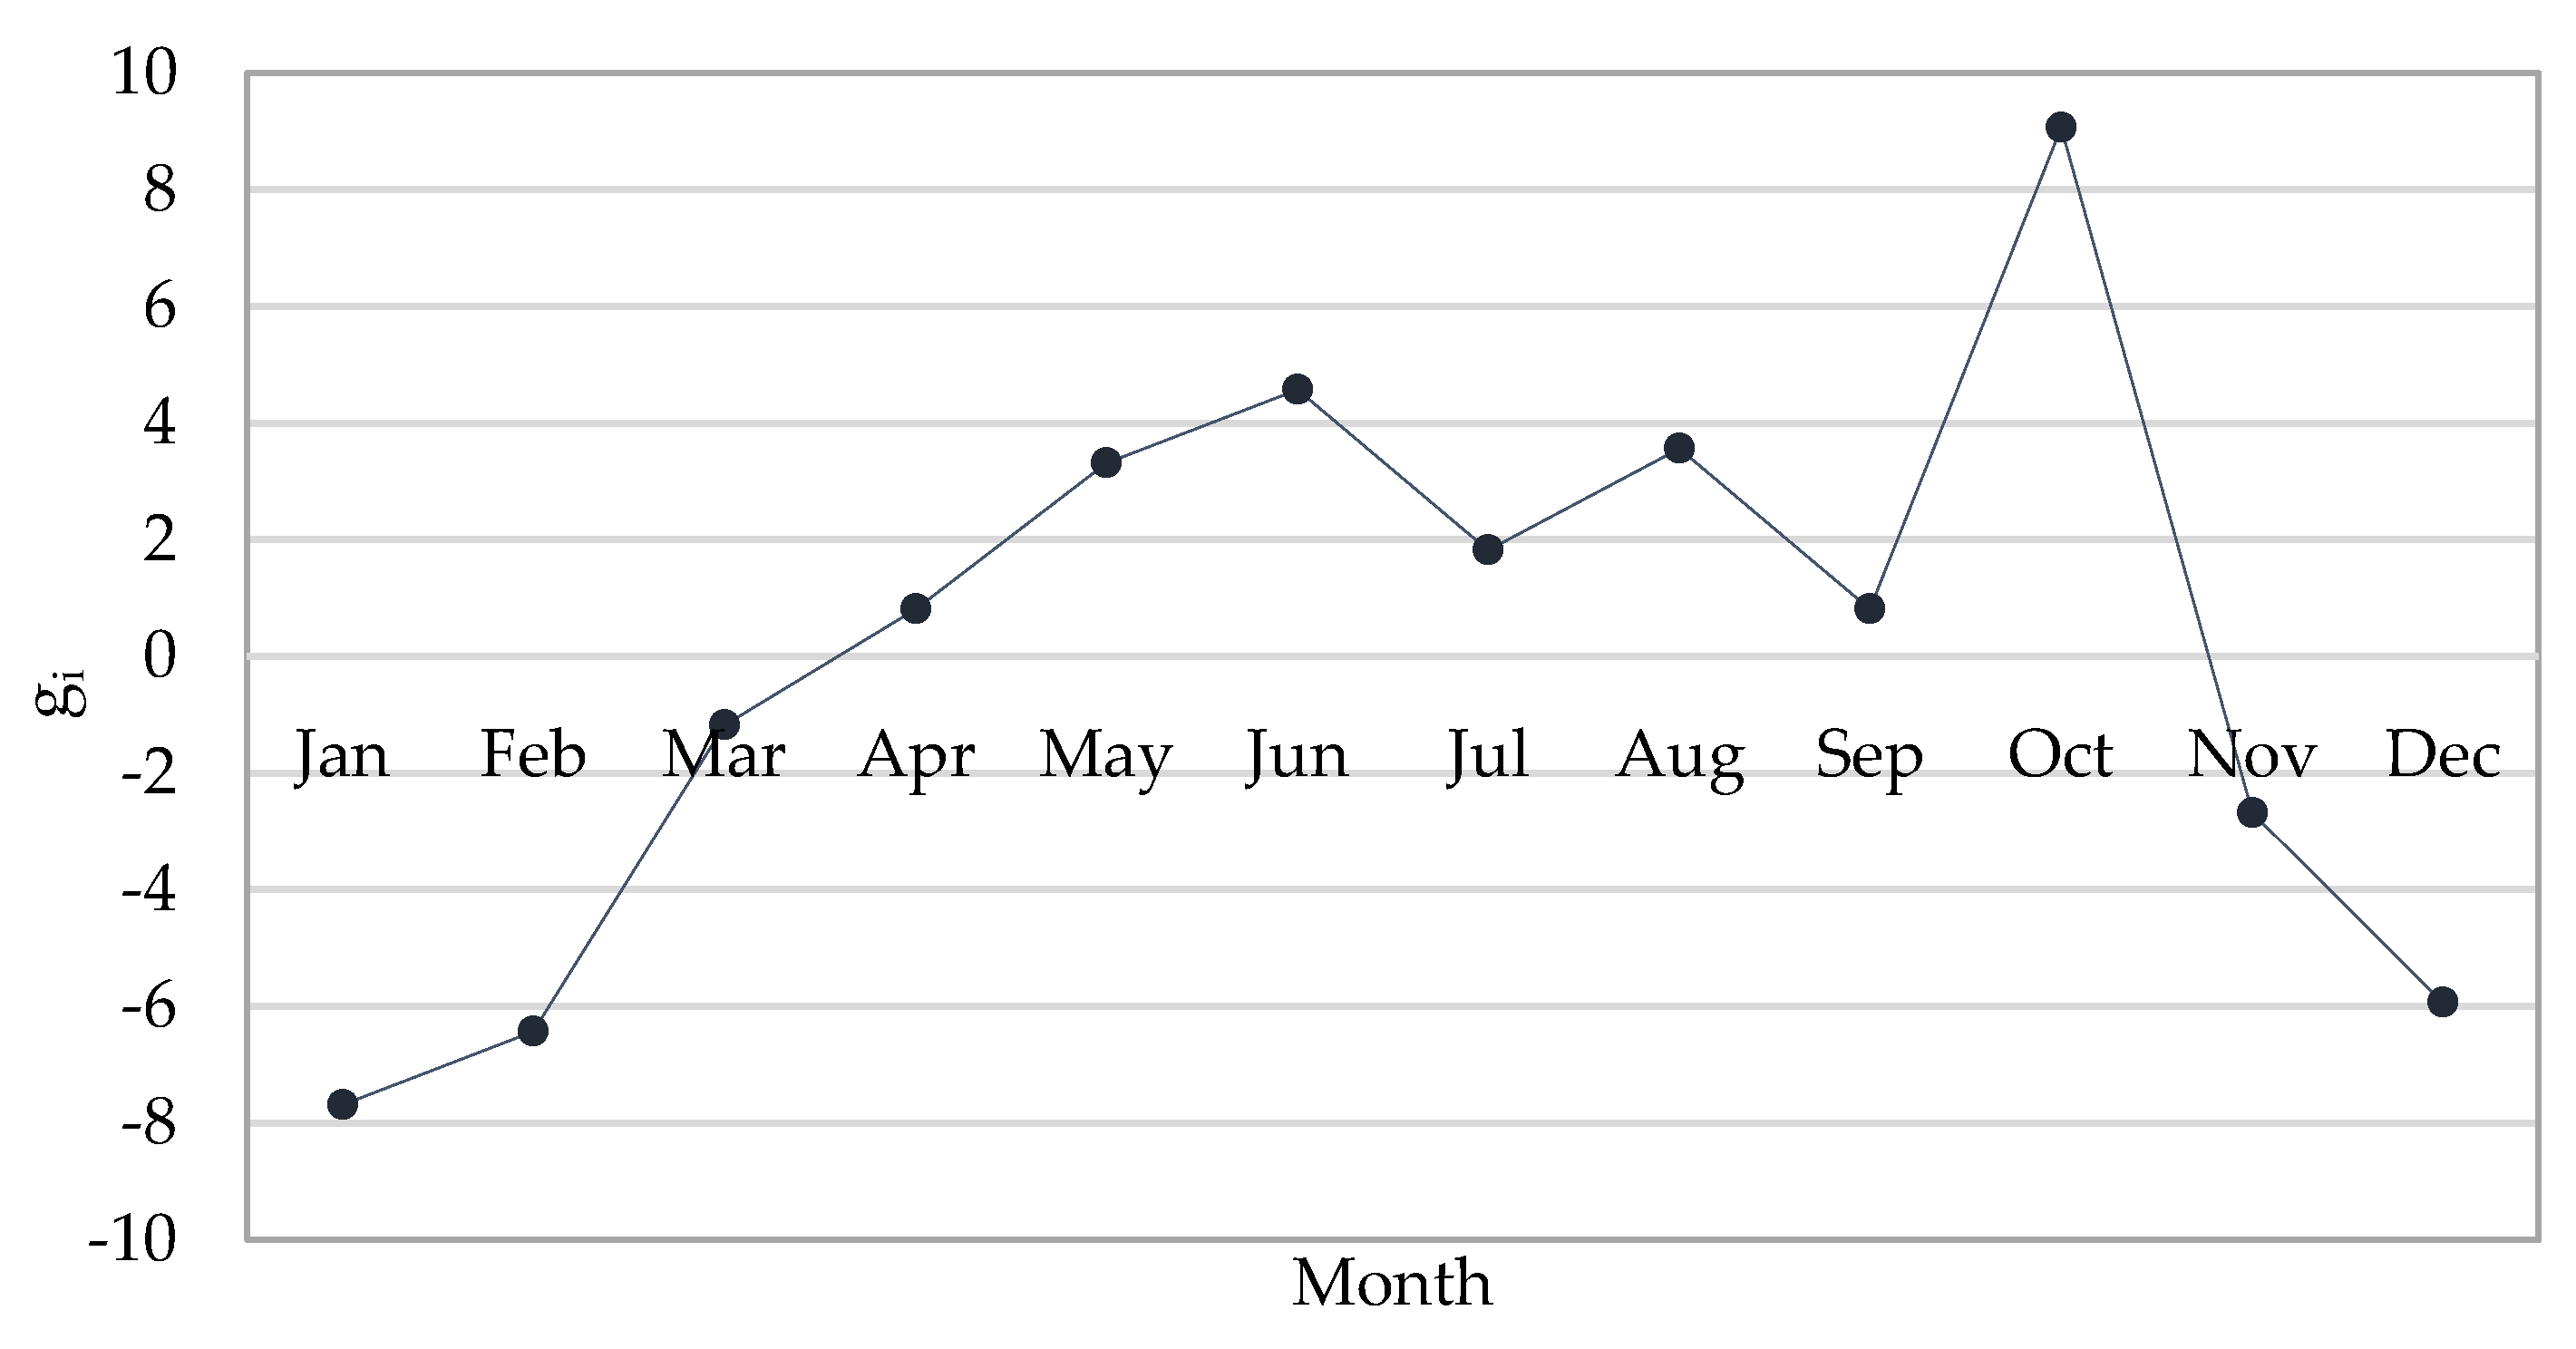
The absolute levels of seasonal fluctuations for individual subperiods are calculated using the following formula:
where gi are the absolute levels of seasonal fluctuations expressed in the same units as the examined phenomenon, and is the average value of the studied phenomenon:
The results of the calculations show that every year in the analyzed period, as a result of seasonal fluctuations, the total number of failures was lower than the monthly average (100%) by approximately 47% in January, by 40% in February, and by 8% in March; was higher than the monthly average by 4.9% in April; and so on (Figure 4). The absolute seasonal fluctuation of gi informed that, in January, the total number of failures was lower than the average monthly ( = 16.44 failures/month) by 7.68 failures and, in October, was higher than the average by 9.06 failures/month (Figure 5).
3.2. Random Fluctuations
Because the occurrence of failures in gas networks is of a random nature, a method for isolating accidental fluctuations from the failure stream is presented. Random fluctuations can be described using the residual components from zt. For each month, the fluctuations can be calculated according to the following formula [39]:
where yt is the empirical value of the studied phenomenon (number of failures in subsequent months); is the theoretical value, for t = 1, 2, …, n (estimated on the basis of the trend function and the least-squares method); and gi is the absolute level of seasonal fluctuations. The calculations show that, for example, in January, the empirical level of the number of failures in this month, yt = 10, consisted of the number of failures resulting from the main causes (trend function), = 9.74 failures; the number of failures resulting from seasonal fluctuations, gi = −7.68 (less than the average number of failures); and the number of failures resulting from random variations, zt = 7.93.
4. Determination of the Failure Stream for Distribution Gas Networks Using the Poisson Distribution
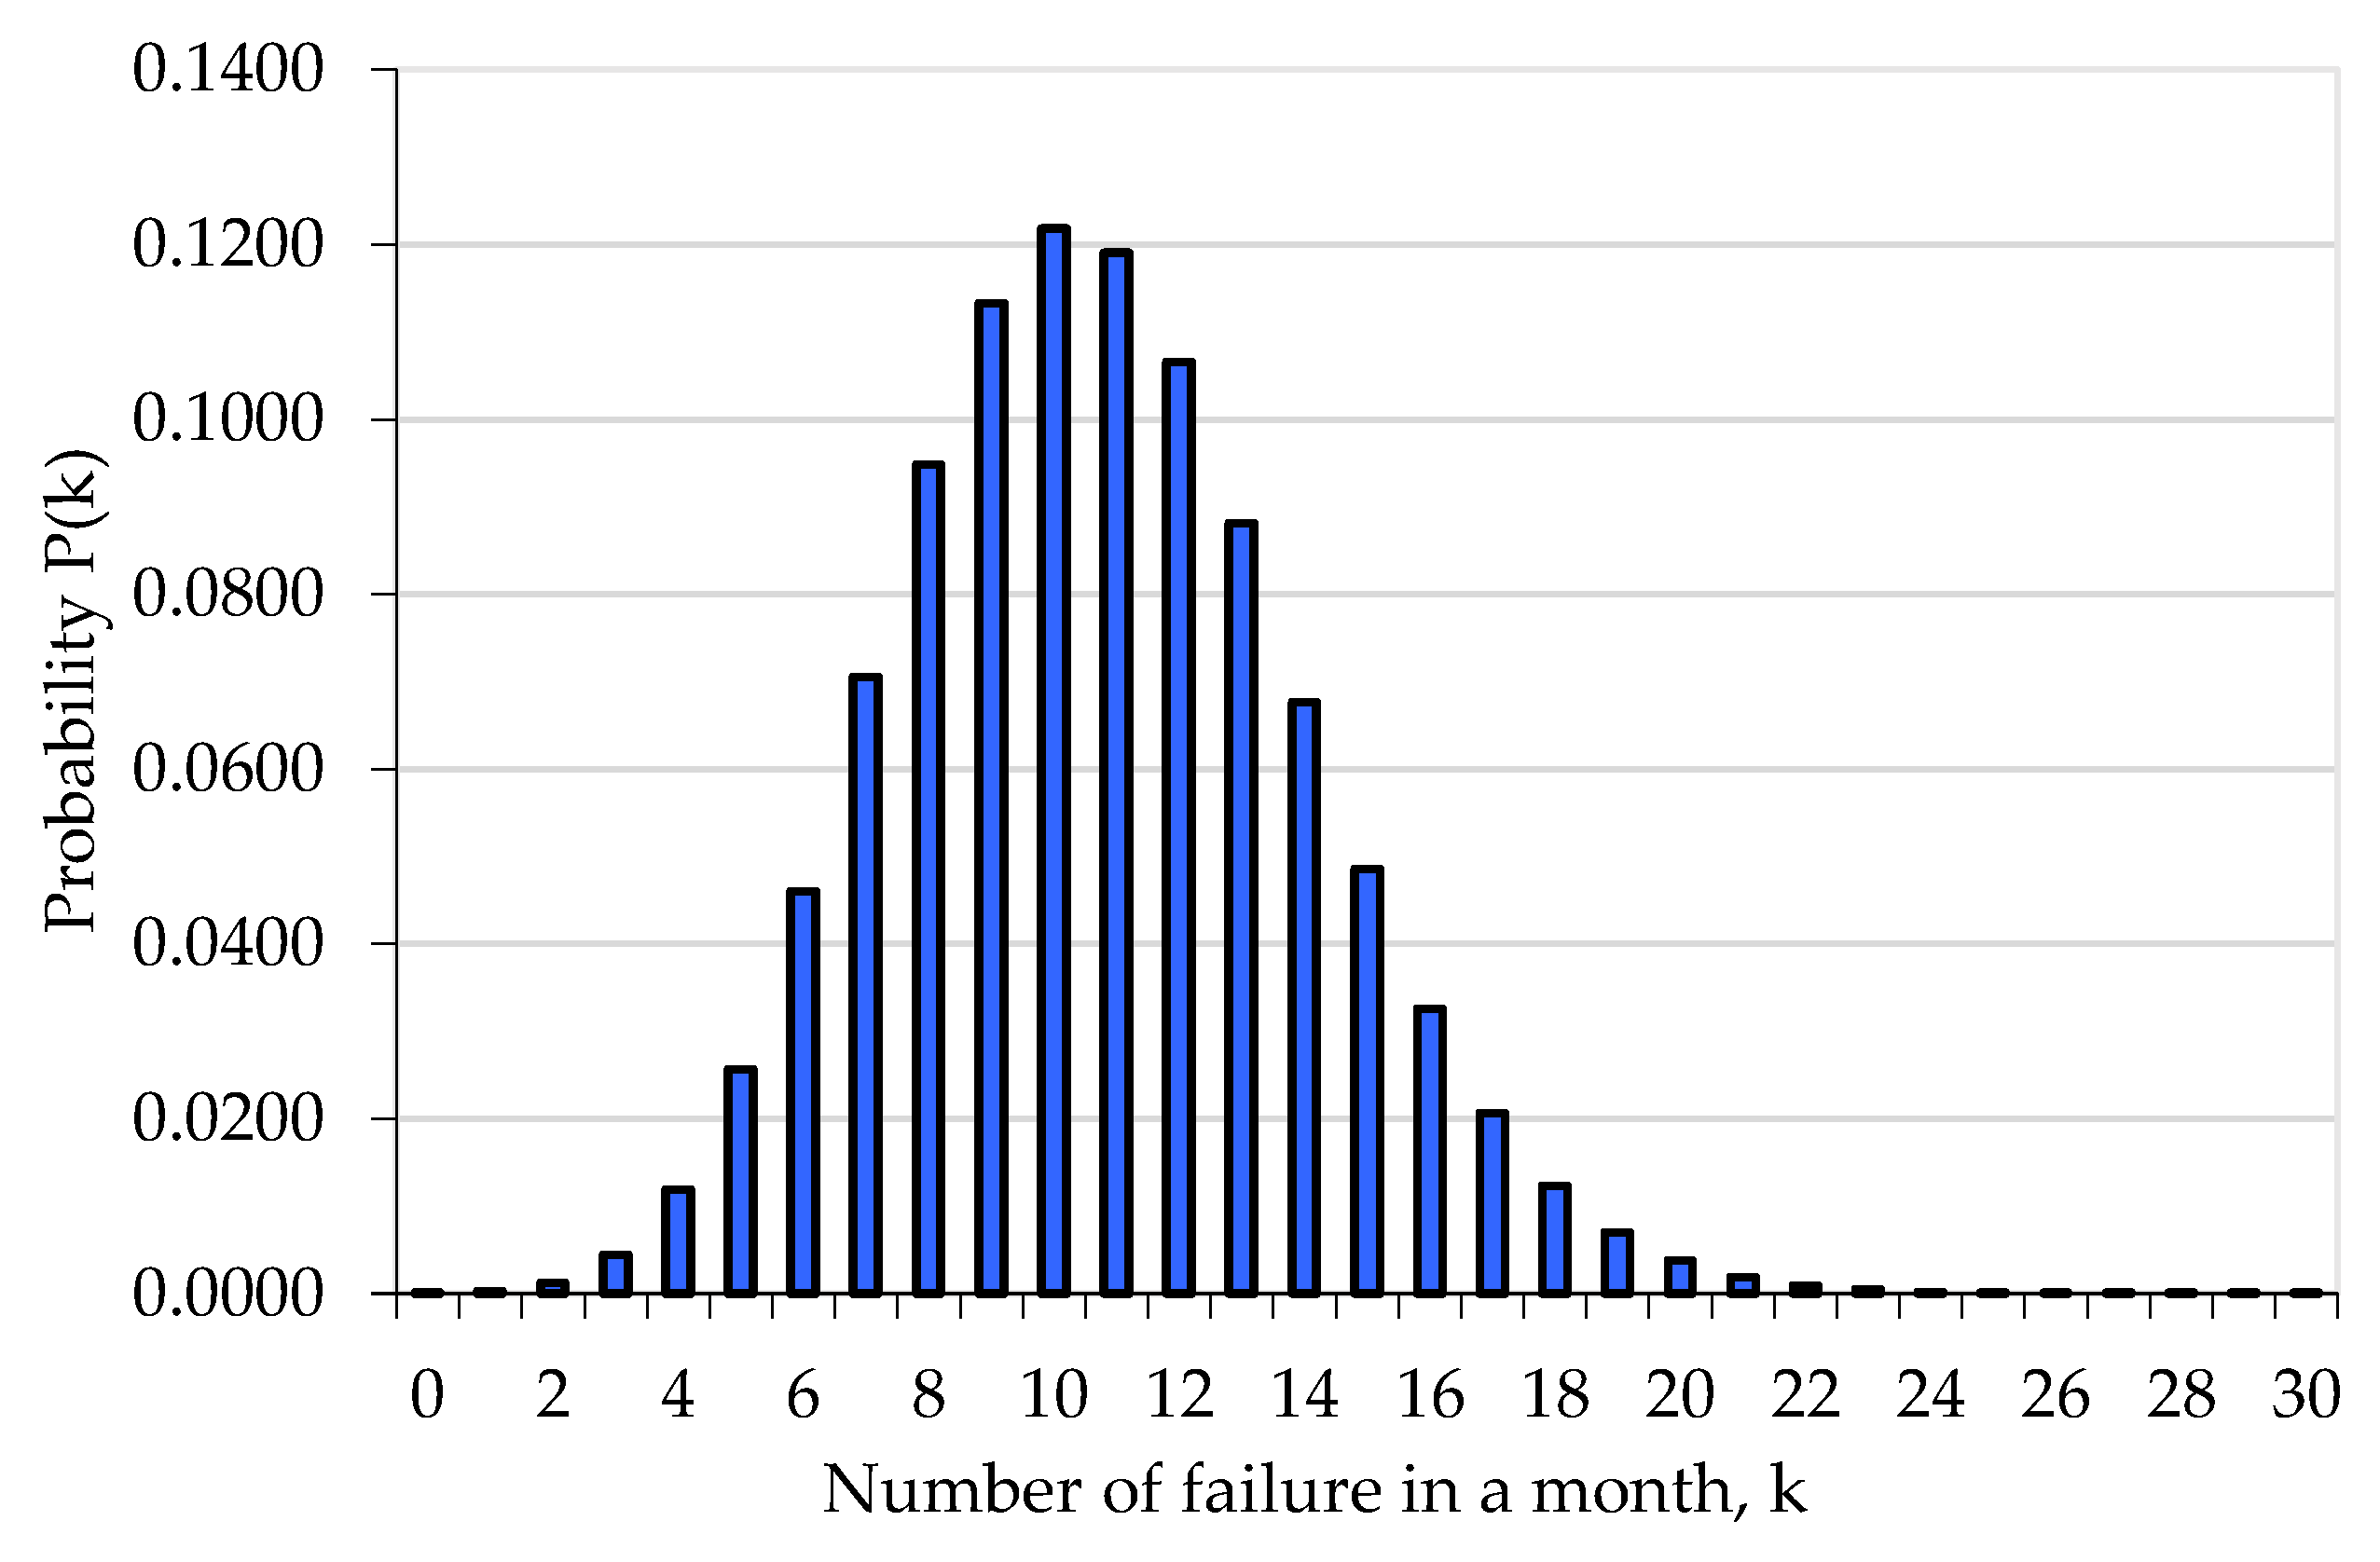
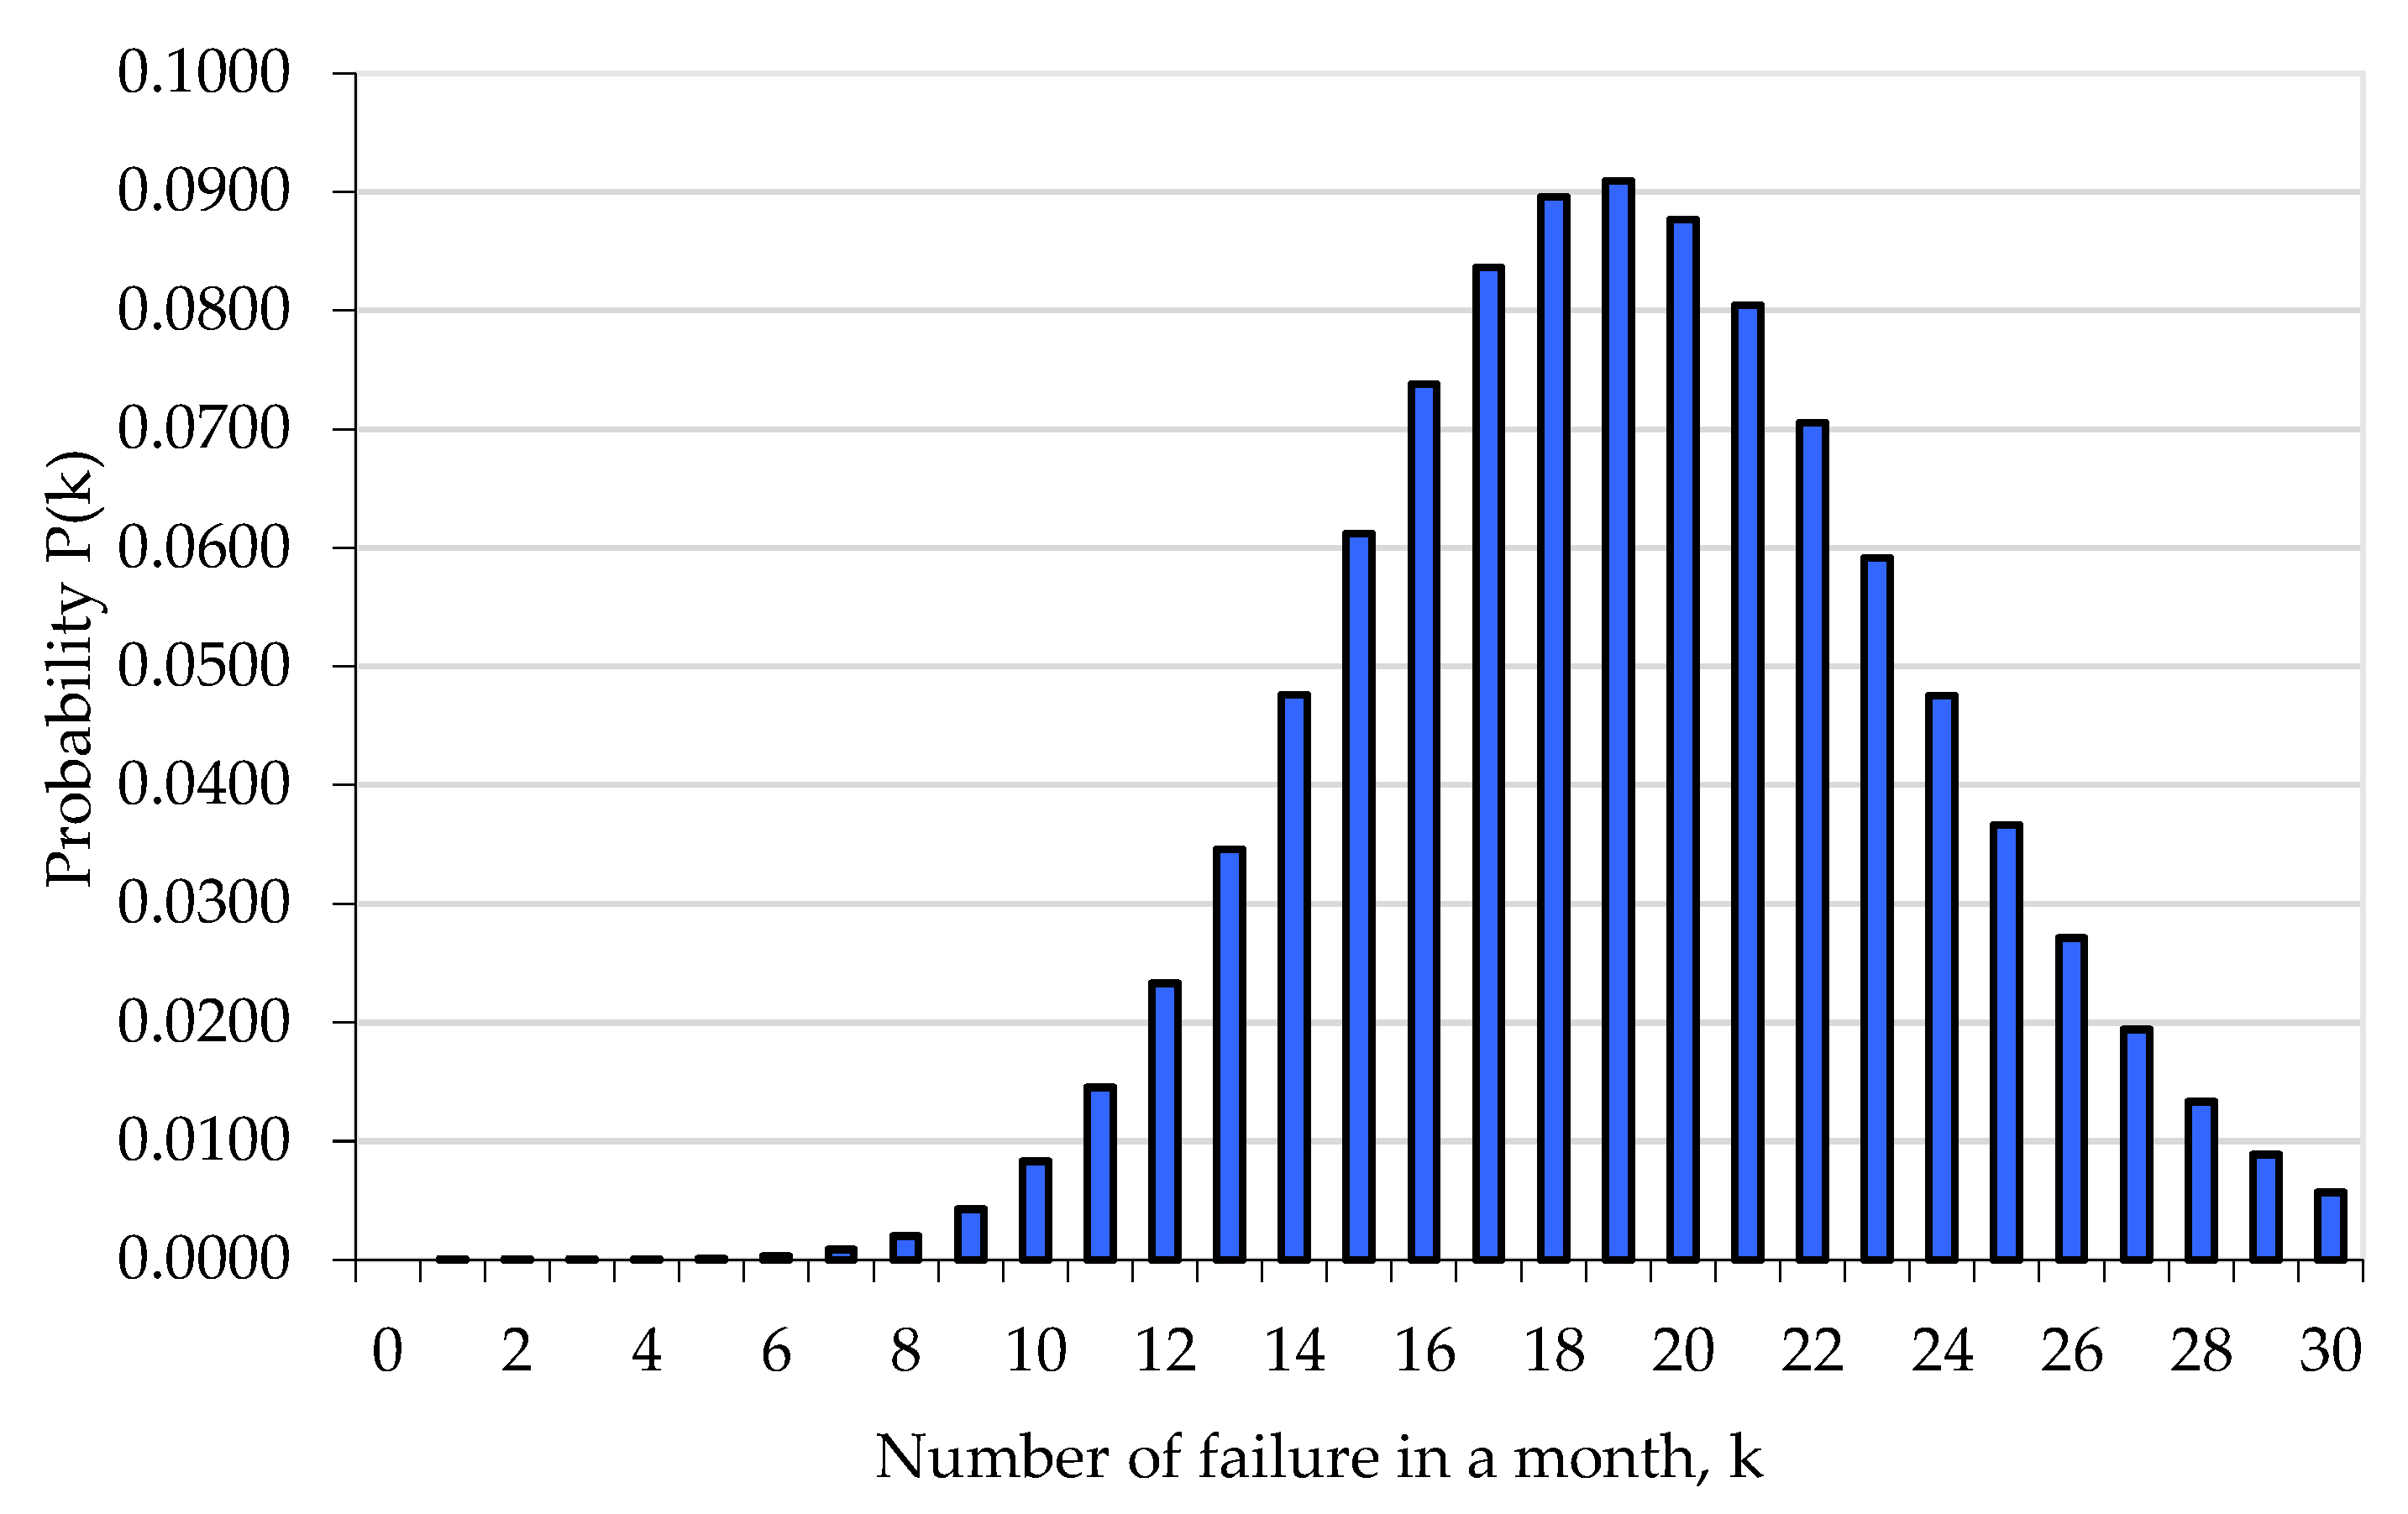
The analysis was carried out for two separate periods according to earlier seasonality calculations: (a) four autumn and winter months (November, December, January, and February) and (b) the remaining eight months.
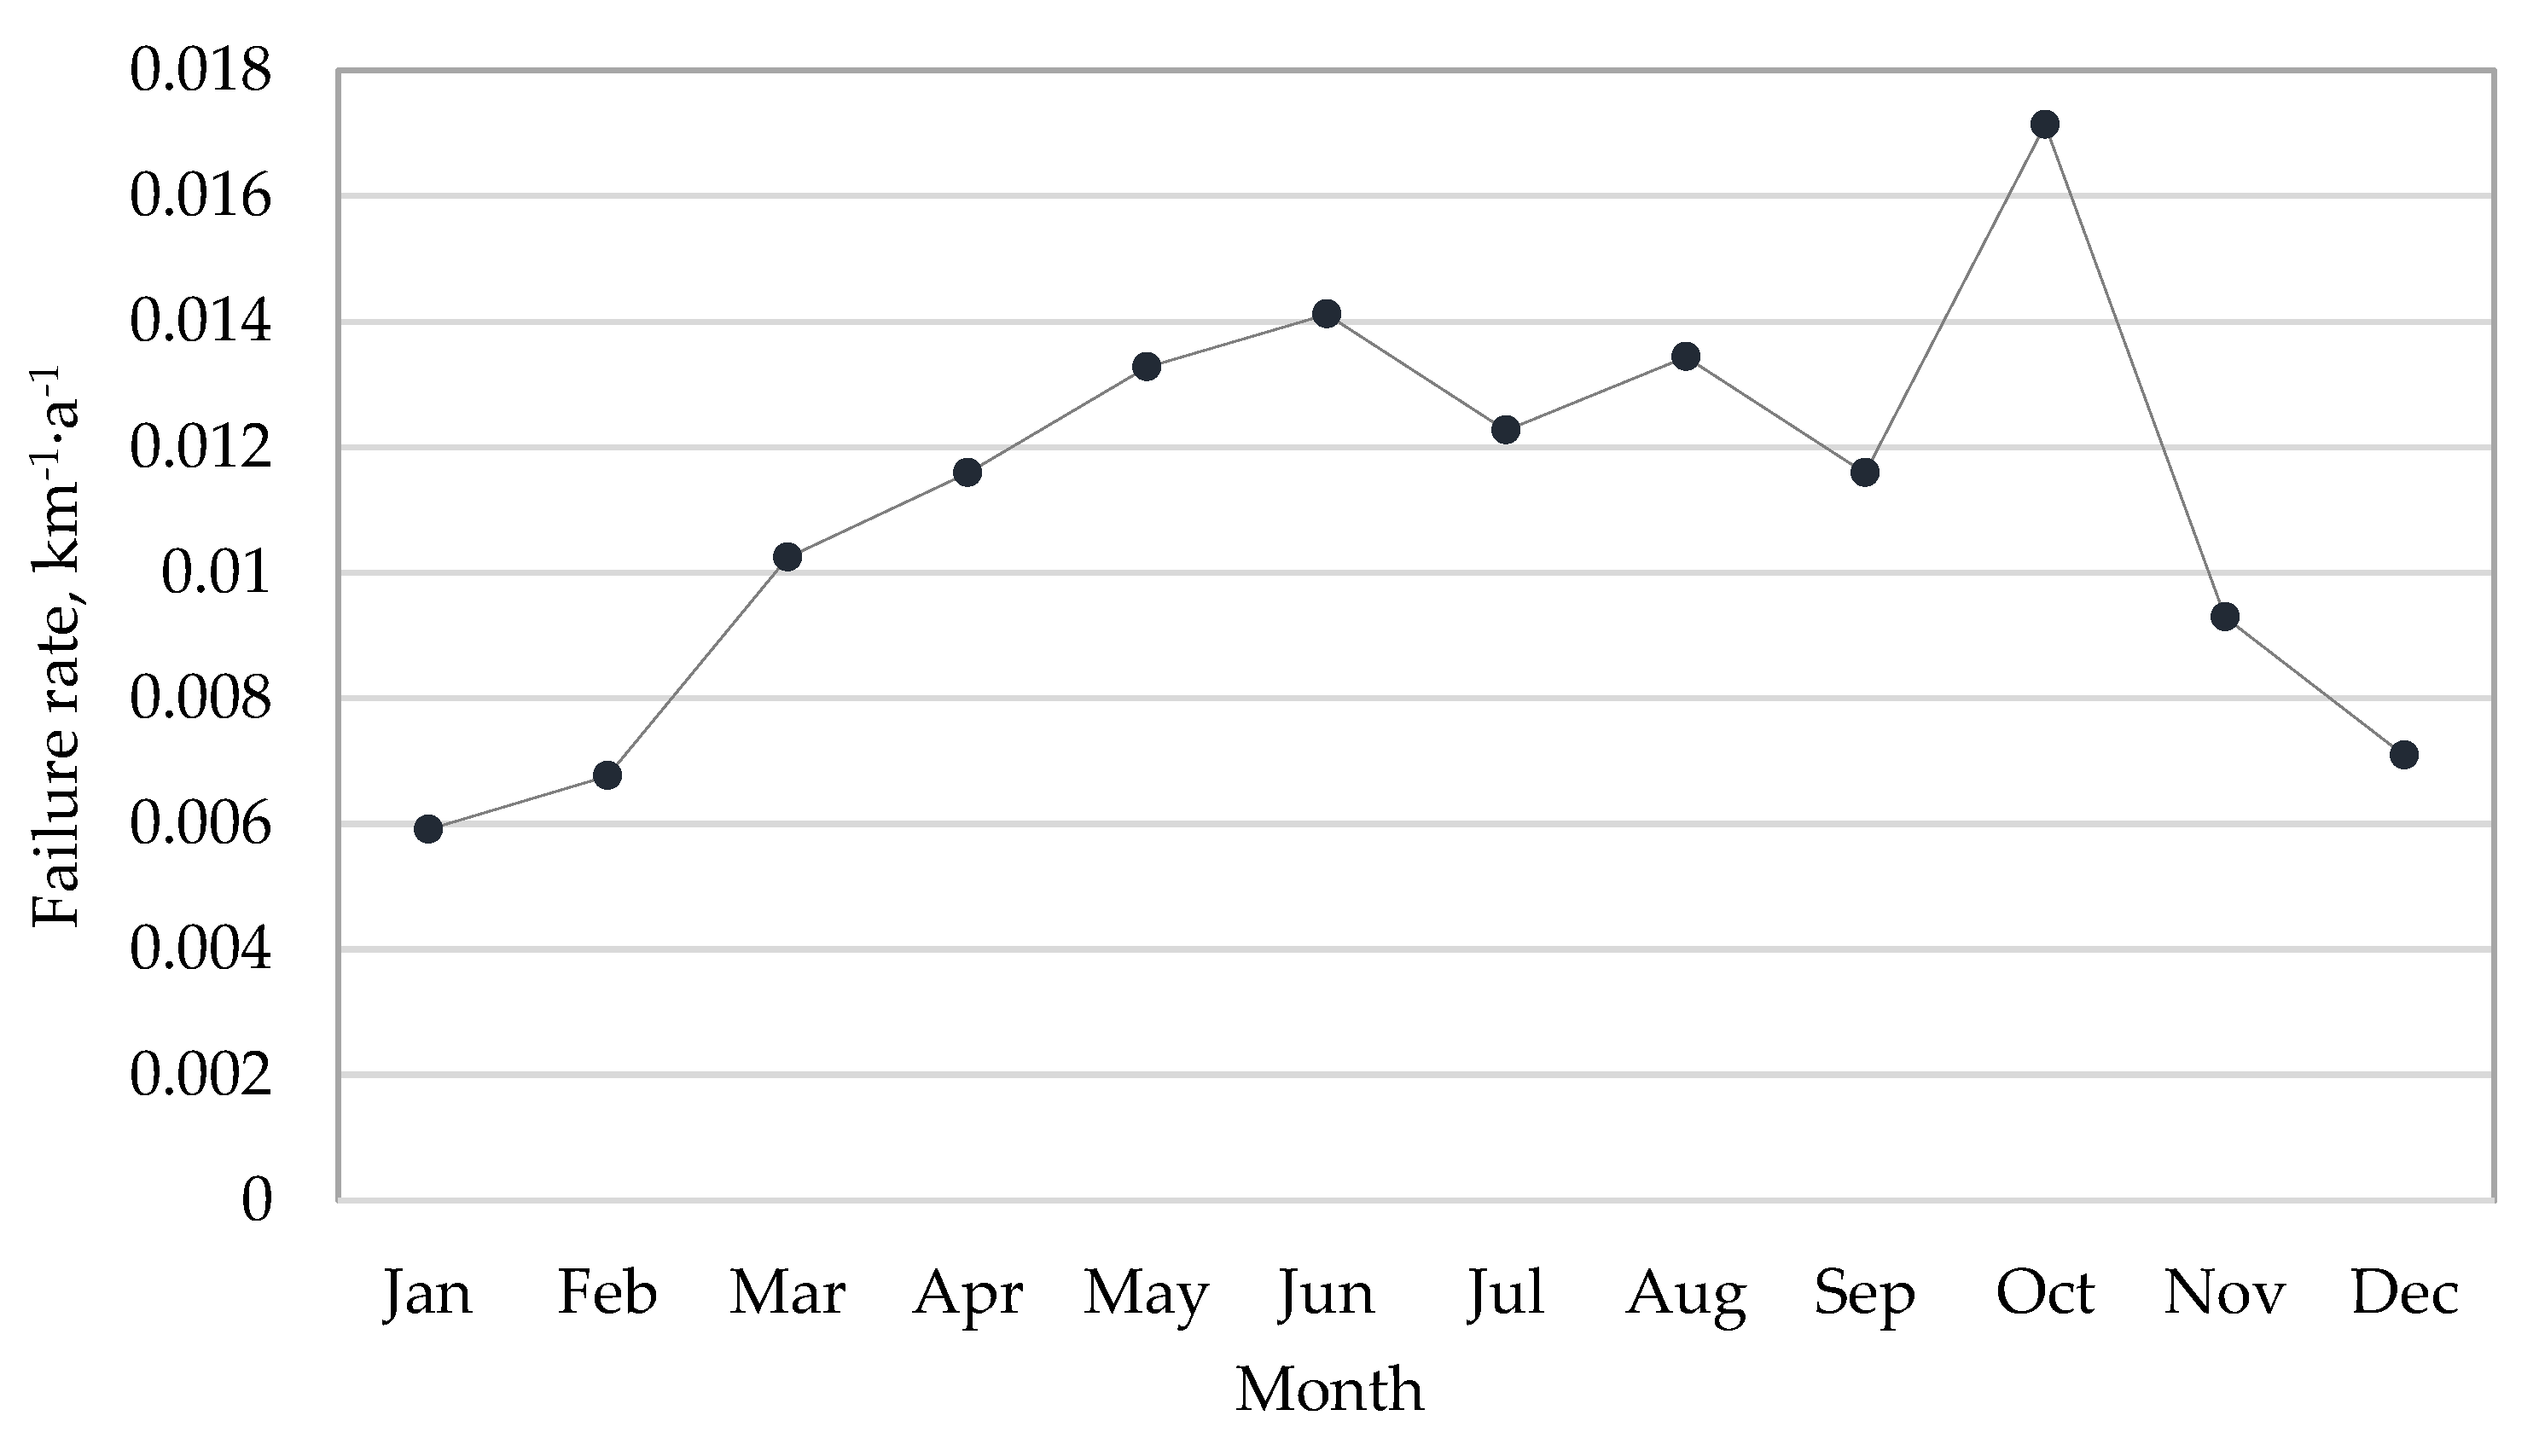
In Figure 6, the failure rates for the average-length network (Lavg = 1488 km) are presented.
The following were assumed: average working time between failures and average repair time had exponential distributions, and in individual periods, the failure stream was homogeneous, according to own research [38,39,40,41,42,43].
The probability of occurrence of k failures can be calculated by the following formula:
where Λ is the average number of failures per month, k is the number of failures, and t is the period of the analysis.
The analysis shows that in the stream of failures in gas networks, we can distinguish between two basic groups of failures: unpredictable/accidental failures (e.g., mechanical), and those that can be predicted on the basis of previous operational tests. By knowing the failure model, one can predict failure occurrences in the following years in a specific section of the network (of a certain diameter and made of a particular material) at certain times of the year, using the Monte Carlo method for this purpose.
5. Forecasting Method of Acceptable Failure Consequences Using Homogeneous Markov Chain
Section 5 is based on the previously performed analysis from Section 2, Section 3, Section 4 and Section 5 concerning the gas network failure for the urban agglomeration in the southeastern part of Poland; research on the failure stream in the gas network, including the separation of seasonal and random fluctuations; determination of the failure stream for distribution gas networks using the Poisson distribution; and the forecasting method for acceptable failure consequences using the homogeneous Markov chain. The random variable X(t) can have a discrete or continuous distribution. The random process {X(t): t∈T} can be a discrete, that is, finite or countable, set of t∈T (if its implementation takes natural numbers, then we are referring to a random chain). If the set is a numerical range, then we are dealing with a continuous process. The basic issue in stochastic processes is the determination of probabilities related to the occurrence of a random variable X(t) [44,45,46,47].
For a discrete time-space, t = 0, 1, 2, …, conditional probability is recorded in the form of
The Markov process is a sequence of events in which the probability of each event depends only on the previous result. Markov chains are Markov processes that are defined in the discrete space of states, sequences X1, X2, X3, … of random variables. The field of these variables is called the space of the Markov chain states. A random process with a discrete set of states and a discrete set of parameters T = N = {0, 1, 2, …} is called a uniform Markov chain.
For a computable state space, the stochastic process {X(t): t∈T} is called the Markov process if for any number x0, x1, …, xn, xn+1 and t0 < t1 < … < tn < tn+1, ti∈T, i = 0, 1, …, n + 1, the following equality holds [48]:
where t0, t1, …, tn−1 are past moments (past), tn is the present moment (present), and tn+1 is the coming moment (future).
P {X (tn + 1) = xn + 1/X (tn) = xn, ... X (t0) = x0} = P {X (tn + 1) = xn + 1/X (tn) = xn},
Equation (9) defining the Markov process means that the distribution of states’ “future” does not depend on the “past” but only on the state of the current process.
The probabilities of the transition from the state i to the state j for a homogeneous chain are
In the case of a stationary process, we obtain
The aforementioned applies to the one-step chain transitions between states. In a similar way, stationary n-step transition probabilities [48] are determined:
where n is the number of steps.
In the case of one-step transitions (n = 1), this index is omitted.
The probabilities of one-step transitions can be saved in the form of a matrix:
The element pi,j of the matrix P is the probability of a one-step transition from the state i to the state j in the space of m + 1 states for 0, 1, …, m.
The rule is that in the matrix (Equation (13)), the sum of each row must be equal to 1. For the Markov chains, the Chapman-Kolmogorov equation is applicable, describing the probability of the n-step transitions in the following way:
The interpretation of Equation (14) is as follows: summation occurs after all intermediate states k, and components of the sum are conditional probabilities starting with the state i; the process passes from the state k in r steps and then from the state j in (n – r)-steps.
The rule is that if it is possible to determine the probabilities of one-step transitions, then there is the possibility to determine the probabilities of multistep transitions by means of Equation (14). This is done using the matrix multiplication rule.
Generally, for n-step matrices,
The probabilities of transitions for steady states have limits, which can be written as
Using Equation (14) for r = 1 and steady state we obtain:
The summation takes place after all the i states and the following conditions are met: and qj > 0.
The limits of the probabilities of transitions qj can be identified as inverses of the average times for returning to the state j.
The two-state Markov chain model to describe the model for the occurrence of days with acceptable and unacceptable consequences of gas network failure was assumed, with regard to the duration of failure and the number of recipients without gas supplies, which, among others, can be used in estimating the frequency of organizing repair teams by gas companies.
Data regarding the failure rate of the gas network were analyzed; the observation period covered 3 years. For statistical analysis, the failure risk calculated as the product of the duration and consequences expressed in monetary values equaled 0.26404.
The mark “0” was adopted for a day with acceptable consequences of gas network failures and “1” was adopted for a day with unacceptable consequences of gas network failures.
The multistep transition matrices were, for example, as follows:
From the point of view of organization of the repair teams, the probability distribution of the appearance of acceptable and unacceptable consequences of gas network failure is interesting.
Assuming that the number of days with unacceptable consequences of gas network failure (DD) is the number of consecutive days with unacceptable consequences of gas network failure before the next day (DBD) with acceptable consequences of gas network failure, that is, the first transition from the state “1” to the state “0”, we obtain
For example, for DD = k = 5 d, that is, that within 5 consecutive days there will be unacceptable consequences of gas network failure, the probability of such an event is 0.079.
The expected value of the number of consecutive days with unacceptable consequences of gas network failure is 4 d. Hence, the cycle value, taking into account both acceptable and unacceptable consequences of gas network failure, is 9 d. The presented methodology allows one to evaluate the work of the repair teams. It is possible to analyze, from this point of view, the frequency of use of these brigades.
6. Conclusions and Perspectives
The assessment of the functionality of gas networks should be a priority activity for the operators of these systems, who should pay more attention to the assessment of the operation of existing networks. With increasing pressure from environmentalists and the tightening of acceptable environmental pollution standards, it seems a necessity. The variety of methods for gas network operation assessment allows for the selection of an optimal solution. The use of several methods at the same time gives the opportunity to objectively assess a system’s functionality and make a correct decision regarding the minimization of the occurrence of failure. The presented methodology can be used to assess the technical states of gas pipelines, which allows decisions to be made if the system requires modernization or general overhaul. It could be very useful in the carrying out and preparing of operation strategy plans.
The implementation of the methodology and research for this article allowed us to formulate the following conclusions:
- (a)
- On the basis of the values of the failure rate, it was found that the gas-pipeline network is characterized by a good technical state, which was confirmed by the authors’ previous studies in other gas supply systems [21,38]. The failure rate for pipelines made of steel is λsteel = 0.075 km−1·a−1, and the failure rate for pipelines made of plastics is λp = 0.18 km−1·a−1. A fairly high percentage of failure was caused by mechanical damage to both steel pipelines (67.92%) and plastic (95.28%), that is, failures caused as a result of human activity, as well as inaccurate and out-of-date spatial development plans, resulting in damage while building other infrastructure. The detailed analysis indicates that the higher failure rate of plastics concerned gas supply connections and was caused by inaccurate spatial development plans and a lack of proper performance of connections. In the case of pipes made of steel, modernization was performed over the last years, influencing the smaller failure rate.
- (b)
- The failure rate of the examined system showed the seasonality of failure occurrences in gas networks. In spring and summer months, the failure rate increases, and in autumn and winter months, it decreases. It seems advisable to increase the number of repair teams in the gas supply subsystems during periods of increased failure intensity, to increase the frequency of gas-pipeline inspections.
- (c)
- Simulation methods with the application of the Poisson distribution to determine the failure stream of the gas supply subsystem and forecasting method of acceptable failure consequences using the homogeneous Markov chain allow for correct classification of the subsystem elements for modernization or general renovation.
The methodology can be used directly in other gas supply systems because the presented approach is suitable for different systems. If numerous failures happen in gas supply networks, the gas company is obliged to carry out some modernization and renovation, so as to minimize the pipeline’s failures. The presented method for the failure analysis should be the main element of complex management.
Further work in this area will be focused on researching the exposure to failure using the operating data, field investigations, and analyses made by experts, which can help in identifying particular areas with high and unacceptable failure, so as to classify the sections of the network for renovation through risk maps. An important aspect will also be an analysis of failure assessment in the context of determination of the acceptance criteria of pipe network failure.
The analysis of the gas network failures can contribute to the assessing of the technical state of networks, which can help in planning potential repairs and, consequently, contribute to prevention of and reduction in the number of failures, as well as minimize their consequences. The development of appropriate failure assessment methods contributes to reducing the possible consequences of disasters; helps engineers, designers, or government officials to make correct decisions regarding the selection of the optimal solution for technical facilities; and provides means for securing their users and the surrounding environment. In today’s world, the development of technology has brought about many benefits, but it has also contributed to creating many threats. Through such techniques, terrorists have access to weapons and to modern information transfer methods. Therefore, failure risk analysis related to the operation of all technical systems should now be a priority action undertaken by appropriate experts.
Author Contributions
All authors contributed equally to the manuscript.
Funding
This research received no external funding.
Conflicts of Interest
The authors declare no conflict of interest.
References
- Abada, I.; Massol, O. Security of supply and retail competition in the European gas market. Some model based insights. Energy Policy 2011, 39, 4077–4088. [Google Scholar] [CrossRef]
- Fernandes, M.P.; Viegas, J.L.; Vieira, S.M. Segmentation of Residential Gas Consumers Using Clustering Analysis. Energies 2017, 10, 2047. [Google Scholar] [CrossRef]
- Hao, Y.-M.; Zhang, C.-S.; Shao, H.; Wang, M.-T. Baye network quantitative risk analysis for failure of natural gas pipelines. J. Northeast. Univ. 2011, 32, 321–325. [Google Scholar]
- Brown, N.; Crate, J.M. Analysis of a failure in a polyethylene gas pipe caused by squeeze off resulting in an explosion. J. Fail. Anal. Prev. 2012, 12, 30–36. [Google Scholar] [CrossRef]
- Biresselioglu, M.E.; Yelkenci, T.; Oz, I.O. Investigating the natural gas supply security: A new perspective. Energy 2015, 80, 168–176. [Google Scholar] [CrossRef]
- Costantini, V.; Gracceva, F.; Markandya, A. Security of energy supply: Comparing scenarios from a European perspective. Energy Policy 2007, 35, 210–226. [Google Scholar] [CrossRef] [Green Version]
- Flouri, M.; Karakosta, C.; Kladouchou, C. How does a natural gas supply interruption affect the EU gas security? A Monte Carlo simulation. Renew. Sustain. Energy Rev. 2015, 44, 785–796. [Google Scholar] [CrossRef]
- Fu, X.; Zhang, X. Failure probability estimation of gas supply using the central moment method in an integrated energy system. Appl. Energy 2018, 219, 1–10. [Google Scholar] [CrossRef]
- Geng, J.B.; Ji, Q.; Fan, Y. A dynamic analysis on global natural gas trade network. Appl. Energy 2014, 132, 23–33. [Google Scholar] [CrossRef]
- Majid, Z.A.; Mohsin, R.; Yaacob, Z.; Hassan, Z. Failure analysis of natural gas pipes. Eng. Fail. Anal. 2010, 17, 818–837. [Google Scholar] [CrossRef]
- Mohsin, R.; Majid, Z.A. Erosive failure of natural gas pipes. J. Pipeline Syst. Eng. 2014, 5, 818–837. [Google Scholar] [CrossRef]
- Guy, P.; Capelle, J.; Schmitt, C.; Mouwakeh, M. Domain failure assessment diagrams for defect assessment of gas pipes. In Proceedings of the 19th European Conference on Fracture: Fracture Mechanics for Durability, Reliability and Safety, Kazan, Russia, 26–31 August 2012. [Google Scholar]
- Lu, W.; Su, M.; Fath, B.D. A systematic method of evaluation of the Chinese natural gas supply security. Appl. Energy 2016, 165, 858–867. [Google Scholar] [CrossRef]
- Majid, Z.A.; Mohsin, R.; Yusof, M.Z. Experimental and computational failure analysis of natural gas pipe. Eng. Fail. Anal. 2012, 19, 32–42. [Google Scholar] [CrossRef]
- Luo, X.; Lu, S.; Shi, J.; Li, X.; Zheng, J. Numerical simulation of strength failure of buried polyethylene pipe under foundation settlement. Eng. Fail. Anal. 2015, 48, 144–152. [Google Scholar] [CrossRef]
- Mohsin, R.; Majid, Z.A.; Yusof, M.Z. Multiple failures of API 5L X42 natural gas pipe: Experimental and computational analysis. Eng. Fail. Anal. 2013, 34, 10–23. [Google Scholar] [CrossRef]
- Potocnik, P.; Govekar, E.; Grabec, I. Short-term natural gas consumption forecasting. In Proceedings of the 16th IASTED International Conference On Applied Simulation and Modelling, Palma de Mallorca, Spain, 29–31 August 2007; DeFelice, F., Ed.; IASTED: Calgary, AB, Canada, 2007; pp. 353–357. [Google Scholar]
- Shalaby, H.M.; Riad, W.T.; Alhazza, A.A.; Behbehani, M.H. Failure analysis of fuel supply pipeline. Eng. Fail. Anal. 2006, 13, 789–796. [Google Scholar] [CrossRef]
- Urbanik, M.; Tchórzewska-Cieślak, B. Ecological aspects of the natural gas use. Czasopismo Inżynierii Lądowej Środowiska i Architektury 2015, 62, 409–417. [Google Scholar] [CrossRef]
- Piegdon, I.; Tchorzewska-Cieslak, B.; Eid, M. Managing the risk of failure of the water supply network using the mass service system. Eksploat. Niezawodn. 2018, 2, 284–291. [Google Scholar] [CrossRef]
- Tchórzewska-Cieślak, B.; Pietrucha-Urbanik, K.; Urbanik, M. Analysis of the gas network failure prediction using the Monte Carlo simulation method. Eksploat. Niezawodn. 2016, 18, 254–259. [Google Scholar] [CrossRef]
- Tchórzewska-Cieślak, B. Method of Assessing of Risk of Failure in Water Supply System; European Safety and Reliability Conference (ESREL), Risk, Reliability and Societal Safety; Taylor & Francis: London, UK, 2007; Volume 2, pp. 1535–1539. [Google Scholar]
- Królikowska, J. Application of PHA method for assessing risk of failure on the example of sewage system in the city of Cracow. Annu. Set Environ. Prot. 2011, 13, 693–710. [Google Scholar]
- Ondrejka Harbulakova, V.; Estokova, A.; Stevulova, N.; Luptakova, A. Different aggressive media influence related to selected characteristics of concrete composites investigation. Int. J. Energy Environ. Eng. 2014, 5, 82. [Google Scholar] [CrossRef]
- Kent Muhlbauer, W. Pipeline Risk Management; Gulf Publishing Company: London, UK, 1992. [Google Scholar]
- Directive 2009/73/EC of the European Parliament and of the Council of 13 July 2009 concerning common rules for the internal market in natural gas and repealing Directive 2003/55/EC. Available online: https://eur-lex.europa.eu/legal-content/EN/ALL/?uri=CELEX%3A32009L0073 (accessed on 12 March 2018).
- European Gas Pipeline Incident Data Group (EGIG). 5–9th Reports of the European Gas Pipeline Incident Data Group (Period 1970–2013); Doc. No EGIG 14.R.0403; European Gas Pipeline Incident Data Group: Amsterdam, The Netherlands, 2002. [Google Scholar]
- European Gas Pipeline Incident Data Group (EGIG). 5–9th Reports of the European Gas Pipeline Incident Data Group (Period 1970–2013); Doc. No EGIG 11.R.0402; European Gas Pipeline Incident Data Group: Amsterdam, The Netherlands, 2005. [Google Scholar]
- European Gas Pipeline Incident Data Group (EGIG). 5–9th Reports of the European Gas Pipeline Incident Data Group (Period 1970–2013); Doc. No EGIG 08.TV-B.0502; European Gas Pipeline Incident Data Group: Amsterdam, The Netherlands, 2008. [Google Scholar]
- European Gas Pipeline Incident Data Group (EGIG). 5–9th Reports of the European Gas Pipeline Incident Data Group (Period 1970–2013); Doc. No EGIG 05.R.0002; European Gas Pipeline Incident Data Group: Amsterdam, The Netherlands, 2011. [Google Scholar]
- European Gas Pipeline Incident Data Group (EGIG). 5–9th Reports of the European Gas Pipeline Incident Data Group (Period 1970–2013); Doc. No EGIG 02.R.0058; European Gas Pipeline Incident Data Group: Amsterdam, The Netherlands, 2015. [Google Scholar]
- International Association of Oil & Gas Producers (OGP). Operating Management System Framework for Controlling Risk and Delivering High Performance in the Oil and Gas Industry; International Association of Oil & Gas Producers (OGP): London, UK, 2014. [Google Scholar]
- Martini, A.; Troncossi, M.; Rivola, A. Leak Detection in Water-Filled Small-Diameter Polyethylene Pipes by Means of Acoustic Emission Measurements. Appl. Sci. 2017, 7, 2. [Google Scholar] [CrossRef]
- Martini, A.; Troncossi, M.; Rivola, A. Vibroacoustic Measurements for Detecting Water Leaks in Buried Small-Diameter Plastic Pipes. J. Pipeline Syst. Eng. 2017, 8, 04017022. [Google Scholar] [CrossRef]
- Xu, C.; Gong, P.; Xie, J.; Shi, H.; Chen, G.; Song, G. An acoustic emission based multi-level approach to buried gas pipeline leakage localization. J. Loss Prevent. Proc. Ind. 2016, 44, 397–404. [Google Scholar] [CrossRef]
- Martini, A.; Troncossi, M.; Rivola, A. Automatic Leak Detection in Buried Plastic Pipes of Water Supply Networks by Means of Vibration Measurements. Shock Vib. 2015, 2015, 16530. [Google Scholar] [CrossRef]
- Meng, L.; Yuxing, L.; Wuchang, W.; Juntao, F. Experimental study on leak detection and location for gas pipeline based on acoustic method. J. Loss Prev. Proc. Ind. 2012, 25, 90–102. [Google Scholar] [CrossRef]
- Tchórzewska-Cieślak, B. Reliability of Selected Elements of the Natural Gas Supply Subsystem. Ph.D. Thesis, Cracow University of Technology, Cracow, Poland, 2002. [Google Scholar]
- Sobczyk, M. Statistics: Theoretical and Practical Aspects; Maria Curie-Skłodowska University: Lublin, Poland, 2006. [Google Scholar]
- Tchórzewska-Cieślak, B.; Rak, J. Analysis of Gas Networks Failure in Chosen Cities. In Proceedings of the XII Conference of Heat Engineers; PZITS: Solina, Poland, 2000. [Google Scholar]
- Tchórzewska-Cieślak, B.; Rak, J. Models of safety reliability of water supply systems using Markov processes. In II National Congress of Environmental Engineering; Committee of Environmental Engineering of the Polish Academy of Sciences: Lublin, Poland, 2005; Volume 32, pp. 519–528. [Google Scholar]
- Rak, J. Safety of Water Supply System; Polish Academy of Science: Warsaw, Poland, 2009. [Google Scholar]
- Tchorzewska-Cieslak, B.; Rak, J. Method of Identification of Operational States of Water Supply System; Environmental Engineering; Taylor & Francis: London, UK, 2009; Volume 3, pp. 521–526. [Google Scholar]
- Cox, D.R.; Miller, H.D. The Theory of Stochastic Processes; Chapman& Hall/CRC: Boca Raton, FL, USA, 1996. [Google Scholar]
- Davis, M.H.A. Markov Models and Optimization; Monographs on Statistics and Applied Probability 49; Chapman& Hall/CRC: Boca Raton, FL, USA, 1993. [Google Scholar]
- Grabski, F. Reliability and maintainability characteristics in semi-Markov model. J. Pol. Saf. Reliab. Assoc. 2016, 7, 79–85. [Google Scholar]
- Kolowrocki, K.; Soszynska-Budny, J. Modeling Complex Technical Systems Operation Processes. Reliab. Saf. Complex Tech. Syst. Process. 2011, 53–78. [Google Scholar] [CrossRef]
- Stark, M.R. Mathematical Foundations for Design; McGraw-Hill Book Company: New York, NY, USA, 1972. [Google Scholar]
Figure 1.
Number of failures (%) for the low- and medium-pressure networks depending on the causes of their occurrences for (a) steel and (b) plastics.
Figure 1.
Number of failures (%) for the low- and medium-pressure networks depending on the causes of their occurrences for (a) steel and (b) plastics.

Figure 2.
Number of failures (%) for the low- and medium-pressure networks depending on the diameters for (a) steel and (b) plastics.
Figure 2.
Number of failures (%) for the low- and medium-pressure networks depending on the diameters for (a) steel and (b) plastics.

Figure 3.
Failure rates for steel and plastics.
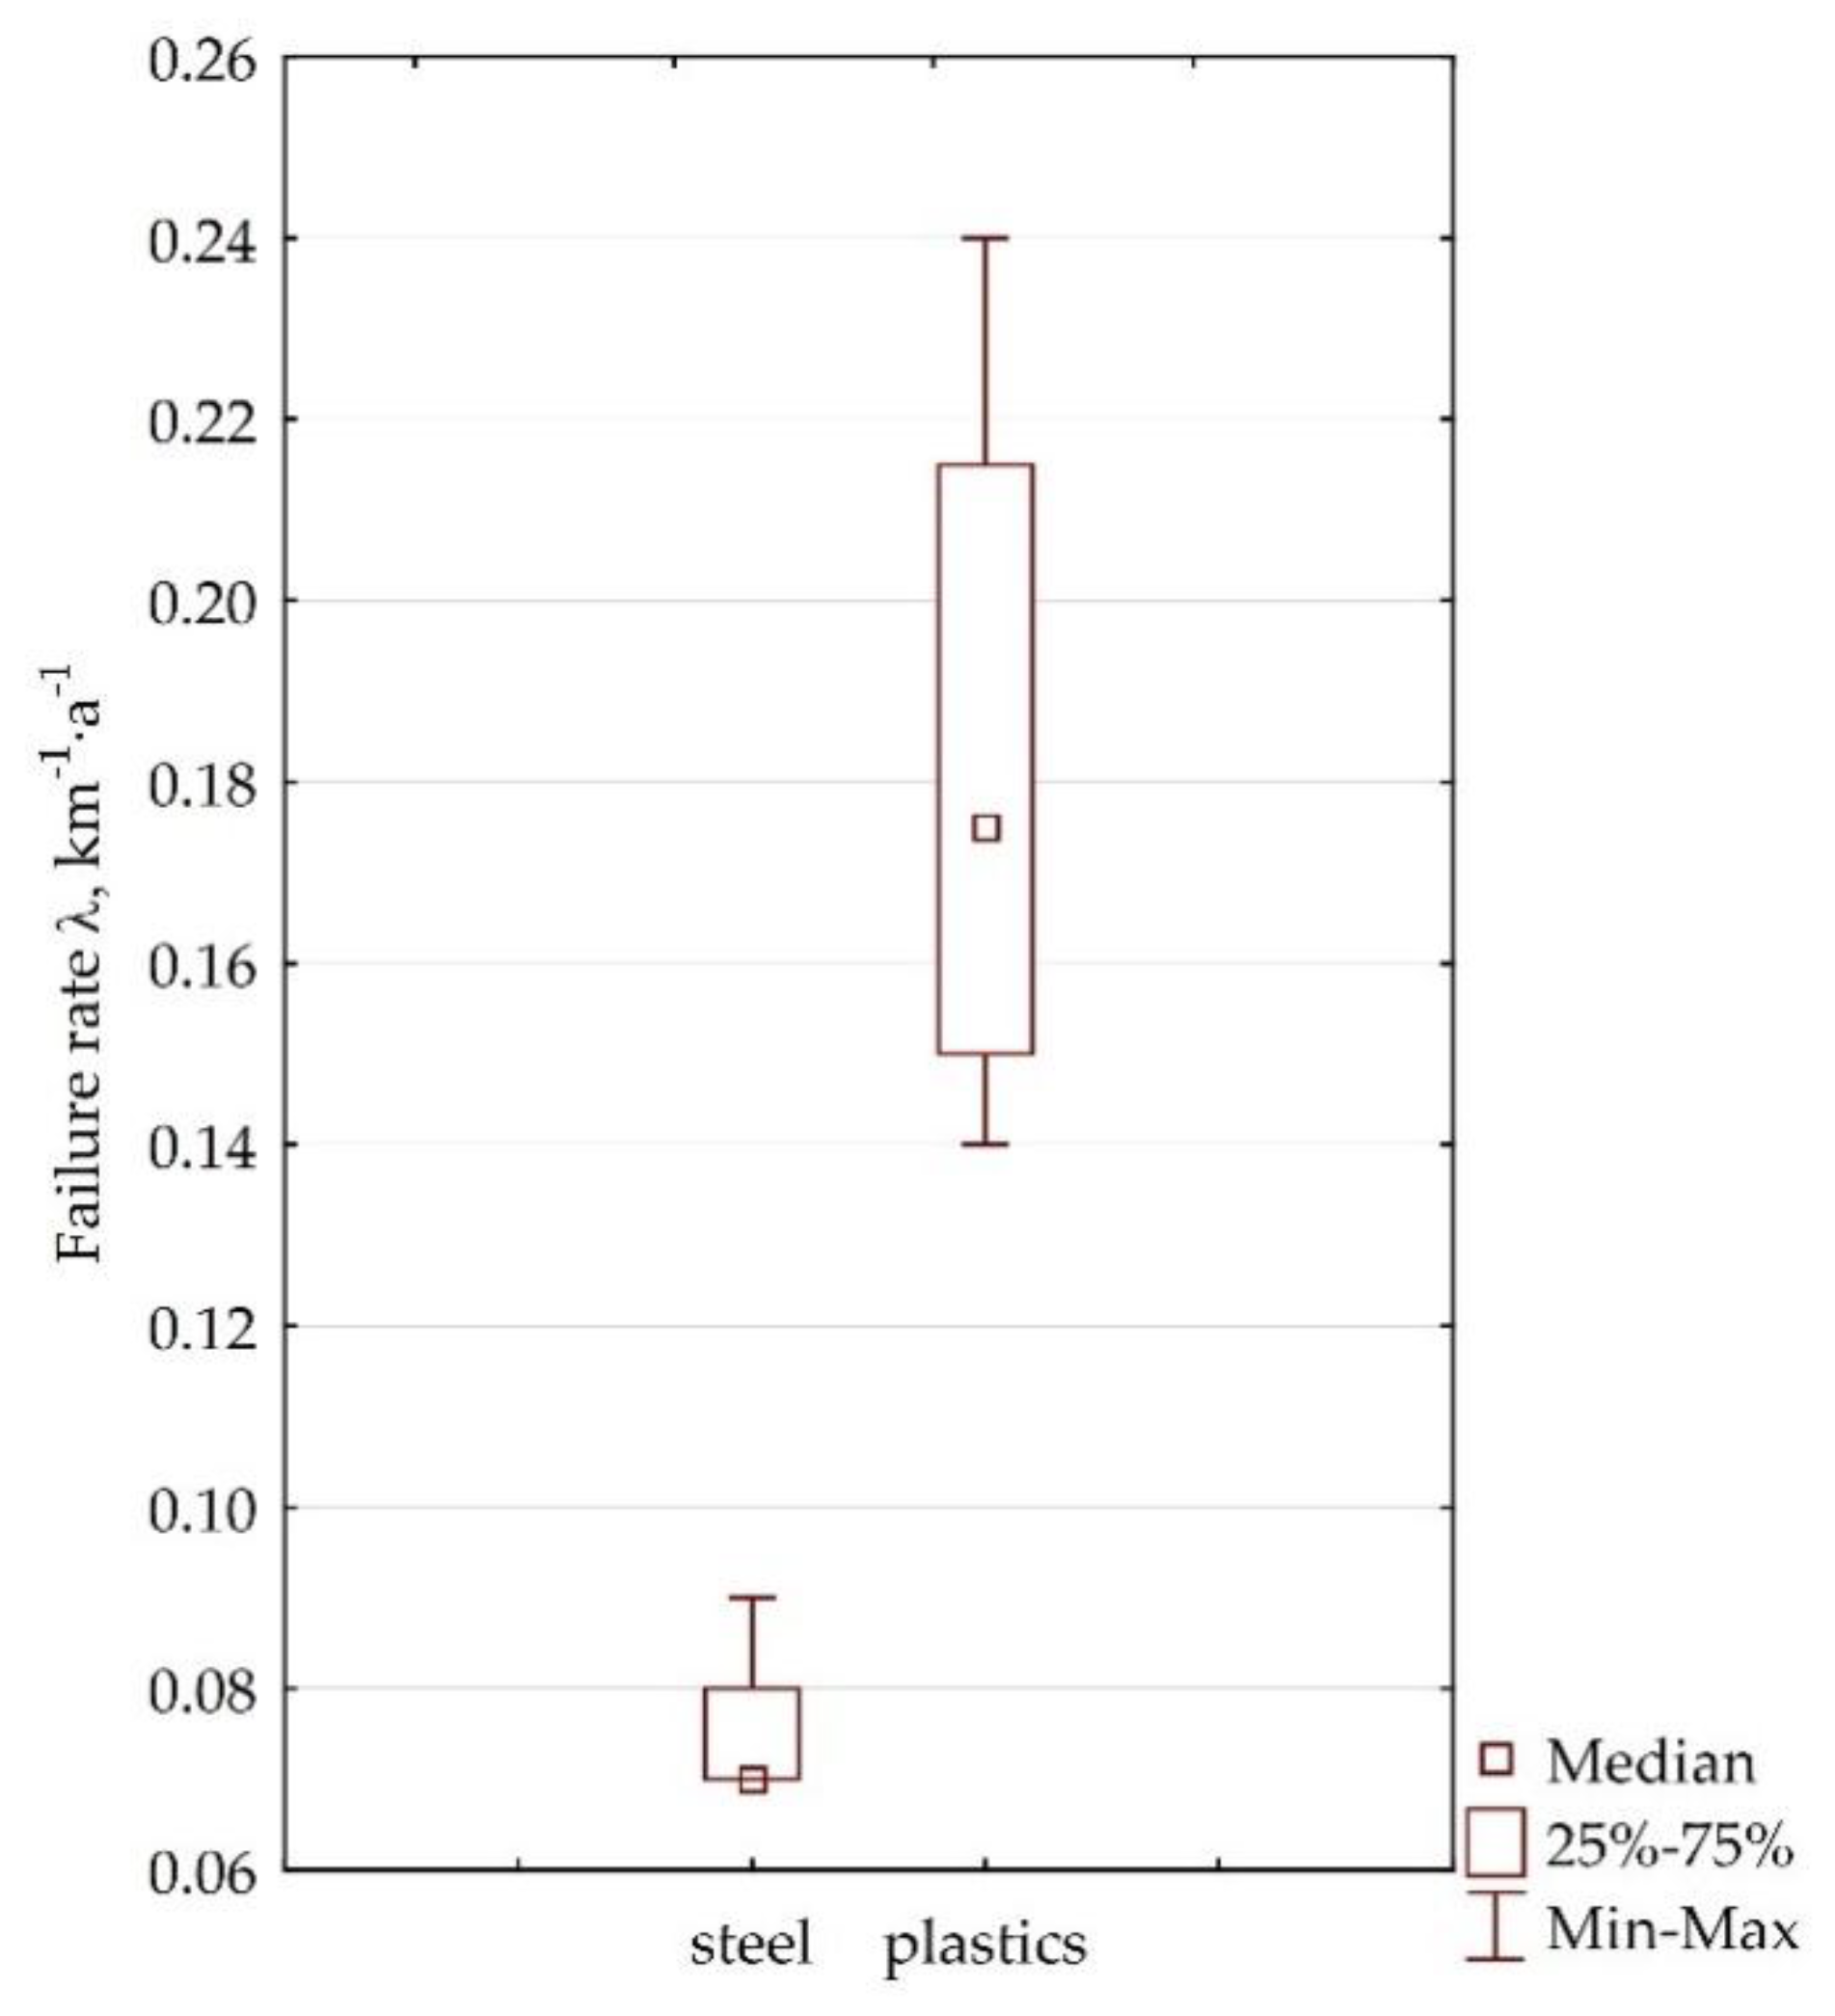
Figure 4.
Relative seasonal fluctuations in number of failures in gas network.

Figure 5.
Absolute seasonal fluctuations in number of failures in gas network.

Figure 6.
Average failure rate in the examined area of gas network for each month.

Figure 7.
The probability of occurrence of k failures for four months in a year.

Figure 8.
The probability of occurrence of k failures for eight months in a year.

© 2018 by the authors. Licensee MDPI, Basel, Switzerland. This article is an open access article distributed under the terms and conditions of the Creative Commons Attribution (CC BY) license (http://creativecommons.org/licenses/by/4.0/).
Share and Cite
MDPI and ACS Style
Tchórzewska-Cieślak, B.; Pietrucha-Urbanik, K.; Urbanik, M.; Rak, J.R. Approaches for Safety Analysis of Gas-Pipeline Functionality in Terms of Failure Occurrence: A Case Study. Energies 2018, 11, 1589. https://doi.org/10.3390/en11061589
AMA Style
Tchórzewska-Cieślak B, Pietrucha-Urbanik K, Urbanik M, Rak JR. Approaches for Safety Analysis of Gas-Pipeline Functionality in Terms of Failure Occurrence: A Case Study. Energies. 2018; 11(6):1589. https://doi.org/10.3390/en11061589
Chicago/Turabian StyleTchórzewska-Cieślak, Barbara, Katarzyna Pietrucha-Urbanik, Marek Urbanik, and Janusz R. Rak. 2018. "Approaches for Safety Analysis of Gas-Pipeline Functionality in Terms of Failure Occurrence: A Case Study" Energies 11, no. 6: 1589. https://doi.org/10.3390/en11061589
Note that from the first issue of 2016, this journal uses article numbers instead of page numbers. See further details here.