The Influence of Operating Parameters on Adsorption/Desorption Characteristics and Performance of the Fluidised Desiccant Cooler


Department of Thermodynamics, Theory of Machines and Thermal Systems, Wroclaw University of Science and Technology, Wybrzeże Wyspiańskiego 27, 50-370 Wroclaw, Poland
*
Author to whom correspondence should be addressed.
Energies 2018, 11(6), 1597; https://doi.org/10.3390/en11061597
Submission received: 21 May 2018
/
Revised: 11 June 2018
/
Accepted: 14 June 2018
/
Published: 19 June 2018
(This article belongs to the Special Issue Energy Systems Engineering)
Abstract
:This paper concerns the issue of the proper selection of the operating parameters of the fluidised desiccant cooler. Despite the fact that fluidised desiccant cooling technology is being reported in the literature as an efficient way to provide cooling for the purposes of air-conditioning, the improper control of its operation can lead to a significantly worse performance than expected. The objective of the presented theoretical study is to provide guidelines on the proper selection of such operating parameters of a fluidized desiccant cooler, such as superficial air velocity, desiccant particle diameter, bed switching time, and desiccant filling height. The influence of the chosen operating parameters on the performance of fluidised desiccant cooling technology is investigated based on their impact on electric and thermal coefficients of performance (COP) and specific cooling power (SCP). Moreover, the influence of the outlet air temperature, humidity, and desiccant water uptake on the adsorption/desorption characteristics was investigated, contributing to better understanding of sorption processes.
1. Introduction
Alternative cooling technologies, such as fluidised desiccant coolers, are nowadays of great interest. Thanks to its advantages, fluidised desiccant cooling is especially promising. Unlike adsorption cooling [1,2], it does not require low pressure maintenance, which greatly affects investment costs. On the other hand, when compared to fixed beds systems, it provides increased adsorption kinetics and a lower air pressure drop [3]. This technology is at the early stage of development, however, a few prototypes of fluidised desiccant dehumidifiers (fluidised beds) have been already developed. The prototype of a low-cost self-circulating fluidised desiccant dehumidifier was presented by Chen et al. [4]. The next generation of this prototype was presented by Chiang et al. [5]. The maximum values of the electric coefficients of performance (COP) and the specific cooling power (SCP) of these prototypes were reported as 0.37 and 287 W/kg, respectively. According to the theoretical study by Rogala et al. [6], the performance of a fluidized desiccant cooler FDC can be much better (reaching an electric COP of about 10 and a SCP of about 500 W/kg). This lower than expected performance probably results from the improper selection of operating parameters, such as desiccant particle diameter, desiccant filling height, superficial air velocity, and bed switching time. A better understanding of the adsorption mechanism in the fluidised bed and the relation between the above mentioned operating parameters and FDC performance would greatly contribute to the development of FDC technology. This paper presents a modelling analysis of the influence of operating parameters on the performance of FDC, as well as on air desiccation (adsorption) and desiccant regeneration (desorption). The modelling was conducted using the model that was developed by the authors, which was comprehensively presented in the work of Rogala et al. [7]. The operating parameters that were analyzed are the desiccant particle diameter, bed switching time (tsw), superficial air velocities during adsorption (Uads) and desorption (Udes), and desiccant filling height (Hd).
The performance of the FDC should be assessed and compared to the performance of the reference technologies, such as adsorption cooling [3] and vapor-compression cooling [8,9]. The adsorption chillers are reported to feature a thermal COP ranging from 0.5 to 0.6 [10] (while driven by similar heating and cooling temperatures to the FDC). Such systems do not utilize electric power as a primary energy source. However, according to Chorowski et al. [2], some electric power is consumed by the cooling tower and pumping systems. The maximum reported SCP of the adsorption chillers (while driven by similar heating and cooling temperatures to the FDC) does not exceed 300 W/kg [11]. On the other hand, vapor-compression chillers are supplied only with the electric power, which is spent on running the compressor and the secondary systems (e.g., condenser fans). Vapor-compression chillers are reported to feature electric COP up to 3 [8,9]. A FDC is primarily supplied with thermal power and, when it is properly designed and operated, it should achieve a thermal COP similar to the adsorption chillers. Furthermore, the electric power is needed to run the fans of the FDC. A FDC should consume significantly less electricity than a vapor-compression chiller, as electric power is its secondary energy source. Therefore, the electric COP of a FDC should be 2–3 times higher. The primary aim of this study is to assess whether the abovementioned performance can be theoretically be reached and to indicate the proper ranges of the operating parameters. The fulfillment of these requirements will make the FDC competitive to the reference technologies.
2. Modelling
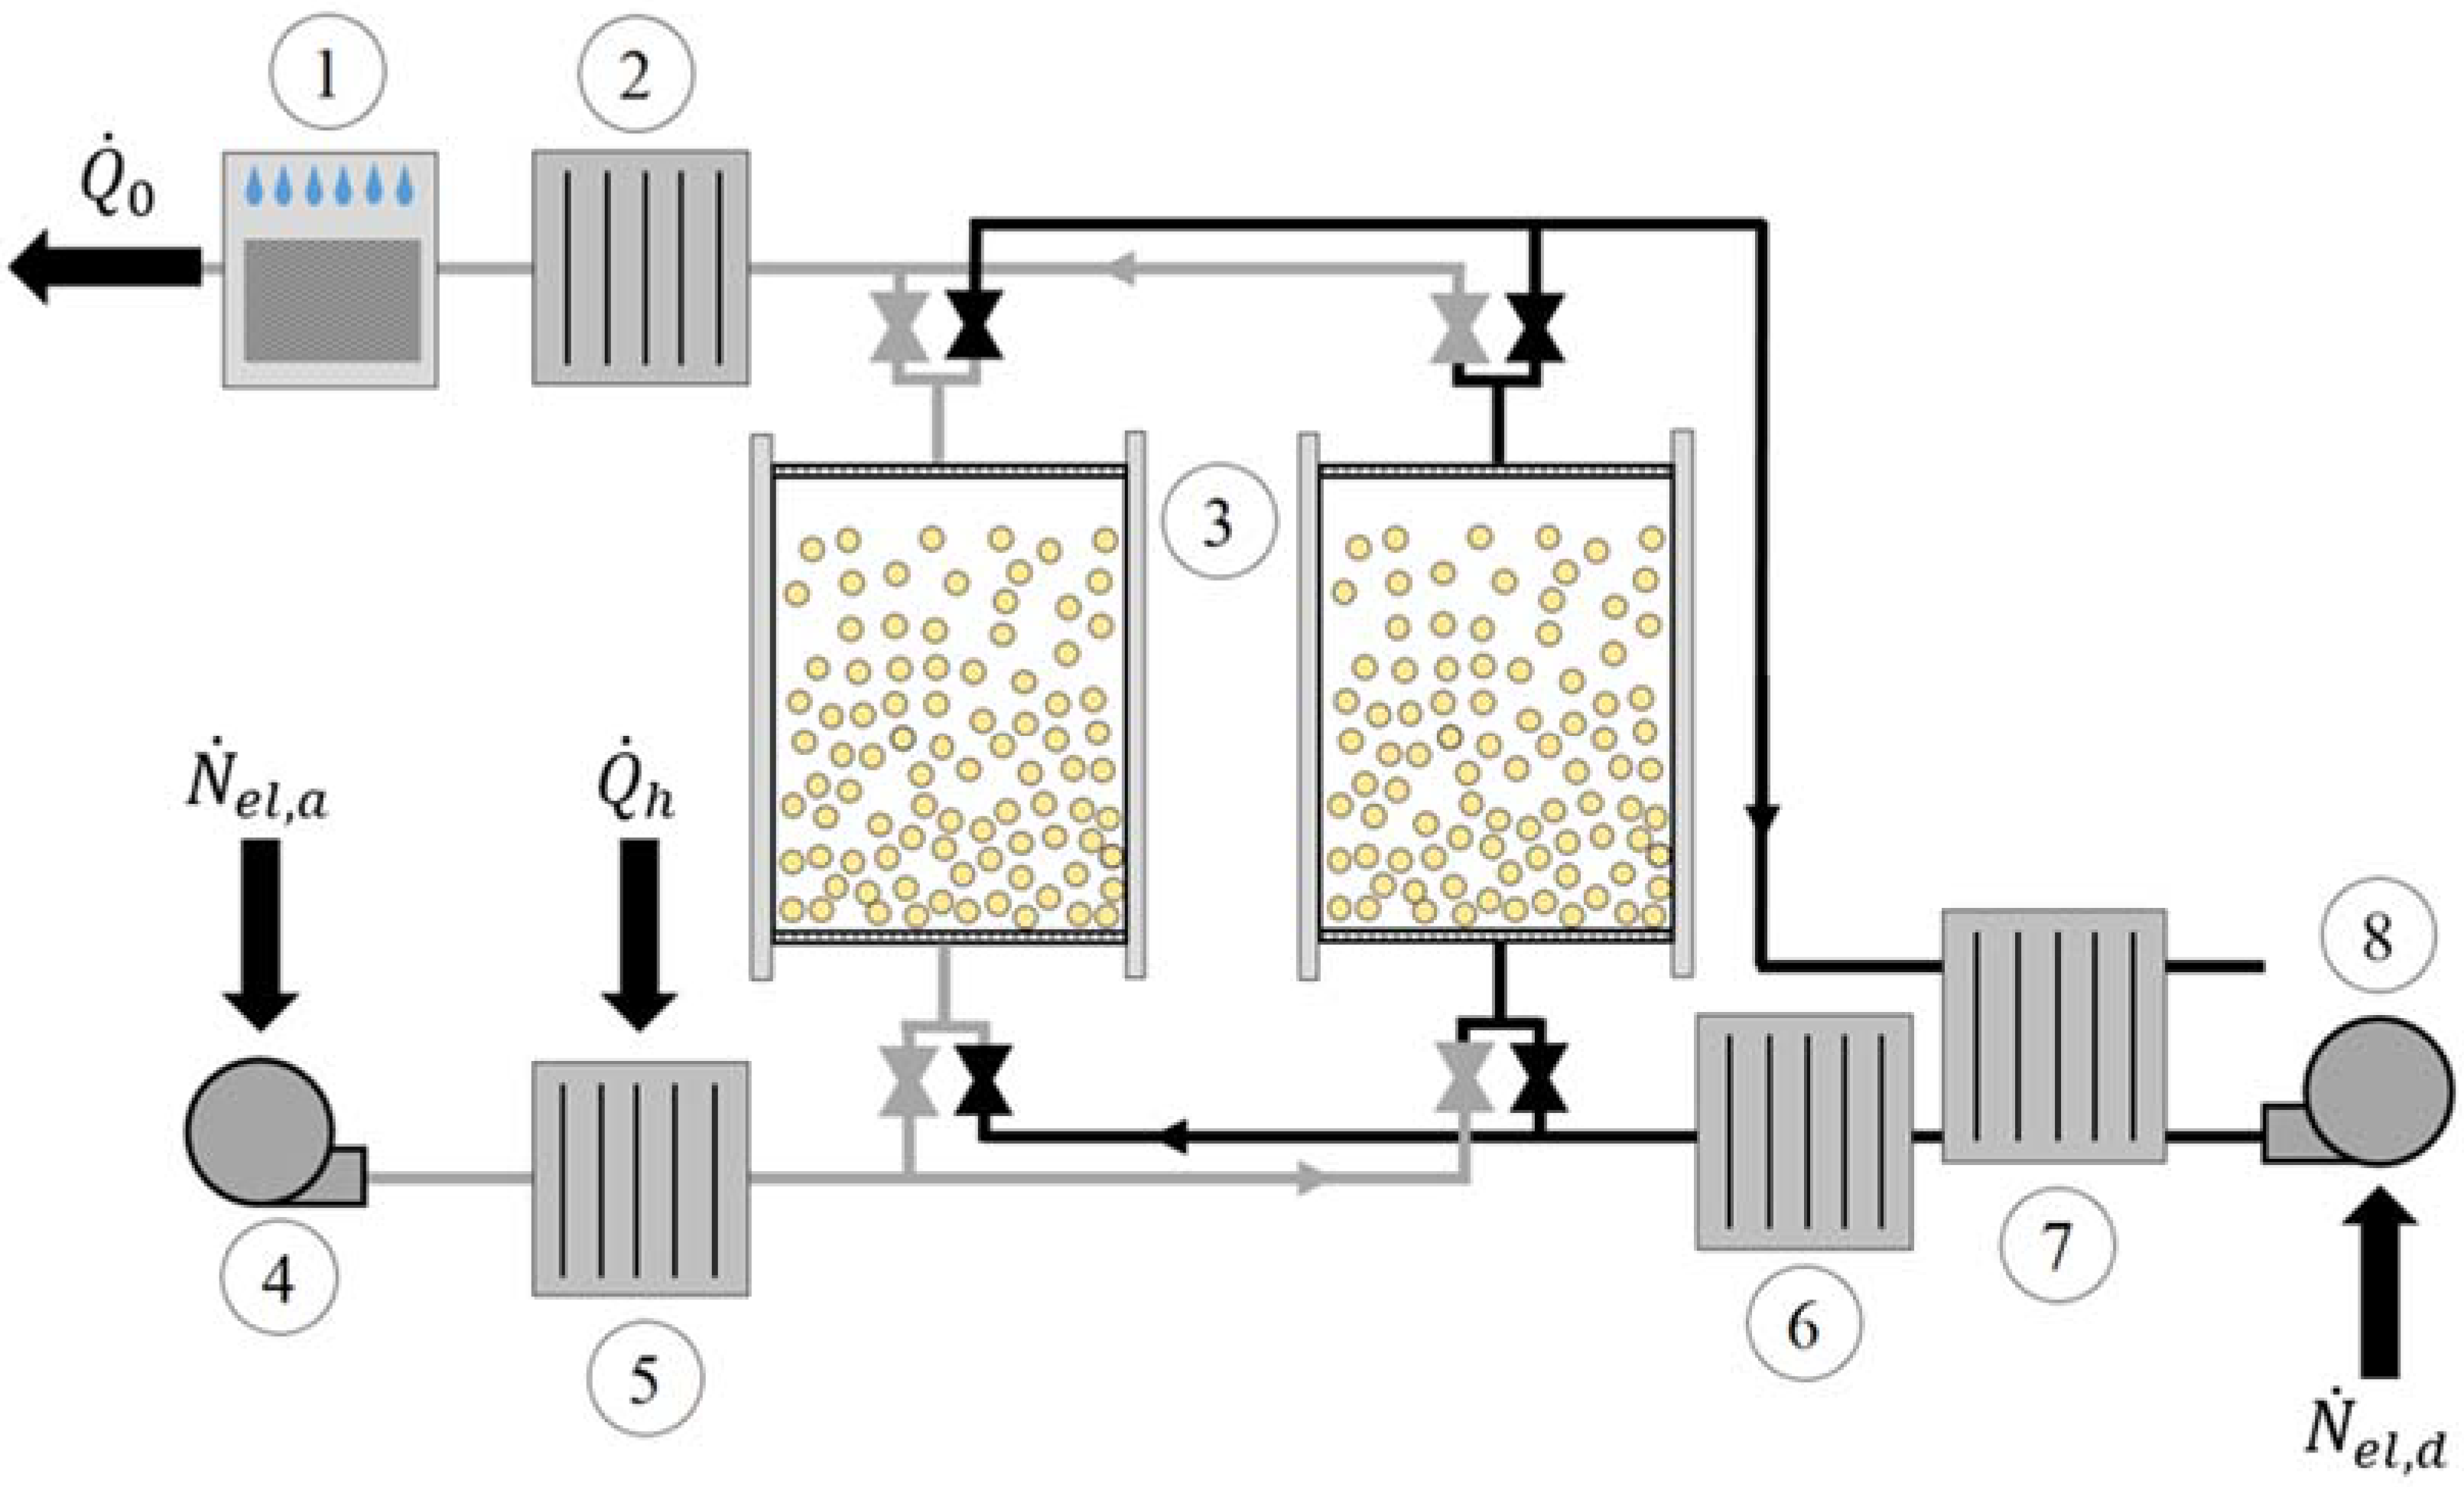
The scheme of the FDC is presented in Figure 1. The operating principle of FDC can be described on the basis of this figure. The system consists of two fluidised beds (3) filled with a desiccant (e.g., silica gel). The beds are periodically supplied with hot or cold air. The fan (4) blows the air through the air cooler (5). The cooled air enters the fluidised bed (3). Because of the adsorption, the air is dehumidified and warmed up. Then, the dehumidified air is cooled again in the air cooler (2), and finally, it is humidified in the humidifier (1), which results in an air temperature drop. Simultaneously, the desiccant contained in the second fluidised bed is regenerated. The fan (8) blows the air through the recovery heat exchanger (7) and the air heater (6). Then, the hot air enters the fluidised bed, where, as a result of the high temperature of the air, the desorption of water from the desiccant proceeds. At last, the regenerated air flows through the recovery heat exchanger (7).
The modelling of the above described FDC was carried out using our original, experimentally validated model, which is comprehensively described by Rogala et al. [7]. The modelling is based on energy and conservation equations, which are used to calculate the temperature and humidity of the air at the outlet of the fluidised bed and the temperature of the desiccant. The model provides full information about the temperatures and water contents of both the air and desiccant at any time of the sorption process. This data can be used to estimate the performance of the FDC, which is described by thermal COP, electric COP, and SCP, as follows:
The cooling power is generated as a result of the water evaporation. Assuming that the air humidity at the inlet and the outlet of the FDC does not change, the cooling power can be estimated based on the change of the desiccant water uptake within the switching time, as follows:
where Δw is the change of the desiccant water uptake within the switching time tsw. On the other hand, the heating power can be estimated based on the mean air temperature change during regeneration ΔTmean before and after the desorption bed, as follows:
The electric power is consumed by electric fans and is expressed as follows:
where the pressure drop that is generated in the fluidised bed is equal to [3], as follows:
Combining Equations (1)–(7), the performance of FDC can be expressed as follows:
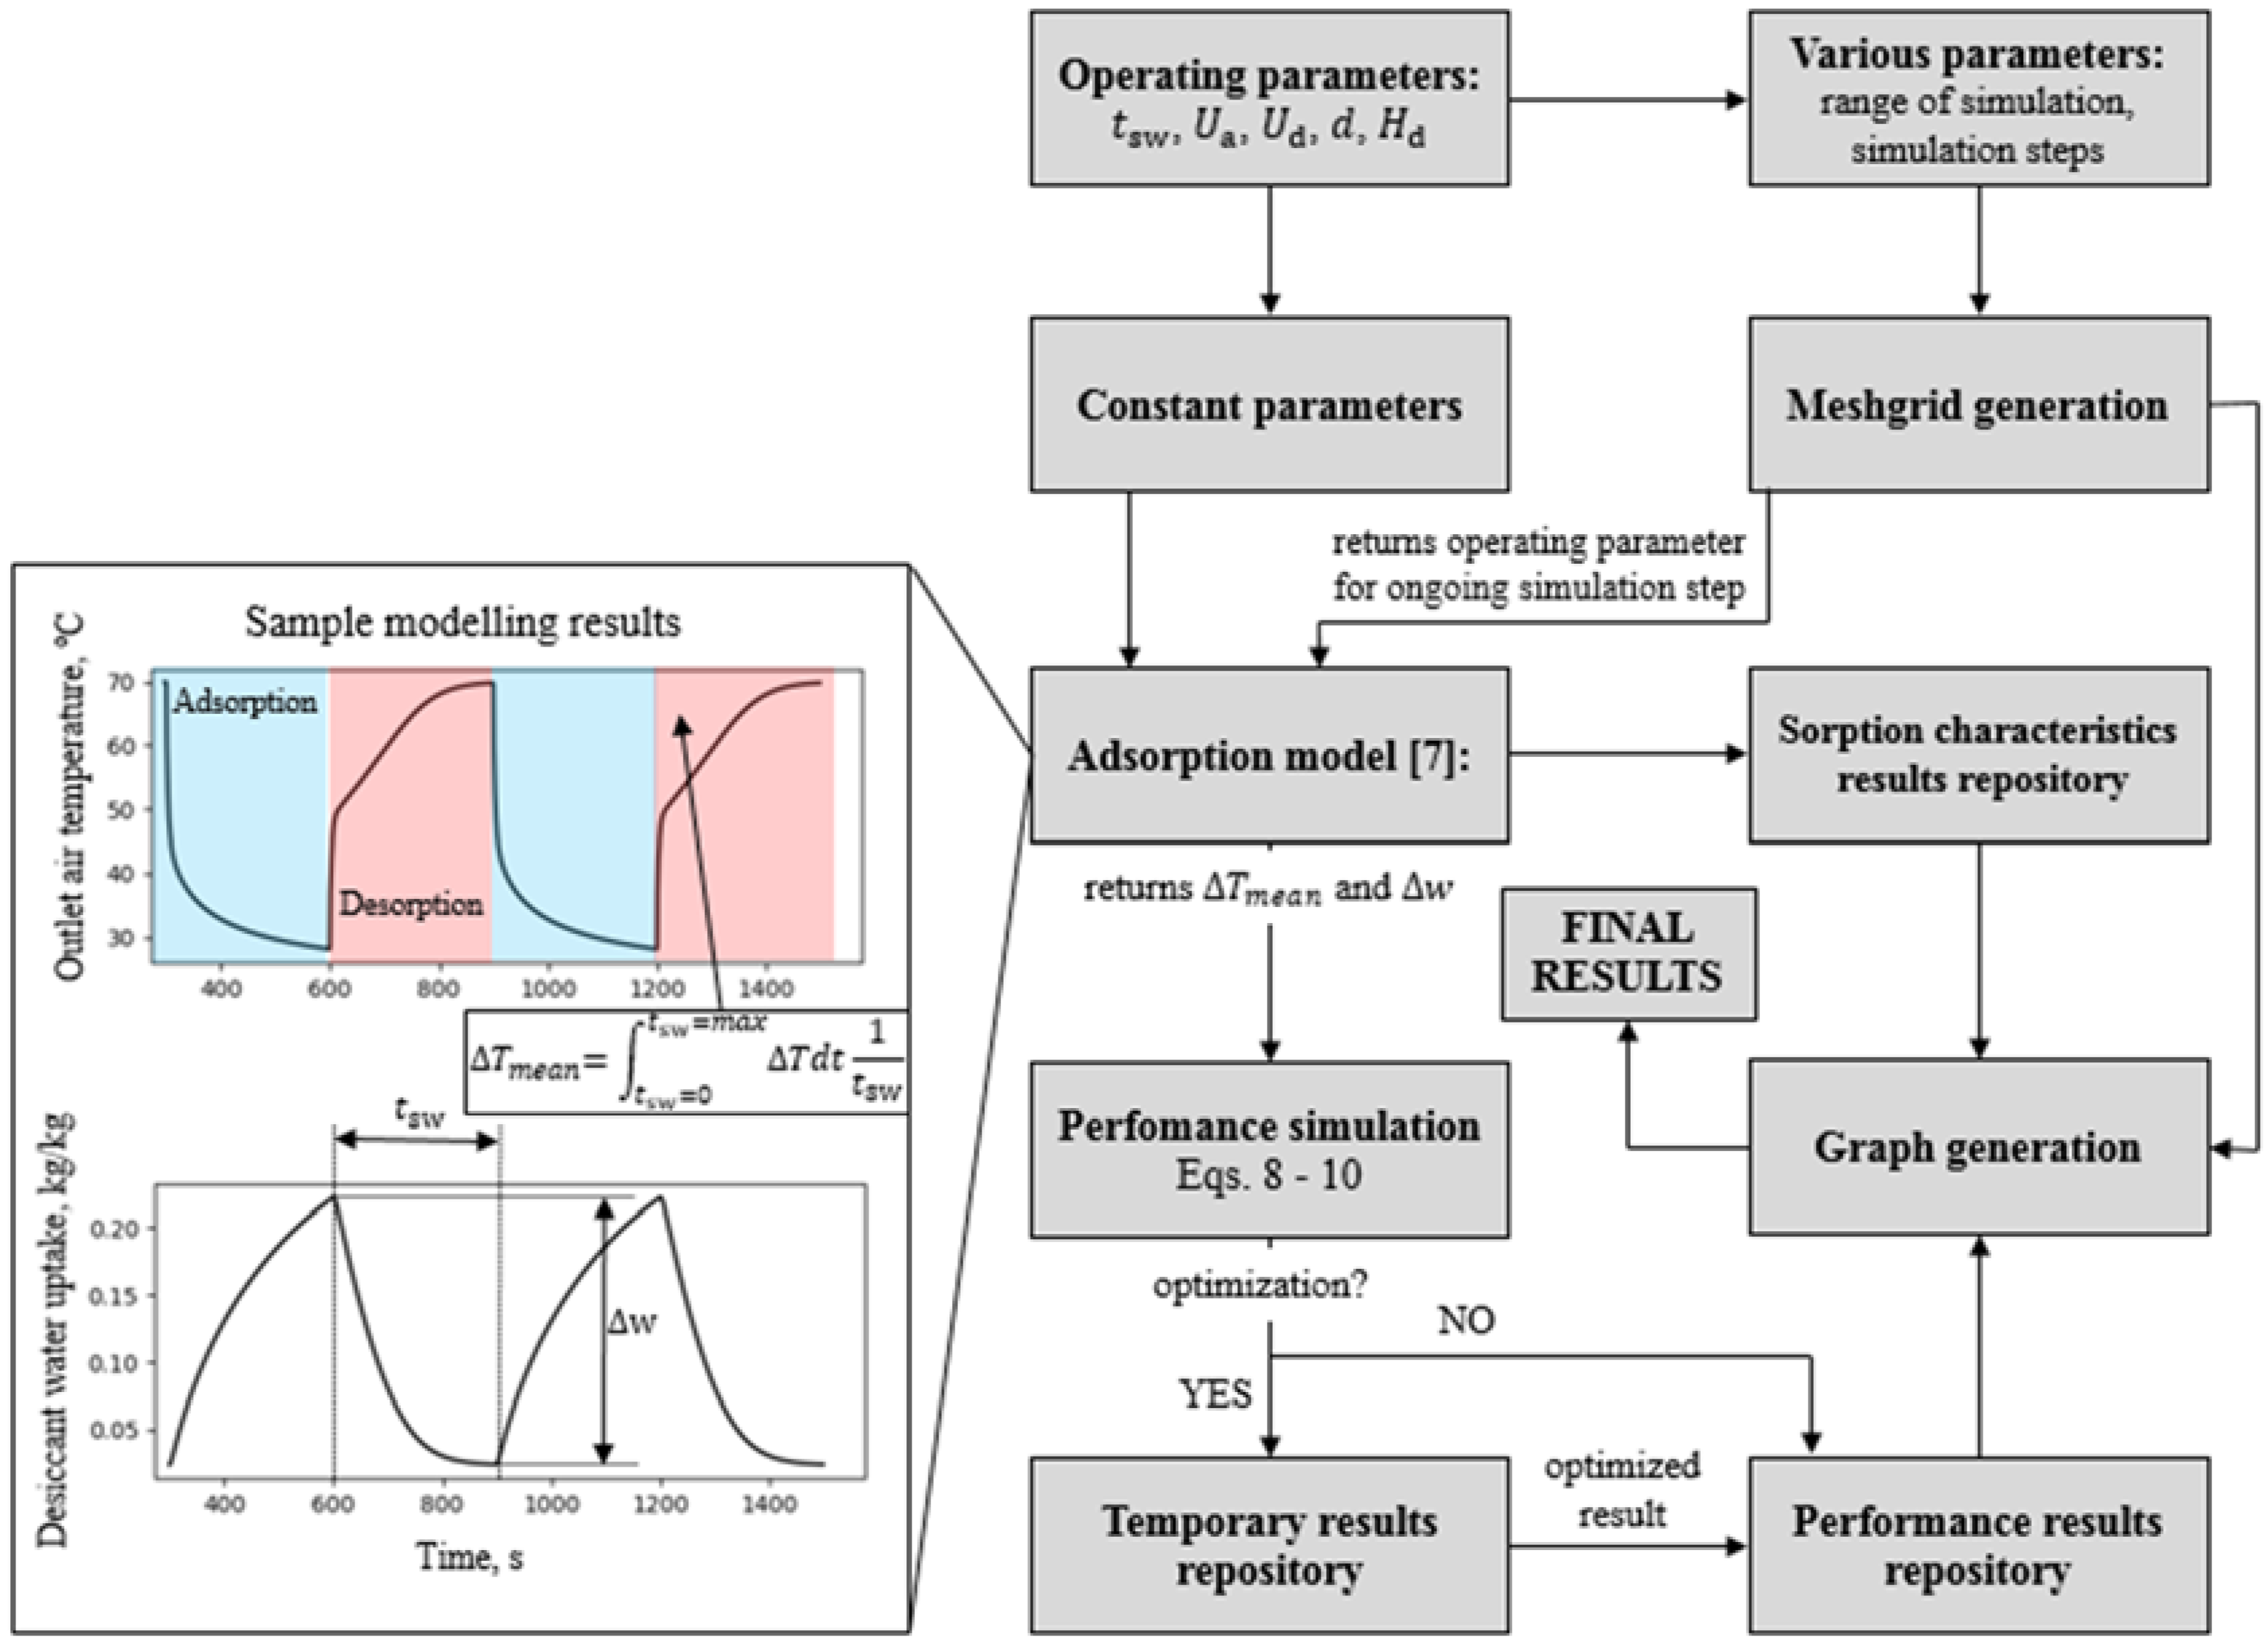
The change of the desiccant water uptake Δw within the given time tsw and the mean air temperature change ΔTmean are provided by the model. The model was implemented in the simulation procedure, presented in Figure 2, and was developed in the programming language (PYTHON). The simulation procedure allows the modeling of the influence of the chosen operating parameters. Based on the operating parameters that were chosen to be varied throughout the simulation, a meshgrid is generated. The meshgrid provides the input data for the sorption model. The modelling of the sorption processes in the fluidised bed is performed for every single node of the meshgrid. The model provides either information on the sorption characteristics or the parameters that are required for performance evaluation, Equations (8)–(10), as the change of the water uptake Δw and mean air temperature drop on the desorbing fluidised bed ΔTmean. The results that were obtained during a single simulation step are stored in separate directories. In some of the simulations, the additional optimization procedure was implemented. When the simulations are completed, graphical results are generated. A complete simulation consists of thousands of single simulations. The presented simulation procedure took between hours to even a few days, depending on the simulation type.
The performance of the FDC and the adsorption/desorption characteristics were modelled for the selected range of the operating parameters. The analyzed ranges of these parameters are reported in Table 1. The temperatures of the adsorption, desorption, and inlet air humidity were kept constant during the modelling and were assumed to be 25 °C, 60 °C, and 12 g/kg, respectively.
3. Results and Discussion
3.1. The Effect of Desiccant Particle Diameter
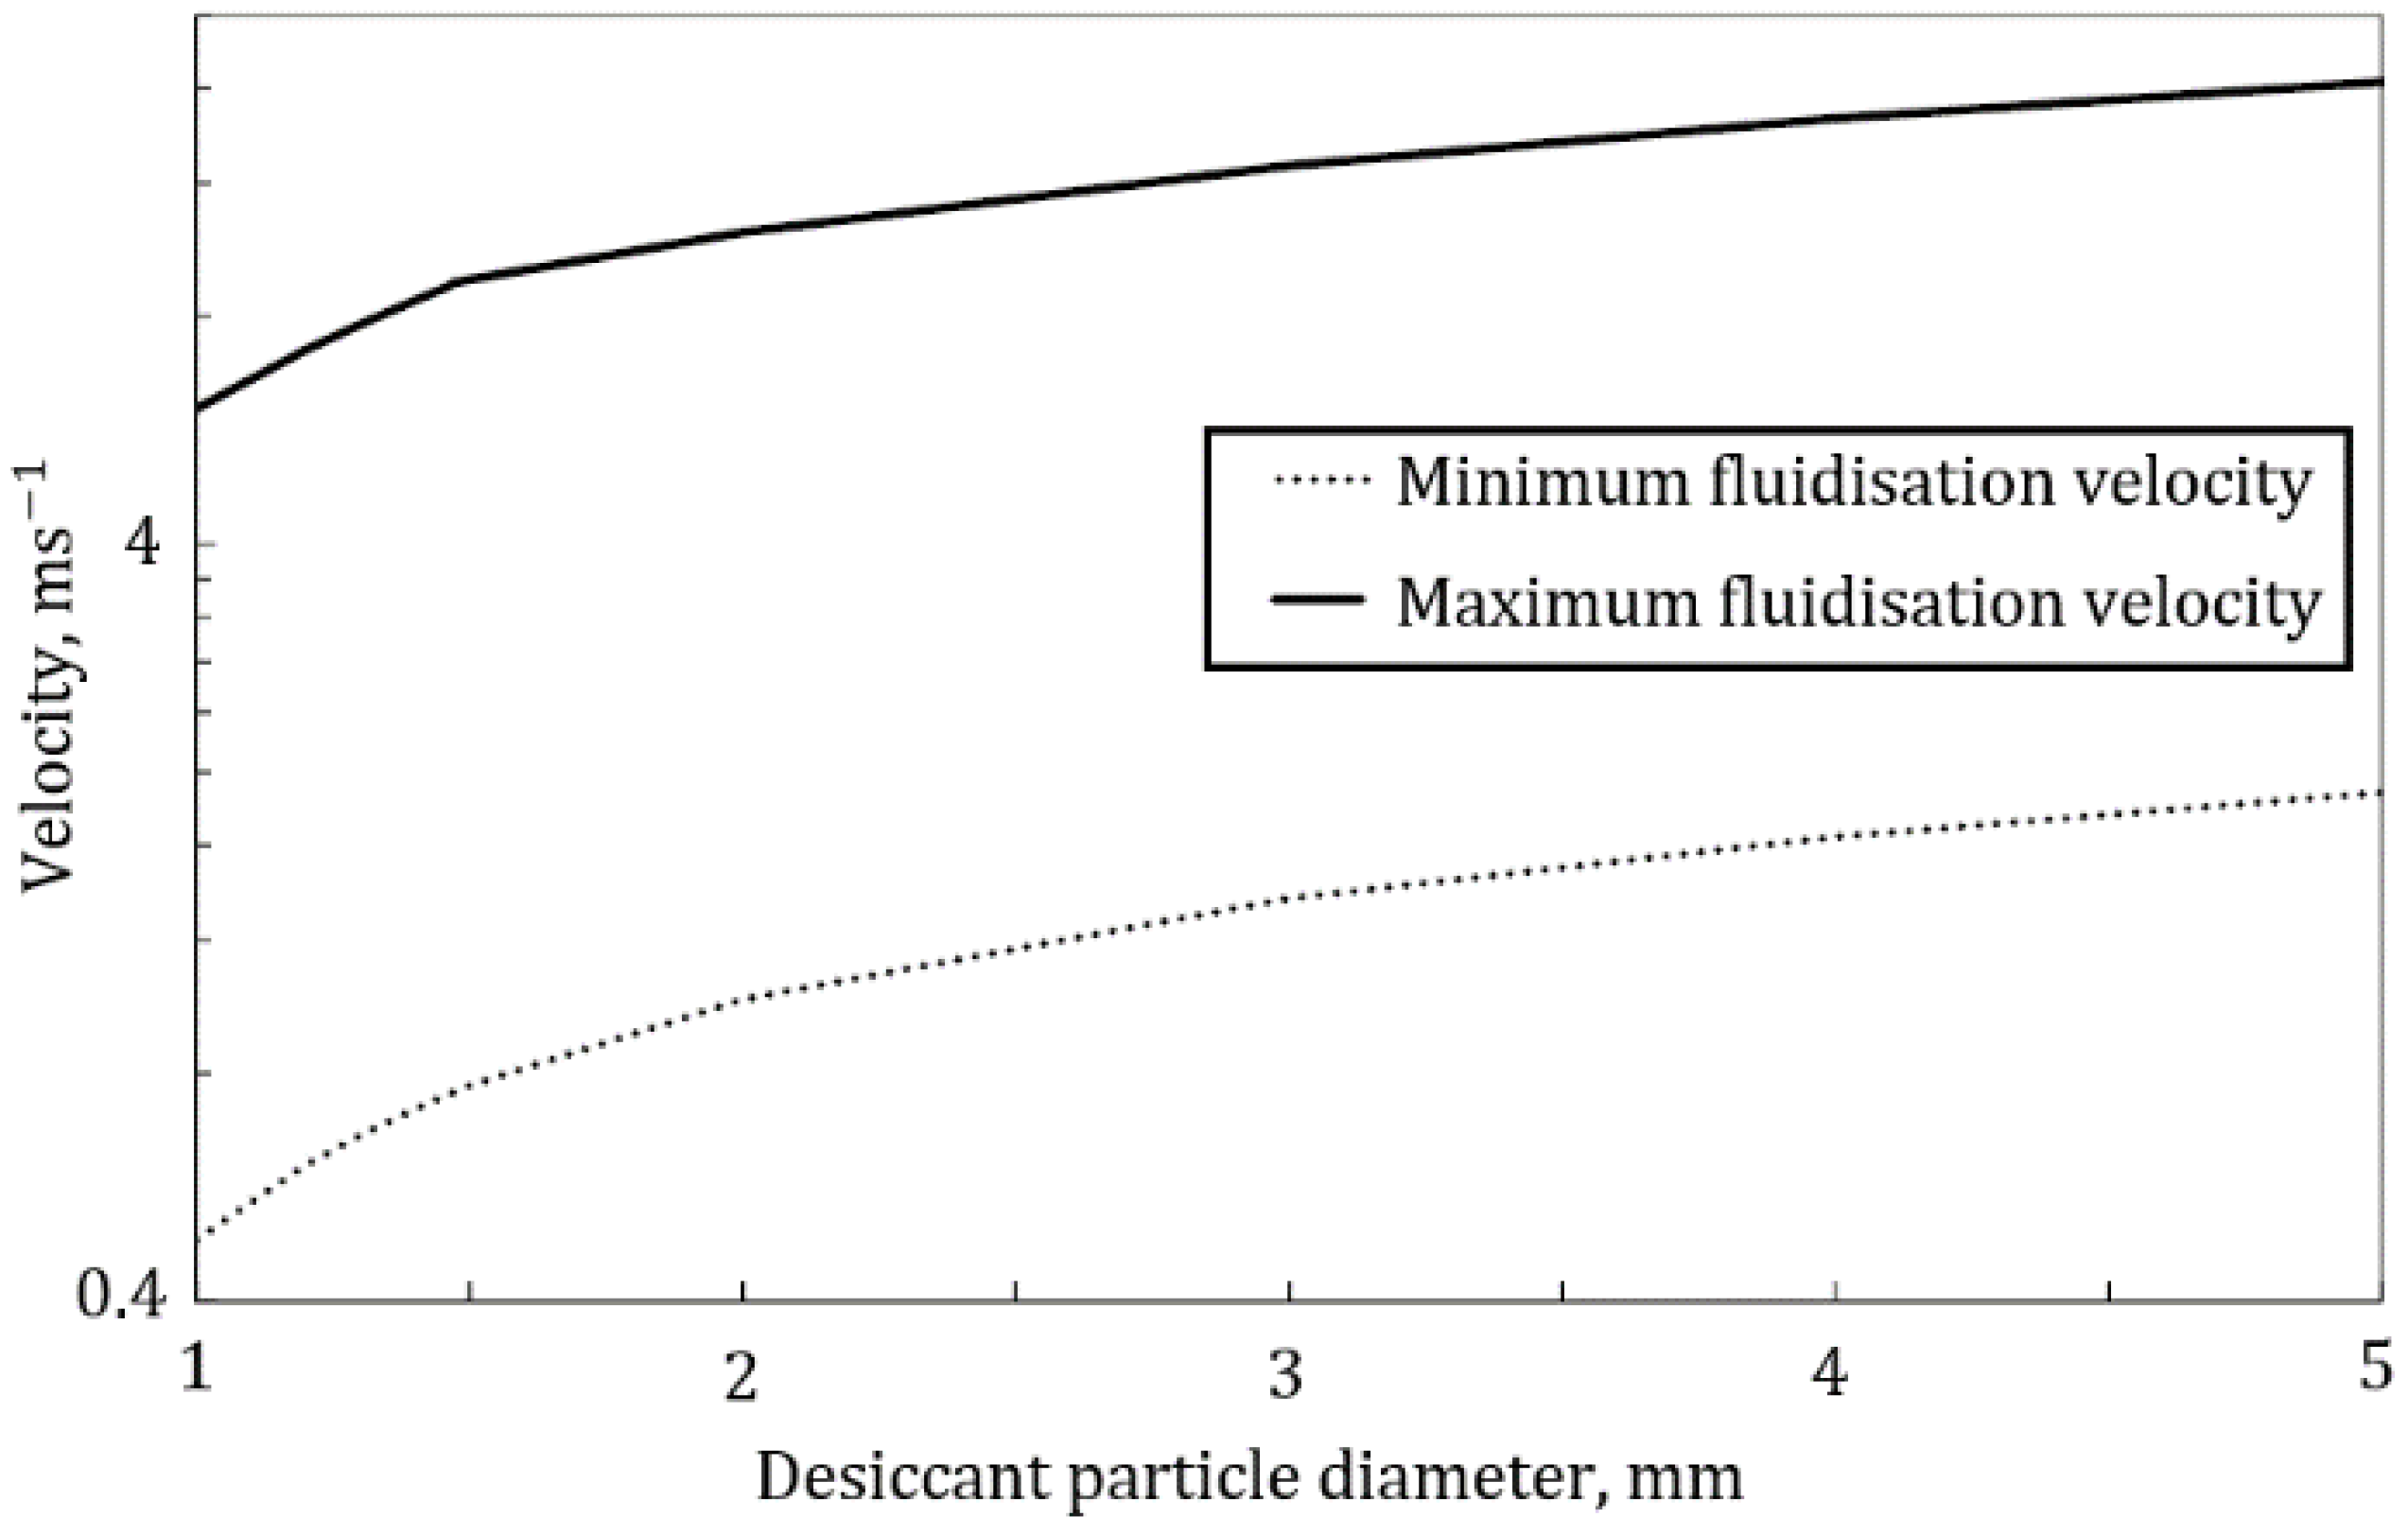
At first, the effect of the desiccant particle diameter on the performance of the FDC was investigated. In the FDC, the desiccant was simply poured into the fluidised bed. Therefore, some of the limitations that were related to the adsorption cooling systems did not occur (i.e., the contact resistance and the inter-particle mass transfer resistance) [12,13]. On the other hand, the desiccant particle diameter influenced the minimum [4] and the maximum [14] fluidisation velocities, which is visualized in Figure 3. For the desiccant particle with a diameter of 5 mm, the difference between the minimum and the maximum fluidisation velocities was significant. The smaller the desiccant particle was, the more narrow the regime of fluidisation was. For the desiccant particle with a diameter of 1 mm, fluidisation was possible for the superficial air velocities ranging between 1 and 6 m/s. For the smaller desiccant particles, which were not discussed in this paper, the fluidisation regime may have been even more limited.
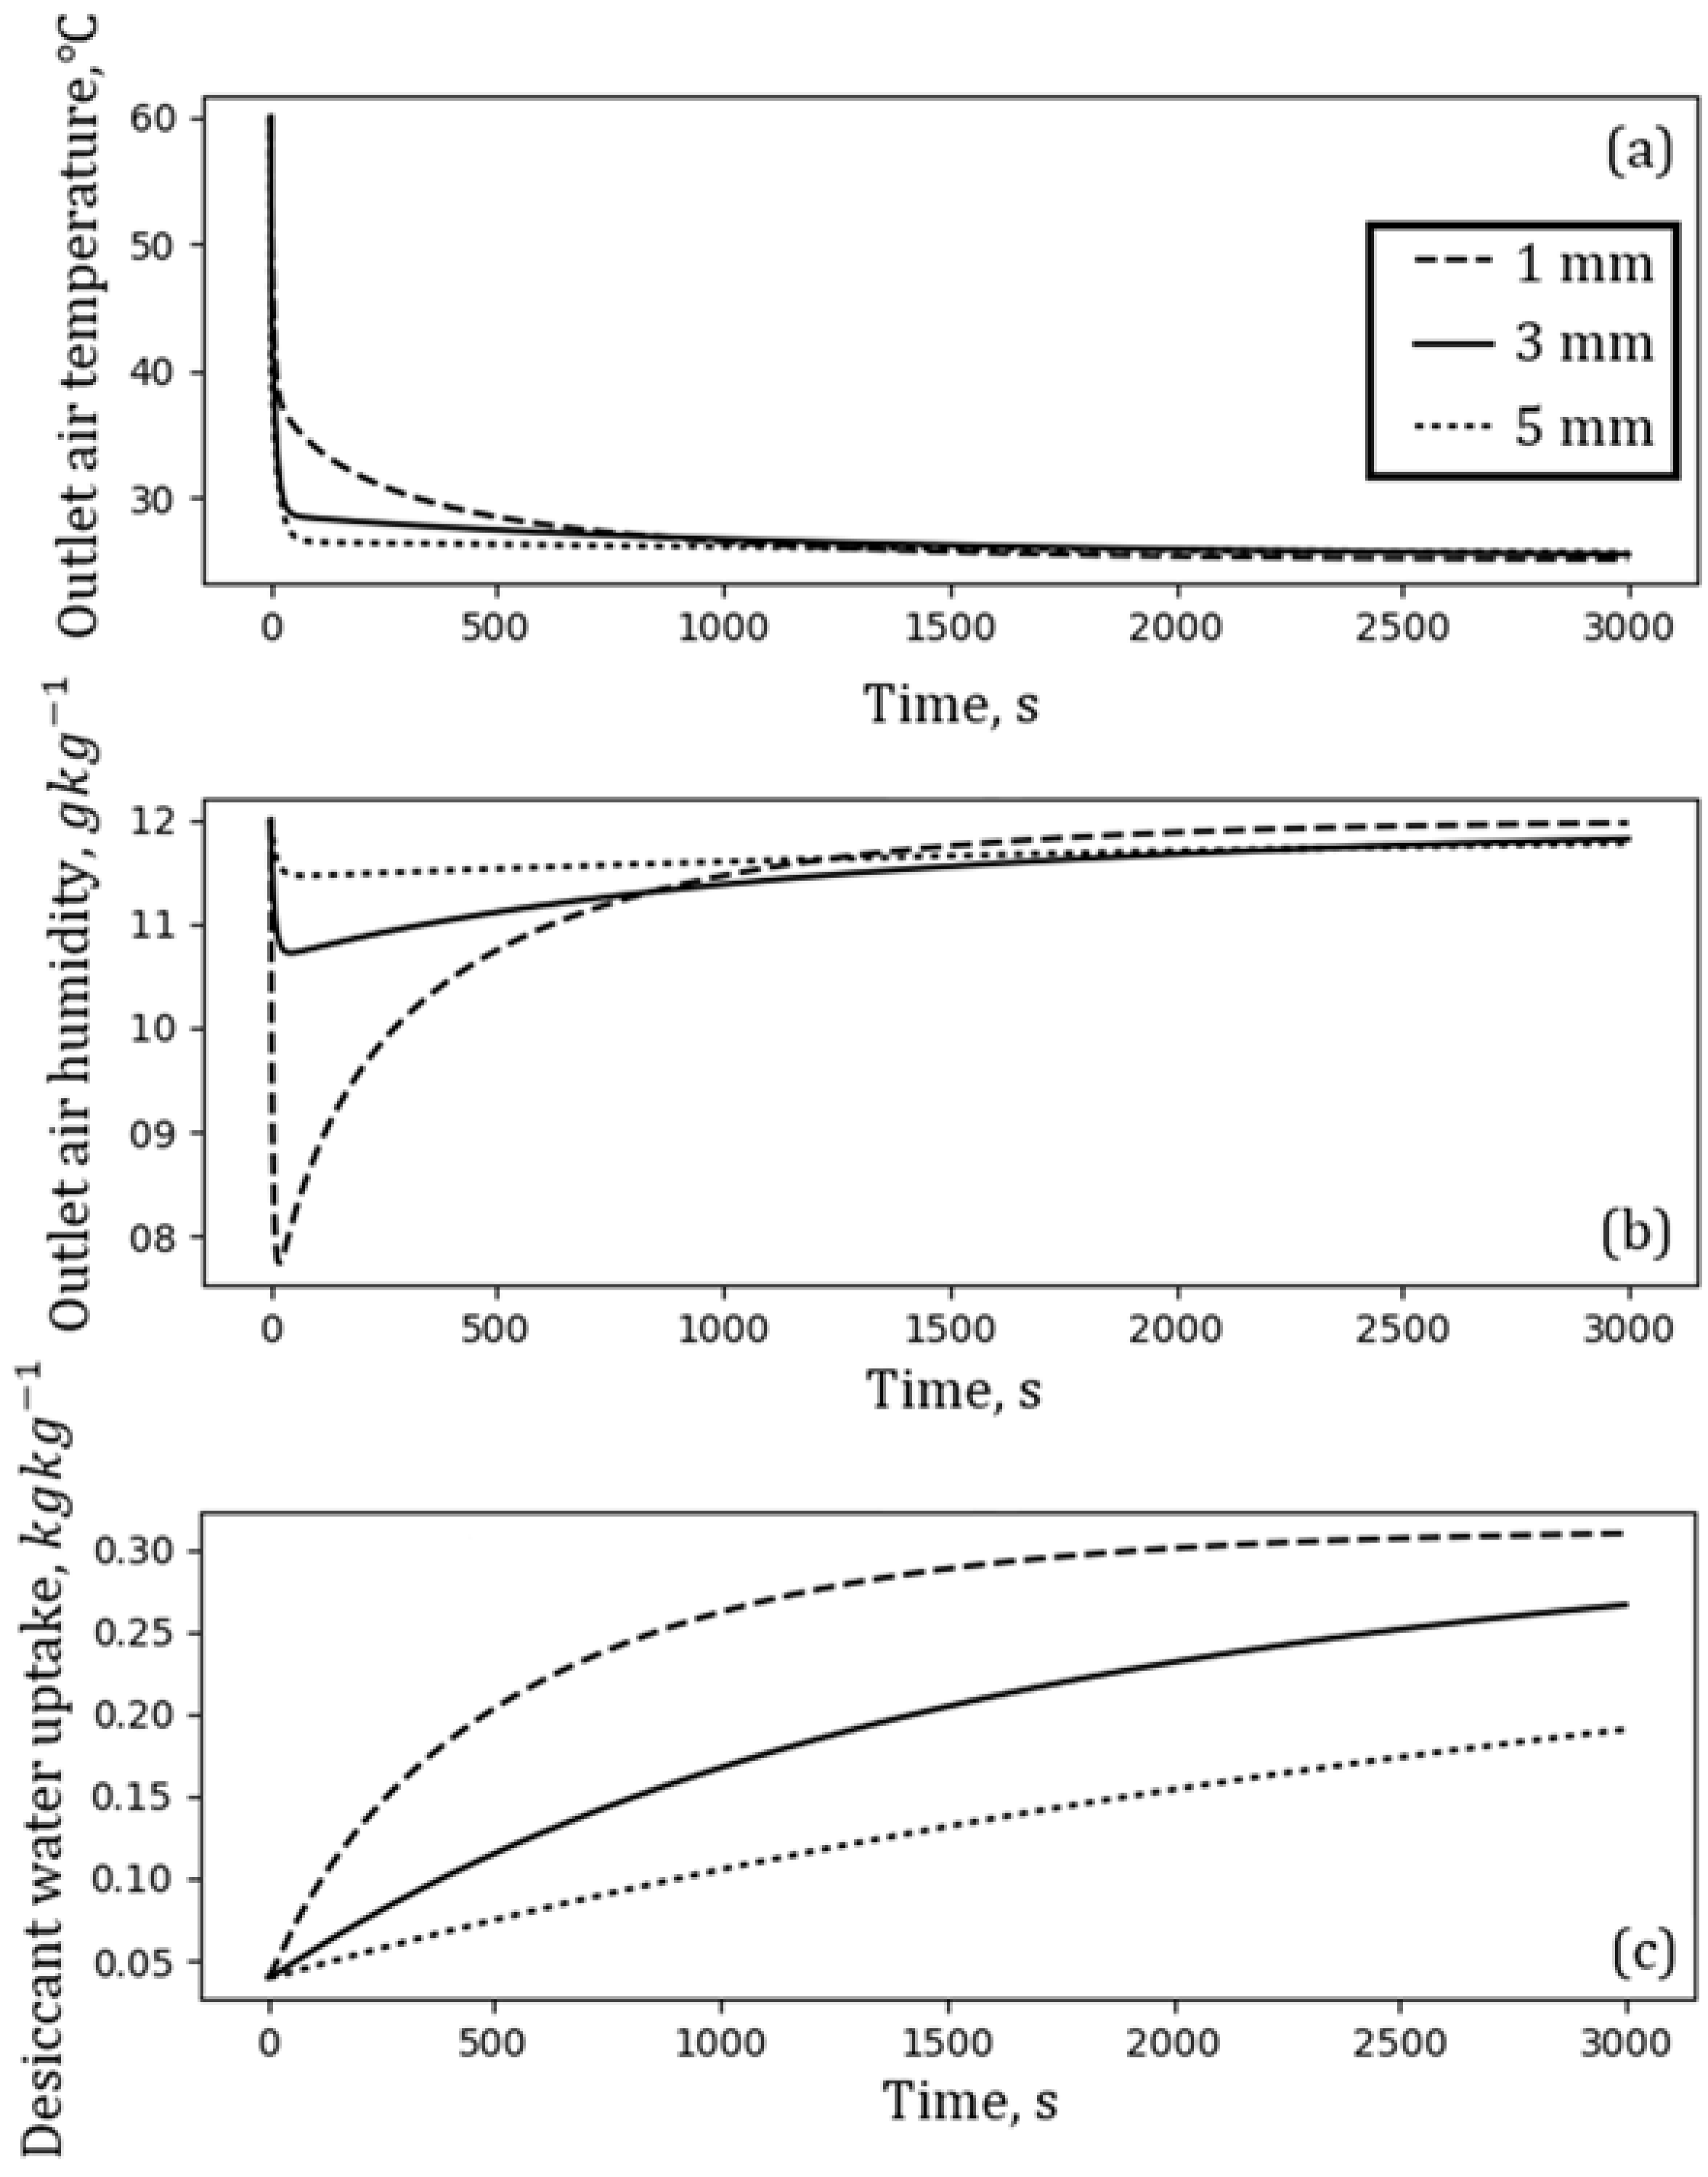
The influence of the desiccant particle diameter on the adsorption characteristics is presented in Figure 4. Particle diameters of 1 mm, 3 mm, and 5 mm were investigated. Other operating parameters were set according to Table 1.
The desiccant particle diameter significantly affects the kinetics of adsorption. Because of the very good contact of each particle with the passing air, the intraparticle resistance became the main limitation of the heat and mass transfer. The particles with the diameter of 1mm increased the water uptake much faster than those with a 3 mm or 5 mm diameter (see, Figure 4c). A higher adsorption rate resulted in better initial desiccation of the air (see, Figure 4b), but on the other hand, the outlet air humidity returned much faster to the base value. According to Figure 4a, the adsorption tended to start at higher temperatures in the case of the smaller desiccant particle diameters. The application of smaller particles could therefore not only enhance the kinetics of the adsorption, but enabled the utilization of higher temperature heat sinks.
The positive influence of the decreased desiccant particle diameter can also be seen in Figure 5, which presents desorption characteristics of the FDC, namely the air temperature at the outlet (see Figure 5a), the air humidity at the outlet (see Figure 5b), and the desiccant water uptake (see Figure 5c). The start of the desorption was shifted towards a lower temperature and, in the case of desiccant particles with the diameter of 1 mm, the desorption was established at 40 °C (which was indicated by the sudden change of line steepness in Figure 5a). This meant that a decrease of the desiccant particle diameter enabled the use of lower temperature heat sources and thus expanded the utilization of the low potential energy. The kinetics of desorption were enhanced with smaller particles, which resulted in a much greater air humidity at the outlet at the beginning of the desorption (see Figure 5b), and a shorter time was needed to reach the equilibrium water uptake (see Figure 5c). The reduction of the desiccant particle diameter resulted in the reduced time of the complete regeneration (see Figure 5c) and could probably greatly increase the SCP without the loss in the COP.
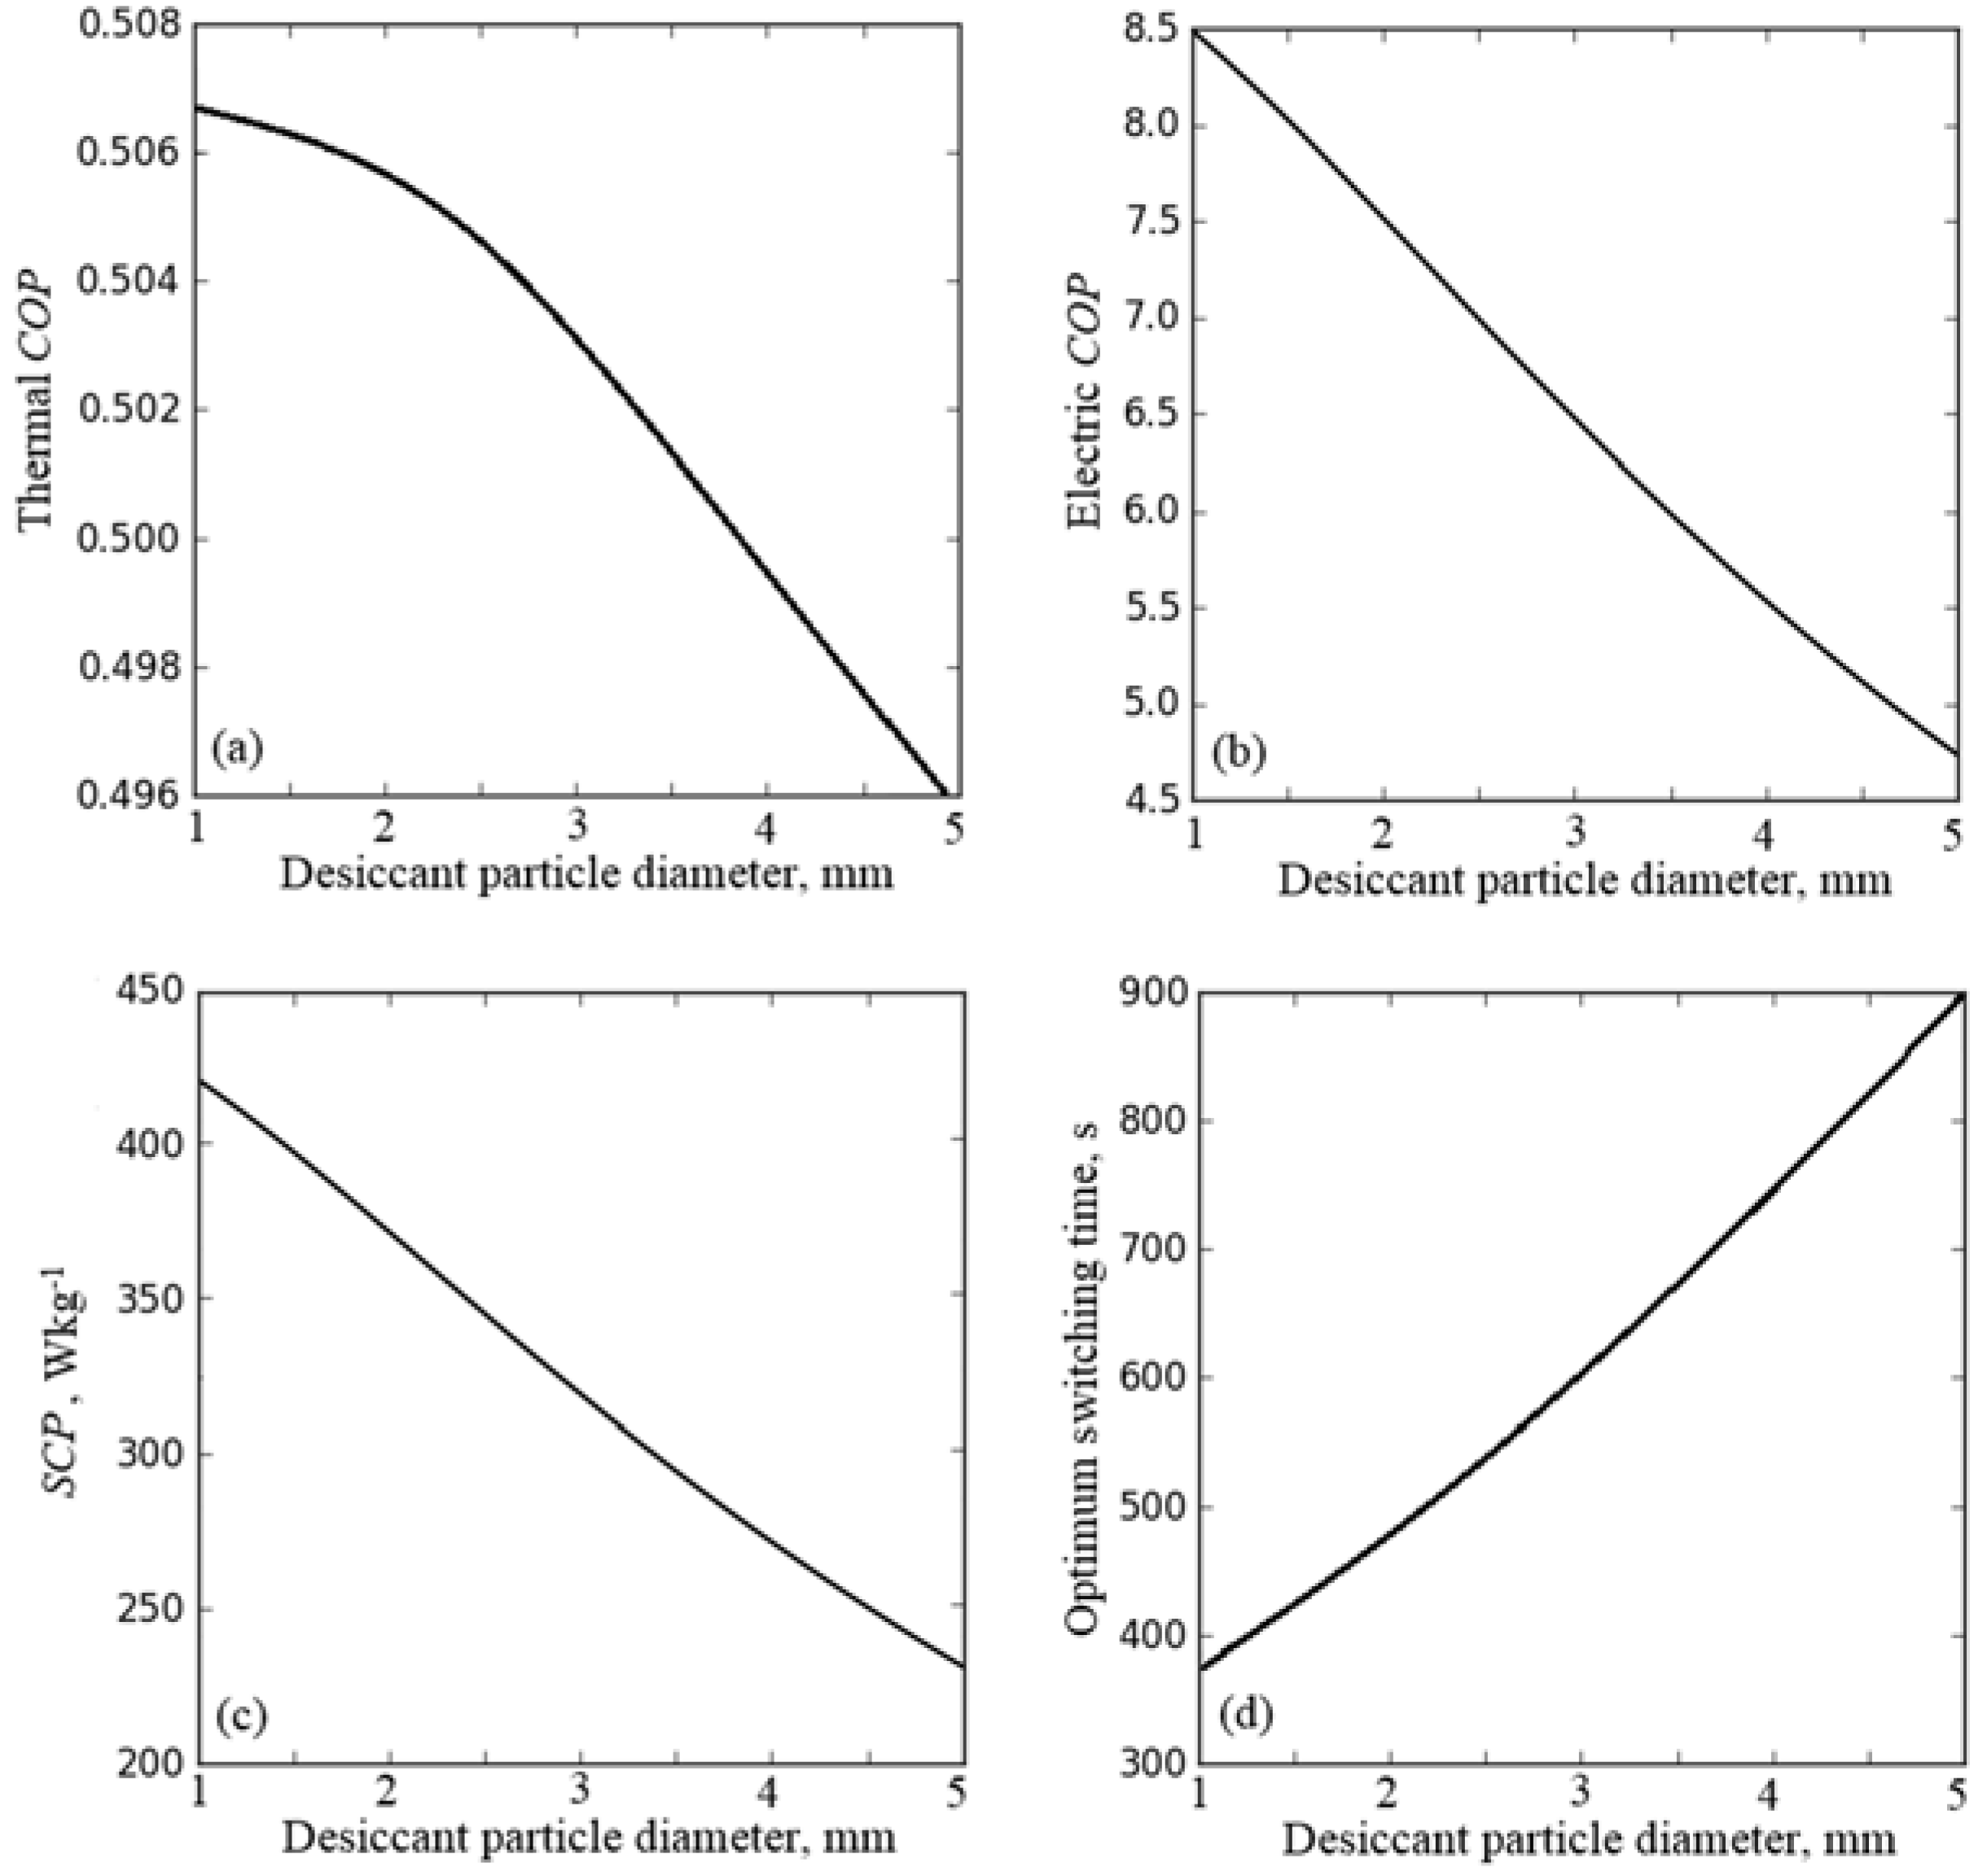
Such a conclusion seemed to be legitimised by the results that are presented in Figure 6, which presented the influence of a desiccant particle diameter on thermal COP, electric COP, and SCP, which were obtained for the optimum switching time. The performance of the FDC was analyzed for desiccant particle diameters ranging from 1 mm to 5 mm. The operating parameters were set according to Table 1. Each simulation was run with its specific optimum switching time (i.e., the switching time for which the electric COP and SCP reached maximum values). The optimum switching time enabled the maximization of the SCP. Decreasing the desiccant particle diameter from 5 mm to 1 mm not only nearly doubled the SCP (see Figure 6b) and the electric COP (see Figure 6c), but it increased the COP as well. Simultaneously, the shortening of the optimum switching time by more than half was observed (see Figure 6d). The decrease of the desiccant particle diameter had a positive influence on both the adsorption/desorption characteristics and the performance of the FDC. It resulted in improved sorption kinetics, shorter optimum switching time, and better FDC performance. The desiccant particle diameter seemed to have a crucial influence on the performance of the FDC, especially the SCP and electric COP. The change of the desiccant particle diameter from 5mm to 1mm could nearly double the SCP and electric COP for a nearly unchanged thermal COP. On the other hand, the desiccant particle diameter affected the fluidisation regime that was constricted by the minimum and maximum fluidisation velocities. In the case of very small desiccant particles, fluidisation could be hard to maintain and control.
3.2. The Effect of Switching Time
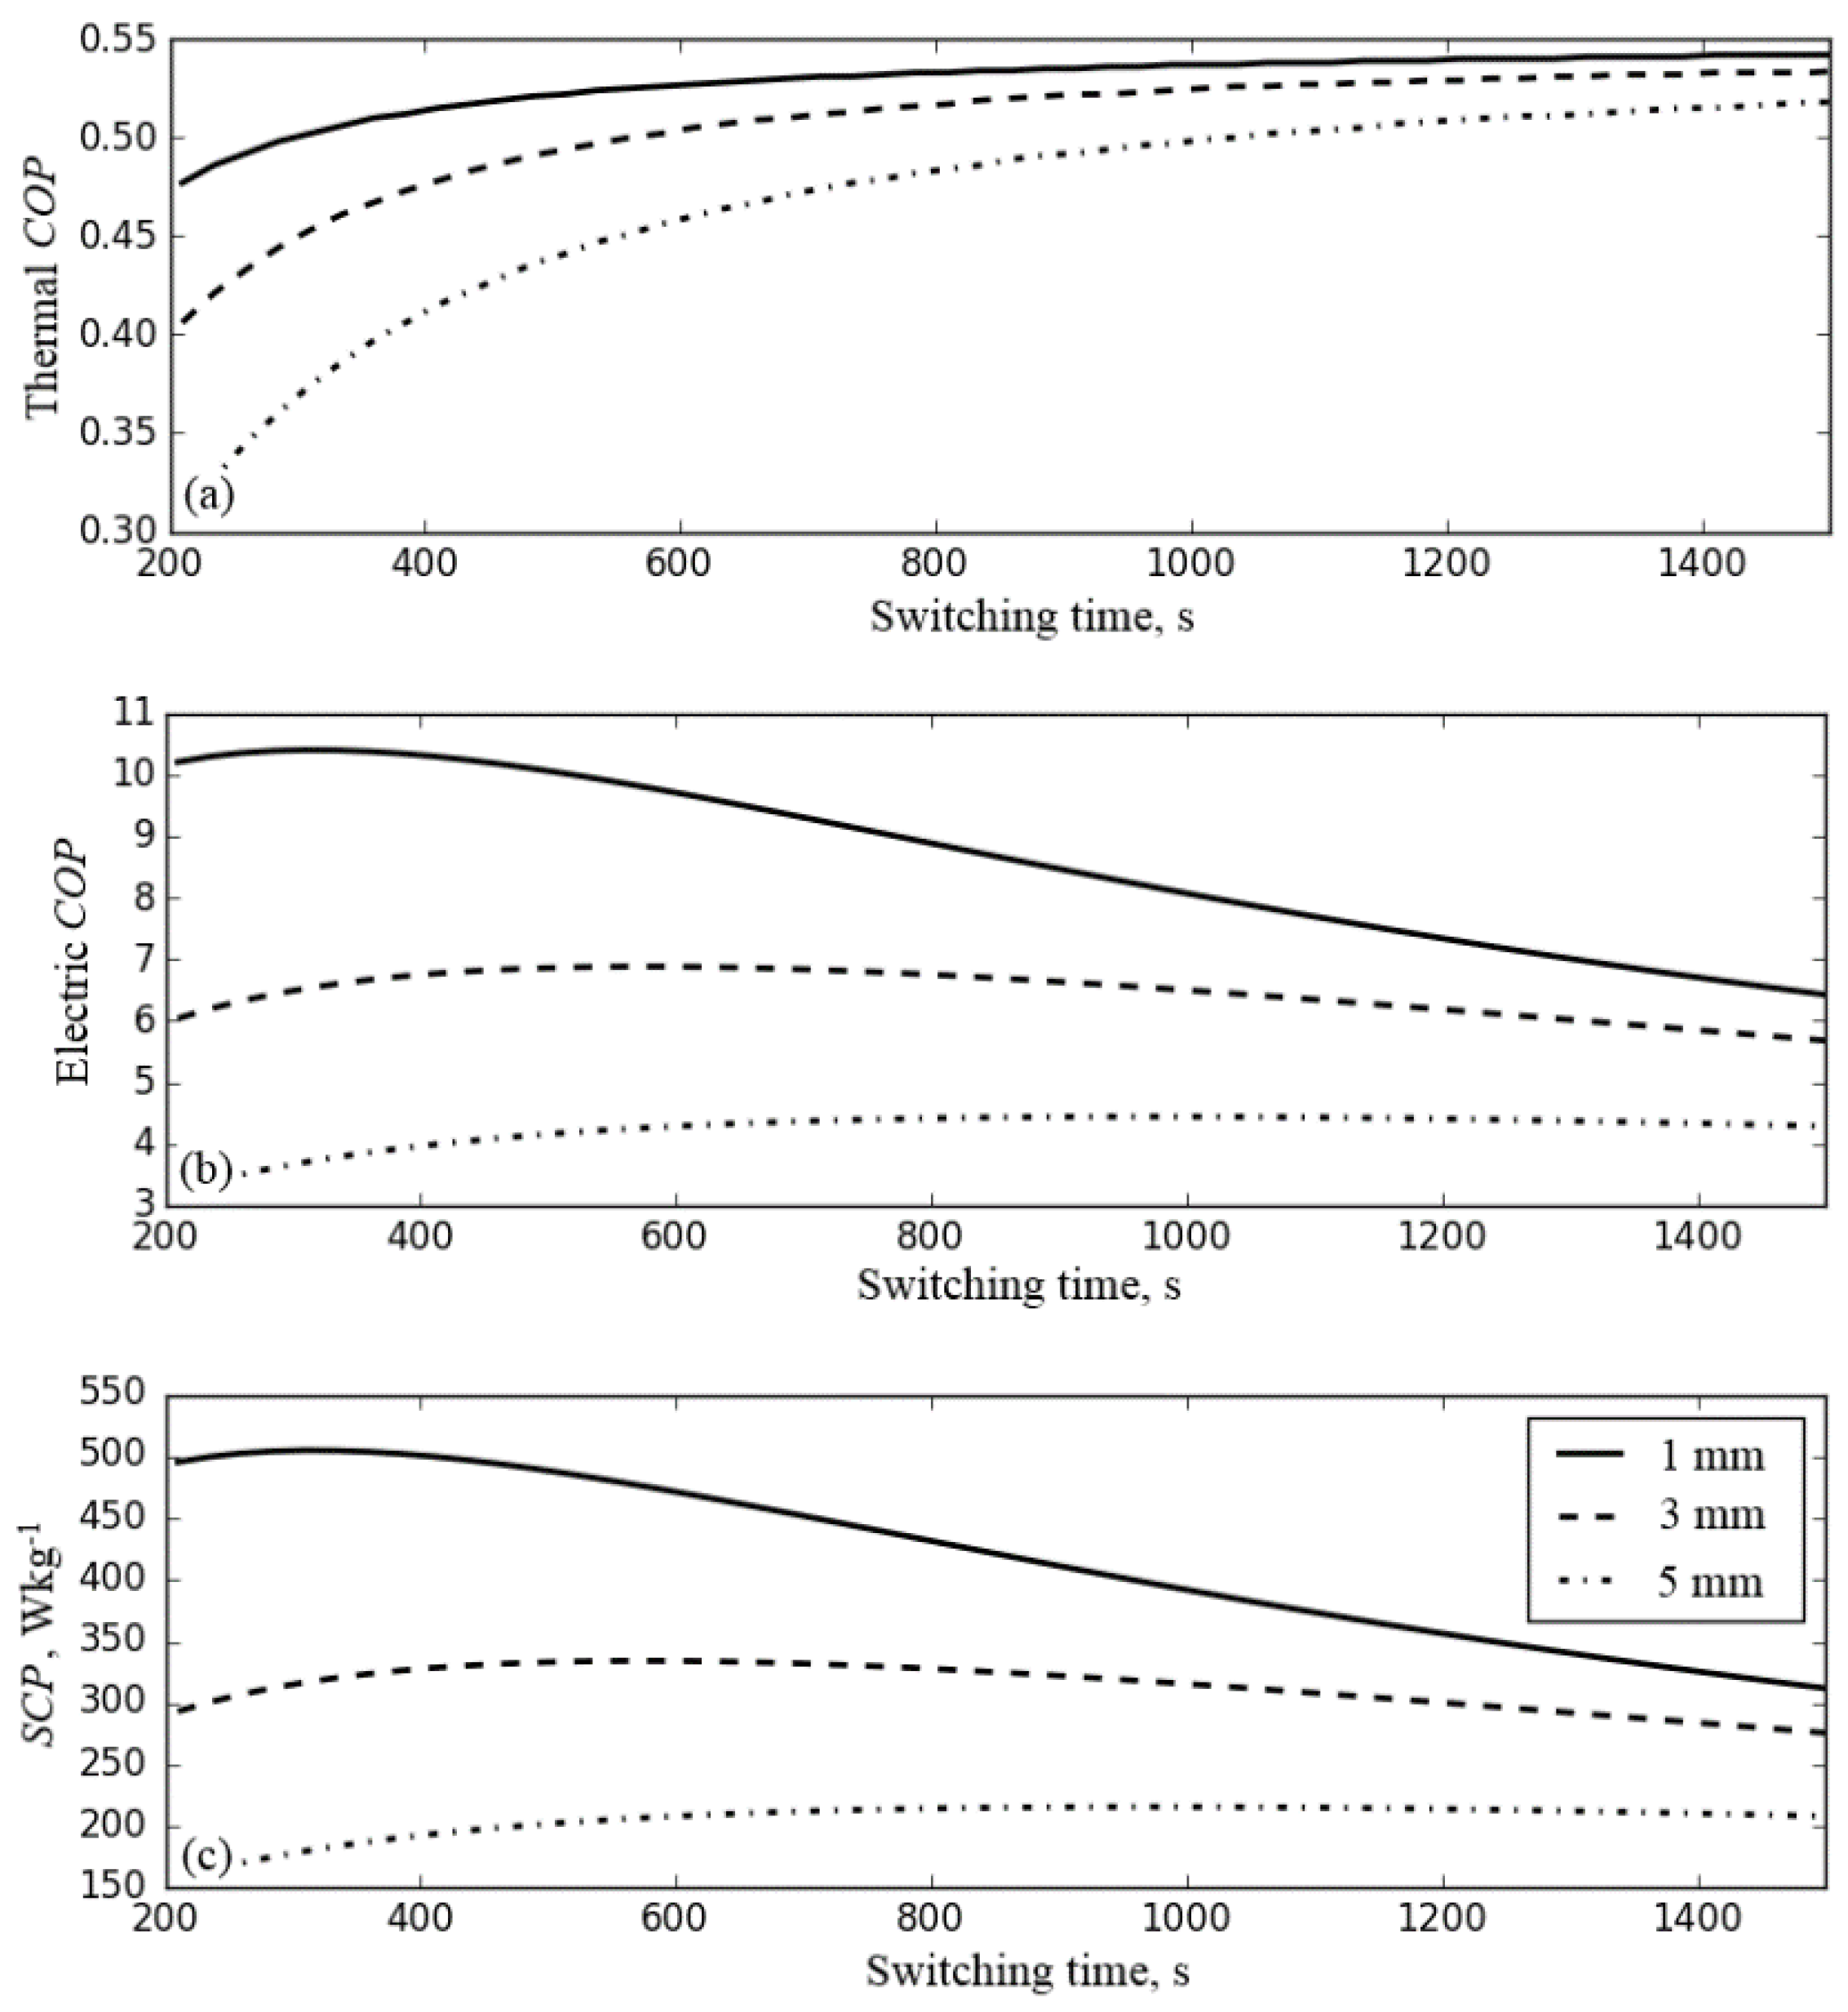
The influence of the switching time on the performance of FDC was investigated in the range of 200 s to 1500 s. The results of the simulations are presented in Figure 7.
Simulations were carried out for the desiccant particles with a diameter of 1 mm, 3 mm and 5 mm. For each particle diameter, at a certain switching time (called optimum switching time), electric COP (see, Figure 7b) and SCP (see, Figure 7c) reach maximum values. The smaller desiccant particle diameter is, the shorter the optimum switching time is. On the other hand, thermal COP increases with the increase in the switching time. This results from the phenomena reported in [7]. Firstly, the cooling/heating provided to the bed with the air stream is spent on the change of desiccant temperature and then on adsorption/desorption (see, Figure 8a). Too short switching time can cause undesired deterioration in FDC performance. The influence of switching time on adsorption/desorption characteristics is presented in Figure 8.
This figure presents the variation of the air temperature and humidity at the outlet, and the desiccant water uptake of a single bed against time. The second bed always operated in an opposite mode. This simulation was performed for the desiccant particle with a diameter of 1 mm. According to Figure 7b,c, for such operating parameters, the optimum switching time was about 350 s. The operation of the FDC under the switching time of 200 s (shorter than optimum), 350 s (optimum), and 650 s (longer than optimum) was modelled. The switching time affected the change of water uptake, which appeared between the desorption and adsorption (see Figure 8c). A change of switching time had a greater impact on the adsorption (maximum) uptake than desorption (minimum) uptake. It could be seen that the better the desiccant was desorbed, the greater the initial drop of air humidity was (see Figure 8b). Within 200 s, the air temperature at the outlet did not reach 60 °C, which meant that the heat source was not properly utilized. Increasing the switching time to 350 s resulted in the air temperature at the outlet being close to 60 °C (see Figure 8a), as well as a lowered minimum desiccant water uptake (see Figure 8c). This finally caused a better initial desiccation of air (see Figure 8b). A further increase in the switching time (up to 650 s) did not significantly improve the desorption, but on the other hand, it enhanced the adsorption. Increasing the switching time mostly led to the increase of the thermal COP. The presented analyses showed that the switching time should not be shorter than optimum. In order to maximize the electric COP and SCP, the FDC should operate with the optimum switching time. Operating the FDC with a switching time longer than the optimum would increase the thermal COP, but lower the electric COP and SCP. Moreover, as a result of the poor adsorption kinetics, the application of multi-bed systems could be considered, for example, a 3-bed FDC (two beds adsorbing and one desorbing at the same time). This solution would lead to the further increase of the thermal COP. The 3-bed systems were successfully applied in the adsorption cooling [10].
3.3. The Effect of Superficial Air Velocity
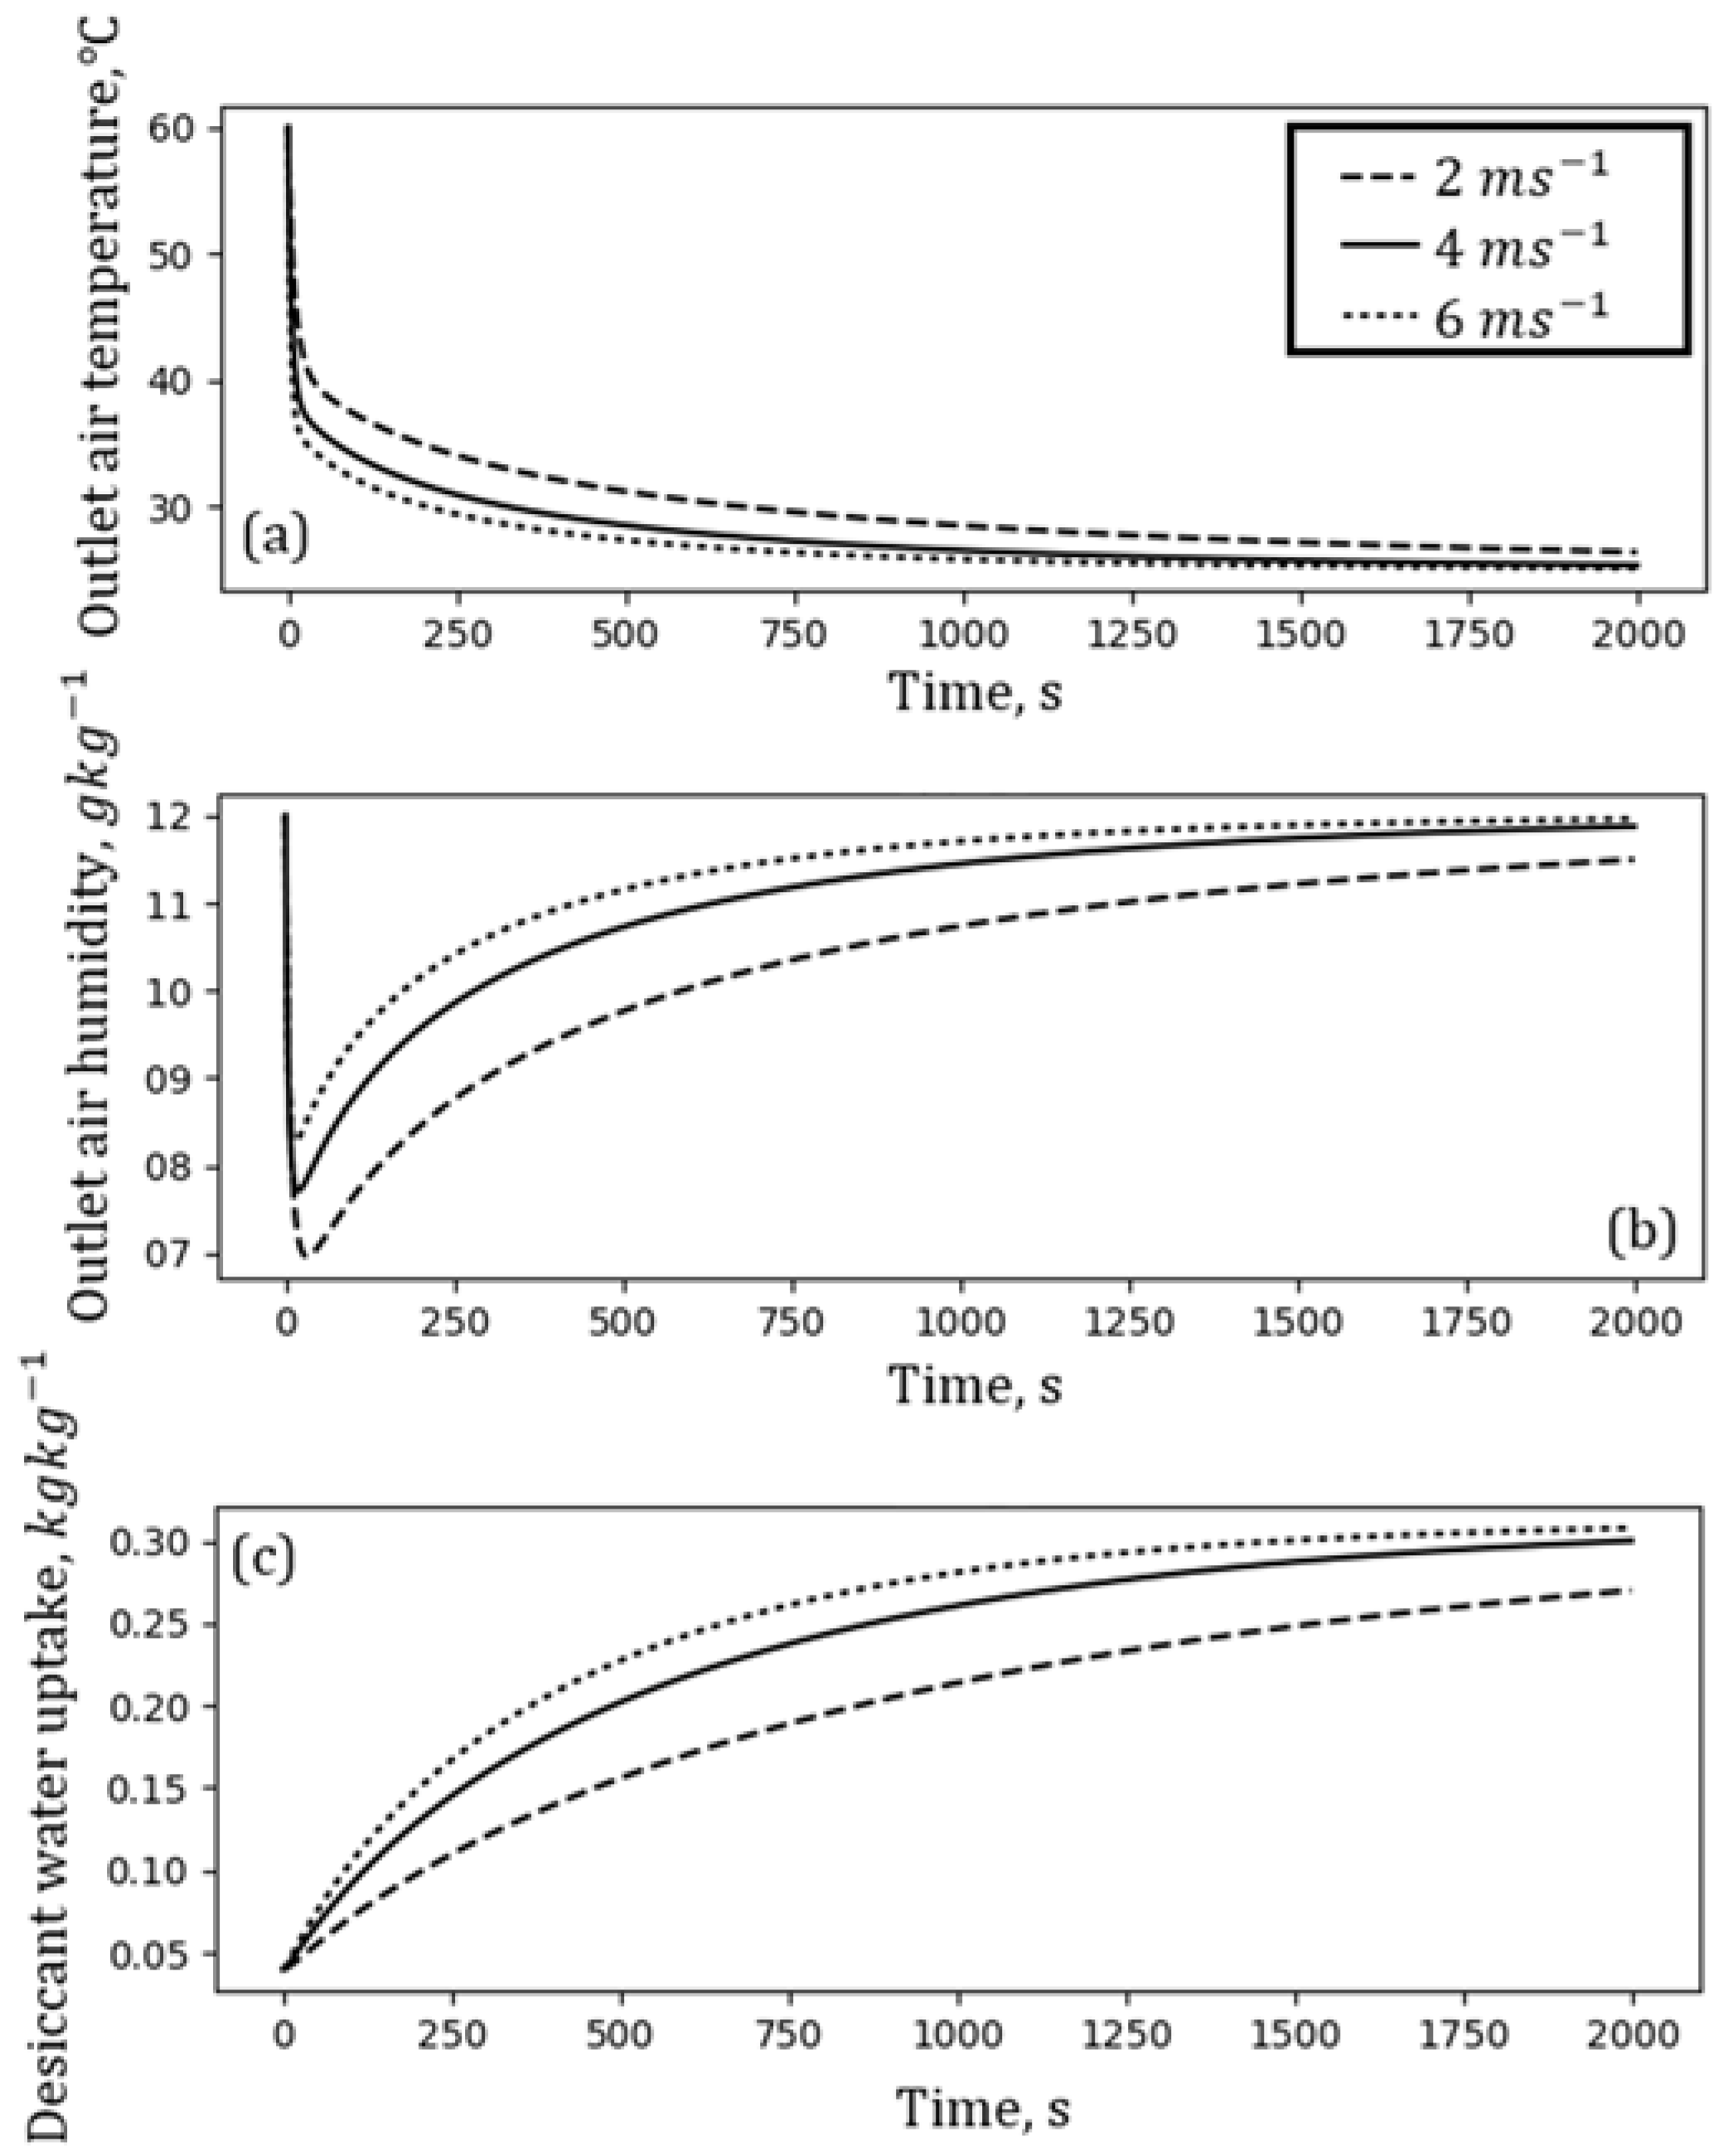
The influence of a superficial air velocity on the performance of a FDC and its sorption characteristics was investigated. Because of the different adsorption and desorption kinetics, the influence of the superficial air velocity during these processes was investigated separately. The modelling was performed for the desiccant particle with a diameter of 1 mm, desiccant filling height of 0.04 m, and within the range of superficial air velocities from 1 to 6 m/s (see Table 1). The optimum switching time was applied to all of the simulations. The influence of the superficial air velocity on the adsorption characteristics is presented in Figure 9. Superficial air velocities of 2 m/s, 4 m/s, and 6 m/s were analyzed. The increase of superficial air velocity increased the kinetics of the adsorption (see Figure 9c). The decrease of the superficial air velocity enabled the increase of the initial air desiccation (see Figure 9b), but on the other hand, it lowered the adsorption rate (see Figure 9c). The increase of the superficial air velocity increased the kinetics, but it was not enough to desiccate a much larger volume of passing air (see Figure 9b). The change of superficial air velocity had little influence on the temperature at which the adsorption started (see Figure 9a). Furthermore, an increase of superficial air velocity enabled the reaching of the adsorption equilibrium faster, which probably resulted in the shortening of the optimum switching time, which could have led to the general improvement of the FDC performance.
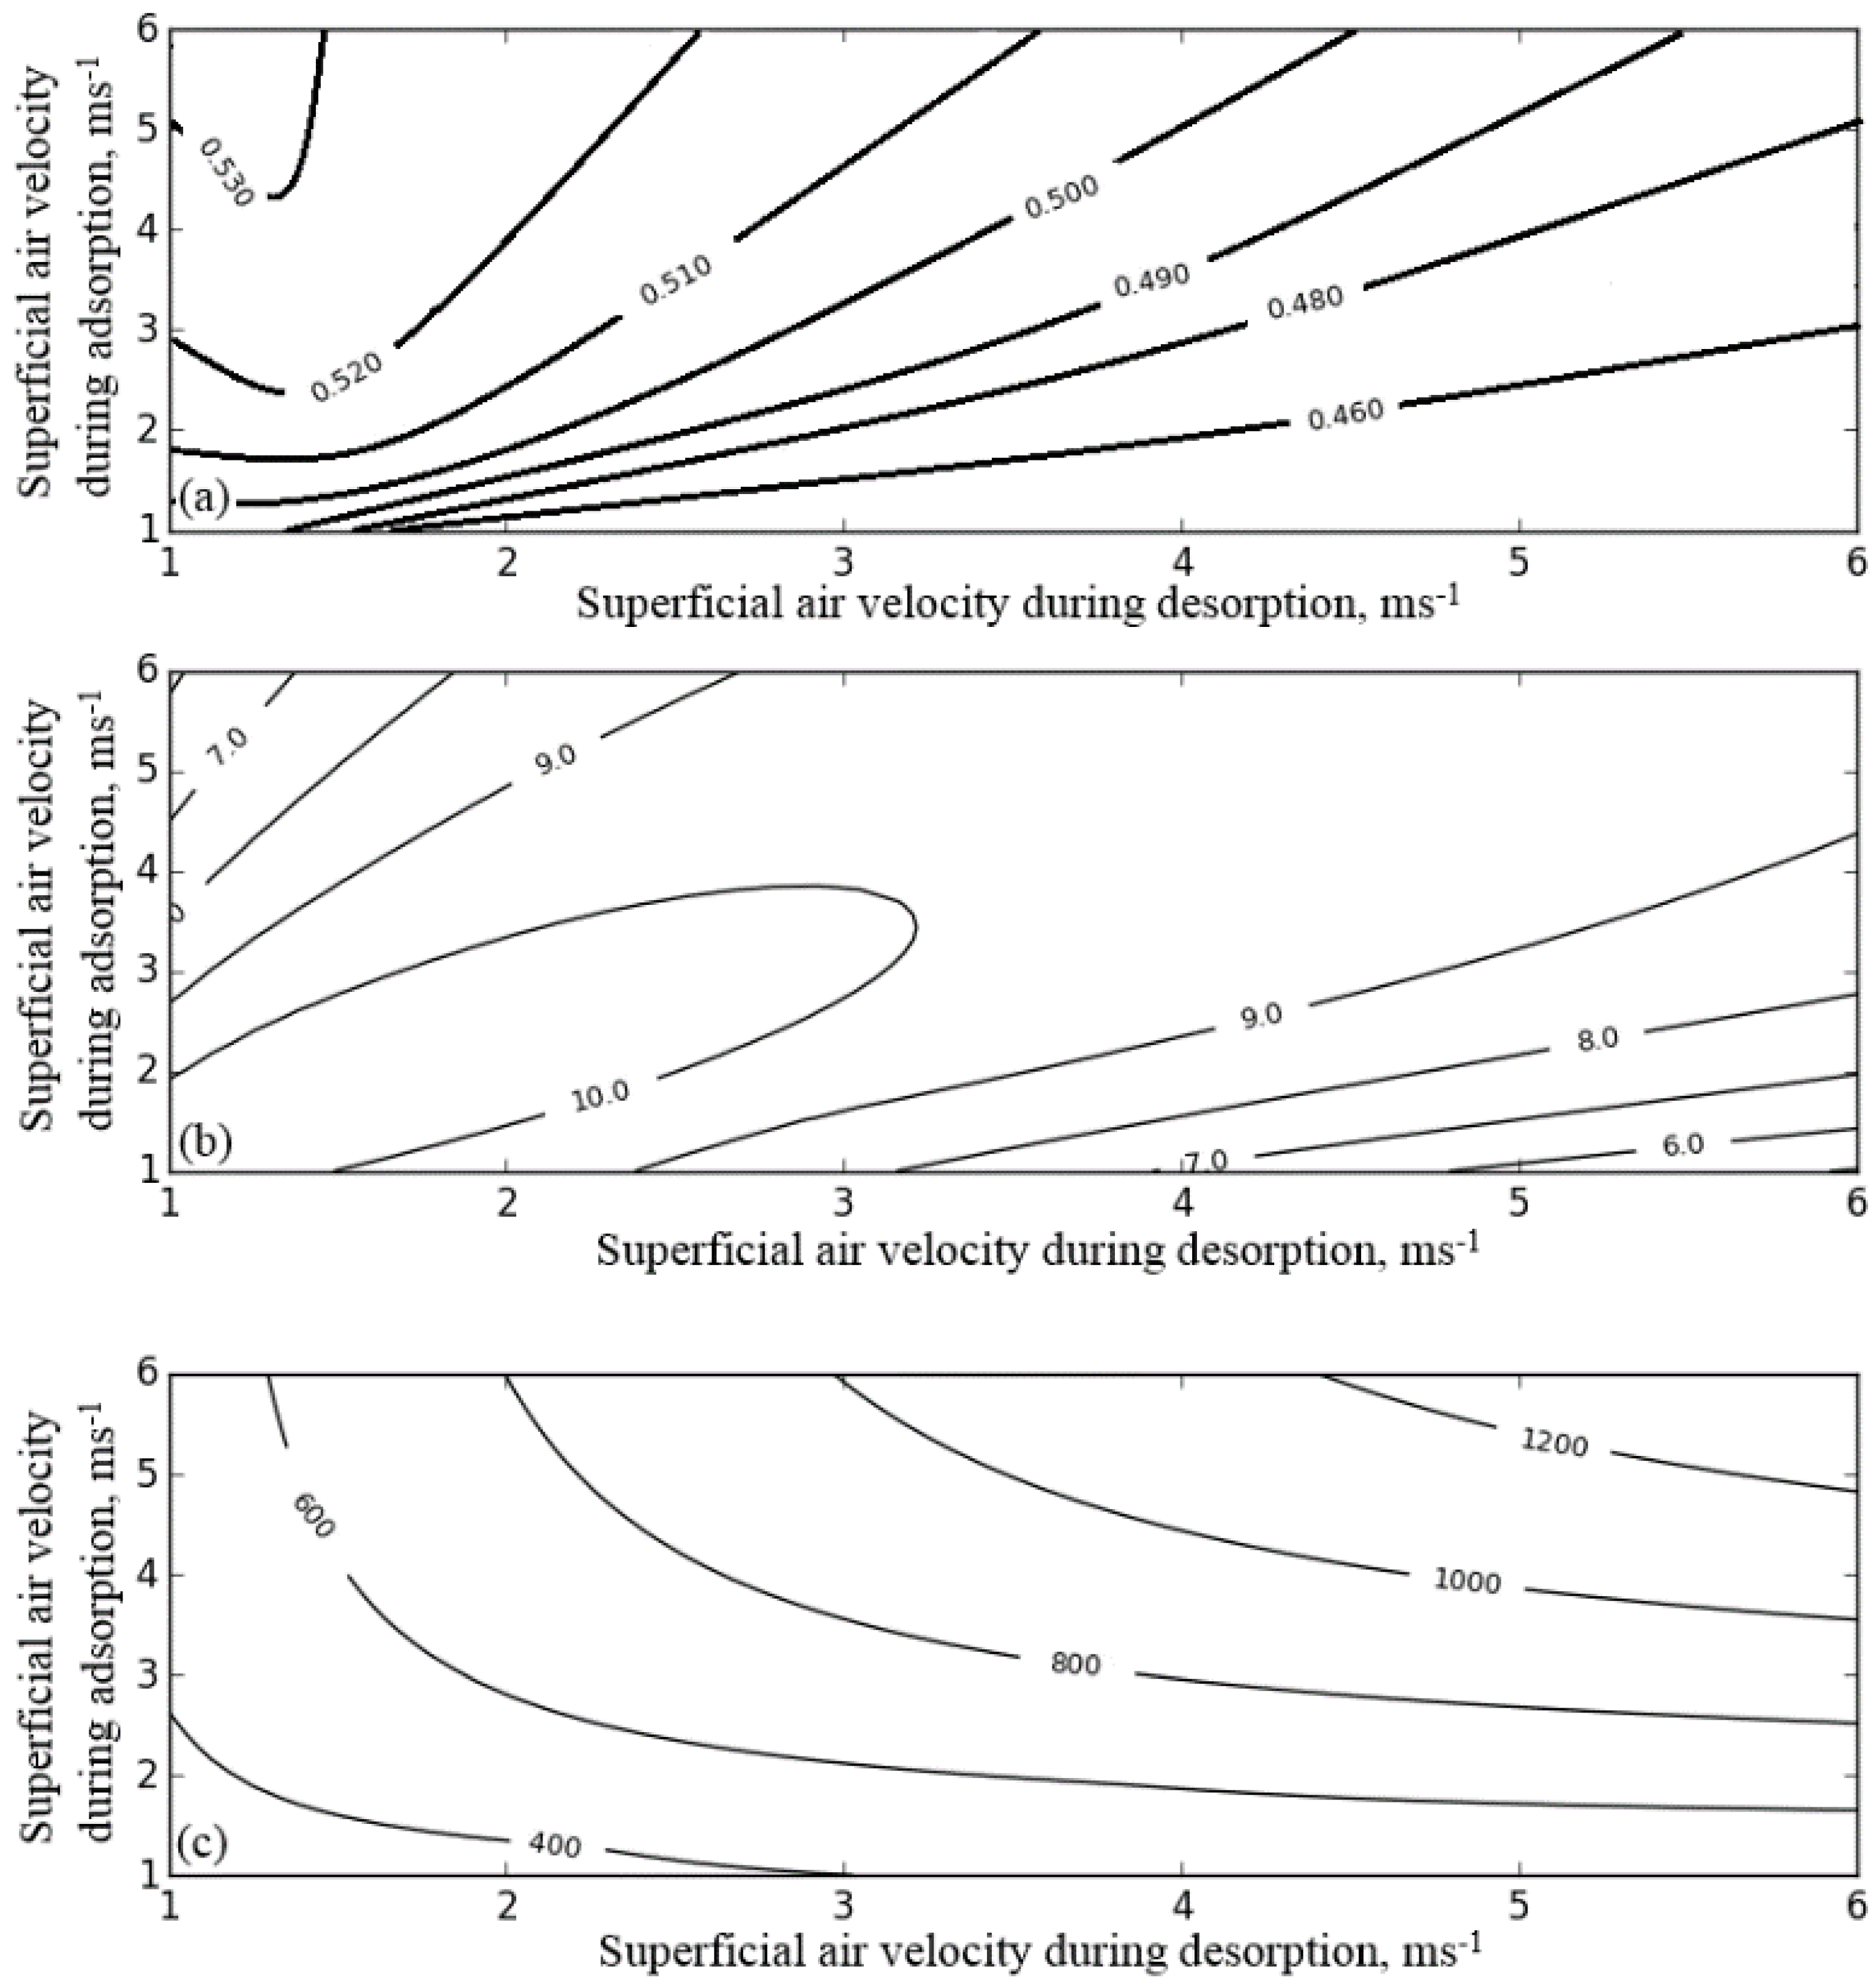
Similar effects could be observed during the desorption (see Figure 10). The higher superficial air velocity increased the desorption kinetics (see Figure 10c), however it decreased the initial increase of the air humidity at the outlet (see, Figure 10b). At last, the effect of the superficial air velocities on the FDC performance were investigated. The results are presented in Figure 11. The electric COP (see, Figure 11b) was the highest when both of the superficial air velocities were similar. However, it remained high in the case of the higher superficial air velocity during the adsorption. This might have resulted from a difference of the adsorption and desorption kinetics. The highest thermal COP (see Figure 11a) was achieved with a high superficial air velocity during the adsorption and was low during desorption. As it can be seen in Figure 9 and Figure 10, the desorption proceeded significantly faster than the adsorption. The higher superficial air velocity during the adsorption promoted the adsorption to proceed faster, while the desorption, due to better kinetics, proceeded fast enough under lower superficial air velocities. The differences of the adsorption and desorption kinetics could be mitigated by a change of switching time and the application of multibed systems, but also by setting a different superficial air velocity during the adsorption and desorption.
3.4. The Effect of Desiccant Filling Height
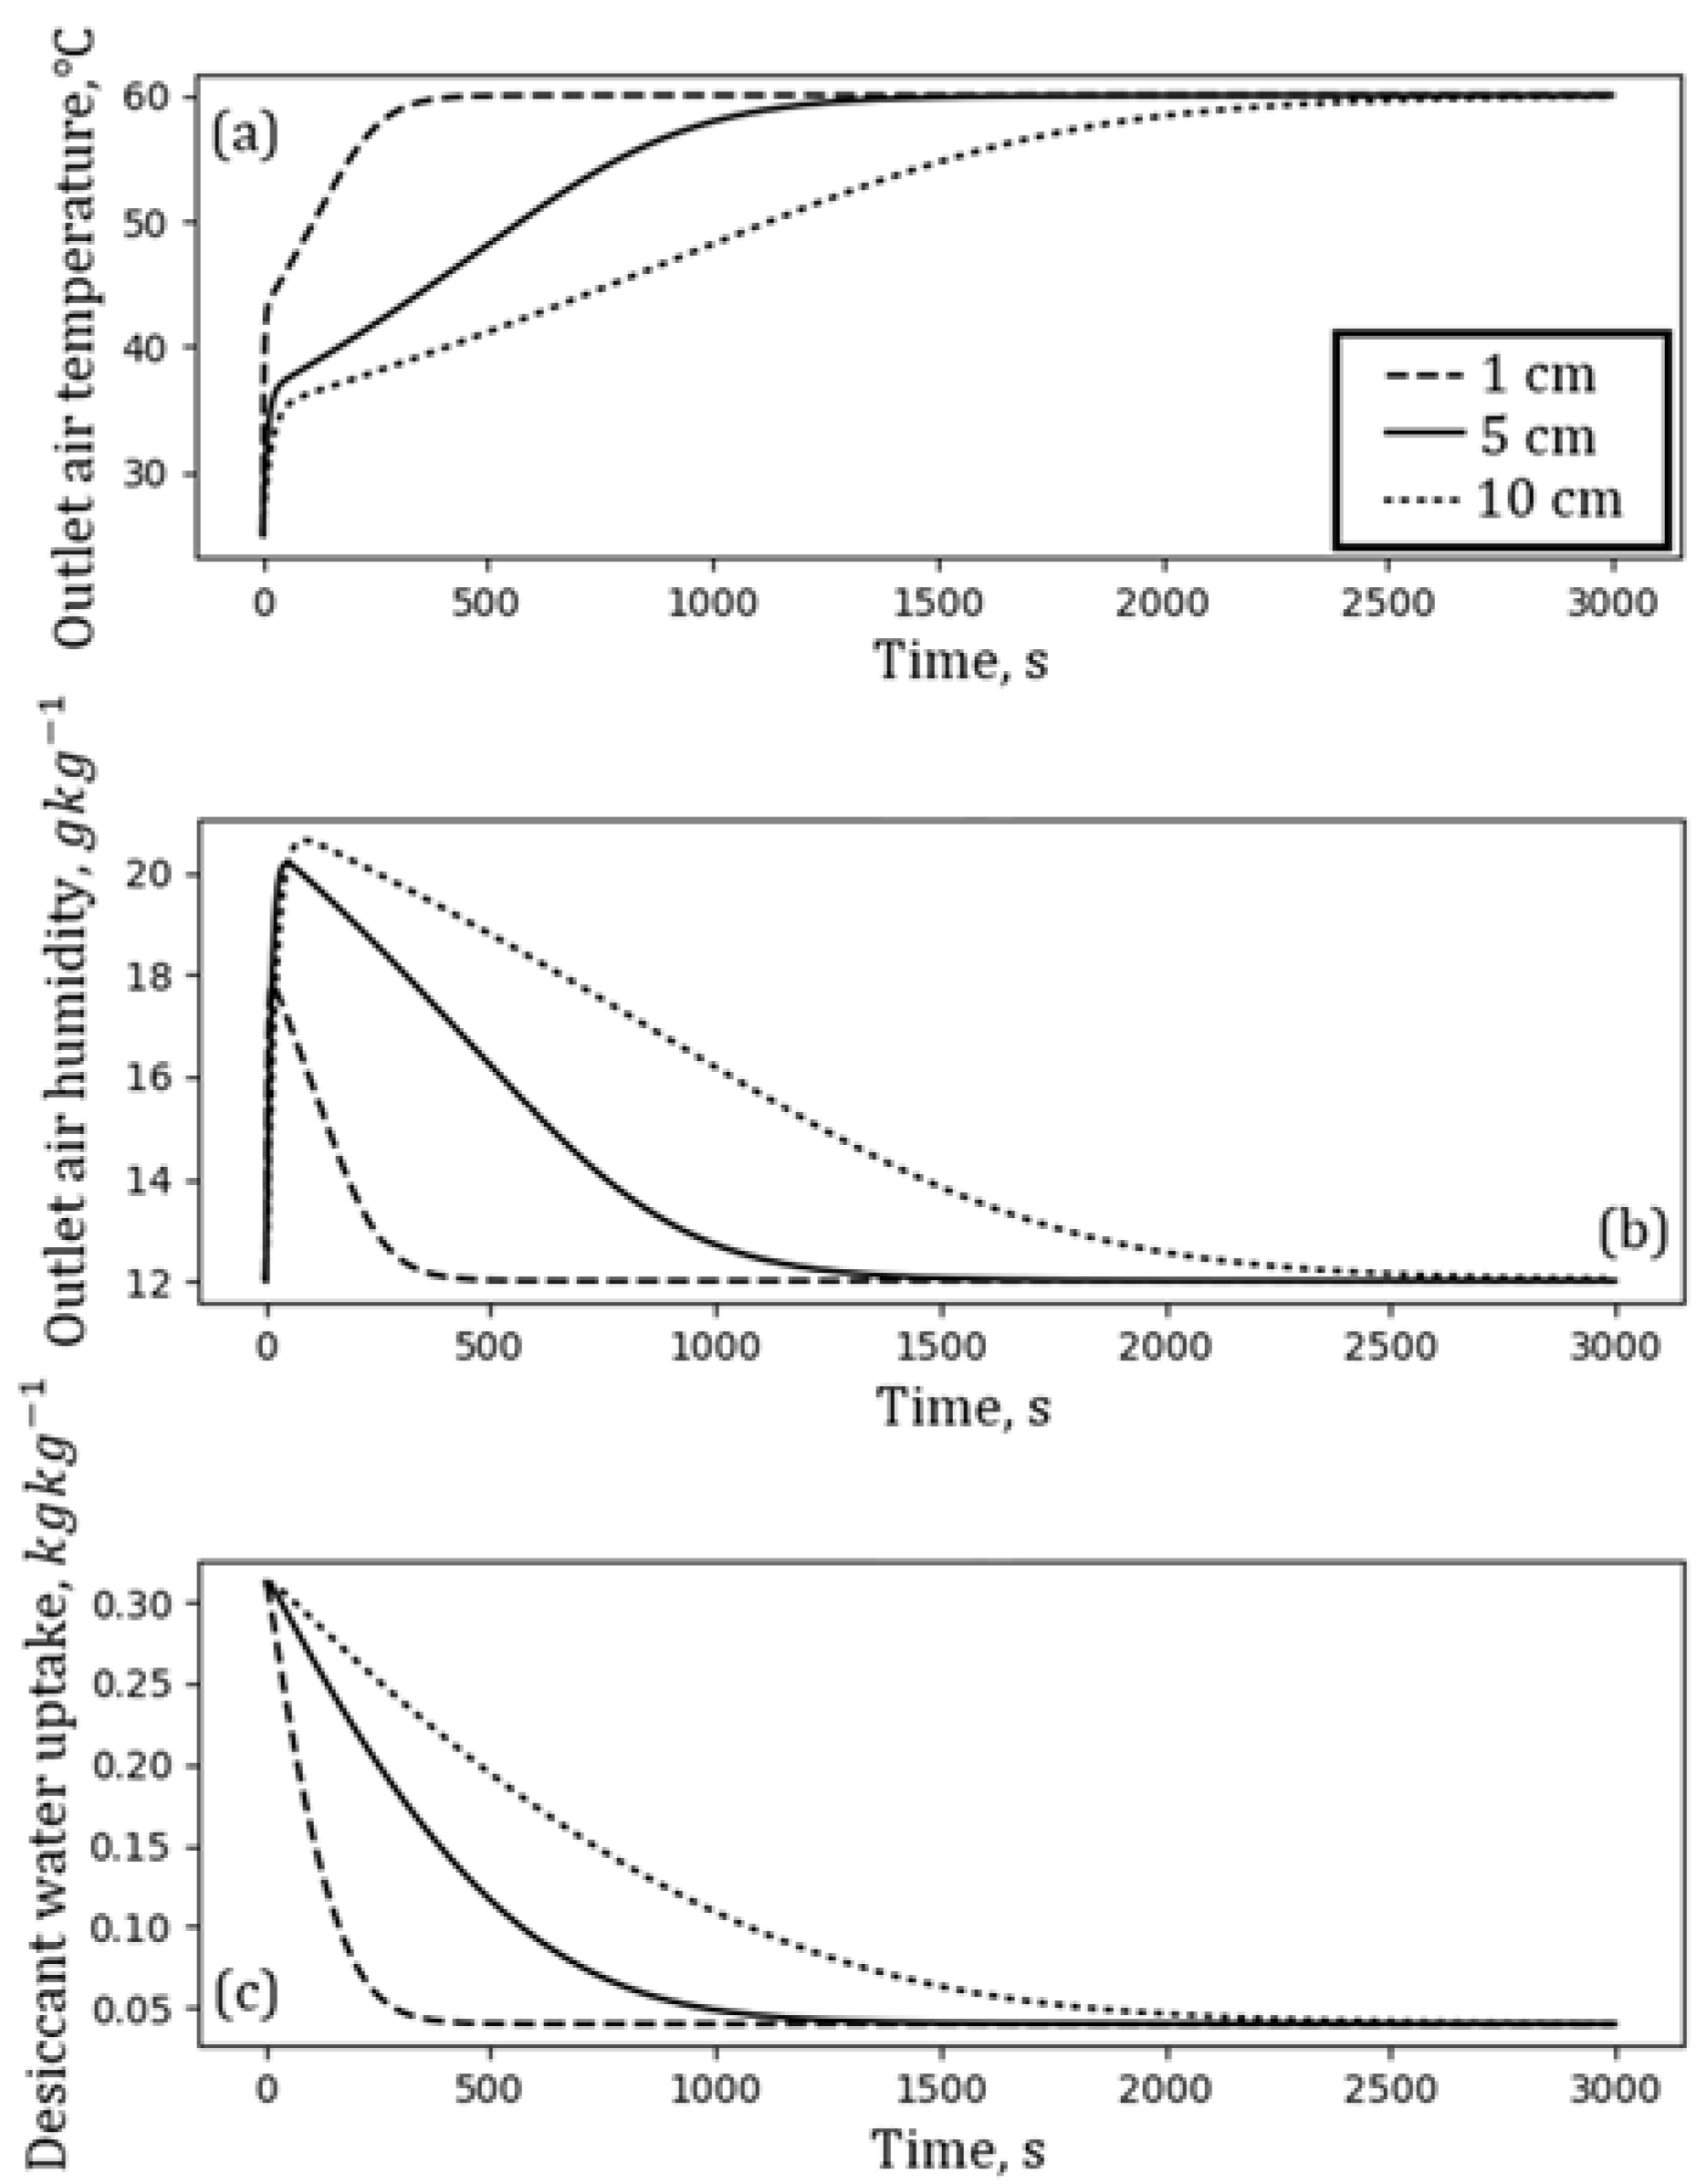
The last analyzed operating parameter was the desiccant filling height. The desiccant filling height was equivalent to the mass of the desiccant that was poured into the fluidised bed. Its effect on the adsorption/desorption characteristics was investigated with the desiccant filling height ranging from 1 cm to 10 cm. The other operating parameters were set according to Table 1. Figure 12 presents the influence of the desiccant filling height on the adsorption characteristics. The higher filling height was equivalent to more desiccant poured into the bed. It resulted in deeper air desiccation (see Figure 12b).
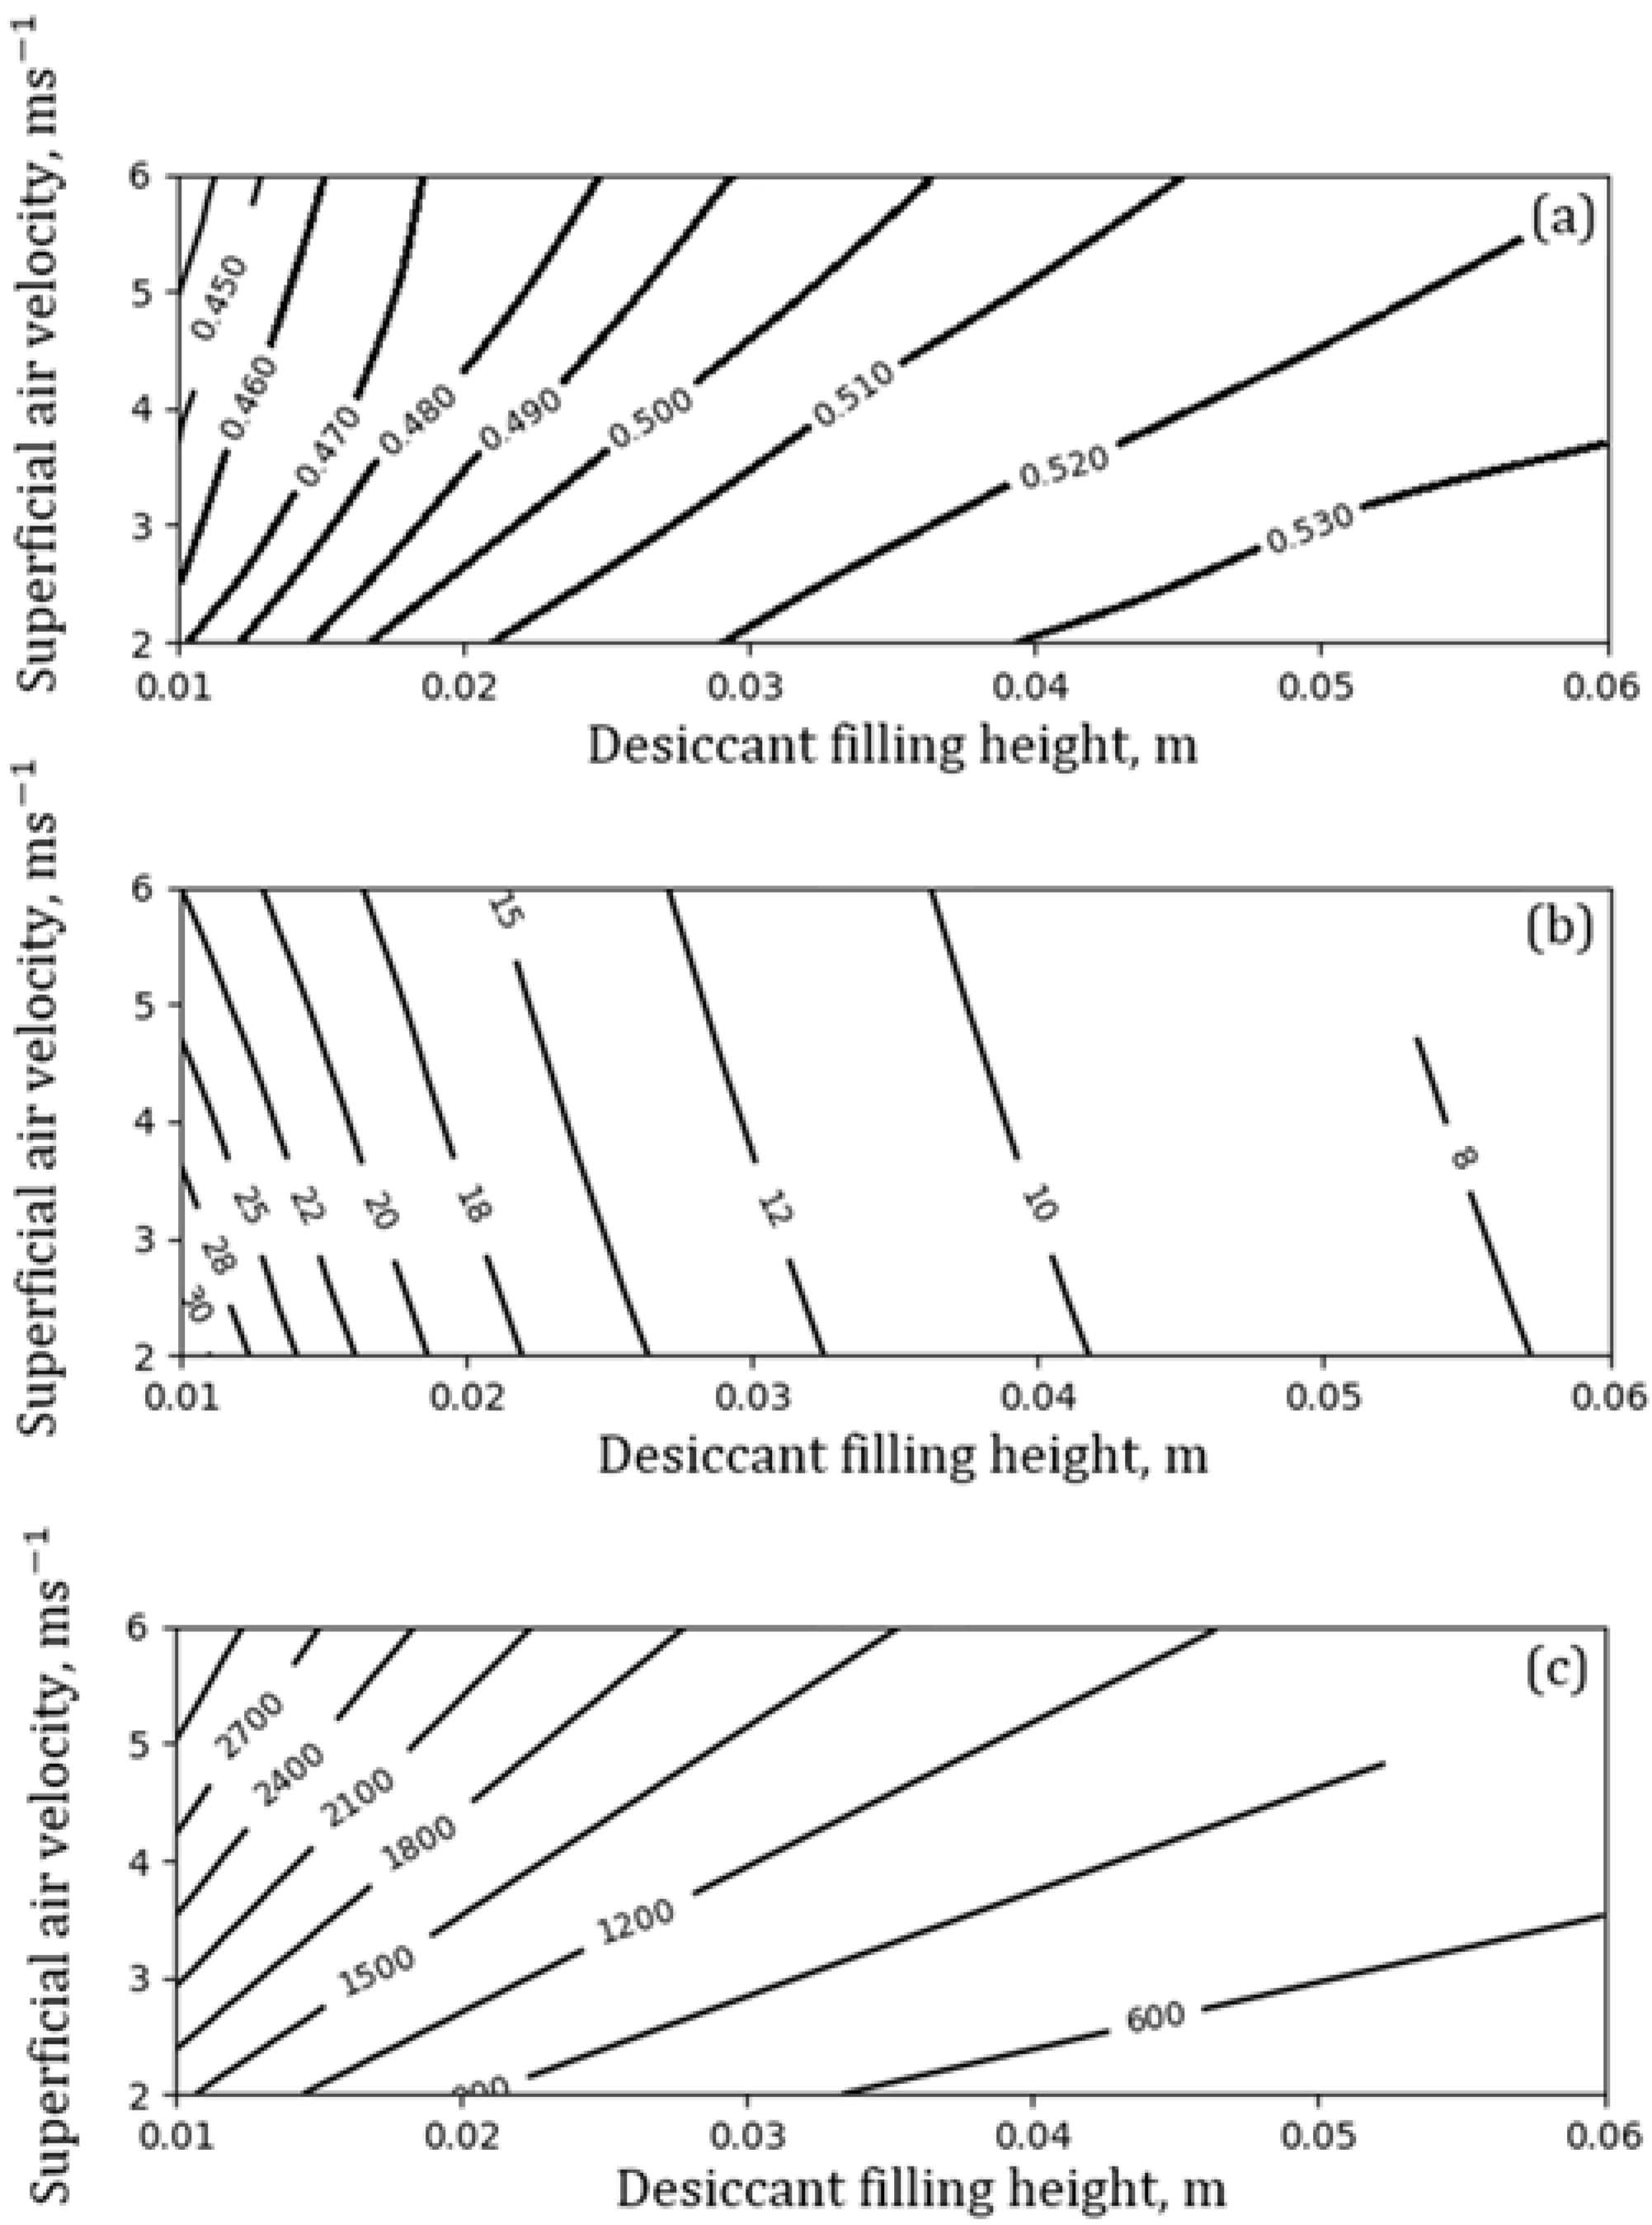
The increase in the desiccant filling height led to the decrease of the initial outlet humidity. Moreover, the effect of desiccation lasted much longer. A similar trend could be observed in the case of the desorption (see Figure 13). More desiccant required more time to get fully adsorbed (see Figure 12c). The more desiccant that underwent adsorption, the more cooling that needed to be provided. In the case of the FDC, cooling power was provided by the air stream and it was proportional to the air superficial velocity. In the case of the small desiccant filling height, the amount of cooling that was provided with the air stream was enough to run the quick adsorption. On the other hand, when the filling height was high, the amount of cooling was not enough to run the quick adsorption. Adsorption was hindered because of the insufficient cooling that was provided with the air stream. Not only were proper parameters to achieve high adsorption kinetics required (e.g., small desiccant particle size), but also, enough cooling had to be provided, proportionally to the amount of the desiccant that was poured into the fluidised bed. Due to the limitations of superficial air velocity, smaller desiccant filling heights were recommended. Similar conclusions could be drawn from Figure 14, presenting the influence of the desiccant filling height and superficial air velocities during the adsorption and desorption (both velocities were equal) on the performance of the FDC. The operating parameters that were used during this simulation are given in Table 1. The electric COP decreased with the increase of the desiccant filling height. It dropped from 30 to less than 8 when the filling height was increased from 1 cm to 6 cm. Increasing, the SCP and thermal COP stayed in contradiction. The thermal COP was the highest for the high desiccant filling height and low velocities. On the other hand, the SCP increased for the small desiccant filling heights and high superficial velocities. The results of the presented simulations showed the significant influence of the desiccant filling height on the performance of the FDC, especially on the electric COP.
4. Conclusions
The influence of operating parameters on the adsorption/desorption characteristics and the performance of the fluidised desiccant cooler was investigated by means of a simulation procedure based on our theoretical modelling. A comprehensive study on the influence of the desiccant particle diameter, the switching time, the superficial air velocities, and the desiccant filling height on the FDC performance was carried out. Based on the obtained results, the following conclusions can be drawn:
- A decrease of the desiccant particle diameter improves the performance of FDC, mainly by reducing the intraparticle mass transfer resistance and thereby enhancing the sorption kinetics. Nevertheless, the particle diameter affects the minimum and the maximum fluidisation velocity, which puts significant limitations on FDC operation. In the case of desiccant particle diameters smaller than 1 mm, fluidisation maintenance can be problematic because of the very narrow fluidisation regime.
- A FDC should operate with a optimum switching time that maximizes the electric COP and SCP. On the other hand, increasing the switching time above the optimum value will result in an increased thermal COP, but at the expense of the electric COP and SCP. Operating the FDC with the switching time below optimum is not recommended, as it deteriorates the performance of the FDC.
- Optimum electric COP can be achieved with similar superficial air velocities. The increase of the superficial air velocity during the adsorption over desorption allows for the mitigation of the differences of the adsorption and desorption kinetics, and can be applied as an alternative method for increasing COP in multibed systems, for example.
- The cooling power, which is provided with the air stream, is proportional to the superficial air velocity. In turn, the superficial air velocity is limited by the minimum and the maximum fluidisation velocities. The amount of desiccant in the fluidised bed has to be matched to the provided cooling power. Therefore, decreasing the desiccant filling height results in the significant increase of SCP and electric COP. The desiccant filling height has a significant impact on the performance of a FDC, especially on the electric COP. A desiccant filling height of below 4 cm has been recommended. This essentially affects the scalability of the FDC systems.
As a result of poor kinetics, the adsorption proceeds much slower than desorption. Therefore, the application of a multi-bed FDC should be considered. In the case of a FDC, an alternative solution is to increase the superficial air velocity during the adsorption over desorption. Both solutions will result in better adsorption of the desiccant and thus an improved thermal COP.
Author Contributions
Z.R. conceived the model, preformed the modelling, and wrote the paper; P.K. supervised the research and revised the paper; and P.B. revised the paper.
Funding
This research was supported by the Dean of the Faculty of Mechanical and Power Engineering of Wrocław University of Science and Technology. Research grant for young scientists, no. 0402/0164/17.
Conflicts of Interest
The authors declare no conflict of interest.
Nomenclature
| cg | Specific heat of air J/(kg K) |
| COPel | electric COP |
| COPth | thermal COP |
| A | cross section area of the fluidised bed, m2 |
| g | gravitational acceleration m/s2 |
| Hd | desiccant filling height m |
| air mass flow during adsorption, kg/s | |
| air mass flow during desorption, kg/s | |
| Md | desiccant mass in the bed kg |
| electric power W | |
| cooling power W | |
| heating power W | |
| SCP | specific cooling power W/kg |
| tsw | switching time s |
| Uads | superficial air velocity during adsorption m/s |
| Udes | superficial air velocity during desorption m/s |
| ∆Hev | heat of evaporation J/kg |
| ∆p | pressure drop on fluidised bed Pa |
| ∆Tmean | mean air temperature drop during regeneration K |
| ∆w | change of desiccant water uptake kg/kg |
| ε | void fraction |
| ρd | desiccant bulk density kg/m3 |
| ρg | air density kg/m3 |
| ρp | desiccant particle density kg/m3 |
References
- Wang, D.; Zhang, J.; Tian, X.; Liu, D.; Sumathy, K. Progress in silica gel-water adsorption refrigeration technology. Renew. Sustain. Energy Rev. 2014, 30, 85–104. [Google Scholar] [CrossRef]
- Chorowski, M.; Rogala, Z.; Pyrka, P. System options for cooling of buildings making use of district heating heat. Int. J. Refrig. 2016, 70, 183–195. [Google Scholar] [CrossRef]
- Chen, C.H.; Schmid, G.; Chan, C.T.; Chiang, Y.C.; Chen, S.L. Application of silica gel fluidised bed for air-conditioning systems. Appl. Therm. Eng. 2015, 89, 229–238. [Google Scholar] [CrossRef]
- Chen, C.H.; Ma, S.S.; Wu, P.H.; Chiang, Y.C.; Chen, S.L. Adsorption and desorption of silica gel circulating fluidized beds for air conditioning systems. Appl. Energy 2015, 155, 708–718. [Google Scholar] [CrossRef]
- Chiang, Y.C.; Chen, C.H.; Chiang, Y.C.; Chen, S.L. Circulating inclined fluidized beds with application for desiccant dehumidification systems. Appl. Energy 2016, 175, 199–211. [Google Scholar] [CrossRef]
- Rogala, Z.; Kolasiński, P.; Gnutek, Z. Effect of operating conditions on performance of silica gel-water air-fluidised desiccant cooler. In Proceedings of the International Conference on Advances in Energy Systems and Environmental Engineering (ASEE17), Wrocław, Poland, 2–5 July 2017; Volume 22. [Google Scholar]
- Rogala, Z.; Gnutek, Z.; Kolasiński, P. Modelling and experimental analyzes on air-fluidised silica gel-water adsorption and desorption. Appl. Therm. Eng. 2017, 127, 950–962. [Google Scholar] [CrossRef]
- Nunes, T.K.; Vargas, J.V.C.; Ordonez, J.C.; Shah, D.; Martinho, L.C.S. Modeling, simulation and optimization of a vapor compression refrigeration system dynamic and steady state response. Appl. Energy 2015, 158, 540–555. [Google Scholar] [CrossRef]
- Ibrahim, N.I.; Al-farayedhi, A.A.; Gandhidasan, P. Experimental investigation of a vapor compression system with condenser air pre-cooling by condensate. Appl. Therm. Eng. 2017, 110, 1255–1263. [Google Scholar] [CrossRef]
- Chorowski, M.; Pyrka, P. Modelling and experimental investigation of an adsorption chiller using low-temperature heat from cogeneration. Energy 2015, 92, 221–229. [Google Scholar] [CrossRef]
- Rogala, Z. Adsorption chiller using flat-tube adsorbers—Performance assessment and optimization. Appl. Therm. Eng. 2017, 121, 431–442. [Google Scholar] [CrossRef]
- Brancato, V.; Gordeeva, L.; Sapienza, A.; Freni, A.; Frazzica, A. Dynamics study of ethanol adsorption on microporous activated carbon for adsorptive cooling applications. Appl. Therm. Eng. 2016, 105, 28–38. [Google Scholar] [CrossRef]
- Santamaria, S.; Sapienza, A.; Frazzica, A.; Freni, A.; Girnik, I.S.; Aristov, Y.I. Water adsorption dynamics on representative pieces of real adsorbers for adsorptive chillers. Appl. Energy 2014, 134, 11–19. [Google Scholar] [CrossRef]
- Wen-Ching, Y. Handbook of Fluidization and Fluid-Particle Systems; Taylor & Francis Group LLC: New York, NY, USA, 2003. [Google Scholar]
Figure 1.
The scheme of the fluidized desiccant cooler (FDC). 1—humidifier, 2—air cooler, 3—fluidized beds, 4—electric fan, 5—air cooler, 6—air heater, 7—recovery heat exchanger, and 8—electric fan.
Figure 1.
The scheme of the fluidized desiccant cooler (FDC). 1—humidifier, 2—air cooler, 3—fluidized beds, 4—electric fan, 5—air cooler, 6—air heater, 7—recovery heat exchanger, and 8—electric fan.

Figure 2.
Description of the simulation procedure.

Figure 3.
Minimum and maximum fluidization velocities with respect to the diameter of the fluidized particles.
Figure 3.
Minimum and maximum fluidization velocities with respect to the diameter of the fluidized particles.

Figure 4.
The influence of the desiccant particle diameter on adsorption characteristics: (a) Outlet air temperature; (b) outlet air humidity; and (c) desiccant water uptake.
Figure 4.
The influence of the desiccant particle diameter on adsorption characteristics: (a) Outlet air temperature; (b) outlet air humidity; and (c) desiccant water uptake.

Figure 5.
The influence of the desiccant particle diameter on desorption characteristics: (a) Outlet air temperature; (b) outlet air humidity; and (c) desiccant water uptake.
Figure 5.
The influence of the desiccant particle diameter on desorption characteristics: (a) Outlet air temperature; (b) outlet air humidity; and (c) desiccant water uptake.
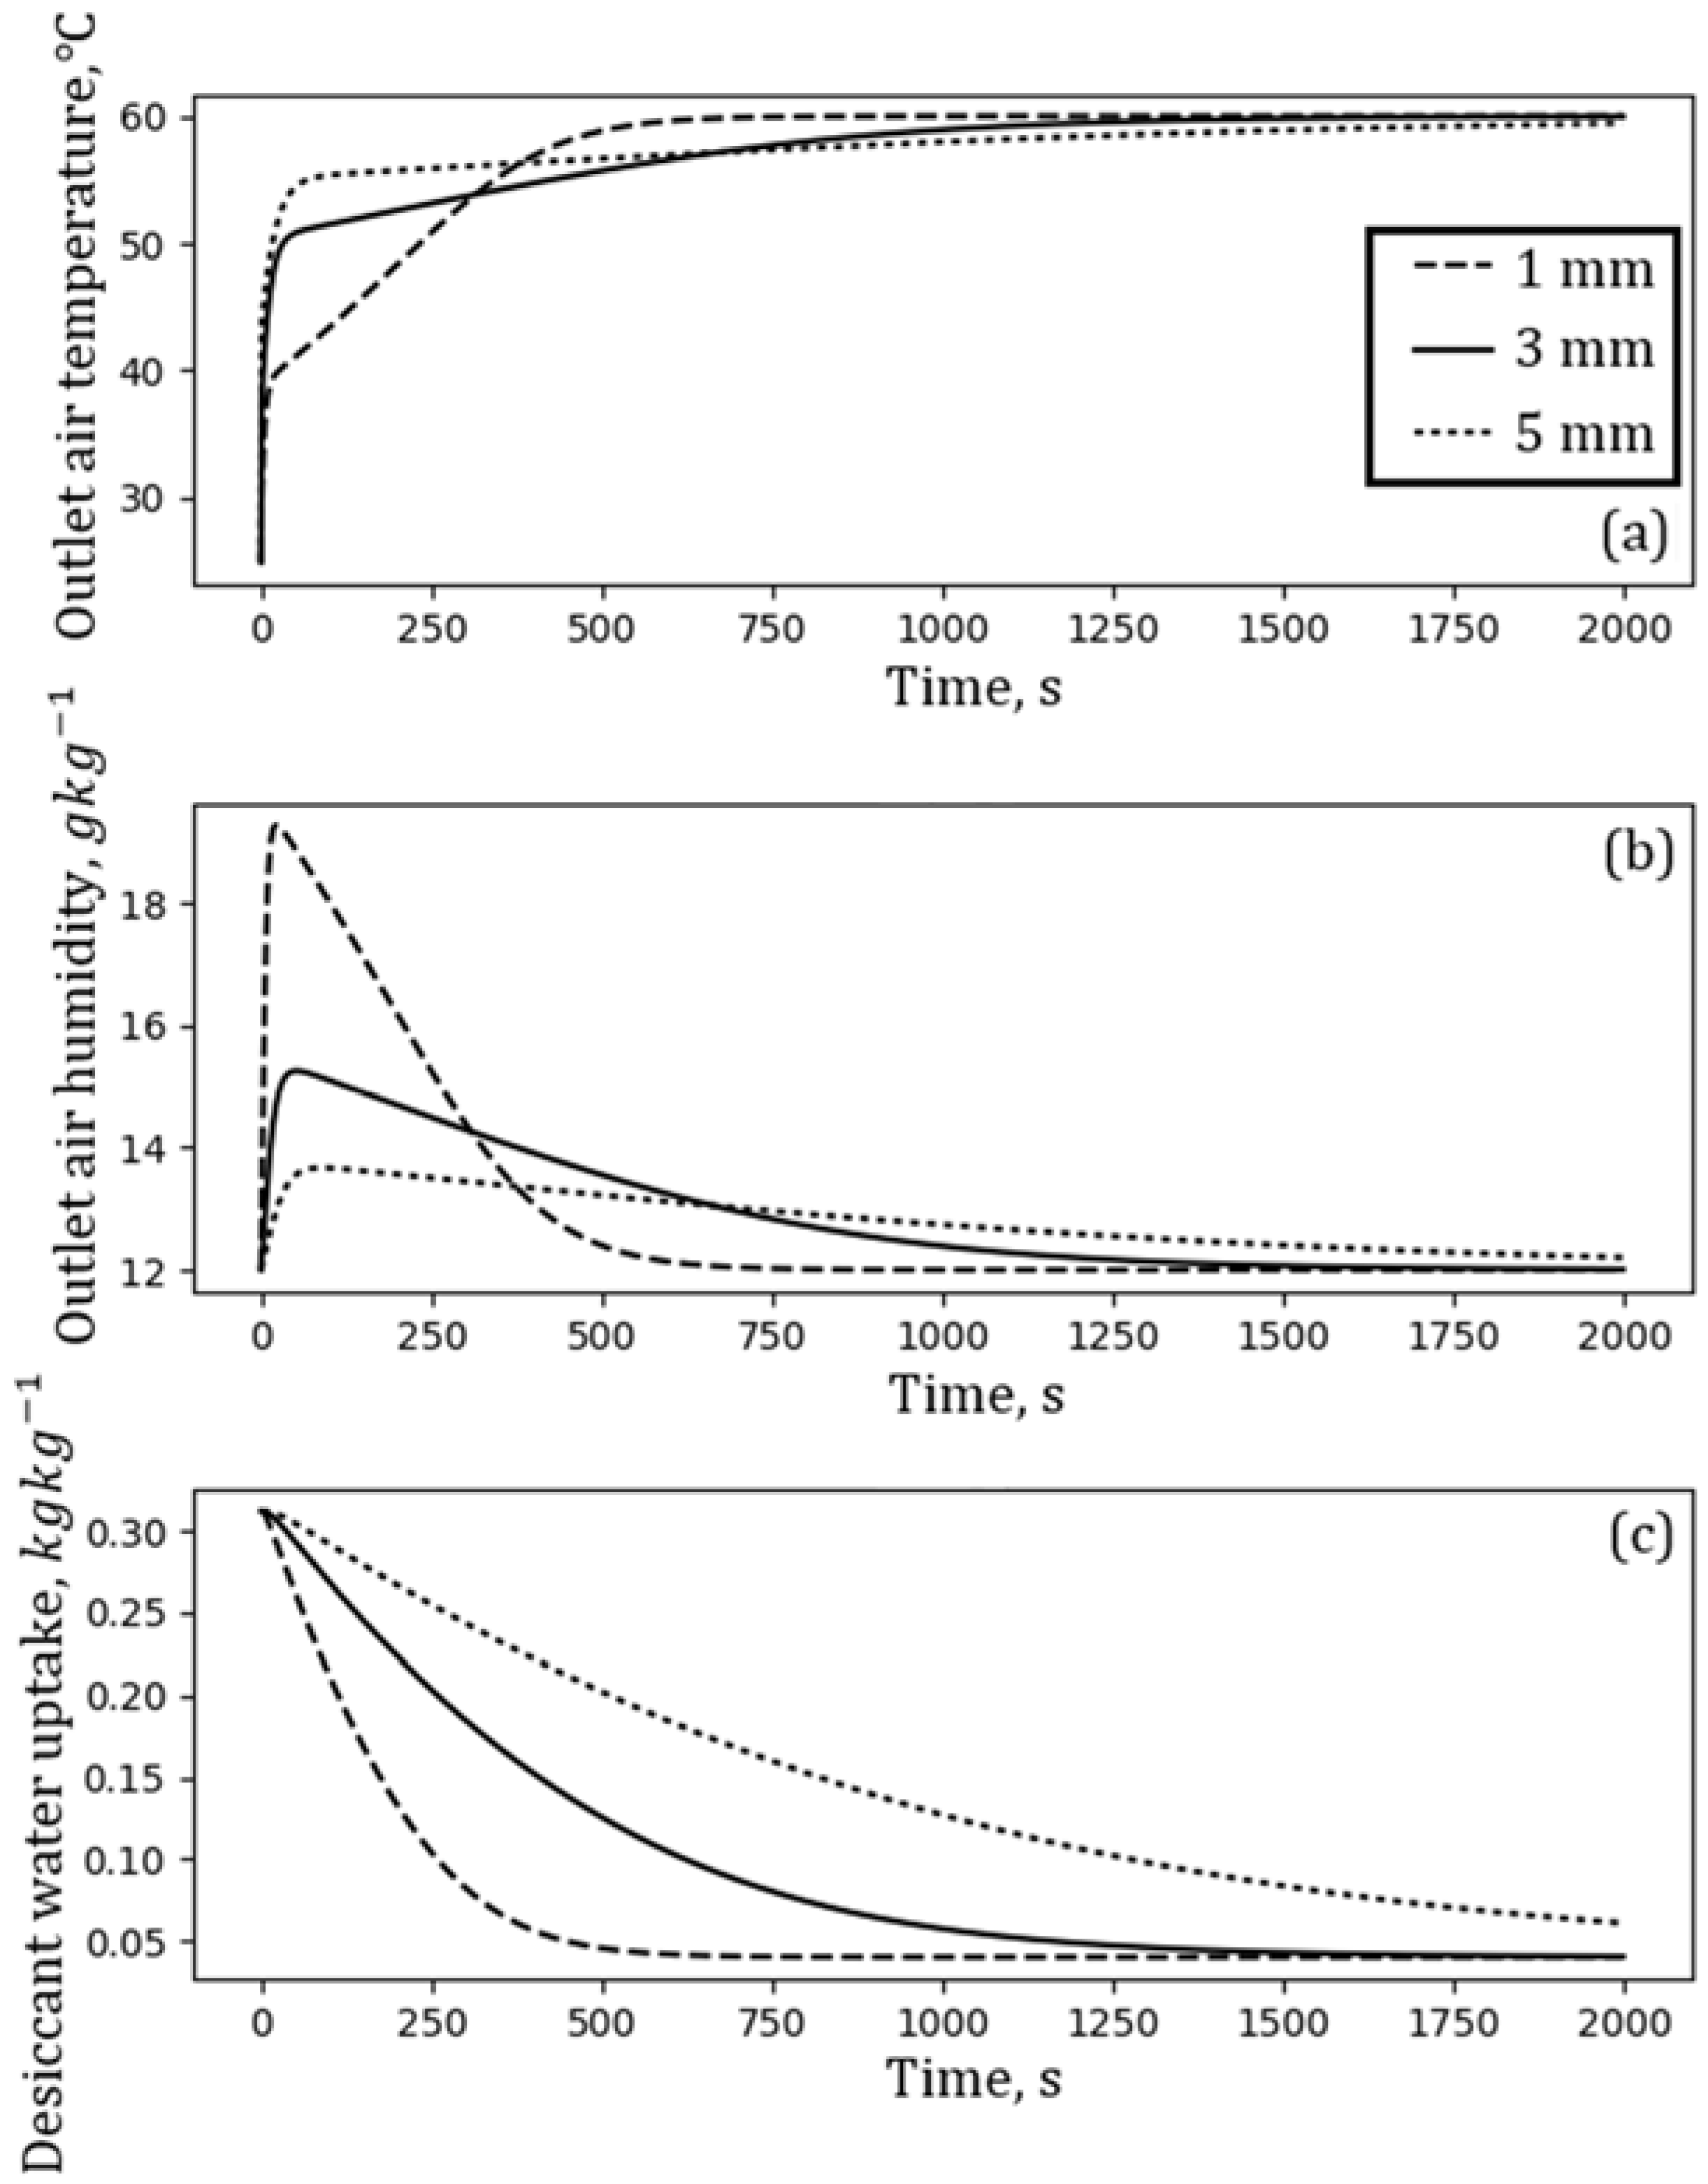
Figure 6.
The influence of the desiccant particle diameter on: (a) thermal COP; (b) electric COP; (c) SCP; (d) optimum switching time.
Figure 6.
The influence of the desiccant particle diameter on: (a) thermal COP; (b) electric COP; (c) SCP; (d) optimum switching time.

Figure 7.
The influence of switching time on: (a) thermal COP; (b) electric COP; (c) SCP.

Figure 8.
The influence of switching time on adsorption/desorption characteristics: (a) Outlet air temperature; (b) Outlet air humidity; and (c) Desiccant water uptake.
Figure 8.
The influence of switching time on adsorption/desorption characteristics: (a) Outlet air temperature; (b) Outlet air humidity; and (c) Desiccant water uptake.
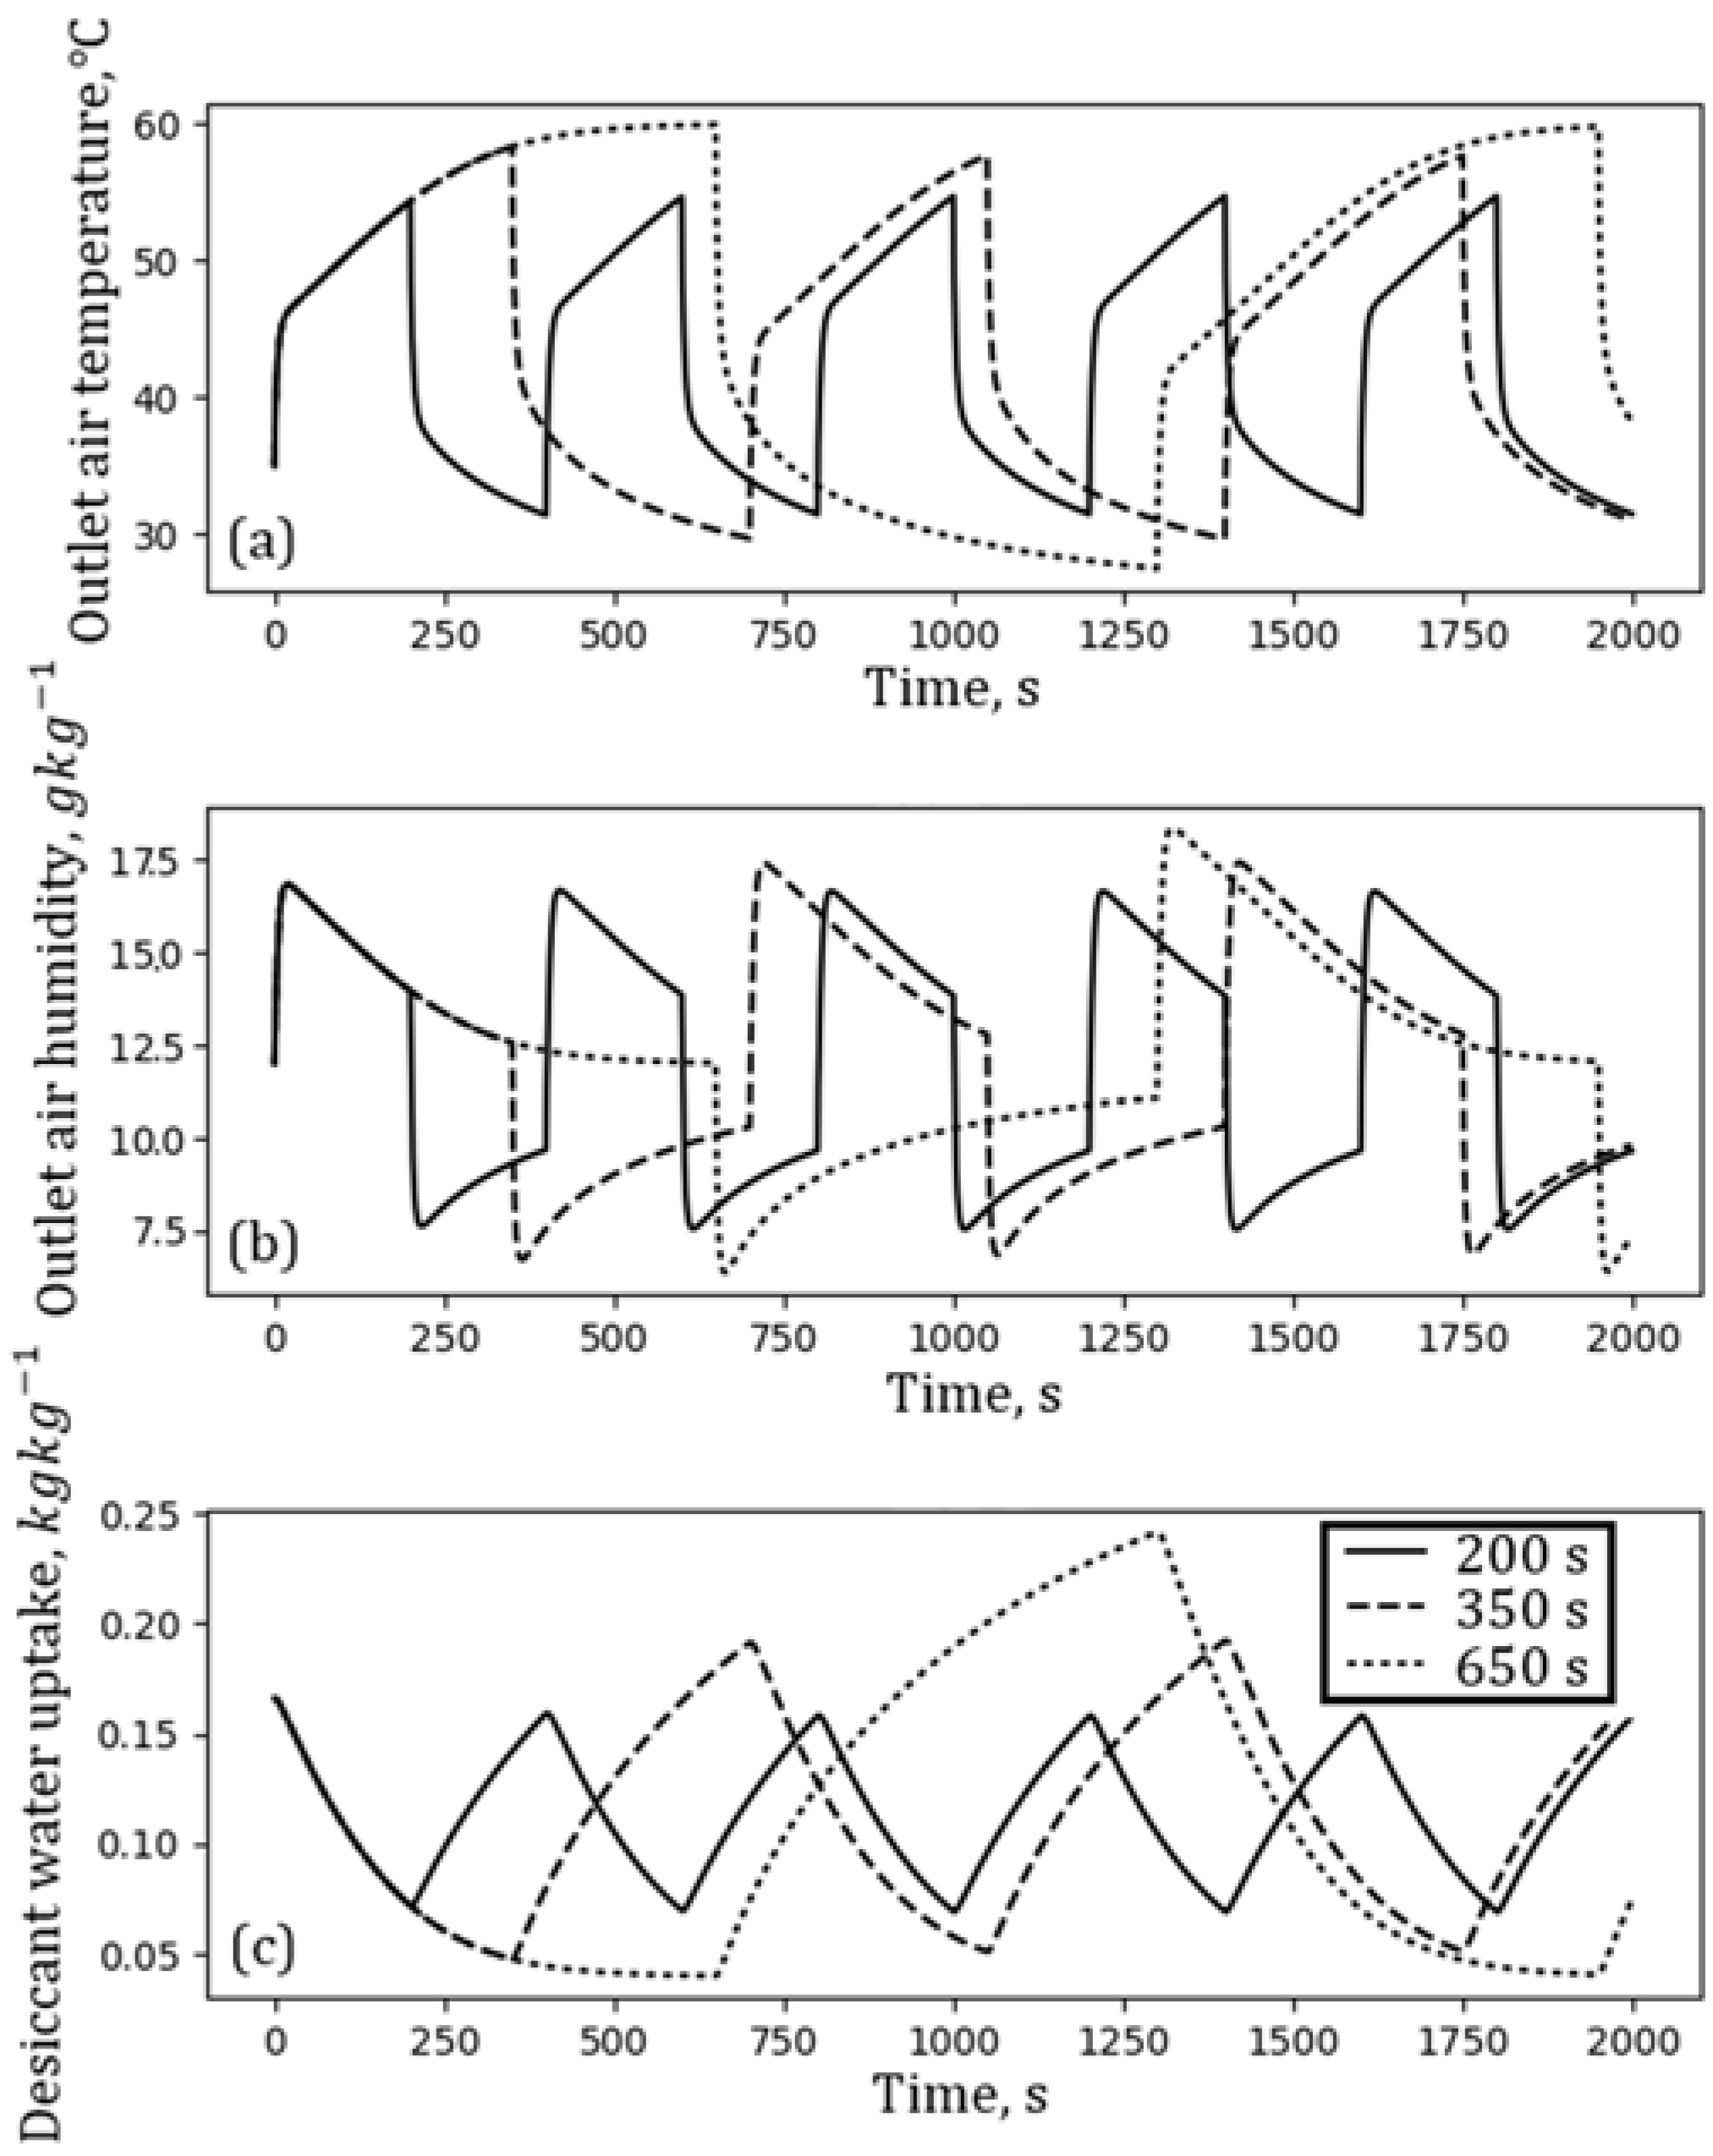
Figure 9.
The influence of the superficial air velocity on adsorption characteristics: (a) Outlet air temperature; (b) Outlet air humidity; (c) Desiccant water uptake.
Figure 9.
The influence of the superficial air velocity on adsorption characteristics: (a) Outlet air temperature; (b) Outlet air humidity; (c) Desiccant water uptake.

Figure 10.
The influence of superficial air velocity on desorption characteristics: (a) Outlet air temperature; (b) Outlet air humidity; (c) Desiccant water uptake.
Figure 10.
The influence of superficial air velocity on desorption characteristics: (a) Outlet air temperature; (b) Outlet air humidity; (c) Desiccant water uptake.
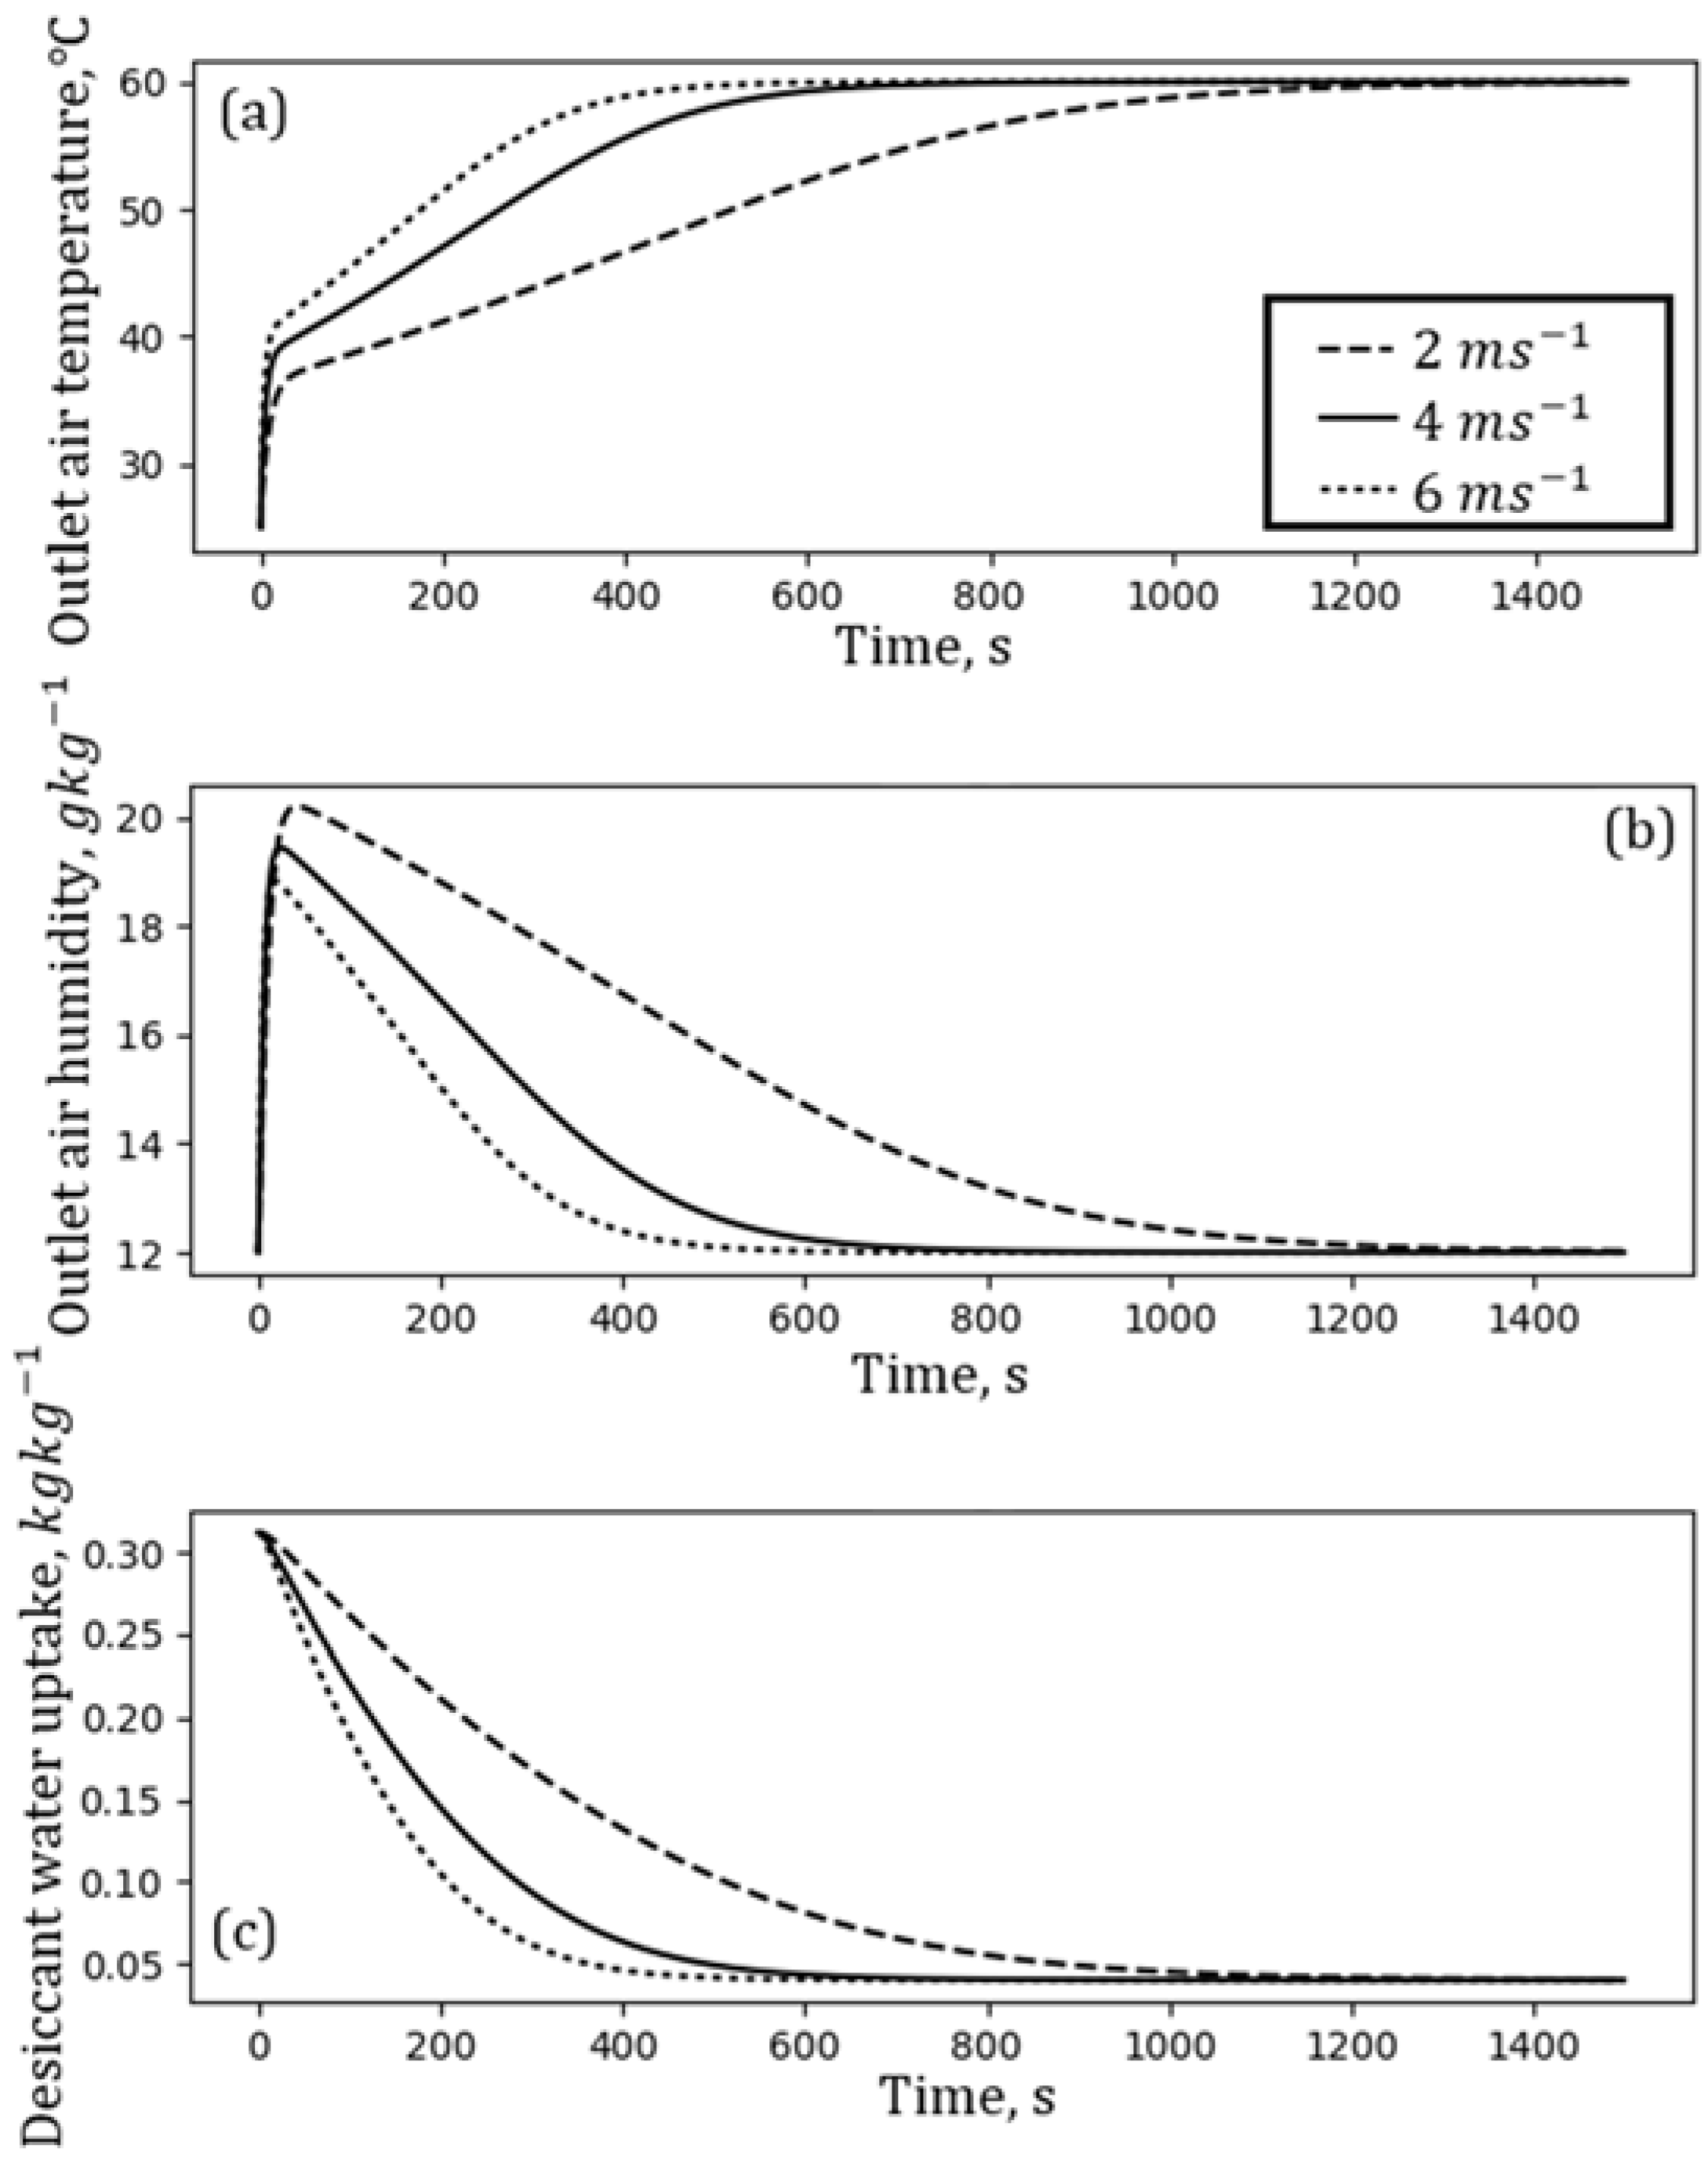
Figure 11.
The influence of superficial air velocity on: (a) thermal COP; (b) electric COP; (c) SCP.
Figure 11.
The influence of superficial air velocity on: (a) thermal COP; (b) electric COP; (c) SCP.

Figure 12.
The influence of desiccant filling height on adsorption characteristics: (a) Outlet air temperature; (b) Outlet air humidity; (c) Desiccant water uptake.
Figure 12.
The influence of desiccant filling height on adsorption characteristics: (a) Outlet air temperature; (b) Outlet air humidity; (c) Desiccant water uptake.
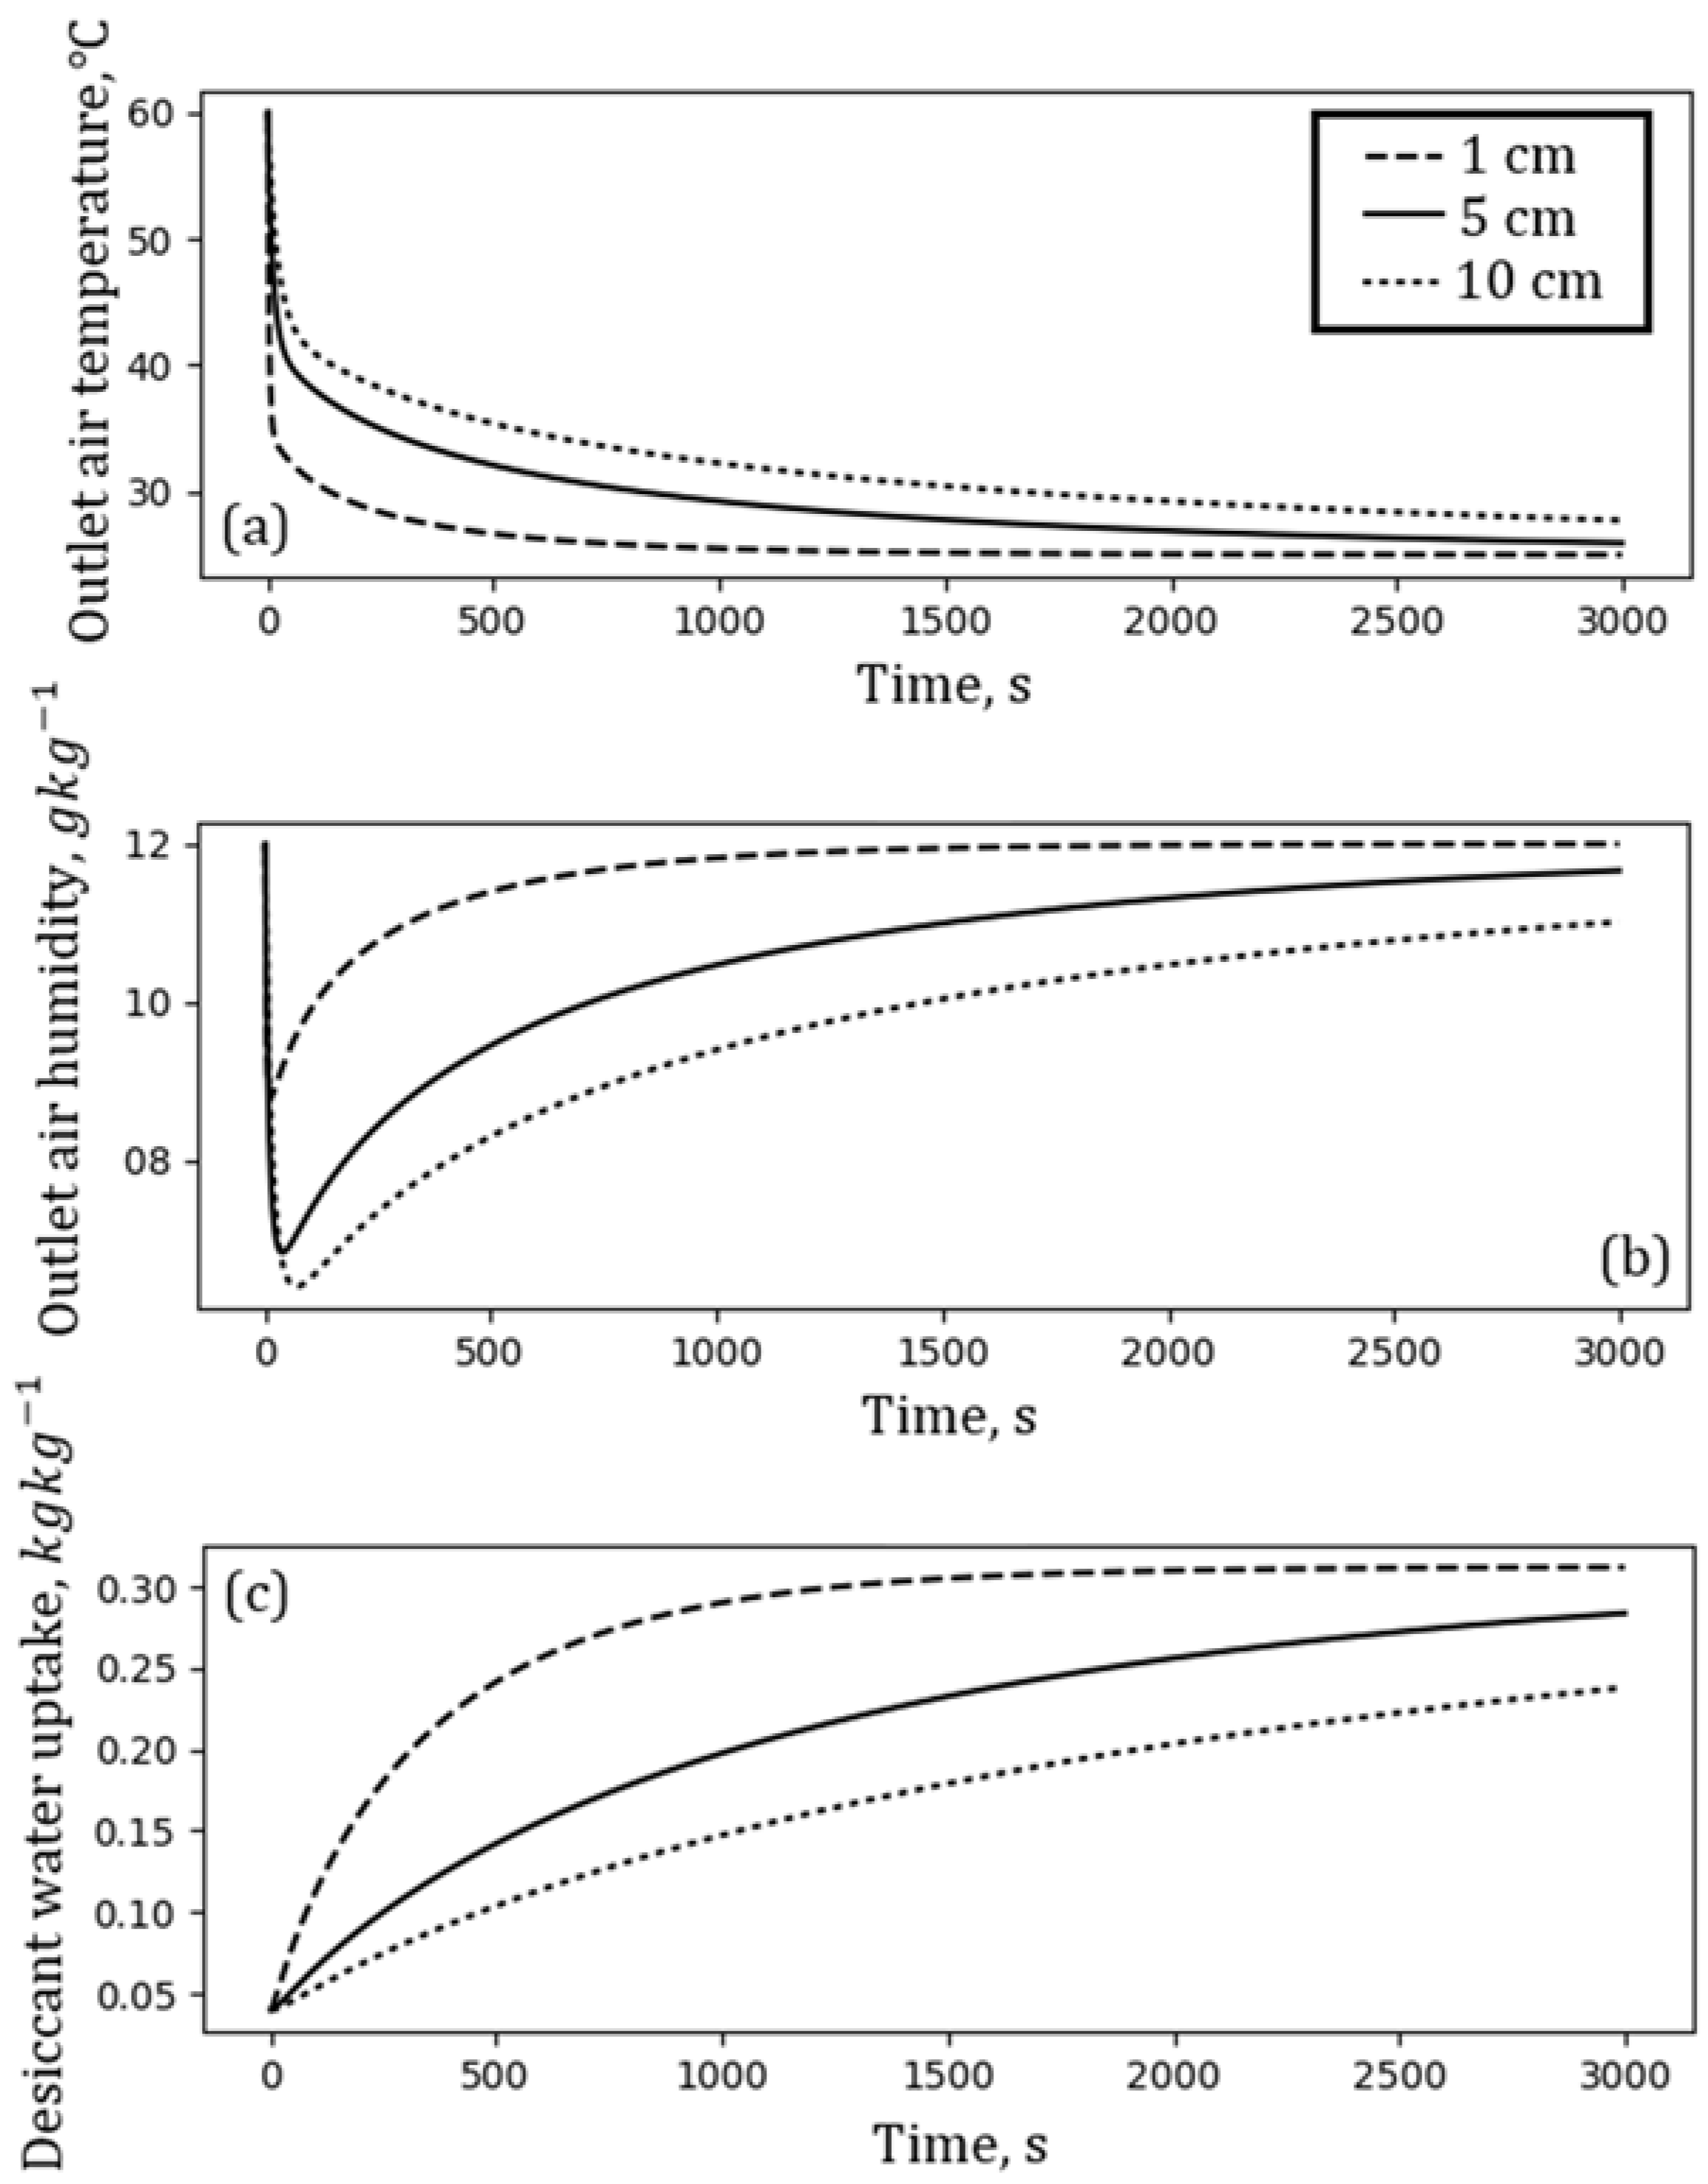
Figure 13.
The influence of desiccant filling height on desorption characteristics: (a) Outlet air temperature; (b) Outlet air humidity; and (c) Desiccant water uptake.
Figure 13.
The influence of desiccant filling height on desorption characteristics: (a) Outlet air temperature; (b) Outlet air humidity; and (c) Desiccant water uptake.

Figure 14.
The influence of desiccant filling height and superficial air velocities during adsorption and desorption (both velocities are equal) on the performance of the FDC: (a) thermal COP; (b) electric COP; (c) SCP.
Figure 14.
The influence of desiccant filling height and superficial air velocities during adsorption and desorption (both velocities are equal) on the performance of the FDC: (a) thermal COP; (b) electric COP; (c) SCP.


Table 1.
Operating parameters used in analyzes.
| Operating Parameter | dp, mm | tsw, s | Uads, m/s | Udes, m/s | Hd, cm |
|---|---|---|---|---|---|
| Desiccant particle diameter (see Figure 4) | 1, 3, 5 | 3000 | 2 | 2 | 5 |
| Desiccant particle diameter (see Figure 5) | 1, 3, 5 | 2000 | 2 | 2 | 5 |
| Desiccant particle diameter (see Figure 6) | 1–5 | optimum | 2 | 2 | 5 |
| Switching time (see Figure 7) | 1, 3, 5 | 200–1500 | 2 | 2 | 4 |
| Switching time (see Figure 8) | 1 | 200, 350, 650 | 2 | 2 | 4 |
| Superficial air velocity during adsorption (see Figure 9) | 1 | 2000 | 2, 4, 6 | - | 4 |
| Superficial air velocity during desorption (see Figure 10) | 1 | 1500 | - | 2, 4, 6 | 4 |
| Superficial air velocities (see Figure 11) | 1 | optimum | 1–6 | 1–6 | 4 |
| Desiccant filling height (see Figure 12) | 1 | 3000 | 2 | - | 1, 5, 10 |
| Desiccant filling height (see Figure 6) | 1 | optimum | 2 | - | 1, 5, 10 |
| Superficial air velocities and desiccant filling height (see Figure 14) | 1 | optimum | 2–6 | 2 | 1–6 |
© 2018 by the authors. Licensee MDPI, Basel, Switzerland. This article is an open access article distributed under the terms and conditions of the Creative Commons Attribution (CC BY) license (http://creativecommons.org/licenses/by/4.0/).
Share and Cite
MDPI and ACS Style
Rogala, Z.; Kolasiński, P.; Błasiak, P. The Influence of Operating Parameters on Adsorption/Desorption Characteristics and Performance of the Fluidised Desiccant Cooler. Energies 2018, 11, 1597. https://doi.org/10.3390/en11061597
AMA Style
Rogala Z, Kolasiński P, Błasiak P. The Influence of Operating Parameters on Adsorption/Desorption Characteristics and Performance of the Fluidised Desiccant Cooler. Energies. 2018; 11(6):1597. https://doi.org/10.3390/en11061597
Chicago/Turabian StyleRogala, Zbigniew, Piotr Kolasiński, and Przemysław Błasiak. 2018. "The Influence of Operating Parameters on Adsorption/Desorption Characteristics and Performance of the Fluidised Desiccant Cooler" Energies 11, no. 6: 1597. https://doi.org/10.3390/en11061597
Note that from the first issue of 2016, this journal uses article numbers instead of page numbers. See further details here.