The Effect of a Vertical Electric Field on the Surface Flashover Characteristics of a Bushing Model


1
Laboratory of Advanced Technology of Electrical Engineering and Energy, Graduate School at Shenzhen, Tsinghua University, Shenzhen 518055, Guangdong, China
2
Applied Science, Université du Québec à Chicoutimi (UQAC), 555 Boulevard de l’Université, Chicoutimi, QC G7H 2B1, Canada
*
Author to whom correspondence should be addressed.
Energies 2018, 11(6), 1607; https://doi.org/10.3390/en11061607
Submission received: 27 May 2018
/
Revised: 13 June 2018
/
Accepted: 15 June 2018
/
Published: 20 June 2018
(This article belongs to the Section F: Electrical Engineering)
Abstract
:High-voltage bushings play a crucial role in energy conveyance. Their specialized electric structure makes the bushing more vulnerable to surface discharge. However, the influence of a vertical electric field on the surface flashover of bushing structures remains unclear. To investigate this mechanism, four simplified bushing samples were built and the influence of pollution, leakage length, and the electric field component vertical to the dielectric surface on flashover properties of the bushing samples were tested. It was found that the surface pollution level was the decisive factor that influenced flashover voltage. When the leakage length and form factor were the same, the pollution flashover of the bushing structure was lower than that of the post structure. It was also found that increasing the leakage length was not very effective in improving the flashover voltage of bushings when the equivalent salt deposit density (ESDD) was high. No obvious correlation was found between pollution flashover voltage and electric field stress. Furthermore, the uneven wetting flashover performance of the bushings was tested. Under this condition, the flashover voltage decreased with an increase of the electric field component vertical to the dielectric surface. In addition, the electric field distribution of the samples was calculated and the results were in accordance with the experimental results.
1. Introduction
In high-voltage (HV) conversion substations, HV bushings play an important role. They not only convey current through walls or transformer tanks but also act as insulation between lead wires and the ground. With the increase in voltage level, many flashover accidents in substations have been reported in the U.S., Canada, Brazil, and China [1,2,3,4]. Among these, more than 70% were related to HV wall bushings. The reported flashovers of HV bushings mostly happened under operational voltage on rainy days even when there was a relatively low equivalent salt deposit density (ESDD) (less than 0.1 mg/cm2). As the configuration of a HV bushing is generally different from that of a line or post insulator, it is necessary to investigate their flashover mechanism in order to improve the bushing design and eventually avoid similar flashover accidents.
Some researchers have attributed bushing flashovers to uneven wetting. In substations, wall bushings are generally mounted at an angle of incline θ (0° ≤ θ ≤ 15°). When rain falls, part of the bushings in the vicinity of walls may be sheltered by the roof. Therefore, the bushing surface could not be wetted evenly. As the resistance of dry bands is much higher than that of wet bands, most of the voltage drop is applied across the dry zone, leading to the initiation of local arcs. Once an arc length reaches a critical value, flashover happens [5,6,7,8,9]. Tang et al. [10] established a flashover model to predict the flashover voltage of unevenly wetted HV direct current (HVDC) wall bushings. The authors also used that model to investigate the influence of dry zone length on flashover voltage. Schneider proposed a time-varying dry band model to explain the flashover process [11]. He gave the prerequisites of a model and demonstrated that the resistance ratio of a wet to a dry band was an important factor for the occurrence of flashover. The models mentioned above treated the bushing as a line insulator structure. However, the electric field distribution of an HV bushing is different from that of a line insulator. For HV bushings, as the central conductor is surrounded by an insulating sheath and the flange is grounded, the electric field component vertical to the dielectric surface is very strong [12,13,14]. Due to the difference in electric field distribution, the flashover mechanism of a bushing may be different from that of a line or post insulator.
Lambeth carried out experiments on HVDC wall bushings and found that their performance was inferior to that of empty porcelain shells under the same rain condition [15]. This conclusion was also verified by Katsuhiko, who made samples of porcelain shells with protruded electrodes to simulate a real bushing’s structure [16]. He found that samples with protruded electrodes had lower flashover voltages than those made of bare shells. Noticing structural differences between post insulators and HV bushings, Fan compared the impulse flashover characteristics of these two structures and studied the influence of surface conductivity and gap length on the flashover voltage of each type [17]. Although many studies have been carried out on the surface flashover of HV bushings, the influence of electric field components vertical to the dielectric surface has not been touched. Further investigation on this problem may benefit the research on improving surface flashover performance of HV bushings as well as equipment that is also subjected to strong electric field components vertical to the dielectric surface, such as basin insulators [18,19,20].
In this paper, a simplified bushing model was established and alternating current (AC) flashover experiments were carried out. During the experiments, the flashover procedures and arc propagations developed from typical sliding discharge and pollution discharge were observed using a high-speed camera. The effects of ESSD, leakage length, and the electric field component vertical to the dielectric surface were also investigated. To explain the test results, numerical calculations were performed and the calculated results were consistent with the experimental results.
2. Test Facilities, Specimen, and Procedure
2.1. Experimental Setup
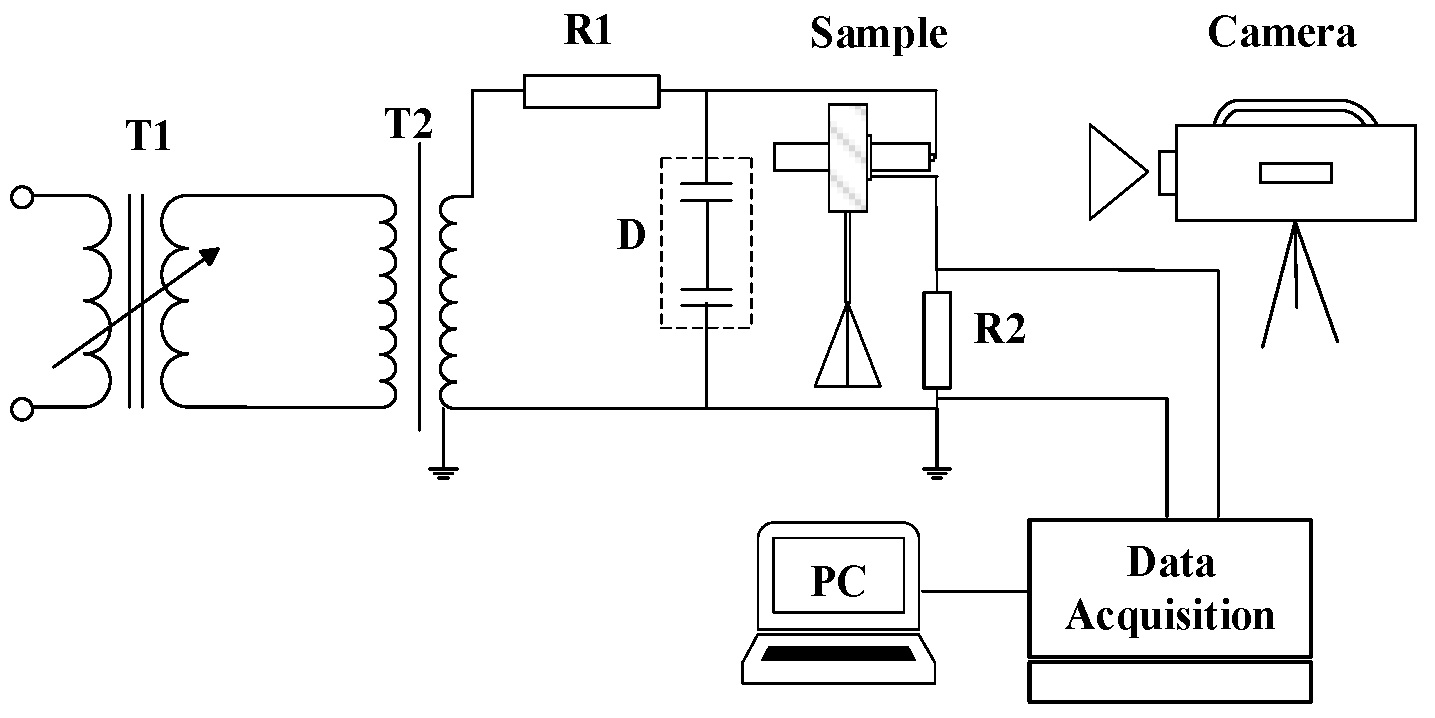
The schematic diagram of the test circuit is shown in Figure 1. The power was supplied by a 50 kV/100 kVA transformer with a rated output current of 2 A and a short-circuit current over 3 A. The test sample was fixed horizontally on a stand specifically made for the test. During the experiments, discharge propagation was photographed using a high-speed camera (Phorton Ultra) with a maximum screening speed of 7000 frames per second (fps) at full resolution (1024 × 768). The voltage applied to the test sample was measured by a voltage divider D and the leakage current was obtained by dividing the voltage applied to the non-inductive resistor R2 by its resistance. The voltage and leakage current signals were sampled simultaneously at 5 kHz by a data acquisition (DAQ) system.
2.2. Specimen
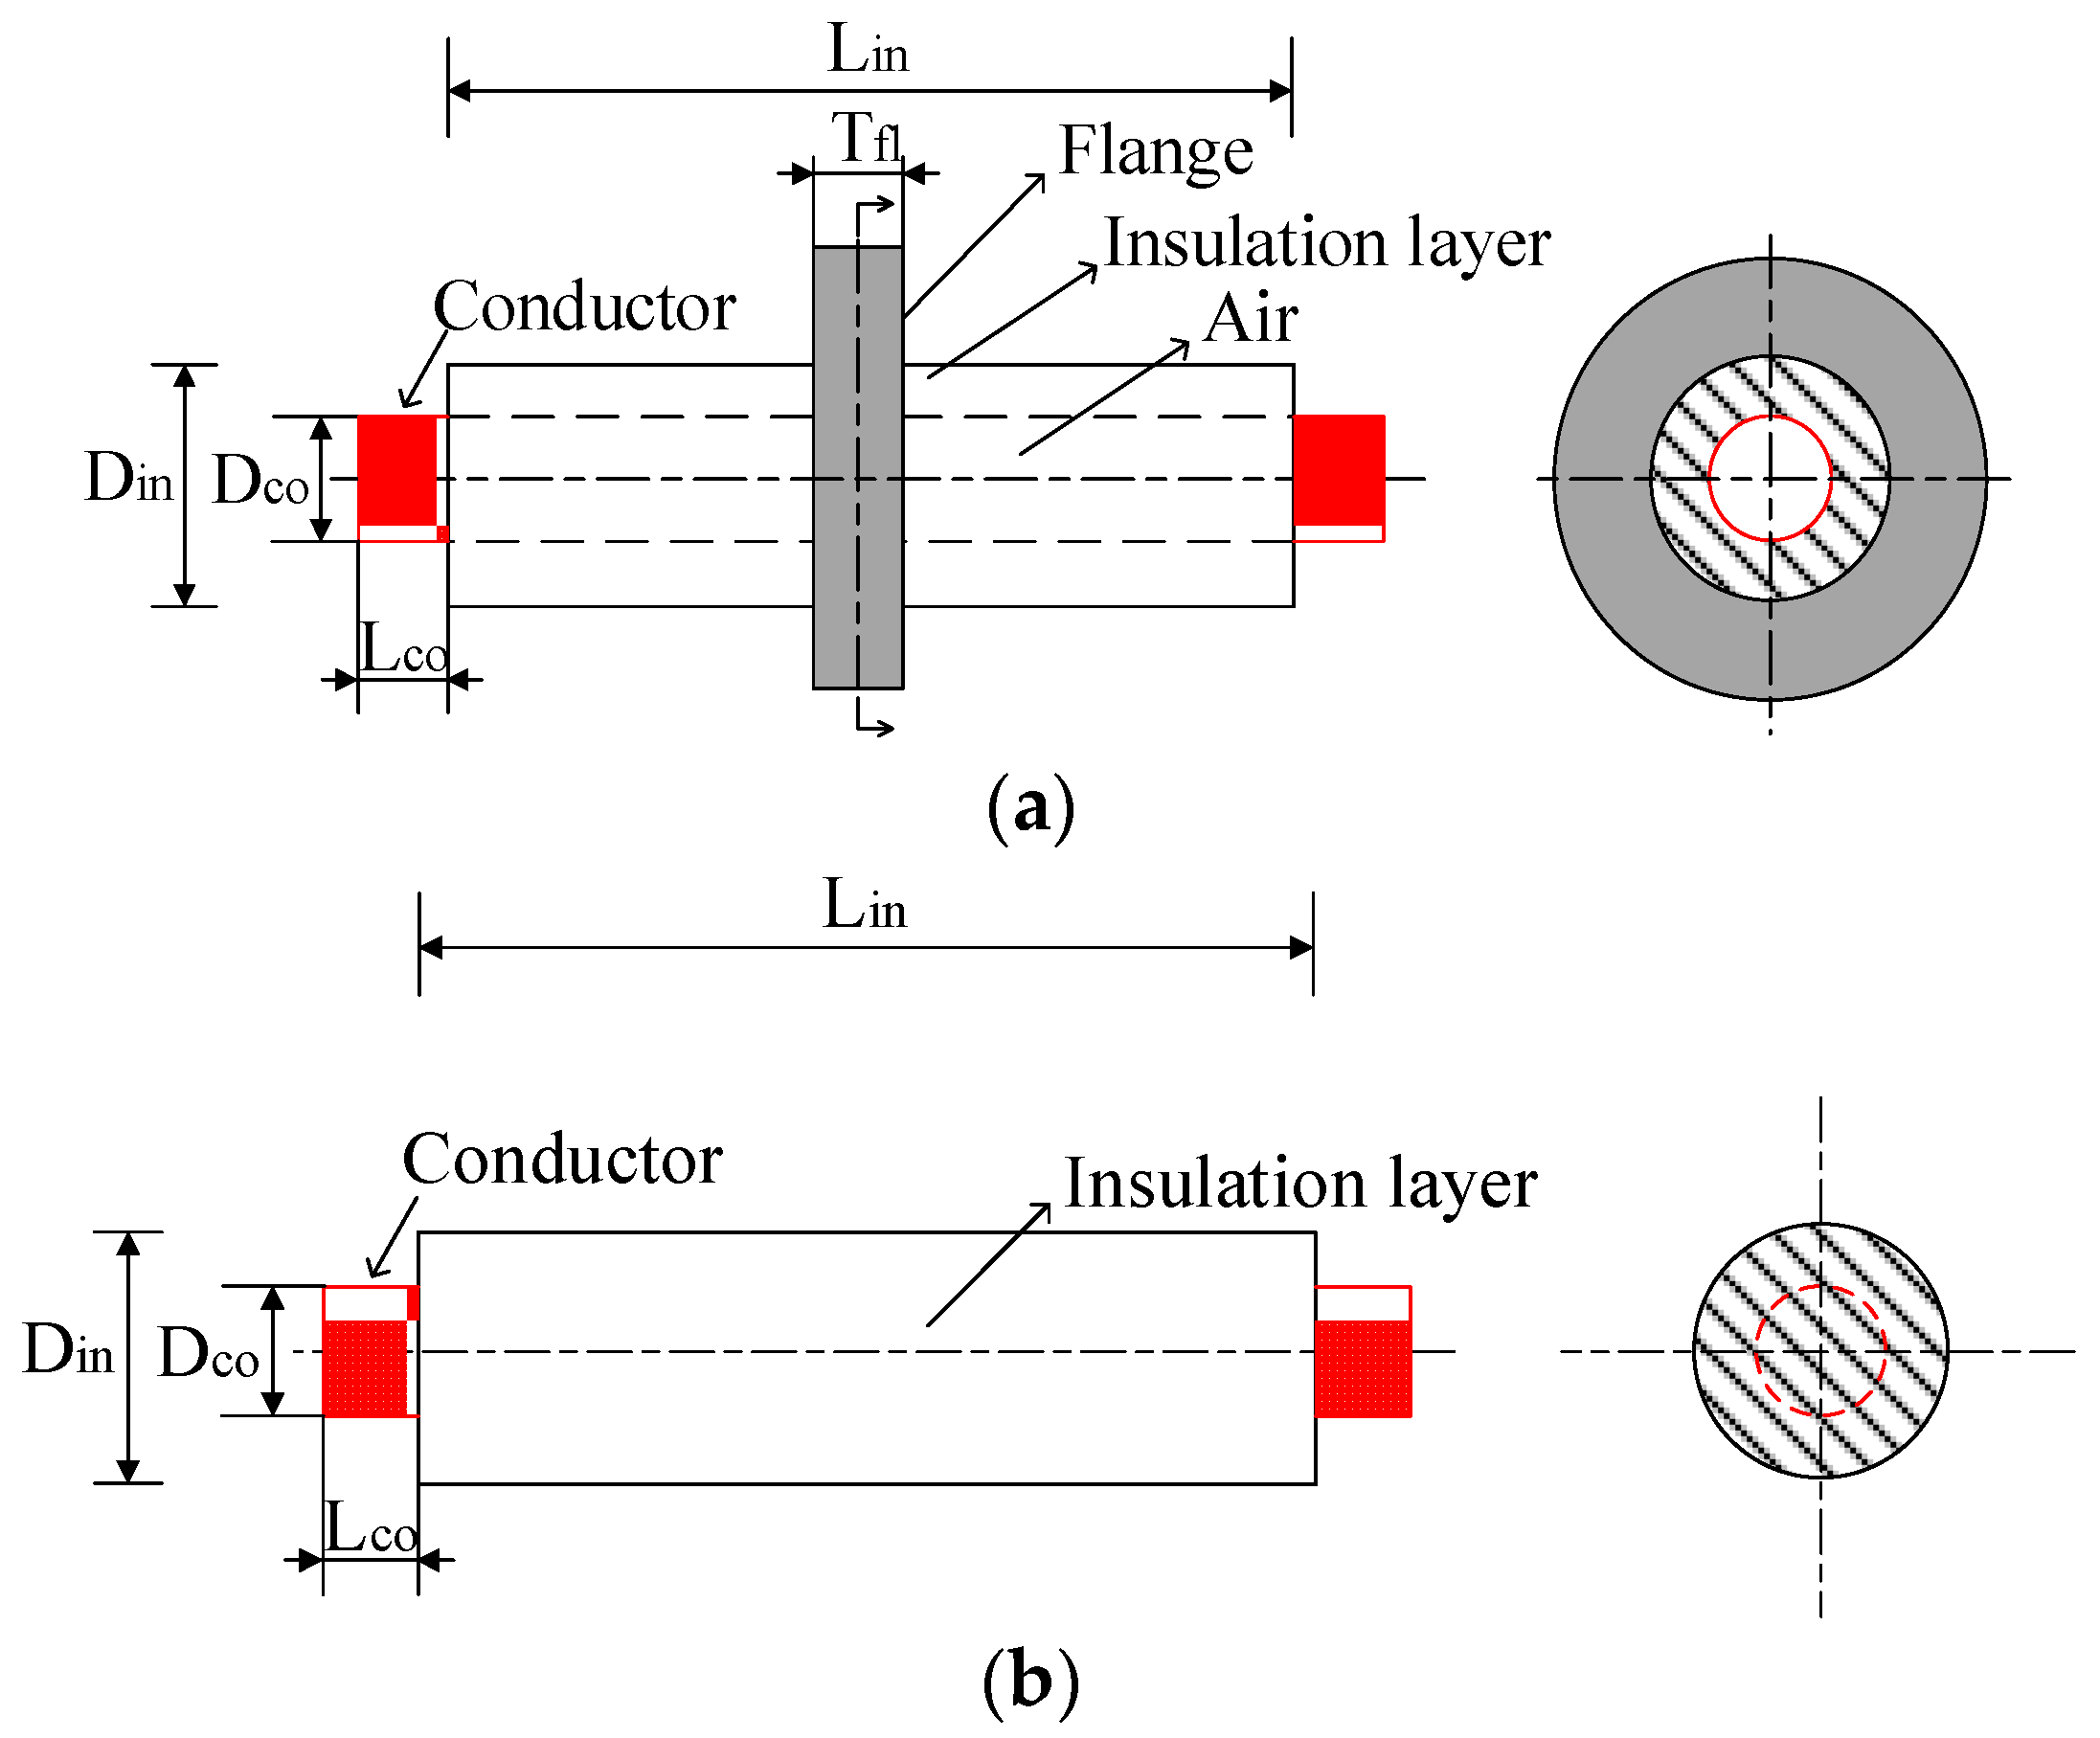
A simplified HV bushing structure [21,22,23], as shown in Figure 2a, was set up. This structure consisted of three layers from the outside to the inside. The outermost layer was the flange. It was made of aluminum with dimensions of 20 mm (thickness) × 230 mm (out diameter). An insulation layer made of nylon was in the middle, which had an out diameter of 120 mm. Two lengths of insulation layer, 320 mm and 580 mm, were chosen. The innermost layer was a hollow tube made of copper. Four samples of bushing structures, namely Type A to Type D, with tube diameters varying from 40 to 80 mm, were built to generate different vertical electric field strengths on the bushing. Moreover, to compare the electrical performance of a bushing structure with that of a post insulator, a post insulator structure was also built. It consisted of three segments, with a solid-cylinder insulation segment in the middle and two cylinder electrodes at both sides as illustrated in Figure 2b. The parameters of all bushing samples and the post sample are listed in Table 1.
2.3. Test Procedure
(1) Preparation. Before each contamination, the sample was carefully cleaned to make sure that all traces of dirt and grease were removed. After cleaning, the sample was dried naturally and not touched by hand.
(2) Contamination and wetting. A solid layer method in accordance with IEC60507 [24] was used to pollute the sample. A suspension consisting of Kaolin as inert material, a suitable amount of NaCl as conductive material, and distilled water were prepared and used to coat the sample surface uniformly. A fog chamber is generally recommended for artificial pollution tests to wet the samples. However, the presence of fog would dramatically reduce the visibility and thus handicap the recording of the arc formation and development process [25]. Therefore, instead of a fog chamber, distilled water was sprayed over the sample to wet the pollution layer before the tests in this study.
(3) Evaluation. The up-and-down method was used to determine the V50 withstand voltage [26]. For each test, the next voltage was increased or decreased depending on the last test result. If the last test withstood the voltage, the next voltage was increased in steps of 5% of the last test voltage (ΔU). Otherwise, the next voltage was decreased in steps of 5% of the last test voltage. Each sample was subjected to at least 10 “useful” tests at a given pollution level. The first test that yielded a result different from the preceding ones (from flashover to withstood or vice versa) was considered as the first “useful” test. This first “useful” test and at least nine of the following tests were performed to obtain the V50 withstand voltage, which was determined by
where Ui is the applied voltage, ni is the number useful tests at the same test voltage Ui, and N is the total number of useful tests. To record the arc formation and development process, a high-speed camera was used. It was connected to a personal computer (PC) through a RS-422 cable and the user could select the playback rate in the software.
3. Results
3.1. Flashover Voltage and Leakage Current
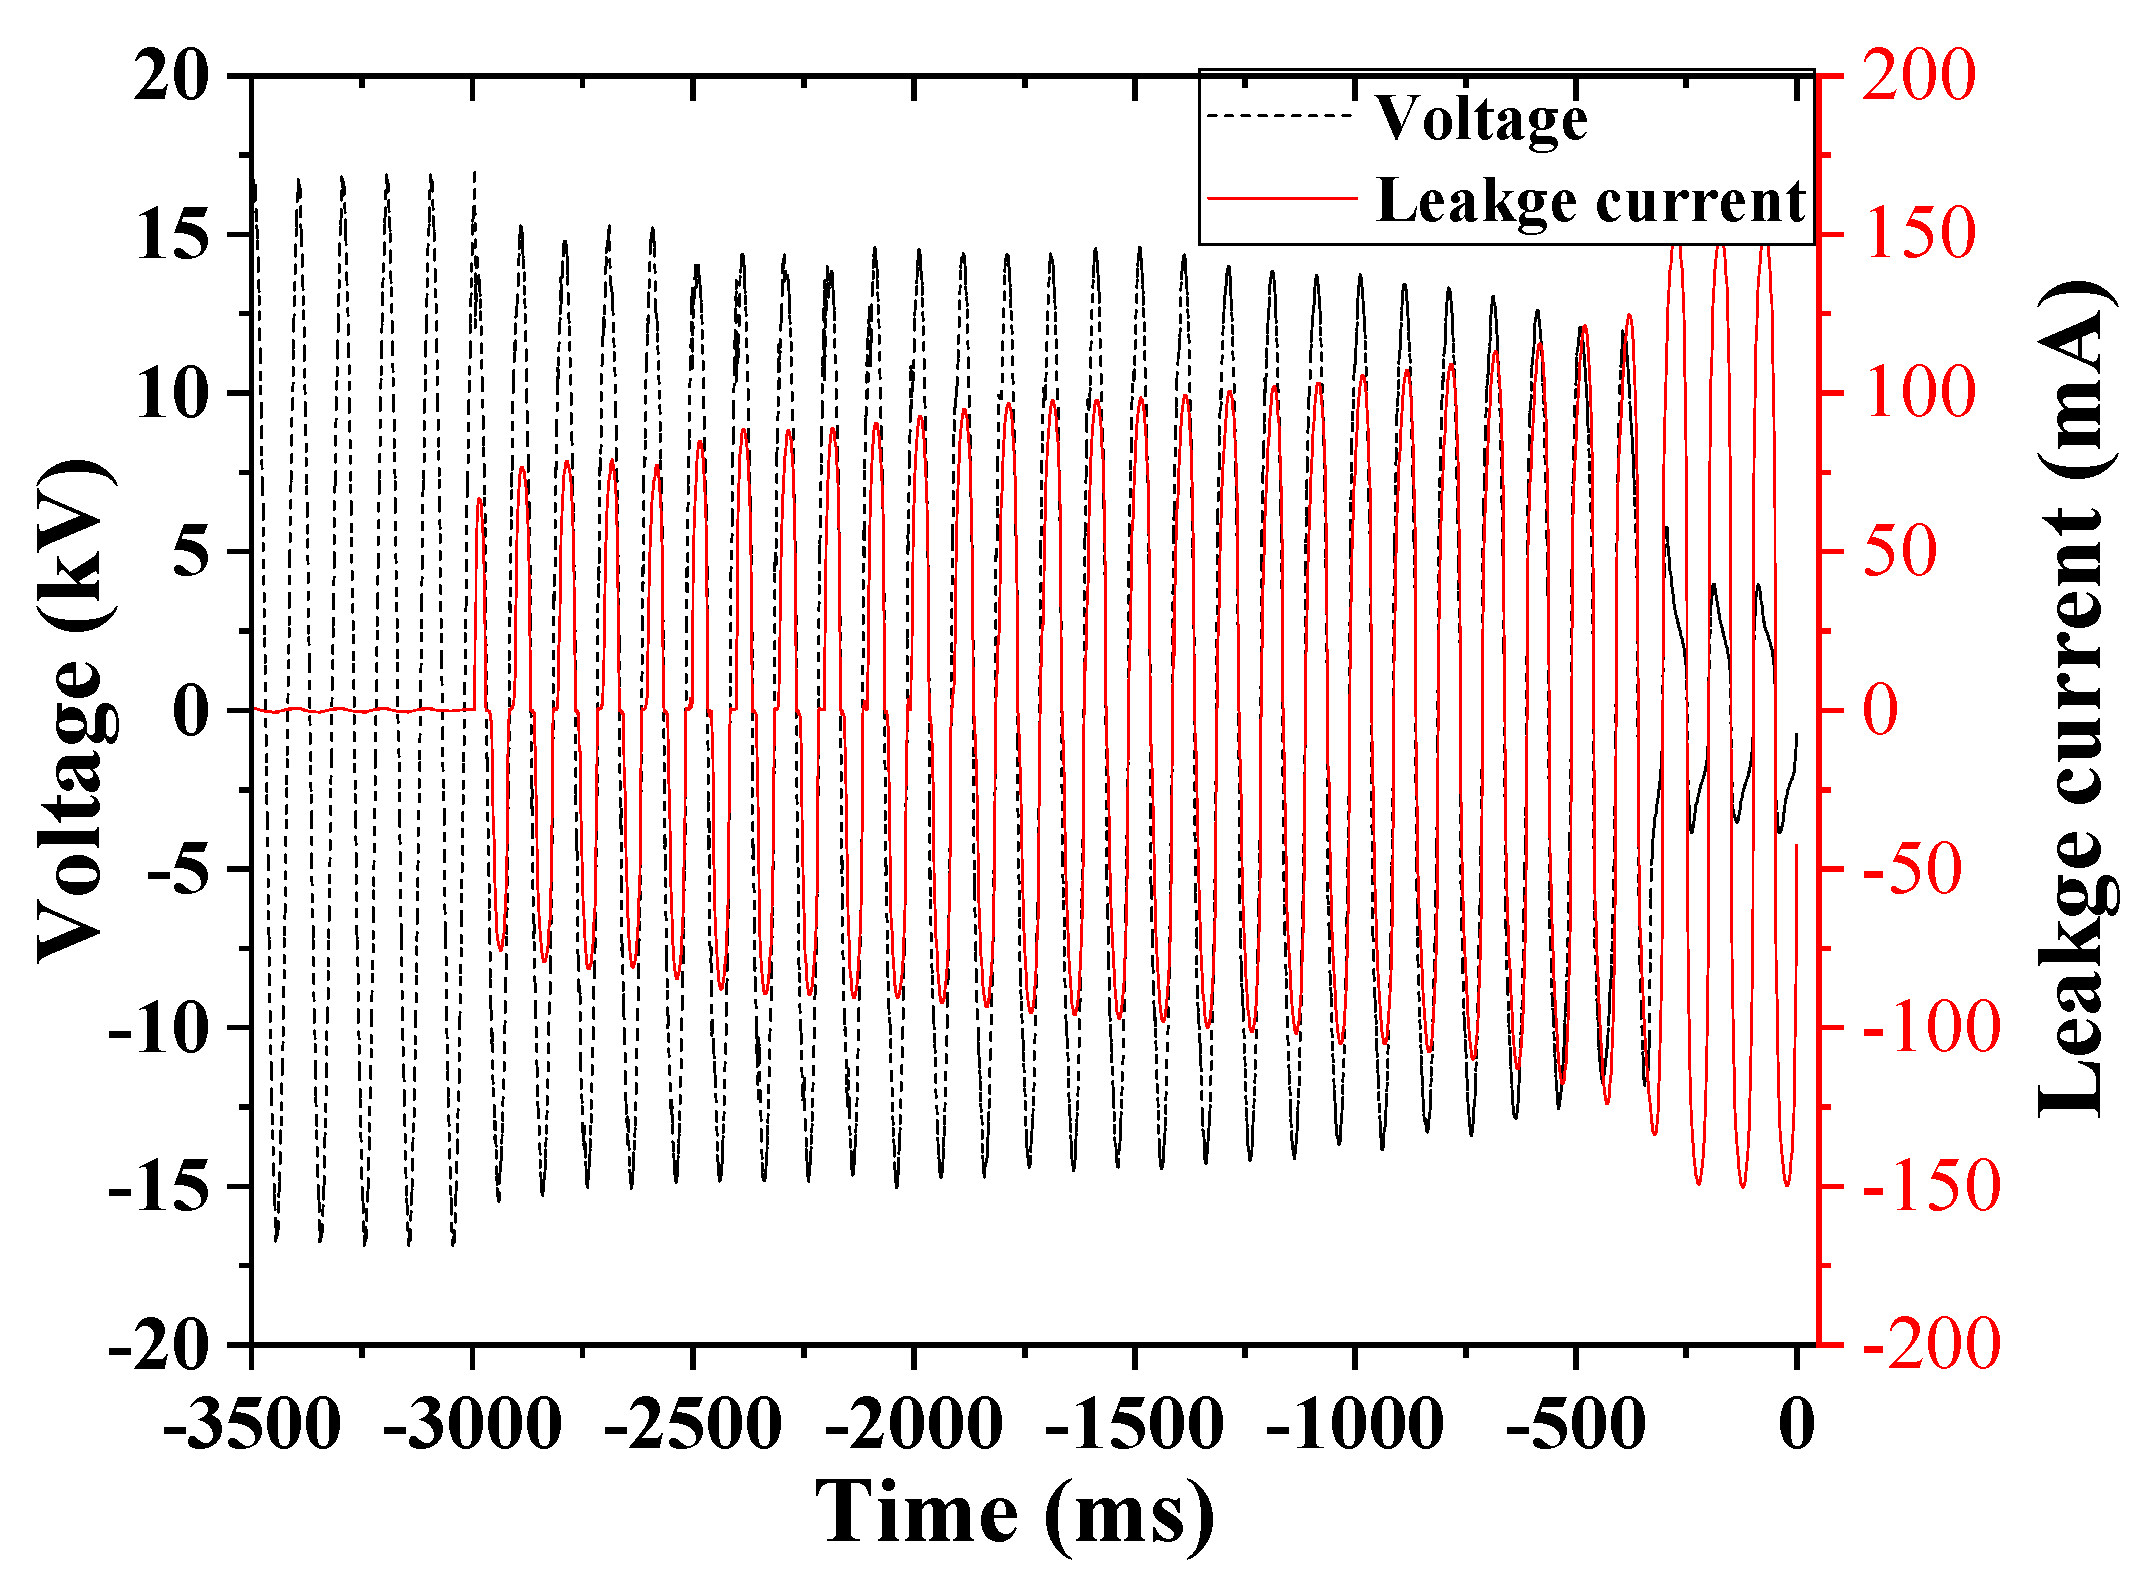
Figure 3 shows the recorded signals before flashover with an ESDD of 0.15 mg/cm2. The leakage current changed with the surface status of the sample. The amplitude of the current was only 0.5 mA till 3 s before the flashover and the surface resistance was about 30 MΩ, which indicated that the arc had not formed yet. Then, at 3 s before the flashover, the amplitude of the leakage current rose quickly to about 75 mA, indicating that a local arc began to develop. During this period, the leakage current was determined by the arc and pollution layer resistance, which were connected in series. Finally, the arc was increased to 150 mA, which means that the arc had propagated and connected the full channel. The applied voltage was almost in phase with the leakage current during the entire procedure, which showed that the circuit was mainly characterized by its resistive nature.
In Figure 3, it can be observed that the applied voltage decreased slightly when flashover was about to happen. When the arc bridged the full leakage length, the voltage decreased drastically. On the contrary, the leakage current increased slightly at the initiation of arc development and increased drastically at the time flashover took place. The changes in voltage and leakage current were in accordance with the volt-ampere characteristics of the arc, which showed that the flashover procedure on the bushing was still an arc-type surface flashover.
3.2. Arc Propagation Procedure of Sliding Discharge and Pollution Discharge
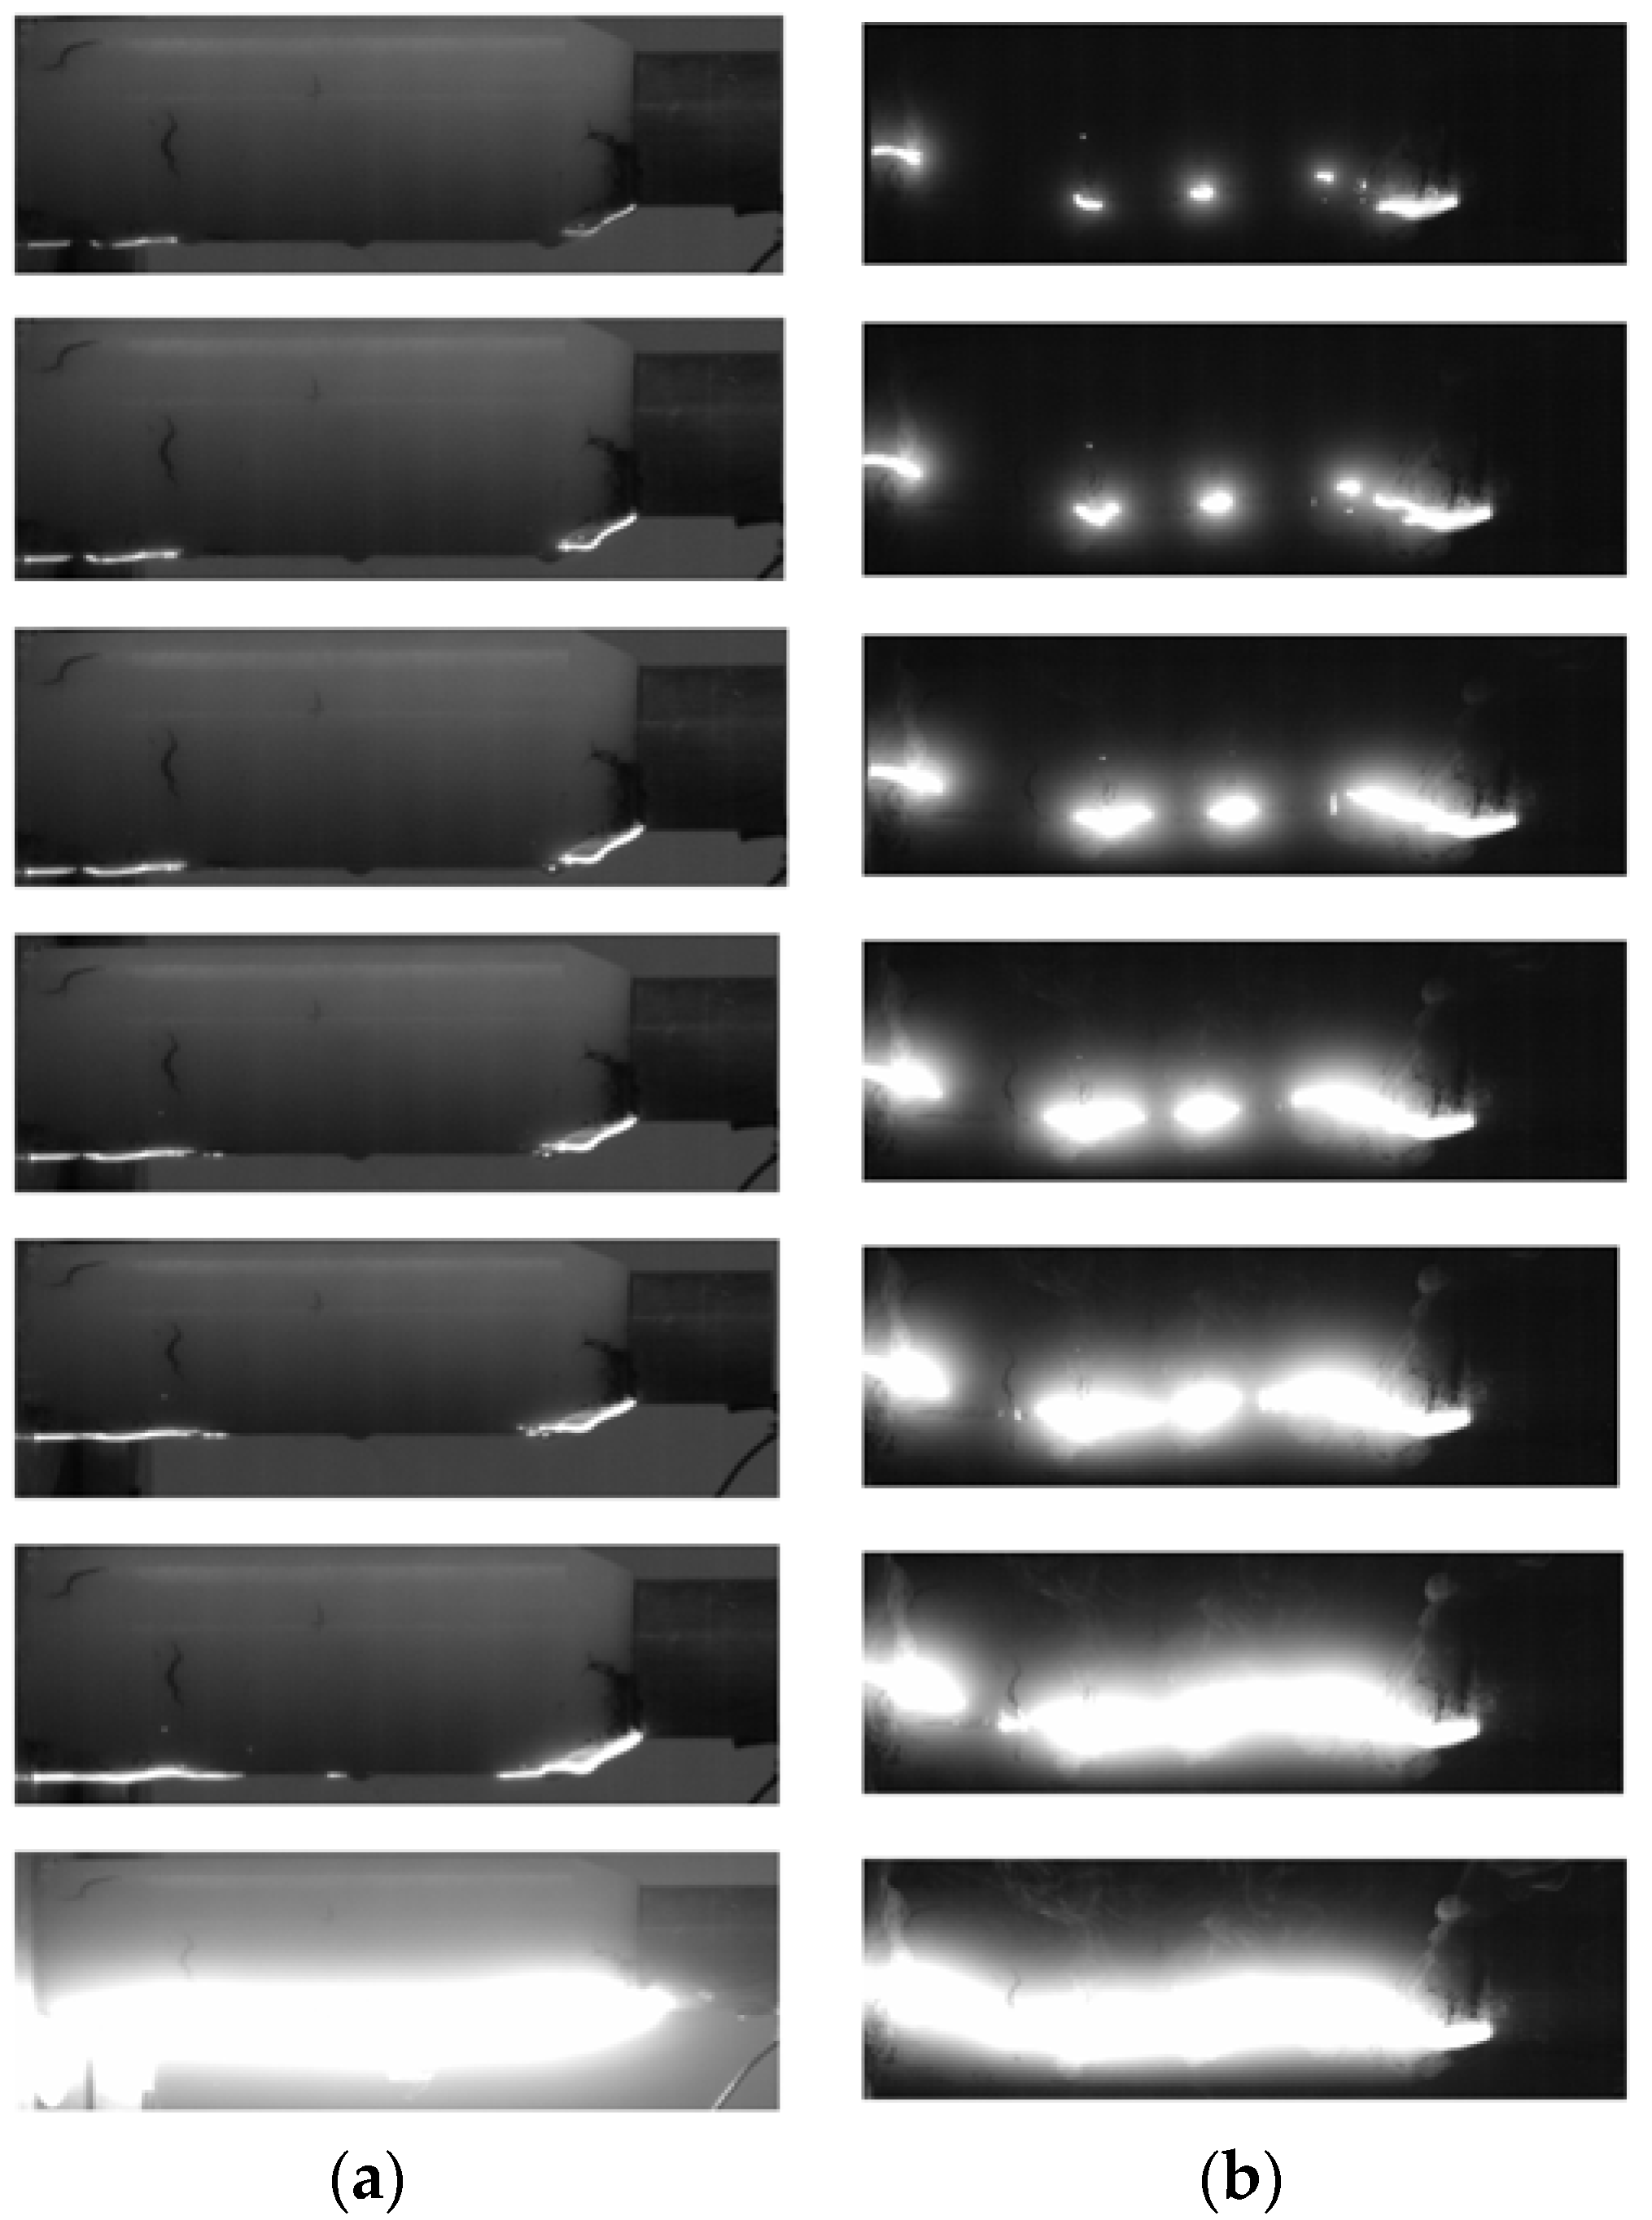
Sliding discharge is a very special discharge that only occurs when the electric field component vertical to the dielectric surface is very strong. HV bushings, as mentioned above, have such characteristics so that sliding flashover may happen when the applied voltage is high enough and the bushing surface is dry and relatively clean. Typical arc developments of sliding discharge and pollution discharge on sample A are illustrated in Figure 4.
For the bushing samples used in this study, flashover due to sliding discharge only happened when the samples were not polluted. Otherwise, flashover developing from pollution discharge would happen instead of sliding flashover as the length of the insulation layers was relatively short. Under the sliding discharge condition, the arc first emerged in the vicinity of the flange and at the intersection formed by an insulation layer, lead wire, and air as shown in the first picture of Figure 4a. Arc propagation observations show that the arc path on the surface of an insulating layer is relatively straight and the arc channel is very thin with low light intensity. Based on the high-speed camera recordings, the arc propagation velocity of sliding discharge was about 600 m/s. The sliding flashover voltage was 35.4 kV for sample A. Under the pollution discharge condition with an ESDD of 0.1 mg/cm2, as shown in Figure 4b, the pollution flashover voltage was only 11.7 kV and the arc propagation velocity was about 30 m/s. Unlike the sliding discharge, the arc of pollution discharge had a wide arc channel and high light intensity. However, at the moment that the flashover happened, the arc channel of the sliding flashover was even wider than that of the pollution flashover.
The recordings of these two kinds of discharge procedures indicated that they corresponded to different physical processes before flashover. For sliding discharges, electric field stress is the crucial parameter, which resulted in a much higher flashover voltage. In the case of pollution discharge, however, the dominant factor is the leakage current, which lead to a wider and brighter arc channel.
3.3. Effect of ESDD
ESDD is commonly used in describing the pollution degree of contaminated insulators. Due to the special configuration of bushings, the electric field is severely distorted at the intersection between the flange and the insulation layer. Therefore, the flashover properties of bushings may not only be determined by surface conductivity properties, but also by the electric field distribution between the conductor tube and the flange.
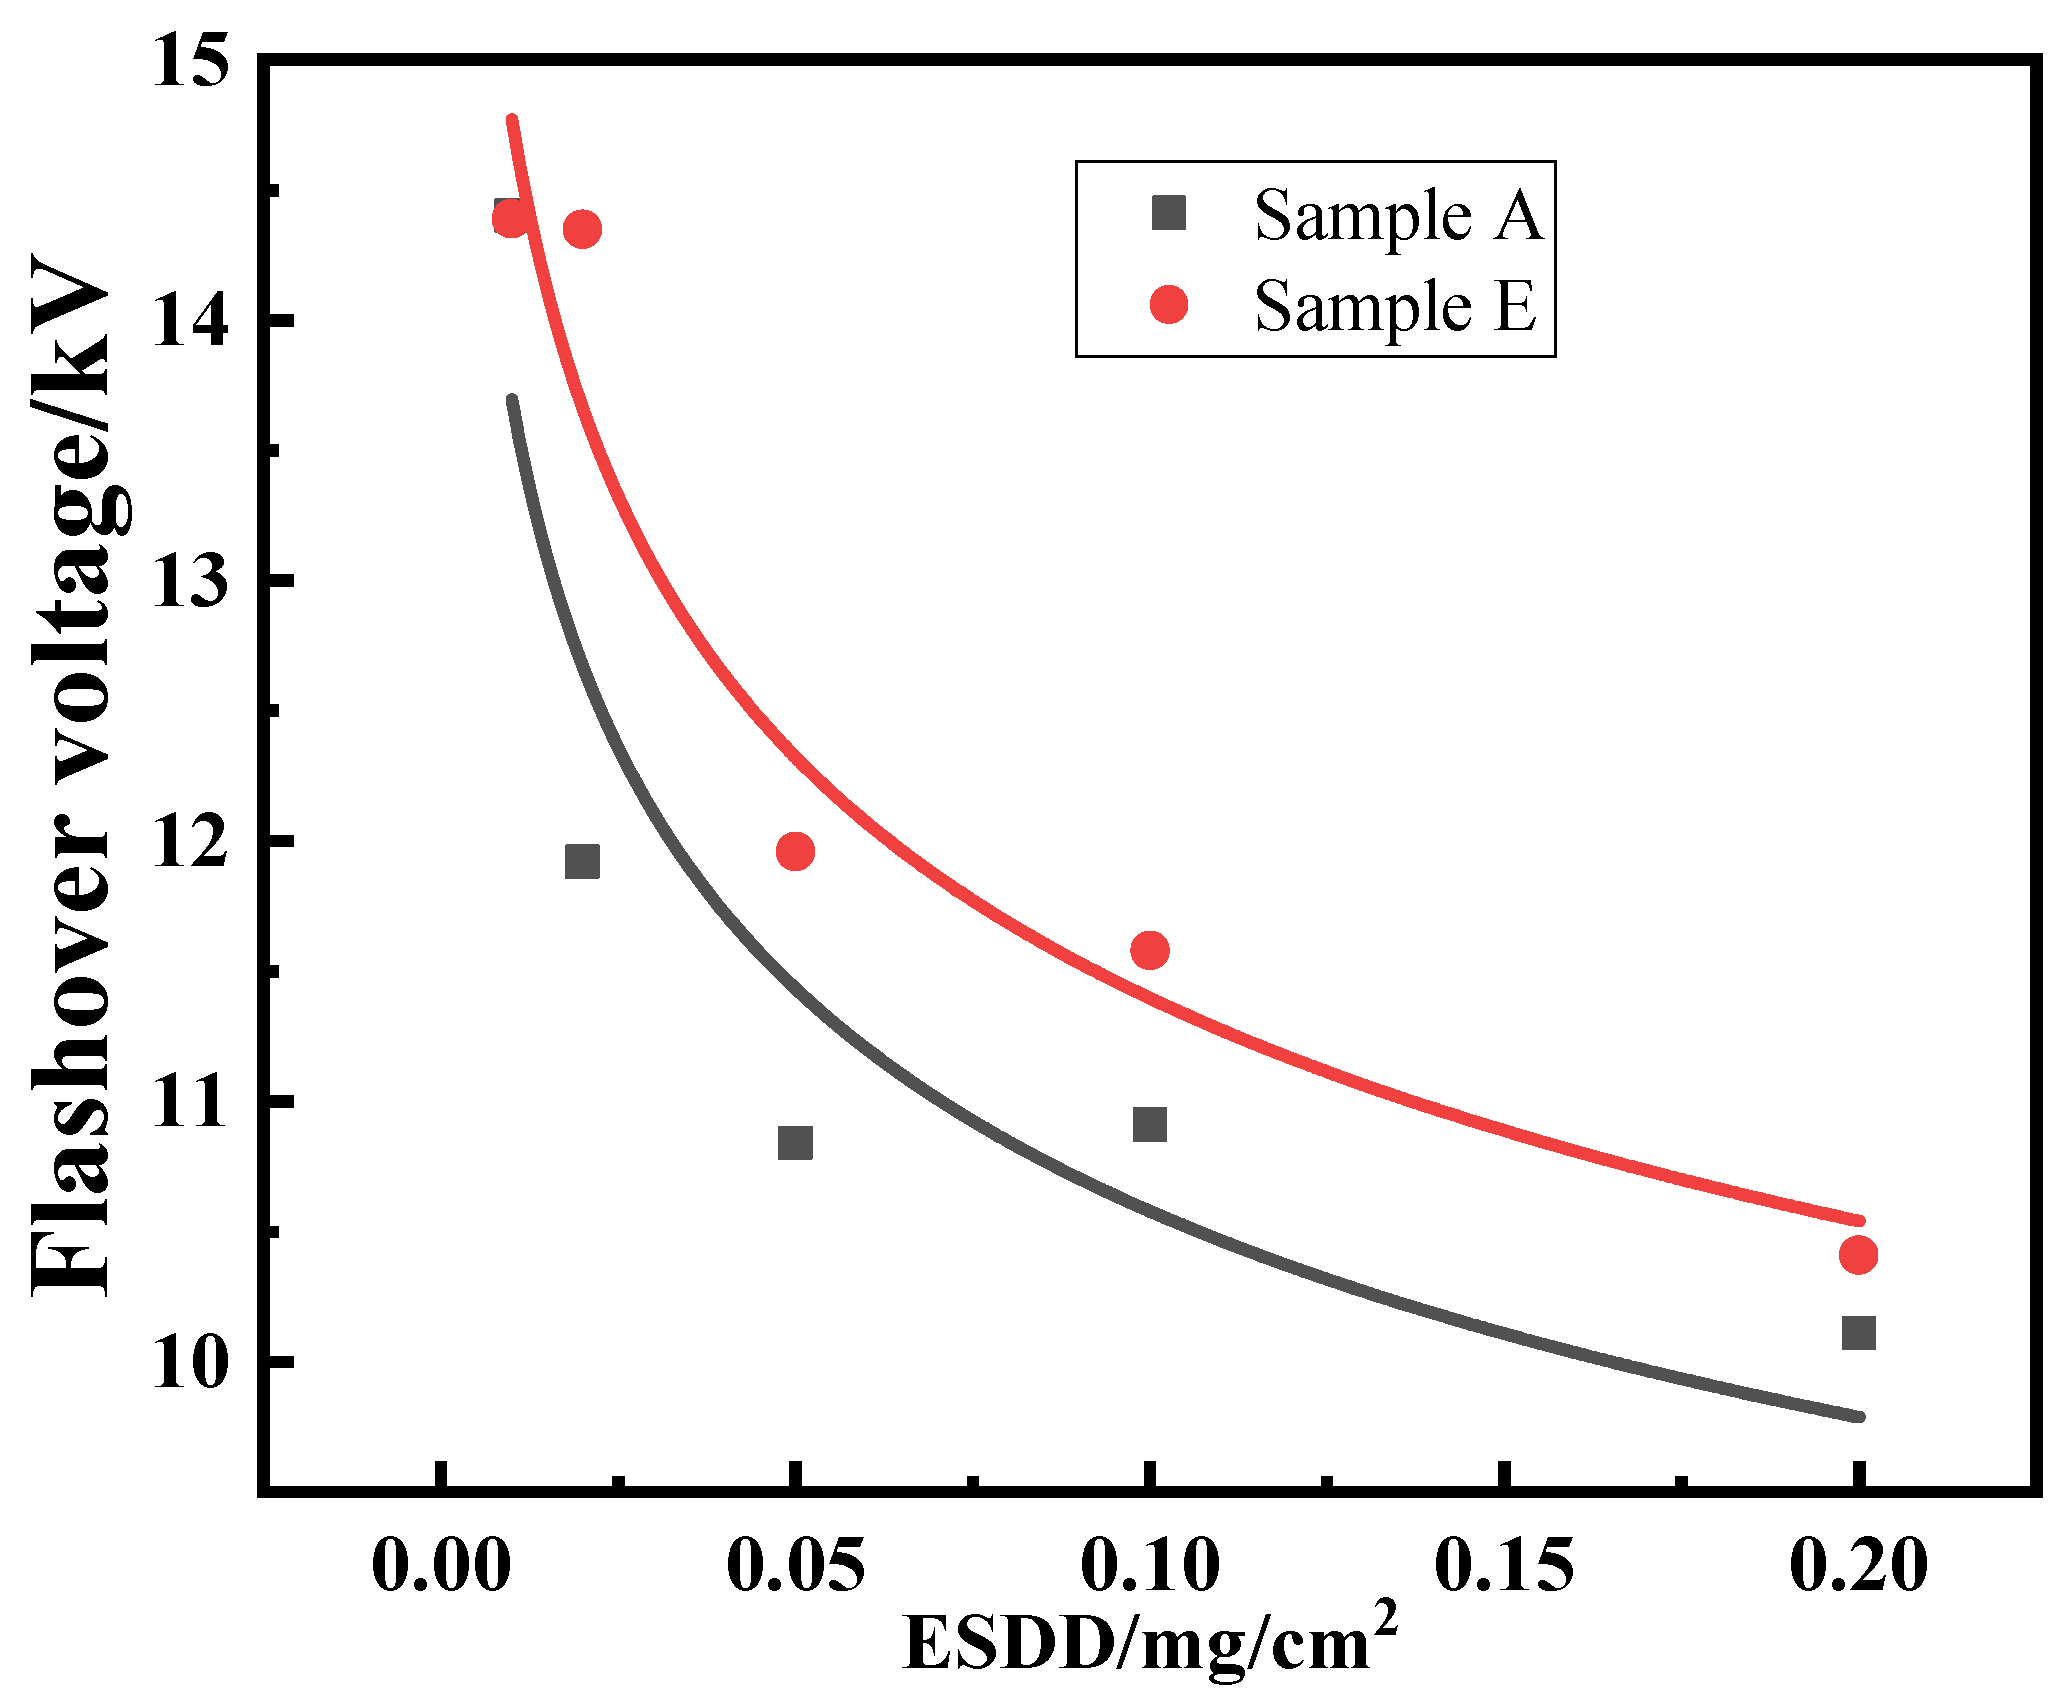
Experiments were carried out on sample A (bushing structure) and sample E (post insulator structure), which have the same length of insulation layer, to compare the flashover characteristics of the bushing and the post insulator [27]. The test ESDD ranged from 0.01 mg/cm2 to 0.2 mg/cm2, corresponding to light to heavy pollution; the results are shown in Figure 5. From the test results, it was found that the flashover voltage of the post insulator is 3.4–21.2% higher than that of the bushing at the same pollution level. It was also found that, for both structures, the flashover voltage decreases exponentially with the increase of ESDD. Compared with an ESDD of 0.01 mg/cm2, the flashover voltage at a pollution level of 0.2 mg/cm2 decreases 29.8% for the bushing structure (sample A) and 27.7% for the post insulator structure (sample E).
The flashover voltages of both samples A and E complied with the surface pollution flashover characteristics
where a represents the form parameter of the bushing sample, b represents the physical parameter of the surface arc, and R2 is the correlation coefficient. The calculated results for sample A and sample E are listed in Table 2.
3.4. Effect of Leakage Length
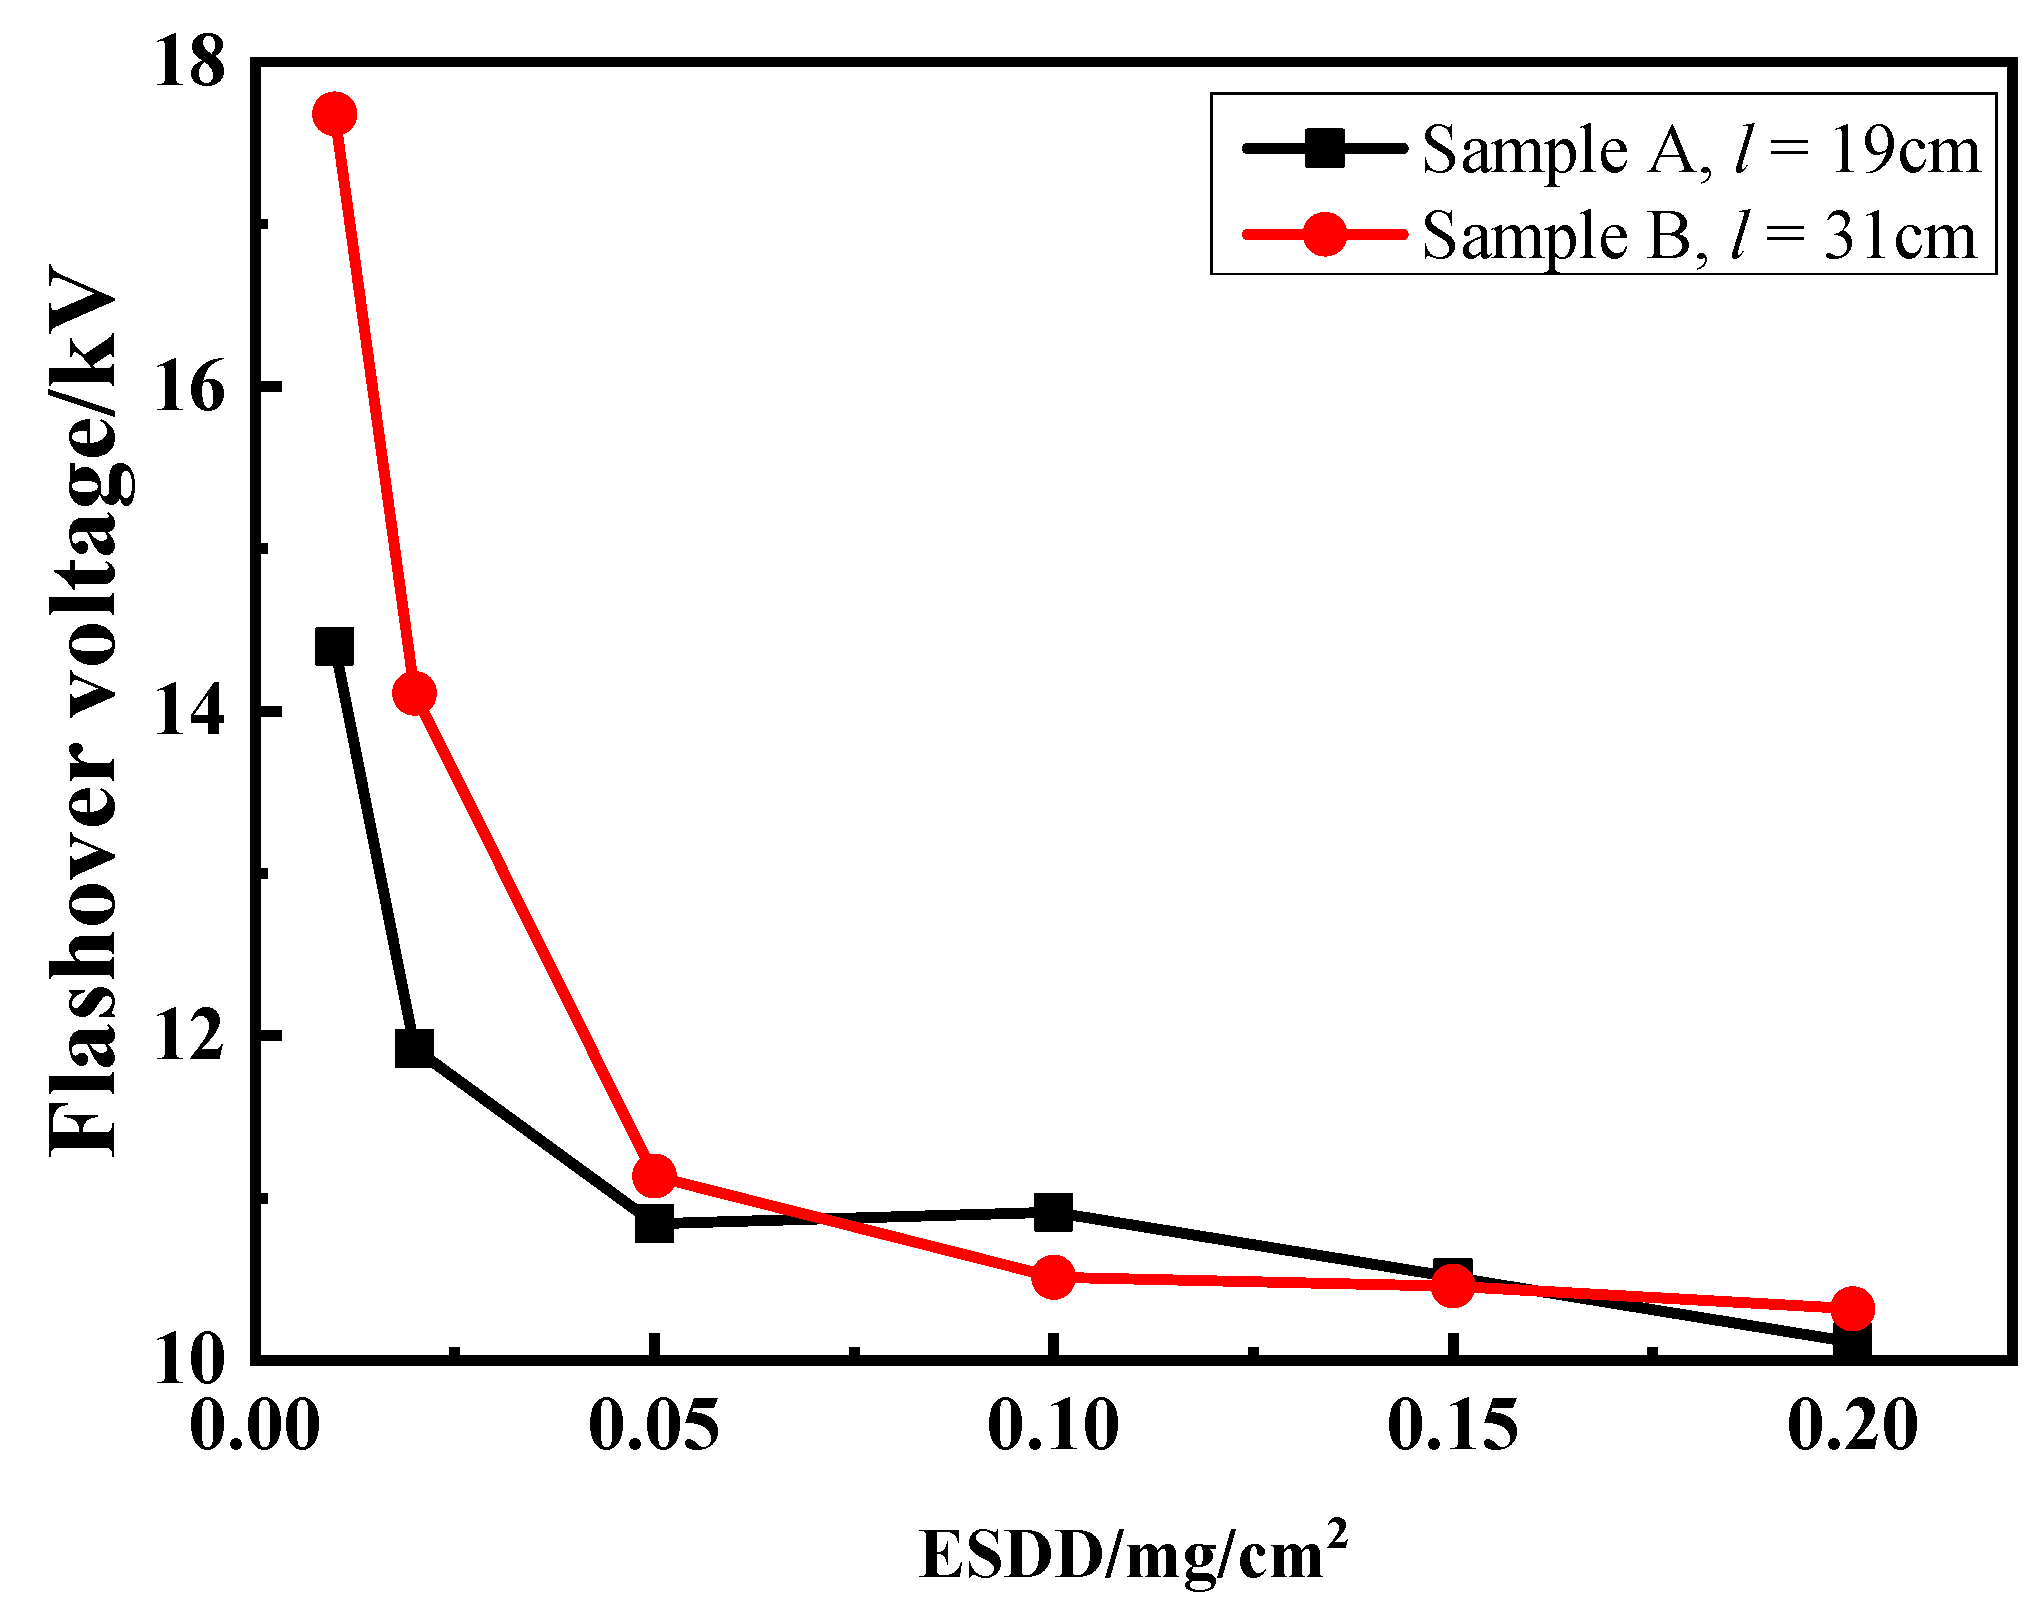
Leakage length is an important factor influencing the pollution flashover performance of line insulators. Therefore, the insulators were designed to have a complex shed structure to increase the leakage length for good pollution flashover performance. To investigate the effect of leakage length on the flashover performance of a bushing, experiments were carried out on samples A and B, which had same conductor diameters but different insulation-layer lengths. The leakage lengths for samples A and B are 19 cm and 31 cm, respectively.
For sliding discharge of an HV bushing, the onset voltage can be determined [28] as follows
where E0 is the corona onset strength, which is 21.2 kV/cm (r.m.s) for AC at standard air pressure, ω is the power frequency in Hz, ρ is the surface resistance in Ω/m, and C0 is the unit surface capacitance in F/cm2. According to the calculation results, the C0 values of samples A and B were 0.98 pF/cm2 and 0.93 pF/cm2, respectively, which showed an almost similar C0 value for both samples. The test sliding flashover voltages of samples A and B were 35.4 kV and 38.8 kV, which are also similar. Therefore, comparing the experimental and calculated (Equation (3)) values, it can be seen that leakage length has a minor influence on sliding discharge flashover.
The test results for pollution flashover are shown in Figure 6. They indicate that the bushing with a longer leakage length has a higher pollution flashover at a low ESDD (less than 0.05 mg/cm2), whereas at a high ESDD (higher than 0.05 mg/cm2), the flashover voltages of samples A and B tend to be the same. Therefore, under a high ESDD condition, it is difficult to improve the pollution flashover voltage by increasing the leakage length. The results also demonstrate that the flashover voltage of the bushing types tends to level off with the increase in ESSD.
3.5. Effect of the Vertical Electric Field Component Vertical to the Dielectric Surface
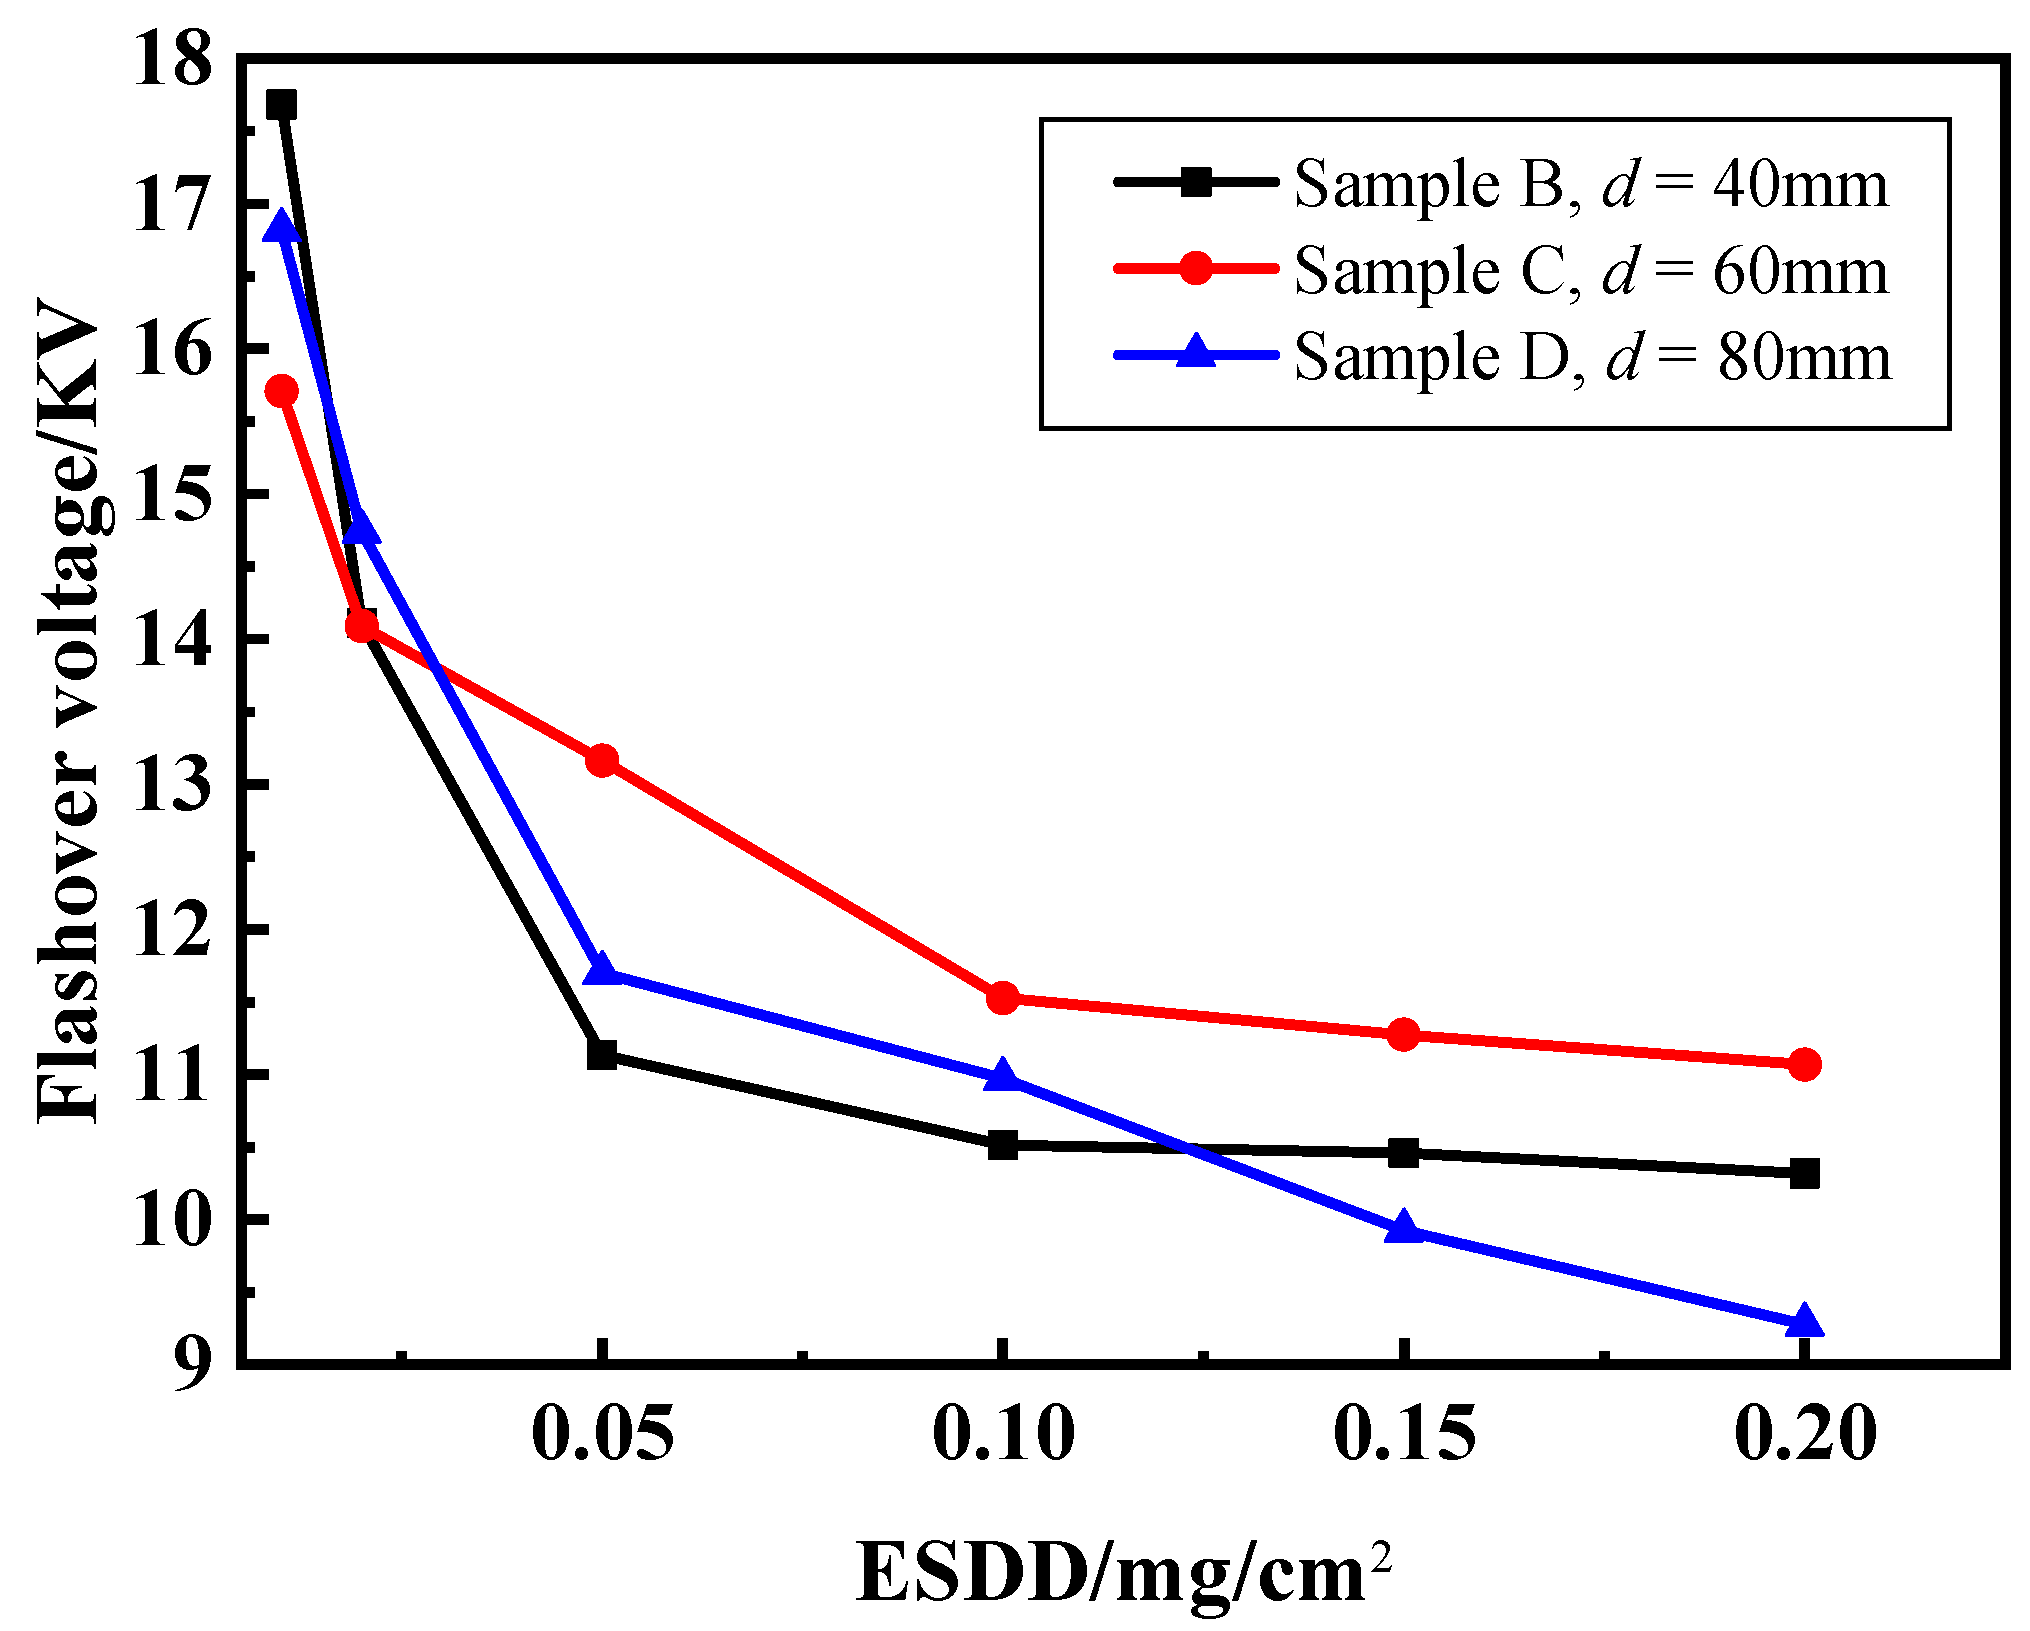
A strong electric field component vertical to the dielectric surface is a special feature of a bushing-type insulation structure, which is caused by a high voltage difference applied on a small distance (between the inner conductor and the flange). To investigate the effect of an electric field component vertical to the dielectric surface, experiments were carried out on samples A, B, C, and D. Due to the different profile parameters, the electric field components vertical to the dielectric surface are different for all four bushing samples.
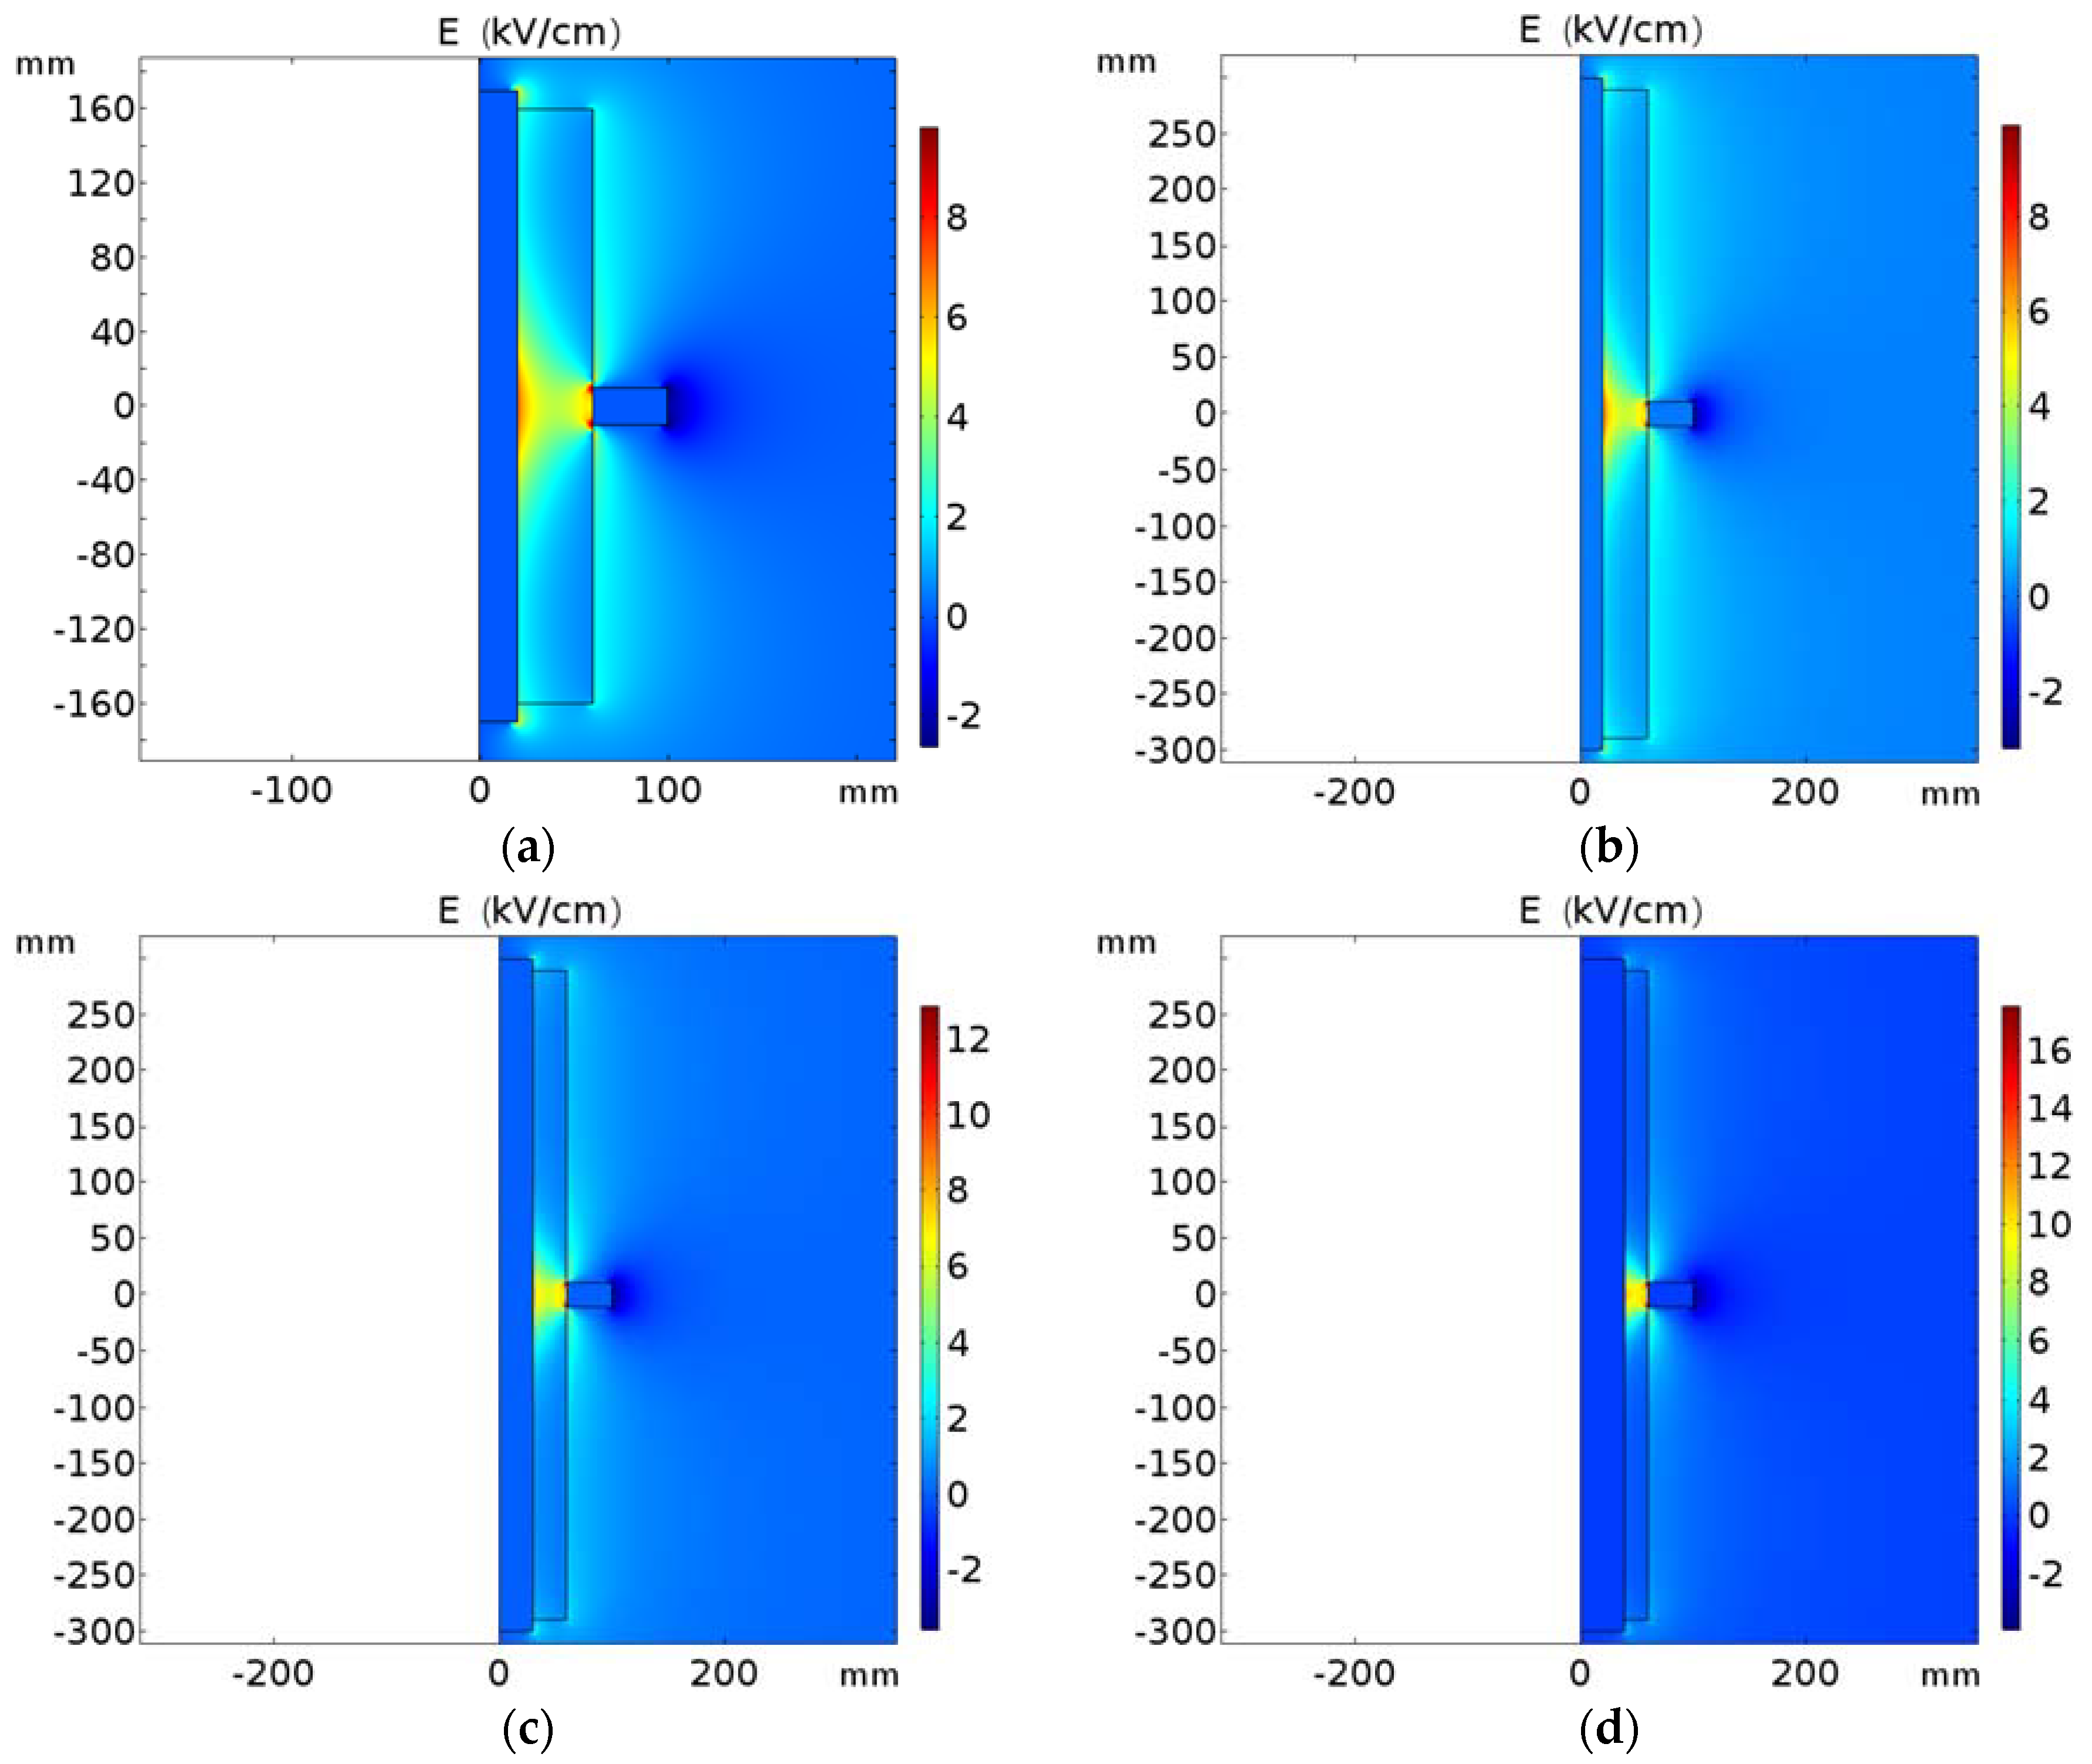
To calculate the electric field distribution, numerical simulations were performed by the finite element method. In the simulation, a voltage of 20 kV was applied to the high-voltage end of the bushing and the bushing surface was assumed to be dry. The relative permittivity of the nylon layer was 4. The calculated electric field distributions are shown in Figure 7 and the maximum components vertical to the dielectric surface Evmax are listed in Table 3. It can be seen that the electric field is concentrated at the flange and that its maximum value is located at the junction of the flange and the insulation layer, which is consistent with the visual observation by high-speed camera as shown in Figure 4. As nylon is a good insulation material, the maximum electric field component vertical to the dielectric surface is almost unchanged when the length of the insulation layer is increased from 320 mm (sample A) to 580 mm (sample B). The maximum electric field strength increases with the conductor diameter. Compared with sample B, which has a conductor diameter of 40 mm, the maximum electric field of sample D, having a conductor diameter of 80 mm, is 71.7% higher.
The test results for sliding flashover are shown in Table 4. As can be seen from Table 4, the sliding flashover is closely related to the electric field component vertical to the dielectric surface. Although the leakage length of sample B is 63.2% longer than that of sample A, its sliding flashover is only 9.6% higher than that of sample A due to the closeness of the maximum electric field components vertical to the dielectric surface. Sample D, having the greatest electric field component vertical to the dielectric surface, has the lowest sliding flashover.
When the polluted bushing was wetted, the electric field distribution was changed somewhat. However, considering the space distance between the conductor tube and the flange and that the insulation material remains unchanged, the influence of pollution on the maximum electric field components vertical to the dielectric surface at the flange is insignificant.
The test results for pollution flashover are displayed in Figure 8. In this figure, the pollution flashover voltages decrease with an increase of ESDD at all vertical electric field strengths. Compared with sample B, the maximum electric field component vertical to the dielectric surface of sample D is almost doubled. However, the pollution flashover of sample D is not always lower than that of sample B at all ESDD levels. When the ESDD is in the range of 0.05 mg/cm2–0.1 mg/cm2, the flashover voltage of sample D is even higher than that of sample B. Therefore, a stronger electric field component vertical to the dielectric surface does not guarantee a lower flashover voltage.
3.6. Effect of Uneven Rain Flashover
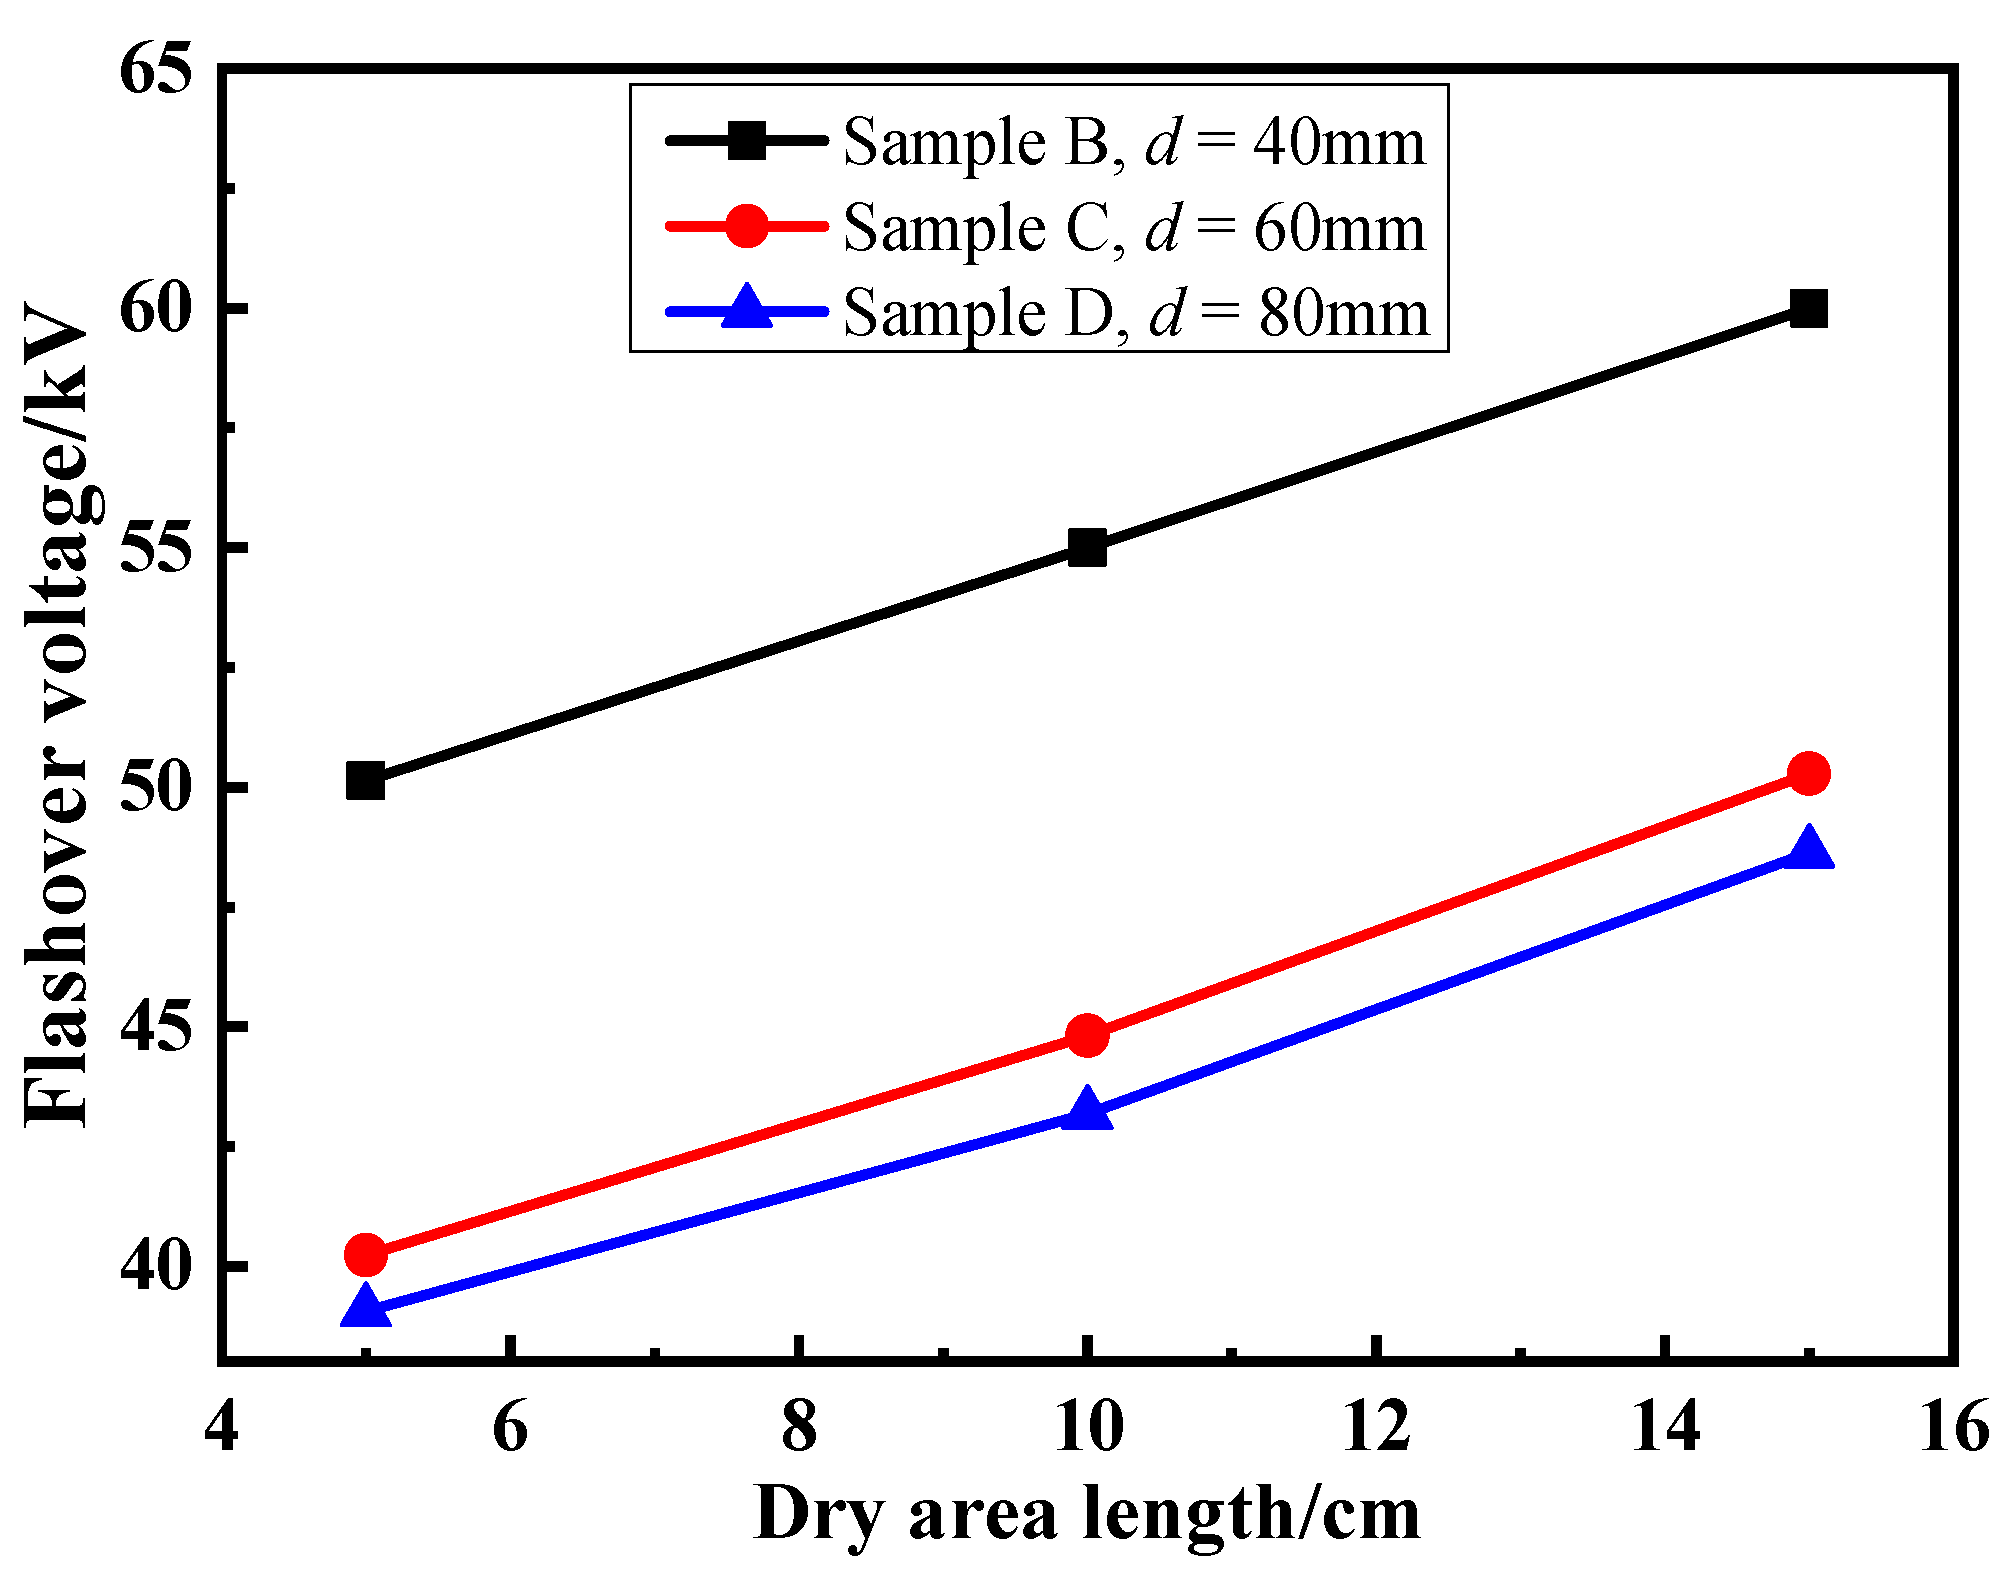
Uneven rain used to be considered the main reason for bushing flashover. Many researchers studied flashover voltage change with dry zone length and found the critical length [7,9,15]. In this study, experiments on uneven wetting flashover properties were carried out using simplified bushing samples with the dry zone starting from the flange. Tests were focused on flashover voltage variations with dry zone length under different vertical electric fields.
In Figure 9, test results show that the flashover increased linearly with dry zone length when the dry zone length ranged from 5 cm to 15 cm. The flashover voltage increased 20% to 25% when the dry zone length increased from 5 cm to 15 cm for all three samples. This can be explained by the fact that, under the same applied voltage, the shorter the dry zone length is, the higher the voltage drop applied on it is, making it easier to meet the critical voltage and electric field requirements for the occurrence of flashover.
4. Discussion
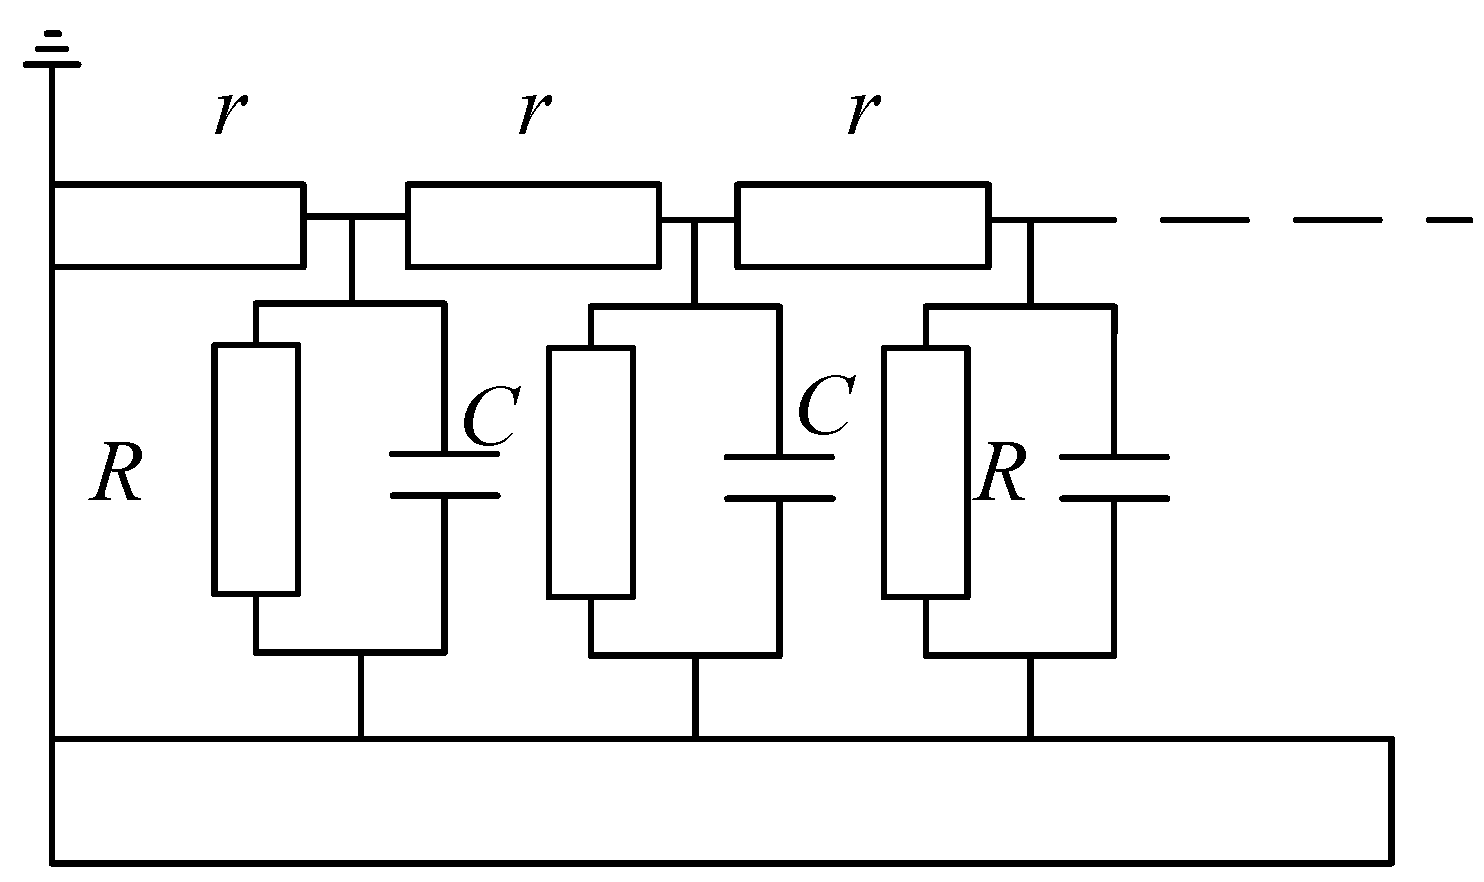
An HV bushing can be represented by an equivalent circuit, as shown in Figure 10, where r stands for the surface resistance, R stands for the volume resistor, and C stands for the capacitor between conductor and flange.
When the surface of the bushing sample is contaminated and wet, the surface resistance will decrease significantly and be determined by the layer condition. According to a previous study [29], the surface conductivity is proportional to the ESDD:
where k is a coefficient ranging from 200 to 1000.
Therefore, the surface resistance r can be calculated by
where f stands for the form factor and can be calculated as
Assuming k = 1000, ESDD = 0.1 mg/cm2, and substituting the form parameters, the surface resistance of all five samples can be calculated as listed in Table 5.
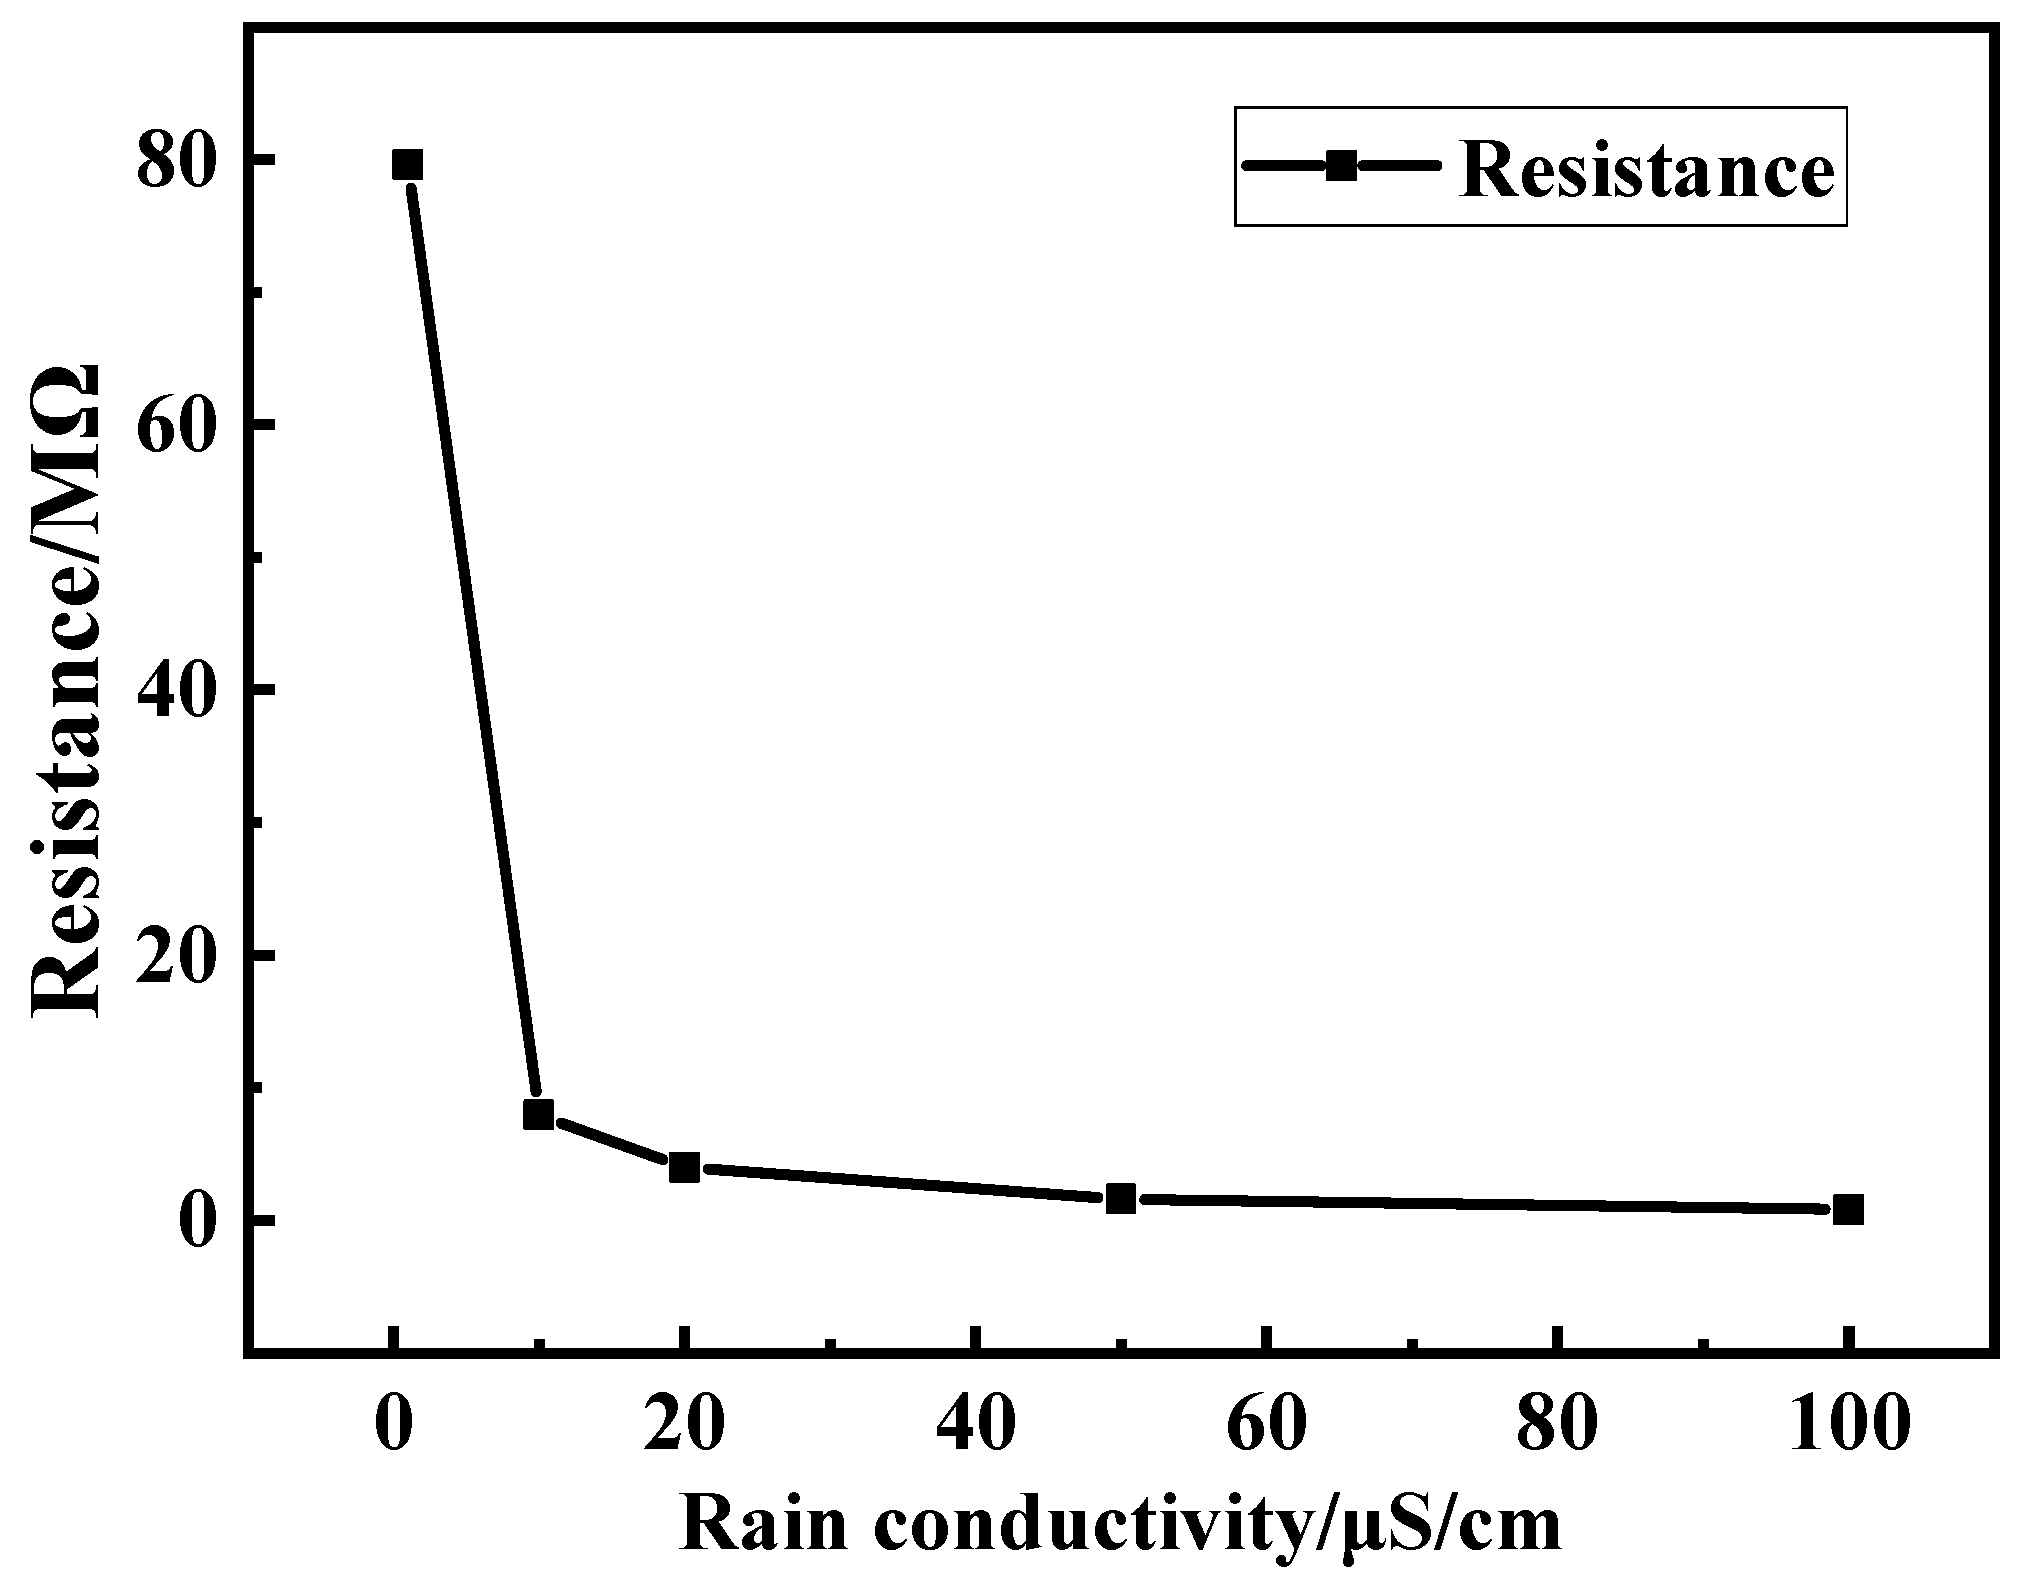
Taking sample B as an example, the surface resistance against the ESDD would appear as in Figure 11. It can be seen from this figure that the surface resistance decreased inversely proportionally to the increase in ESDD. When the ESDD exceeds 0.05 mg/cm2, the curve becomes flat, which shows that a further increase in ESDD does not result in a significant decrease of surface resistance. However, under a wet condition, the surface resistance can be calculated by
where σr stands for the volume conductivity of rain, which is normally 1–100 μS/cm, D stands for the diameter of the insulation cylinder, and h stands for the thickness of the water film, which is 0.01 cm at saturated wetting status.
The surface resistance of a rain-fouled surface layer is found in Table 6 and Figure 12. Although the relationship of resistance and rain conductivity is still inversely proportional, the “saturated period” of this curve started when the rain conductivity was 15 μS/cm.
In addition, there is a capacitance between the conductor and the flange. As the flange thickness is very small compared with that of the conductor tube, it cannot be regarded as a coaxial capacitor structure. Therefore, the capacitance cannot be calculated from any existing formula and can only be obtained by numerical simulation. The simulated results for capacitance are listed in Table 7.
As shown in Table 5, Table 6 and Table 7, the surface resistance and capacitive reactance are not comparable as for order of magnitude. Under the designed bushing model, we have:
These results indicated that under moderate pollution conditions, such as an ESDD of 0.1 mg/cm2, the effect of the capacitive current can be omitted. Under a rain condition, the capacitive current was about 1/10 of the surface current. Because pollution flashover is a current dominant process, the vertical direction current is too low to influence the flashover process. Under an uneven rain condition, the appearance of a dry zone would further increase the value of rw. Then, the capacitive current is increased to influence the flashover voltage of the surface charge. This theory can explain the experimental results that changing the diameter of the conductor does not affect the flashover voltage of bushing-type samples at different ESDD levels.
Authors should discuss the results and how they can be interpreted in perspective of previous studies and of the working hypotheses. The findings and their implications should be discussed in the broadest context possible. Future research directions may also be highlighted.
5. Conclusions
The flashover characteristics of bushing-type insulation structures was tested thoroughly with specifically designed samples. The following conclusions can be obtained:
- (1)
- Before flashover, the arc channel of sliding discharge was thinner than that of pollution discharge. However, at the moment of flashover, the arc channel of sliding flashover was even wider and brighter than that of pollution flashover.
- (2)
- In this study, sliding flashover only happened when the bushing surface was clean. The sliding flashover voltage was closely related to the electric field component vertical to the dielectric surface. Increasing the leakage length had an insignificant influence on improving the sliding flashover performance.
- (3)
- The pollution flashover of the bushing-type structure was lower than that of the post-type structure when the leakage length and form factor were the same. The pollution flashover voltage decreased as the ESDD was increased. When the ESDD exceeded 0.05 mg/cm2, the pollution flashover voltages of bushing structures A and B changed little.
- (4)
- The pollution flashover voltage of bushing-type structures was not obviously influenced by the leakage length under a high ESDD condition. The influence of vertical electric field strength on HV bushing flashover is a very complex matter. A stronger electric field component vertical to the dielectric surface does not necessarily facilitate the flashover process.
- (5)
- The ratio of surface resistance to inner capacitive reactance was found to be the crucial parameter influencing surface flashover properties of the bushing samples. Under pollution flashover condition, this ratio was negligible so that the flashover procedure was nearly immune to changes of vertical electric field. Under a rain flashover condition, however, this ratio was about 1/10 so that the flashover voltage decreased as the vertical electric field was increased.
The effect of a vertical electric field on the surface flashover characteristics of a bushing is a very complicated problem and a bushing model with sheds would warrant further investigation.
Author Contributions
M.Z. and L.W. (Liming Wang) conceived and designed the experiments; M.Z. and L.W. (Lu Wen) performed the experiments; F.Y. and M.F. analyzed the data; H.M. contributed analysis tools; M.Z. and F.Y. wrote the paper.
Funding
The project was supported by the National Key Research and Development Program of China (2017YFB0902702).
Conflicts of Interest
The authors declare no conflict of interest. The founding sponsors had no role in the design of the study; in the collection, analyses, or interpretation of data; in the writing of the manuscript, and in the decision to publish the results.
References
- Lampe, W.; Eriksson, K.A.; Peixoto, C.A.O. Operating Experience of HVDC Stations with Regard to Natural Pollution. CIGRE. 1984. no. 33.01. Available online: http://www.iitk.ac.in/npsc/Papers/NPSC2000/15.pdf (accessed on 16 June 2018).
- McDermid, W.M.; Ram, B.S.; Forrest, J.A.C. Nelson river converter station bushing flashovers—Corrective measures and investigation. In Proceedings of the HVDC System Operating Conference, Winnipeg, MB, Canada, 15–17 September 1987; pp. 38–48. [Google Scholar]
- Low, S.S. Operating and test experience with 500 kV DC wall bushings. In CIGRE International Colloquium on HVDC Power Transmission; CIGRE: Recife, Brazil, 1989. [Google Scholar]
- Crusius, R.L.; Nigri, A.I. 600 kV System external insulation performance—Four years in operation. In CIGRE International Colloquium on HVDC Power Transmission; CIGRE: Recife, Brazil, 1989. [Google Scholar]
- Lampe, W. Pollution and rain flashovers on HVDC wall bushings. In Proceedings of the Second International Conference Properties and Application Dielectric Materials, Beijing, China, 12–16 September 1988. [Google Scholar]
- Ozaki, Y.; Seta, T.; Fujimura, T.; Naito, K. Flashover voltage characteristics of contaminated bushing shells for UHV transmission systems. IEEE Trans. Power Appar. Syst. 1981, 100, 3733–3743. [Google Scholar] [CrossRef]
- Rizk, F.A.M.; Kamel, S.I. Modelling of HVDC wall bushing flashover in nonuniform rain. IEEE Trans. Power Deliv. 1991, 6, 1650–1662. [Google Scholar] [CrossRef]
- Tang, L.; Raghuveer, M.R. Numerical prediction of HVDC wall bushing flashover caused by uneven wetting. In Proceedings of the Conference Electrical Insulattion and Dielectric Phenomena, Millbrae, CA, USA, 20–23 October 1996. [Google Scholar]
- Tang, L.; Raghuveer, M.R. Simulation of HVDC wall bushing performance under unevenly wetted conditions. In Proceedings of the IEEE WESCANEX 97 Communications, Power and Computing, Winnipeg, MB, Canada, 22–23 May 1997. [Google Scholar]
- Tang, L.; Raghuveer, M.R. Modelling of HVDC wall bushing flashover due to uneven wetting. IEEE Trans. Power Deliv. 1999, 14, 194–199. [Google Scholar] [CrossRef] [Green Version]
- Schneider, H.M.; Lux, A.E. Mechanism of HVDC wall bushing flashover in nonuniform rain. IEEE Trans. Power Deliv. 1991, 6, 448–455. [Google Scholar] [CrossRef]
- Mcdermid, W.; Black, T. External flashovers, related insulation failures and corrective measures in converter stations of Nelson River bipole 1 and bipole 2. IEEE Trans. Dielectr. Electr. Insul. 2014, 21, 2406–2414. [Google Scholar] [CrossRef]
- Zhang, S.; Peng, Z.; Liu, P. Inner insulation structure optimization of UHV RIP oil-SF6 bushing using electro-thermal simulation and advanced equal margin design method. IEEE Trans. Dielectr. Electr. Insul. 2014, 21, 1768–1777. [Google Scholar] [CrossRef]
- Monga, S.; Gorur, R.S.; Hansen, P.; Massey, W. Design optimization of high voltage bushing using electric field computations. IEEE Trans. Dielectr. Electr. Insul. 2006, 13, 1217–1224. [Google Scholar] [CrossRef]
- Lambeth, P.J. Laboratory tests to evaluate HVDC wall bushing performance in wet weather. IEEE Trans. Power Deliv. 1990, 5, 1782–1793. [Google Scholar] [CrossRef]
- Naito, K.; Matsuoka, R.; Ito, S.; Morikawa, S. An investigation of the horizontally mounted insulators for HVDC stations. IEEE Trans. Power Deliv. 1989, 4, 653–666. [Google Scholar] [CrossRef]
- Fan, J.; Zheng, J.; Wang, L. Flashover characteristic along surface under lightning impulse voltage. Power Syst. Technol. 2003, 27, 13–16. [Google Scholar]
- Liu, Q.; Yan, J.; Hao, L.; Zhang, B.; Liu, S. Charge transport and accumulation around a spancer insulator for application in HVDC wall bushing. IEEE Trans. Dielectr. Electr. Insul. 2018, 25, 281–293. [Google Scholar] [CrossRef]
- Qi, B.; Dai, Q.; Li, C.; Zeng, Z.; Fu, M.; Zhuo, R. The Mechanism and Diagnosis of Insulation Deterioration Caused by Moisture Ingress into Oil-Impregnated Paper Bushing. Energies 2018, 11, 1496. [Google Scholar] [CrossRef]
- Wang, Q.; Liao, J.; Tian, H.; Liu, P.; Peng, Z. Regularity analysis of the temperature distribution of epoxy impregnated paper converter transformer bushings. IEEE Trans. Dielectr. Electr. Insul. 2017, 24, 3254–3264. [Google Scholar] [CrossRef]
- Li, C.; Xia, Q.; Zhao, Z.; Yao, C.; Mi, Y.; Zhao, X.; Wang, J. Impact analysis of the capacitive coupling sensor on bushing external insulation. IET Gener. Trans. Distrib. 2016, 10, 3663–3670. [Google Scholar] [CrossRef]
- Wang, Y.; Xiao, K.; Chen, B.; Li, Y. Study of the Impact of Initial Moisture Content in Oil Impregnated Insulation Paper on Thermal Aging Rate of Condenser Bushing. Energies 2015, 8, 14298–14310. [Google Scholar] [CrossRef] [Green Version]
- Yang, F.; Du, L.; Yang, L.; Wei, C.; Wang, Y.; Ran, L.; He, P. A Parameterization Approach for the Dielectric Response Model of Oil Paper Insulation Using FDS Measurements. Energies 2018, 11, 622. [Google Scholar] [CrossRef]
- IEC 60507. Artificial Pollution Tests on High-Voltage Insulators to Be Used on A.C. Systems; IEC: Geneva, Switzerland, 1991. [Google Scholar]
- Li, J.; Guan, Z.; Wang, L.; Yang, H.; Zhou, J. An experimental study of AC arc propagation over a contaminated surface. IEEE Trans. Dielectr. Electr. Insul. 2012, 19, 1360–1368. [Google Scholar] [CrossRef]
- Yin, F.; Jiang, X.; Farzaneh, M.; Hu, J. Electrical Performance of 330-kV Composite Insulators with Different Shed Configurations under Icing Conditions. IEEE Trans. Dielectr. Electr. Insul. 2015, 22, 3395–3404. [Google Scholar] [CrossRef]
- Fracz, P. Measurement of optical signals emitted by surface discharges on bushing and post insulator. IEEE Trans. Dielectr. Electr. Insul. 2013, 20, 1909–1914. [Google Scholar] [CrossRef]
- Liang, X.; Chen, C.; Zhou, Y. High Voltage Engineering; Tsinghua University Press: Beijing, China, 2003; p. 73. [Google Scholar]
- Guan, Z.; Guo, C.; Wang, G. Measurement of contamination distribution on the hydrophobic surface of insulators by a partial surface conductivity method. High Volt. Eng. 2014, 40, 957–964. [Google Scholar]
Figure 1.
Schematic diagram of the test circuit. T1, Regulator; T2, Transformer; R1, Protective resistor; D, Voltage divider; R2, Non-inductive resistor.
Figure 1.
Schematic diagram of the test circuit. T1, Regulator; T2, Transformer; R1, Protective resistor; D, Voltage divider; R2, Non-inductive resistor.

Figure 2.
Orthographic view and central sectional map of samples with (a) bushing structure, and (b) post insulator structure.
Figure 2.
Orthographic view and central sectional map of samples with (a) bushing structure, and (b) post insulator structure.

Figure 3.
Waveforms of an applied voltage and the induced leakage current 3 s prior to flashover.

Figure 4.
Arc propagation on sample A (a) Sliding flashover with a time interval of 660 μs (b) Pollution flashover with a time interval of 330 μs.
Figure 4.
Arc propagation on sample A (a) Sliding flashover with a time interval of 660 μs (b) Pollution flashover with a time interval of 330 μs.

Figure 5.
Flashover characteristics of the bushing and the post insulator under different equivalent salt deposit densities (ESDDs).
Figure 5.
Flashover characteristics of the bushing and the post insulator under different equivalent salt deposit densities (ESDDs).

Figure 6.
Flashover voltage results of samples with different leakage lengths.

Figure 7.
Simulated vertical electric field component vertical to the dielectric surface of all the four bushing samples. (a): sample A; (b): sample B; (c): sample C; (d): sample D.
Figure 7.
Simulated vertical electric field component vertical to the dielectric surface of all the four bushing samples. (a): sample A; (b): sample B; (c): sample C; (d): sample D.

Figure 8.
Flashover voltage results of samples with different vertical electric fields.

Figure 9.
The relationship between flashover voltage and dry zone length of samples with different leakage lengths.
Figure 9.
The relationship between flashover voltage and dry zone length of samples with different leakage lengths.

Figure 10.
The equivalent circuit of a bushing.

Figure 11.
The relationship between ESDD and surface resistance.

Figure 12.
The relationship between ESDD and rain conductivity for sample B.


Table 1.
Profile parameters of tested samples.
| Parameters | A | B | C | D | E |
|---|---|---|---|---|---|
| Diameter of conductor Dco (mm) | 40 | 40 | 60 | 80 | 40 |
| Length of insulation layer Lin (mm) | 320 | 580 | 580 | 580 | 160 |
| Length of conductor Lco (mm) | 10 | 10 | 10 | 10 | 10 |
| Thickness of flange Tfl (mm) | 20 | 20 | 20 | 20 | 0 |
| Diameter of insulator layer Din (mm) | 120 | 120 | 120 | 120 | 120 |
Table 2.
The values of a, b, and R2 for samples A and E.
| Bushing Type | a | b | R2 |
|---|---|---|---|
| A | 8.17 | 0.11 | 0.90 |
| E | 8.79 | 0.11 | 0.95 |
Table 3.
Calculated maximum electric field component vertical to the dielectric surface of all four bushing samples.
Table 3.
Calculated maximum electric field component vertical to the dielectric surface of all four bushing samples.
| Type | Evmax (kV/cm) |
|---|---|
| A | 9.8 |
| B | 9.9 |
| C | 12.9 |
| D | 17.0 |
Table 4.
Sliding flashover of all four bushing samples.
| Type | V (kV) |
|---|---|
| A | 35.4 |
| B | 38.8 |
| C | 36.4 |
| D | 33.2 |
Table 5.
Calculated results of surface resistance.
| Type | A | B | C | D | E |
|---|---|---|---|---|---|
| Surface resistance (MΩ) | 0.0079 | 0.0159 | 0.0159 | 0.0159 | 0.0079 |
Table 6.
Surface resistance of sample under different rain conductivities.
| Rain Conductivity (μS/cm) | 1 | 10 | 20 | 50 | 100 |
|---|---|---|---|---|---|
| Surface resistance (MΩ) | 79.62 | 7.962 | 3.981 | 1.592 | 0.7962 |
Table 7.
Capacitance and capacitive reactance of bushing samples.
| Bushing Type | A | B | C | D |
|---|---|---|---|---|
| Capacitance (pF) | 8 | 16 | 26 | 33 |
| Capacitive reactance (MΩ) | 400 | 199.04 | 122.49 | 96.51 |
© 2018 by the authors. Licensee MDPI, Basel, Switzerland. This article is an open access article distributed under the terms and conditions of the Creative Commons Attribution (CC BY) license (http://creativecommons.org/licenses/by/4.0/).
Share and Cite
MDPI and ACS Style
Zhu, M.; Wang, L.; Yin, F.; Farzaneh, M.; Mei, H.; Wen, L. The Effect of a Vertical Electric Field on the Surface Flashover Characteristics of a Bushing Model. Energies 2018, 11, 1607. https://doi.org/10.3390/en11061607
AMA Style
Zhu M, Wang L, Yin F, Farzaneh M, Mei H, Wen L. The Effect of a Vertical Electric Field on the Surface Flashover Characteristics of a Bushing Model. Energies. 2018; 11(6):1607. https://doi.org/10.3390/en11061607
Chicago/Turabian StyleZhu, Mingxi, Liming Wang, Fanghui Yin, Masoud Farzaneh, Hongwei Mei, and Lu Wen. 2018. "The Effect of a Vertical Electric Field on the Surface Flashover Characteristics of a Bushing Model" Energies 11, no. 6: 1607. https://doi.org/10.3390/en11061607
Note that from the first issue of 2016, this journal uses article numbers instead of page numbers. See further details here.