Residential Electricity Consumption and Economic Growth in Algeria


1
Laboratoire d’Économie et Développement, Faculté des Sciences Economiques, Commerciales et des Sciences de Gestion, Université de Bejaia, Bejaia 06000, Algeria
2
Department of Economic Analysis and Political Economy, Faculty of Economics and Business Sciences, University of Seville, Ramón y Cajal 1, 41018 Seville, Spain
3
Vicerrectoría de Investigación y Postgrado, Universidad Autónoma de Chile, Pedro de Valdivia 425, Santiago, Chile
*
Author to whom correspondence should be addressed.
Energies 2018, 11(7), 1656; https://doi.org/10.3390/en11071656
Submission received: 11 April 2018
/
Revised: 8 June 2018
/
Accepted: 21 June 2018
/
Published: 26 June 2018
(This article belongs to the Special Issue Energy Economy, Sustainable Energy and Energy Saving)
Abstract
:Within the framework of the COP21 (Conference of the Parties) agreement, Algeria submitted its Intended Nationally Determined Contribution pledging to reduce carbon emissions by at least 7% by 2030. However, it will be a difficult task to reach this target as total final energy consumption has increased 32% from 2010 to 2014, with the major energy increases being related to electricity use in the residential sector. In this context, the relationship between residential electricity consumption and income is analyzed for Algeria in the period 1970–2013, by estimating a residential electricity consumption per capita demand function which depends on GDP per capita, its squared and cubed terms, the electricity prices, and the goods and services imports. An extended Autoregressive Distributed Lag model (ARDL) was adopted to consider the different growth patterns registered in the evolution of GDP. The estimate results show that the relationships between electricity use and GDP (in per capita terms) present an inverted N-shape, with the second turning point having been reached. Therefore, promoting growth in Algeria could be convenient to reduce the electricity consumption, as a higher income level may allow the use of more efficient appliances. Additionally, renewable energies may be adequate to increase the electricity production in order to cover the increasing residential demand.
1. Introduction
Algeria has shown great interest in signing the 2015 Paris agreement [1]. On the one hand, Algeria is the third largest CO2 emitter among African countries [2] and, in 2014, total emissions amounted to 147 MT CO2. On the other hand, Algeria is especially exposed to climate change effects as the annual rainfall has been reduced in recent years by up to 30%, and its capacity to capture carbon is small due to the wide extent of the desert [3]. Therefore, Algeria was one of the first developing countries to submit its Intended Nationally Determined Contribution (INDC), in which it is committed to reducing CO2 emissions by at least 7%, by 2030.
Nonetheless, Algeria has a difficult mission ahead to comply with this target. Its total final energy consumption has increased 32% from 2010 to 2014, its major energy increases being related to electricity use in the residential sector [4]. Thus, residential energy consumption has increased 43% and the residential electricity consumption increased 50% over this period. As stated in Bouznit and Pablo-Romero [1], the main energy increases have been especially related to changes in the way of life. Furthermore, electricity consumption is estimated to increase more than double by 2030 [5]. These energy increases have been accompanied by CO2 emissions increases, due to the positive evolution of the consumption of non-renewable energy and the insignificant effect of renewable energy on environment improvement [6]. In this regard, the Algerian CO2 Emissions Intensity−Power sub-index from the Environmental Performance Index has not improved from its baseline score (referred to ten years previous to current) [7]. Thus, if the Algerian authorities want to fulfill their INDC targets while improving the wellbeing of its citizens, some energy policies ought to be undertaken to cushion the probable adverse effects of the increasing electricity demand. In that sense, energy policies may be more globally-effective in the residential sector than in others [8], as residential energy consumption is difficult to displace offshore, contrary to what is happening in other sectors [9,10]. Therefore, the analysis of the evolution of residential electricity use becomes especially interesting, and even more so in countries such as Algeria, in which substantial growth is expected.
Since the seminal study by Kraft and Kraft [11], the energy-growth nexus have been widely analyzed. However, the empirical evidence is mixed in terms of the direction of causality between variables [12]. Most studies are related to electricity energy and developed countries [13], those referred specifically to Algeria being scarce. To our knowledge, only two studies specifically refer to Algeria. The study by Souhila and Kourbali [14] examined the relationships between energy and economic growth in the 1965–2008 period, finding unidirectional causality running from GDP to energy consumption. Likewise, Bélaïd and Abderrahmani [15] examined the causal relationship between electricity consumption, oil price and economic growth for Algeria over the period of 1971–2010. The authors found bidirectional causal relationships between electricity use and economic growth. In addition to these studies, the causal relationships between energy and economic growth in Algeria have been also examined in other papers referred to several countries. Among these, it may be cited those by Wolde-Rufael [16,17] related to African countries, those by Ozturk and Acaravci [18] and Omri [19] referred to MENA countries, those by Squalli [20] referred to OPEC members and those by Ozturk et al. [18] referred to developing countries. In general, these papers find that causality runs from economic growth to energy or electricity consumption in Algeria, although the study by Ozturk amd Acaravci [18] does not find cointegration among the variables and that by Omri [19] finds bidirectional causality.
Regarding the analysis of the relationships between the residential energy consumption and income growth, most previous papers focus on the microeconomic behavior of households [21,22,23]. These studies find that growth in residential energy demand depends on the household’s income level. From a macroeconomic perspective, most of the studies that analyze the relationship between residential energy and income, estimate the short-run and the long-run elasticity of residential demand for electricity. Among them, Silk and Joutz [24] refer to the USA, Holtedahl and Joutz [25] to Taiwan, Hondroyiannis [26] to Greece, Filippini and Pachuari [27] to India, Narayan and Smyth [28] to Australia, Atakhanova and Howie [29] to Kazakhstan, Halicioglu [30] to Turkey, Nasir et al. [31] to Pakistan, Athukorala and Wilson [32] to Sri Lanka, Blázquez et al. [33] and Romero-Jordán et al. [34] to Spain, Atalla and Hunt [35] to the Gulf Cooperation Council countries, and Schulte and Heindl [36] to Germany. Very little attention has been given to regions such as Africa and Latin America.
Moreover, these previous studies do not consider how the relationships between residential electricity use and income may vary as income grows. In this regards, some previous studies have examined the non-linear relationships between economic growth and energy consumption, borrowing the idea of the EKC by testing the so called energy-EKC hypothesis [37]. This last hypothesis states that energy consumption increases with economic growth up to a certain income level, after which it declines. In line with the EKC hypothesis, the inverted-U path for energy use may been explained in terms of structural changes in the composition of economic output and energy efficiency gains [38,39]. The studies by Suri and Chapman [40], Richmond and Kaufmann [38,41], Nguyen-Van [39], Yoo and Lee [42], and Sbia et al. [43] find evidence for the existence of an inverted-U curve relationships between variables. Nevertheless, other studies fail to support the inverted-U curve hypothesis. Among them, it may be cited the study by Luzzati and Orsini [44], Zilio and Recalde [45], and Pablo-Romero and De Jesús [46]. Most of these studies refers to international panel data, none of them being focused on Algeria.
Focusing on the residential energy use, Yin et al. [47] include income per capita and its squared value as explanatory variables when analyzing the residential electricity consumption elasticity values in China. Likewise, Pablo-Romero et al. [48] also include income per capita squared and cubed variables when analyzing whether joining the Covenant of Mayors is reducing municipalities’ residential electricity consumption in Andalusia by testing an energy-environmental Kuznets curve. In the same way, income per capita in squared and cubed terms are also considered by Pablo-Romero and Sánchez-Braza [8] when estimating the energy demand, considering residential energy consumption and income for the EU-28 countries.
Following these last papers, the relationship between residential electricity use and income is analyzed for Algeria in the period 1970–2013, by estimating a residential electricity consumption per capita demand function which depends on GDP per capita, its squared and cubed terms, the electricity prices, and the goods and services imports.
This study enlarges the previous literature by focusing the analysis on electricity consumption of the residential sector. Additionally, to our knowledge, this is the first work to analyze the non-linearity relationships for residential electricity consumption and income for an African country, Algeria. Thus, knowledge of these relationships is important to better implement energy and environmental policies, especially in countries similar to Algeria, which are developing and increasing their electricity demand. The methodology applied is the extended autoregressive distributed lag model (ARDL) with break points. Considering break points appears to be convenient, as the Algerian GDP growth trend since 1970 to 2010 shows different patterns, which may be related to certain political decisions, mainly developed in the 1980s [15].
The remainder of this paper is organized as follows: in Section 2 the methodology is explained. In Section 3 a descriptive analysis is made and the statistical information sources used are specified. In Section 4 the results are presented. In Section 5 the results are discussed. Finally, the main conclusions and policy implications are given in Section 6.
2. Methodology
According to the previous studies, the residential electricity use, measured as Kwh per capita, is considered to be a function of the GDP per capita (constant 2010 US$), the real electricity prices for Kwh and the imports of goods and services as a share of GDP [49,50,51]. Additionally, in this paper, the squared and cubed values of GDP per capita have also been considered as explanatory variables of the electricity consumption, as in Yin et al. [47] and Pablo-Romero et al. [48]. Introducing these variables gives more flexibility to the demand function, allowing the study of how the electricity consumption varies as the income variable grows. In that regard, the electricity consumption elasticity with respect to GDP, may not be constant through time, varying with GDP per capita. Thus, if the estimated coefficient for GDP per capita is positive, and those related to the GDP per capita squared and the GDP per capita cubed, are both negatives, from which an inverted N-shape is obtained. The second threshold level is reached when the electricity elasticity, with respect to income, becomes zero on a decreasing elasticity trend [10]. Nevertheless, if the estimated coefficients related to GDP variables have other signs, alternative types of relationships will be defined between electricity consumption and GDP [52].
The ARDL cointegration testing approach by Pesaran et al. [53], and extended to introduce break points, has been used to analyze the long-run and short-run relationships between the residential electricity consumption and the defined explanatory variables, through the 1970–2013 period. According to Pesaran et al. [53], this model can be used even if variables are not integrated to the same order, but being I(1), I(0) or fractionally integrated. It is worth noting that the ARDL cointegration testing approach by Pesaran et al. [53] holds no feedbacks running from dependent variable to independent variable at the levels. Nevertheless, McNown et al. [54] have developed the ARDL bounds test with bootstrap techniques which can solve the endogeneity problems. Therefore, if there are endogeneity problems, it is convenient to use the ARDL bounds test with bootstrap techniques. In this paper, no endogeneity problems are detected (see Section 4.5). Therefore the ARDL cointegration testing approach by Pesaran et al. [53] has been used.
The breakpoint unit root test has been used to test a possible presence of structural breaks in the studied variables, as Perron [55] considered that most macroeconomic series present transitory fluctuations. Therefore, if the unit root test does not take into account the structural break point, selected exogenously, the decision toward exists against rejecting will be biased. Following Perron [55] and Zivot and Andrews [56], there are three types of break point: those related to changes in the level of the time series (change in the intercept), those related to the change in the rate of growth (change in the trend) and the result of both (change in intercept and trend). In order to examine the stationarity of each variable, the two-break LM unit root test by Lee-Strazicich is used [57]. The null hypothesis implies that there is a unit root, while the alternative hypothesis implies the series is breakpoint stationary. The breaks are determined endogenously. The Crash or A model, that captures a change in the level of the series, has been adopted in this study.
According to previous literature (see for example, Narayan and Smith [58], Belloumi [59], Charfeddine et al. [60], among others), the Pesaran et al. [53] model may be implemented in three steps by sequentially estimating three functions. The first function is defined in order to estimate the conditional error correction of the ARDL model. The ordinary least squares method (OLS) is used. Equation (1) may be expressed as follows:
where, log is the natural logarithm, D indicates first difference, Elec is the residential electricity consumption in per capita terms, GDPC is the Gross Domestic Product per capita (at constant 2010 US$), P is the real household electricity price, imp is the Imports of goods and services, are the dummy variables that capture the regime changes in the model, c is a constant, γ is a temporal dummy in years for the 1970–2013 period and εt is the error term. In addition, the lag is calculated by using the VAR optimal model, minimizing the AIC, SIC and HIC information criteria.
The introduction of the GDPC variable and its squared and cubed terms in Equation (1) may generate multicollinearity problems among the variables [61], which may be analyzed by using the values of the variance inflation factors (VIFs). Nevertheless, according to Pablo-Romero and Sánchez-Braza [62], these multicollinearity problems may be mitigated by converting each explanatory variable to deviations from the geometric mean of the sample. These new variables are denoted respectively as elec, y, y2, y3, p, and imp instead of LogElec, LogGDPC, (LogGDPC)2, (LogGDPC)3, LogP and LogImp, respectively. Thus, the Equation (1) may be rewritten as follow:
Once the Equation (2) has been estimated, the bounds testing approach to cointegration should be implemented to test the presence of cointegration between the studied variables. To this end, the Fisher-test (F-stat) for the lagged level variables joint significance is used. The null hypothesis to be tested is H0: α1 = α2 = α3 = α4 = α5 = α6 = 0, indicating no cointegration relationship between the studied variables. This hypothesis is rejected when the calculated F-test value exceeds the upper critical bounds value [53].
If the null hypothesis is rejected, then, in a second step, the conditional ARDL (q1, q2, q3, q4, q5, q6, q7) long-run model capturing the long-run dynamic should be estimated. The function form may be written as follow [59]:
This equation is estimated by OLS, and the AIC and SIC information criteria is used to determine the lags of the ARDL (q1, q2, q3, q4, q5, q6) model.
In addition, OLS is used to estimate the error correction model for the short-run, and the AIC and SIC information criteria are used to determinate the order of the ARDL (p1, p2, p3, p4, p5, p6). In addition, its stability is checked on the basis of the cumulative sum (CUSUM) test and cumulative sum of squares (CUSUMSQ) test. According to Narayan and Smyth [58], and Belloumi [59], this model may be written as:
Finally, the vector error-correction based Granger Causality analysis is used to study the short-run and long-run Granger causality between variables. If evidence for cointegration is found, the specification of the Granger causality test may be expressed, according to Engle and Granger [63], as follows:
where ECTt−1 is one-period lagged error correction term and τ indicates the adjustment speed to reach the equilibrium. The Wald statistics of the lagged explanatory variables coefficients inform about the short-run causal effects, while the Wald statistic of τ informs about the long-run causal effect.
3. Data and Descriptive Analysis
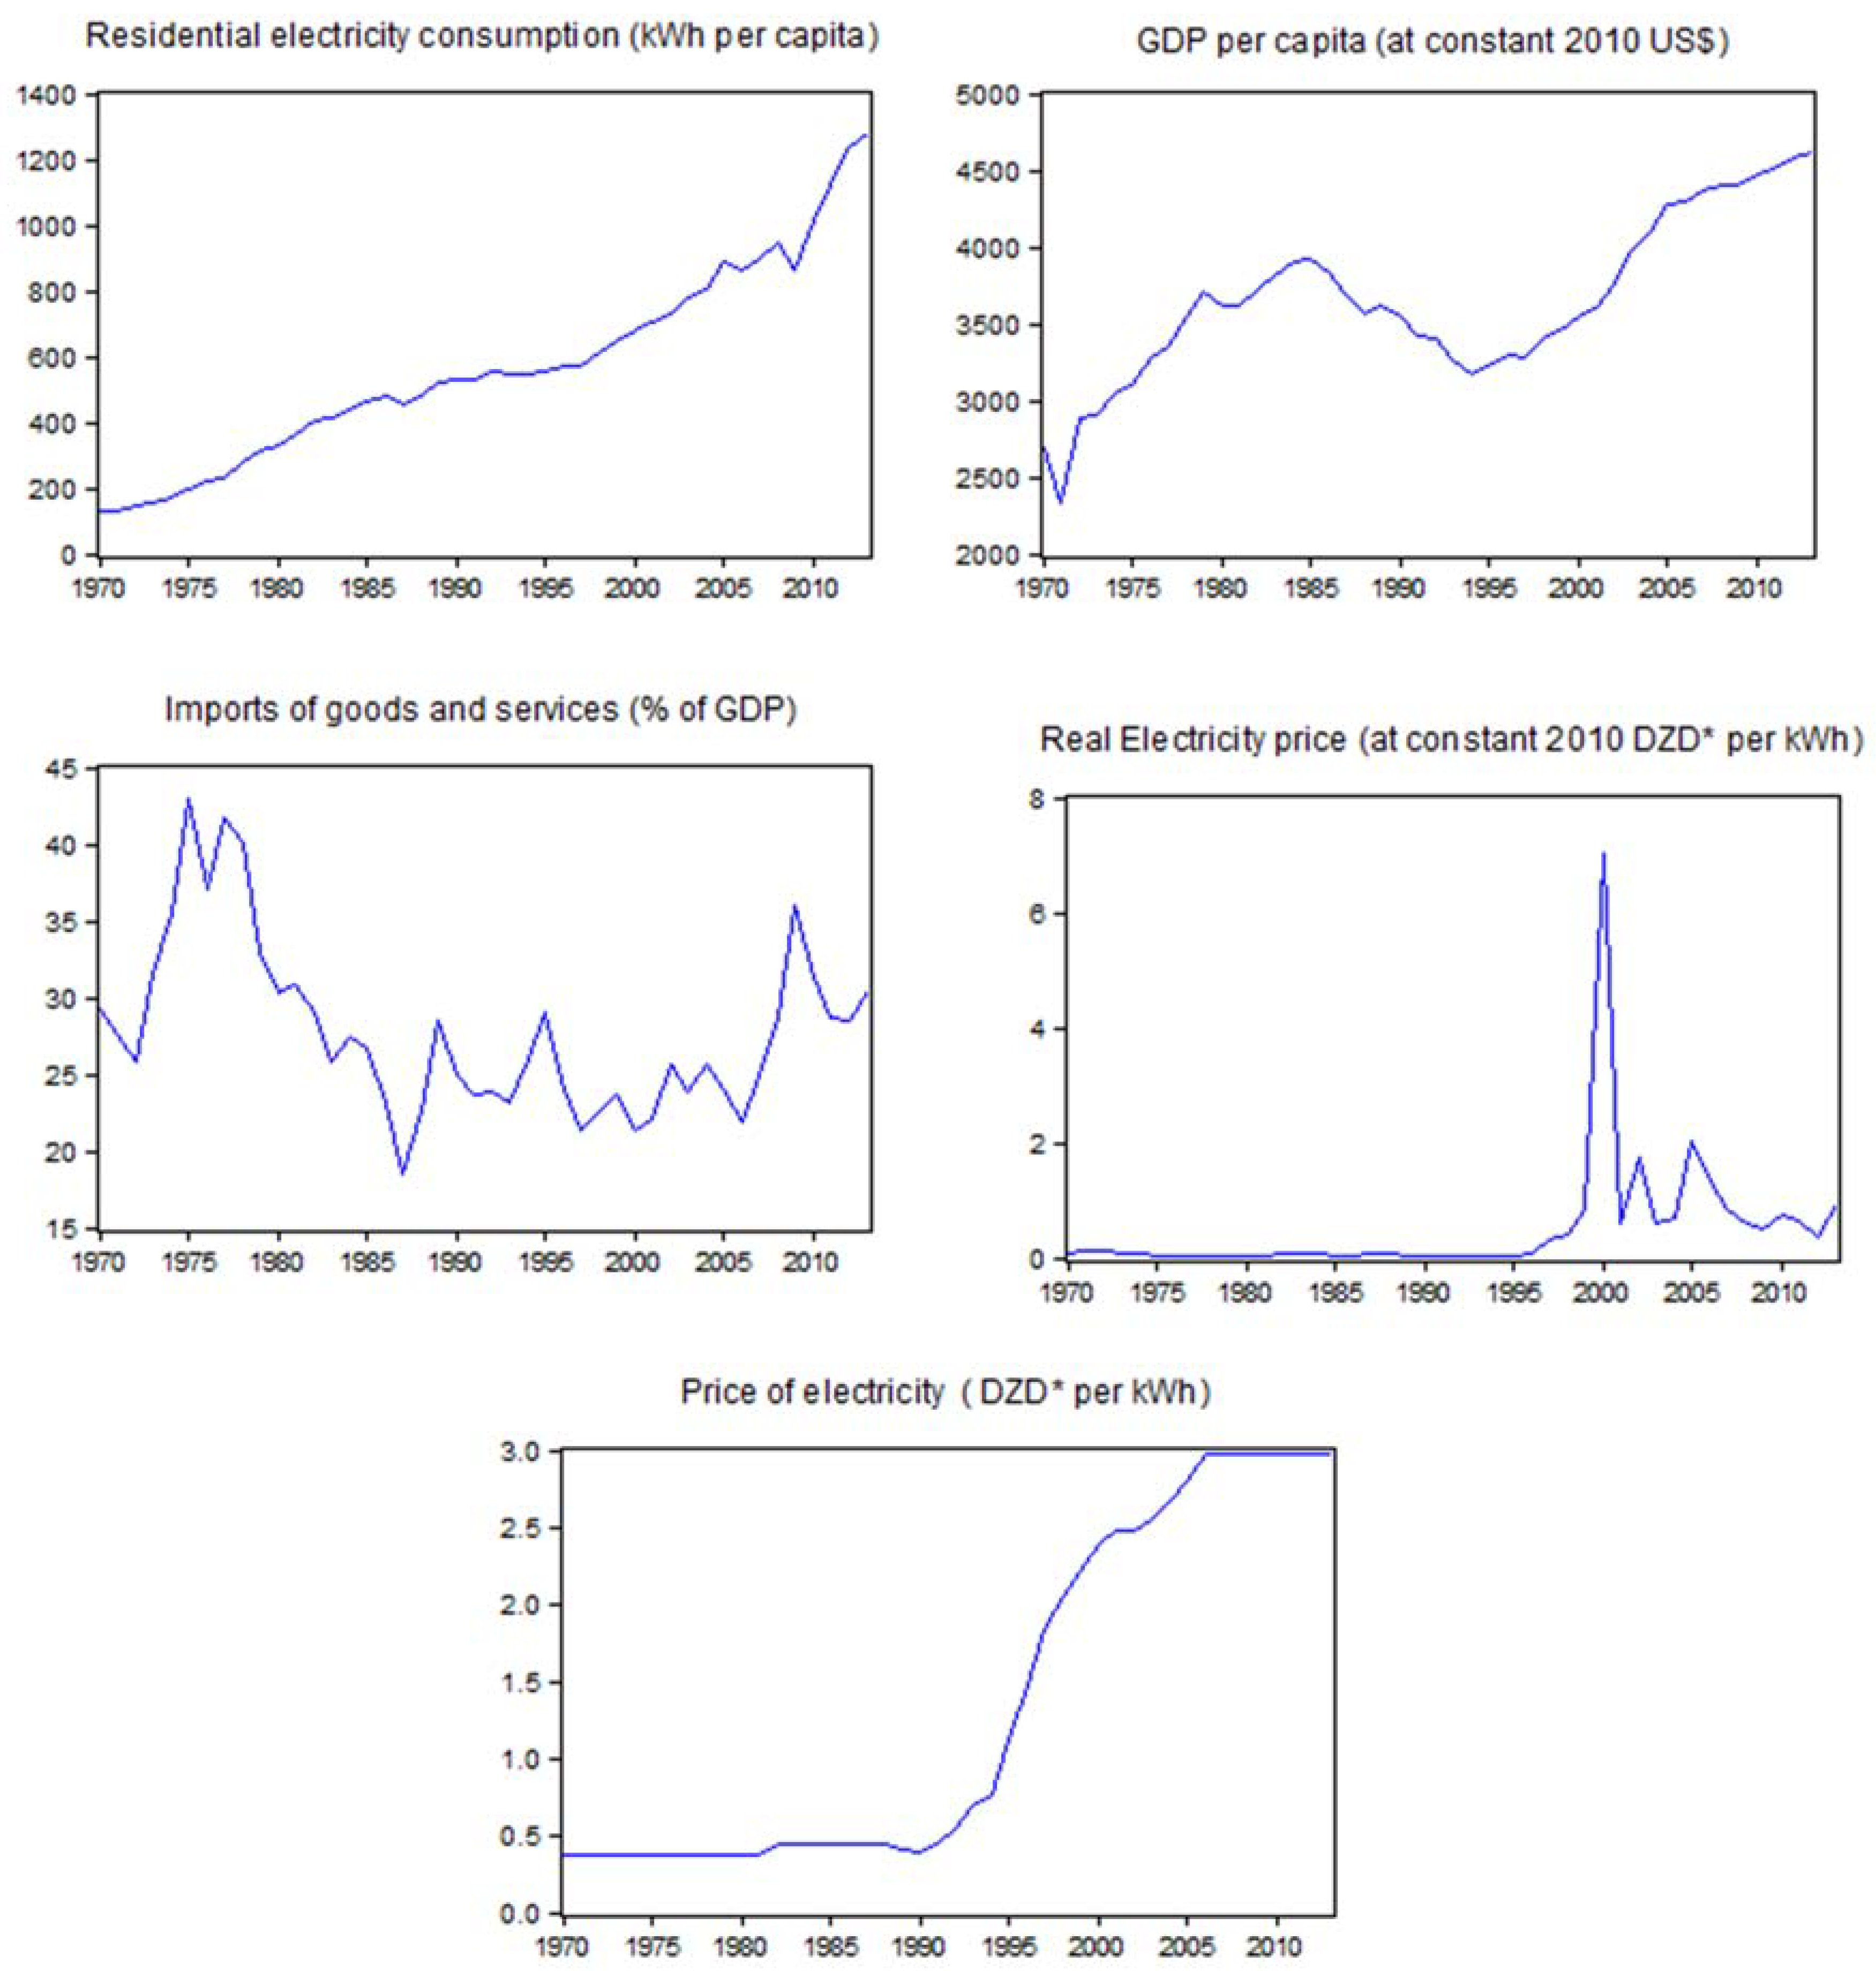
Table 1 summarizes the main statistics of the variables. All variables refer to the period from 1970 to 2013. Data on residential electricity consumption, GDP, imports of goods and services and total population come from the World Development Indicators database [64]. Electricity price data come from the information provided by the Official Journals of the Algerian Government [65]. Real electricity price have been considered in this study. Nevertheless, the nominal price is also shown in Table 1 and Figure 1 to explain the real price trend.
The top left graph in Figure 1 shows the residential electricity consumption per capita trend. A continuously positive growth is observed through the period. This growth is in line with the growing trend in Algerian electricity consumption observed over the last forty years. According to Bélaïd and Abderrahmani [15], this strong demand for electricity can be explained by two factors: the expansion of economic activities and the population growth. Although the Algerian Government had been establishing several development plans to boost economic growth by developing and modernizing the industry sector, which had led to increasing electricity consumption, the growth of Algerian residential electricity consumption has been higher than that of industry, especially over recent years. While, in 1990, electricity use by the industry sector was 48.5% of total electricity consumption and the electricity use by the residential sector was 49.15%; in 2014, the industry sector electricity consumption was only 35% and the residential consumption was more than 63%. This greater residential electricity consumption may be explained by several factors, such as changes in lifestyles [15].
The top right graph in Figure 1 shows the Algerian GDP per capita trend. Over these forty four years, Algeria has not experienced a significant global growth, the average annual growth rate being equal to 1.25%. Three main periods are observed in its evolution. In the first period, from 1970 to 1979, the GDP per capita experienced a strong positive trend. From 1970, Algeria adopted a centrally planned command economy, formulating two four-year plans: from 1970 to 1973 and from 1974 to 1977. This organization led to enormous physical capital investments which, according to Zouache [66], could explain the notable growth of the Algerian economy. The average investment rate was 28.3% from 1970 to 1973 and 40.4% from 1973 to 1978 [67]. Over the second period, from 1980 to 1994, the GDP per capita decreased to $3165.90 in 1994. This situation was the consequence of several factors, especially the oil price crashes in 1979 and 1986 and the political instability in the early 1990s. Finally, from 1994, the GDP per capita again started to increase significantly. In 1994, Algeria suffered from the first IMF stabilization program, and one year later from the second. In general, the aims of these stabilization programs were to liberalize the economy, from socialism to a market-oriented economy [66]. In particular, these programs had two main objectives: to strongly increase investment in public infrastructures and to decrease the unemployment rate by stimulating domestic demand [68]. Finally, at the end of the nineties, this strategy benefited from a favorable context, due to a better political climate and rising oil prices.
The graph at the bottom left of Figure 1 shows the evolution of imports with respect to GDP. Four main stages can be observed. From 1970 to 1975, a notable growth of imports is shown, which may be related to the development system implemented in Algeria, based on strong industrialization. This system generated notable semi-finished products and industrial equipment imports. From 1975 to 1987, a prominent decreased is observed. This decline was mostly caused by the fall in the value of oil exports, and over these years, export revenues paid for nearly 80% of imports. From 1987 to 2006, an evolution with peaks and troughs is observed around a percentage value equal to 22%. Finally, from 2006, the imports percentage starts growing again, except for 2009–2010. This rise was due to the increase in imported goods to cover the needs of the economic recovery program and to satisfy the increasing demands of the population [69].
Finally, the graph at the bottom left of Figure 1 shows the evolution of the annual average household real electricity price. Over the whole period, the Algerian Government fixed and subsidized the electricity prices. It is worth noting that the production and the distribution of electricity are completely in the hands of the government company, namely SONELGAZ. From 1970 to 1994, the prices remain quite constant around constant 2010 DZD 0.05 per kWh. Since then, the Algerian Government proceeded to increase the household electricity price. As from June 1994, the household electricity prices became different for those consuming less or more than 500 kWh per year. In addition, gas and electricity quarterly price revision systems were implemented and most controls were eliminated, raising electricity prices toward their opportunity cost. Therefore, the electricity price grew with the greater liberalization [70]. Nevertheless, after few years, the electricity prices only adjusted partially to the increasing cost of living, becoming much lower again. Additionally, the real electricity prices growth between 1995 and 2000 may be also explained by the Algerian currency devaluation on April 1994 (40.17%). This devaluation had remarkable negative effect on the purchasing power [70].
4. Results
4.1. Break Point Unit Root Test (Selection of Structural Break Point)
Table 2 shows the results of the Lee-Strazicich two breaks unit root test. The LM unit root test rejects the unit root null for y and imp, while do not reject the unit root null for the others. In addition, the results also show that there are six structural break points from 1987 to 2002 (1987, 1994, 1995, 2000, 2001 and 2002). Indeed, since the end of the 1980s, the Algerian economy has experienced real mutations. After the oil crisis of 1986, the Algerian Government started to initiate economic reforms aimed at transforming from a socialist to a liberal economy [66]. Later on, the Algerian Government adopted a structural adjustment plan in 1994. In order to capture these economic changes, the dummy variable of the year 1987 and that related to the structural adjustment plan period (1994–2002) have been introduced into the econometric analysis. The first variable takes the value one for the year 1987 and zero otherwise. The second variable takes the value one for the years 1994 to 2002 and zero otherwise.
4.2. ARDL Bounds Tests
Table 3 shows that the value of F-statistic related to the null hypothesis surpasses the critical value of the bounds test, with unrestricted intercept and no trend, at 1% and 5%. Therefore, there is a cointegration relationship between the variables included in this study, implying that in the long-run, electricity prices, services imports and GDP per capita, its squared and cubed terms are moving together.
4.3. Long-Run and Short-Run Estimates
Table 4 shows the results of estimating the Equations (3) and (4) when the ordinary least squares method is used. The lags of the estimated ARDL model were selected on the basis of the minimum values of the Akaike and Schwarz criteria. Likewise, LM test suggests no evidence of serial correlation in the residuals. The null hypothesis of no serial correlation cannot be rejected.
Column (B) in Table 4 shows the short-run estimate. The coefficient of the estimated error correction coefficient (ECMt−1) appears negative and statistically significant at 1%, with a high value equal to −0.43.
The short-run estimate results also show that the coefficient related to GDP per capita is positive and significant, and that the residential electricity use elasticity with respect to the electricity prices is negative and statistically significant. This means that increasing the electricity prices will reduce the residential electricity consumption in Algeria, in the short term. Nevertheless, the coefficient is less than one, and is therefore considered price inelastic. This result is in line with previous studies that find negative and less than one short-run price elasticities, as for example in Donatos and Mergos [71], Silk and Joutz [24], and Athukorala and Wilson [32]. Additionally, the results show that the short-run electricity use elasticity, with respect to imports, is negative and significant. Therefore, increasing imports have been reducing residential electricity consumption in the short-run. In that regard, it may be possible that imports of goods have allowed, in the short term, the replacement of less energy-efficient goods with others that are more efficient.
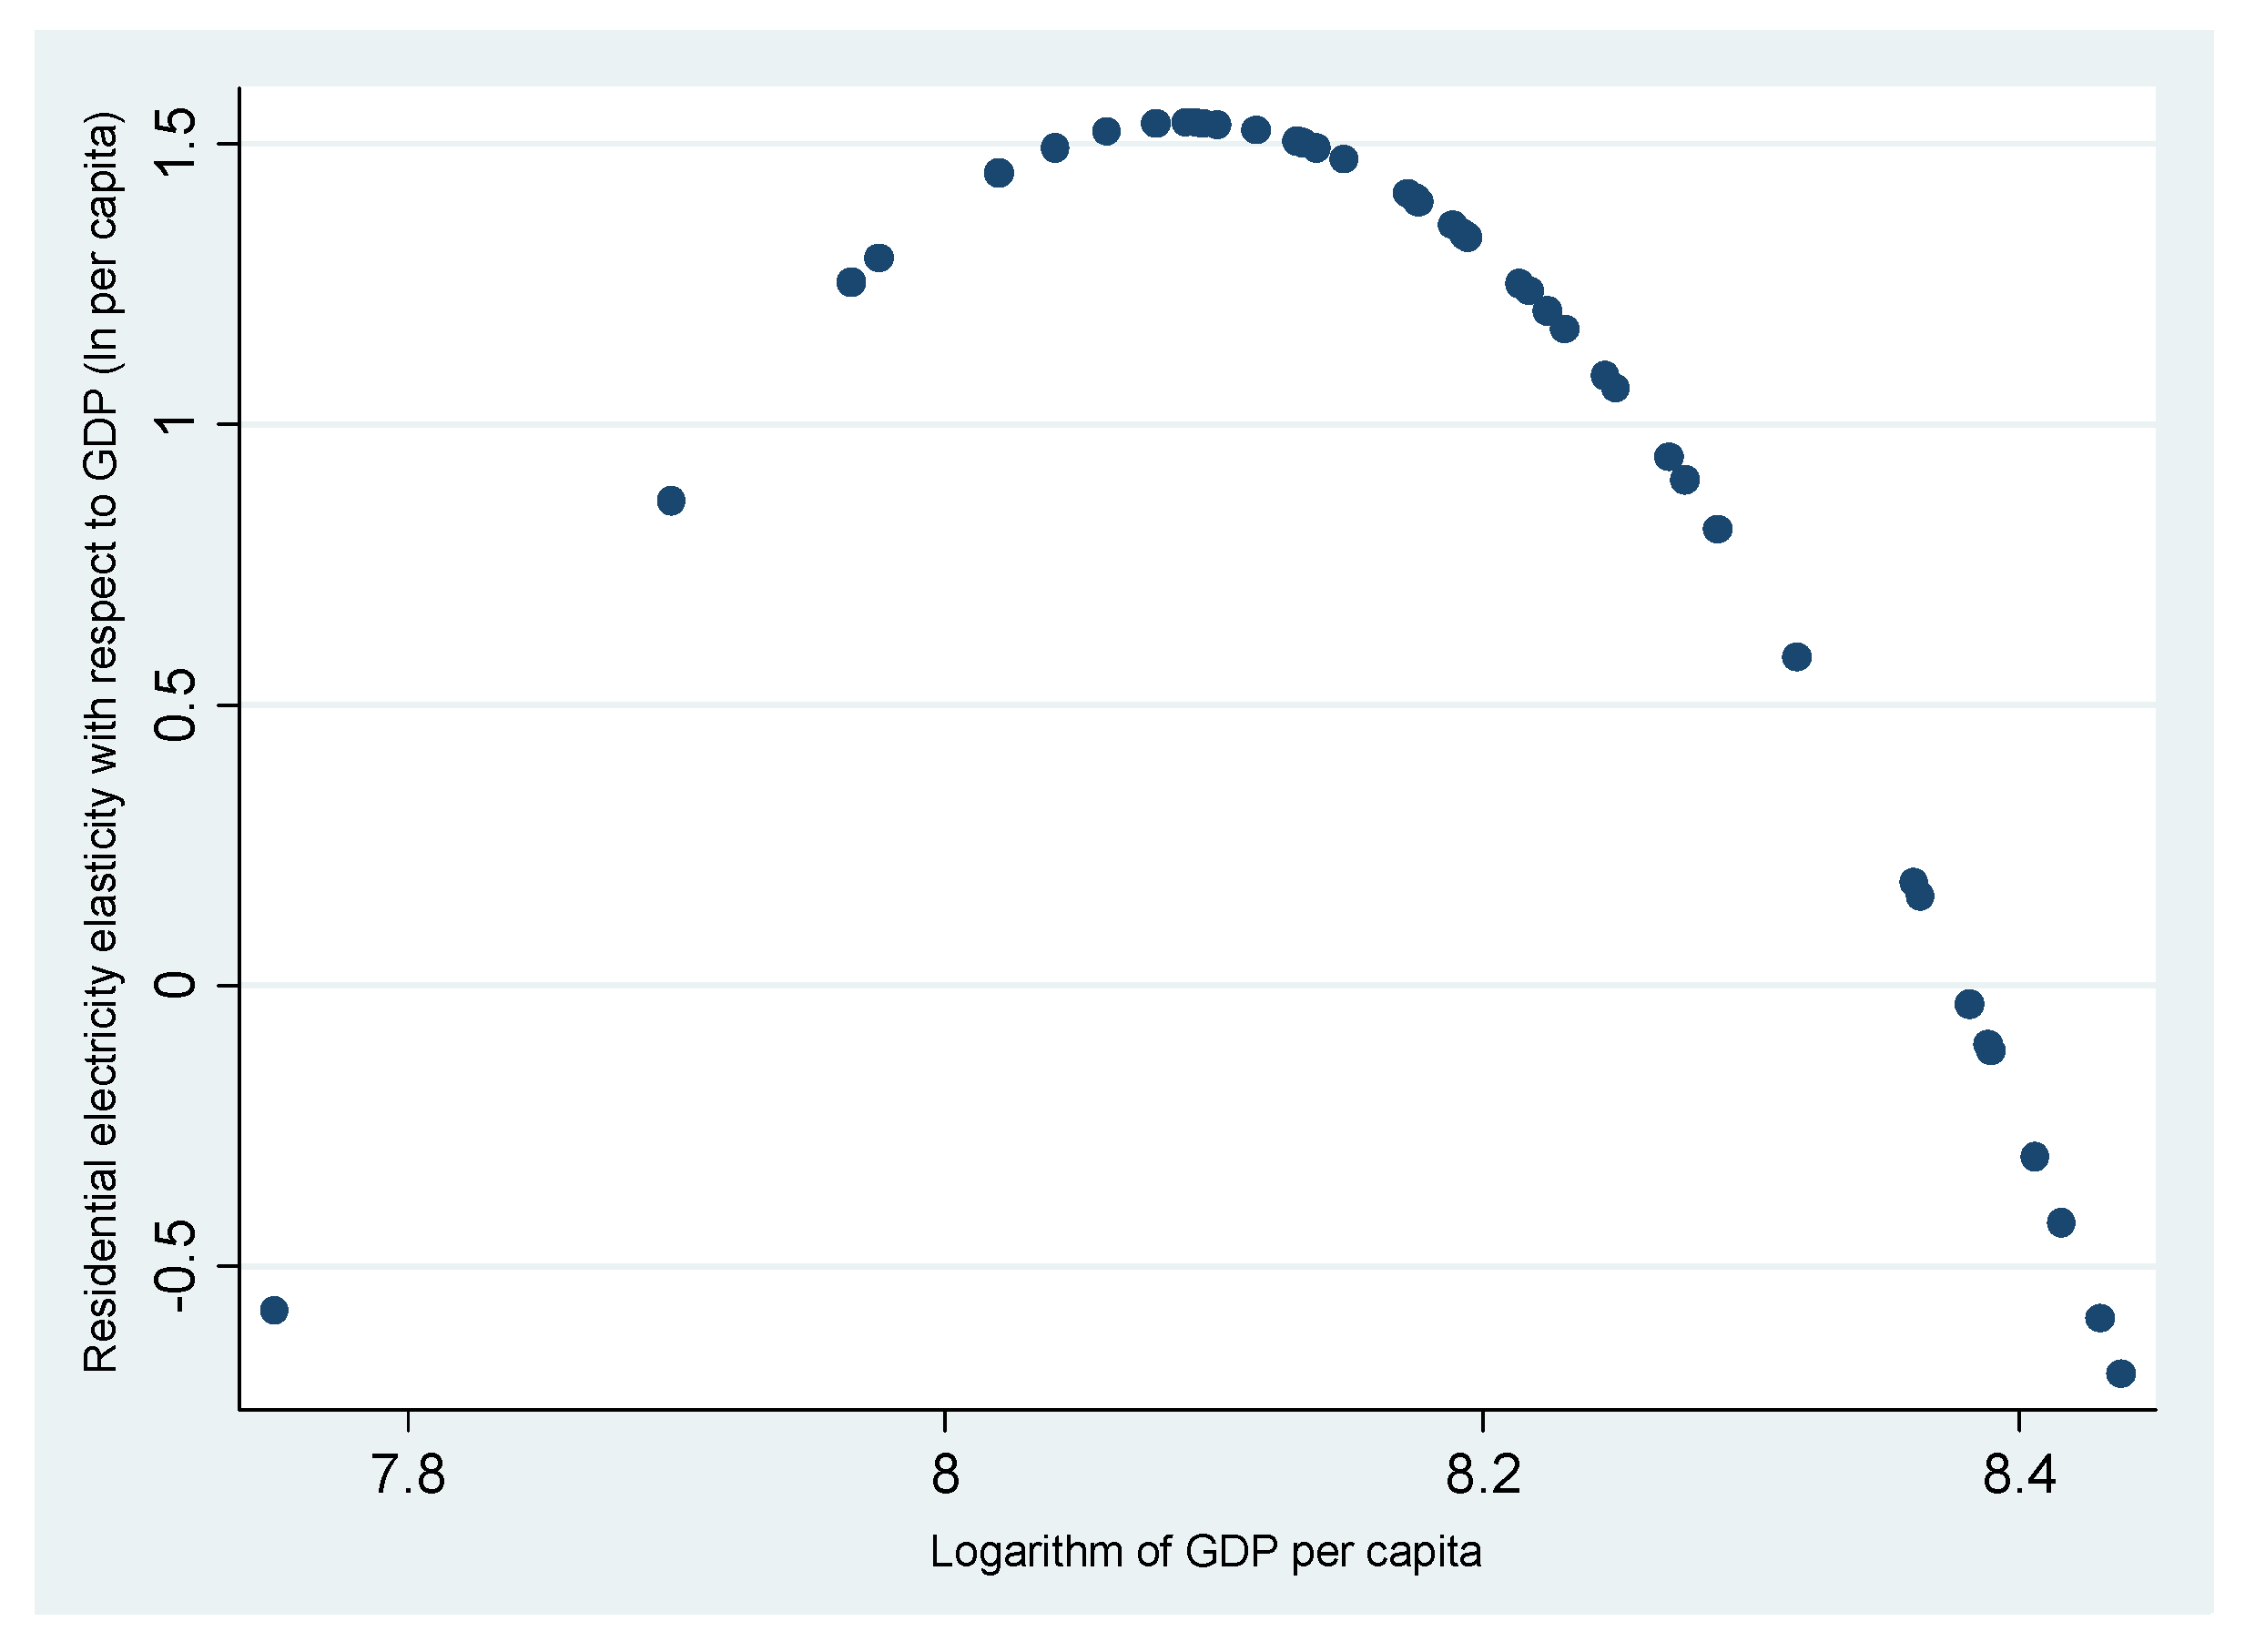
Column (A) in Table 4 shows the results obtained by normalizing per capita residential energy use in the long run The elasticity with respect to GDP per capita in the central point of the sample is positive and statically significant, being equal to 1.35. These results are in line with those obtained by Zaman et al. [50], Bélaïd and Abderrahmani [15], and Kamaludin [72]. Nevertheless, the squared and cubed GDP per capita estimated coefficients are negative and significant. Therefore, the residential electricity consumption elasticity with respect to GDP per capita is not constant through the studied period, varying with GDP per capita. In addition, as these coefficients are negative, the relationships between electricity use and GDP (in per capita terms) present an inverted N-shape curve. However, in order to determine if the second turning point has been reached, it is necessary to calculate and study the first derivative of the residential electricity consumption function in the long-run, to find the maximum point of the function. The first derivative is the residential electricity consumption elasticity to GDP. Therefore if the elasticity value is zero, and the second derivative is negative (elasticity goes from positive to negative values), then the second thresholds of the inverted N-shape curve is obtained. Figure 2 shows the elasticity values with respect to the GDP per capita log value. It is worth noting that elasticity becomes zero for GDP per capita values equal to 8.39 in logs (about 4400 constant 2010 US$). Therefore, the second turning point of the inverted N-shape curve is reached when GDP per capita equals 4400 constant 2010 US$. This value was reached for the Algerian economy in 2010.
Therefore, the results show that GDP per capita increases in recent years are contributing to reduce residential electricity use, which could be related to the fact that the population is replacing their appliances with more efficient ones. In this sense, it is worth highlighting that, in 2012, 100% of the population had the most common appliances, with cooking being the highest percentage of annual energy consumption [73]. Furthermore, the household electrical equipment consumption accounts for 75% of the total electrical energy consumed in the dwellings [74].
Subsequently, as the income growth does not seem to be the cause of the residential electricity growth in the latter years analyzed, there may be some other underlying causes. In this sense, the results show that the time trend effect is positive and significant, which may be explained by the increasing urbanization and the lifestyle changes. Along this line, Gupta [75] states that the lifestyles in cities of the developing countries are becoming energy intensive. Likewise, Karanfil and Li [76] found that urbanization is a relevant factor of electricity use in all income levels, except for the high-income level, with it also being the most important driver of electricity use in upper-middle income countries, such as Algeria [77]. According to the World Bank [64] database, about 70.72% of the Algerian population lived in urban regions in 2015, while the urbanized segment of the population was at 39.5% in 1970.
Additionally, the import coefficient is positive and significant at a 10% level in the long-run estimate. Although in the short-run the residential electricity consumption elasticity with imports is negative, in the long-run the sign changes into positive. However, although imports could lead to more efficient appliance purchases in the short-run, these could also provide more appliance purchases in the households over time, generating rebound effects in the long-run. Thus, it is worth noting that Algerian consumer goods imports were valued at US$13.3 million in 2015, representing 25.65% of total imports, while in 1992 they were valued at US$1.6 million, representing only 19% of total imports [78].
Finally, results in Table 6 also show that the elasticity with respect to residential electricity prices is negative, significant and lower than one. These results are in line with those obtained in Kamaludin [72], referring to developing countries. The author concludes that electricity is assumed to be a necessity good and therefore is relatively inelastic. Along this line, the study by Arisoy and Ozturk [79] found low values for price elasticity of residential electricity, implying that electricity is a necessary good for households. Likewise, price elasticity has also been found non-significant when estimating the effect of energy price on transport energy use [10]. In the case of Algeria, it is worth noting that residential electricity prices, despite increasing in some periods, are low as they are still being greatly subsidized by the Algerian authorities. Therefore, it would be adequate to continue increasing them to market prices. Recently, the Algerian energy regulator has augmented electricity and gas tariffs for high-voltage electricity use. Nevertheless, it has not increased tariffs for low-voltage electricity, which is used in households [80]. The elimination of these subsides in the residential sector would make electricity consumption more sensitive to prices, and therefore responsible electricity consumption could be addressed. Fattouh and El-Katiri [81] state that electricity subsidies distort price signals, inducing large energy consumption inefficiencies. Therefore, they have negative implications on electricity efficiency.
4.4. Multicollinearity and Stability
In order to avoid multicollinearity, all variables in the model were converted to deviation with respect to their mean, as previously mentioned in the methodology section. Table 5 shows the VIF values for the GDP per capita and its squared and cubed transformed values. The VIF values are lower than 5, thereby no multicollinearity is present between y, y2 and y3, in natural logs.
The model stability has also been studied. It is checked on the basis of the CUSUM and CUSUMSQ tests. As shown in Figure 3, the cumulative sum of recursive residuals (CUSUM) test and the cumulative sum squared of recursive residuals (CUSUMSQ) test, show that the estimated coefficients of the error correction model are very stable throughout the studied period.
4.5. Granger Causality Test
Table 6 shows the results of the short-run and long-run Granger causality test between elec, y, p and imp variables.
According to the Wald test based on the chi-square distribution, the short run Granger causality test shows that GDP causes the residential electricity consumption (Dy → Delec), the electricity price causes the residential electricity consumption (Dp → Delec), and imports of goods and services cause the residential electricity consumption (Dimp → Delec) and economic growth (Dimp → Dy). There is no evidence to support residential energy use causing GDP. In the long run, there is evidence of causal relationships, from GDP, prices, and imports on residential energy consumption.
In addition, the results show that electricity prices are determined neither by GDP nor residential electricity consumption. In this sense, it is worth noting that the Algerian government continues to subsidize and administer all energy prices.
5. Discussion
Algeria is a country affected by desertification and is especially vulnerable to the effects of climate change. Traditionally, it has been a low GHG-emitting country, but with a notably increasing energy consumption in recent years, especially in the residential sector electricity consumption. Energy and electricity production is based essentially on natural gas, this country being included in the top ten natural gas producers in the world [4]. Nevertheless, it is worth noting that the declining natural gas production is an incontrovertible trend [82]. Therefore, on the one hand, the main source of energy production is declining and, on the other, a rapidly growing domestic gas demand has become a major issue. The energy measures included in the Algerian INDC are aimed at reducing the global consumption of energy by 9% by 2030 and at diversifying the energy mix by reaching 27% of electricity being generated from renewable energy sources [3].
One of the main issues in reducing energy consumption is related to residential electrical energy consumption. The results of this study show that the relationships between electricity use and GDP (in per capita terms) present an inverted N-shape, with the second turning point having been reached Therefore, promoting growth in Algeria could be convenient in order to reduce the electricity consumption, as higher income levels may be allowing the purchase and use of more efficient appliances. McNeil and Letschert [83] state that much of the growth in electricity consumption in the developing world comes from the uptake of refrigerators and washing machines. Nevertheless, when the market is saturated because the whole population owns these appliances, there is greater potential for electricity reduction from maximizing the efficiency of these large products. In that sense, higher income facilitates purchasing energy efficient appliances, as it depends on financial capacity.
Nevertheless, two main questions may be taken into consideration. Firstly, the results are supported for the per capita electricity consumption. However, the population growth in Algeria is remarkable throughout the studied period, with the annual average being 3.8%, and is still notable in recent years, with a yearly growth rate in 2016 equal to 1.79% [64]. Therefore, reductions in per capita terms may be mitigated, or at least reduced, when considered in absolute terms. Secondly, the results also show that the time trend variable is significant and positive, showing that the electricity consumption in per capita terms grows over time due to other factors not considered in the estimate. In that regard, urbanization and lifestyle changes may be included among these factors, as commented before. These effects seems to be especially relevant, as despite the negative effect of income growth on electricity consumption in households, the growth in electricity consumption has continued to take place in Algeria. That is to say, the increase in income has not been sufficient to compensate for the effect that other factors have had on the growth of residential electricity consumption, such as urbanization or the change of lifestyle.
Therefore, Algeria has to implement some electricity policy measures, if it wants to comply with its INDC commitments. On the one hand, renewable energies may be adequate to increase the electricity production to cover the increasing residential demand with low emissions. In this regard, Algeria has one of the largest solar resources in the world (exceeding 5 billion GWh/yr) [84] and a notable geothermal reservoir in the Albian aquifer (over 700,000 km2) [3]. In order to increase its renewable energy production, the Algerian Government set the Renewable Energy and Energy Efficiency Development Plan 2011–2030, the Renewable Energy and Energy Efficiency Development Plan 2015–2030 and implemented some financial measures such as the feed-in tariff scheme for solar PV installations, the renewable energy fund for investments and the national fund for energy management [4]. Nevertheless, the electricity production from solar or wind energy is very low. According to the last energy balance, the electricity production from solar and wind energy was only 8 Ktep in 2015, while total production was 16,425 Ktep [85]. Thus, the policy measures established until now may not be considered sufficient to promote the use of renewable energies. Algeria needs to implement more incentive schemes and better coordinated public support programs and public-private partnerships in order to develop local industries [82]. For example, Sellami et al. [86] state that Algeria has an enormous potential market for the solar water heater, but its development and commercialization remain in their infancy, due to the lack of specific incentive laws and the absence of a local specialized industry. Along this line, Pitelis and Teece [87] consider that local markets may be co-created by joint multinational foreign investment and home/host/international policies, which imply interactions between business and governmental efforts [88].
However, these measures may be conditioned by the high Algerian budget deficit. Thus, the low oil price is recently having negative impacts on the economy, government budget and external finances, as the oil and gas sector accounts for more than 95% of export revenue [89]. Therefore, the promotion of renewable energy may be conditioned by international aid and foreign investment. In this regard, some barriers may hinder new foreign investments. Among them, the Santander Bank [90] considers that bureaucracy, corruption, legal insecurity and a weak financial sector are investment barriers. In fact, according to the Doing Business 2016 Report [91] Algeria is ranked 156 out of 190. Therefore, it is considered necessary to improve the conditions that favor foreign investment.
On the other hand, the Algerian Government may control the rapid growth in electricity consumption by adjusting electricity tariffs to rationalize its consumption. As stated in Aissaoui [82], progressively raising prices becomes necessary in order to adjust them to electricity production costs. The results show that price is currently not significant in reducing electricity consumption, which could be related to its low level, as they are still being highly subsidized. Nevertheless, raising residential electricity prices may be done slowly and incrementally, as Algeria may be considered a politically sensitive area. As stated in Bouznit and Pablo-Romero [1], it is indispensable to undertake compensatory schemes, such as protecting low income households.
6. Conclusions
Algeria has been one of the countries with special interest in signing the COP21 agreement, due to its vulnerability to the effects of climate change, and being one of the first developing countries to submit the INDC in which it pledged to reduce carbon emissions by at least 7% by 2030. Nevertheless, Algeria has a difficult task ahead to comply with this target as CO2 emissions have been increasing, due to the positive evolution of the consumption of non-renewable energy, the insignificant presence of renewable energy, and the lack of CO2 emissions intensity/power improvement. The total final energy consumption has increased 32% from 2010 to 2014, the main energy increases being related to the residential sector and electricity consumption. Therefore, the analysis of the evolution of residential electricity use becomes especially interesting.
In this paper, the relationship between residential electricity use and income is analyzed for Algeria in the period 1970–2013, by estimating a residential electricity consumption per capita demand function which depends on GDP per capita, its squared and cubed term, the electricity prices and the goods and services imports. The methodology applied is the extended autoregressive distributed lag model (ARDL) with break points.
The short-run estimate results show that residential electricity consumption elasticity with respect to electricity prices is negative. Nevertheless, the coefficient is less than one, and is therefore considered price inelastic. In addition, the results show that the short-run electricity use elasticity with respect to imports is negative and significant. In that sense, it may be possible that imports of goods have allowed, in the short term, the replacement of less energy-efficient goods with others that are more efficient.
The long-run estimates indicate that the elasticity with respect to GDP per capita is positive in the central point of the sample. Nevertheless, the squared and cubed GDP per capita estimated coefficients are negative and significant. Therefore, results show that the relationships between electricity use and GDP (in per capita terms) present an inverted N-shape, with the second turning point having been reached. The results therefore show that the GDP per capita increases in recent years are contributing to reduce residential electricity use, which could be related to the fact that the population are replacing their appliances with more efficient ones. Therefore, promoting growth in Algeria could be convenient in order to reduce electricity consumption, as a higher income level may be allowing the purchase and use of more efficient appliances.
As the income growth does not seem to be the cause of the residential electricity growth (in per capita terms) in the latter years analyzed, there may be some other underlying causes. The results show that the time trend effect is positive and significant, which may be explained by increasing urbanization and lifestyle changes. Additionally, the import coefficient is positive and significant. Therefore, although imports could lead to purchases of more efficient appliances in the short-run, these could also provide more appliance purchases in households over time, generating rebound effects in the long-run. These effects seems to be especially relevant, as the increase in income has not been sufficient to compensate for the effect that other factors have had on the growth of residential electricity consumption, such as urbanization or change of lifestyle.
Therefore, Algeria has to implement some electricity policy measures if wants to comply with its INDC commitments. On the one hand, promoting renewable energies may be adequate to increase the electricity production in order to cover the increasing residential demand and to reduce emissions. However, the policy measures established until now may not be considered sufficient to promote the use of these energies. Algeria needs to implement more incentive schemes and better coordinated public support programs and public-private partnerships in order to develop local markets by joint multinational business and governmental efforts. Nevertheless, as these promotion measures may be conditioned by the high Algerian budget deficit, the promotion of renewable energy may be conditioned by foreign investment. In this sense, it is considered necessary to improve the conditions that favor foreign investment, such as for example battling corruption, reducing heavy bureaucracy, strengthening the financial sector and generating legal security in terms of intellectual property rights.
On the other hand, the results show that the elasticity with respect to residential electricity prices is negative, significant and lower than one, which may be related to very low electricity prices because they are subsidized by the Algerian Government. Therefore, the Algerian Government may control the rapid growth of electricity consumption by adjusting electricity tariffs to rationalize its consumption. It that sense, progressively raising prices becomes necessary in order to adjust them to electricity production costs. Nevertheless, rising residential electricity prices may be done slowly and incrementally in order to maintain the socio-political order.
Author Contributions
All authors jointly conceived and designed the study. M.B. contributed to data processing and drafting the manuscript. M.P.P.-R. contributed to data collection and paper revision. A.S.-B. contributed to data analysis and paper revision.
Acknowledgments
The second and third authors wish to acknowledge the financial support received from the ECO2014-56399-R Project of the Spanish Ministry of Economy and Competitiveness, from the Chair of Energy and Environmental Economics at the University of Seville (Cátedra de Economía de la Energía y del Medio Ambiente, Universidad de Sevilla) and from the SEJ 132 project of the Andalusian Regional Government of Andalusia (Spain). Authors are also grateful for the financial support received from the Department of Economic Analysis and Economic Policy at the University of Seville (Departamento de Análisis Económico y Economía Política, Universidad de Sevilla).
Conflicts of Interest
The authors declare no conflict of interest.
References
- Bouznit, M.; Pablo-Romero, M.P. CO2 emission and economic growth in Algeria. Energy Policy 2016, 96, 93–104. [Google Scholar] [CrossRef]
- Sahnoune, F.; Belhamel, M.; Zelmat, M.; Kerbachi, R. Climate change in Algeria: Vulnerability and strategy of mitigation and adaptation. Energy Procedia 2013, 36, 1286–1294. [Google Scholar] [CrossRef]
- INDC-Algeria (Intended Nationally Determined Contribution INDC-Algeria). Available online: http://www4.unfccc.int/ndcregistry/PublishedDocuments/Algeria%20First/Algeria%20-%20INDC%20 (accessed on 15 June 2018).
- International Energy Agency (IEA). Statistics and Energy Balances by Countries, Non-Member Countries, Algeria; International Energy Agency, OECD/IEA: Paris, France, 2017; Available online: http://www.iea.org/statistics/ (accessed on 15 June 2018).
- Nachmany, M.; Fankhauser, S.; Davidová, J.; Kingsmill, N.; Landesman, T.; Roppongi, H.; Schleifer, P.; Setzer, J.; Sharman, A.; Singleton, C.S.; et al. The 2015 Global Climate Legislation Study. A Review of Climate Change Legislation in 99 Countries; The Grantham Research Institute on Climate Change and the Environment, The Global Legislators Organisation (GLOBE), and The Inter-Parlamentary Union (IPU): London, UK, 2015; Available online: http://eprints.lse.ac.uk/65347/ (accessed on 15 June 2018).
- Amri, F. Carbon dioxide emissions, output, and energy consumption categories in Algeria. Environ. Sci. Pollut. Res. 2017, 24, 14567–14578. [Google Scholar] [CrossRef] [PubMed]
- Environmental Performance Index. Available online: https://epi.envirocenter.yale.edu/ (accessed on 15 June 2018).
- Pablo-Romero, M.P.; Sánchez-Braza, A. Residential energy environmental Kuznets Curve in the EU-28. Energy 2017, 125, 44–54. [Google Scholar] [CrossRef]
- Lau, L.S.; Choong, C.K.; Eng, Y.K. Investigation of the environmental Kuznets curve for carbon emissions in Malaysia: Do foreign direct investment and trade matter? Energy Policy 2014, 68, 490–497. [Google Scholar] [CrossRef]
- Pablo-Romero, M.P.; Cruz, L.; Barata, E. Testing the transport energy-environmental Kuznets curve hypothesis in the EU27 countries. Energy Econ. 2017, 62, 257–269. [Google Scholar] [CrossRef]
- Kraft, J.; Kraft, A. On the relationship between energy and GNP. J. Energy Dev. 1978, 3, 401–403. [Google Scholar]
- Tiba, S.; Omri, A. Literature survey on the relationships between energy, environment and economic growth. Renew. Sustain. Energy Rev. 2017, 6, 1129–1146. [Google Scholar] [CrossRef]
- Omri, A. An international literature survey on energy-economic growth nexus: Evidence from country-specific studies. Renew. Sustain. Energy Rev. 2014, 38, 951–959. [Google Scholar] [CrossRef] [Green Version]
- Souhila, C.; Kourbali, B. Energy consumption and economic growth in Algeria: Cointegration and causality analysis. Int. J. Energy Econ. Policy 2012, 2, 238–249. [Google Scholar]
- Bélaïd, F.; Abderrahmani, F. Electricity consumption and economic growth in Algeria: A multivariate causality analysis in the presence of structural change. Energy Policy 2013, 55, 286–295. [Google Scholar] [CrossRef]
- Wolde-Rufael, Y. Energy demand and economic growth: The African experience. J. Policy Model. 2005, 27, 891–903. [Google Scholar] [CrossRef]
- Wolde-Rufael, Y. Energy consumption and economic growth: The experience of African countries revisited. Energy Econ. 2009, 31, 217–224. [Google Scholar] [CrossRef]
- Ozturk, I.; Acaravci, A. Electricity consumption and real GDP causality nexus: Evidence from ARDL bounds testing approach for 11 MENA countries. Appl. Energy 2011, 88, 2885–2892. [Google Scholar] [CrossRef]
- Omri, A. CO2 emissions, energy consumption and economic growth nexus in MENA countries: Evidence from simultaneous equations models. Energy Econ. 2013, 40, 657–664. [Google Scholar] [CrossRef]
- Squalli, J. Electricity consumption and economic growth: Bounds and causality analyses of OPEC members. Energy Econ. 2007, 29, 1192–1205. [Google Scholar] [CrossRef]
- Jamasb, T.; Meier, H. Household Energy Expenditure and Income Groups: Evidence from Great Britain. Available online: https://www.repository.cam.ac.uk/handle/1810/257200 (accessed on 15 June 2018).
- Wolfram, C.; Shelef, O.; Gertler, P. How will energy demand develop in the developing world? J. Econ. Perspect. 2012, 26, 119–138. [Google Scholar] [CrossRef]
- Gertler, P.J.; Shelef, O.; Wolfram, C.D.; Fuchs, A. The demand for energy-using assets among the world’s rising middle classes. Am. Econ. Rev. 2016, 106, 1366–1401. [Google Scholar] [CrossRef]
- Silk, J.I.; Joutz, F.L. Short and long-run elasticities in US residential electricity demand: A co-integration approach. Energy Econ. 1997, 19, 493–513. [Google Scholar] [CrossRef]
- Holtedahl, P.; Joutz, F.L. Residential electricity demand in Taiwan. Energy Econ. 2004, 26, 201–224. [Google Scholar] [CrossRef] [Green Version]
- Hondroyiannis, G. Estimating residential demand for electricity in Greece. Energy Econ. 2004, 26, 319–334. [Google Scholar] [CrossRef]
- Filippini, M.; Pachuari, S. Elasticities of electricity demand in urban Indian households. Energy Policy 2004, 32, 429–436. [Google Scholar] [CrossRef] [Green Version]
- Narayan, P.K.; Smyth, R. The residential demand for electricity in Australia: An application of the bounds testing approach to cointegration. Energy Policy 2005, 33, 467–474. [Google Scholar] [CrossRef]
- Atakhanova, Z.; Howie, P. Electricity demand in Kazakhstan. Energy Policy 2007, 35, 3729–3743. [Google Scholar] [CrossRef]
- Halicioglu, F. Residential electricity demand dynamics in Turkey. Energy Econ. 2007, 29, 199–210. [Google Scholar] [CrossRef]
- Nasir, M.; Tariq, M.S.; Arif, A. Residential demand for electricity in Pakistan. Pak. Dev. Rev. 2008, 47, 457–467. [Google Scholar]
- Athukorala, P.P.A.W.; Wilson, C. Estimating short and long-term residential demand for electricity: New evidence from Sri Lanka. Energy Econ. 2010, 32 (Suppl. 1), S34–S40. [Google Scholar] [CrossRef] [Green Version]
- Blázquez, L.; Boogen, N.; Filippini, M. Residential electricity demand in Spain: New empirical evidence using aggregate data. Energy Econ. 2013, 36, 648–657. [Google Scholar] [CrossRef] [Green Version]
- Romero-Jordán, D.; Peñasco, C.; Del Río, P. Analysing the determinants of household electricity demand in Spain. An econometric study. Int. J. Electr. Power Energy Syst. 2014, 63, 950–961. [Google Scholar] [CrossRef]
- Atalla, T.N.; Hunt, L.C. Modelling residential electricity demand in the GCC countries. Energy Econ. 2016, 59, 149–158. [Google Scholar] [CrossRef]
- Schulte, I.; Heindl, P. Price and income elasticities of residential energy demand in Germany. Energy Policy 2017, 102, 512–528. [Google Scholar] [CrossRef] [Green Version]
- Dong, X.Y.; Hao, Y. Would income inequality affect electricity consumption? Evidence from China. Energy 2018, 142, 215–227. [Google Scholar] [CrossRef]
- Richmond, A.K.; Kaufmann, R.K. Energy prices and turning points: The relationship between income and energy use/carbon emissions. Energy J. 2006, 27, 157–180. [Google Scholar] [CrossRef]
- Nguyen-Van, P. Energy consumption and income: A semiparametric panel data analysis. Energy Econ. 2010, 32, 557–563. [Google Scholar] [CrossRef]
- Suri, V.; Chapman, D. Economic growth, trade and energy: Implications for the environmental Kuznets curve. Ecol. Econ. 1998, 25, 195–208. [Google Scholar] [CrossRef]
- Richmond, A.K.; Kaufmann, R.K. Is there a turning point in the relationship between income and energy use and/or carbon emissions? Ecol. Econ. 2006, 56, 176–189. [Google Scholar] [CrossRef]
- Yoo, S.H.; Lee, J.S. Electricity consumption and economic growth: A cross-country analysis. Energy Policy 2010, 38, 622–625. [Google Scholar] [CrossRef]
- Sbia, R.; Shahbaz, M.; Ozturk, I. Economic growth, financial development, urbanisation and electricity consumption nexus in UAE. Econ. Res. Ekon. Istraž. 2017, 30, 527–549. [Google Scholar] [CrossRef]
- Luzzati, T.; Orsini, M. Investigating the energy-environmental Kuznets curve. Energy 2009, 34, 291–300. [Google Scholar] [CrossRef]
- Zilio, M.; Recalde, M. GDP and environment pressure: The role of energy in Latin America and the Caribbean. Energy Policy 2011, 39, 7941–7949. [Google Scholar] [CrossRef]
- Pablo-Romero, M.P.; De Jesús, J. Economic growth and energy consumption: The Energy-Environmental Kuznets Curve for Latin America and the Caribbean. Renew. Sustain. Energy Rev. 2016, 6, 1343–1350. [Google Scholar] [CrossRef]
- Yin, H.; Zhou, H.; Zhu, K. Long-and short-run elasticities of residential electricity consumption in China: A partial adjustment model with panel data. Appl. Econ. 2015, 48, 2587–2599. [Google Scholar] [CrossRef]
- Pablo-Romero, M.P.; Pozo-Barajas, R.; Sánchez-Braza, A. Analyzing the effects of Energy Action Plans on electricity consumption in Covenant of Mayors ignatory municipalities in Andalusia. Energy Policy 2016, 99, 12–26. [Google Scholar] [CrossRef]
- Neeland, H. The residential demand for Electricity in the United States. Econ. Anal. Policy 2009, 39, 193–203. [Google Scholar] [CrossRef]
- Zaman, K.; Khan, M.M.; Ahmad, M.; Rustam, R. Determinants of electricity consumption function in Pakistan: Old wine in a new bottle. Energy Policy 2012, 50, 623–634. [Google Scholar] [CrossRef]
- Pourazarm, E.; Cooray, A. Estimating and forecasting residential electricity demand in Iran. Econ. Model. 2013, 35, 546–558. [Google Scholar] [CrossRef] [Green Version]
- Dinda, S. Environmental Kuznets curve hypothesis: A survey. Ecol. Econ. 2004, 49, 431–455. [Google Scholar] [CrossRef] [Green Version]
- Pesaran, M.H.; Shin, Y.; Smith, R.J. Bounds testing approaches to the analysis of level relationships. J. Appl. Econ. 2001, 16, 289–326. [Google Scholar] [CrossRef] [Green Version]
- McNown, R.; Sam, C.Y.; Goh, S.K. Bootstrapping the autoregressive distributed lag test for cointegration. Appl. Econ. 2018, 50, 1509–1521. [Google Scholar] [CrossRef]
- Perron, P. The great crash, the oil price shock, and the unit root hypothesis. Econometrica 1989, 57, 1361–1401. [Google Scholar] [CrossRef]
- Zivot, E.; Andrews, D.W.K. Further evidence on the great crash, the oil-price shock and the unit-root hypothesis. J. Bus. Econ. Stat. 1992, 10, 251–270. [Google Scholar]
- Lee, J.; Strazicich, M.C. Minimum Lagrange multiplier unit root test with two structural breaks. Rev. Econ. Stat. 2003, 85, 1082–1089. [Google Scholar] [CrossRef]
- Narayan, P.K.; Smyth, R. Higher education, real income and real investment in China: Evidence from Granger causality tests. Educ. Econ. 2006, 14, 107–125. [Google Scholar] [CrossRef]
- Belloumi, M. The relationship between trade, FDI and economic growth in Tunisia: An application of the autoregressive distributed lag model. Econ. Syst. 2014, 38, 269–287. [Google Scholar] [CrossRef]
- Charfeddine, L.; Al-Malk, A.Y.; Al Korbi, K. Is it possible to improve environmental quality without reducing economic growth: Evidence from the Qatar economy. Renew. Sustain. Energy Rev. 2018, 82, 25–39. [Google Scholar] [CrossRef]
- Narayan, P.K.; Narayan, S. Carbon dioxide emissions and economic growth: Panel data evidence from developing countries. Energy Policy 2010, 38, 661–666. [Google Scholar] [CrossRef]
- Pablo-Romero, M.P.; Sánchez-Braza, A. Productive energy use and economic growth: Energy, physical and human capital relationships. Energy Econ. 2015, 49, 420–429. [Google Scholar] [CrossRef]
- Engle, R.F.; Granger, C.W.J. Co-integration and error correction: Representation, estimation, and testing. Econometrica 1987, 55, 251–276. [Google Scholar] [CrossRef]
- World Bank. World Development Indicators; The World Bank: Washington, DC, USA, 2017; Available online: http://databank.worldbank.org/data/reports.aspx?source=world-development-indicators (accessed on 15 June 2018).
- GSG Algeria. Journal Officiel, General Secretariat of the Government: Les Vergers—Bir Mourad Rais—Alger. 2017. Available online: http://www.joradp.dz/HEN/Index.htm (accessed on 15 June 2018).
- Zouache, A. The economics of Algeria since indepedence. Vlaams Marxistisch Tijdschr. 2012, 46, 92–98. [Google Scholar]
- World Bank. A Medium-Term Macroeconomic Strategy for Algeria: Sustaining Faster Growth with Economic and Social Stability. Available online: https://openknowledge.worldbank.org/handle/10986/14999 (accessed on 15 June 2018).
- Martin, I. Politique Économique et Stabilité de l’Etat. Centre de Recherches Internationales. Available online: http://www.sciencespo.fr/ceri/sites/sciencespo.fr.ceri/files/artim_0.pdf (accessed on 15 June 2018).
- Brika, S.; Mekarssi, L. Analysis of Algerian trade performance: From 1970 to 2014. J. Behav. Econ. Financ. Entrepreneurship Account. Transp. 2016, 4, 13–17. [Google Scholar]
- Nashashibi, K.A.; Alonso-Gamo, P.; Bazzoni, S.; Féler, A.; Laframboise, N.; Horvitz, S.P. Algeria: Stabilization and Transition to Market; International Monetary Fund: Washington, DC, USA, 1998. [Google Scholar]
- Donatos, G.S.; Mergos, G.J. Residential demand for electricity: The case of Greece. Energy Econ. 1991, 13, 41–47. [Google Scholar] [CrossRef]
- Kamaludin, M. Electricity consumption in developing countries. Asian J. Soc. Sci. Hum. 2013, 2, 84–90. [Google Scholar]
- Ghedamsi, R.; Settou, N.; Gouareh, A.; Khamouli, A.; Saifi, N.; Recioui, B.; Dokkar, B. Modeling and forecasting energy consumption for residential buildings in Algeria using bottom-up approach. Energy Build. 2016, 121, 309–317. [Google Scholar] [CrossRef]
- Zerroug, A.; Refoufi, L.; Dzelzitis, E. Energy consumption trends for industry segments in Northern Africa. Constr. Sci. 2015, 17, 24–30. [Google Scholar] [CrossRef]
- Gupta, M.D. Impact of Lifestyle Pattern on Energy Consumption and Carbon Emissions—A View from India. Available online: http://www.jeaconf.org/UploadedFiles/Document/b4ceee96-f5bd-470a-8df7-504bd7d59cc2.pdf (accessed on 15 June 2018).
- Karanfil, F.; Li, Y. Electricity consumption and economic growth: Exploring panel-specific differences. Energy Policy 2015, 82, 264–277. [Google Scholar] [CrossRef]
- World Bank. World Bank Data, Country Classification, Country and Lending Groups. Available online: https://datahelpdesk.worldbank.org/knowledgebase/articles/906519-world-bank-country-and-lending-groups (accessed on 15 June 2018).
- WITS. Trade Stats, Algeria Trade Statistics, The World Integrated Trade Solution (WITS). Available online: http://wits.worldbank.org/Default.aspx?lang=en# (accessed on 15 June 2018).
- Arisoy, I.; Ozturk, I. Estimating industrial and residential electricity demand in Turkey: A time varying parameter approach. Energy 2014, 66, 959–964. [Google Scholar] [CrossRef]
- Loi de Finances. Loi No. 15–18 du 18 Rabie El Aouel 1437 correspondant au 30 décembre 2015 portant loi de finances pour 2016. J. Off. Republique Algerienne 2015, 72, 3–39. [Google Scholar]
- Fattouh, B.; El-Katiri, L. Energy Subsidies in the Arab World; Arab Human Development Report, Research Paper Series; United Nations Development Programme, Regional Bureau for Arab States: New York, NY, USA, 2012. [Google Scholar]
- Aissaoui, A. Algerian Gas: Troubling Trends, Troubled Policies; The Oxford Institute for Energy Studies, OIES Paper: NG 108; University of Oxford: Oxford, UK, 2016. [Google Scholar]
- McNeil, M.A.; Letschert, V.E. Modeling diffusion of electrical appliances in the residential sector. Energy Build. 2010, 42, 783–790. [Google Scholar] [CrossRef] [Green Version]
- Stambouli, A.B.; Khiat, Z.; Flazi, S.; Kitamura, Y. A review on the renewable energy development in Algeria: Current perspective, energy scenario and sustainability issues. Renew. Sustain. Energy Rev. 2012, 16, 4445–4460. [Google Scholar] [CrossRef]
- Ministry of Energy. Ministry of Energy, République Algérienne Démocratique et Populaire: Alger. 2016. Available online: http://www.energy.gov.dz/francais/index.php?page=bilan-des-realisations-2 (accessed on 15 June 2018).
- Sellami, R.; Merzouk, N.K.; Amirat, M.; Chekrouni, R.; Ouhib, N.; Hadji, A. Market potential and development prospects of the solar water heater field in Algeria. Renew. Sustain. Energy Rev. 2016, 65, 617–625. [Google Scholar] [CrossRef]
- Pitelis, C.N.; Teece, D.J. Cross-border market co-creation, dynamic capabilities and the entrepreneurial theory of the multinational enterprise. Ind. Corp. Chang. 2010, 19, 1247–1270. [Google Scholar] [CrossRef] [Green Version]
- Kolk, A. The role of international business in clean technology transfer and development. Clim. Policy 2015, 15, 170–176. [Google Scholar] [CrossRef]
- Atradius. Atradius Country Reports. Middle East and North Africa; Atradius NV: Amsterdam, The Netherland, 2016. [Google Scholar]
- Santander Bank. Algeria: Foreign Investment. Santander Trade Portal. Available online: https://en.portal.santandertrade.com/establish-overseas/algeria/foreign-investment (accessed on 15 June 2018).
- World Bank. Doing Business 2016, Measuring Regulatory Quality and Efficiency. Available online: http://www.doingbusiness.org/reports/global-reports/doing-business-2016 (accessed on 15 June 2018).
Figure 1.
Graphs of studied variables. DZD *: The Algerian Dinar (national currency of Algeria).

Figure 2.
Residential electricity consumption elasticity with respect to GDP per capita.

Figure 3.
Graphs of the stability test on the residual of Equation (4).


Table 1.
Descriptive statistics.
| Variable | Mean | Max. | Min. | Std. Dev. | Obs. |
|---|---|---|---|---|---|
| Residential electricity consumption (kWh per capita) | 563.22 | 1277.37 | 133.08 | 296.02 | 44 |
| GDP per capita (at constant 2010 US$) | 3646.85 | 4617.51 | 2322.06 | 528.09 | 44 |
| Imports of goods and services (% of GDP) | 27.78 | 42.96 | 18.41 | 5.58 | 44 |
| Real Electricity price (at constant 2010 DZD * per kWh) | 0.48 | 7.03 | 0.016 | 1.11 | 44 |
| Price of electricity (DZD * per kWh) | 1.32 | 2.97 | 0.37 | 1.11 | 44 |
DZD *: The Algerian Dinar (national currency of Algeria).
Table 2.
LM two breaks unit root test (Lee-Strazicich test [53]).
Table 2.
LM two breaks unit root test (Lee-Strazicich test [53]).
| Variable | Break Dates | Lag | t-Statistic | Result |
|---|---|---|---|---|
| elec | 1987/2002 | 4 | −2.730 | Not stationary |
| p | 1994/2000 | 3 | −2.784 | Not stationary |
| imp | 1995/2001 | 7 | −3.713 ** | Breakpoint Stationary |
| y | 1987/2002 | 7 | −4.127 *** | Breakpoint Stationary |
Note: *** and ** denote statistical significance at the 1% and 5%. The critical values for the LM test are −4.073, −3.563, and −3.296 at the 1%, 5%, and 10% levels.
Table 3.
Bounds test to cointegration.
| Critical Values of Bounds Test * at: | |||||
|---|---|---|---|---|---|
| 1% | 5% | ||||
| F-stat value | I(0) | I(1) | I(0) | I(1) | Result |
| 3.91 | 2.26 | 3.35 | 2.62 | 3.79 | Presence of cointegration relationship |
* Pesaran et al. [53], table CI(iii): Unrestricted intercept and no trend.
Table 4.
Estimates of long-run dynamic and short-run dynamic.
| Long-Run Dynamic | Short-Run Dynamic | ||
|---|---|---|---|
| Dependent Variable: elec (A) | Dependent Variable: Delec (B) | ||
| Variables | Coefficients | Variables | Coefficients |
| p | −0.29 *** (0.027) | - | - |
| imp | 0.18 *** (0.056) | Dp | −0.13 * (0.073) |
| y | 1.35 *** (0.145) | Dimp | −0.15 *** (0.061) |
| y2 | −1.85 *** (0.541) | Dimp(−1) | −0.05 (0.060) |
| y3 | −6.13 *** (1.443) | Dimp(−2) | −0.11 ** (0.057) |
| c | −1.16 *** (0.049) | Dy | 0.79 ** (0.333) |
| I87 | −0.13 *** (0.054) | Dy(−1) | −0.05 (0.184) |
| I94-02 | 0.15 *** (0.035) | Dy2 | −1.03 (1.23) |
| trend | 0.05 *** (0.002) | Dy3 | 5.60 (7.113) |
| - | - | C | 0.05 *** (0.009) |
| - | - | I87 | −0.14 *** (0.048) |
| - | - | ECT(−1) | 0.43 *** (0.166) |
| LM-test [p-value] | 1.38 [0.26] | LM-test [p-value] | 0.085 [0.91] |
| Arch-test [p-value] | 1.05 [0.31] | Arch-test [p-value] | 0.10 [0.74] |
| DW | 1.47 | DW | 1.89 |
| - | - | Normality-test [p-value] | 0.78 [0.67] |
| F-Stat | 867.58 | F-Stat | 4.36 |
Note: Standard errors in brackets. ***, ** and * denote statistical significance at the 1%, 5% and 10% levels, respectively. AIC and SC are used to select the optimal lags in the ARDL-model.
Table 5.
Variance inflation factors (VIFs) (Multicollinearity test).
| Variable | VIF |
|---|---|
| y | 3.73 |
| y2 | 2.62 |
| y3 | 4.85 |
Table 6.
Granger causality test.
| Dependant Variable | Short Run Analysis | Long Run Analysis | |||
|---|---|---|---|---|---|
| Delec | Dimp | Dp | Dy | ECMt−1 | |
| Delec | - | 11.89 *** | 7.53 ** | 7.75 ** | 0.037 *** |
| Dimp | 2.29 | - | 2.30 | 3.47 | 0.027 |
| Dp | 1.31 | 1.35 | - | 2.34 | 0.016 |
| Dy | 2.04 | 15.35 *** | 2.30 | - | 0.001 |
Note: The values in the table are obtained from the Wald test based on the chi-square distribution. *** and ** denote statistical significance at the 1% and 5%, respectively.
© 2018 by the authors. Licensee MDPI, Basel, Switzerland. This article is an open access article distributed under the terms and conditions of the Creative Commons Attribution (CC BY) license (http://creativecommons.org/licenses/by/4.0/).
Share and Cite
MDPI and ACS Style
Bouznit, M.; Pablo-Romero, M.P.; Sánchez-Braza, A. Residential Electricity Consumption and Economic Growth in Algeria. Energies 2018, 11, 1656. https://doi.org/10.3390/en11071656
AMA Style
Bouznit M, Pablo-Romero MP, Sánchez-Braza A. Residential Electricity Consumption and Economic Growth in Algeria. Energies. 2018; 11(7):1656. https://doi.org/10.3390/en11071656
Chicago/Turabian StyleBouznit, Mohammed, María P. Pablo-Romero, and Antonio Sánchez-Braza. 2018. "Residential Electricity Consumption and Economic Growth in Algeria" Energies 11, no. 7: 1656. https://doi.org/10.3390/en11071656
Note that from the first issue of 2016, this journal uses article numbers instead of page numbers. See further details here.