Fluid Structure Interaction Modelling of Tidal Turbine Performance and Structural Loads in a Velocity Shear Environment


1
Department of Mechanical Engineering, International Islamic University, Sector H-10, Islamabad Capital Territory 44000, Pakistan
2
Electric Engineering Section, UniKL British Malaysian Institute, Gombak 53100, Malaysia
*
Author to whom correspondence should be addressed.
Energies 2018, 11(7), 1837; https://doi.org/10.3390/en11071837
Submission received: 21 June 2018
/
Revised: 5 July 2018
/
Accepted: 6 July 2018
/
Published: 13 July 2018
(This article belongs to the Special Issue Sustainable Energy Development Strategies: Energy Efficiency and Renewables)
Abstract
:Tidal Current Turbine (TCT) blades are highly flexible and undergo considerable deflection due to fluid interactions. Unlike Computational Fluid Dynamic (CFD) models Fluid Structure Interaction (FSI) models are able to model this hydroelastic behavior. In this work a coupled modular FSI approach was adopted to develop an FSI model for the performance evaluation and structural load characterization of a TCT under uniform and profiled flow. Results indicate that for a uniform flow case the FSI model predicted the turbine power coefficient with an error of 4.8% when compared with experimental data. For the rigid blade Reynolds Averaged Navier Stokes (RANS) CFD model this error was 9.8%. The turbine blades were subjected to uniform stress and deformation during the rotation of the turbine in a uniform flow. However, for a profiled flow the stress and deformation at the turbine blades varied with the angular position of turbine blade, resulting in a 22.1% variation in stress during a rotation cycle. This variation in stress is quite significant and can have serious implications for the fatigue life of turbine blades.
1. Introduction
Tidal current energy is a promising ocean energy resource that is virtually untapped. Analysis tools for understanding tidal current device performance and structural response are still being developed, and the performance of these devices in realistic flow conditions is limited. Scaled experiments and real sea trials can be conducted to further this understanding, however, the integration of the required sensors to characterize these behaviors is challenging and costly. On the other hand, numerical methods can be used to compliment field studies to develop a better understanding of the performance and loading characteristics of tidal current turbines (TCT).
Blade Element Momentum (BEM) is one of the numerical methods that has been used in numerous studies [1,2,3] to characterize TCT performance. Computational Fluid Dynamics (CFD) is the other numerical approach that has also been extensively used in recent years, primarily due to the significant worldwide development of computational resources. CFD studies can resolve the three-dimensional (3D) flow field in the near and far wake of a turbine, and providing detailed flow field information. Numerous TCT performance evaluation studies have been performed in recent years utilizing CFD based on the Reynolds Averaged Navier Stokes (RANS) equation. Mujahid et al. [4] developed a RANS CFD model to replicate the performance of a TCT in an experimental channel and validated it with experimental data. Later they used this model to study the effect of channel blockage on TCT performance. A similar work was performed by Nitin and Arindam [5] to study the performance of a TCT under boundary proximity and different blockage condition. Similarly, Tatum et al. [6] investigated the response of a TCT operating in a profiled flow and subject to surface gravity waves. Tian et al. [7] explored the effect of yaw angle and turbulence intensity on the performance of their TCT through RANS CFD analysis. Liu et al. [8] used RANS CFD study to investigate the effect of blade twist and Nacelle shape on the performance of a TCT. All these studies were based on conventional CFD simulations, where it was assumed that the turbine blades are rigid and the interaction between fluid and structure is ignored. However, in reality tidal turbine blades are highly flexible, especially for large turbines, and undergo appreciable deformation under the effect of fluid pressure. Blade tip deflections of 1.48 m [9] and 1.75 m [10] have been reported for large size turbines with composite blades. In addition, CFD only resolves the flow field and does not provide details of the structural behavior.
TCT’s are always subjected to unsteady hydrodynamic loadings due to unsteady tidal flows [11]. Tidal turbine blades experience alternate flap and edgewise bending, and may also face fatigue failure due to the alternating loads caused by a variety of sources. These loads therefore need to be accurately characterized to avoid early component failures. The flow interactions with tidal turbine blades are very complex and produce unique load time histories and loading spectra. Similarly, the shape of the tidal turbine blades create non-linear stress distributions [12,13], making it highly unlikely to obtain an accurate solution from the common isolated structural analysis techniques. On the other hand, numerical models that can account for Fluid Structure Interaction (FSI) and the hydroelastic behavior of turbine blades are able to provide a better approximation of the turbine performance and details of the structural response. A coupled Fluid Structure Analysis model can effectively solve the fluid field and structural field at the same time, providing a high fidelity solution in both the fluid and structural domains.
Fluid Structure Interaction (FSI) occurs when a fluid interacts with a solid structure in such a way that the fluid pressure causes deformation to the structure, and the deformed structure in return alters the flow field. The FSI can be performed with an Integrated, uncoupled and coupled approach. A detail discussion about these FSI methods is not within the scope of this paper, except the loosely coupled modular approach that has been used in this study. A detail discussion about these FSI methods is available in [13]. The loosely coupled modular approach is an independent domain approach where the flow field and structural fields are solved explicitly and do not require any modification to the CFD or Finite Element Analysis (FEA) code. Instead, it uses a coupling scheme as a “black box” to manipulate the output of CFD and FEA to feed it back to the other program successively. The success of the loosely coupled modular approach for analysis of marine propellers is proven [12], but their use for tidal turbine is limited and will require further understanding to use it effectively. Limited studies on the FSI modelling of tidal turbine are available in the current literature. Kim et al. [14] used an uncoupled FSI technique to study the performance and structural integrity of an ocean current turbine. Jo et al. [15] used a similar approach to analyze the deformation of various TCT monopile designs. Nicholls-Lee et al. [16] used a loosely coupled modular approach to assess the performance of new concept (i.e., bend twist coupled) blades made from adaptive composite. Tatum et al. [17] also used coupled FSI modular approach to study the effect of wave current interaction on the performance of TCT. An uncoupled approach of [14,15] can only model minimal, non-linearity, and small perturbation. Nicholls-Lee et al. [16] used a modular approach, but used a lower fidelity 2D panel code to model the flow. The only study to use a similar technique to the current study was Tatum et al. [17]. However, both the studies [16,17] focused exclusively on modeling the flow field and not the structural response. The need for TCT FSI studies focusing equally on the fluid and structural response has been highlighted by several recent studies [11,17]. But to the best of author knowledge no such study has been reported so far due to the associated computational cost. However, several modifications can be made to already establish procedures for performance and structural studies of TCT using a loosely coupled modular FSI approach to reduce its computational time. The current paper is a contribution to the development of such an FSI model, with low computational time in addition to providing other useful information on the turbine performance and structural behavior in a velocity shear environment.
In this study, an experimentally validated steady state CFD performance model of a scaled turbine rotor was extended to a transient CFD model. The transient CFD model was then coupled with a Finite Element Analysis (FEA) module through system coupling in ANSYS workbench (2018) to perform coupled FSI analysis of the TCT. This was a two-way coupled modular FSI model that could only be run at significant computational cost. This model was then successively converted into the more computationally efficient one way coupled modular FSI model, having the same accuracy as the earlier model. This computationally efficient one-way FSI model was then used to study the effect of velocity profile on the performance and structural loads encountered by a TCT. Structural load characteristics of the turbine blades for both uniform/plug flow and profile flow were also compared.
2. Modeling Approach
The TCT rotor utilized for this study is a 1:40 scaled model of the U.S. Department of Energy (DOE) Reference Model (RM1). This is a non-proprietary Reference Model (RM) developed as a study object for open-source research and validation of the numerical models. This two-bladed rotor has a diameter of 0.5 m. Details of the turbine, blade design, experimental setup, experiments and results are reported in [18]. The optimum Tip Speed Ratio (TSR) of 5.11, corresponding to an angular velocity of 21.48 rad/s, was selected as the calculation condition for this study.
2.1. Transient CFD Model Setup
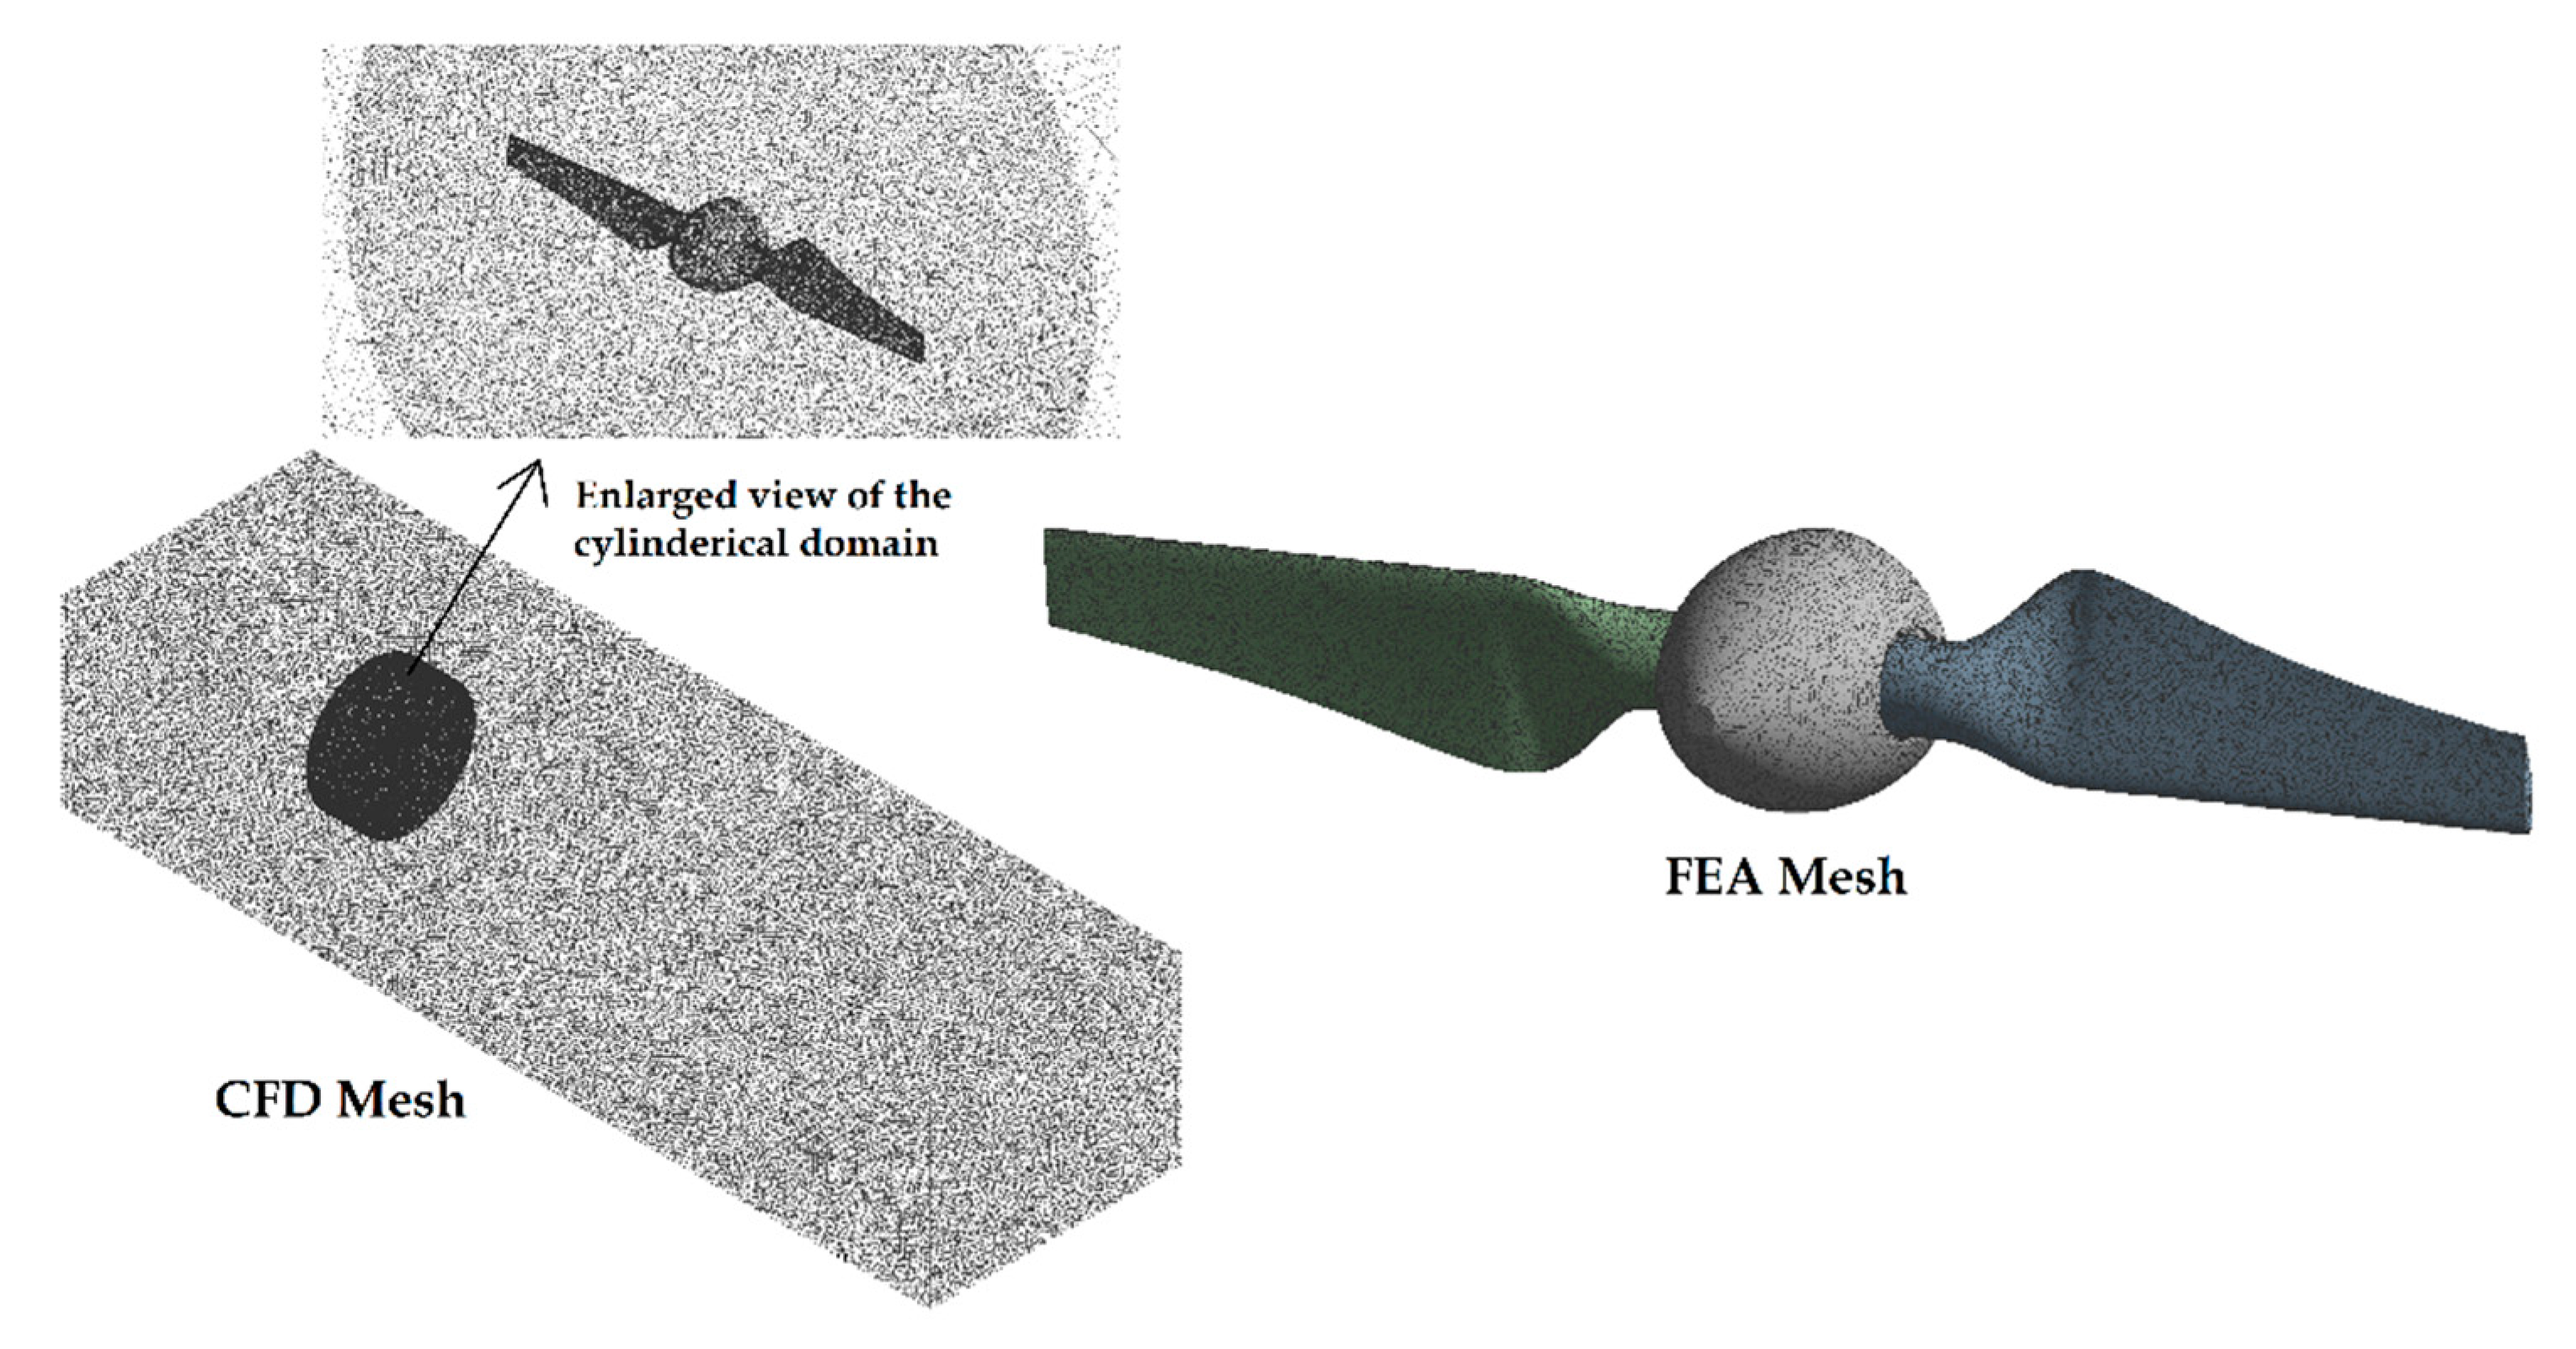
The Transient CFD model used in this study was an extension of the Steady State CFD model developed and validated with experiment in one of our previous studies [4]. A rectangular domain of [1.375 × 1 × 4.755 m] as shown in Figure 1 was used to match the experimental conditions.
A transient rotor stator approach was adopted to solve the Unsteady Reynold Averaged Navier Stokes (URANS) equations. In this approach the inner cylindrical domain containing the rotor is physically rotated using a sliding mesh approach at every time step. The cylindrical domain had a diameter of 0.70 m and 0.23 m length to model the rotation of the turbine about an axis. A plug flow or uniform velocity condition of 1.05 m/s and uniform turbulence of 5% intensity was specified at the inlet. The outlet was set as a pressure outlet with floor and side wall of the tank set to a no slip walls. For no slip walls the fluid immediately next to the wall assumes the velocity of the wall, which is zero by default. This boundary condition was the most appropriate to represent the physical model of experimental water channel in this study since these experiments were conducted in a flow tank and not a towing tank. The side wall representing the longitudinal centerline of the test tank was specified as a symmetry boundary. Rotor of the turbine was assigned a no slip condition. The interface condition of General Grid Interface (GGI) was used for all the three interfaces connecting the stationary and rotating domains.
The mesh used for the CFD domain (see Figure 1) in the coupled analysis was a tetrahedral mesh with a total of 3.98 million elements. A higher density mesh of about 1.92 million elements was generated in the cylindrical domain. Sixteen prism layers were generated around each blade with a first layer thickness of 0.017 mm and growth rate of 1.2 to capture the flow separation at the blade. A minimum of 10 layers are required in the boundary layer to take advantage of the high accuracy SST turbulence model with an automatic wall function model [19]. Value of the dimensionless wall distance (y+) was less than 4 for all the simulated TSRs. The detailed mesh independence study for the CFD model used in this study has been provided in [4].
The total simulation time for the turbine was 0.6 s to model two full rotations of the turbine. A time step equivalent to 2° of the turbine rotations was set as 0.0016 s in view of the numerical stability, accuracy and computational expense. This time step has been found to provide acceptable results for the turbine performance parameters in several previous studies like Nitin and Arindam [5]. A moving mesh method was used to model rotation of the cylindrical domain at the selected angular velocity. The mesh displacement option was set to the regions of motion specified and displacement relative to the initial mesh. The mesh motion option for the rotor was set to the system coupling to allow for the deformation of the rotor blades at each iteration that will be received from the FEA module. A general connection interface model was used with a frame change model of transient rotor stator and a mesh connect method of General Grid Interface (GGI). The solution was initiated with the previous completed steady state CFD solution.
2.2. FEA Model Setup
The transient structural component system within ANSYS Workbench was used for the FE analysis. The RM1 turbine design geometry used for the CFD analysis was shared between the FE and CFD modules. A patch confirming method was used to generate tetrahedral mesh elements with body sizing of 2 mm applied to the blades and hub. The FE model for the rotor was meshed with sloid elements (solid 187) and discretized into 0.89 million elements containing 1.3 million nodes (see Figure 1). Solid 187 is a 10 node, 3-D element with large deflection and strain capabilities. It is a higher order element with quadratic displacement behavior suitable for irregular meshes. The mesh was different to the CFD mesh and was more suited for the FE analysis. The loosely coupled modular approach has this advantage to use different meshes for the CFD and FE analysis. The turbine blades and hub were modelled as solids made from structural steel. This simplification was required to lower the model complexity at the initial model development phase. The use of steel blades will not affect the findings of this study and its relevance to real turbine blades made from composite materials. Because this study is focused on investigating the effect of blade deformation on performance and load characteristic of turbine. The overall behavior of variation in performance and load characteristics will remain same irrespective of the blade material. The use of steel instead of composite material will only change the amount/magnitude of blade deformation/stress which is not the focus of this study the analysis setting for the FE analysis was set such that to match the CFD settings with a time step of 0.0016 s and total time of 0.6 s. To include the effect of centrifugal forces the rotor was assigned an angular velocity of 21.48 rad/s for rotation along the X-axis to match the rotational velocity assigned in the CFD domain. A remote displacement boundary conditions was applied at back face of the hub and large displacement was assumed. Remote displacement is a type of constraint that enables to apply rotation at an arbitrary location in space. A fluid solid interface was specified at the surfaces of the two blades to enable the data transfer between the CFD and FE analysis.
2.3. System Coupling Setup
The system coupling component system was used within ANSYS Workbench to perform coupled CFD and FE analysis. End time and time step setting for the system coupling setup were the same as for the CFD and FEA modules. Two data transfers were created for the two-way FSI analysis with fluid solid interface comprised of all the blade surfaces as the contributing region from the FEA system and rotor region also comprised of the same blade surfaces from the CFD system. One of the data transfer was transferring the fluid force from the CFD model at the rotor region to the fluid solid interface region of the FEA system. The second data transfer was responsible for transferring the incremental displacement at fluid solid interface region in the FEA system to the rotor region as mesh displacement in the CFD system. In this simulation setting the CFD model is first solved to the target residual convergence of 1 × 10⁻⁴ to provide the fluid force exerted on the rotor region. The FEA system is then started by the system coupling and the force data is transferred to the specified fluid solid interface region in the structural model to obtain a converged solution of the displacement data. The displacement data is transferred back to CFD module. The system coupling performs mesh deformation with the selected mesh deformation settings. The process is iterated for the number of defined coupling iterations till the completion of all the coupling steps.
3. Results and Discussion
3.1. Development of the FSI Model
In order to develop a computationally efficient numerical model with acceptable accuracy, initially an FSI simulation with two-way data transfer was setup to simulate two rotations of the turbine because it was expected that the transient solution data for the 1st rotation would not be settled [17,20]. The current study requires settled solution data for at least one complete rotation of the turbine in both CFD and FEA modules. The CFD, FEA and system coupling system were setup as described in Section 2. Both the CFD and FE analysis were run with a parallel configuration at a shared memory workstation. The CFD solver was run with thirty six processors and the mechanical solver used two processors. The solution for this simulation took about 283.3 h (12 days) to complete. Similar, computational time has also been reported by other authors like Kim et al. [14] as 10 days and Morris et al. [21] as 340 h (14 days) for FSI analysis of the TCT with almost similar setup, computational resources and convergence criteria.
In order to obtain the same fidelity results with a reduced computational time, this simulation was successively modified. An uncoupled transient CFD solution was obtained for two rotations of turbine with the same spatial and time discretization as used for the CFD setup in the first FSI Simulation. This CFD solution was used to initialize a two-way coupled FSI simulation for a total simulation time of 0.29 s corresponding to one complete rotation of the turbine instead of two rotations. The rest of setup for CFD, FEA and system coupling were same for both simulations. This modification reduced the solution time to about 105.6 h (4.4 days) with almost similar settled results (i.e., numerical results does not change much as the simulation proceed from one time step to the next) for one complete rotation of the turbine in both the CFD and FEA domains.
The third FSI simulation was similar to the 2nd FSI simulation but only a one-way data transfer was established because the resulting structural deflection from the first two simulations was minimal. In this simulation only the force data from the CFD module was transferred to the FEA module at every time step. But the CFD module was not receiving the mesh displacement data from the FEA module. A considerable reduction in the computational time was achieved with this approach and the solution completed in about 58.3 h (2.4 days).
CFD and FEA mesh used for the all simulations in this study was same as described in Section 2.1 and Section 2.2. The loosely coupled modular approach allows to separately discretize the CFD and FEA domains to better meet the refinement requirement of each domain. But this advantage also leads to the challenge of accurately passing the boundary information from one computational domain to the other. The coupled simulation through ANSYS system coupling provides a mapping summary at the start of simulation. This mapping summary describes the percentage of nodes and areas being mapped for the data transfers used. The mesh setups used in the simulations for this study resulted in almost 90% of the nodes mapping between both the data transfers. Since accurate determination of the blade deformation was not the focus but rather to study the effect of deformation on performance and structural loads. Therefore, the achieved mapping percentage was considered sufficient for this study. The comparison between the computational time and thrust force predictions obtained from all the three FSI simulations is provided in Table 1.
The comparison between the experimental data for turbine performance, uncoupled steady state CFD model and the three FSI simulations is as seen in Figure 2. The coupled two-way FSI simulations under predicted the torque and thrust values that are closer to the experimental data as compared to the uncoupled CFD and one-way coupled FSI simulation. This finding is in contrast to [17,22] where the authors have attributed the increase in performance with deformed blades to the fact that their undeformed blades were not in optimum position. The two-way coupled FSI simulations predicted CP with an error of 4.8% with the experimental data compared to an error of 9.8% by the rigid body steady state CFD and one-way coupled FSI model. These results are also in accordance with the physical observation that the performance of the turbine will decrease as its blade are deformed. The thrust force is the other most important parameter that needs to be accurately predicted for the determination of flap wise bending. A similar plot for the thrust coefficient could have been very useful but the experimental data for thrust force was not available. Table 1 clearly shows that the difference in thrust prediction is negligible for all the FSI simulation and a clear reduction in the computational time has been achieved without any compromise on the fidelity of the solution.
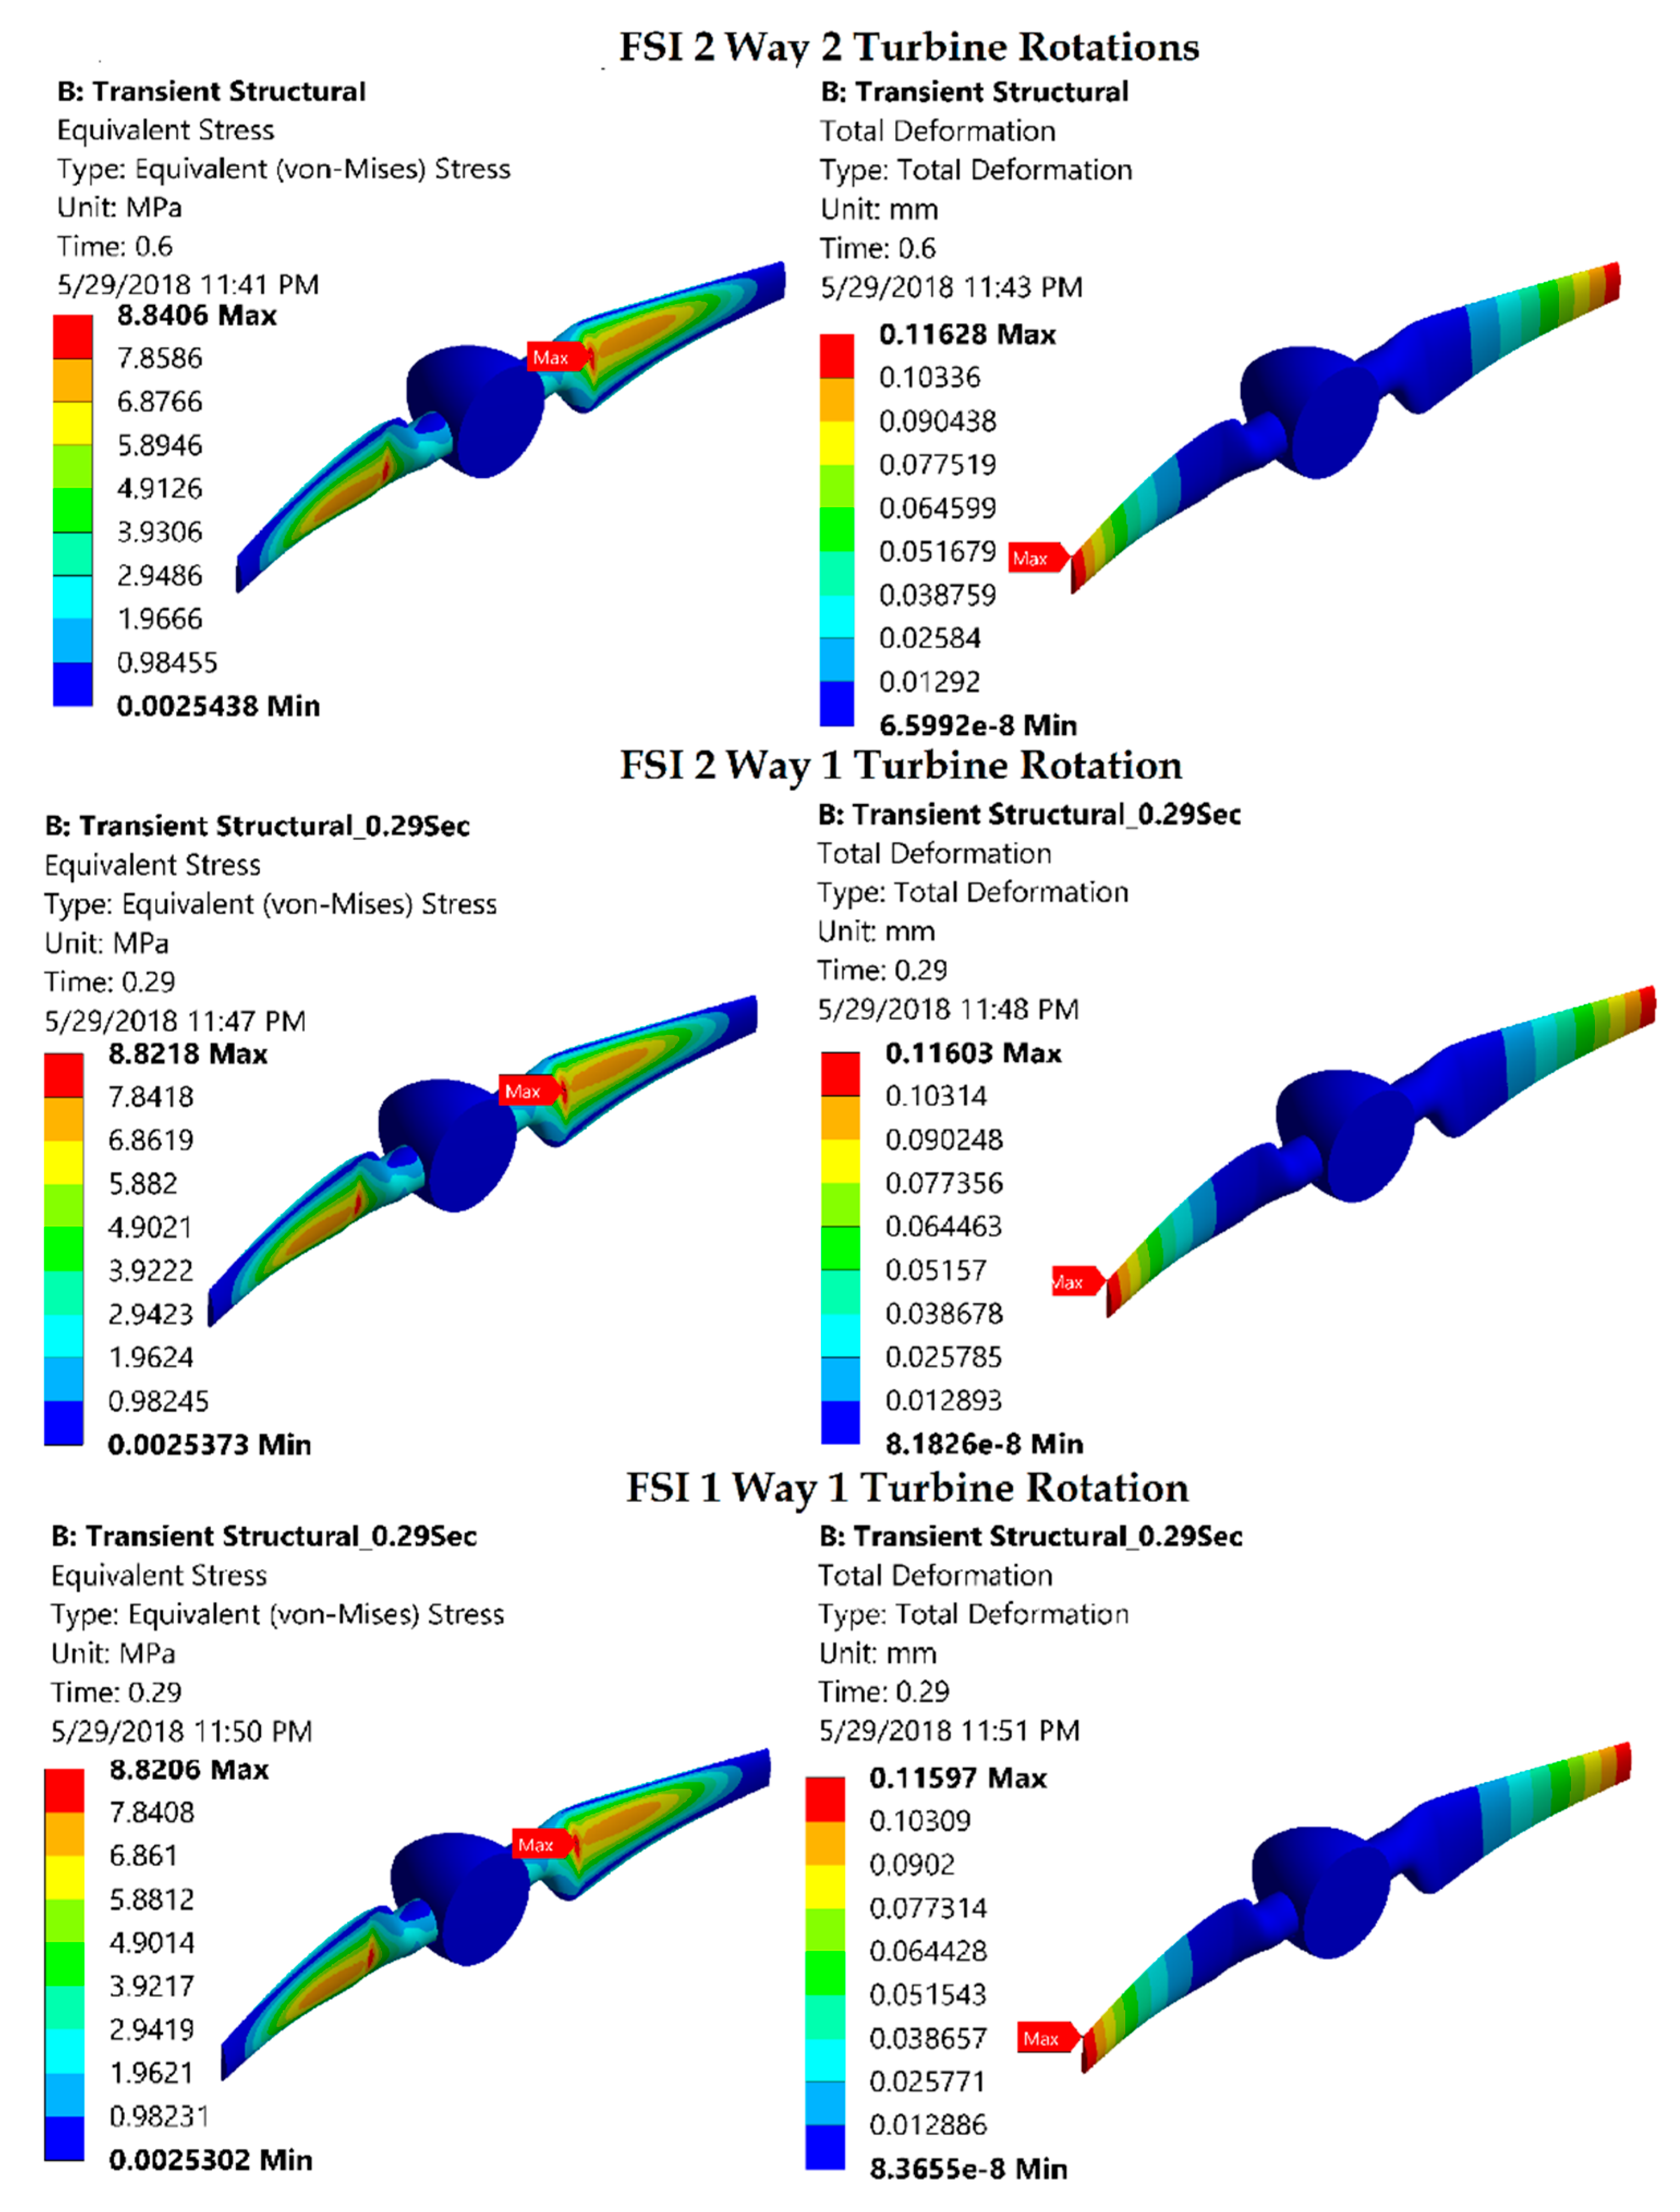
Although the CFD results are almost similar for all the FSI simulations but it is equally important to compare the results of the FE analysis system. Figure 3 and Figure 4 clearly show that the blade deformation and equivalent stress prediction of all the three FSI simulation is almost similar for one complete rotation of the turbine. First two data points for the one rotation models showed a difference because the simulation had just started. This is a very normal behavior because every simulation takes few time steps before the solution data is completely settled. In addition, the qualitative plots for the deformations and stresses were also same as shown in Figure 5. At the last time step of the turbine rotation almost identical values of the maximum equivalent stress on rotor of 8.84 MPa, 8.82 MPa and 8.82 MPa are obtained from the three FSI simulations. Similarly, the maximum total deformation on rotor at the last time step is also predicted with almost similar values of 0.12 mm by the three FSI simulations. In addition, similar location for the maximum stress and deformation on the blade has been provided by all the three FSI simulations (see Figure 5). It is however, very important to highlight that these results are similar because the maximum deformation of structure is only 0.12 mm for the simulated turbine design which is negligibly small. Because in this study solid blades made of structural steel are used and the turbine diameter is also very small. The actual turbines have larger diameters and their blades are made from composite materials with hollow sections. For cases with more expected blade deformation the one-way data transfer will not closely model the real situation and the results will not match those of the two-way data transfer models. However, for the current study the FSI model with one-way data transfer simulating one turbine rotation is considered adequate due to its computational efficiency and accuracy.
3.2. Effect of Velocity Profile on Performance and Structural Loads
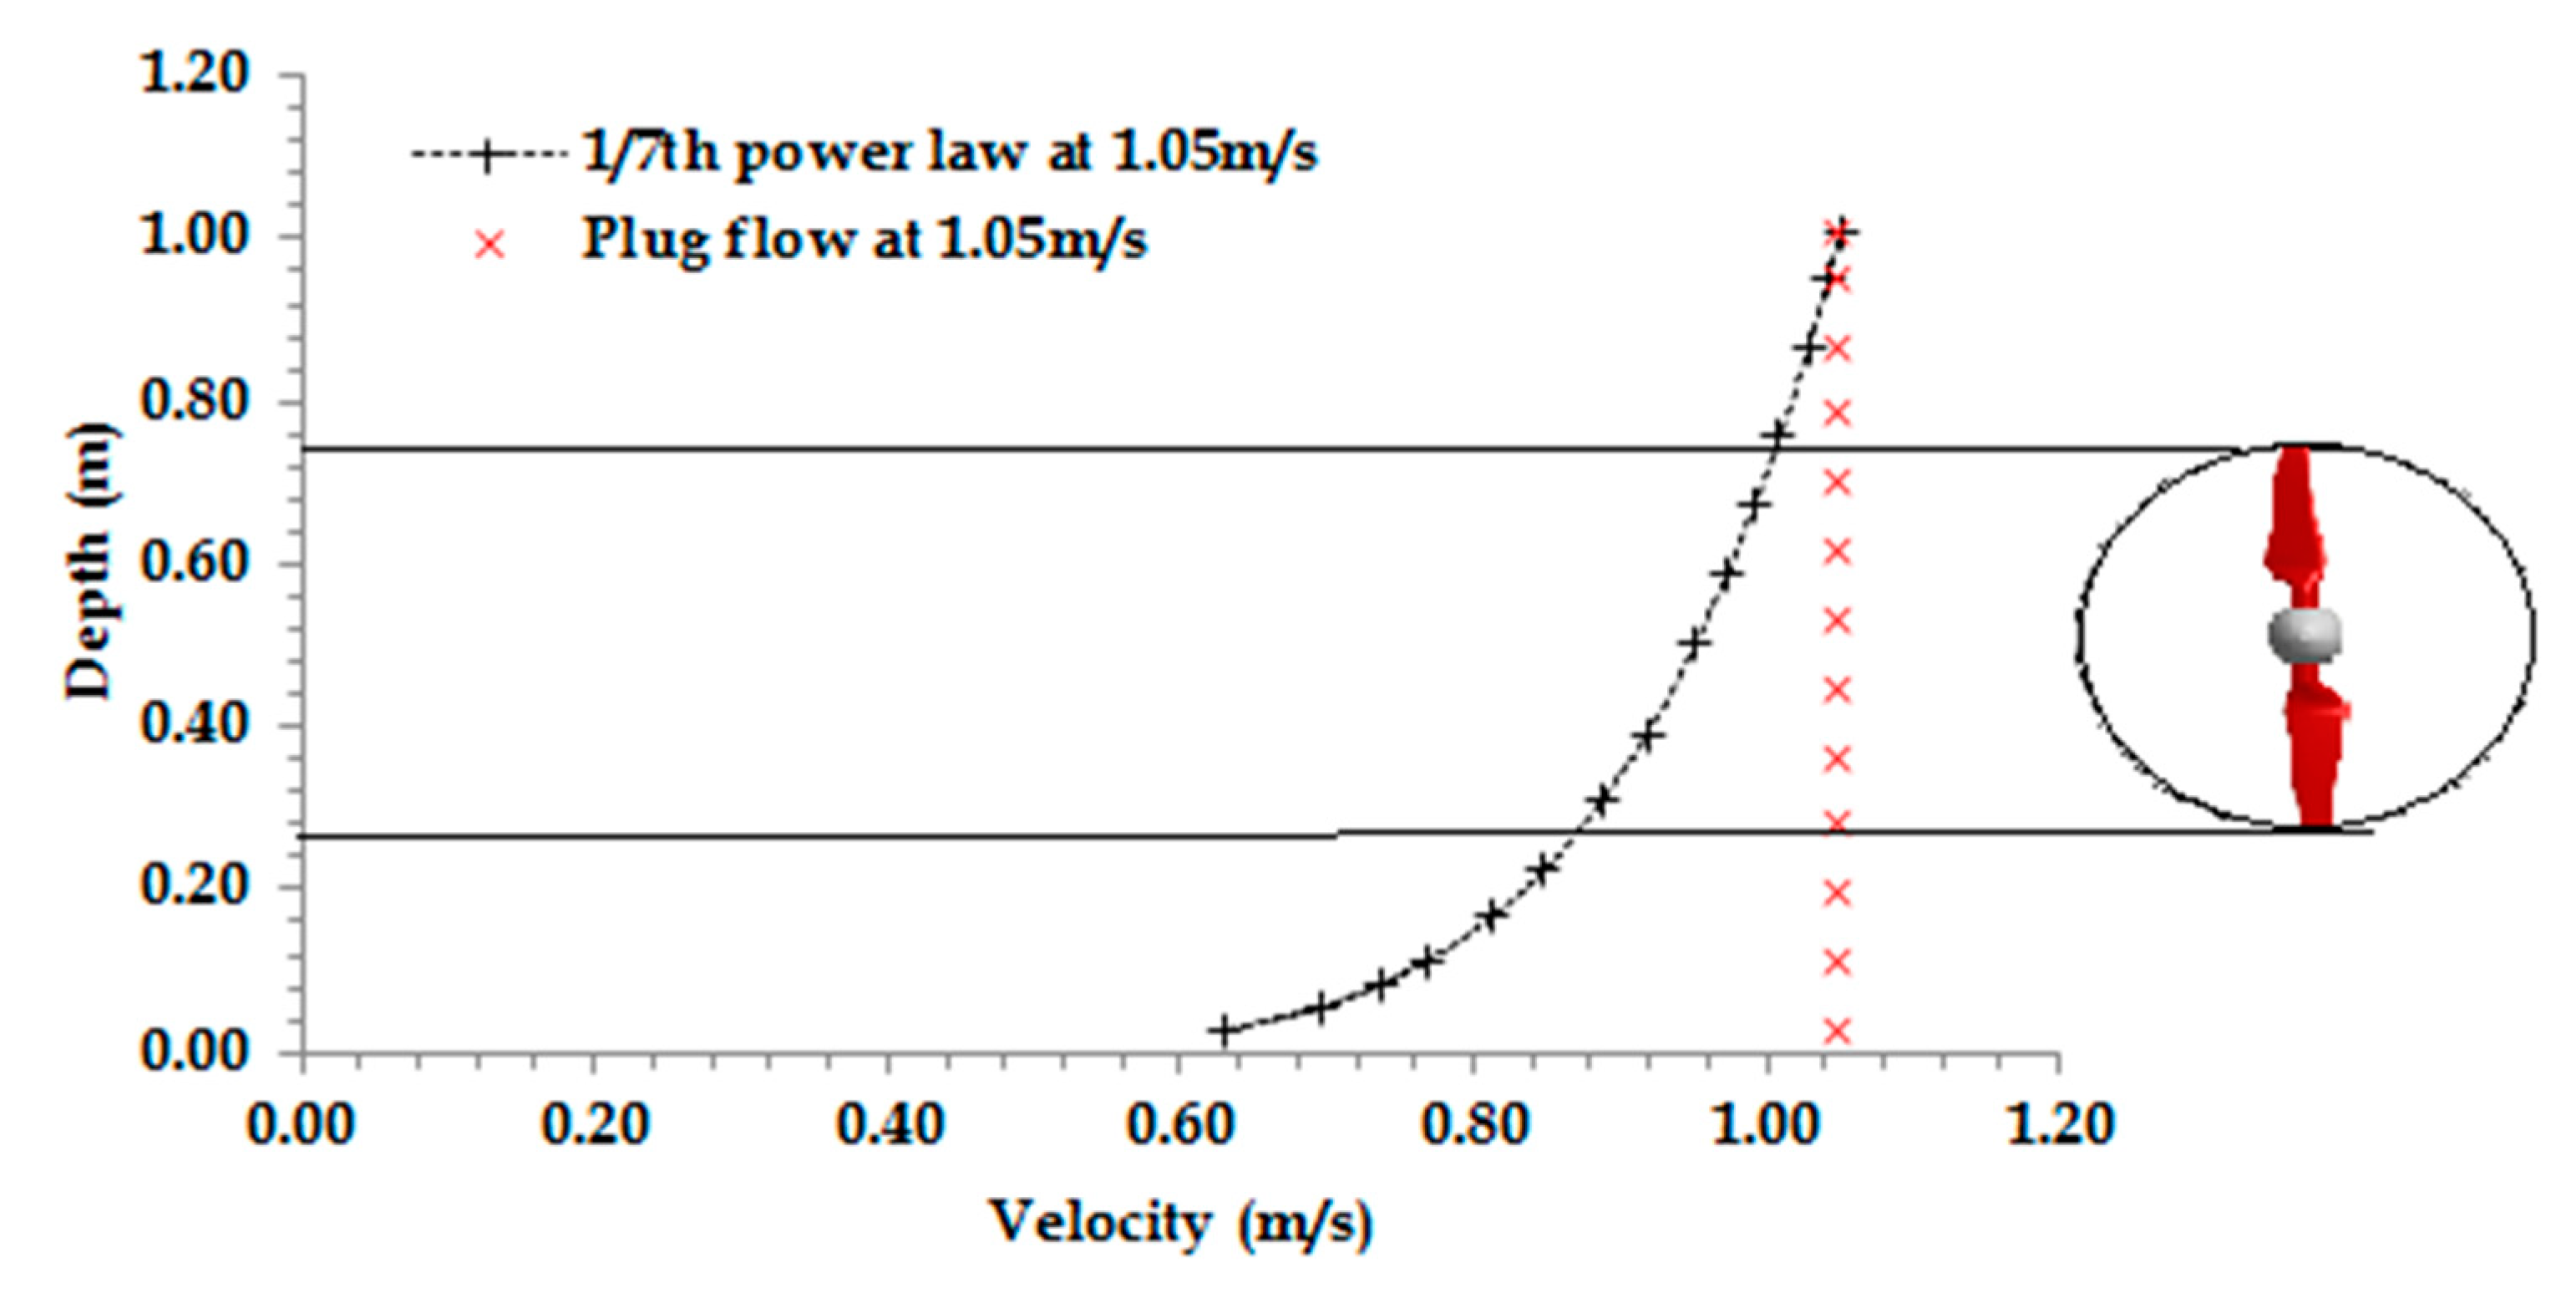
The one-way one rotation FSI model was used to study the effect of shear velocity profile on the turbine performance and structural loads. It has been clearly established that this model can account for the Fluid Structure Interaction and hydroelastic behavior of the turbine blade similar to that of a two-way coupled model simulating two turbine rotations for the case study presented in this paper. A transient CFD model was setup with the same settings as those described in Section 2.1 except that the uniform/plug flow velocity condition of 1.05 m/s was replaced with a velocity profile of 1/7th power law at 1.05 m/s as shown in Figure 6. The 1/7th power law profile has been successfully used in a rigid blade CFD study by [23] to represent the velocity shear profile for the data collected at seven estuary sites.
An uncoupled CFD simulation was run as a CFX multi configuration simulation to first solve a steady state solution followed by a transient simulation initialized by the steady state solution. The torque and thrust prediction for the uncoupled steady state CFD simulation with profiled velocity (shown in Figure 6) at the inlet was 0.454 Nm and 56.63 N. Similar values of torque and thrust were predicted by the uncoupled transient CFD simulation for the two turbine rotations. Following this a coupled one-way one turbine rotation FSI simulation was performed with the same setup as described in Section 2.1, Section 2.2 and Section 2.3, except that a profiled inlet velocity boundary condition was used with the velocity profile of Figure 6. The CFD system of this coupled analysis was initialized with the uncoupled transient simulation for the velocity profile boundary condition. This FSI simulation predicted similar CFD results as in the uncoupled rigid body CFD simulations because only a one-way data transfer was established and the blade deformation data was not transferred from the FEA to CFD module.
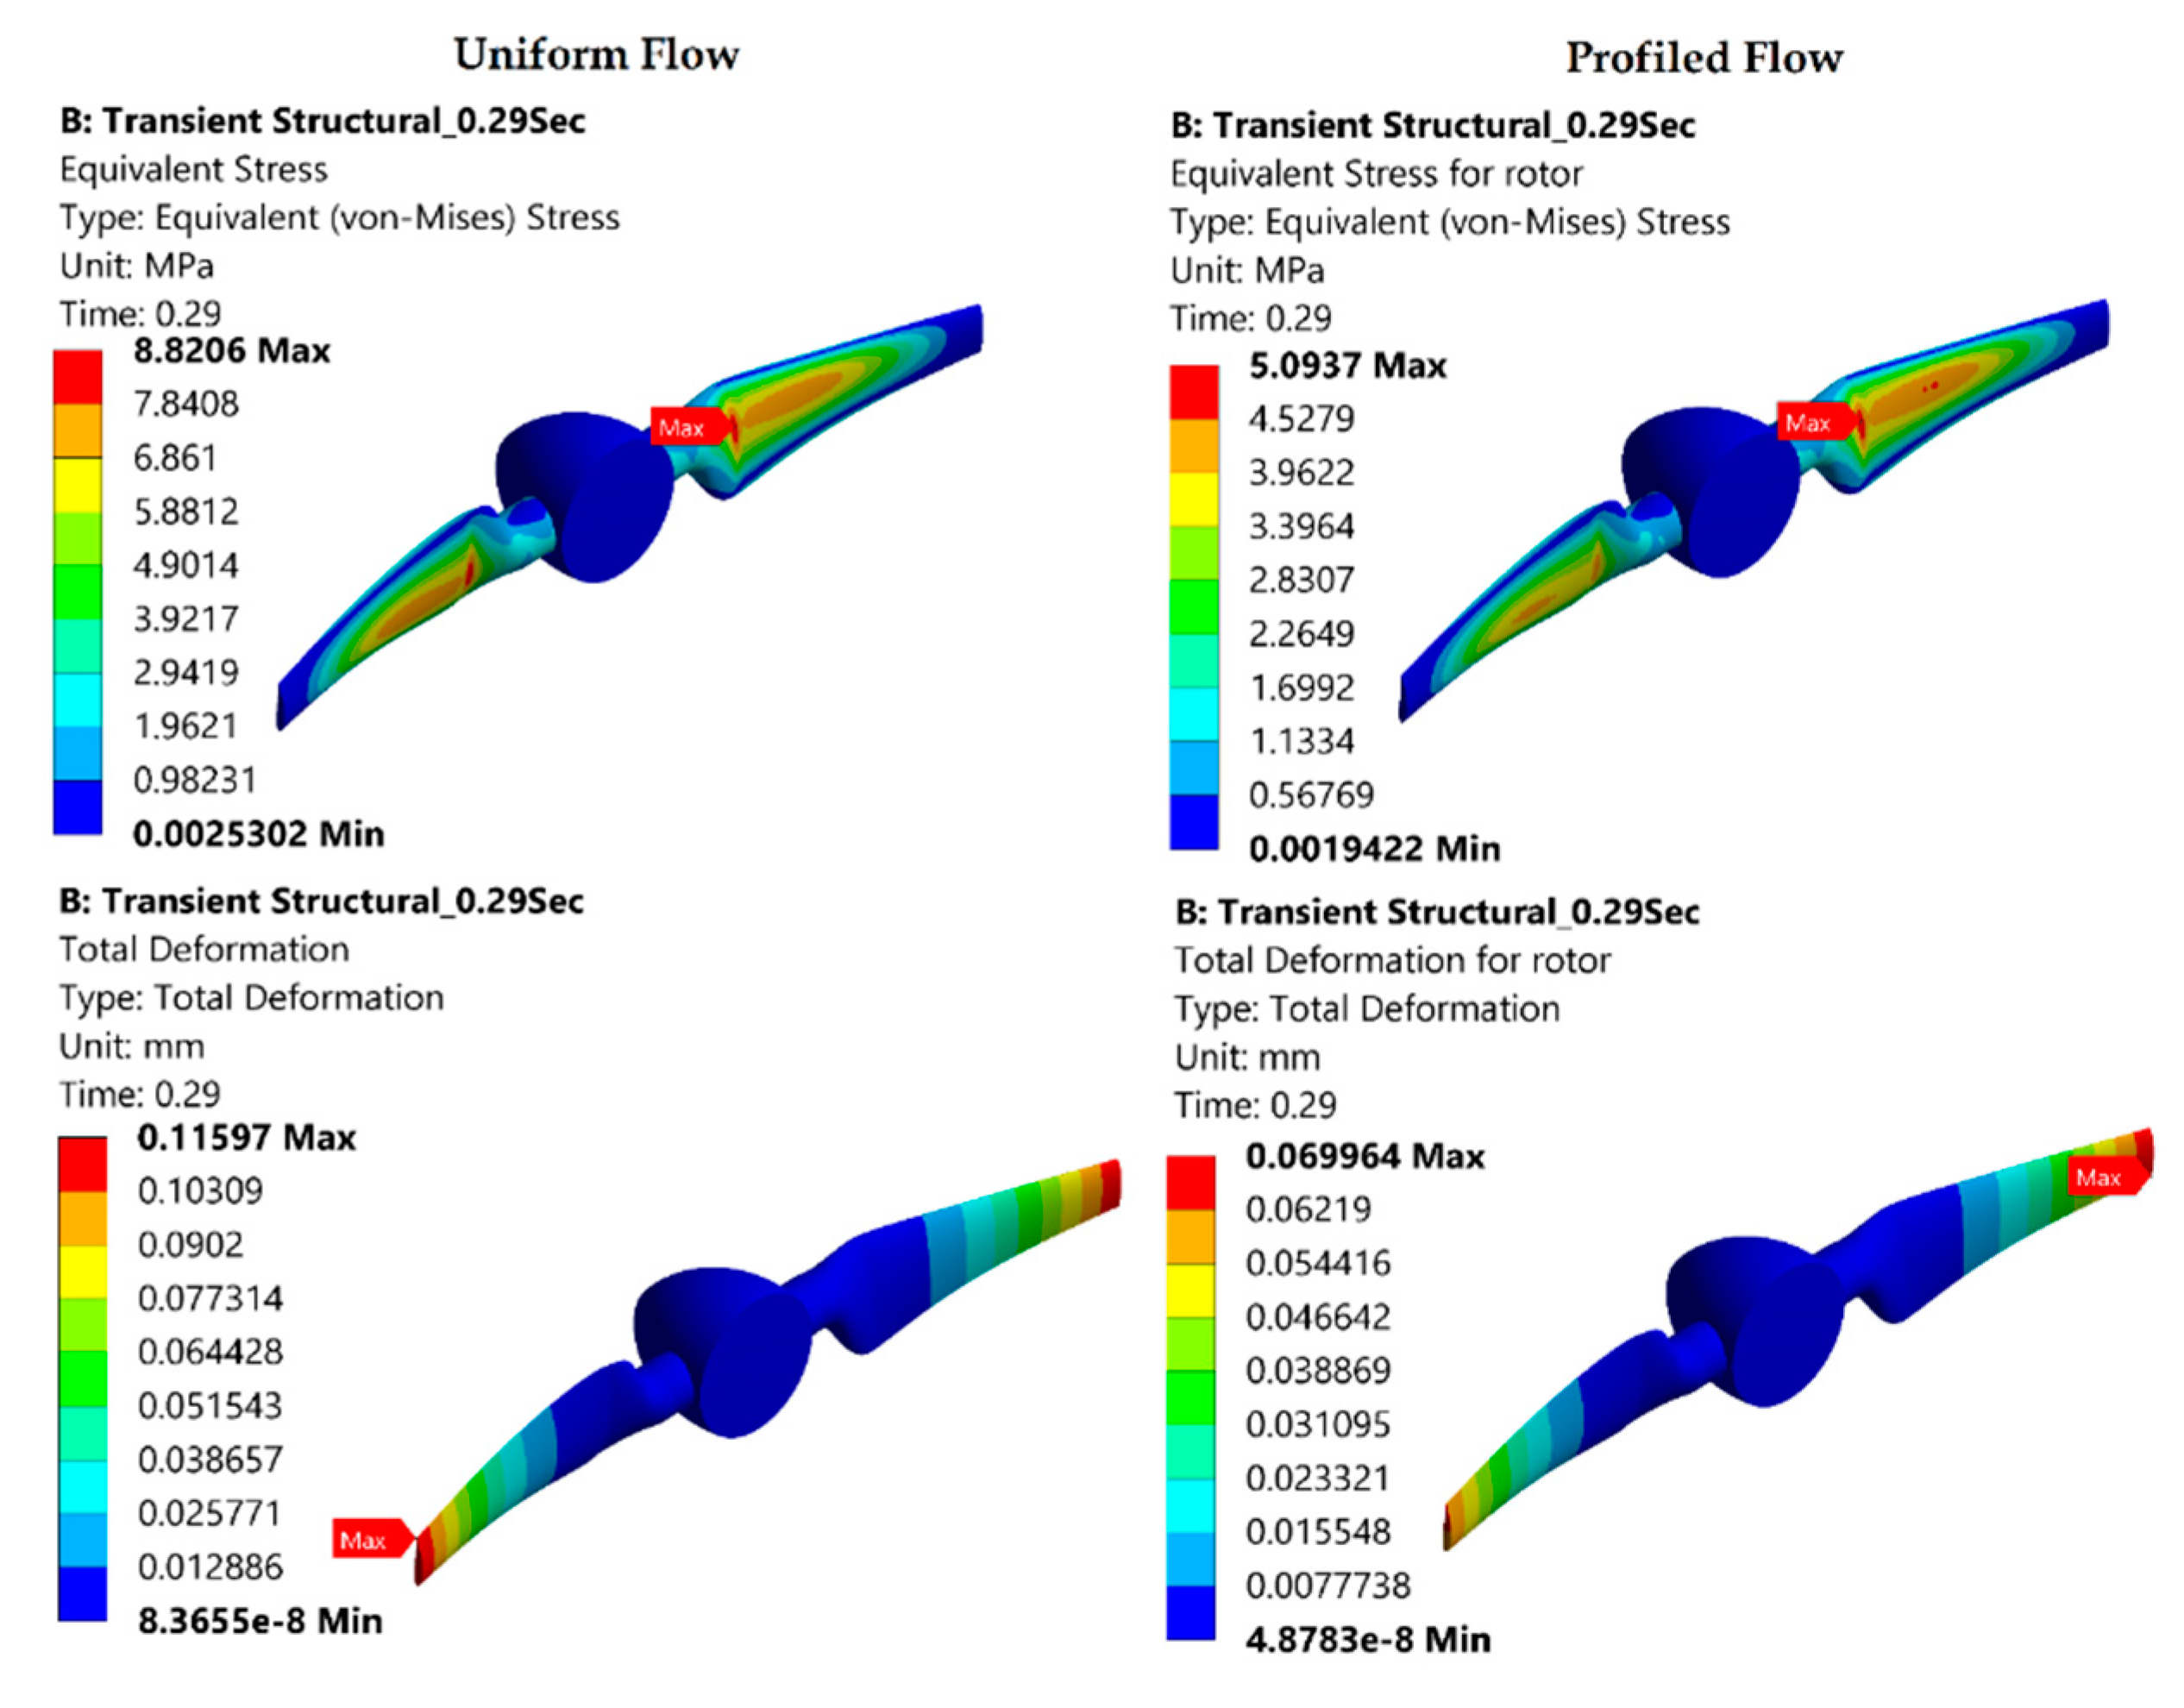
For both the flow cases maximum stress occurs at the root section of the blade where the transition region starts and maximum deformation occurs at the blade tip (see Figure 7). The location of maximum stress and deformation also does not change between uniform and profiled flow case as evident from Figure 7. However, the magnitude of equivalent stress and deformation on rotor has reduced for profiled flow compared to a uniform flow case.
At the individual blade level the stress and deformation at different angular positions along the rotation cycle of the turbine is almost similar for both the blades for a uniform flow case (see Figure 8). At the start of the flow the blades experience considerable deformation and then retains its deformed shape with negligible variation in the deformation and stress.
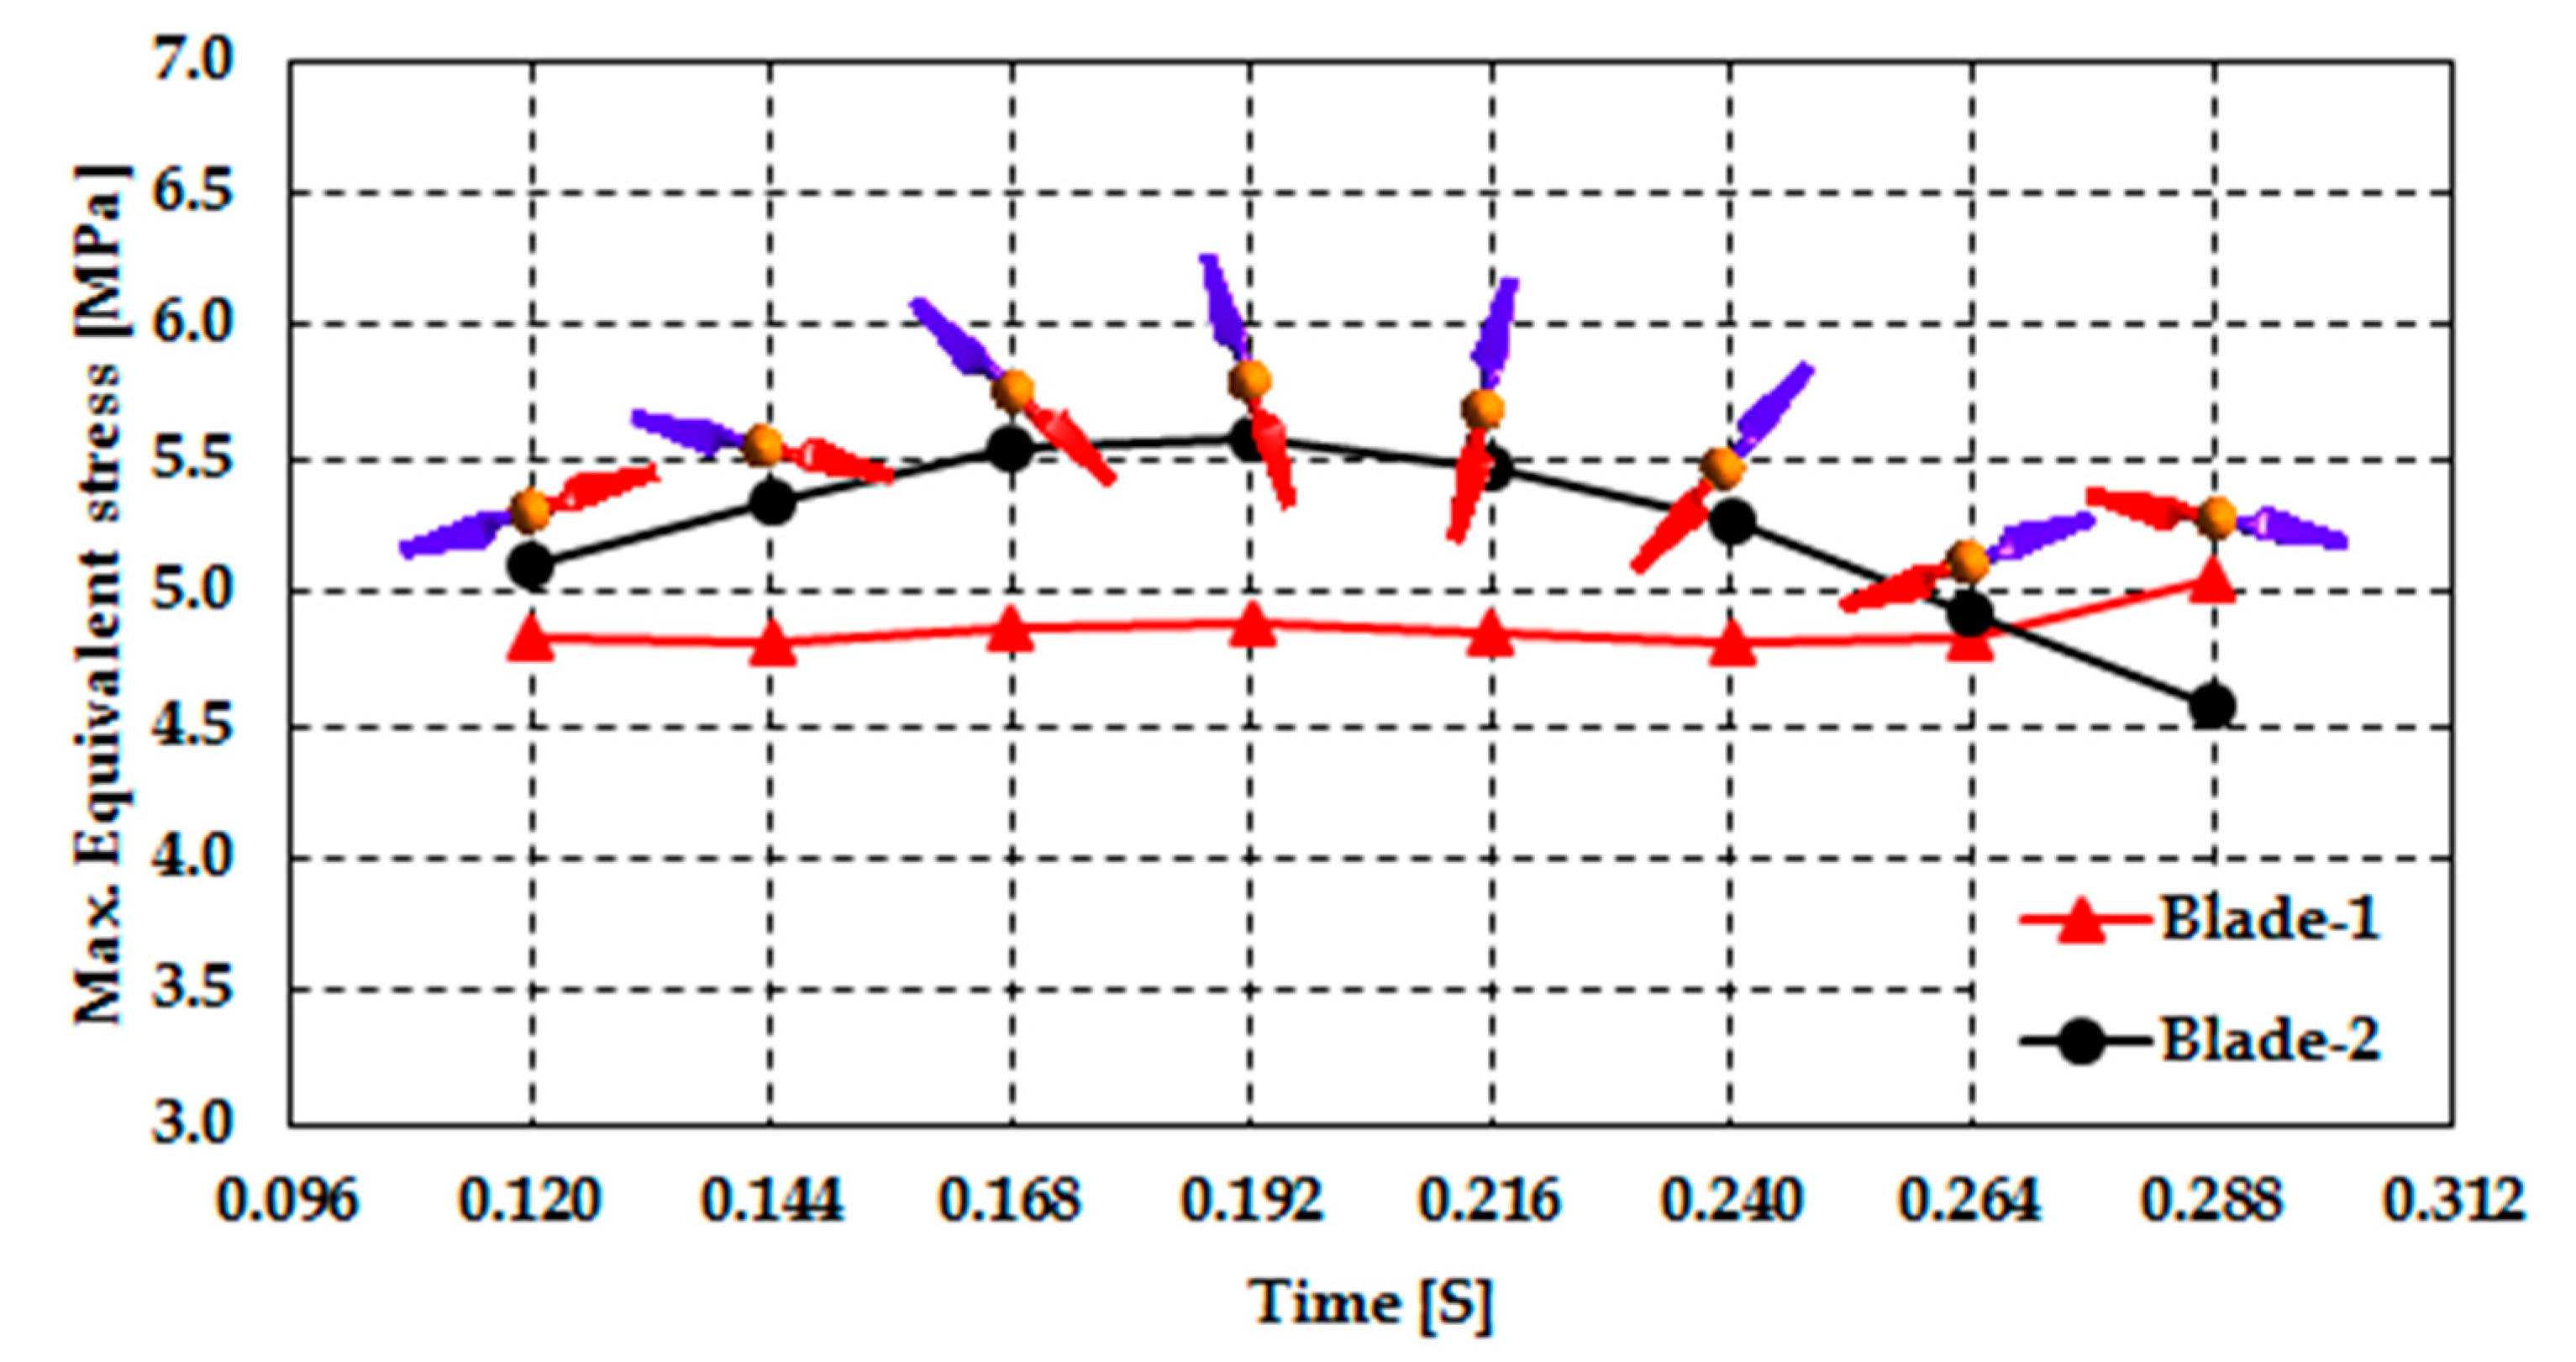
However, for a profiled flow case different fluid velocity is experienced by the individual turbine blades. Similarly, different velocities are experienced along the length of the same blade. The velocities on individual blades and along the blade length also changes with the rotation of the rotor at different angular positions. These velocity variations results in variation of the corresponding stresses and deformations. This phenomenon can be clearly observed in Figure 9.
The minimum and maximum equivalent stress values for an individual blade during a rotation cycle are 4.6 MPa and 5.6 MPa, respectively. This gives a maximum stress variation of 22.1% for a blade in one rotation cycle. For larger turbine designs this variation can further increase. The variation in stress state of the individual turbine blade in shear flow environment along the rotation cycle of the rotor can also cause fatigue failure.
4. Conclusions and Prospects
In this study a coupled FSI model was developed for the performance evaluation and structural loads characterization of a TCT. The loosely coupled modular FSI approach was adopted by utilizing the ANSYS system coupling, CFX and Transient structural systems. All the FSI simulations predicted the same value for turbine power coefficient (). The FSI simulations provided a better prediction of turbine when compared with experimental data than RANS CFD, with an error value of 4.8% and 9.8% respectively. Both the one way and two-way data transfer models provided similar results for stress and deformation, due to minimal deflection of the turbine blade. The one-way data transfer model was used to study the effect of a profiled flow on the performance and structural loads of the TCT. The FSI model also under predicted the turbine and thrust by 12% and 6% compared to the rigid blade RANS CFD model for the profiled flow case. For the uniform flow case, both the blades of the turbine experienced uniform stress and deformation throughout a rotation cycle. For a profiled flow case, the stress and deformation varied at the blade as a function of angular position throughout a rotation cycle of the turbine. The maximum variation in equivalent stress of 22.1% was observed for a blade during a complete rotation cycle due to the effect of velocity shear. This considerable variation can cause fatigue failure of the turbine blades.
In this study a model scale rotor with solid blades made from structural steel placed in an experimental channel was simulated. The tower and nacelle were also not included for simplification at this model development stage. Future work will consider a real size turbine with more flexible hollow blade sections placed in real size tidal channel. The tower and nacelle will also be included to study the effect of profiled flow on the fatigue life of the turbine.
Author Contributions
M.B. performed all the simulations and post-processed, analyzed the results, and wrote the manuscript. S.B. and K.K. analyzed the simulation results and revised the manuscript. All authors read and approved the final manuscript.
Funding
This research was funded by Higher Education Commission (HEC) Pakistan under grant number Pin#2EG1-384” and “The APC was funded by UniKL British Malaysian Institute Malaysia”.
Acknowledgments
The authors gratefully acknowledge the support of Department of Aeronautics and Astronautics at the Institute of Space Technology Islamabad for providing computational facilities at the modelling and simulation lab. The Higher Education Commission (HEC) Pakistan is also acknowledged for its financial support to scholar Mujahid Badshah, Pin#2EG1-384. The authors also thank James H VanZwieten, Southeast National Marine Renewable Energy Center, Florida Atlantic University, Boca Raton, Florida, USA for contributing to the revised version of this paper.
Conflicts of Interest
The authors declare no conflict of interest.
References
- Badshah, M.; Badshah, S.; Khalil, S.J. Hydrodynamic design of tidal current turbine and the effect of solidity on performance. J. Eng. Appl. Sci. 2017, 36, 45–54. [Google Scholar]
- Batten, W.; Bahaj, A.; Molland, A.; Chaplin, J. The prediction of the hydrodynamic performance of marine current turbines. Renew. Energy 2008, 33, 1085–1096. [Google Scholar] [CrossRef]
- Masters, I.; Chapman, J.; Willis, M.; Orme, J. A robust blade element momentum theory model for tidal stream turbines including tip and hub loss corrections. J. Mar. Eng. Technol. 2011, 10, 25–35. [Google Scholar]
- Mujahid, B.; VanZwieten, J.H.; Saeed, B.; Sakhi, J. A CFD study of blockage ratio and boundary proximity effects on the performance of a tidal turbine. IET Renew. Power Gen. under review.
- Nitin, K.; Arindam, B. Performance characterization and placement of a marine hydrokinetic turbine in a tidal channel under boundary proximity and blockage effects. Appl. Energy 2015, 148, 121–133. [Google Scholar] [CrossRef]
- Tatum, S.; Allmark, M.; Frost, C.; O’Doherty, D.; Mason-Jones, A.; O’Doherty, T. CFD modelling of a tidal stream turbine subjected to profiled flow and surface gravity waves. Int. J. Mar. Energy 2016, 15, 156–174. [Google Scholar] [CrossRef]
- Tian, W.; VanZwieten, J.H.; Pyakurel, P.; Li, Y. Influences of yaw angle and turbulence intensity on the performance of a 20 kW in-stream hydrokinetic turbine. Energy 2016, 111, 104–116. [Google Scholar] [CrossRef] [Green Version]
- Liu, J.; Lin, H.; Purimitla, S.R.; ET, M.D. The effects of blade twist and nacelle shape on the performance of horizontal axis tidal current turbines. Appl. Ocean Res. 2017, 64, 58–69. [Google Scholar] [CrossRef]
- Nicholls-Lee, R.F. Adaptive Composite Blades for Horizontal Axis Tidal Turbines. Ph.D. Thesis, University of Southampton, Southampton, UK, 2011. [Google Scholar]
- Grogan, D.M.; Leen, S.B.; Kennedy, C.; Brádaigh, C.Ó. Design of composite tidal turbine blades. Renew. Energy 2013, 57, 151–162. [Google Scholar] [CrossRef] [Green Version]
- Zhou, F.; Mahfuz, H.; Alsenas, G.M.; Hanson, H.P. Static and fatigue analysis of composite turbine blades under random ocean current loading. Mar. Technol. Soc. J. 2013, 47, 59–69. [Google Scholar] [CrossRef]
- Turnock, S.; Wright, A. Directly coupled fluid structural model of a ship rudder behind a propeller. Mar. Struct. 2000, 13, 53–72. [Google Scholar] [CrossRef]
- Nicholls-Lee, R.F.; Turnock, S.R.; Boyd, S.W. Simulation Based Optimization of Marine Current Turbine Blades. In Proceedings of the 7th International Conference on Computer and IT Applications in the Maritime Industries (COMPIT’08), Liège, Belgium, 21–23 April 2008; pp. 314–328. [Google Scholar]
- Kim, B.; Bae, S.; Kim, W.; Lee, S.; Kim, M. A Study on the Design Assessment of 50 kW Ocean Current Turbine Using Fluid Structure Interaction Analysis. In Proceedings of the IOP Conference Series: Earth and Environmental Science, Beijing, China, 19–23 August 2012; p. 042037. [Google Scholar]
- Jo, C.-H.; Kim, D.-Y.; Rho, Y.-H.; Lee, K.-H.; Johnstone, C. FSI analysis of deformation along offshore pile structure for tidal current power. Renew. Energy 2013, 54, 248–252. [Google Scholar] [CrossRef] [Green Version]
- Nicholls-Lee, R.; Turnock, S.; Boyd, S. Application of bend-twist coupled blades for horizontal axis tidal turbines. Renew. Energy 2013, 50, 541–550. [Google Scholar] [CrossRef]
- Tatum, S.; Frost, C.; Allmark, M.; O’Doherty, D.; Mason-Jones, A.; Prickett, P.; Grosvenor, R.; Byrne, C.; O’Doherty, T. Wave-current interaction effects on tidal stream turbine performance and loading characteristics. Int. J. Mar. Energy 2016, 14, 161–179. [Google Scholar] [CrossRef]
- Craig, H.; Vincent, S.N.; Budi, G.; Michele, G.; Fotis, S. U.S. Department of Energy Reference Model Program RM1: Experimental Results. Technical Report; 2014. Available online: https://www.osti.gov/biblio/1172793-department-energy-reference-model-program-rm1-experimental-results (accessed on 5 July 2018). [CrossRef] [Green Version]
- ANSYS Inc. ANSYS CFX-Solver Modelling Guide; ANSYS, Inc.: Canonsburg, PA, USA, 2016; p. 170. [Google Scholar]
- Ageze, M.B.; Hu, Y.; Wu, H. Comparative Study on Uni-and Bi-Directional Fluid Structure Coupling of Wind Turbine Blades. Energies 2017, 10, 1499. [Google Scholar] [CrossRef]
- Morris, C.E.; O’Doherty, D.M.; O’Doherty, T.; Mason-Jones, A. Kinetic energy extraction of a tidal stream turbine and its sensitivity to structural stiffness attenuation. Renew. Energy 2016, 88, 30–39. [Google Scholar] [CrossRef]
- Morris, C. Influence of Solidity on the Performance, Swirl Characteristics, Wake Recovery and Blade Deflection of a Horizontal Axis Tidal Turbine. Ph.D. Thesis, Cardiff University, Wales, UK, 2014. [Google Scholar]
- Mason-Jones, A. Performance Assessment of a Horizontal Axis Tidal Turbine in a High Velocity Shear Environment. Ph.D. Thesis, Cardiff University, Wales, UK, 2009. [Google Scholar]
Figure 1.
Domain and mesh used for the analysis.

Figure 2.
Performance evaluation of turbine with different modelling techniques.
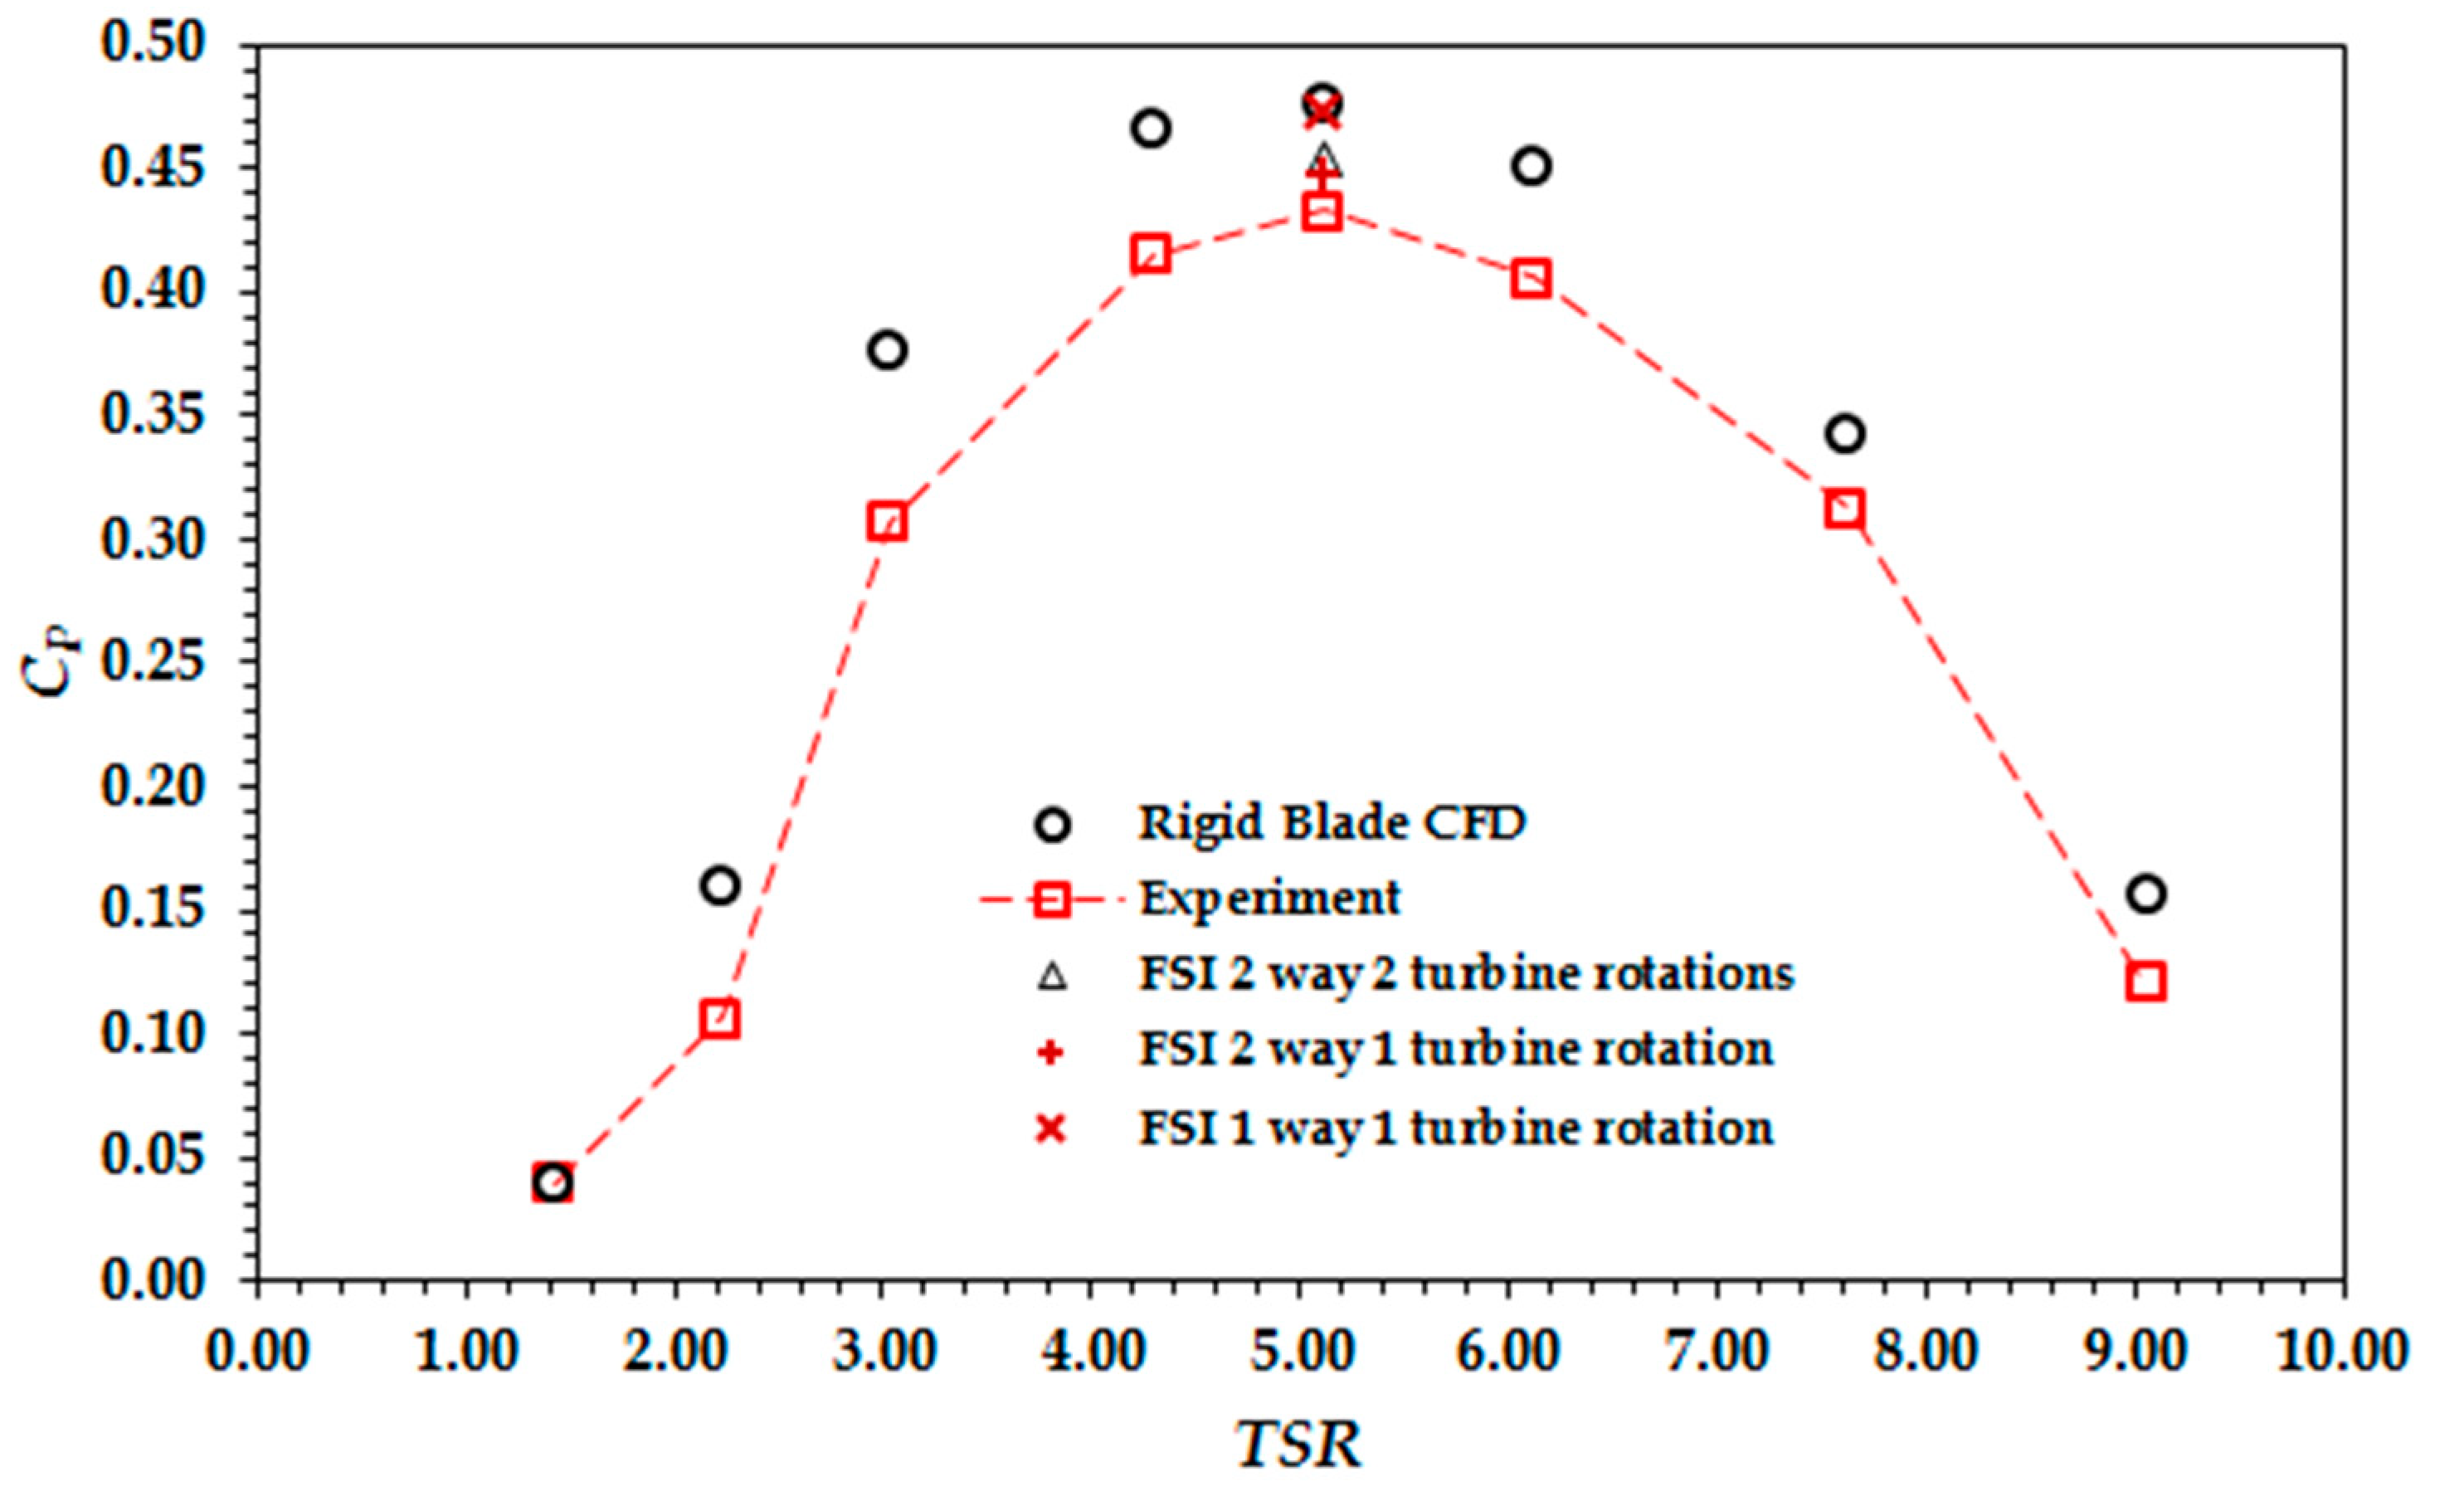
Figure 3.
Prediction of total deformation from the three FSI simulations.
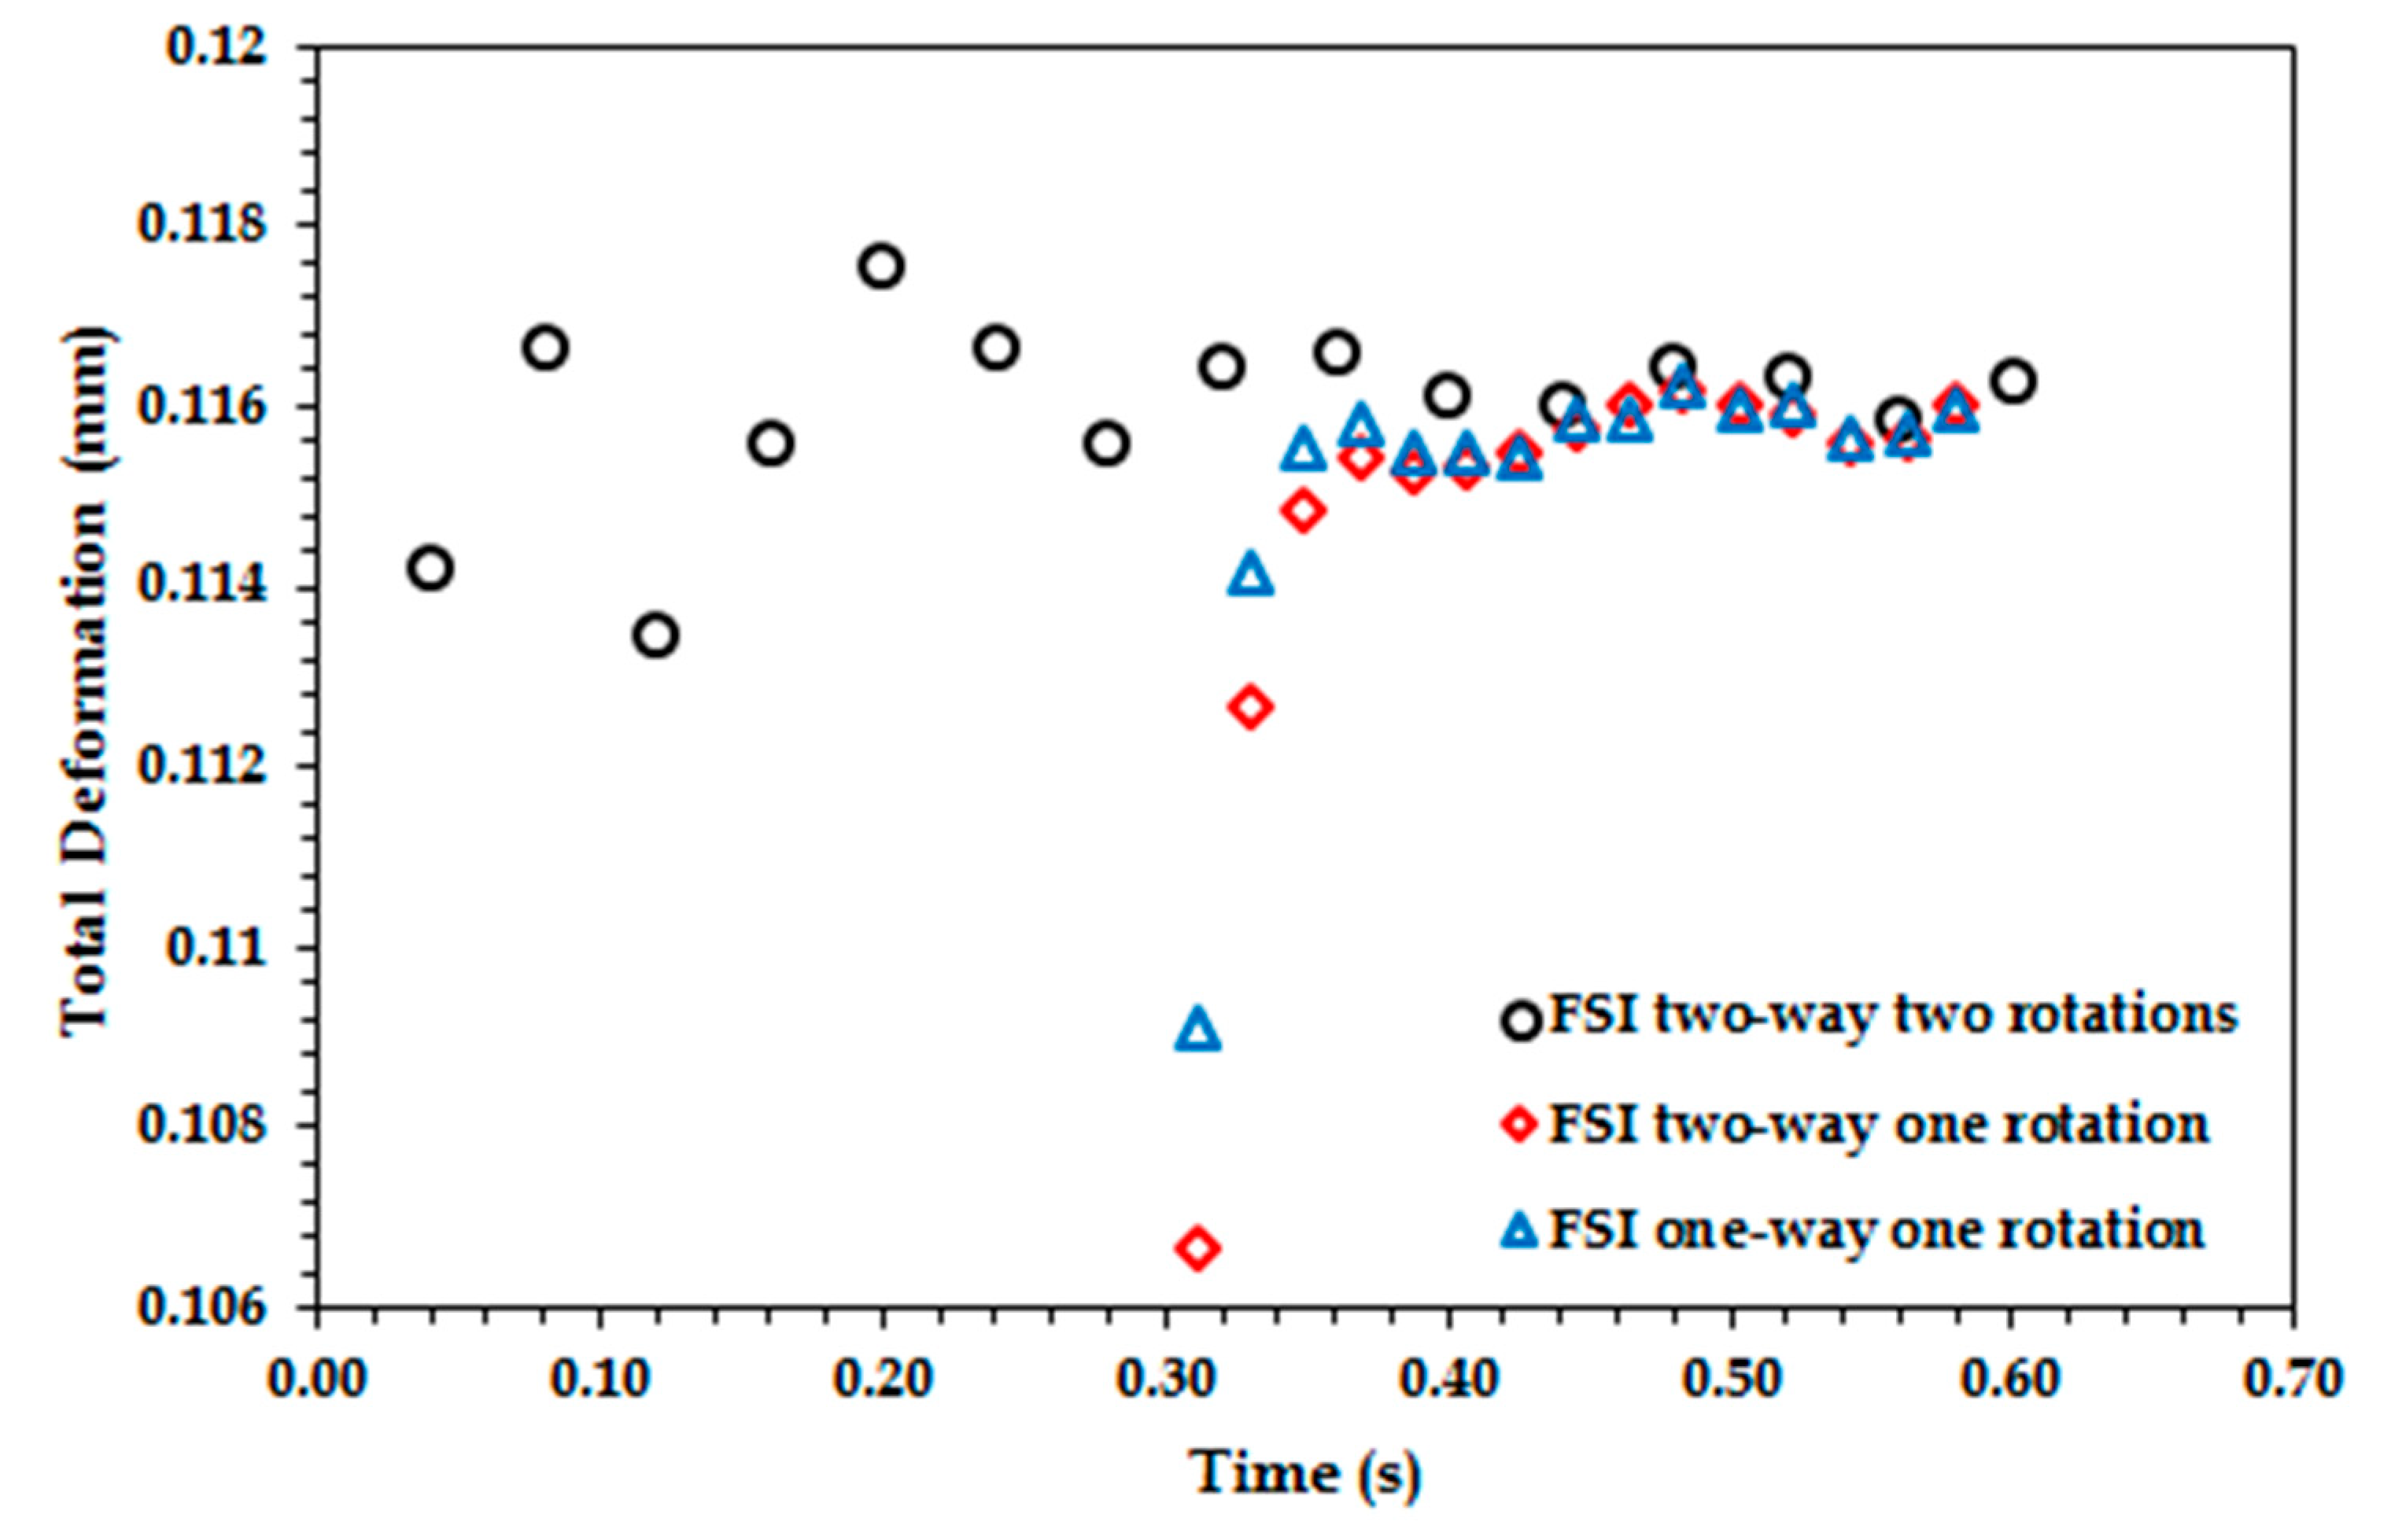
Figure 4.
Prediction of equivalent stress from the three FSI simulations.
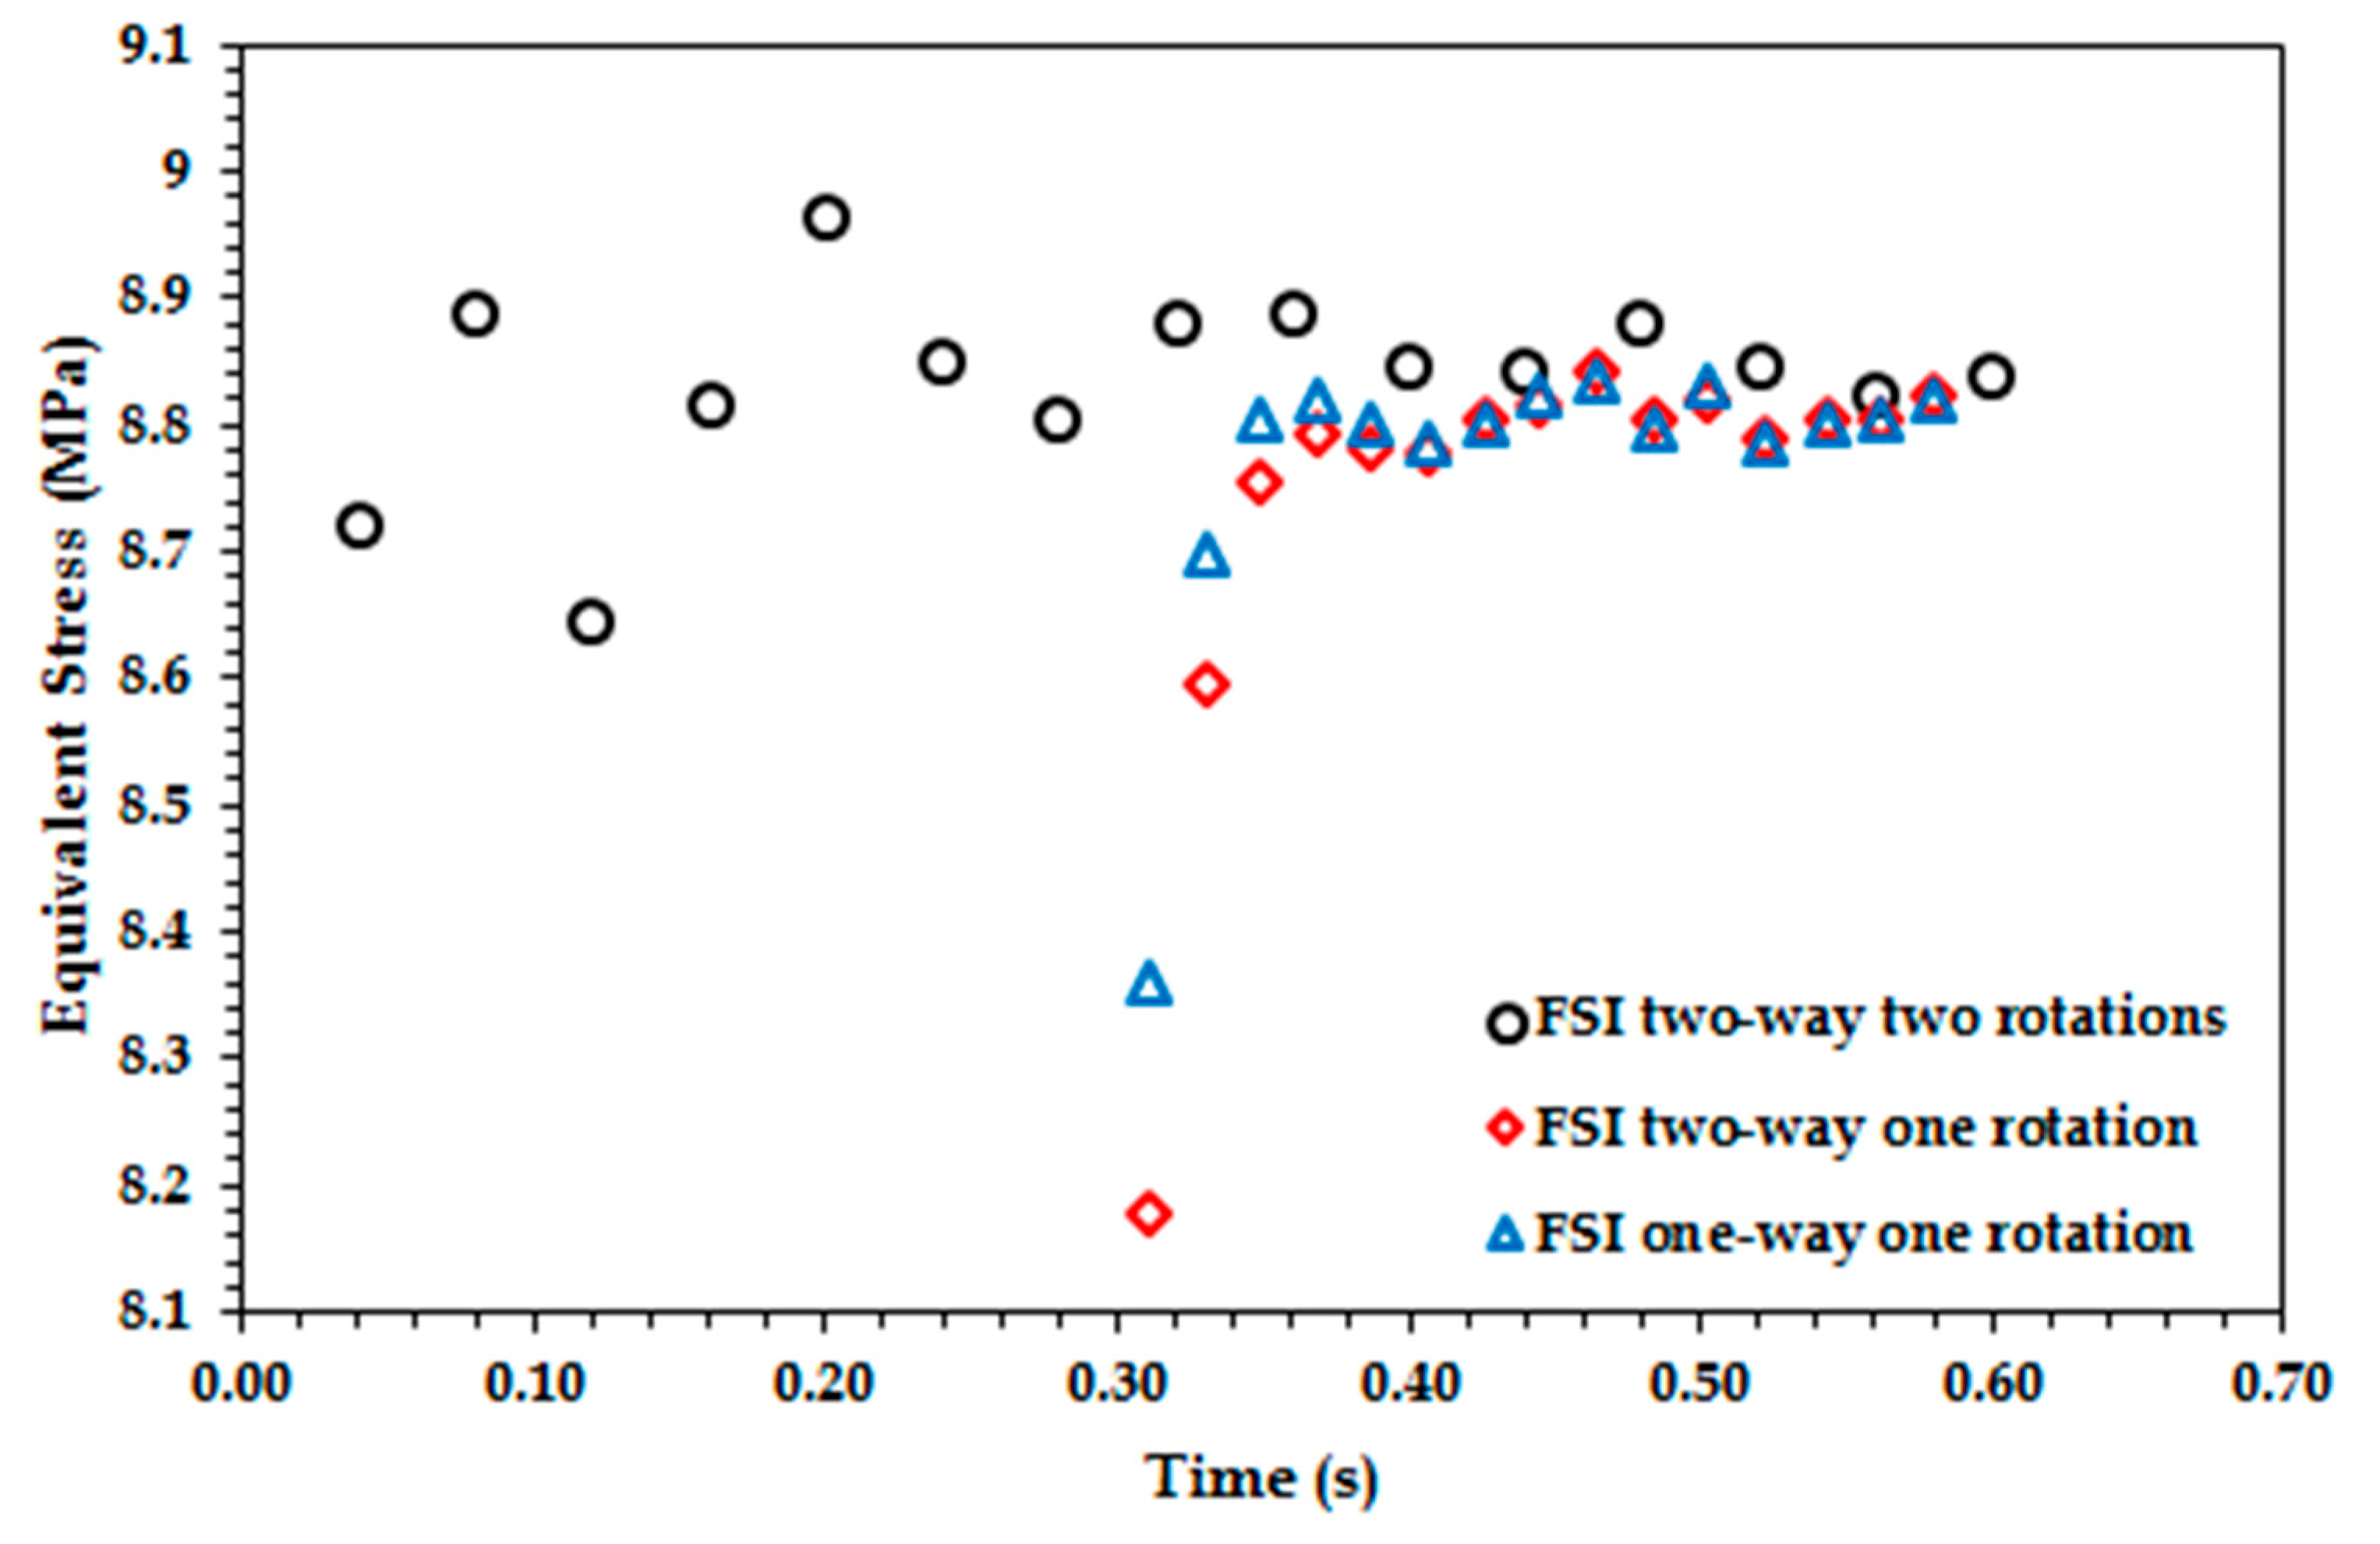
Figure 5.
Contour plots of equivalent stress and total deformation on rotor at the last time step from the three FSI simulations.
Figure 5.
Contour plots of equivalent stress and total deformation on rotor at the last time step from the three FSI simulations.

Figure 6.
Inlet velocity profile with 1/7th power law and plug flow for the experimental channel.

Figure 7.
Contours of Equivalent (Von-Mises) stress and Total deformation for rotor for uniform and profiled flow.
Figure 7.
Contours of Equivalent (Von-Mises) stress and Total deformation for rotor for uniform and profiled flow.

Figure 8.
Variation of stress and deformation at rotating turbine blades for uniform flow.
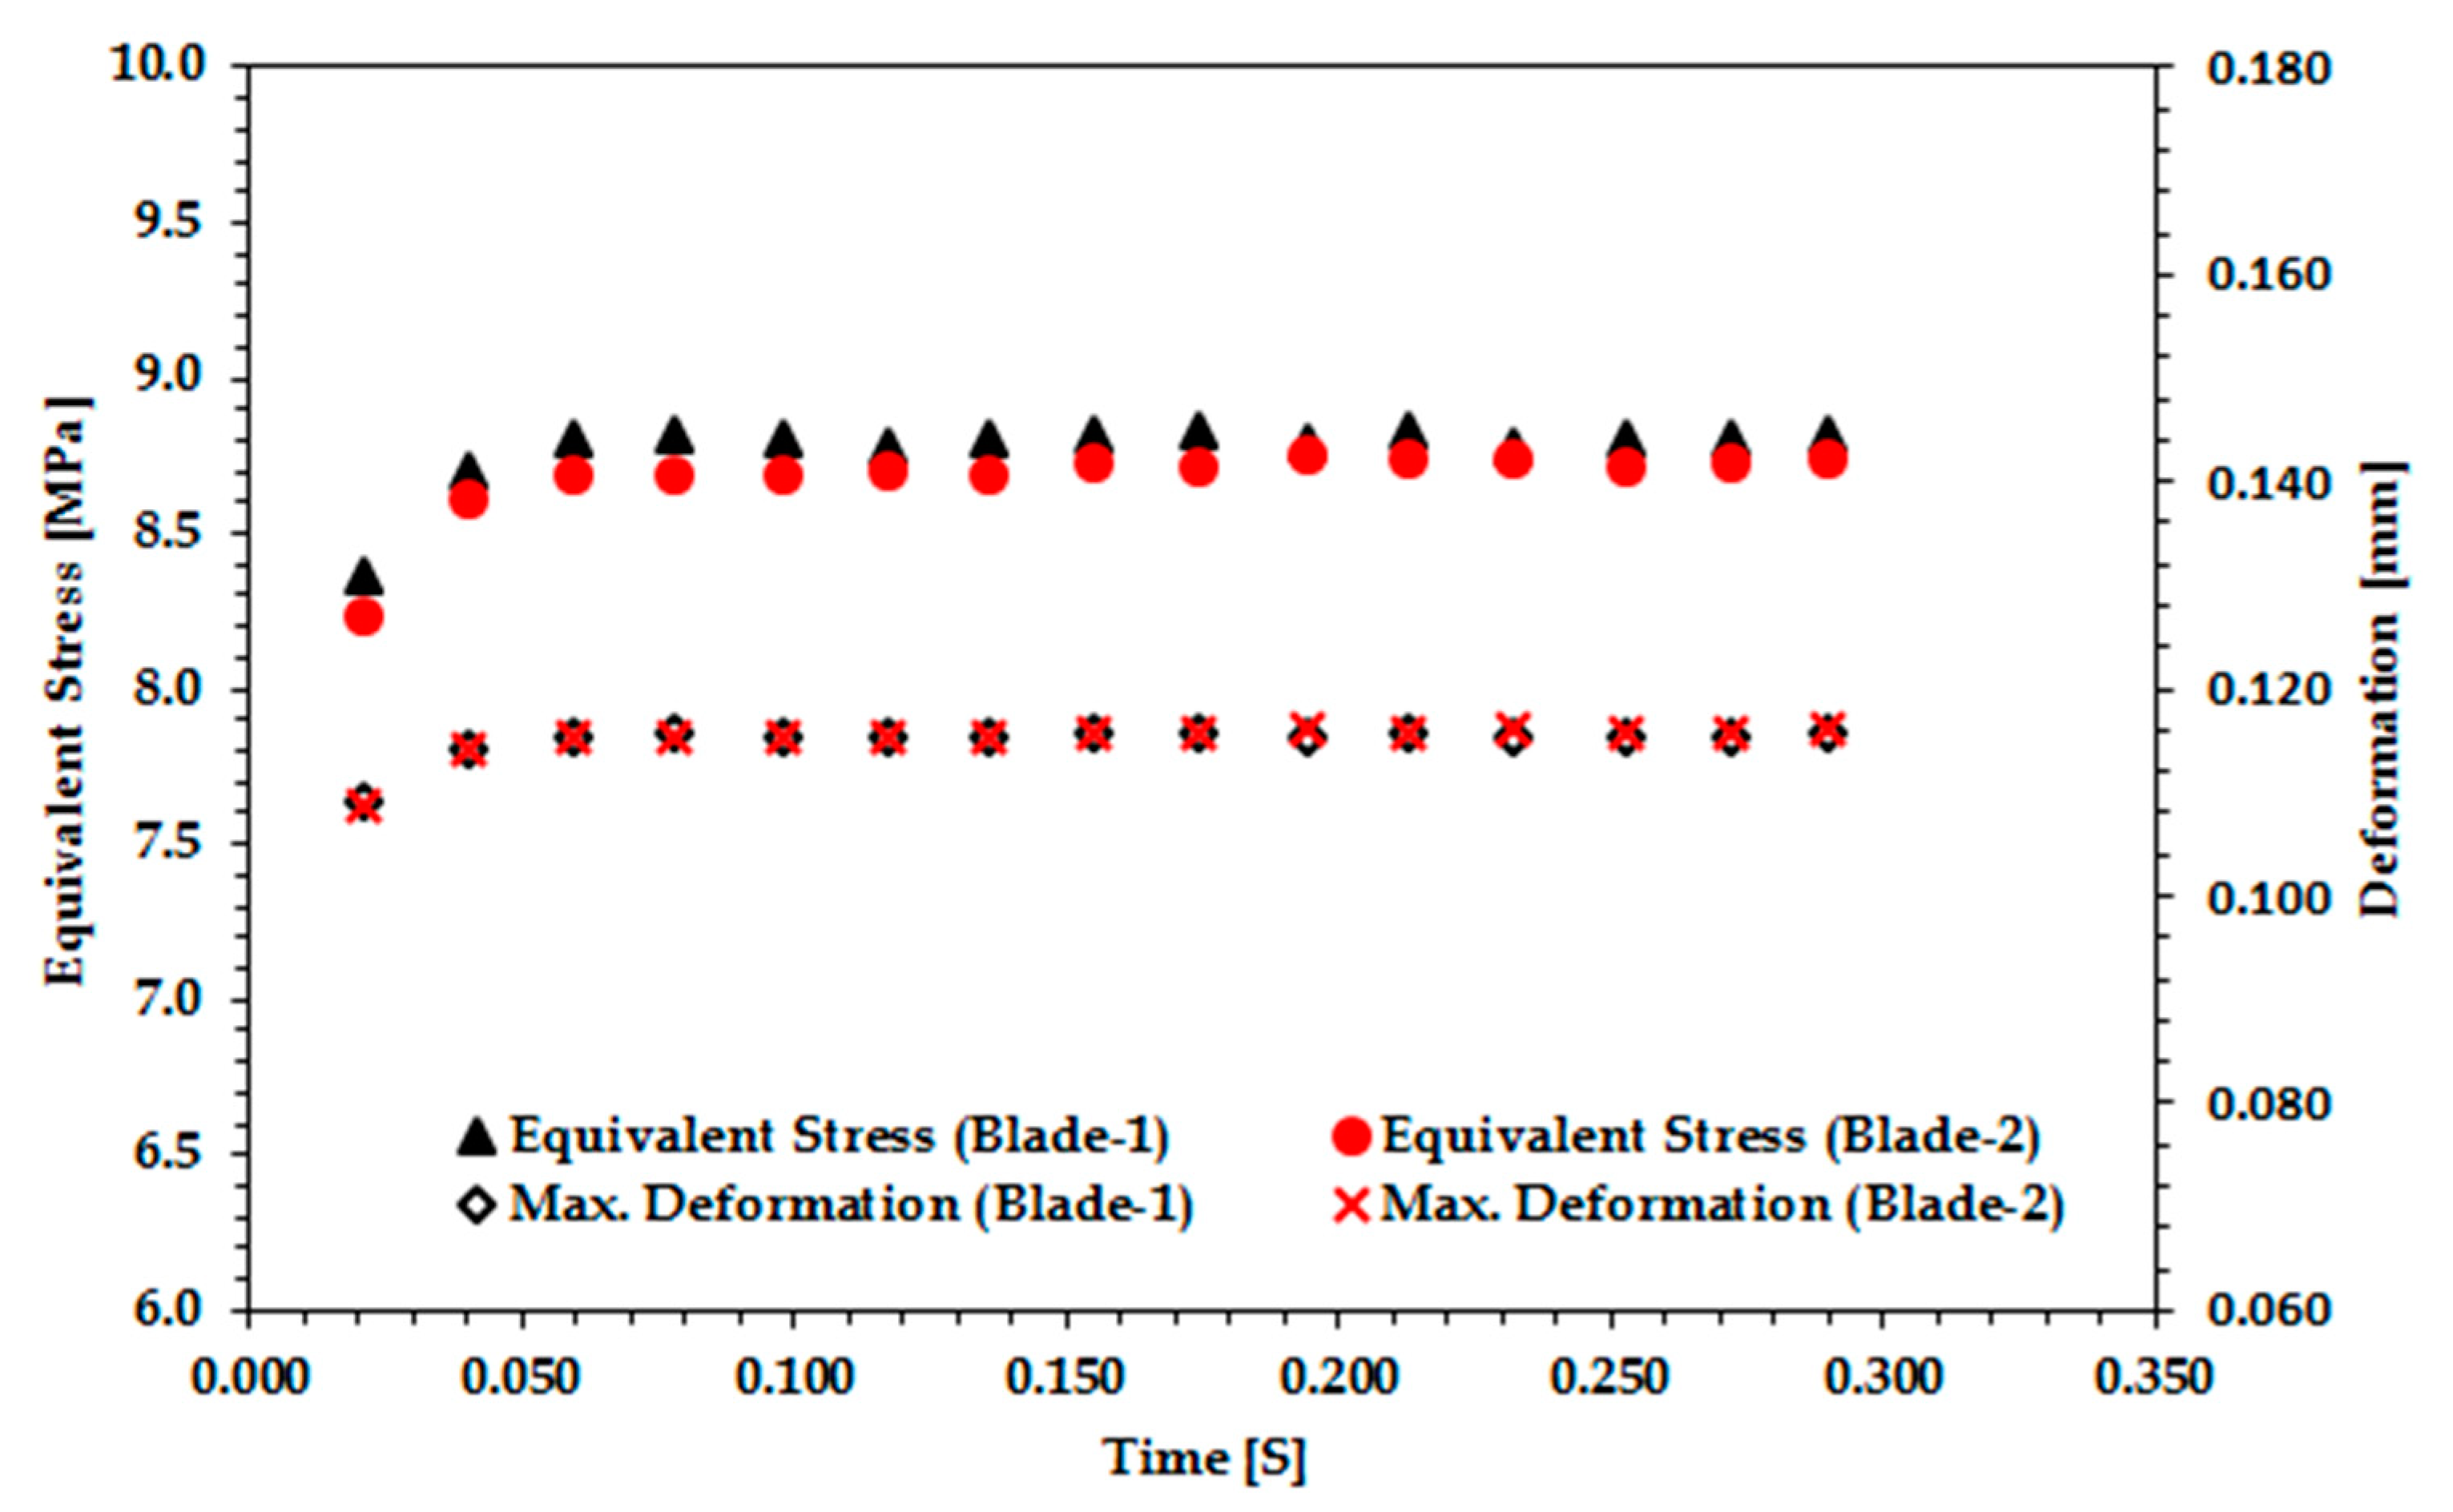
Figure 9.
Variation of stress and deformation at rotating turbine blades for profiled flow.

Table 1.
Comparison of the computational time and thrust force prediction.
| S# | Simulation Name | Computational Time (h) | Thrust Force (N) |
|---|---|---|---|
| 1 | Two-way two turbine rotations | 283.3 | 99.29 |
| 2 | Two-way one turbine rotation | 105.6 | 98.66 |
| 3 | One-way one turbine rotation | 58.3 | 100.24 |
© 2018 by the authors. Licensee MDPI, Basel, Switzerland. This article is an open access article distributed under the terms and conditions of the Creative Commons Attribution (CC BY) license (http://creativecommons.org/licenses/by/4.0/).
Share and Cite
MDPI and ACS Style
Badshah, M.; Badshah, S.; Kadir, K. Fluid Structure Interaction Modelling of Tidal Turbine Performance and Structural Loads in a Velocity Shear Environment. Energies 2018, 11, 1837. https://doi.org/10.3390/en11071837
AMA Style
Badshah M, Badshah S, Kadir K. Fluid Structure Interaction Modelling of Tidal Turbine Performance and Structural Loads in a Velocity Shear Environment. Energies. 2018; 11(7):1837. https://doi.org/10.3390/en11071837
Chicago/Turabian StyleBadshah, Mujahid, Saeed Badshah, and Kushsairy Kadir. 2018. "Fluid Structure Interaction Modelling of Tidal Turbine Performance and Structural Loads in a Velocity Shear Environment" Energies 11, no. 7: 1837. https://doi.org/10.3390/en11071837
Note that from the first issue of 2016, this journal uses article numbers instead of page numbers. See further details here.