E-City Web Platform: A Tool for Energy Efficiency at Urban Level


1
CERIS Civil Engineering Research and Innovation for Sustainability, Instituto Superior Técnico, Universidade de Lisboa, Av. Rovisco Pais 1, 1049-001 Lisbon, Portugal
2
CICS.NOVA—Interdisciplinary Center of Social Sciences, Faculdade de Ciências Sociais e Humanas, Universidade NOVA de Lisboa, Av. de Berna 26-C, 1069-061 Lisbon, Portugal
3
CIAUD Centro de Investigação em Arquitectura, Urbanismo e Design, Faculdade de Arquitectura, Universidade de Lisboa, R. Sá Nogueira, 1349-063 Lisbon, Portugal
4
Municipal Development Office, 2784-214 Oeiras Municipality, Portugal
*
Author to whom correspondence should be addressed.
Energies 2018, 11(7), 1857; https://doi.org/10.3390/en11071857
Submission received: 20 June 2018
/
Revised: 11 July 2018
/
Accepted: 13 July 2018
/
Published: 16 July 2018
(This article belongs to the Section A: Sustainable Energy)
Abstract
:Cities, as main energy consumers, play a crucial role in achieving a more sustainable energy future. This means that there is an urgent need to transform the way of planning urban areas, focusing on more efficient and self-reliant energy production and consumption modes overall. In this framework, the aim of this study is to explore the Net-Zero energy balance between two spatial scales: the whole city with its diversified energy consumption patterns, and those urban blocks, neighborhoods, or industrial areas that can produce energy and supply it to other areas. This approach leads to the development of an energy zoning for the city, based on the geographical urban delimitation of solar energy exporters cells and the energy consuming ones. On the production side, cells are delimited according to their solar energy production potential. On the demand side, cells are delimited according to four specific criteria: construction timeline, population density, urban morphologies, and land-use patterns that permit the definition of a classification of urban areas, based on the different energy consumption levels. In this paper, the web platform “E-City”, a tool for planning energy balance at urban level is presented, by describing its practical application in the city of Oeiras, Portugal. The platform integrates itself with the existing municipal Geographic Information System, exploring both spatial and statistical dimensions associated with zoning and the overall energy network system. Results from the use of this tool are relevant for urban planning practices, formulation of policies, and management of public investment that can be guided to more energy efficient solutions and supporting the transition towards nearly zero-energy cities.
1. Introduction
Urbanization associated with the growth of population and the expansion of built environment is a process that has led to changes in land use with serious consequences for climate change [1]. According to the International Energy Agency (2016), urban areas today account for about two-thirds of primary energy demand and 70% of total energy-related carbon dioxide emissions [2]. Indeed, energy flows constrain and shape cities leading to a pressing need for new approaches to its planning and design. It is within this background that new concepts such as the Smart City [3] and Digital City [4] have been developed in part to address specific problems that affect urban energy systems [5].
These visions of Future Cities today are taking on a new relevance for the definition of energy-efficient urban models as well as their integration and application to the existing cities. For instance, the “Malaga Smart City” has been developed to address European target 20-20-20 plan, embracing a collaborative model between the customers and the distribution company. In this project, energy efficiency is promoted by increasing the use of renewable energy sources associated with the development of smart grids able to manage and store energy and optimize electric-vehicle charging [6].
Different from the previous, the “Amsterdam Smart City” recognizes the need of a systematic framework of actions within the domains of energy transition and open connectivity [7]. This approach has led to the developing of 52 ongoing projects that promote the balance between sustainable energy supply and demand in neighborhoods by including the expected raise of electrical cars, integrating cooling and city heat system and investing in energy-efficient housing renovations [8].
Within the Smart City planning process of Rotterdam, local authorities. The common understanding through these projects is that Information and Communications Technologies (ICT) coupled with digital visualization platforms can be used to improve cities, with special attention to their transition towards a low carbon future [9,10].
Enhancing energy efficiency, increasing the share of renewable energy sources, and integrating smart grids and electric vehicles into cities are complex tasks with evident implications for urban development and planning. Given the need for effective solutions to support the decision-making process and governance [11], this paper proposes the E-City web platform: a tool for planning energy balance at urban scale. The E-City is a recent concept that stands out for being an evolution of the smart city model, focused on city optimization and management through planned decisions and actions sustained by Geographical Information System (GIS) [12] (Bremer et al., 2017) and virtualization tools [5,12]. This understanding, coupled with the challenge of energy efficiency integration into urban planning [13], are the basis of the E-City web platform implemented by a multidisciplinary team composed by the authors of the paper: Miguel Amado, Francesca Poggi, and António Ribeiro Amado, members of a research group hosted by the Instituto Superior Técnico, Universidade de Lisboa (https://www.geotpulab.com/), and Sílvia Breu, a decision-maker of the Municipality of Oeiras.
The specific goal of the project was the development of a theoretical model and its practical application, articulating energy consumption and solar energy supply with land use zoning and urban design parameters. In this framework, the E-city web platform is just one of the results of the OEIRAS E_CITY research project, financed by the QREN/2011 under the “Competitive edge, Innovation and Knowledge Programme”. The contribution of all authors to the E-City platform was the design of the conceptual-theoretical-empirical framework that supports such operative tool.
2. Related Works
During the last years, several studies have explored how digital visualization platforms and ICT can contribute to the decision-making, implementation, and monitoring processes involved in the planning for more energy efficient cities [14]. What follows in this section is a literature review on web-based platforms, highlighting objectives, spatial scale, methods, barriers/gaps, and insights. Given the variety and wide-coverage of these tools, the selection has covered those that address energy efficiency and solar energy production within the context of municipal and urban planning.
In this frame, Kim et al. (2012) elaborated the U-Eco City web-based application which integrates interactive 3D modeling of urban space with the estimation of energy demand to deliver the most effective energy supply strategies at the city scale, by combining GIS data and geospatial data [15]. However, this study just presents an energy monitoring system at the early-stage prototyping stage.
The MEU web platform is another tool which promises detailed monitoring and planning for both energy demand and supply at individual building, neighborhood, and whole city scale [16]. However, the objective of this application is limited to the analysis and scenarios buildings of natural gas infrastructure.
Yamamura et al. (2017) propose an urban energy planning platform based on BIM-GIS integration, which aims to access the optimal technical and policy solution for readjust city infrastructure and pushing energy planning issues at urban level forward [17]. This study, although at an early stage, draws relevant insights concerning the need of a flexible strategy to renovate all the buildings in a neighborhood as energy-efficiently and as pragmatically as possible, instead of each building on its own [18].
The challenge to improve energy efficiency at the urban and building level, represents the main focus of the Smart UrbaN ServIces for Higher eNergy Efficiency (SUNSHINE) project. In this frame, the SUNSHINE platform delivers a smart service tool which provides three different applications: (1) the visualization of urban-scale “Energy Maps” to be used for planning activities and large-scale energy pre-certification purposes; (2) the optimization of energy consumption of heating/cooling systems and (3) an interoperable control of public illumination systems [19]. This tool presents advances in parallel fields that involve building energy performance assessment using 3D city models. Here, the simulation of energy scenarios frames a new way of supporting municipal managers in the development of long-term urban energy strategies.
In carrying forward the focus on energy modeling and analysis of a city’s building stock, the web-based data and computing platform: City Building Energy Saver (CityBES) was developed to support district or city-scale efficiency programs. Taking the current energy usage data as the baseline, CityBES can offer a wide array of analysis suited for a city’s energy efficiency program, including energy benchmarking, energy savings, greenhouse gas reductions, operation improvements, and energy costs reductions [20].
Nevertheless, while the aforementioned studies deal with energy consumption issues, they do not consider the dimension of energy production, which is an extremely relevant issue towards energy-efficient urban areas, especially considering solar technologies [21,22]. Mapping solar energy in urban environments has become an extremely important task for urban planning and energy management [13]. In that regard, solar energy mapping tools have been developed in several cities worldwide [23,24]. However, the value of these tools determined by energy production assessment capability is limited by the lack of articulation with the energy consumption dimension, at the city scale. Promoting a more holistic and interactive approach to energy management systems, other works have designed web platforms to support city governments in developing effective energy policy decisions.
This is, for example, the case of the iURBAN smartDSS, an open software platform that integrates local, intelligent energy systems and available communication infrastructures [25]. Real-time data of energy consumption and production at building scale are collected by metering devices [26]. These data are then aggregated to provide a database at city-level that permits support to authorities and energy service providers. The platform also provides a tool to measure, predict, and balance energy production; demand and storage; and a tool to measure and verify reductions in energy consumption and GHG emissions resulting from city energy use [26].
In that regard, the SEMANCO integrated platform promises to model multiple urban energy systems of an urban area using a set of tools which interact with semantically modelled data [27]. This interactive tool provides qualified information to different agents, within a context of continuous development of urban energy models [28]. However, the overall impression is that this participative-based approach is limited to the visualization of parts of the city, neglecting a comprehensive energy balance perspective.
Out of this pattern, the New York City Energy Mapping Project developed an interactive platform to estimate the annual building energy consumption by end use, at the block scale [29]. This tool does not include solar energy mapping, but it provides a suitable starting point for distributed generation analysis at city scale, as explained by Howard et al. (2012) [30].
Energy visualization to support planning and management of cities is a challenge which has led to different approaches, whether assessing energy production or consumption. In this framework, the difference between the E-City web platform, described in this paper, and the above-mentioned tools is, before anything else, the elaboration of a model focused on energy balance at city scale. This assumption is associated with the vision of the city as a system compounded by existing or projected urban cells, operating as energy consumer and producer in a potential state of equilibrium. In other words, the goal is to reinforce the energy efficiency and promote the widespread integration of solar energy and smart grids in the urban areas in a way that puts them on par with a potential balance, through the usage of digital tools for planning and management [31].
To this end, the E-City web platform has been built using a real case study: The Municipality of Oeiras, in Portugal. The following Section 3 and Section 4 describe the model and the methodology that have supported the conception of the web platform and its potential as a quantitative and interactive tool for the municipal energy planning and decision-making processes.
3. Conceptual Model and Methodology
For the understanding and justification of the E-City Web Platform, this section presents a synthesis of the concepts and principles that have supported its conception. The total energy request in Oeiras over the last ten years grew 49%, closely following the national trend (+75%), with an average annual rate of growth of 4.7% [32].
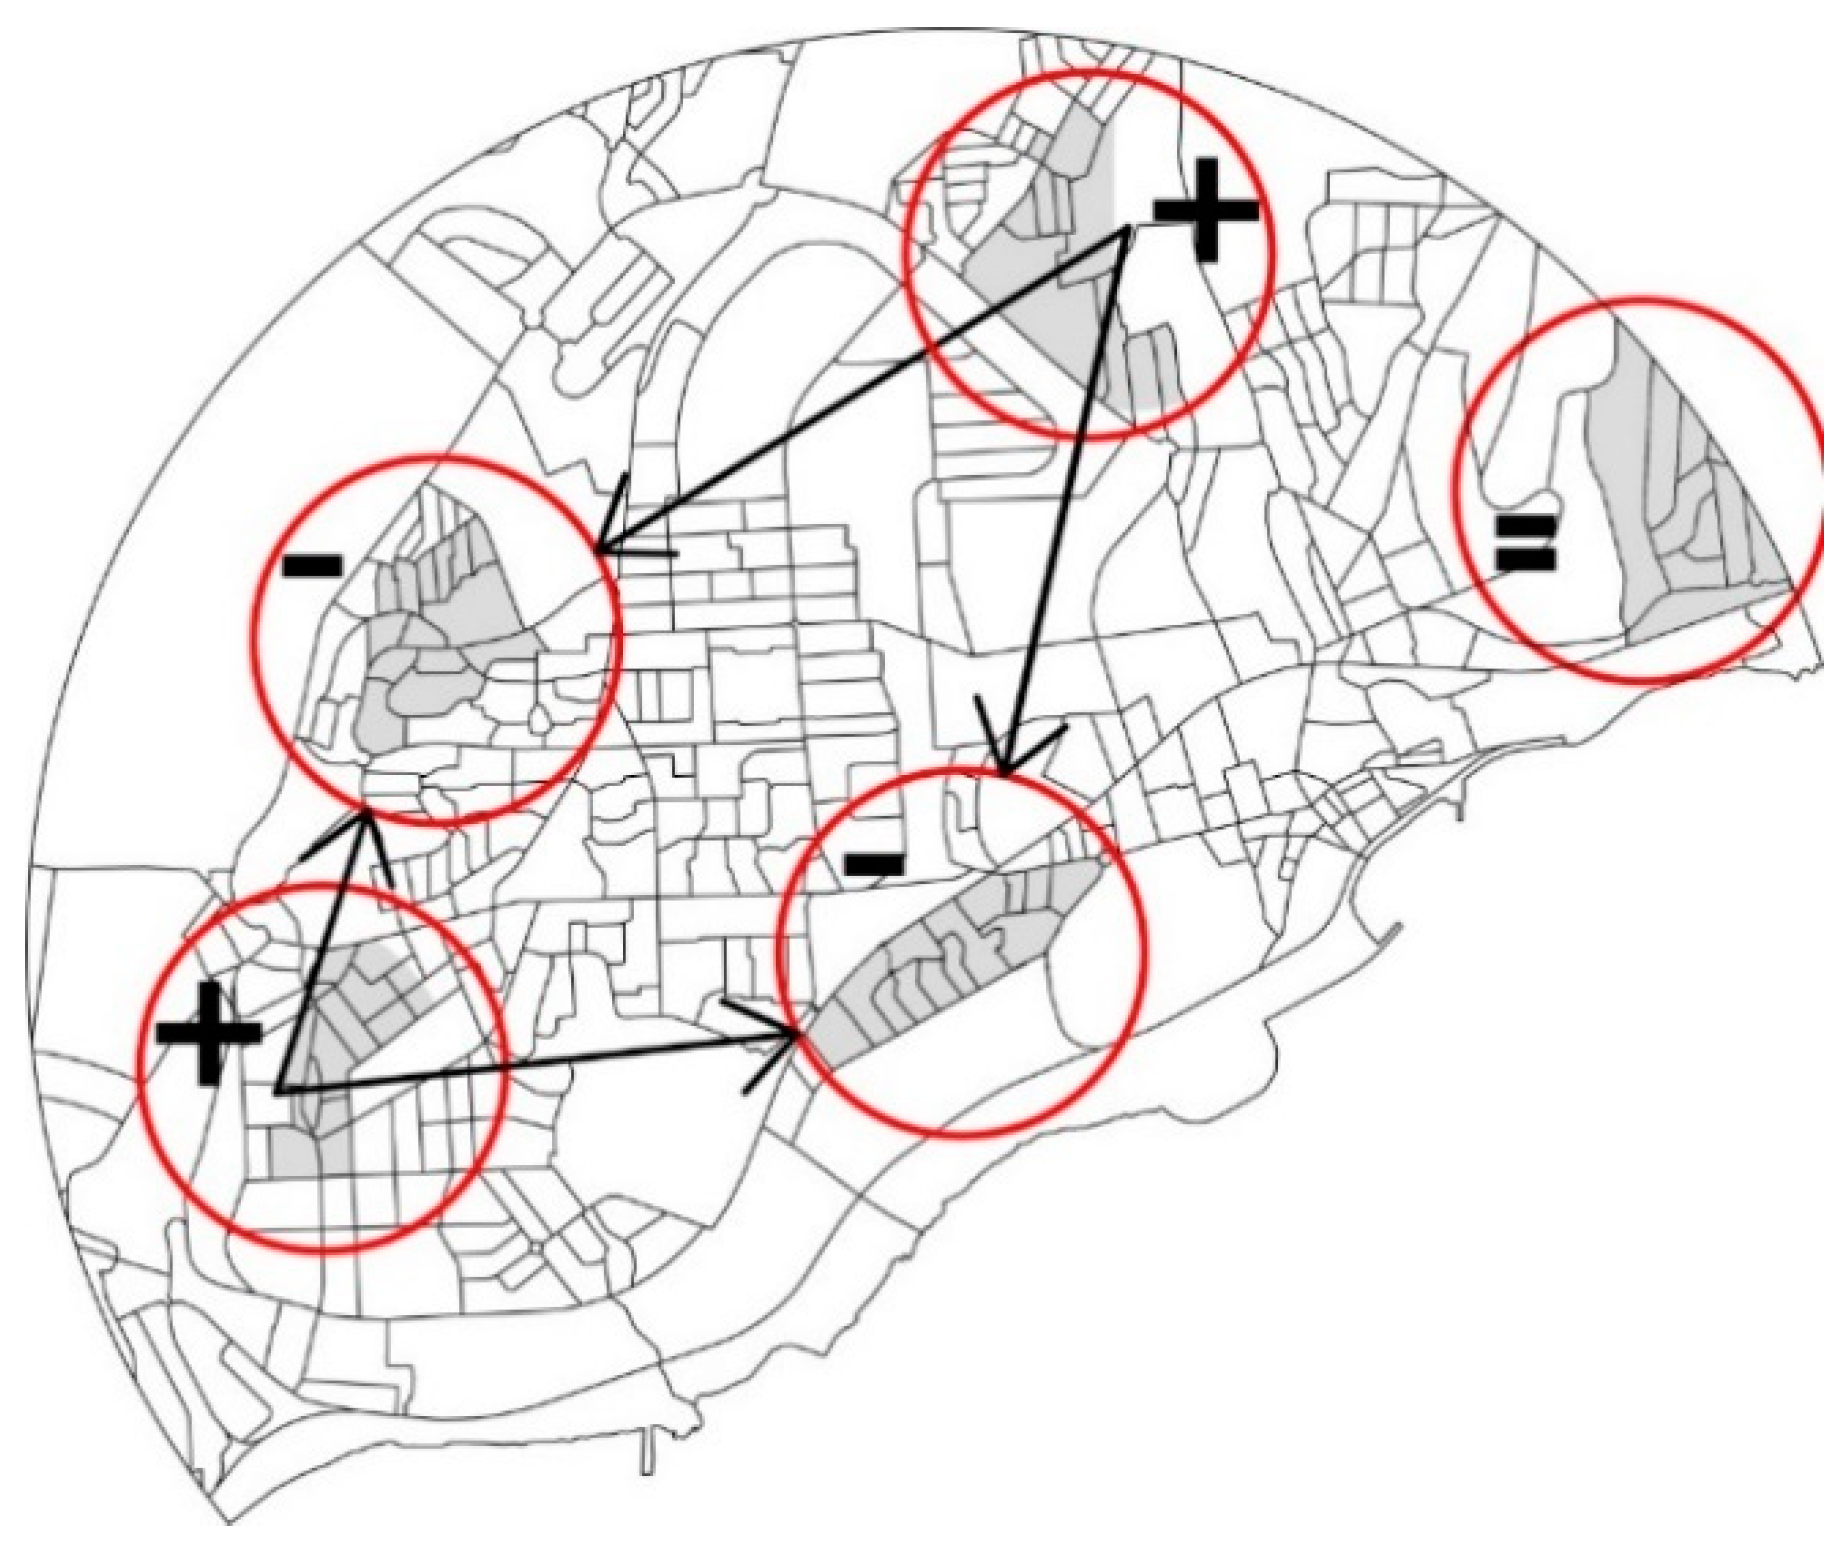
This scenario has led to the understanding that the persistence in certain urban development models, regarding the local production and consumption of energy, when associated with such an increase in demand, results in unsustainable energy performances. Moreover, the share of energy that is not generated from renewable sources, makes it mandatory to delineate new approaches focused on a paradigm shift regarding how urban areas are planned. Such considerations contextualize the research question of this study, that is, to promote the Net-Zero energy balance between two well-defined spatial domains: the whole city with its diversified energy consumption and, those urban blocks, neighborhoods or industrial areas that can produce energy and supply it to other areas (Figure 1).
This model leads to the development of an energy zoning for the city, based on the geographical urban delimitation of solar energy exporters cells and the energy consuming ones. On the production side, cells are delimited according to their solar energy production potential. On the demand side, cells are delimited according to four specific criteria: construction timeline, population density, urban morphologies, and land-use patterns that permit the definition of a classification of urban areas, based on the different energy consumption levels [13,31].
Moving from theory to practice, this section describes the methodology adopted to develop a WebGIS platform for planning the energy balance at municipal scale.
The first step involves the preparation of the main themes that constitute the Geographic Information Data Model to support the E-City web platform (Table 1).
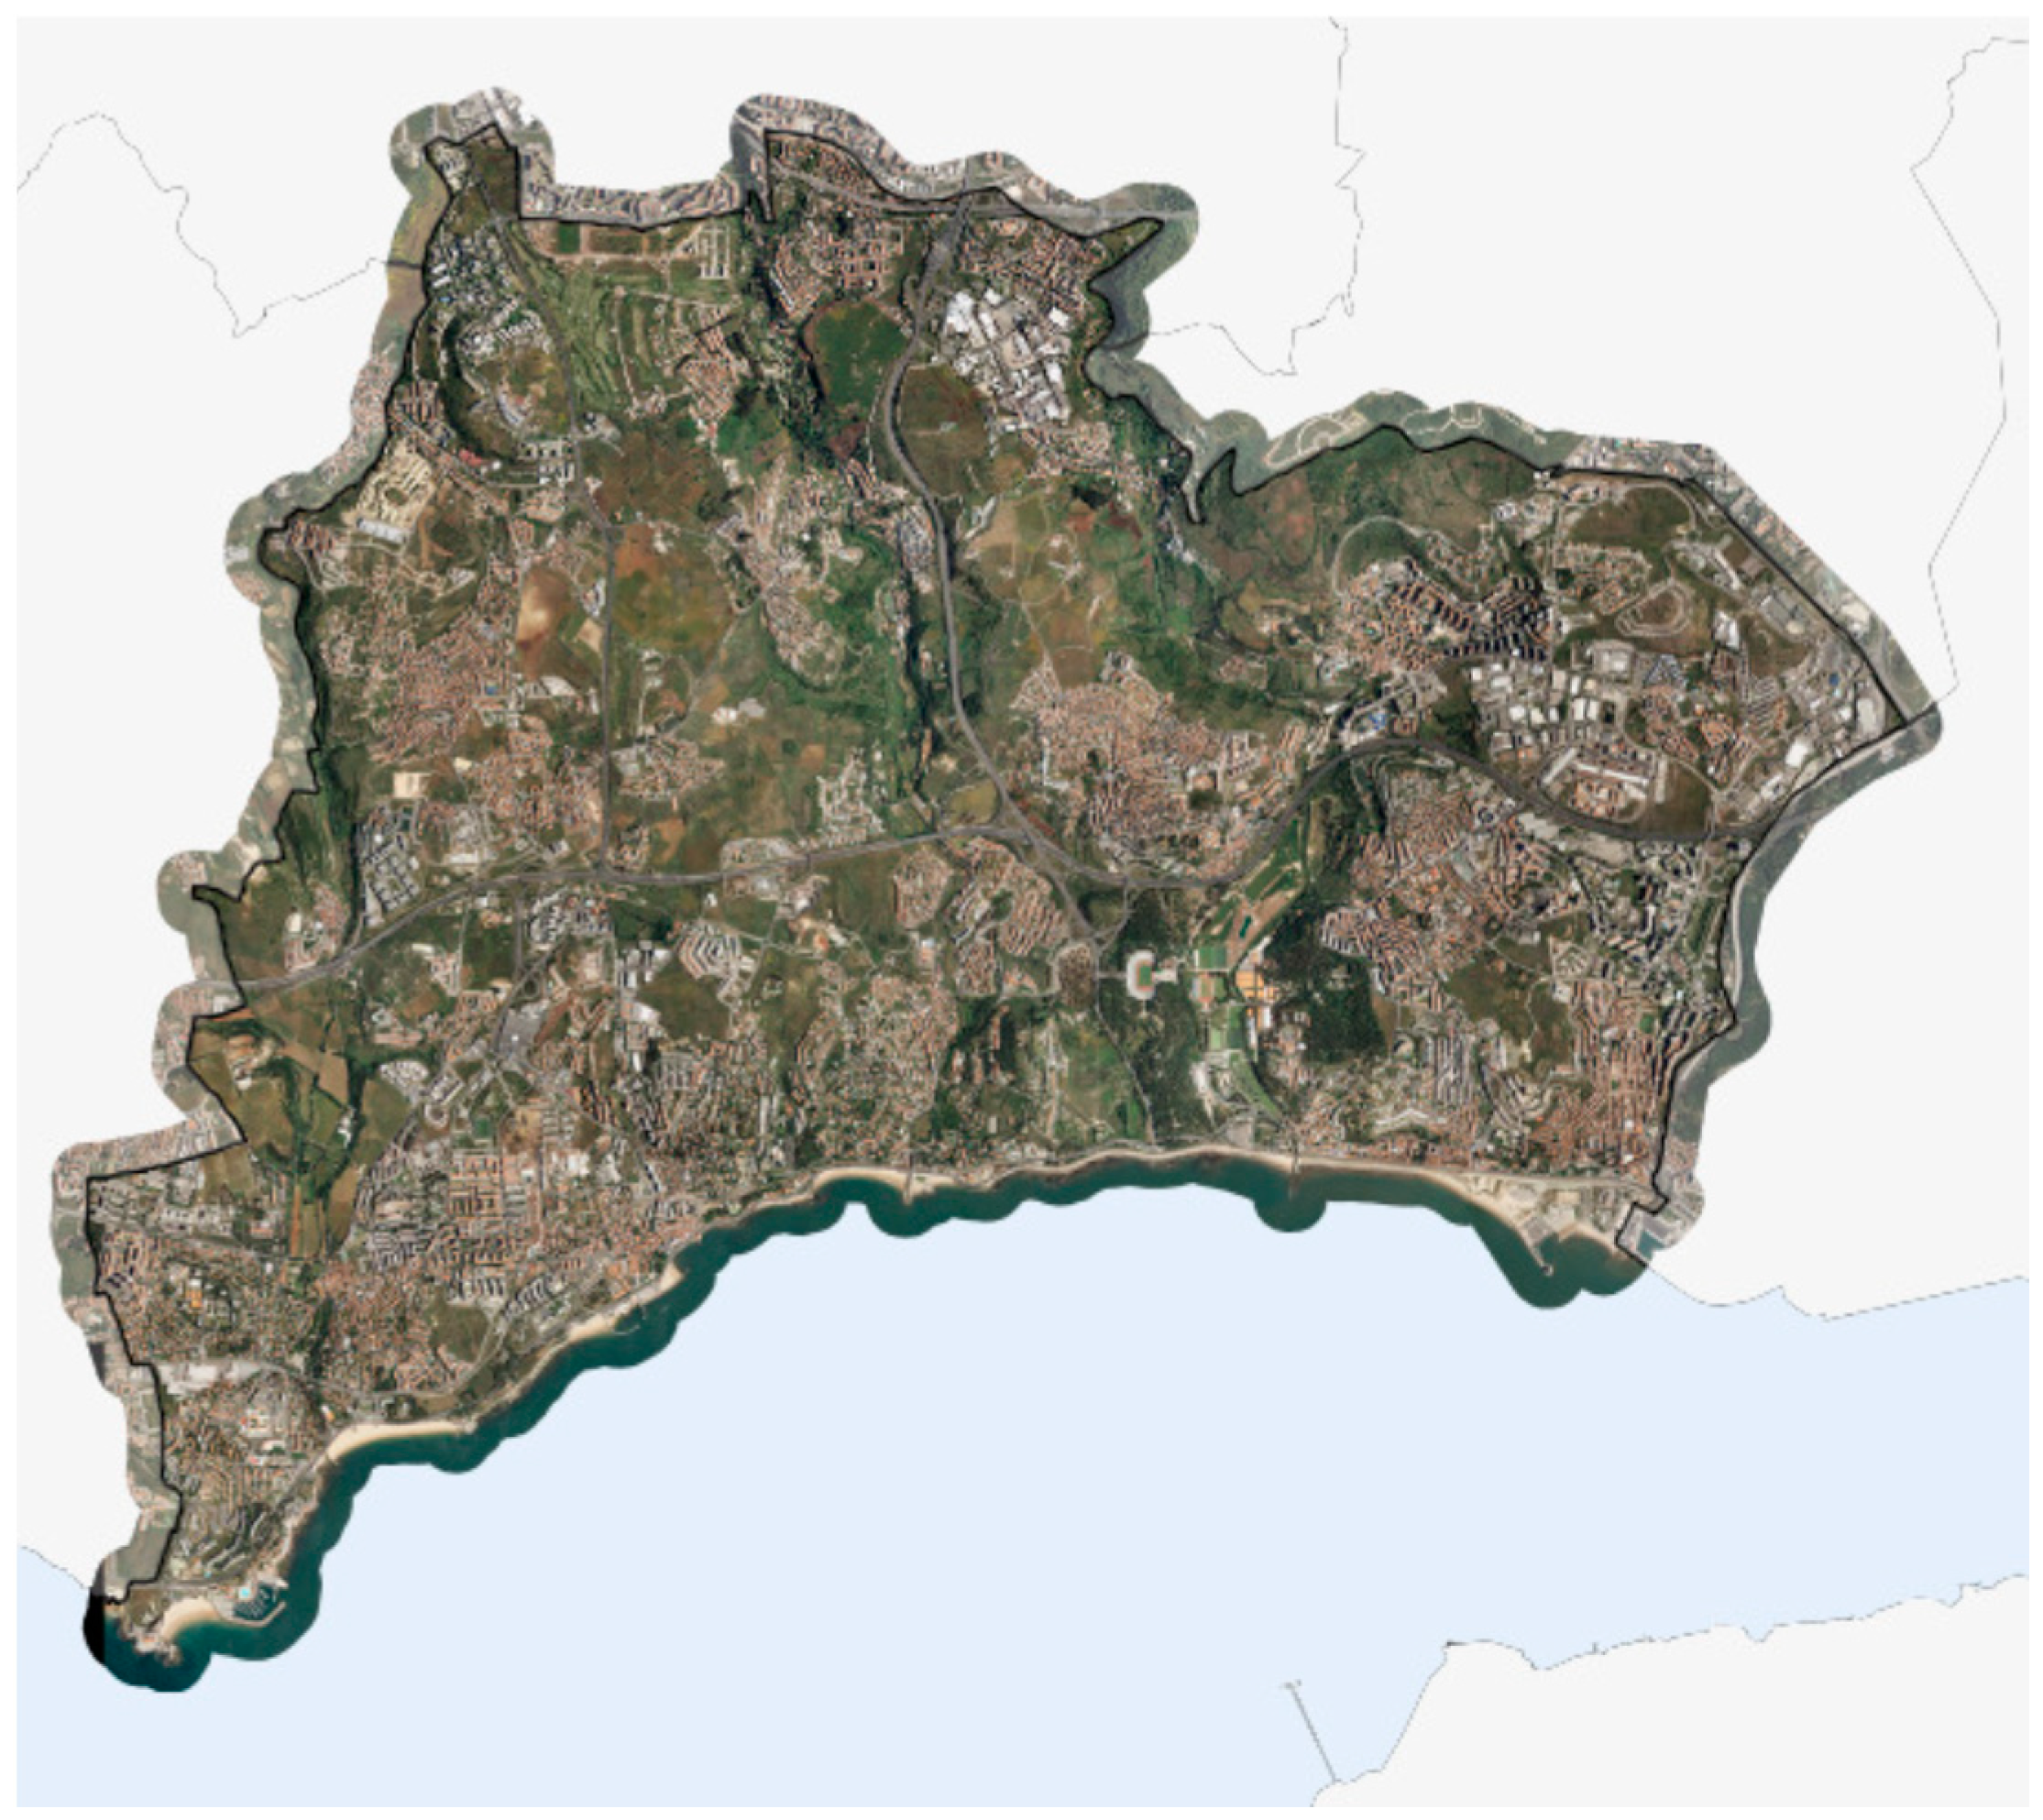
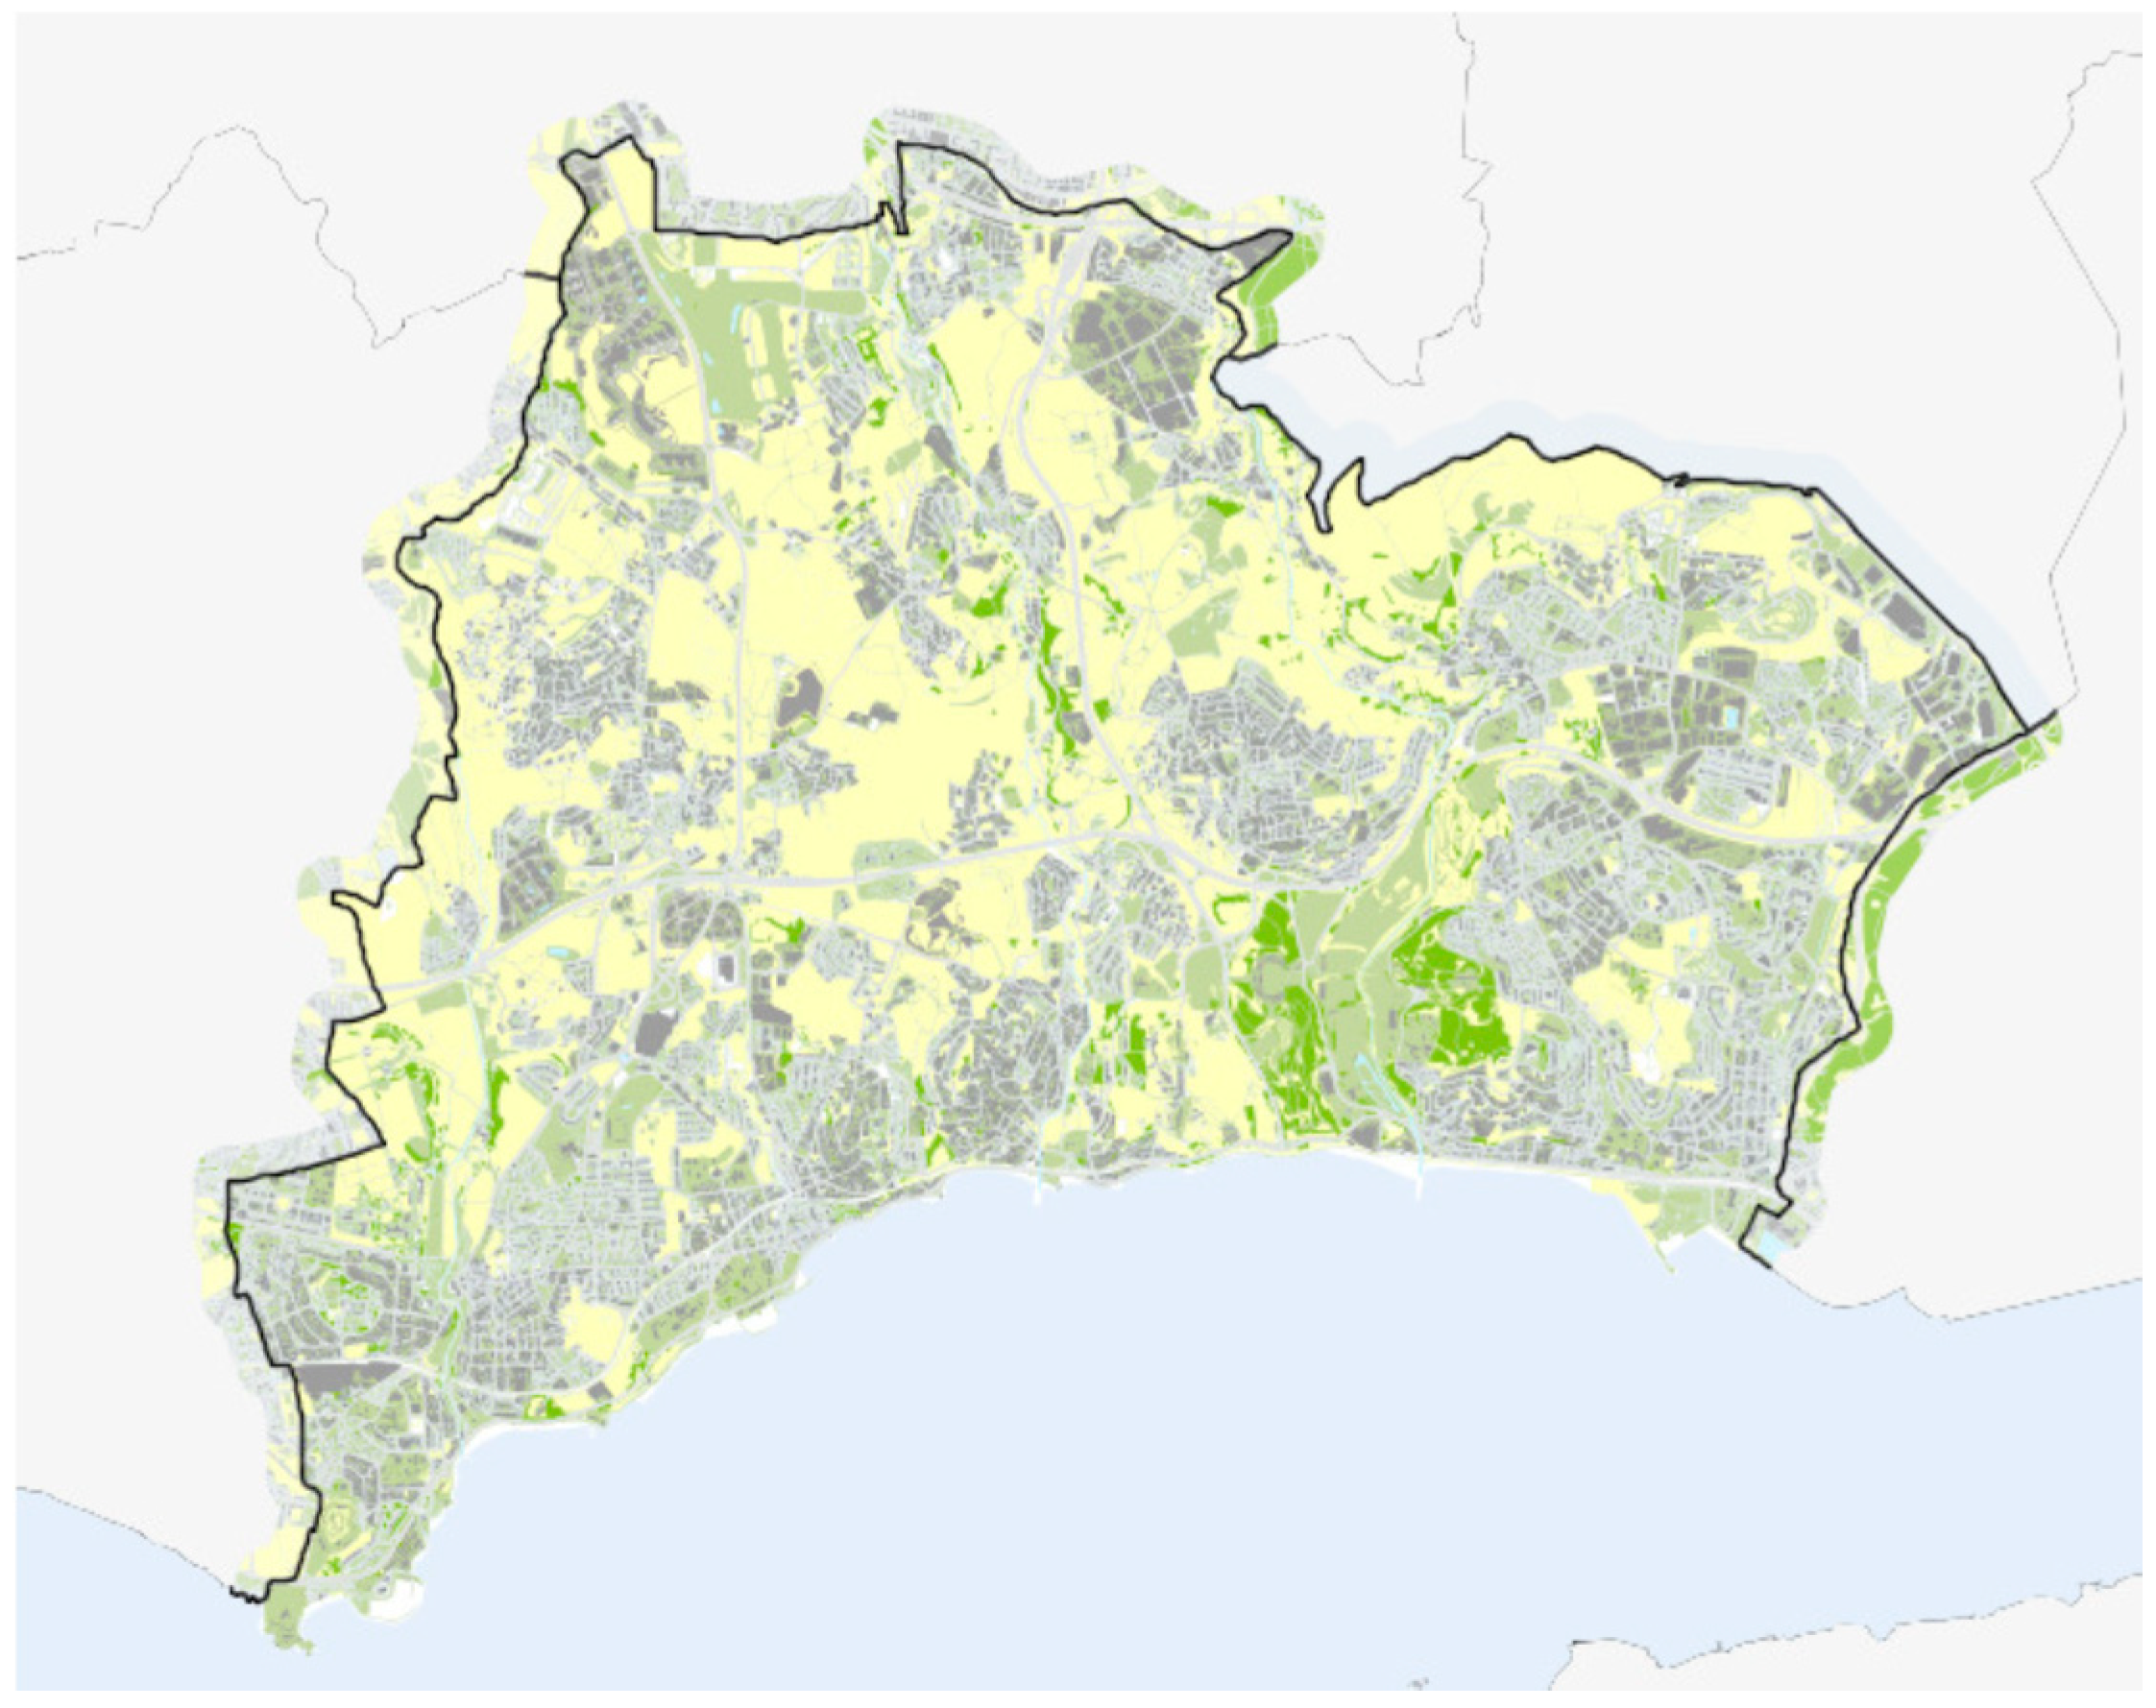
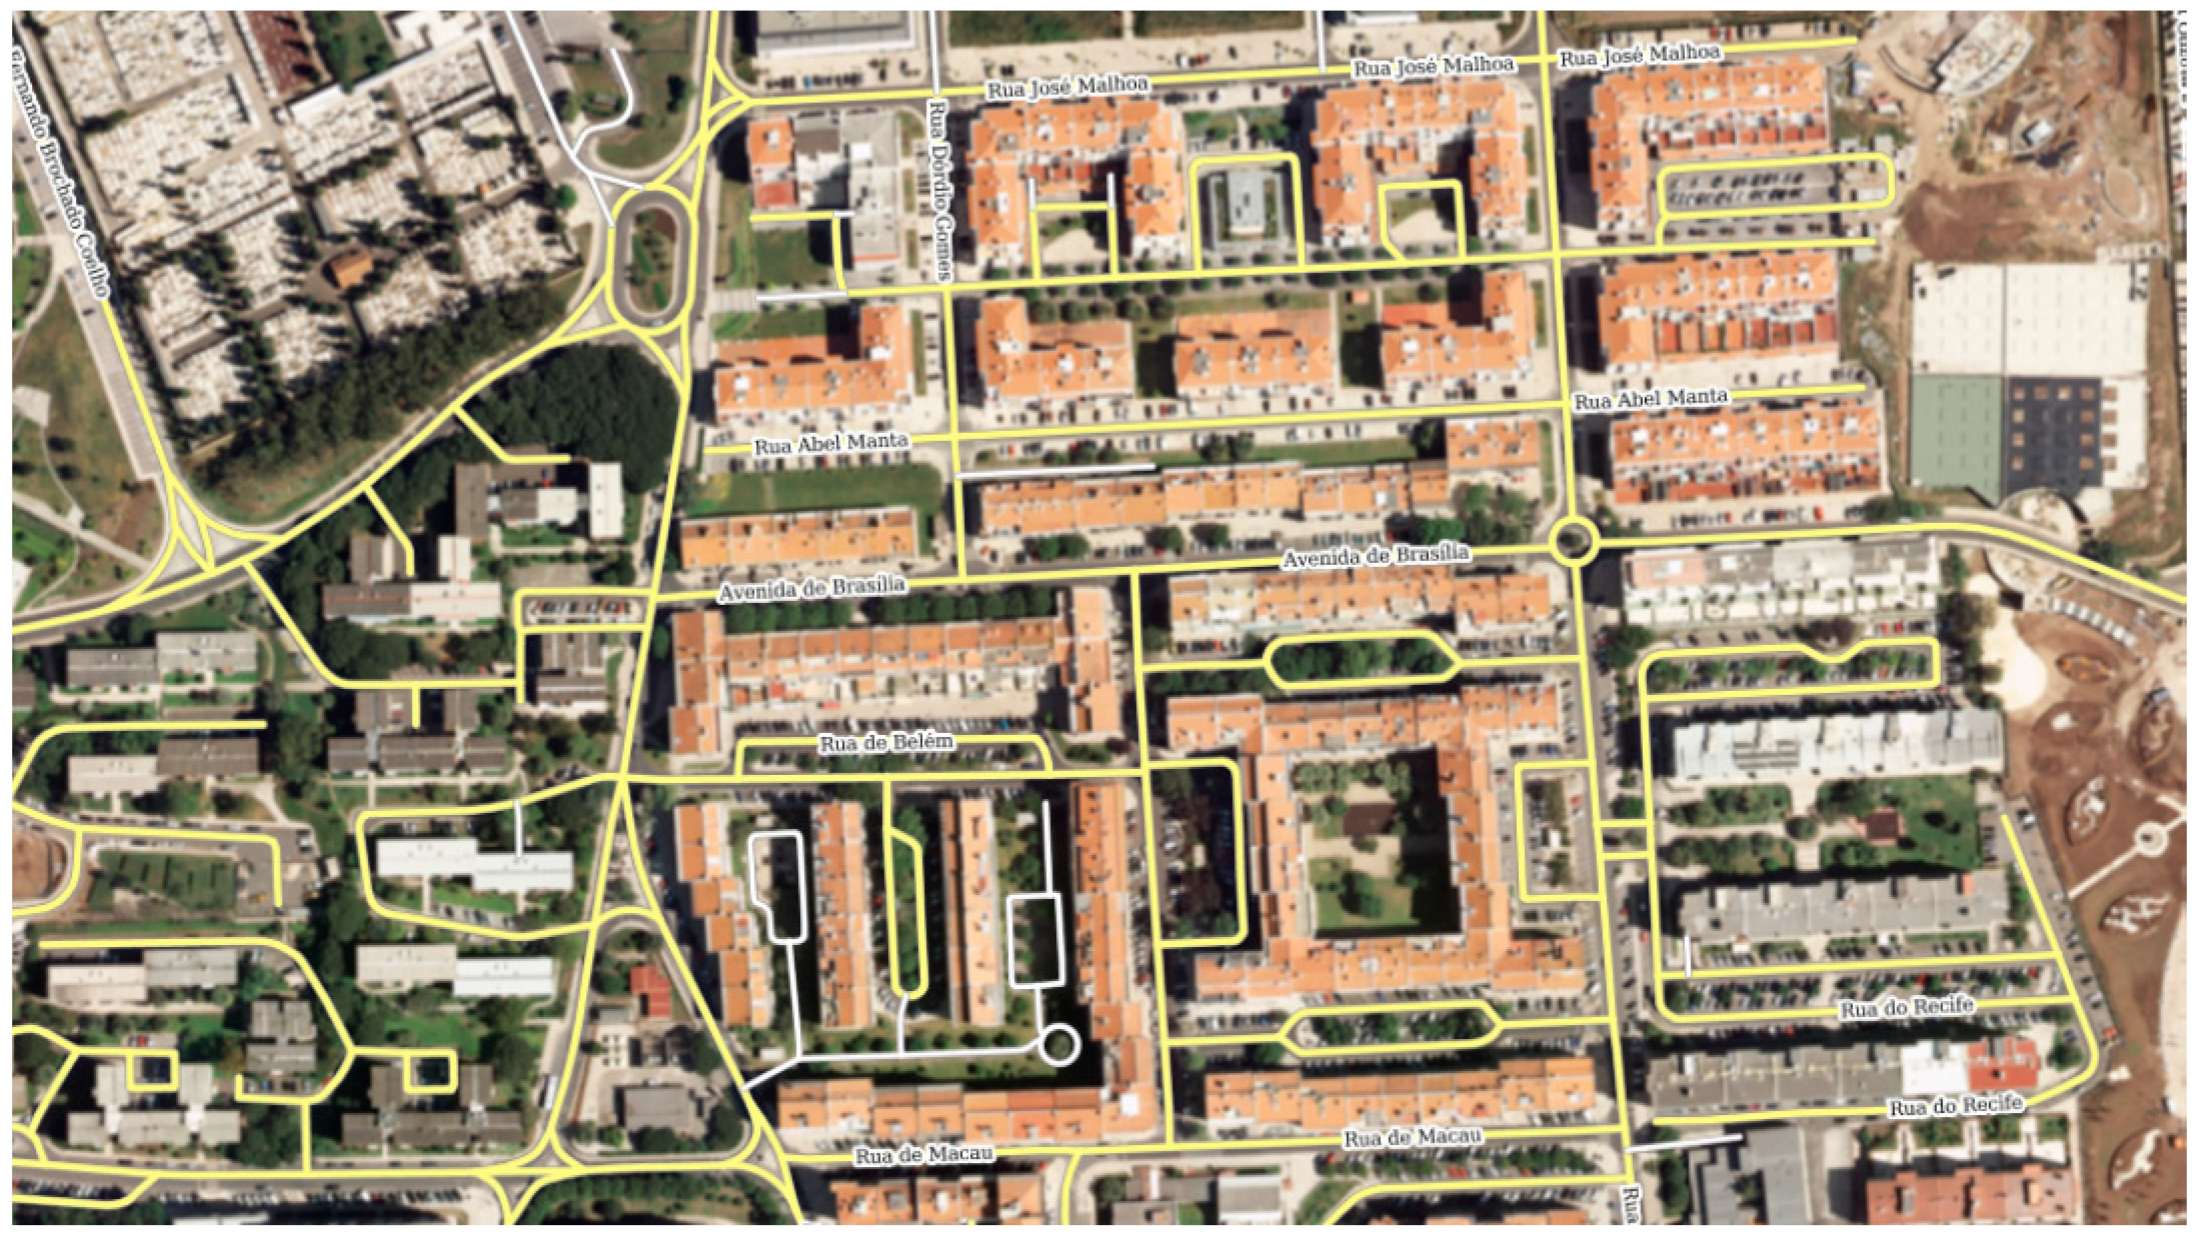
The “context information” provides the geographic framework that supports the web platform, according to the map visualization model of the Municipal GeoPortal of Oeiras [33] (Figure 2, Figure 3 and Figure 4).
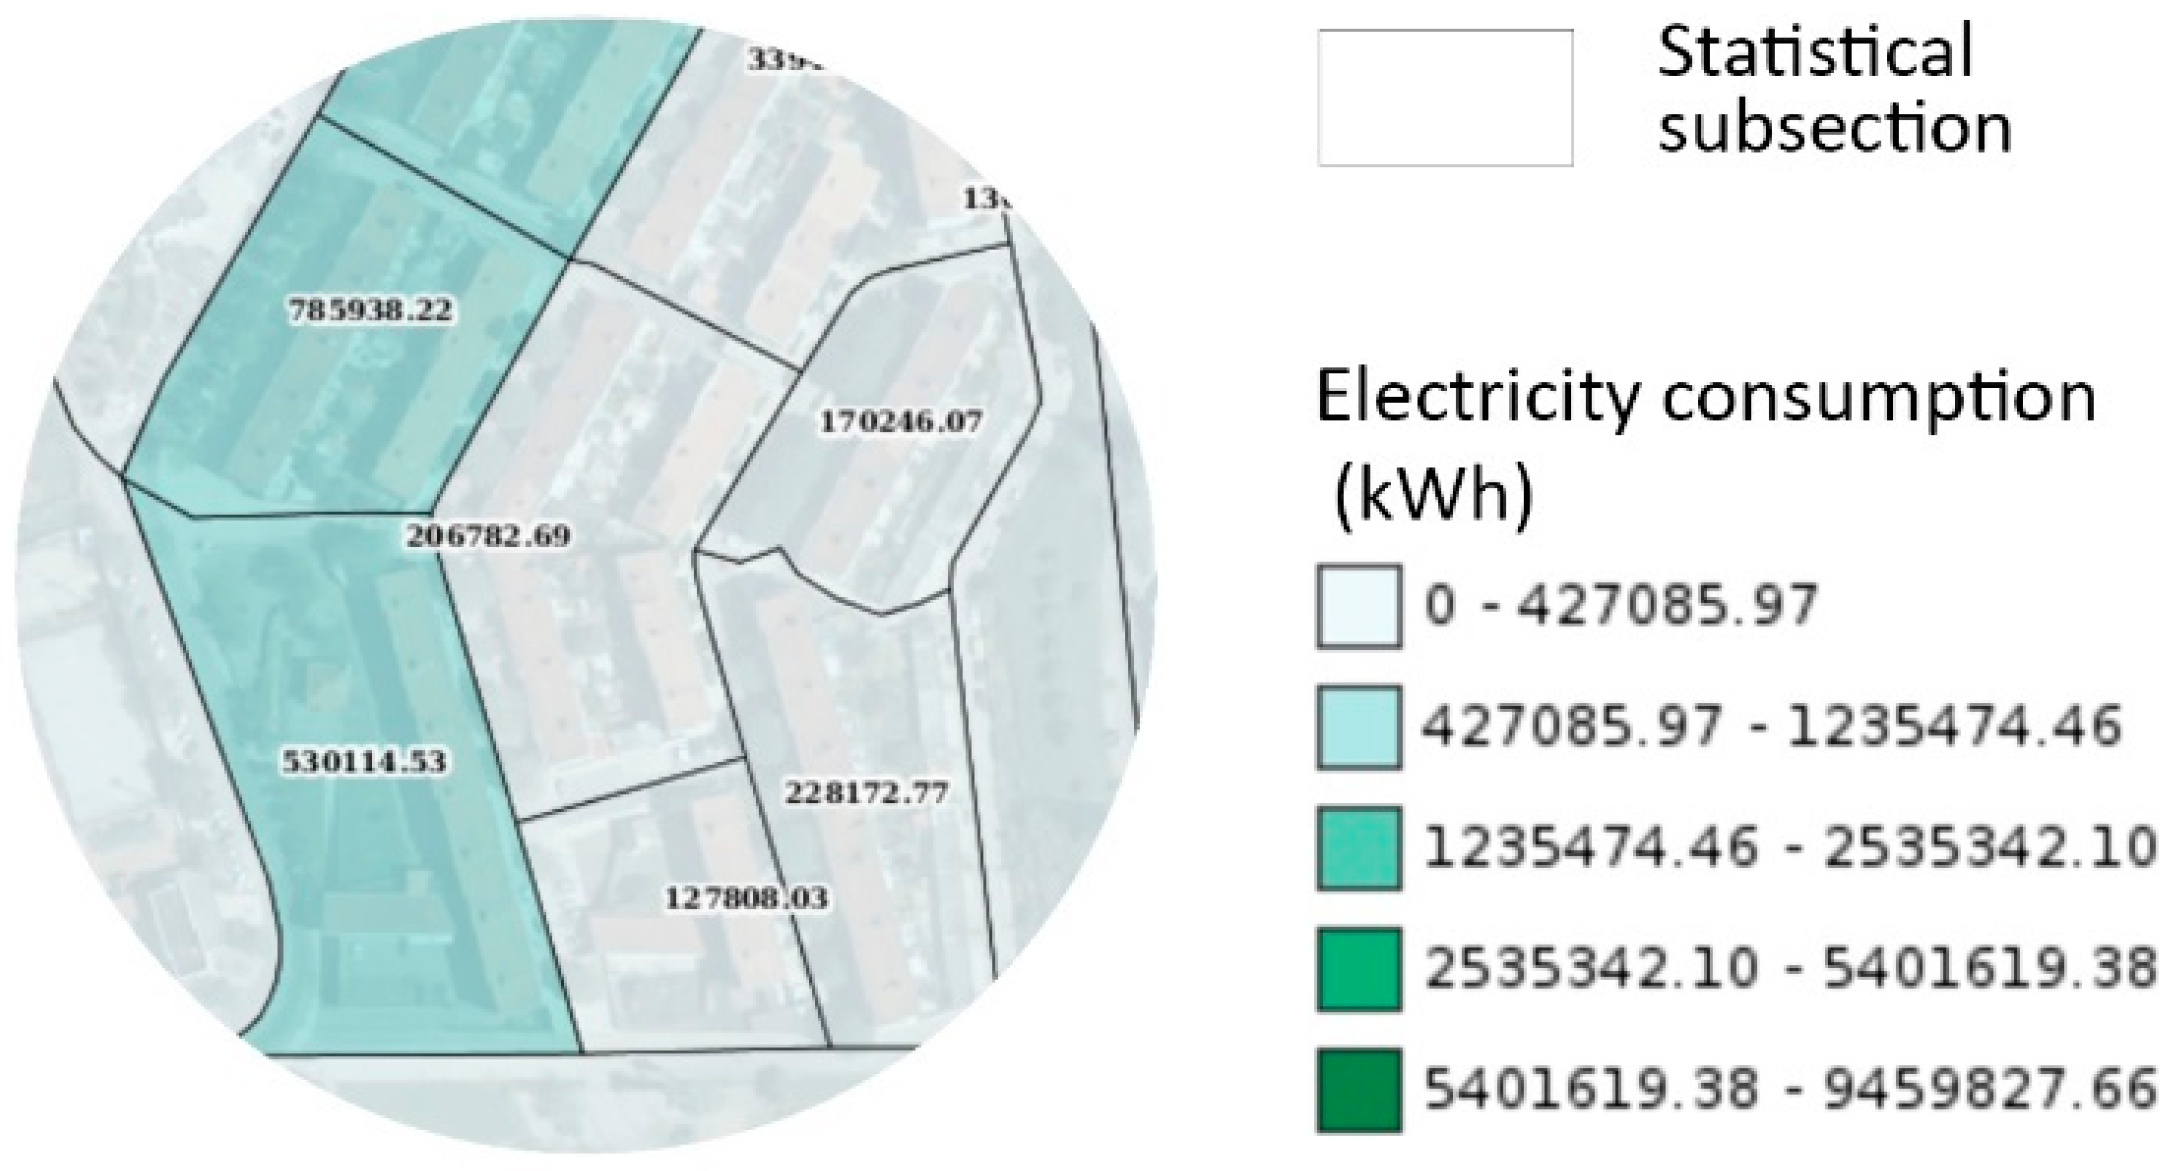
Electricity and gas “consumption data” consider the number of inhabitants, the number of agricultural, industrial, and service companies (public and private), and the number of public lighting posts in each statistical subsection (Figure 5).
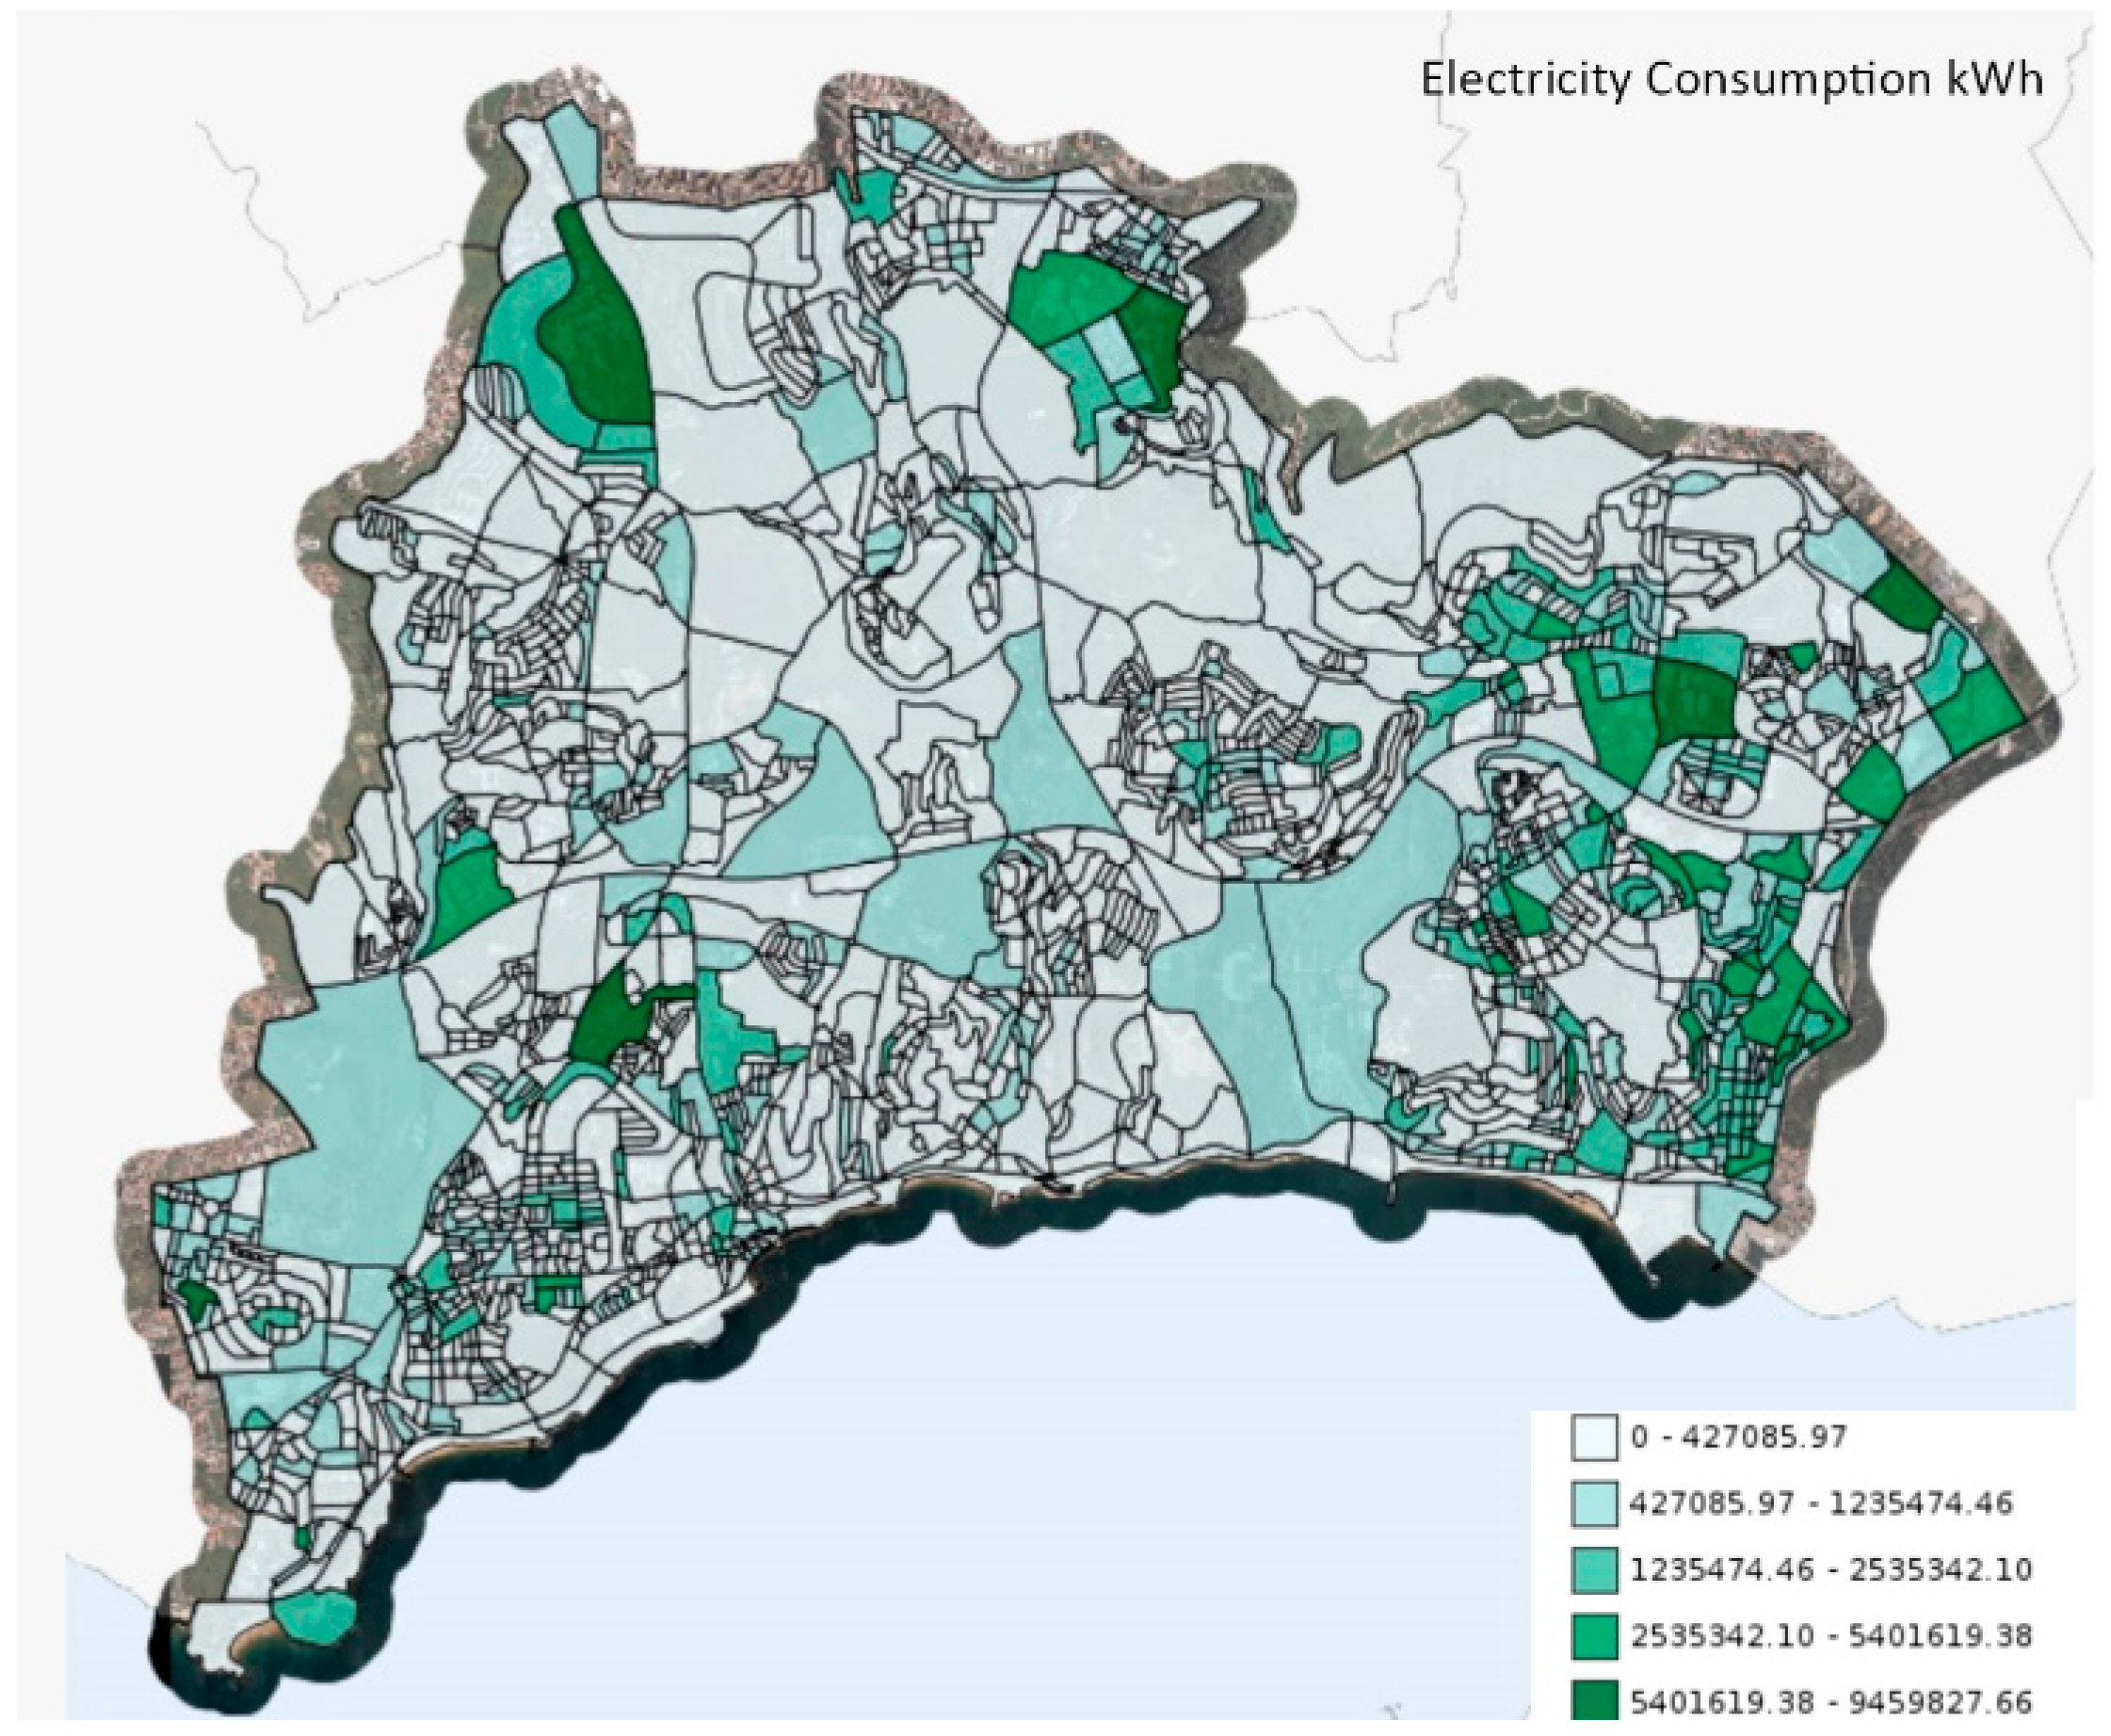
Municipal energy consumption (Figure 6) is divided between the electricity and gas consumption maps which have been elaborated using the statistical information published by the General Directorate of Geology and Energy for the year 2011 [34].
The analysis of carbon dioxide emissions is based on the data published by National Statistical Institute for the year 2007 [35], which are synthetized in the following (Table 2).
The CO2 emissions’ totals from fossil origin and biomass are disaggregated, in accordance with economic activity, industries, and families, and weighted by the national totals. Mapping consider the number of families and the number of companies in each statistical subsection. The energy cost analysis is based on Eurostat data for the year 2012, considering the per capita energy consumption, at statistical subsection level (Table 3).
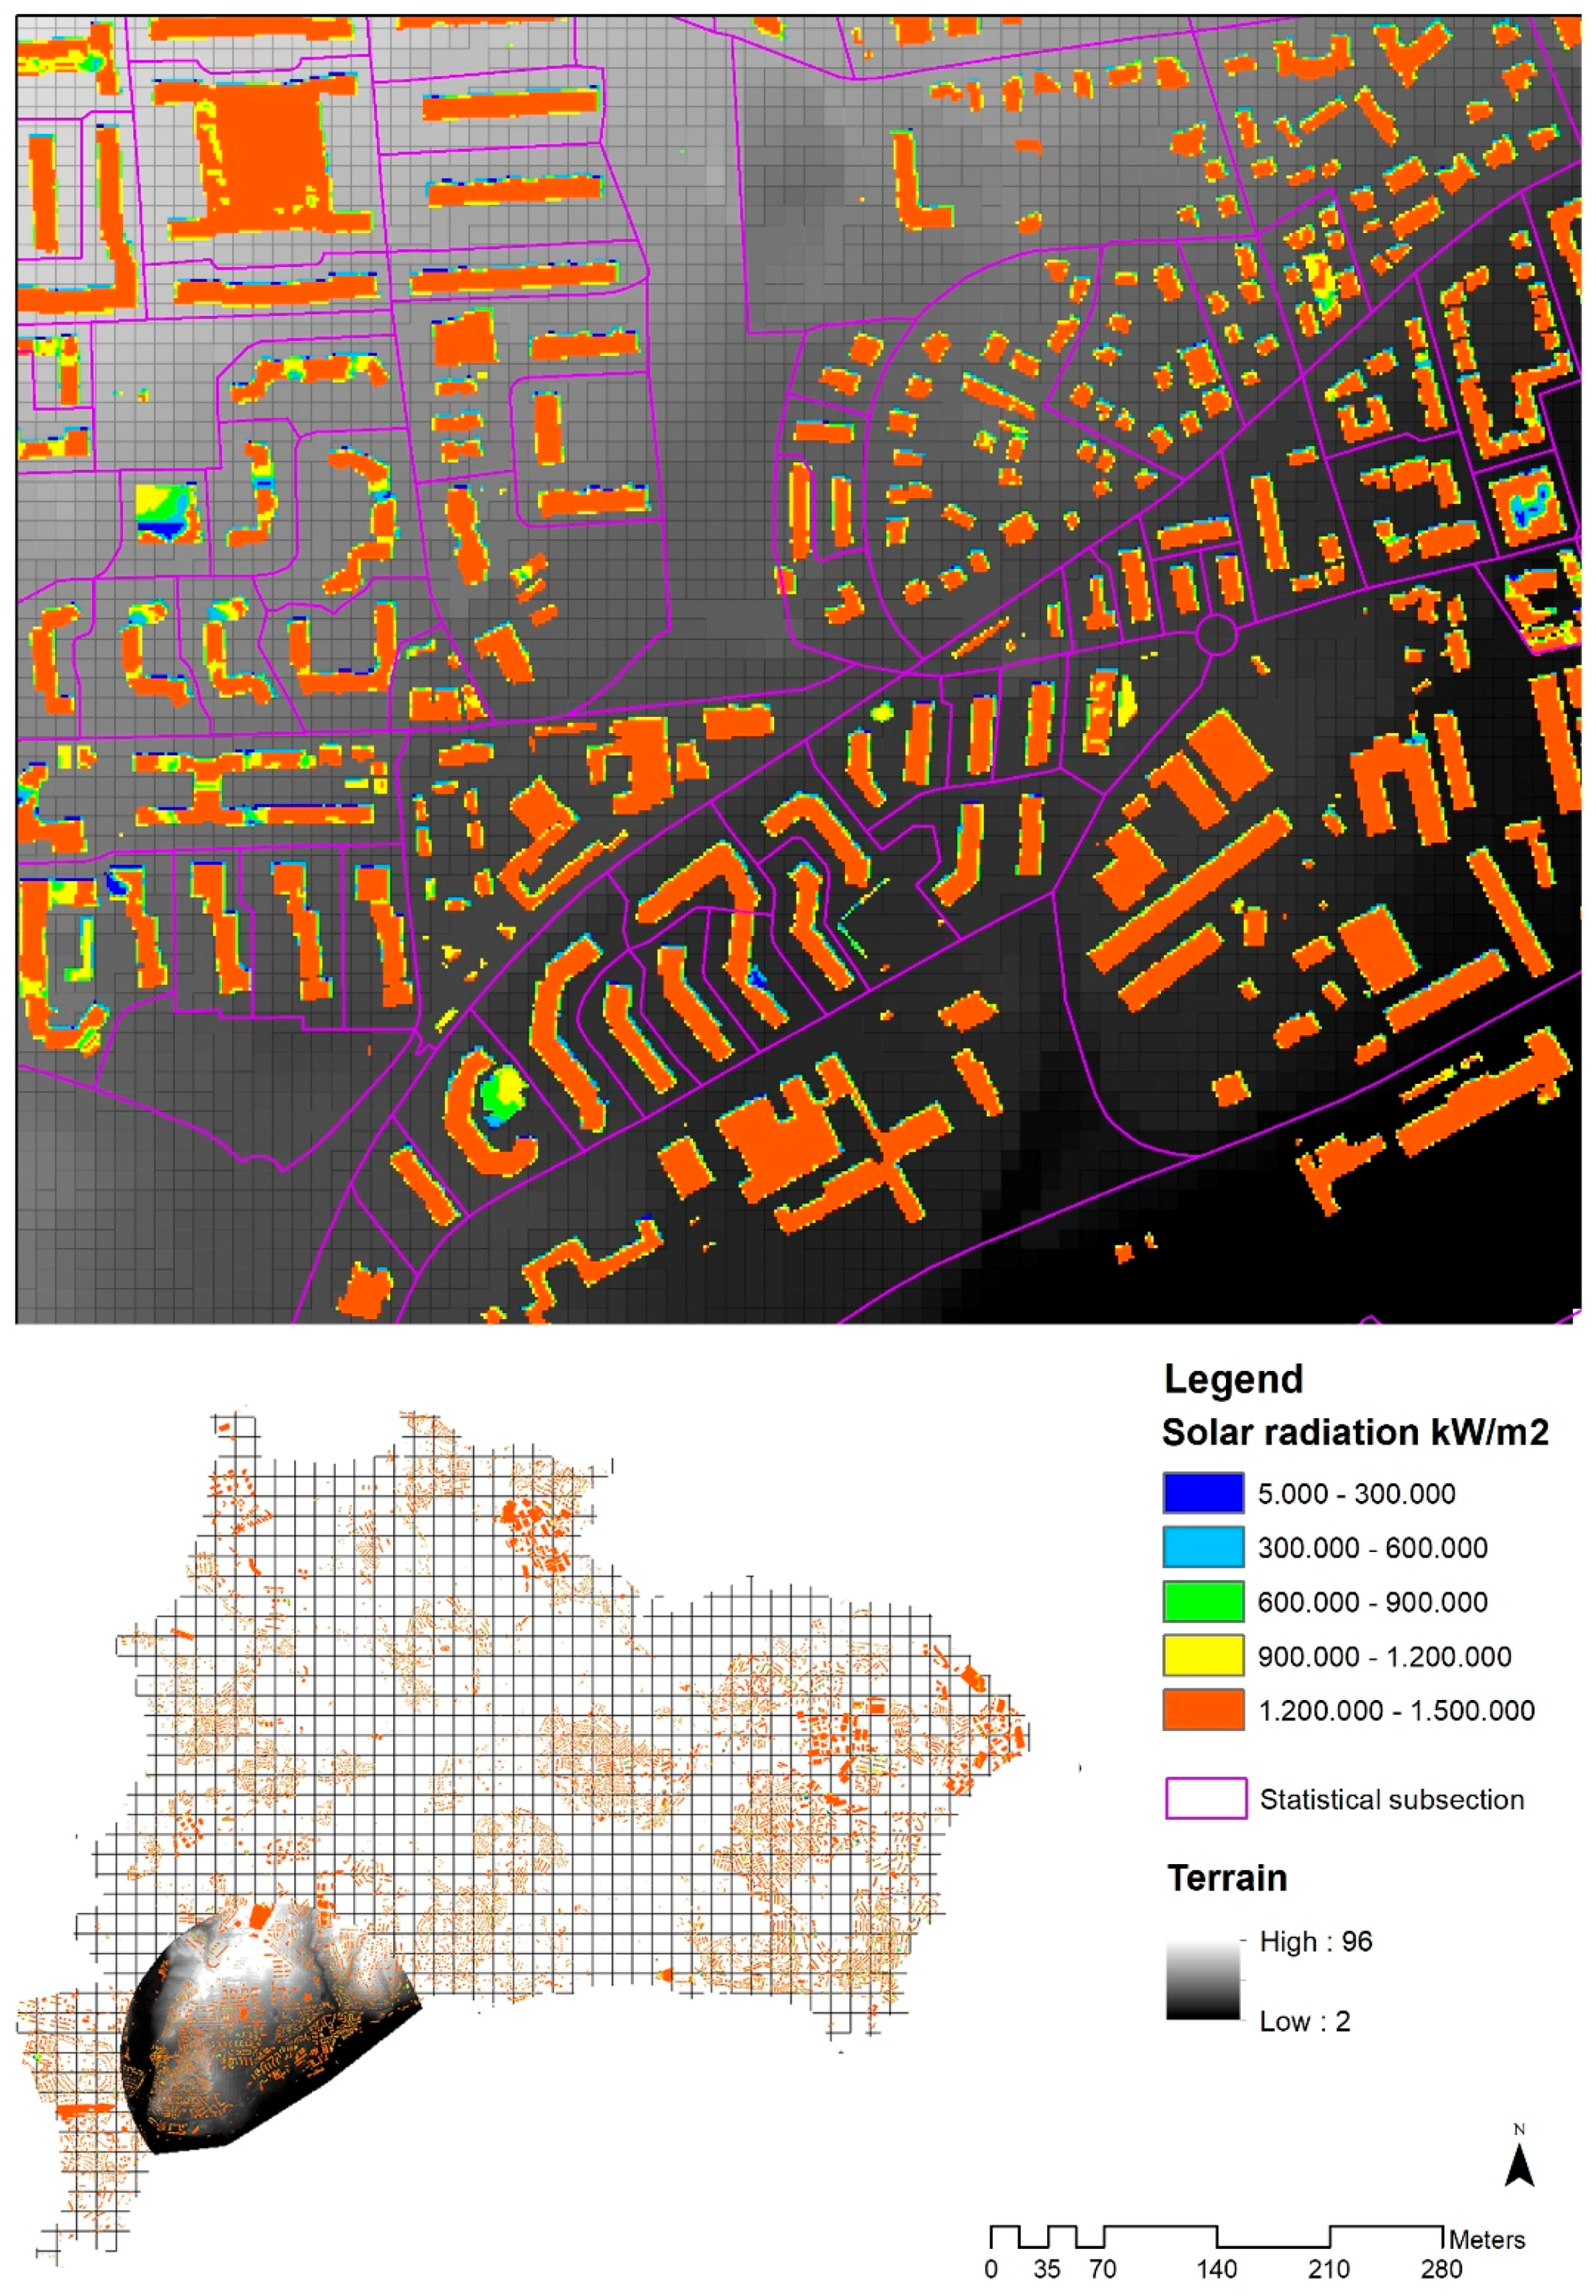
In this study, the energy production side at municipal level was analyzed using the Solar Analyst extension of ArcMap GIS, as it can account for site latitude and elevation, surface orientation, and shadows cast by surrounding topography, daily and seasonal shifts in solar angle, and atmospheric attenuation [36].
In this way, a specific digital model that integrates the terrain and the roofs of buildings was created from contours, elevation points, and ridges obtained through a topographical survey (scale 1: 10,000). The result is a Triangular Irregular Network (TIN) with a spatial resolution of 2 m, from which a raster model of the relief with the same resolution was drawn up.
With this model, it was possible to calculate the irradiation for a large area, accounting not only for the orientations of roofs but also for the shadows originated by the buildings (Figure 7).
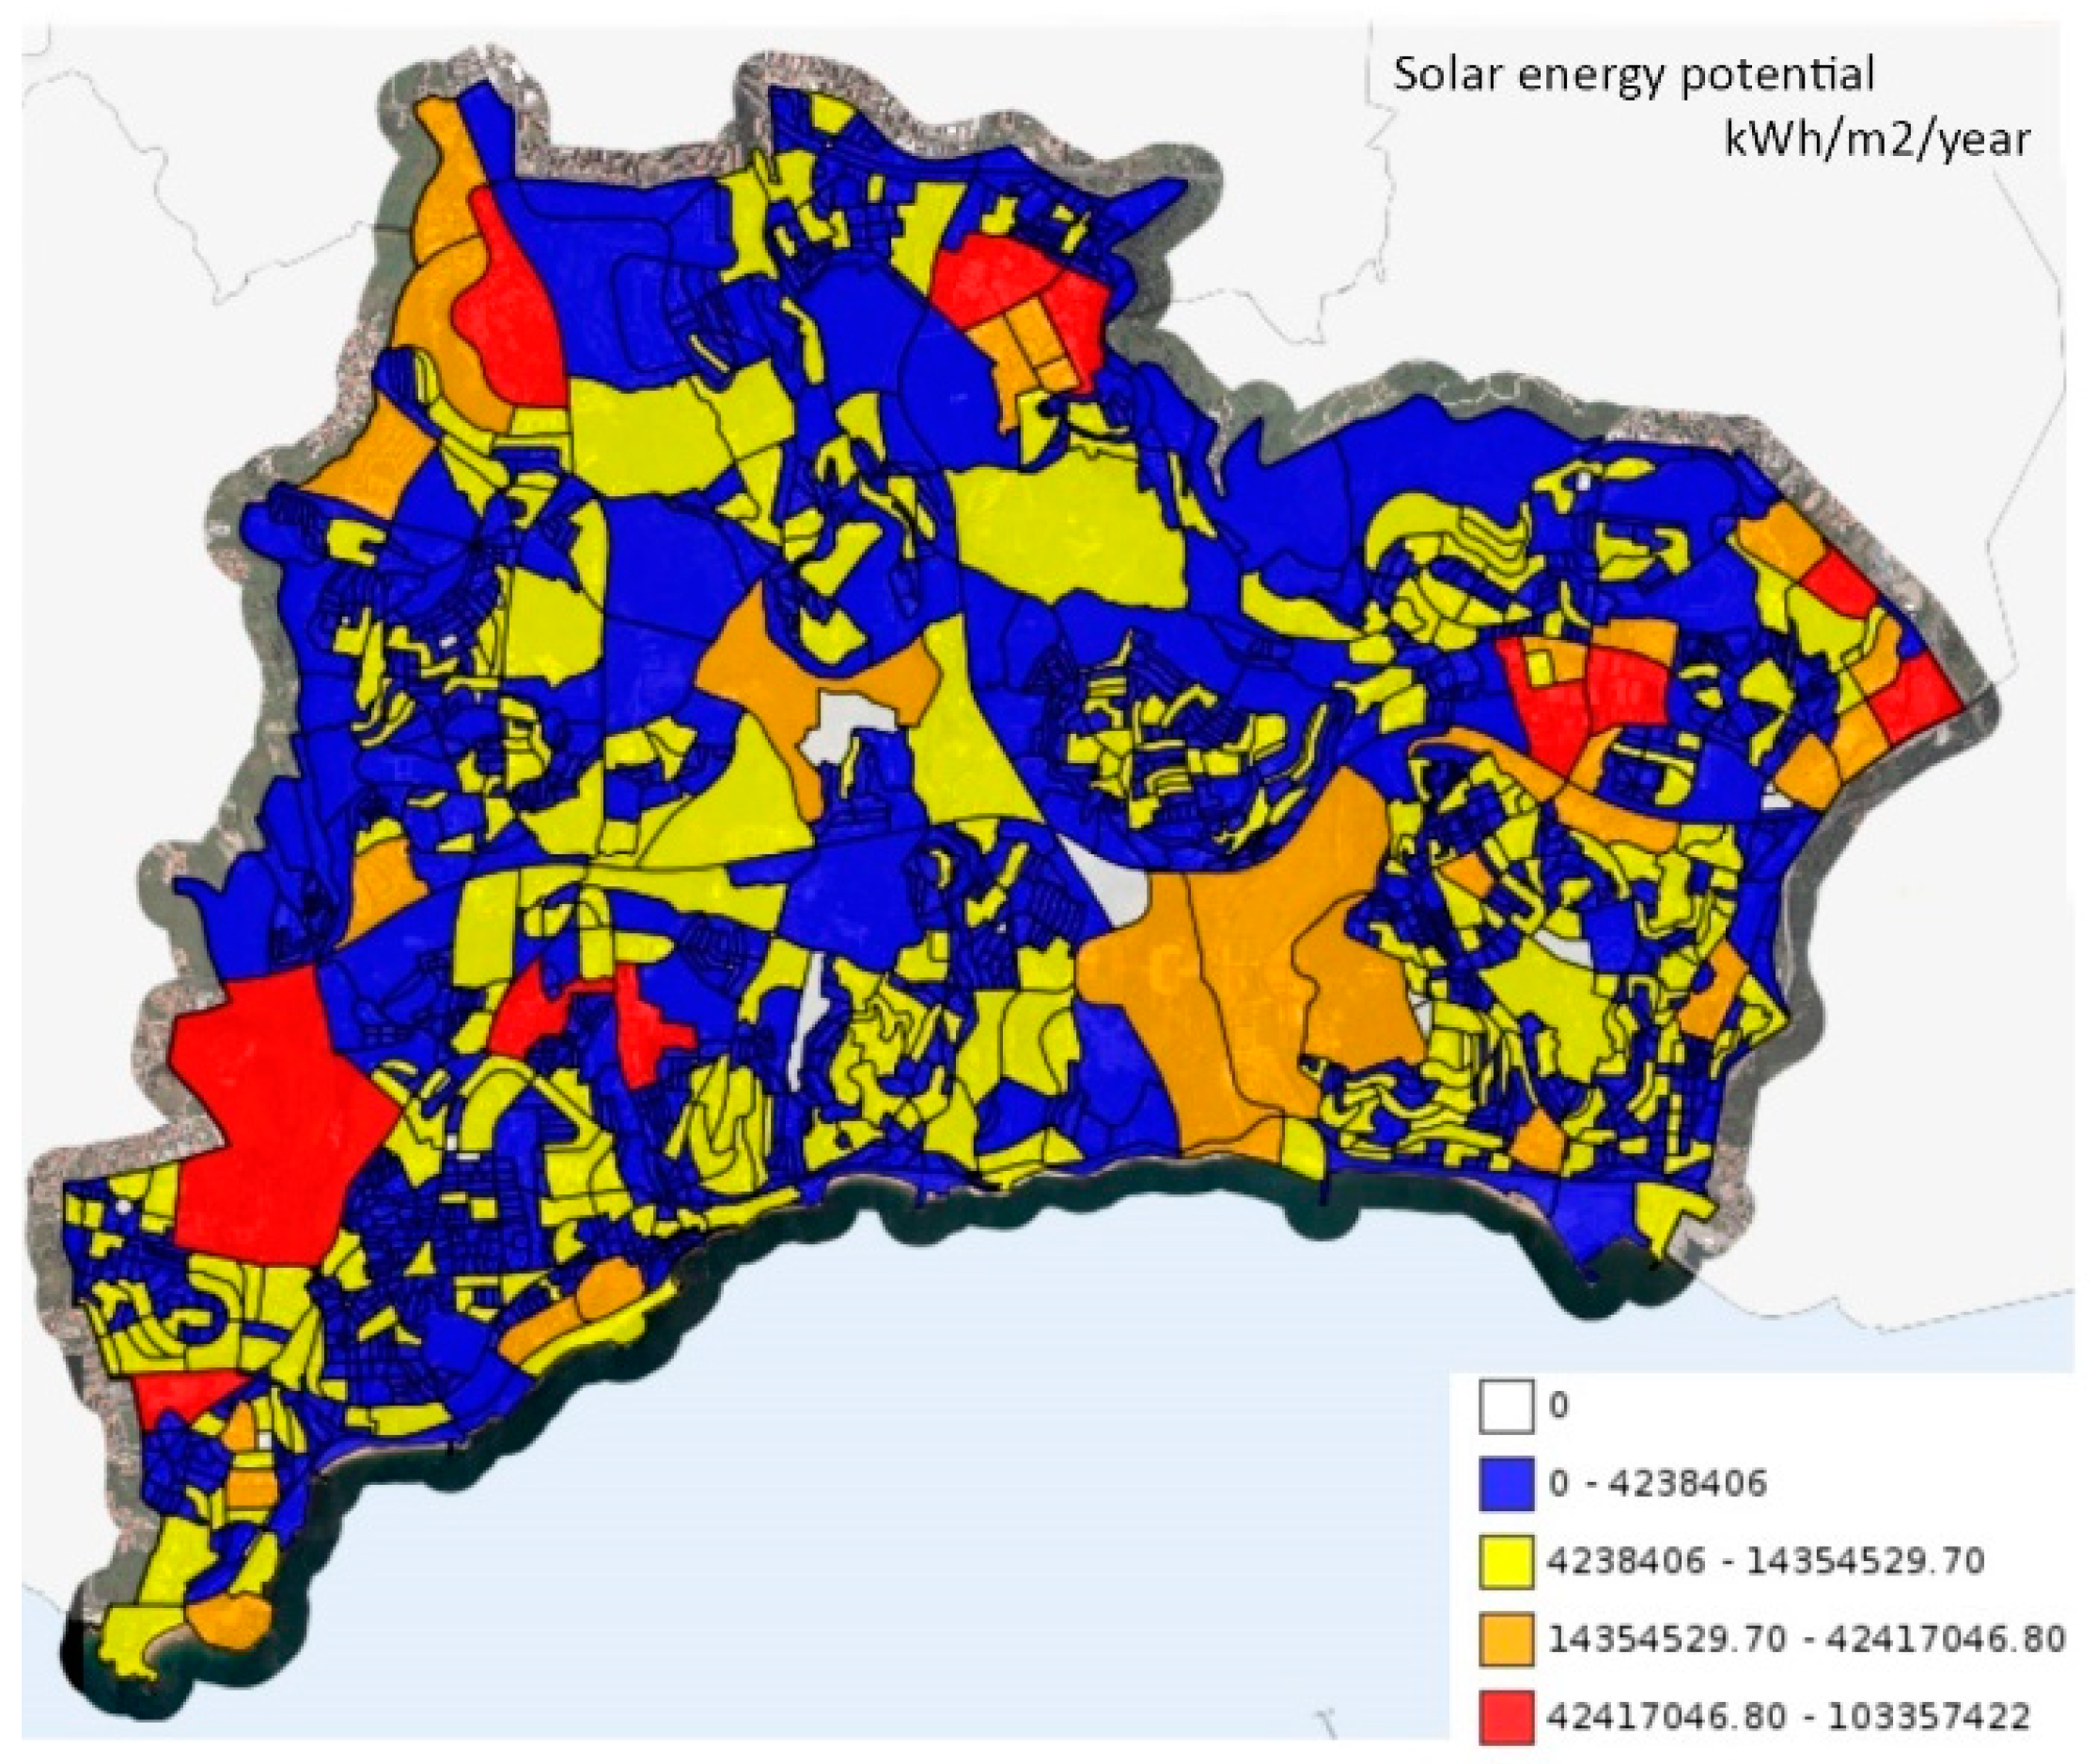
The potential of solar energy production was then translated at the statistical subsection level by making a correlation between the building roofs with at least 20 m2 of area for PV system installation (In this research, the value of at least 20 m2 as installed PV area, has been adopted taking into account the average minimum installed capacity for a residential 2 kW solar PV system [37]) and elevated levels of incident solar radiation estimated by the Solar Analyst (Figure 8).
4. E-City Web Platform
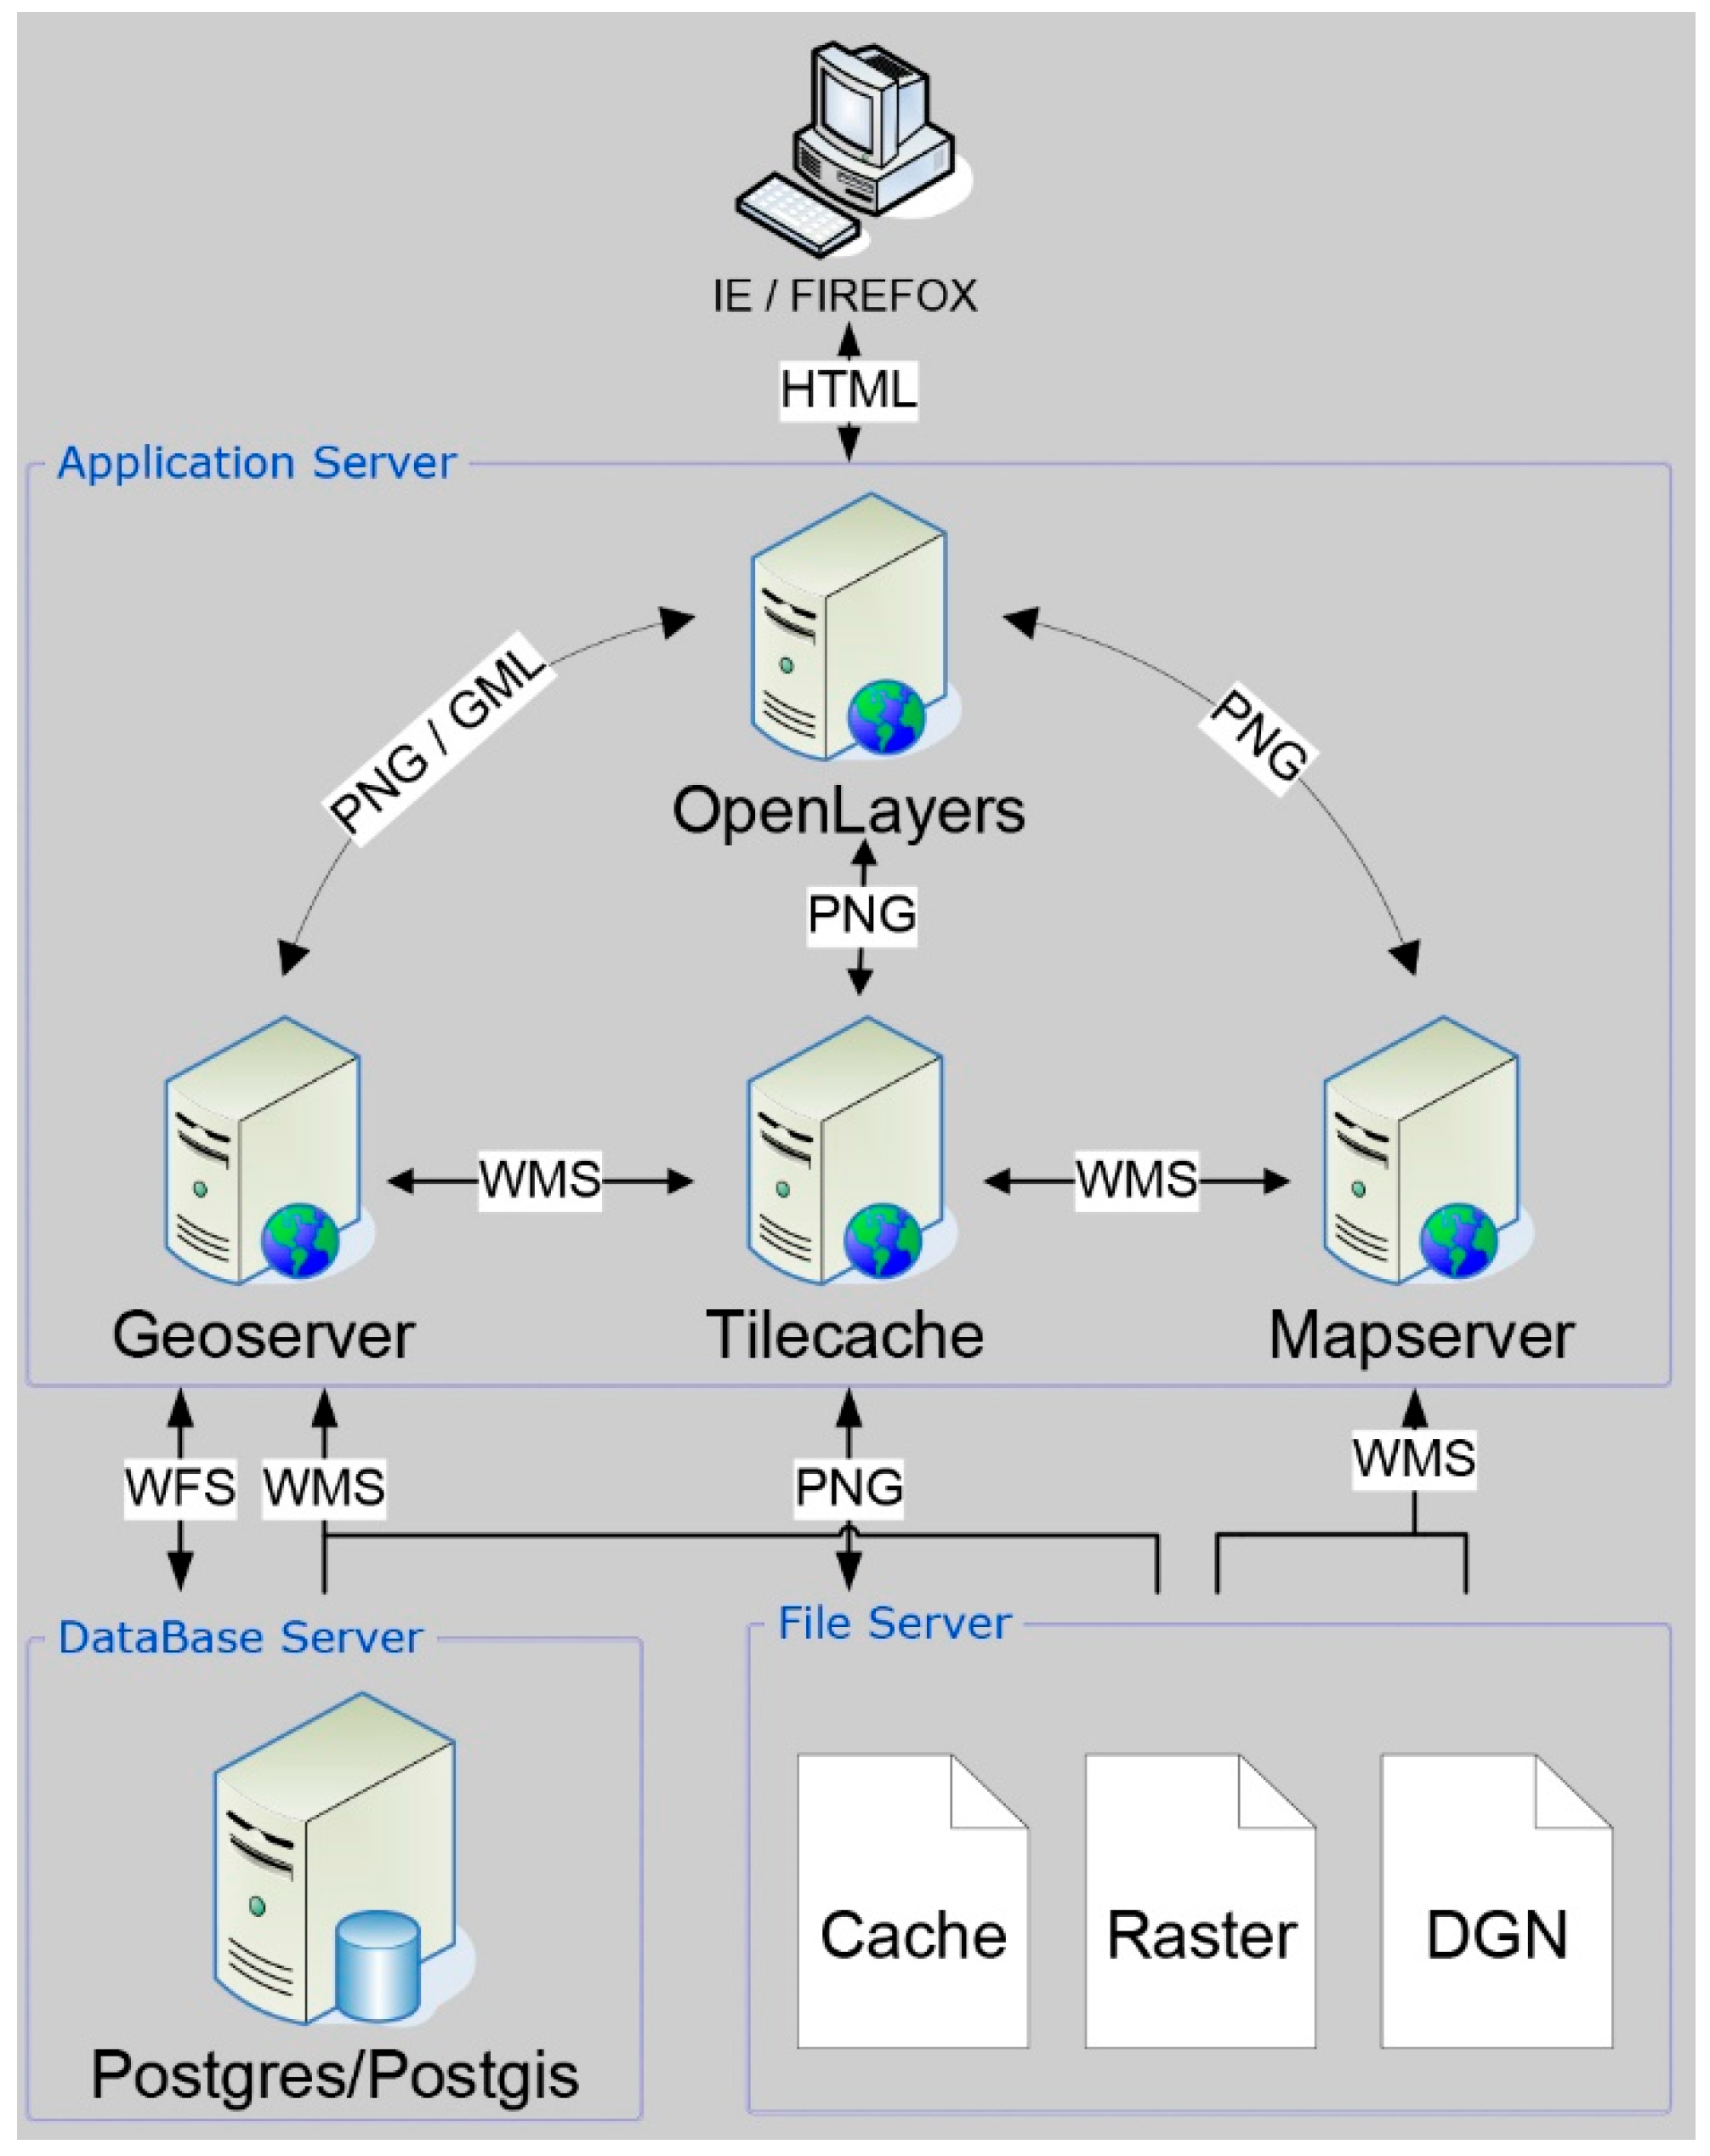
From a practical perspective, the E-City web platform is developed in GIS environment, including visualization, search capability, and interactive item details or description. The system architecture of this WebGIS solution is based on three layers: database server, application server, and file server (Figure 9).
The interface integrates the following technologies and features:
- PostGreSQL: Database Management System;
- PostGIS: Geographic Data Management System;
- GeoServer: Map server software;
- OpenLayers: Web mapping software;
- C # .NET: Programming Language;
- Interoperability between data and services allows the use of information in different environment (intranet, extranet and internet), through the use of Open GIS Consortium (OGC) standards, namely through Web Map services, Web Feature Services, and Web Coverage Services.
- Support of XML and Web Services market standards for integration and interoperability with third-party applications, in particular with any online monitoring system for energy consumption.
The platform operates on a web server, being accessed remotely through HTTP requests and responses, using web browsers. The information is stored in the architecture that also integrates a relational database and a data repository to manage and store alphanumeric information, vector graphics, and raster graphics. Due to the series of existing GIS engines, both via web (WMS or WFS) and local, an API has been developed and implemented to provide flexibility in the use of a GIS and DBMS engine for the access to local data or the visualization by the user.
The E-City web platform is available online at http://geoportal.cm-oeiras.pt/ver/ecity. The WEB environment is simple and fast to allow decision-makers and population to access and use the information (Figure 10).
E-City web platform provides 2D visualization of the whole municipality, as displayed in Figure 9, which shows color-coded simulated energy balance at the statistical subsection level. Here, users can also choose different filters (in a floating window) to visualize information on energy consumption in terms of electricity and gas, costs, and solar energy production.
5. Discussion of Results
Energy issues are of paramount importance regarding the investment in energy efficiency and the usage of renewable energy sources that contribute to the reduction of greenhouse effect gases and the consequent sustainability of society. In this framework, the municipality of Oeiras, together with GEOTPU.LAB, developed the E-city research project aiming to articulate energy consumption and solar energy supply with land use zoning and urban design parameters [22]. Indeed, the E-City platform is a digital tool that results from a rigorous conceptual-theoretical-empirical framework elaborated during 4 years of research on the municipal territory.
Following the research insights, the E-City web platform was developed to visualize and manage energy performances at the municipal scale and it offers one path forward for exploration and experimentation. Here, it is important to refer how this tool has been articulated to the municipal planning process.
First, it played an important role in integrating energy efficiency concerns into Oeiras Municipal Master Plan. The visualization of the potential solar energy production and the existing energy consumption patterns in the built environment led decision-makers and planners to define sustainable energy development as a priority. As such, the municipal regulation approved in 2015 and integrated in its Section 2, the article n. 63: “The urban development plans have to provide a description of their contribution in terms of renewable energy production and energy efficiency level and the proposed energy performance” [38] (p. 42).
Second, it provides an accessible interface to sensitize the wide public on the need to reduce energy use and promote de-installation of solar collectors and PV systems in their municipality.
Third, it constitutes a tool that can further evolve toward a real time municipal energy monitoring platform, based on data collected from the smart meters and the communication technologies integrated in the network.
Finally, the novel energy efficiency background of the E-City web platform permits the identification of those issues considered as having a direct relation to local planning as well as the existing limitations (both theoretical and practical). The theoretical approach adopted in the present study relies on the concept of energy balance as the guiding principle to develop the energy-efficient city model. Far from turning cities into energy self-sufficient areas, this argument promotes the municipal and urban planning processes as both catalysts of energy efficiency and solar energy, translating the Net-Zero energy building model approach to the urban level. This can be a limitation if associated with the idea of the city as a closed system, or it can be an essential premise for an innovative planning process that considers urban areas and rural areas as a whole energetically balanced [39].
At the practical level, the main limitation of E-City web platform is that energy consumption data are correlated to the statistical subsections resulting in a tool that does not deliver real time data. Indeed, information could be more accurate if smart and advanced meters would be installed in the buildings across the municipality.
Another of its limitations lies in the solar energy potential estimation method that considers all the roofs as planes and adopts an approximate surface with at least 20 m2 of area for PV system installation. A digital model obtained from LiDAR data would permit a more accurate calculation of roof parameters, such as the hill shade, slope, and aspect [37].
6. Conclusions
With the increasing energy demand associated with cities, the need for energy efficiency integration into the municipal planning process is today a fundamental step. The development of an energy efficient city, supported by ICT and digital solutions for management and planning, is thus an opportunity to increase its competitiveness and sustainability. The E-City web platform, presented in this paper, integrates itself with the existing municipal GIS, developing both the spatial and statistical dimensions associated with zoning and the municipal energy system. It was specifically created to organize and visualize energy performance data at municipal scale and make them accessible to planners, stakeholders, and population. In practical terms, this tool has been used by the public administration of Oeiras to understand important aspects associated with existing and future urban development.
For instance, electricity and gas consumption maps permit the visualization of how and why an existing urban block negatively influences the energy balance due to its form, orientation, density, construction year, heating and cooling systems, or materials used for the roof, exterior walls, and window. Indeed, these aspects are key to promote energy efficiency through urban planning and construction regulation, by elaborating specific refurbishment programs for existing buildings and guidelines for new urban expansions [22].
The solar energy potential map is another key tool to visualize where there is a real opportunity to promote PV systems in building roofs. Finally, the energy balance scenario leads to the ongoing revolution associated with the Smart Grids and ICT that will allow the monitorization and optimization of energy performance in real time.
In this sense, the future development of the E-City web platform will be focused on smart meters and sensor integration in pilot projects to monitor energy flows at urban scale. The articulation of these technologies with the WebGIS architecture will provide the shift of the platform, from the actual static system to an interactive system which shows real-time data, considering energy consumption, production, distribution, and storage dynamics across the municipality.
Results and insights from the use of this tool are relevant to understand how urban planners, policy-makers, stakeholders, and the public can be informed and guided towards more energy-efficient solutions. The Net-Zero energy balance is an ambitious but promising approach to promote the integration of solar energy, energy efficiency, and smart grids in cities, leading to an organized change with long term effects. Indeed, it is a new paradigm that aims to encourage planners to focus on city and its relationships with energy as a complex whole, connecting energy performances of the built environment with the planning framework at municipal scale.
Author Contributions
M.A., F.P. and A.R.A. have contributions to conception and design the research, acquisition of data, analysis and interpretation of data; drafting the article and revising it critically for important intellectual content; S.B. have a contribution in the analysis and interpretation of data and in revising it critically for technical content; All authors have a contribution in the final approval of the version of the paper to be published.
Funding
This research was funded by European Commission Funds—FEDER n. 2012–267/9002-LISBOA-01-0527-FEDER-000739 in the framework of the PTQREN/267-9002/2012) leaded by the Oeiras Municipality and GEOTPU.LAB—Laboratory of Architecture, Territory and Urban Planning Studies of IST UL.
Acknowledgments
The second and third author thank the Portuguese Fundação para a Ciência e Tecnologia (FCT) for the financial support through PhD Fellowship.
Conflicts of Interest
The authors declare no conflicts of interest.
References
- Booth, C.; Felix, H.; Jessica, L.; David, P. Solutions for Climate Change Challenges in the Built Environment; John Wiley & Sons: Hoboken, NJ, USA, 2012; ISBN 978-1-4051-9507-2. [Google Scholar]
- International Energy Agency. Energy Technology Perspectives 2016. 2016. Available online: https://www.iea.org/publications/freepublications/publication/EnergyTechnologyPerspectives2016_ExecutiveSummary_EnglishVersion.pdf (accessed on 1 December 2017).
- Janssen, M.; Anthopoulos, L.; Weerakkody, V. A Unified Smart City Model USCM for Smart City Conceptualization and Benchmarking. Int. J. Electron. Gov. Res. 2016, 12, 77–93. [Google Scholar] [CrossRef]
- Fusero, P. E-City. Digital Networks and Future Cities; List: Barcelona, Spain, 2008; ISBN 8895623061. [Google Scholar]
- Mosannenzadeh, F.; Bisello, A.; Vaccaro, R.; D’Alonzo, V.; Hunter, G.W.; Vettorato, D. Smart energy city development: A story told by urban planners. Cities 2017, 64, 54–65. [Google Scholar] [CrossRef]
- Carillo-Aparicio, S.; Heredia-Larrubia, J.R.; Perez-Hidalgo, F. SmartCity Málaga, a real-living lab and its adaptation to electric vehicles in cities. Energy Policy 2013, 62, 774–779. [Google Scholar] [CrossRef]
- Angelidou, M. Smart city policies: A spatial approach. Cities 2014, 41, S3–S11. [Google Scholar] [CrossRef]
- Amsterdam Smart City Energy, Water & Waste Projects. Available online: https://amsterdamsmartcity.com/themes/energy-water-waste/projects (accessed on 7 December 2017).
- Deakin, M.; Reid, A. Smart cities: Under-gridding the sustainability of city-districts as energy efficient-low carbon zones. J. Clean. Prod. 2018, 173, 39–48. [Google Scholar] [CrossRef]
- Kourtit, K.; Nijkamp, P.; Steenbruggen, J. The significance of digital data systems for smart city policy. Socio Econ. Plan. Sci. 2017, 58, 13–21. [Google Scholar] [CrossRef]
- Barns, S. Smart cities and urban data platforms: Designing interfaces for smart governance. City Cult. Soc. 2017. [Google Scholar] [CrossRef]
- Bremer, M.; Mayr, A.; Wichmann, V.; Schmidtner, K.; Rutzinger, M. A new multi-scale 3D-GIS-approach for the assessment and dissemination of solar income of digital city models. Comput. Environ. Urban Syst. 2016, 57, 144–154. [Google Scholar] [CrossRef]
- Amado, M.; Poggi, F.; Ribeiro Amado, A.; Breu, S. A Cellular Approach to Net-Zero Energy Cities. Energies 2017, 10, 1826. [Google Scholar] [CrossRef]
- Monteiro, C.S.; Costa, C.; Pina, A.; Santos, M.Y.; Ferrão, P. An urban building database (UBD) supporting a smart city information system. Energy Build. 2018, 158, 244–260. [Google Scholar] [CrossRef]
- Kim, S.A.; Shin, D.; Choe, Y.; Seibert, T.; Walz, S.P. Integrated energy monitoring and visualization system for Smart Green City development: Designing a spatial information integrated energy monitoring model in the context of massive data management on a web based platform. Autom. Constr. 2012, 22, 51–59. [Google Scholar] [CrossRef]
- Puerto, P.; Pernet, M.; Capezzali, M.; Darmayan, L.; Cherix, G. The MEU web platform: A tool dedicated to urban energy management. In Proceedings of the International Conference CISBAT 2015 Future Buildings and Districts Sustainability from Nano to Urban Scale, Lausanne, Switzerland, 9–11 September 2015; pp. 1005–1010. [Google Scholar]
- Yamamura, S.; Fan, L.; Suzuki, Y. Assessment of Urban Energy Performance through Integration of BIM and GIS for Smart City Planning. Procedia Eng. 2017, 180, 1462–1472. [Google Scholar] [CrossRef]
- Yamamura, S. Combining BIM and GIS for a Sustainable Society. Available online: https://www.gim-international.com/content/article/combining-bim-and-gis-for-a-sustainable-society (accessed on 1 July 2018).
- Staso, U.; Giovannini, L.; Berti, M.; Prandi, F.; Cipriano, P.; Amicis, R.D. Large-scale residential energy maps: Estimation, validation and visualization project SUNSHINE—Smart Urban Services for Higher Energy Efficiency. In Communications in Computer and Information Science, Proceedings of the International Conference on Data Management Technologies and Applications, Vienna, Austria, 29–31 August 2014; Helfert, M., Holzinger, A., Belo, O., Francalanci, C., Eds.; Springer: New York, NY, USA, 2014; pp. 28–44. [Google Scholar]
- Hong, T.; Chen, Y.; Lee, S.H.; Piette, M. CityBES: A Web-based platform to support city-scale building energy efficiency. In Proceedings of the 5th International Urban Computing Workshop, San Francisco, CA, USA, 13 August 2016. [Google Scholar]
- Eicker, U.; Klein, M. Large-scale renewable energy integration within energy-efficient urban areas: Results from three German case studies. Int. J. Low Carbon Technol. 2012, 2, 1–12. [Google Scholar] [CrossRef]
- Amado, M.; Poggi, F.; Amado, A.R. Energy efficient city: A model for urban planning. Sustain. Cities Soc. 2016, 26, 476–485. [Google Scholar] [CrossRef]
- Fish, C.S.; Calvert, K. An Analysis of Interactive Solar Energy Web Maps for Urban Energy Sustainability. Cartogr. Perspect. 2017, 5–22. [Google Scholar] [CrossRef]
- Freitas, S.; Catita, C.; Redweik, P.; Brito, M.C. Modelling solar potential in the urban environment: State-of-the-art review. Renew. Sustain. Energy Rev. 2015, 41, 915–931. [Google Scholar] [CrossRef] [Green Version]
- Avellana, N.; Fernandez, A. iURBAN: Intelligent Urban Energy Tool; River Publishers: Delft, The Netherlands, 2016; ISBN 978-87-93519-10-7. [Google Scholar]
- iUrban Consortium. iURBAN Platform Architecture. Available online: http://www.iurban-project.eu/results-en/iurban-platform-architecture.html (accessed on 15 December 2017).
- Corrado, V.; Ballarini, I.; Madrazo, L.; Nemirovskij, G. Data structuring for the ontological modelling of urban energy systems: The experience of the SEMANCO project. Sustain. Cities Soc. 2015, 14, 223–235. [Google Scholar] [CrossRef]
- Madrazo, L.; Nemirovskij, G.; Sicilia, A. Shared vocabularies to support the creation of energy urban systems models. In Proceedings of the 4th Workshop Organized by the EEB Data Models Community, Nice, France, 9–11 September 2013. [Google Scholar]
- Sustainable Engineering Lab New York City Building Energy Map. Available online: http://qsel.columbia.edu/nycenergy/ (accessed on 11 January 2018).
- Howard, B.; Parshall, L.; Thompson, J.; Hammer, S.; Dickinson, J.; Modi, V. Spatial distribution of urban building energy consumption by end use. Energy Build. 2012, 45, 141–151. [Google Scholar] [CrossRef]
- Amado, M.; Poggi, F. Solar Energy Integration in Urban Planning: GUUD Model. Energy Procedia 2014, 50, 277–284. [Google Scholar] [CrossRef]
- Oeiras Municipality. Characterization and Diagnosis Report of Oeiras Municipality 2011 (Relatório de Caracterização e Diagnóstico do Município de Oeiras 2011). Available online: http://pdm.cm-oeiras.pt/default.aspx?pg=1fe3e441-b5c0-476e-8720-7c1aa8c04f67 (accessed on 18 December 2017).
- Oeiras Municipality. Municipal Geoportal. Available online: http://geoportal.cm-oeiras.pt/ver/mapas (accessed on 7 January 2018).
- General Directorate of Geology and Energy. Statistics and Prices. Available online: http://www.dgeg.gov.pt/ (accessed on 3 December 2017).
- INE. Territorial Statistics (Estatísticas Territoriais). Available online: http://www.ine.pt/xportal/xmain?xpid=INE&xpgid=ine_unid_territorial&menuBOUI=13707095&contexto=ut&selTab=tab3 (accessed on 13 April 2015).
- Tovar-Pescador, J.; Pozo-Vázquez, D.; Ruiz-Arias, J.A.; Batlles, J.; López, G.; Bosch, J.L. On the use of the digital elevation model to estimate the solar radiation in areas of complex topography. Meteorol. Appl. 2006, 13, 279–287. [Google Scholar] [CrossRef]
- Hong, T.; Lee, M.; Koo, C.; Kim, J.; Jeong, K. Estimation of the Available Rooftop Area for Installing the Rooftop Solar Photovoltaic (PV) System by Analyzing the Building Shadow Using Hillshade Analysis. Energy Procedia 2016, 88, 408–413. [Google Scholar] [CrossRef]
- Oeiras Municipality. Municipal Master Plan Regulation 2015 (Regulamento Plano Director Municipal 2015). Available online: http://pdm.cm-oeiras.pt/default.aspx?pg=82a0f316-a458-4765-8e1c-9b23cdbb77a4 (accessed on 21 October 2015).
- Poggi, F.; Firmino, A.; Amado, M. SMART RURAL: A Model for Planning Net-Zero Energy Balance at Municipal Level. Energy Procedia 2017, 122, 56–61. [Google Scholar] [CrossRef]
Figure 1.
Conceptual model.

Figure 2.
Orthophoto map.

Figure 3.
Cartography.

Figure 4.
Road axis.

Figure 5.
Visualization of data at the statistical subsection level.

Figure 6.
Map of electricity consumption.

Figure 7.
Extract of solar radiation estimation on building roofs (kWh/m2).

Figure 8.
Potential of solar energy production on building roofs.

Figure 9.
WebGIS architecture.

Figure 10.
Energy Balance page of the E-City web platform.


Table 1.
Main theme of the Geographic Information Data Model.
| Context Information | Consumption Data | Production Capacity Data |
|---|---|---|
| Orthophoto map | Electricity and natural gas consumption | Annual Solar Potential |
| Cartography | CO2 emission | |
| Road axis | Energy costs | Expected Productivity |
| Energy Balance Data | ||
| Positive | Negative | Balanced |
Table 2.
CO2 emissions’ totals data.
| CO2 Emissions’ Totals | From Fossil Origin (t/year) | From Biomass (t/year) |
|---|---|---|
| Economic activities | 65,056.9 | 13,280.2 |
| Industry | 54,516.2 | 8259.4 |
| Households | 10,540.7 | 5020.8 |
Table 3.
Electricity and natural gas prices for industrial and domestic users.
| Electricity Prices for Industrial Users (€/kWh) | Electricity Prices for Domestic Users (€/kWh) | |
| 2011 | 0.1048 | 0.1654 |
| 2012 | 0.1403 | 0.1993 |
| Natural Gas Prices for Industrial Users (€/GJ) | Natural Gas Prices for Domestic Users (€/GJ) | |
| 2011 | 9.97 | 16.95 |
| 2012 | 13.68 | 20.52 |
© 2018 by the authors. Licensee MDPI, Basel, Switzerland. This article is an open access article distributed under the terms and conditions of the Creative Commons Attribution (CC BY) license (http://creativecommons.org/licenses/by/4.0/).
Share and Cite
MDPI and ACS Style
Amado, M.; Poggi, F.; Ribeiro Amado, A.; Breu, S. E-City Web Platform: A Tool for Energy Efficiency at Urban Level. Energies 2018, 11, 1857. https://doi.org/10.3390/en11071857
AMA Style
Amado M, Poggi F, Ribeiro Amado A, Breu S. E-City Web Platform: A Tool for Energy Efficiency at Urban Level. Energies. 2018; 11(7):1857. https://doi.org/10.3390/en11071857
Chicago/Turabian StyleAmado, Miguel, Francesca Poggi, António Ribeiro Amado, and Sílvia Breu. 2018. "E-City Web Platform: A Tool for Energy Efficiency at Urban Level" Energies 11, no. 7: 1857. https://doi.org/10.3390/en11071857
Note that from the first issue of 2016, this journal uses article numbers instead of page numbers. See further details here.