Impact of Partial Shading on the P-V Characteristics and the Maximum Power of a Photovoltaic String
by
 , and
, and
J. C. Teo
1, 
Rodney H. G. Tan
1,*,
V. H. Mok
1,
Vigna K. Ramachandaramurthy
2 and
ChiaKwang Tan
3 1
Faculty of Engineering, Technology & Built Environment, UCSI University No. 1, Jalan Menara Gading, Kuala Lumpur 56000, Malaysia
2
Institute of Power Engineering, Department of Electrical Power Engineering, Universiti Tenaga Nasional, 43000 Kajang, Malaysia
3
UM Power Energy Dedicated Advanced Centre, University of Malaya, Jalan Pantai Baharu, Kuala Lumpur 59990, Malaysia
*
Author to whom correspondence should be addressed.
Energies 2018, 11(7), 1860; https://doi.org/10.3390/en11071860
Submission received: 1 June 2018
/
Revised: 21 June 2018
/
Accepted: 26 June 2018
/
Published: 17 July 2018
Abstract
:A photovoltaic system is highly susceptible to partial shading. Based on the functionality of a photovoltaic system that relies on solar irradiance to generate electrical power, it is tacitly assumed that the maximum power of a partially shaded photovoltaic system always decreases as the shading heaviness increases. However, the literature has reported that this might not be the case. The maximum power of a partially shaded photovoltaic system under a fixed configuration and partial shading pattern can be highly insusceptible to shading heaviness when a certain critical point is met. This paper presents an investigation of the impact of partial shading and the critical point that reduce the susceptibility of shading heaviness. Photovoltaic string formed by series-connected photovoltaic modules is used in this research. The investigation of the P-V characteristic curve under different numbers of shaded modules and shading heaviness suggests that the photovoltaic string becomes insusceptible to shading heaviness when the shaded modules irradiance reaches a certain critical point. The critical point can vary based on the number of the shaded modules. The formulated equation in this research contributes to determining the critical point for different photovoltaic string sizes and numbers of shaded modules in the photovoltaic string.
1. Introduction
Conventional electrical power generation based on coal-fired power plants introduces carbon emissions which cause air pollution to be released into the Earth’s atmosphere. To tackle this problem, renewable energy is employed as an alternative mode of electrical power generation. Among the renewable energy options, photovoltaic solar power is getting more and more popular nowadays due to its abundantly available and inexhaustible nature [1,2,3,4,5]. The non-involvement of mechanical or moving parts in a photovoltaic power system also makes it more preferable than other renewable energy options [6]. In 2016, around 75 GW of solar photovoltaic capacity was installed worldwide, which is almost a 50% growth from about 50 GW in 2015 [7,8]. The significant growth in photovoltaic power systems promotes the popularity of photovoltaic power system research among renewable energy researchers.
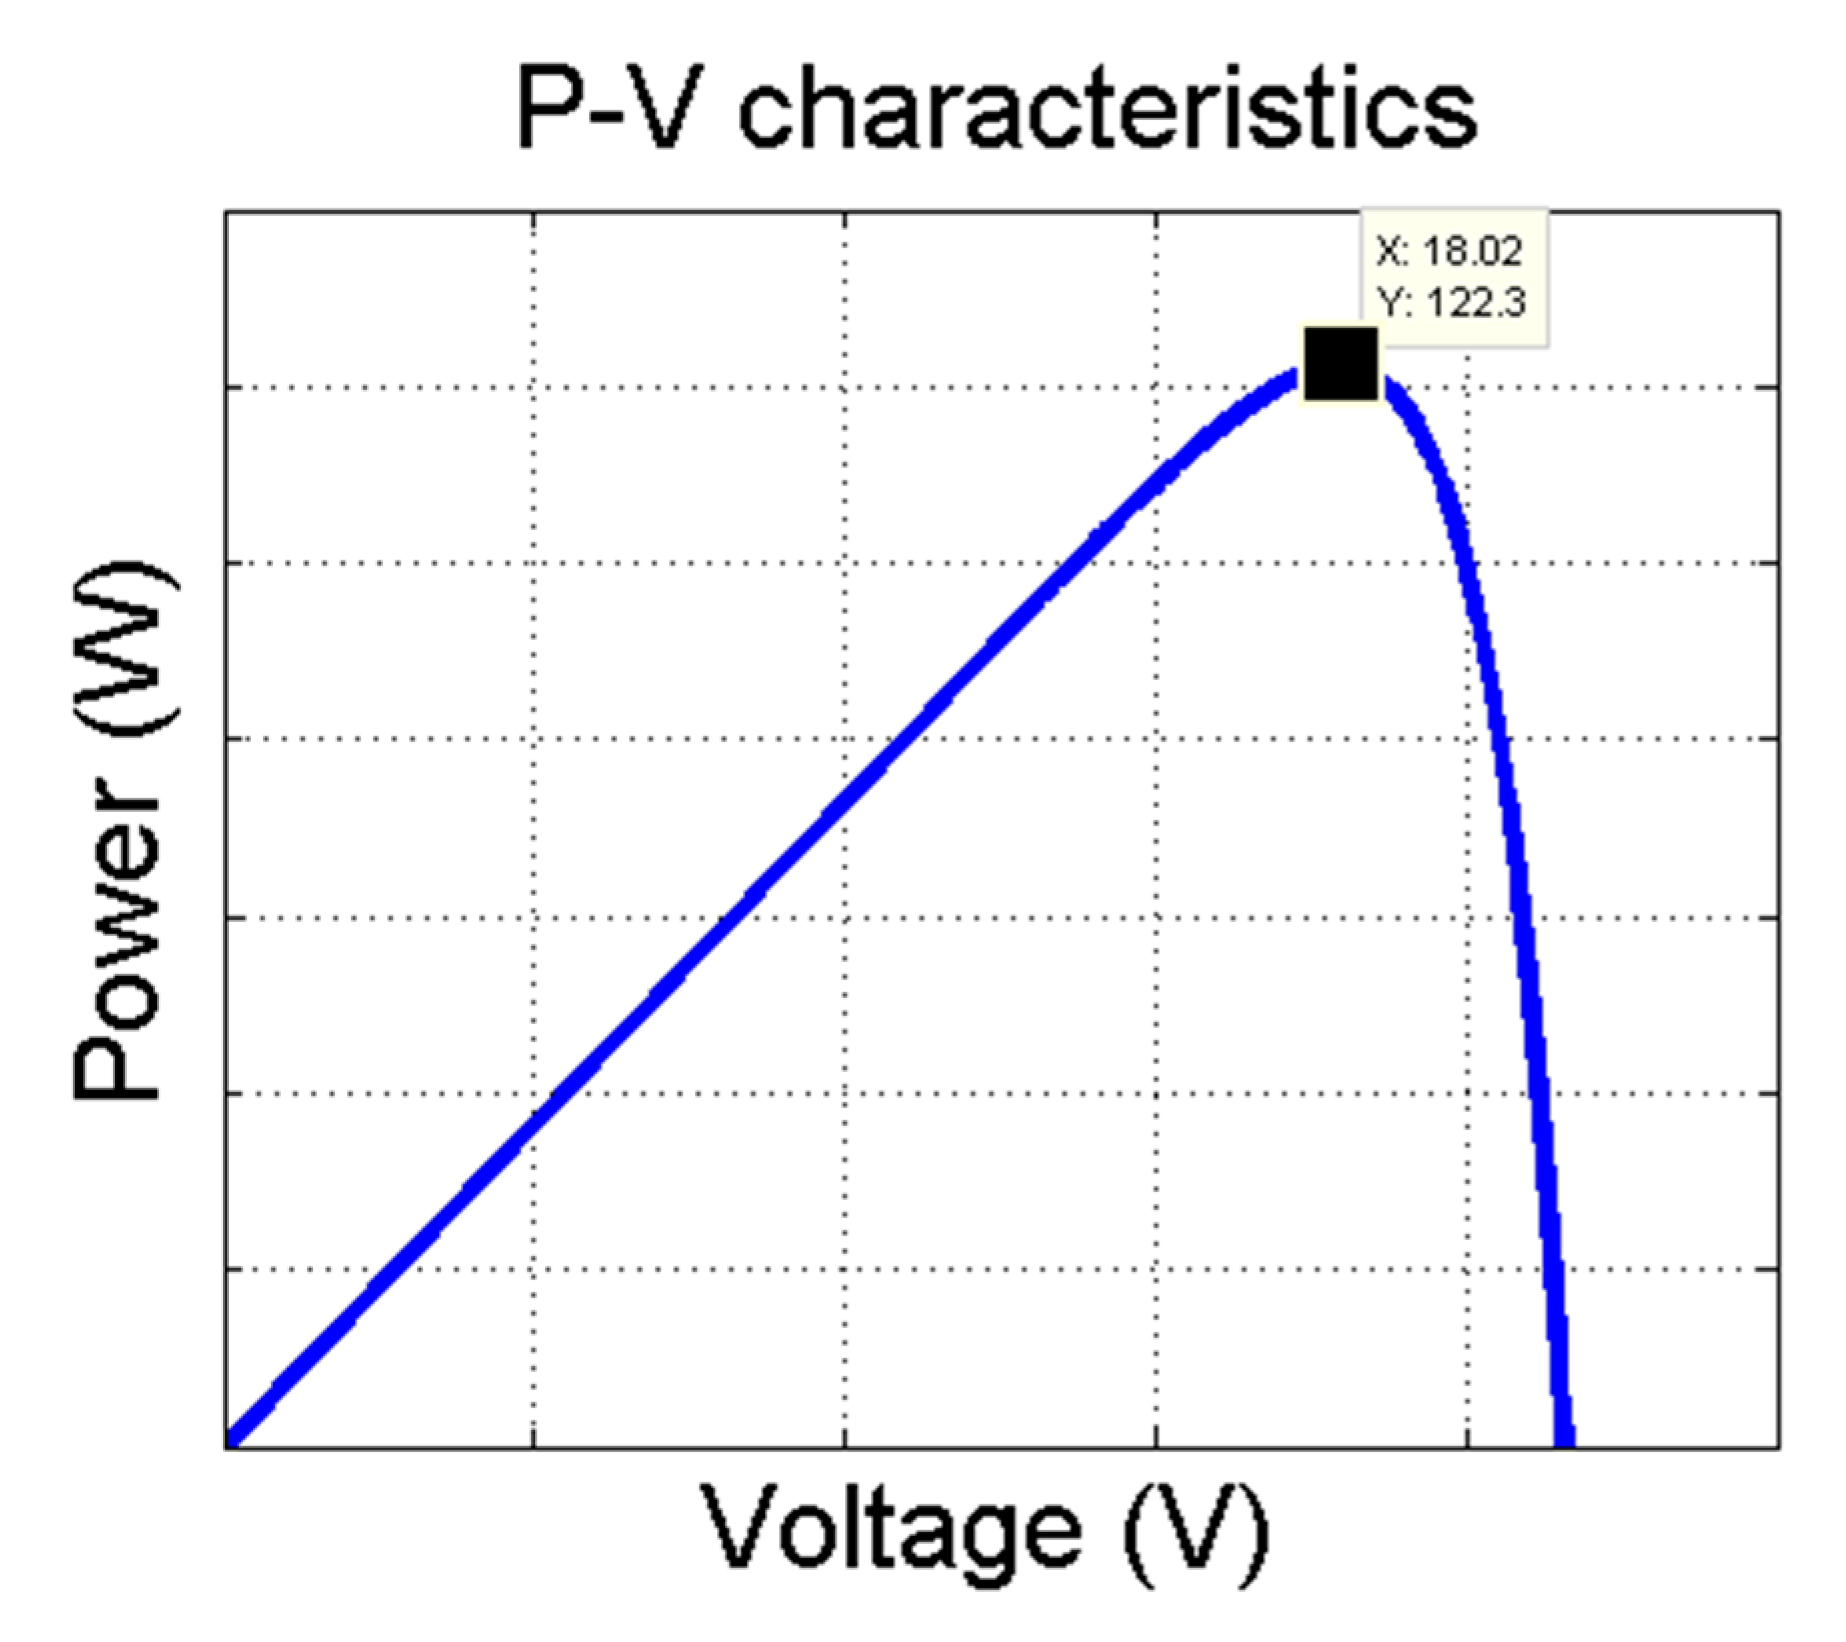
Photovoltaic modules or solar panels are the most fundamental components in a photovoltaic power system which is used to convert solar energy to electrical power [9,10,11,12,13]. When a photovoltaic module is connected to a piece of measurement equipment, P-V characteristics will be obtained as illustrated in Figure 1 [14]. The P-V characteristics demonstrate the electrical power delivered by the photovoltaic module at different voltages.
In the presence of the P-V characteristics, the maximum power of the photovoltaic module can be tracked. For instance, the marked point in Figure 1 shows the highest point of the P-V characteristics, which represents the maximum power delivered by the photovoltaic module [15]. The maximum power of the photovoltaic module is always harvested from the photovoltaic module for electricity generation purposes [16]. Therefore, it is important to determine the P-V characteristics of a photovoltaic module so that the maximum power can be tracked and harvested from the photovoltaic module.
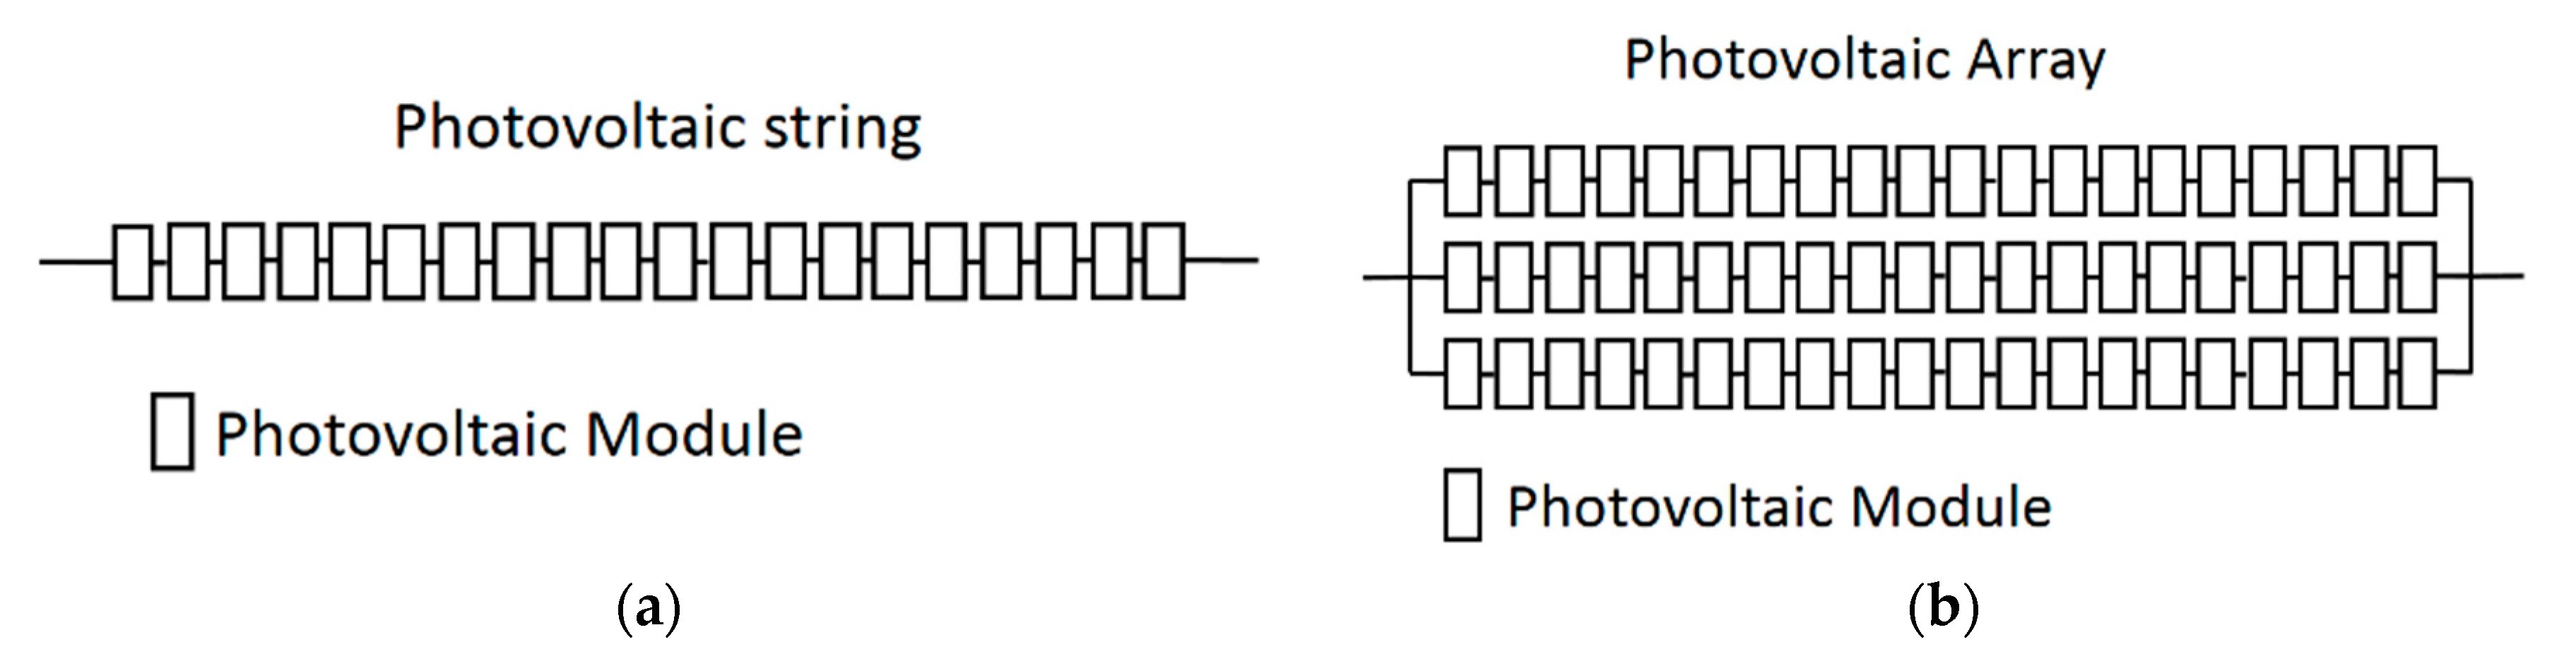
In a photovoltaic system, multiple photovoltaic modules are connected in series to form a photovoltaic string to achieve a required voltage and power output. To achieve an even higher power, these photovoltaic strings can be connected in parallel to form a photovoltaic array [17,18], as illustrated in Figure 2. In general, more than 1000 photovoltaic modules are employed in a megawatt-scale photovoltaic system to provide megawatts of electrical power production. These photovoltaic modules cannot only be connected in series as this will introduce an extremely high output voltage which makes it unfit for grid-connected inverters and energy storage purposes. Therefore, parallel connection is employed, as well as series connection, to connect these photovoltaic modules. Usually, multiple photovoltaic strings are formed by connecting multiple photovoltaic modules in series. These photovoltaic strings are then connected in parallel to form the photovoltaic array in the megawatts scale photovoltaic plant. Similar to the photovoltaic module, the P-V characteristics of a photovoltaic string/array need to be determined in order to track and harvest the maximum power from the photovoltaic string/array.
During a uniform irradiance condition, the P-V characteristics of a photovoltaic string exhibit one peak that resembles the P-V characteristics in Figure 1. The peak acts as the global peak which represents the maximum power of the photovoltaic string [19,20]. When partial shading takes place, multiple peaks appear on the P-V characteristics due to the use of a bypass diode [21,22,23]. Figure 3 shows the P-V characteristics of a photovoltaic string during a partial shading condition. The highest peak is the global peak which represents the maximum power of the photovoltaic string, while the others are the local peaks [24,25].
Apparently, a photovoltaic system is highly susceptible to partial shading [26,27,28,29,30,31,32,33,34,35,36,37,38,39]. During partial shading, the maximum power of a photovoltaic system can drop drastically, which significantly reduces the energy yield of the photovoltaic system. However, the susceptibility of partial shading to a photovoltaic system is not constant. The susceptibility of partial shading to a photovoltaic system can be varied due to the partial shading pattern and the connection employed to connect the photovoltaic modules in the photovoltaic system [26,27,28,29,32,33,34,35,36,37,38].
The experimental results in [26] suggested that under an identical partial shading pattern, the maximum power of a photovoltaic system should drop at a constant rate as the shading heaviness increases, as illustrated in Figure 4a. It means that under an identical partial shading pattern, a partially shaded photovoltaic system is always susceptible to the shading heaviness. This makes sense as the photovoltaic system relies on the solar irradiance to generate electrical power, and the maximum power of a partially shaded photovoltaic system should be lower and lower as the shading heaviness is getting heavier and heavier.
However, another phenomenon has been observed by S. Silvestre et al. [39]. S. Silvestre et al. discovered that a partially shaded photovoltaic system is not necessarily susceptible to the shading heaviness. They discovered that the maximum power of a partially shaded photovoltaic system decreases as the shading heaviness increases, as presented by the researchers in [26,27,28,29,30,31,32,33,34,35,36,37,38]. However, when the shading heaviness reaches a certain critical point, the maximum power remains unchanged even if the shading heaviness is getting heavier and heavier from that critical point, as illustrated in Figure 4b. It means that the partially shaded photovoltaic system can become insusceptible to shading heaviness when the shading heaviness reaches a certain critical point. This finding is inspiring because a partially shaded photovoltaic system is commonly believed to always be susceptible to the shading heaviness.
It is obvious that lots of research has been conducted on the impact of partial shading on the photovoltaic system throughout the years [26,27,28,29,30,31,32,33,34,35,36,37,38]. However, none of it has precisely presented the finding proposed in [39], which stated that the maximum power of a partially shaded photovoltaic system can become insusceptible to shading heaviness when the shading heaviness reaches a certain critical point. Therefore, it is a good area to further explore.
The finding proposed by [39] regarding the critical point is definitely inspiring. However, the experiment setup used in their research is a photovoltaic system that consists of nine photovoltaic modules only. They did not consider cases where a photovoltaic system consists of a greater number of photovoltaic modules. Besides that, the partial shading pattern and shading heaviness applied in their experiment are limited, which is insufficient to really conclude their finding. According to their result, the critical point can vary based on the number of shaded modules in the photovoltaic system. Therefore, an equation to determine the critical point for different numbers of shaded modules is highly expected. However, they did not formulate an equation to determine the critical point. Furthermore, they did not verify whether the critical point is also applicable to different sized photovoltaic systems.
The aim of this research is to investigate the susceptibility of the shading heaviness to a partially shaded photovoltaic system and the critical point that decreases the susceptibility of shading heaviness using a photovoltaic system with a multiple number of photovoltaic modules and various partial shading conditions. Besides that, an equation to calculate the critical point is formulated in this research as well. Furthermore, the critical point equation is also verified with different sized photovoltaic systems.
2. Methodology
A photovoltaic string consists of 20 photovoltaic modules and is used to conduct the experiment in this research. The photovoltaic modules have an open circuit voltage of 21.6 V, short circuit current of 7.34 A, ideality factor of 1.5, and series resistance of 0 ohm. Temperature, T = 25 °C is used for all the case studies in the experiment. Each photovoltaic module in the photovoltaic string has one bypass diode.
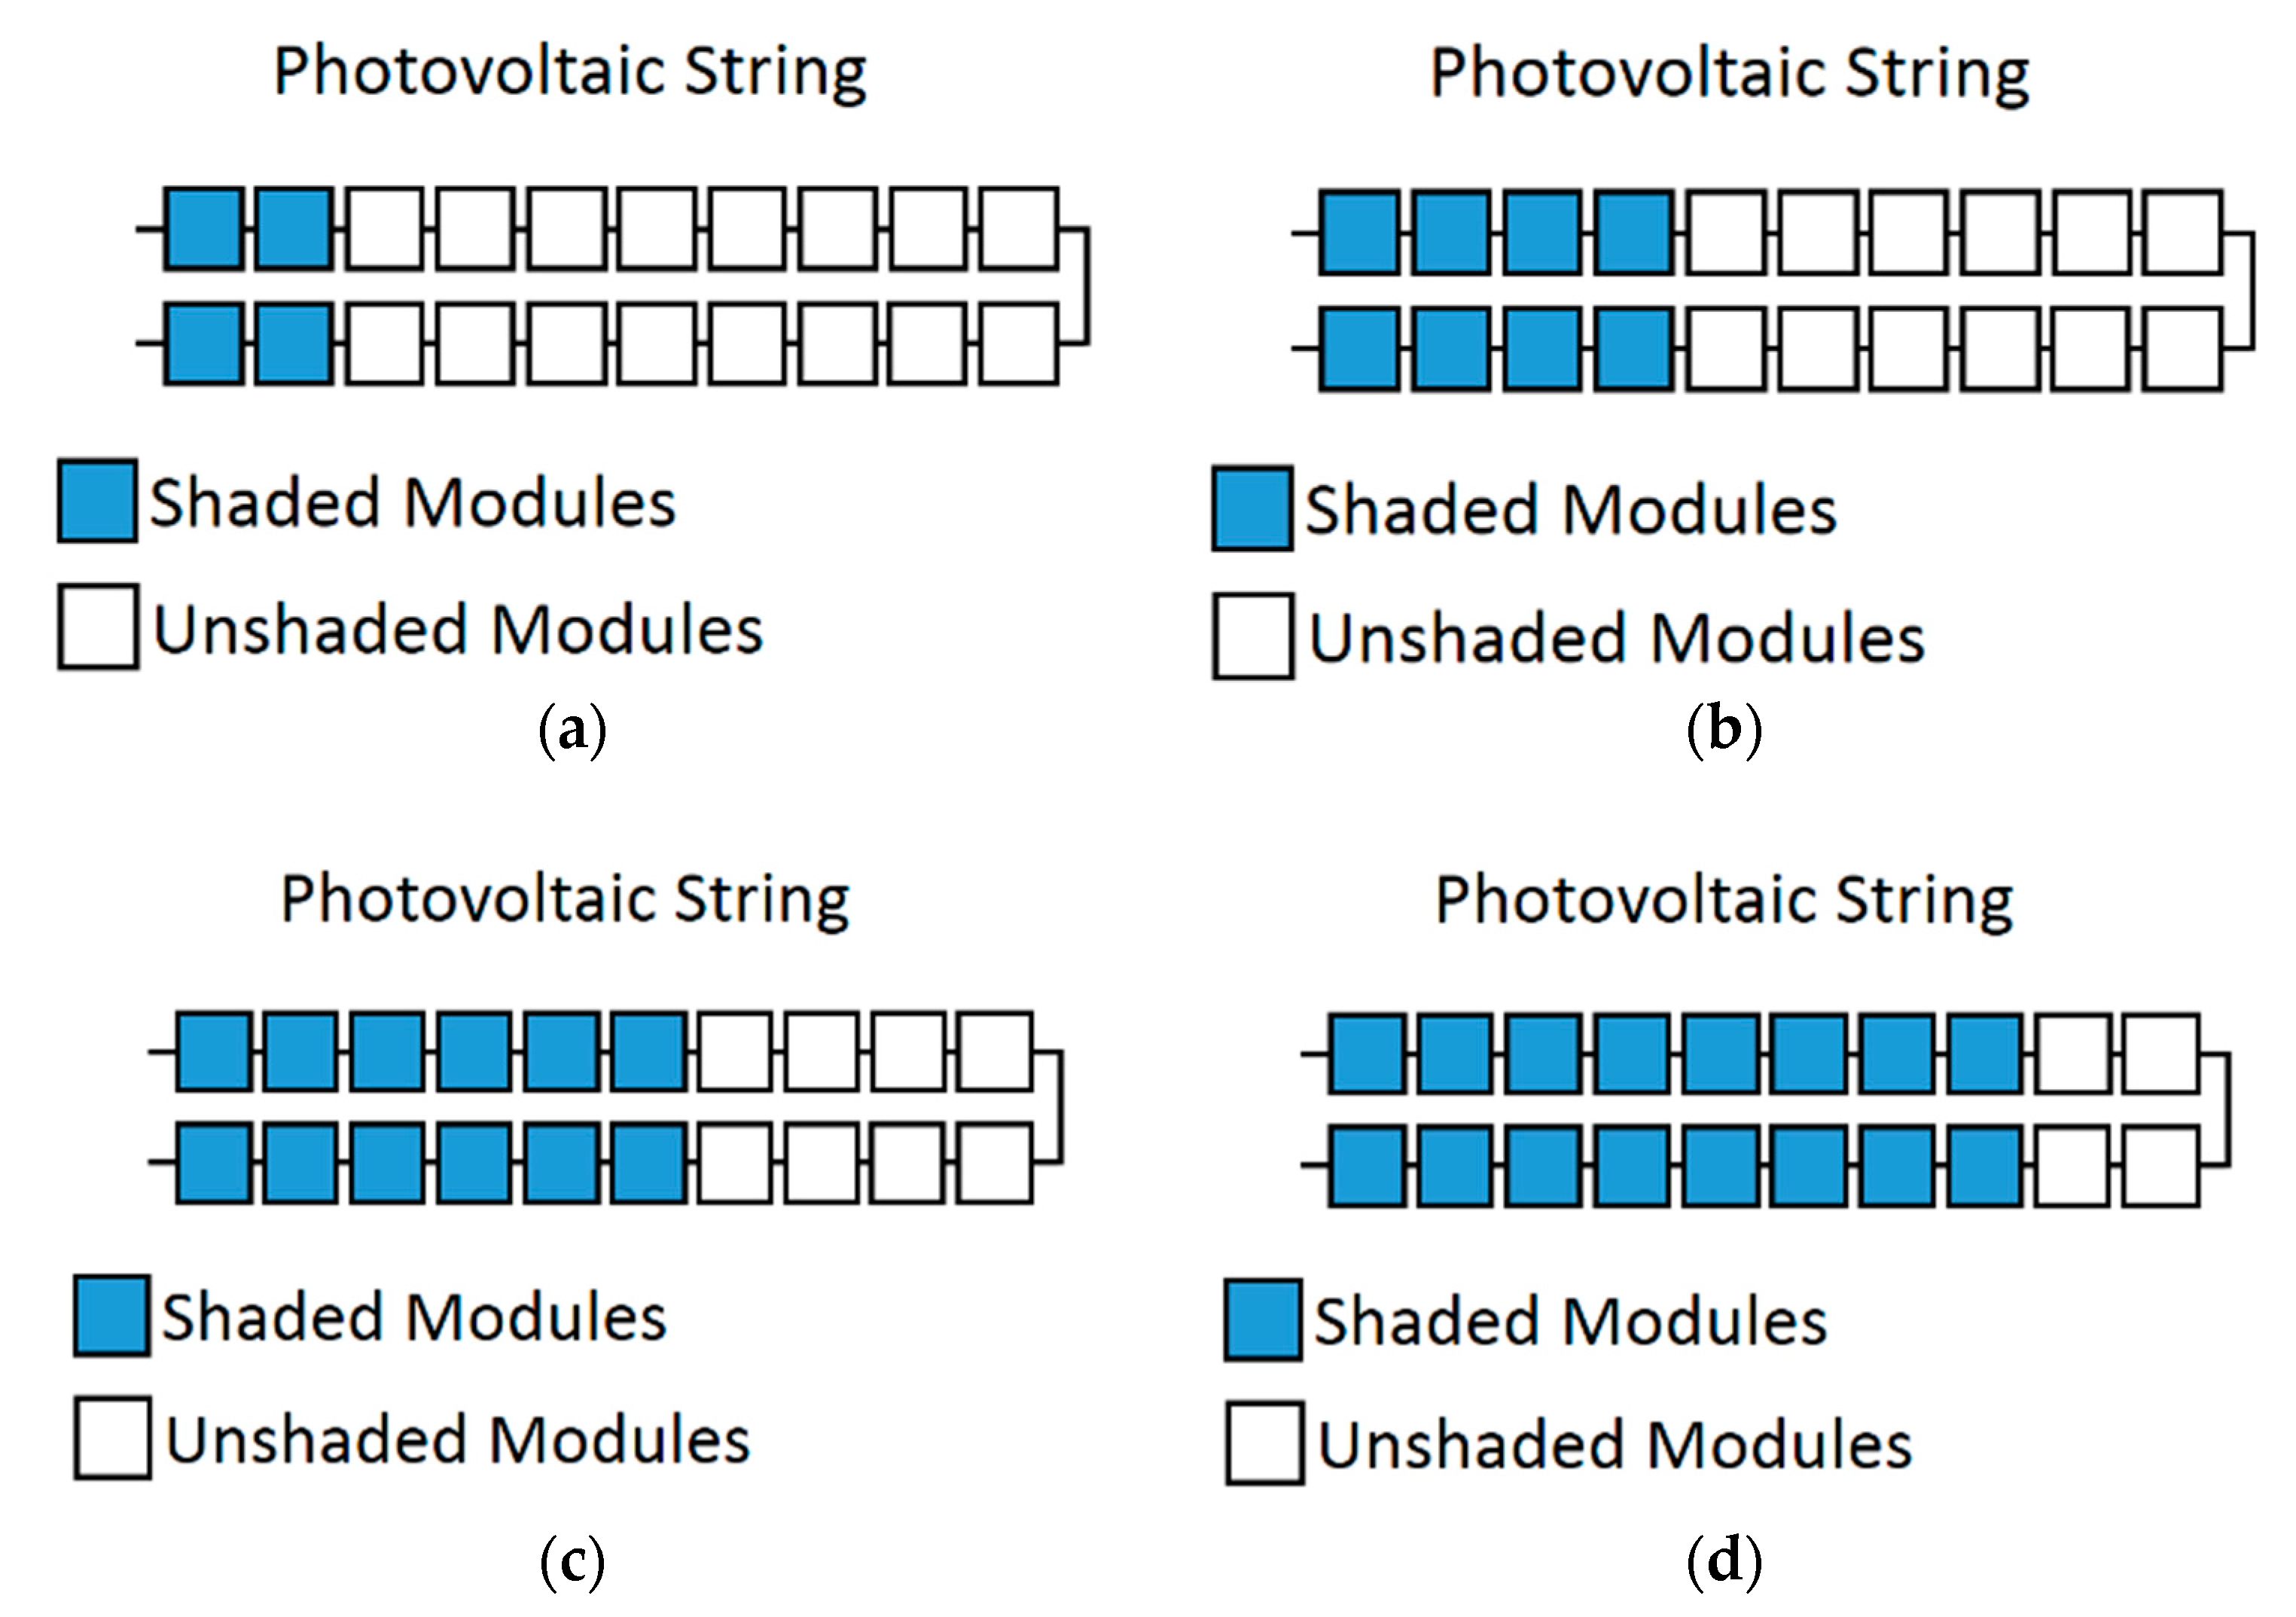
There are four experiment setups developed using the photovoltaic string, including 4 modules shaded, 8 modules shaded, 12 modules shaded, and 16 modules shaded setups, as illustrated in Figure 5.
Table 1 shows all the conditions that applied to every experimental setup in Figure 5. In the experiment, the P-V characteristics of every experimental setup under all the applied conditions are determined.
A photovoltaic array that consists of parallel connected photovoltaic strings and is not used in this research. This is because a photovoltaic system with a higher degree of parallelism is less susceptible to partial shading [32]. Similar statements are also suggested in [33,34,35,36,37,38,39,40], which address the fact that a higher degree of parallelism in a photovoltaic system can reduce the susceptibility of partial shading. Therefore, a photovoltaic array that consists of parallelism is not used in this research. Photovoltaic string that is in a series connected configuration is used in this research.
The random partial shading patterns with multiple shading heaviness are not used in this research. These partial shading patterns occur due to an uneven cloud distribution. It is more likely to be experienced by a megawatts scale photovoltaic plant. The area of the coverage of the photovoltaic string is not as big as a megawatts scale photovoltaic system. Therefore, the random partial shading patterns with multiple shading heaviness are not considered in this research.
There is not a standard rule for choosing the photovoltaic system size to conduct the partial shading experiment. The size can be chosen based on the designer and researcher preferences. For instance, Hiren Patel and Vivek Agarwal [26] chose photovoltaic arrays that consist of 300, 900, and 1000 photovoltaic modules; R. Ahmad et al. [29] chose photovoltaic arrays that consist of 20 and 25 photovoltaic modules; S. Silvestre et al. [39] chose a photovoltaic array consisting of nine photovoltaic modules, and so on. Regardless of the chosen size of the photovoltaic system, the experimental outcome should be applicable in certain ways to a megawatts scale photovoltaic plant as tacitly assumed among the researchers [26,27,28,29,30,31,32,33,34,35,36,37,38,39].
A photovoltaic string model is developed to carry out the experiment. A solar cell block from the SimElectronics block set is used to develop the photovoltaic string model. This method of modelling has been used by J. C. Teo et al. to develop a photovoltaic string model [11]. They have conducted practical measurements to validate the photovoltaic string model in their research. Hence, it makes sense to use this method to develop the photovoltaic string model for the experiment.
The solar cell block is set to a five-parameter configurationm which is defined in Equations (1) and (2), where I is the output current, IPH is the photo-generated current, IO is the diode saturation current, V is the output voltage, RS is the series resistance, NS is the number of cells, VT is the junction thermal voltage, A is the ideality factor, k is the Boltzman constant (1.3806503 × 10⁻²³ J/K), T is the cell temperature, and q is the electron charge (1.6021765 × 10⁻¹⁹ C).
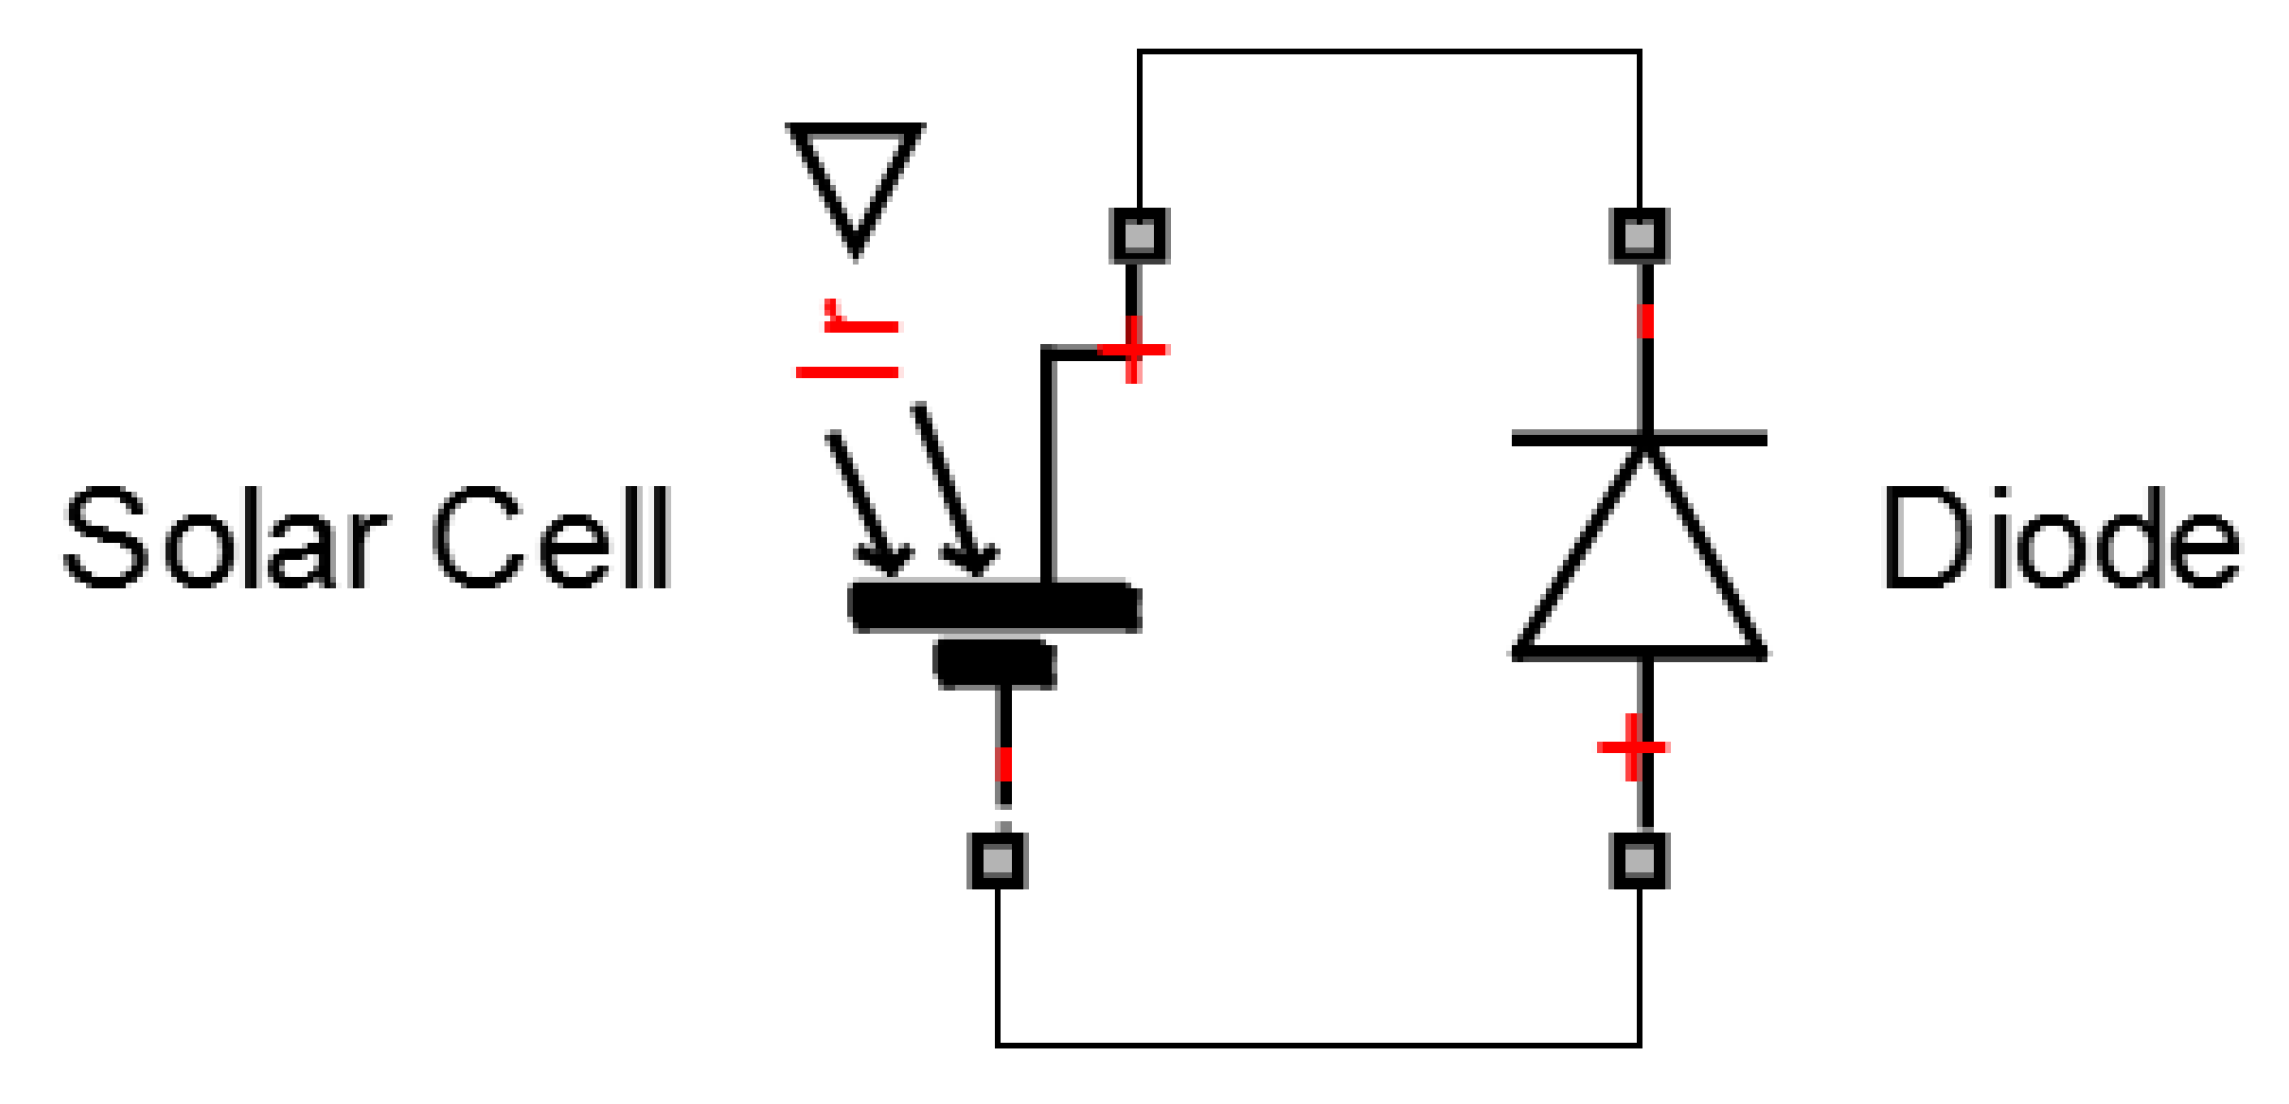
The short circuit current, open circuit voltage, series resistance, and ideality factor of the solar cell block are set according to the experiment requirements. To implement the bypass diode, the diode block from the Simscape block set is connected in antiparallel with the solar cell block, as shown in Figure 6.
The architecture in Figure 6 represents a photovoltaic module with a bypass diode. The architecture is duplicated to 20 sets, and these 20 sets of architecture are then connected in series to form a photovoltaic string model which consists of 20 photovoltaic modules that are required for the experiment. The photovoltaic string model is made into a single block known as PV string, as shown in Figure 7.
Figure 7 shows the entire photovoltaic string model that was developed to carry out the experiment. The PV string block is the model for the photovoltaic string. It has 20 inputs which control the irradiance of every particular photovoltaic module in the photovoltaic string. The Control Unit block sets the unshaded modules irradiance, shaded modules irradiance, and number of the shaded modules in the PV string based on the parameter in the Unshaded Irr, Shaded Irr, and Shade Module block, respectively.
During the simulations, the Controlled Current Source block sweeps the output current of the photovoltaic string. The Voltage Sensor block measures the output voltage of the photovoltaic string. The Product block multiplies the output voltage and output current of the photovoltaic string to obtain the output power of the photovoltaic string. The To Workspace block sends the output power and output voltage of the photovoltaic string to the MATLAB (R2014a, MathWorks, Natick, MA, USA) workspace to plot the P-V characteristics curve.
Basically, the developed photovoltaic string model shown in Figure 7 is developed by cascading and extending the photovoltaic string model proposed by J. C. Teo et al. [11]. It is common practice to develop a larger scale photovoltaic system model by cascading and extending the validated small-scale photovoltaic system model [26]. The larger scale model that is developed by cascading and extending the validated small-scale model should give appropriate results for analysis purposes, as suggested by [26,39]. The method in [26] has also been applied by another researcher [29] to conduct a partial shading experiment.
The experiment can be conducted using the photovoltaic string model shown in Figure 7. To conduct the experiment for the 4 modules shaded setup, the Unshade Irr block is set to 1000 while the Shaded Module block is set to 4. These settings configure the photovoltaic string to a four modules shaded setup with the unshaded modules irradiance fixed at 1000 w/m2. The Shade Irr block is set to 900 to apply the condition 1 in Table 1 to the 4 modules shaded setup. Simulation performed under these setting generates the P-V characteristics of the 4 modules shaded setup under condition 1. To obtain the P-V characteristics of the 4 modules shaded setup under all the conditions in Table 1, 10 simulations are performed with the Shade Irr block set to 0, 100, 200, 300, 400, 500, 600, 700, 800, and 900, respectively.
Similar procedures are applied to conduct the experiment for the 8 modules shaded, 12 modules shaded, and 16 modules shaded setup. For instance, for the 8 modules shaded setup, the Unshade Irr block is set to 1000 while the Shade Module block is set to 8. These settings configure the photovoltaic string to the 8 modules shaded setup with the unshaded module irradiance fixed at 1000 w/m2. To obtain the P-V characteristics of the 8 modules shaded setup under all the conditions in Table 1, 10 simulations are performed with the Shade Irr block set to 0, 100, 200, 300, 400, 500, 600, 700, 800, and 900, respectively.
To conduct the experiment for the 12 modules shaded setup, the Unshade Irr block is set to 1000 while the Shade Modules block is set to 12. The simulations are performed with the Shade Irr block set to 0, 100, 200, 300, 400, 500, 600, 700, 800, and 900, respectively, to obtain the P-V characteristics of the 12 modules shaded setup under the conditions in Table 1.
To conduct the experiment for the 16 modules shaded setup, the Unshade Irr block is set to 1000 while the Shade Modules block is set to 16. The simulations are performed with the Shade Irr block set to 0, 100, 200, 300, 400, 500, 600, 700, 800, and 900, respectively, to obtain the P-V characteristics of the 16 modules shaded setup under the conditions in Table 1. Table 2, Table 3, Table 4 and Table 5 show the parameters set in the model in Figure 7 to conduct the experiment for the 4 modules shaded, 8 modules shaded, 12 modules shaded, and 16 modules shaded setups.
The experiment considers lots of partial shading conditions, including lightly shaded, heavily shaded, a small number of modules shaded, a big number of modules shaded, and lots of shading heaviness conditions. These partial shading conditions pretty much cover all the possible partial shading conditions that might be experienced by a photovoltaic string at the site. Hence, the data collected in the experiment should be sufficient to conclude the critical points of a photovoltaic string, as well as to formulate the equation to determine the critical points of a photovoltaic string. However, more simulation work is required to conduct the experiment as it involves a huge number of partial shading conditions.
3. Results
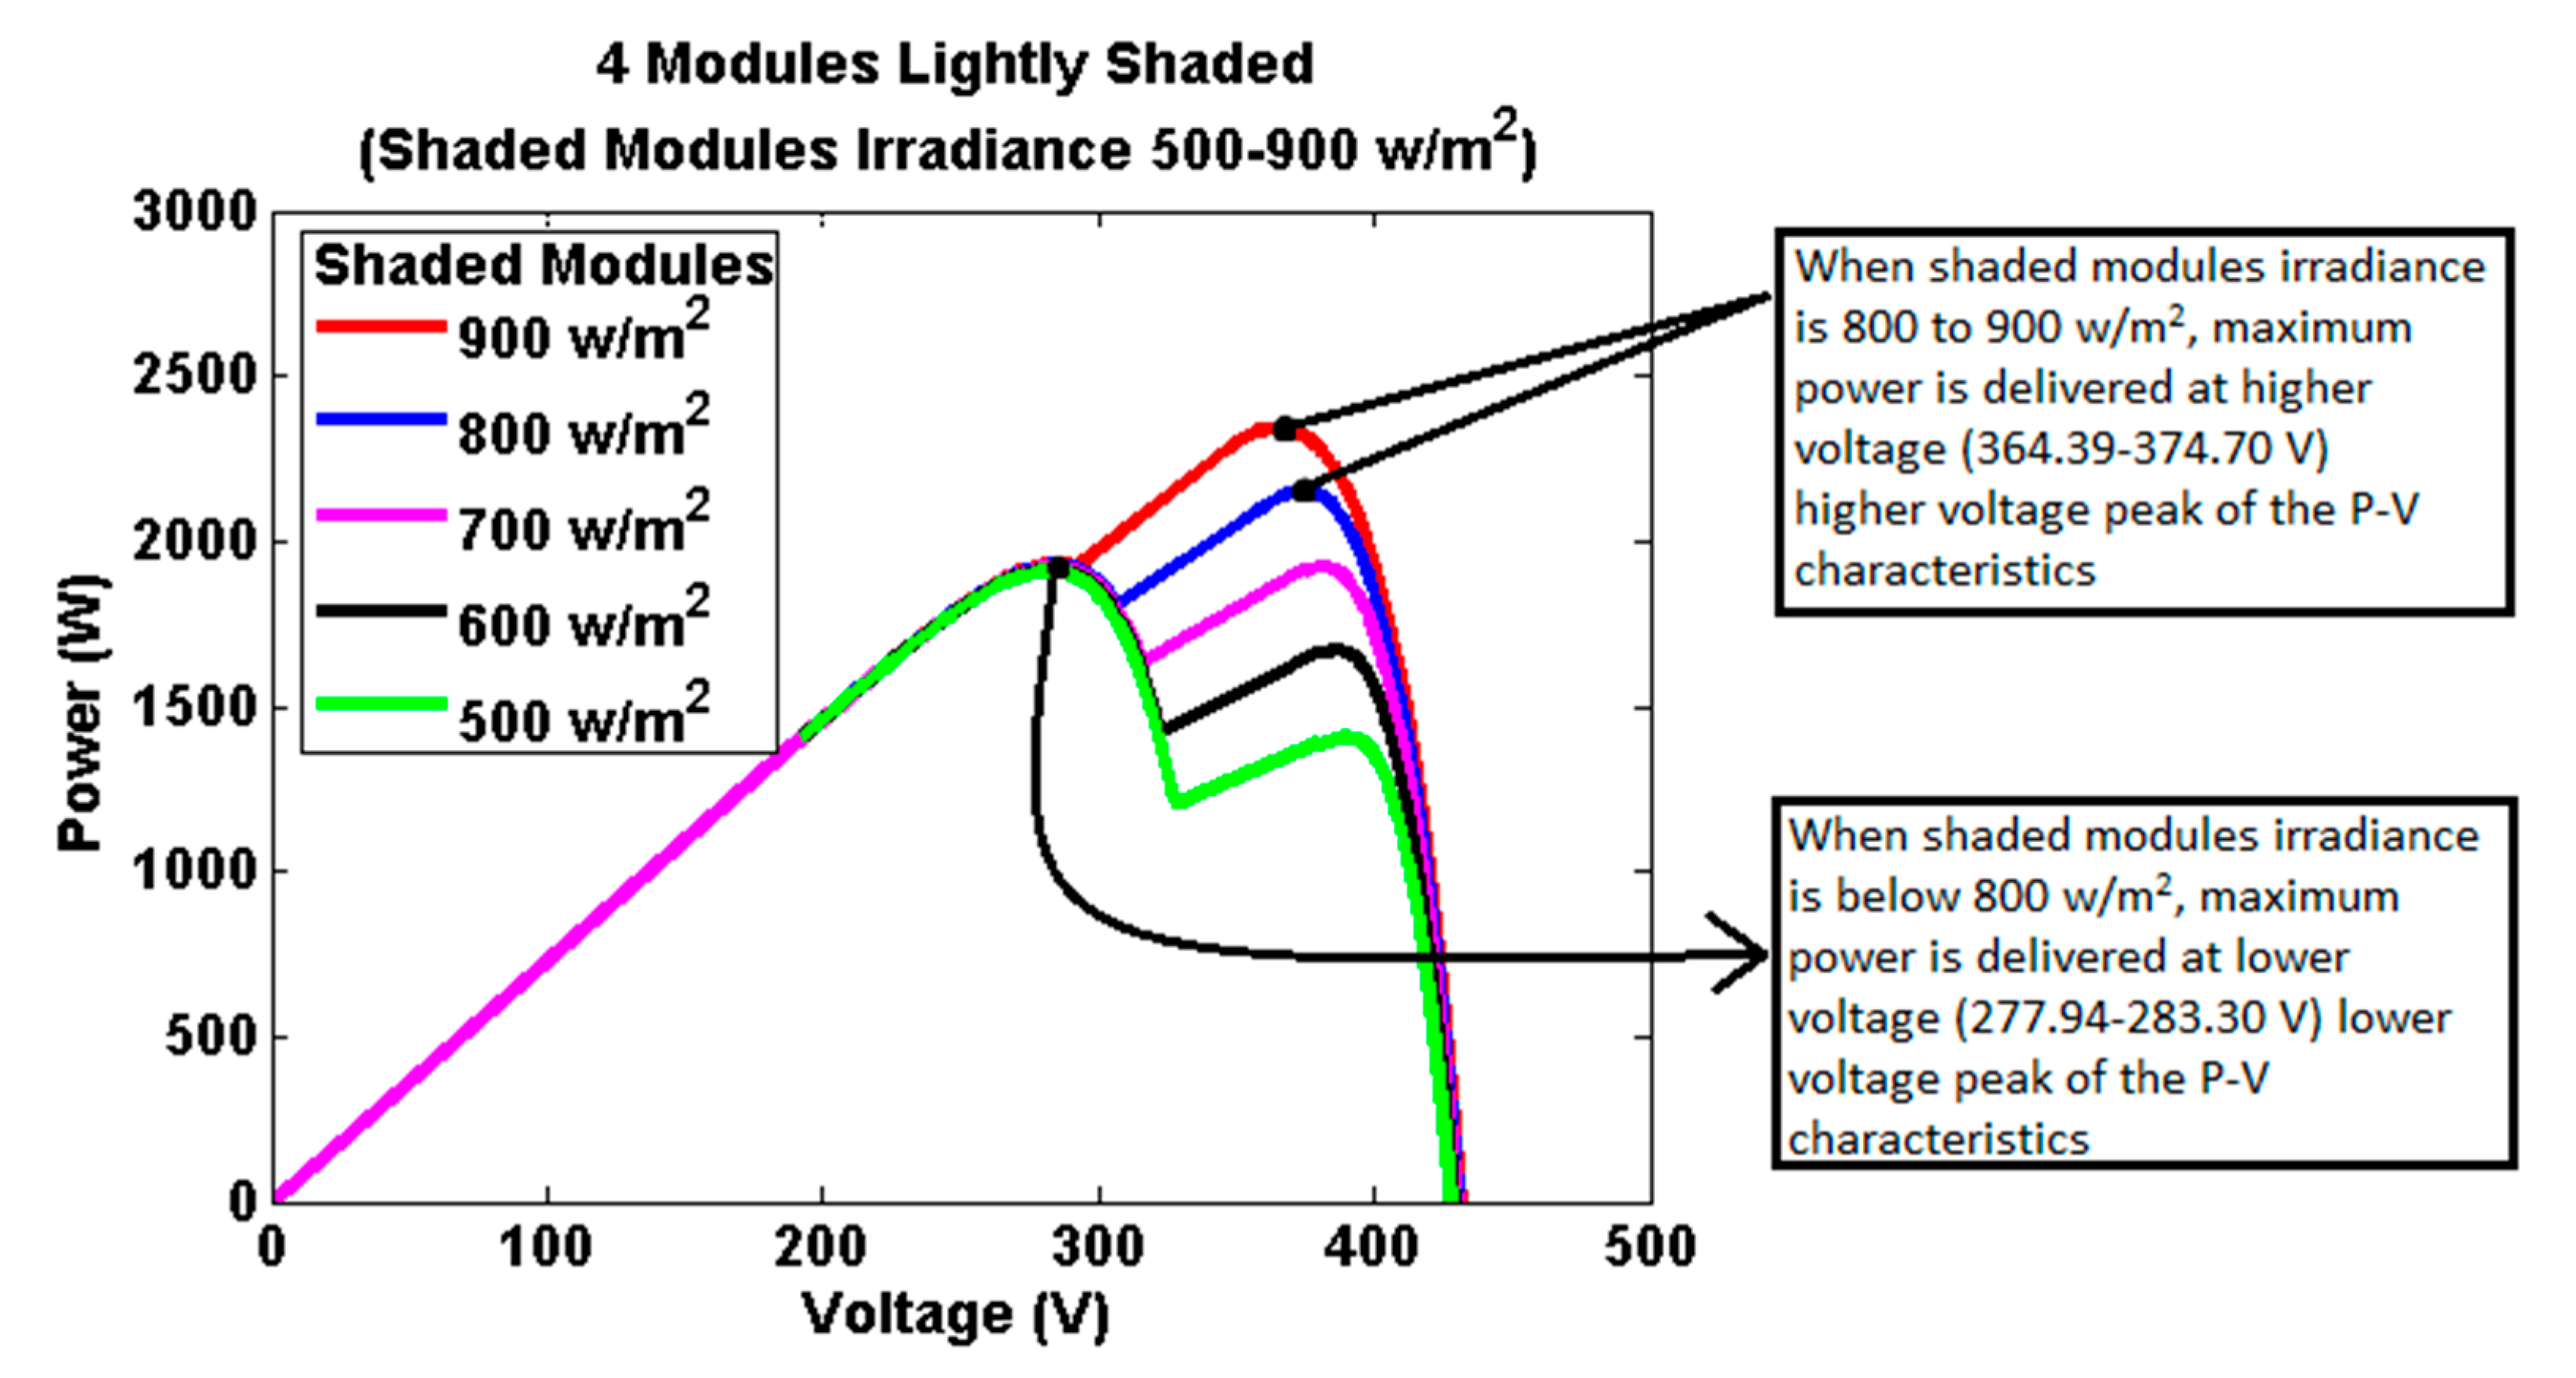
Figure 8 shows the P-V characteristics of the four modules shaded setup. Figure 8a represents the P-V characteristics when the shaded modules irradiance is between 500 and 900 w/m2. Figure 8b illustrates the P-V characteristics when the shaded modules irradiance is between 0 and 400 w/m2. Considering the 4 modules shaded setup in Figure 8a, the higher voltage peak of the P-V characteristics is higher than the lower voltage peak when the shaded module irradiance is between 800 and 900 w/m2.
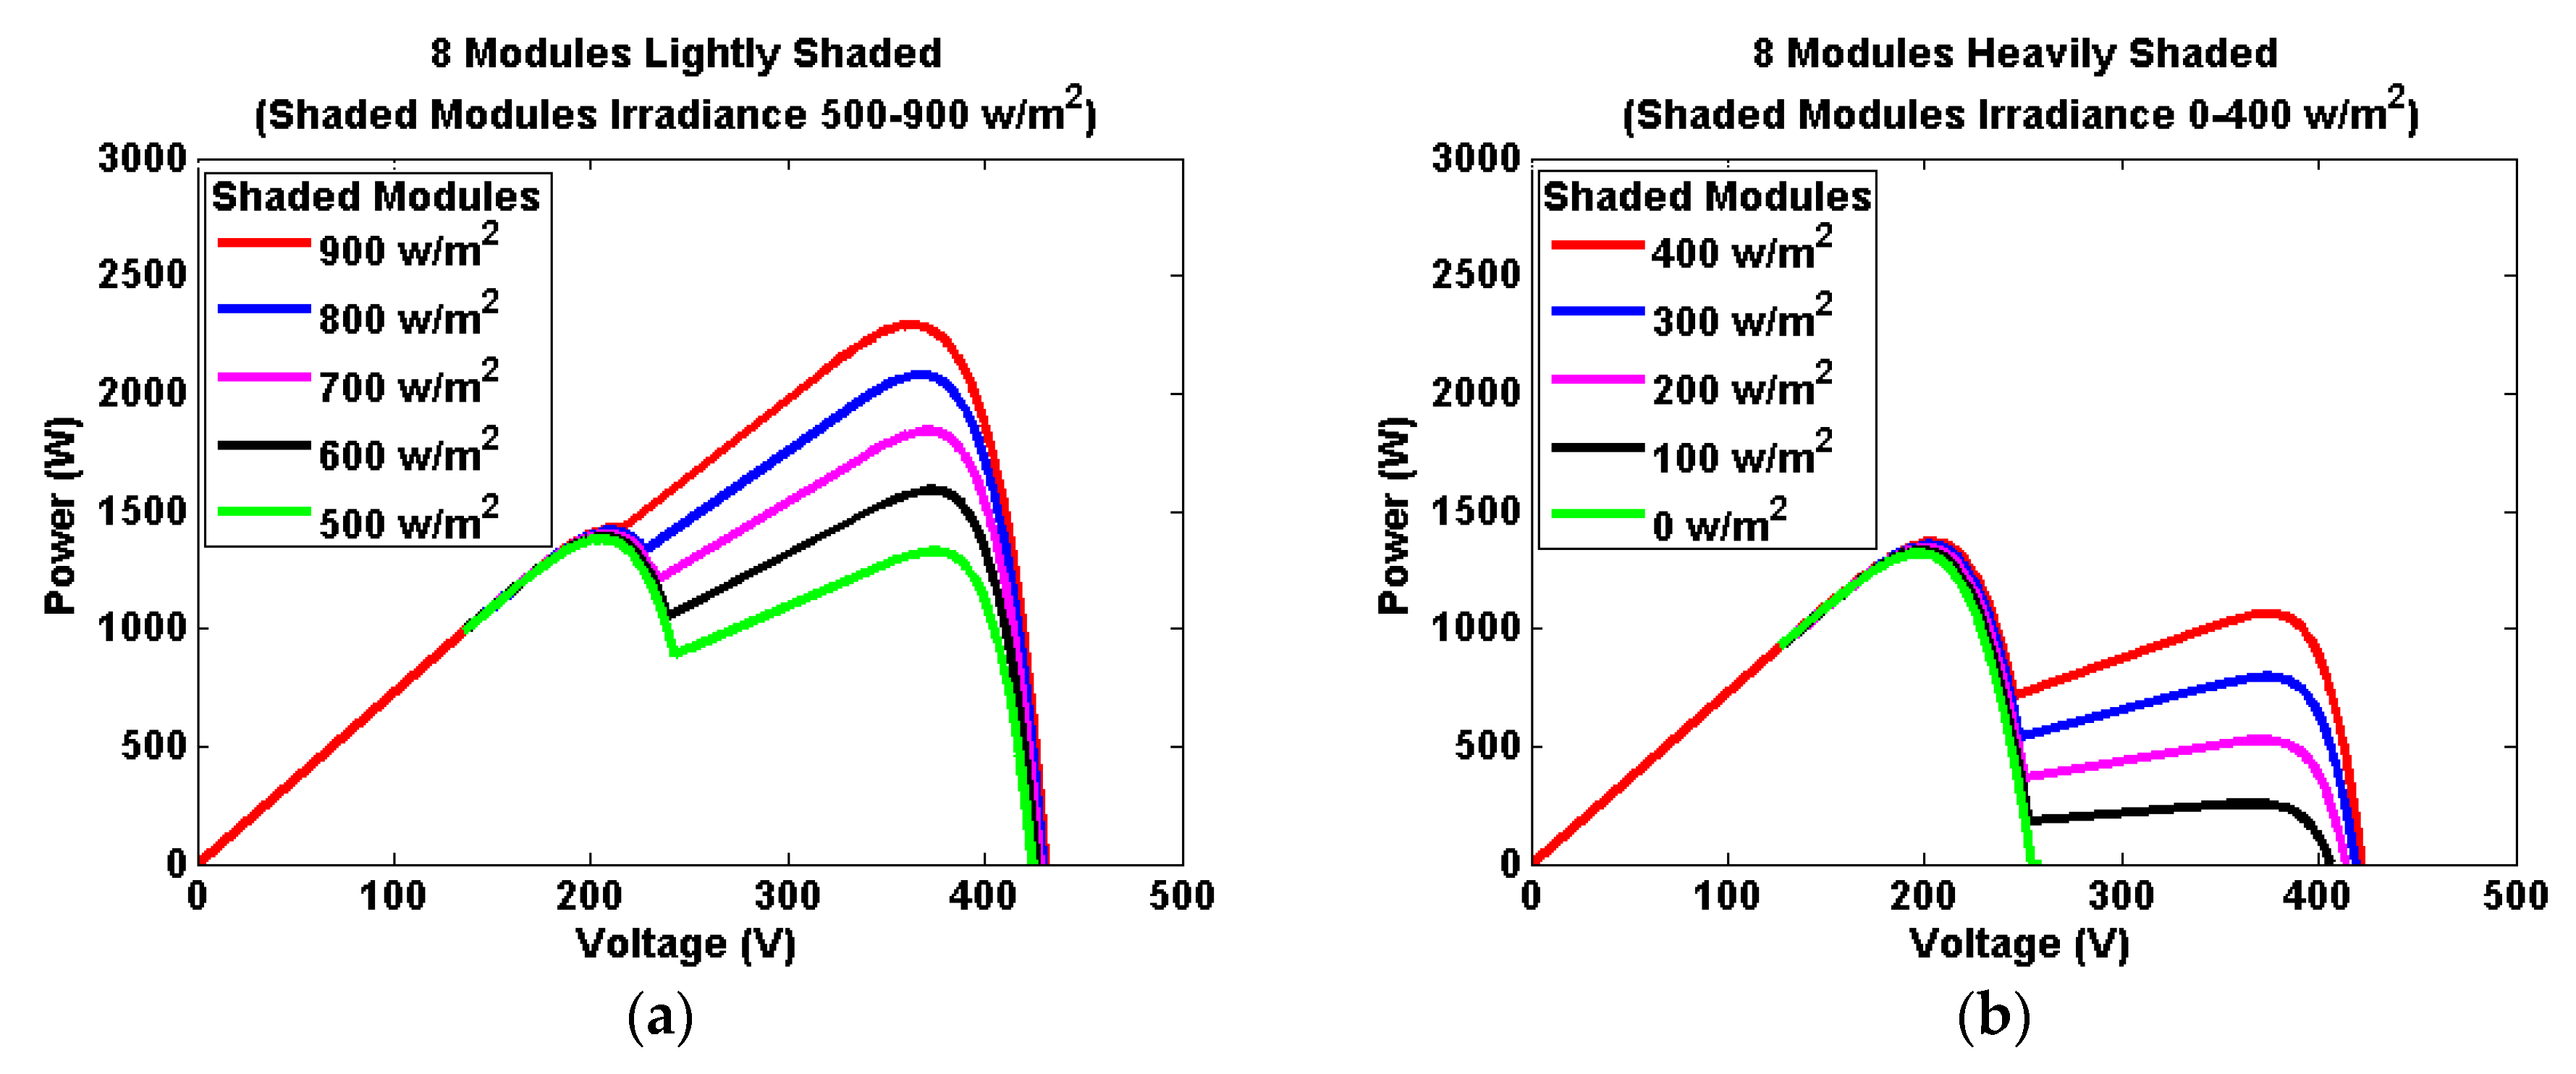
Figure 9 shows the P-V characteristics of the 8 modules shaded setup. Figure 9a represents the P-V characteristics when the shaded modules irradiance is between 500 and 900 w/m2. Figure 9b illustrates the P-V characteristics when the shaded modules irradiance is between 0 and 400 w/m2. Similar situations are observed in the 8 modules shaded setup shown in Figure 9, where the higher voltage peak acts as the global peak when the shaded modules irradiance is above a certain level. The higher voltage peak reduces as the shaded modules irradiance decreases.
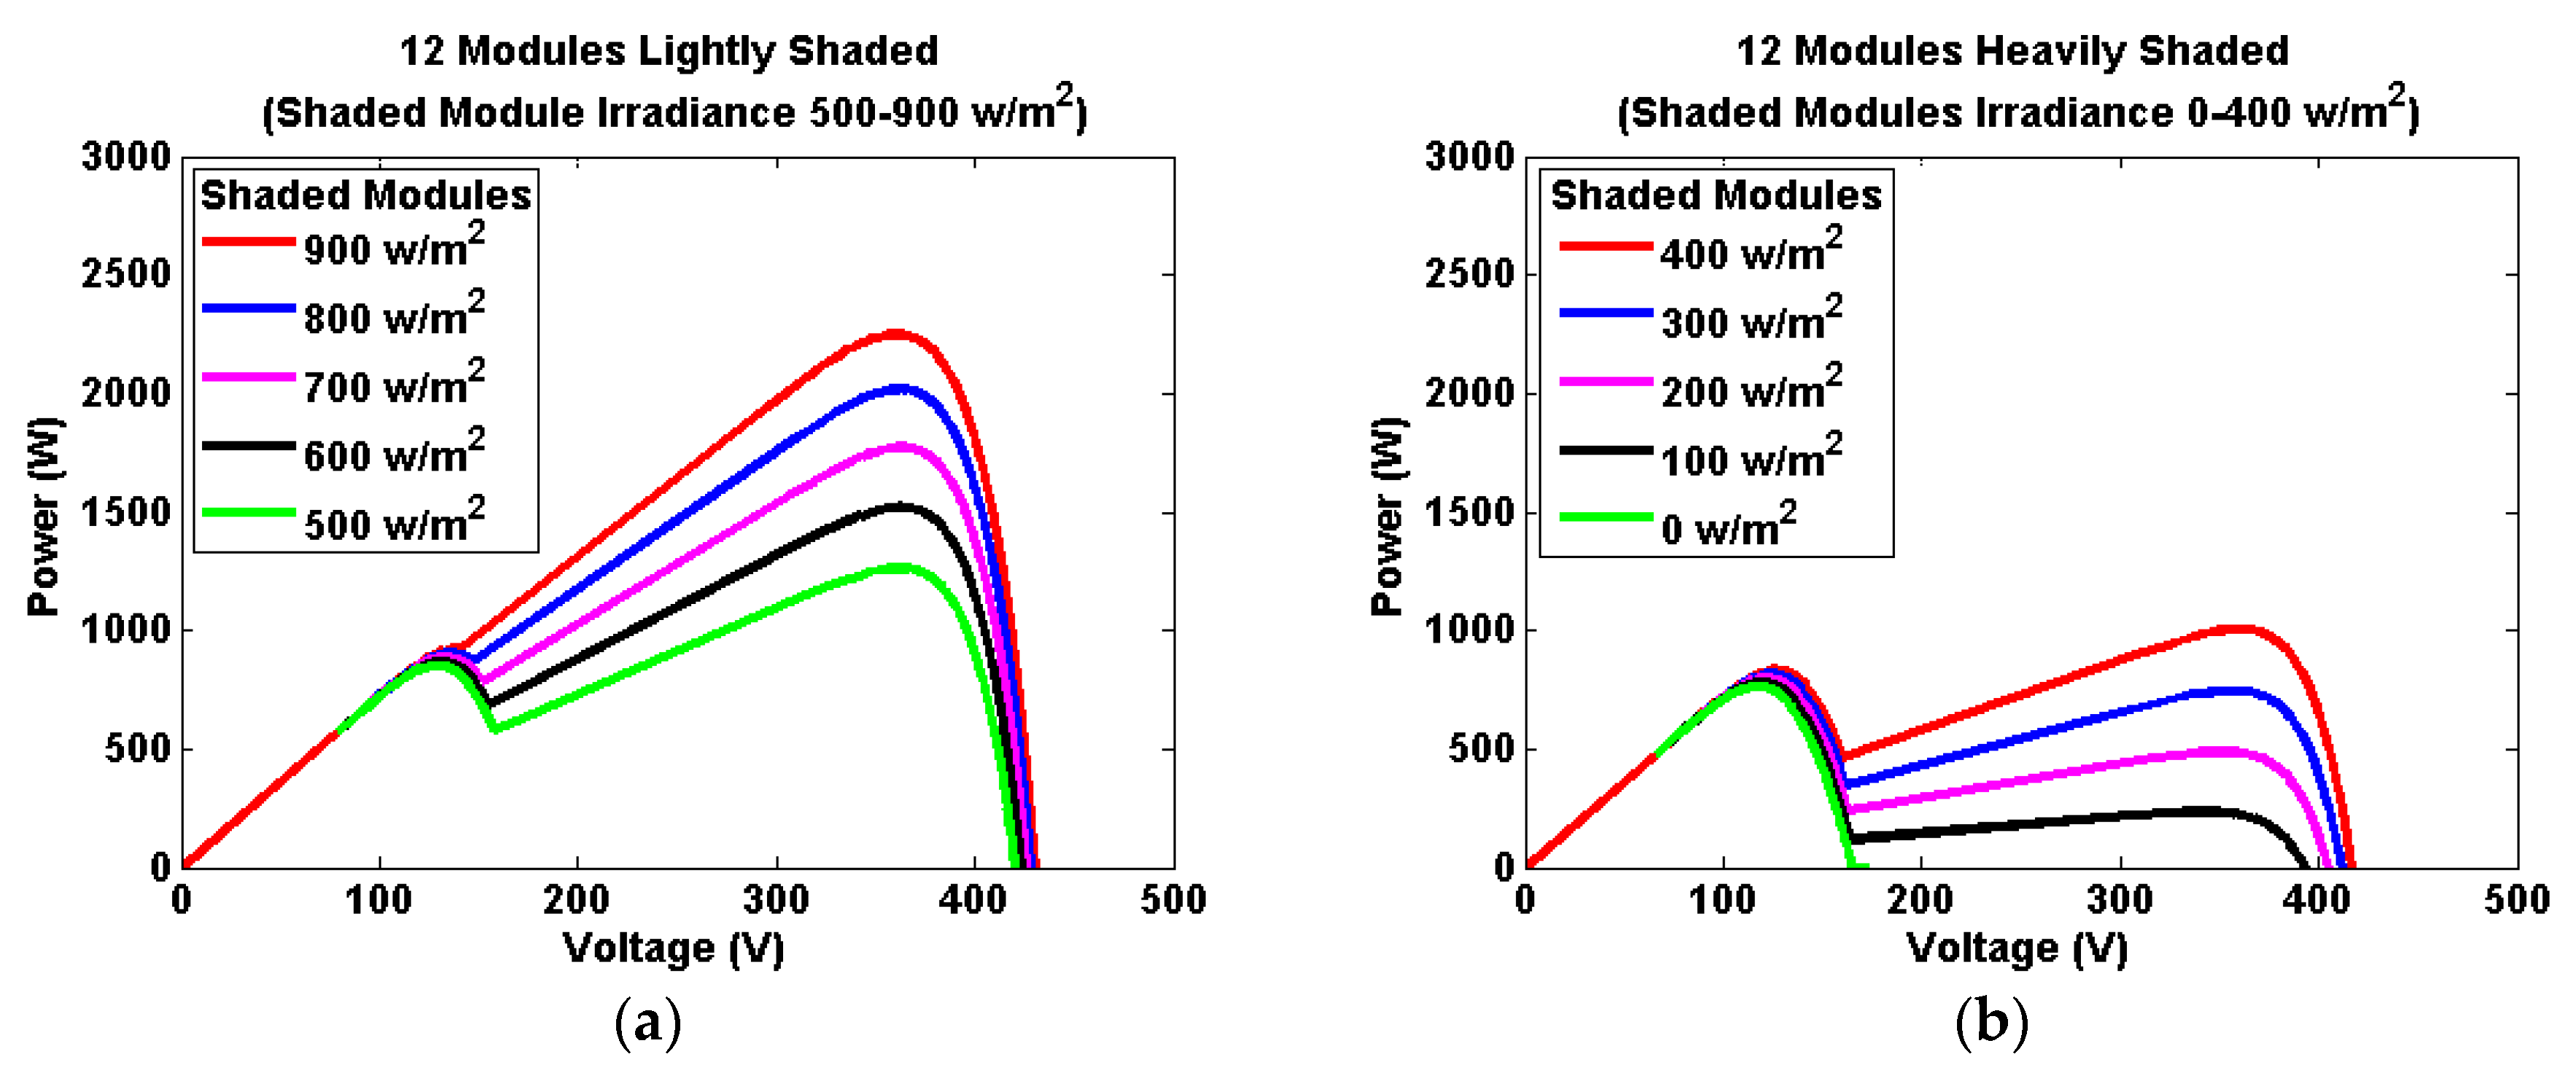
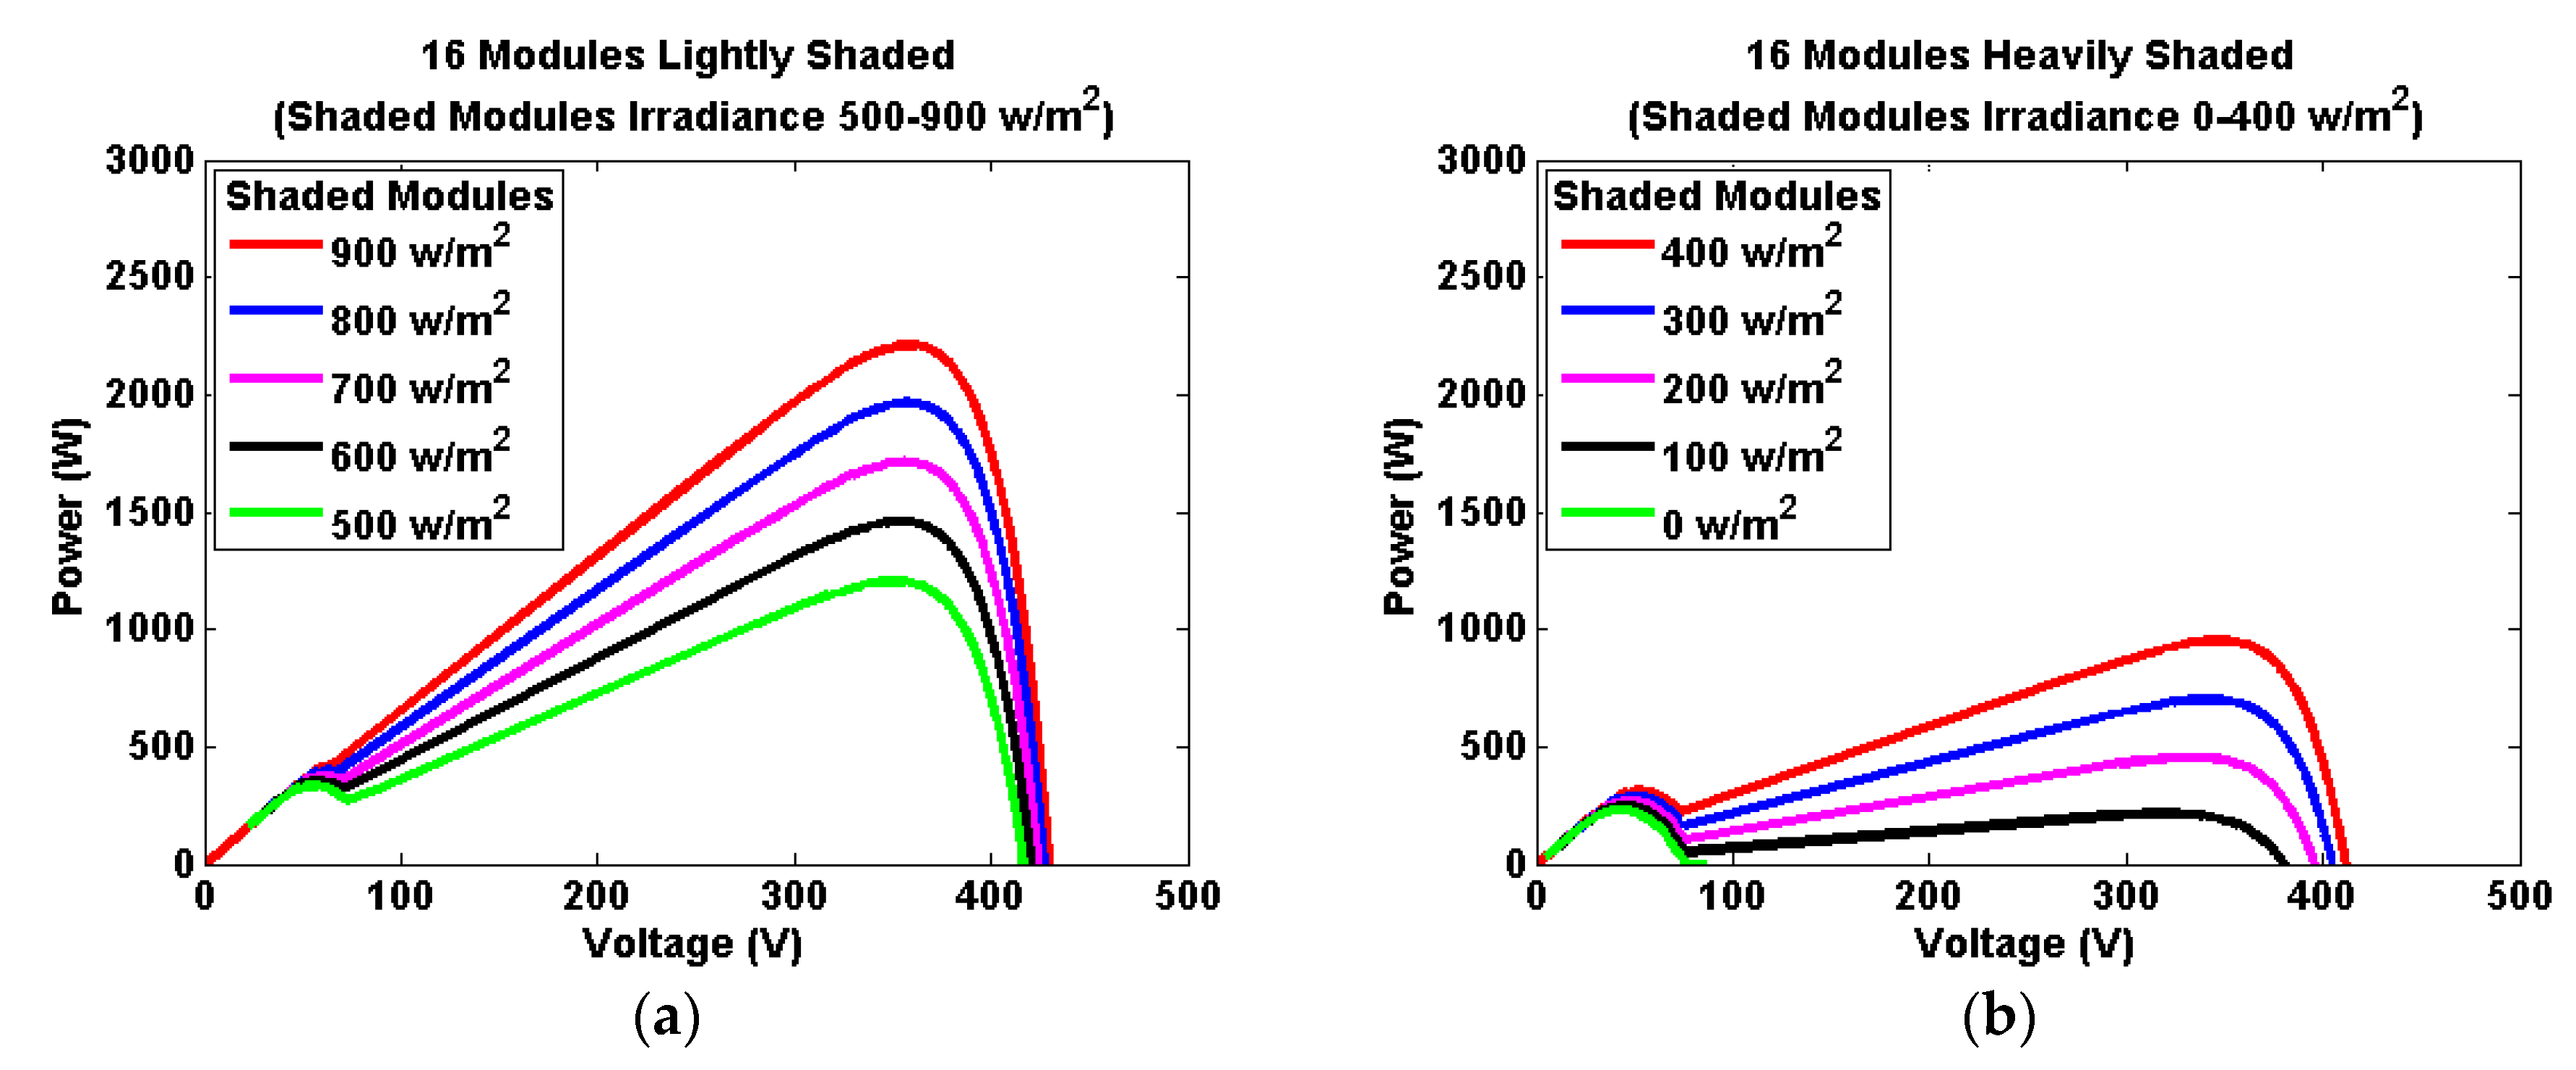
Figure 10 shows the P-V characteristics of the 12 modules shaded setup. Figure 11 shows the P-V characteristics of the 16 modules shaded setup. The similar situation that is observed in the 4 and 8 modules shaded setups is also observed in the 12 and 16 module shaded setups shown in Figure 10 and Figure 11. The higher voltage peak acts as the global peak when the shaded modules irradiance is above a certain level.
Table 6, Table 7, Table 8 and Table 9 are tabulated based on the data on the P-V characteristics of Figure 8, Figure 9, Figure 10 and Figure 11 which show the maximum power and maximum power delivery voltage of all the experimental setups under the applied conditions.
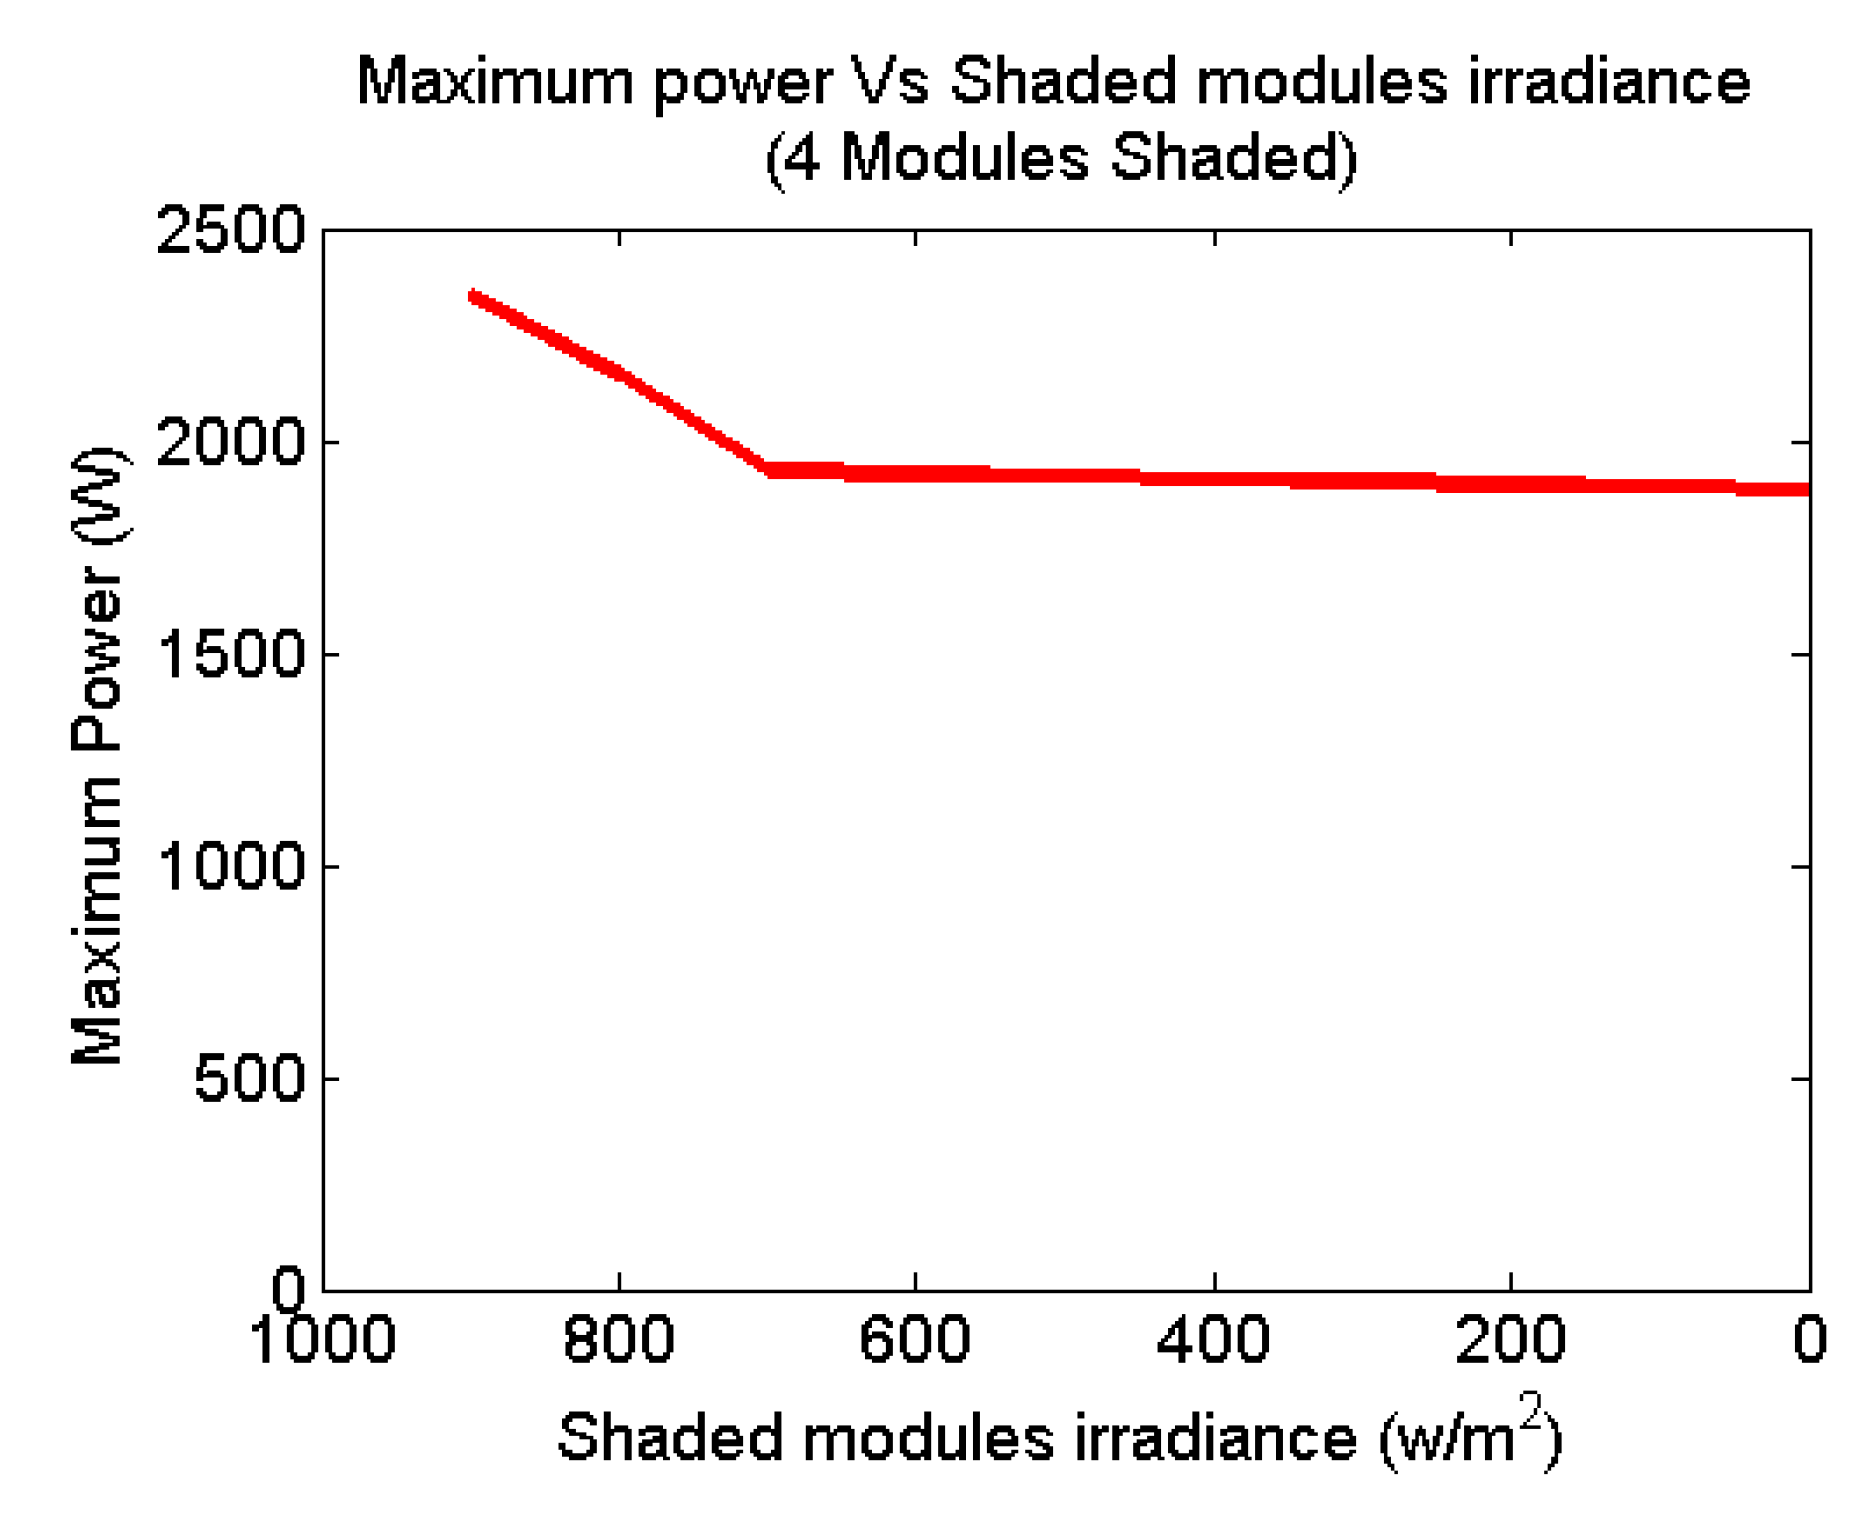
By using the maximum powers and shaded modules irradiance in Table 6, a graph such as that illustrated in Figure 12 can be plotted. It shows the relationship between the maximum powers and the shaded modules irradiance of the 4 modules shaded setup.
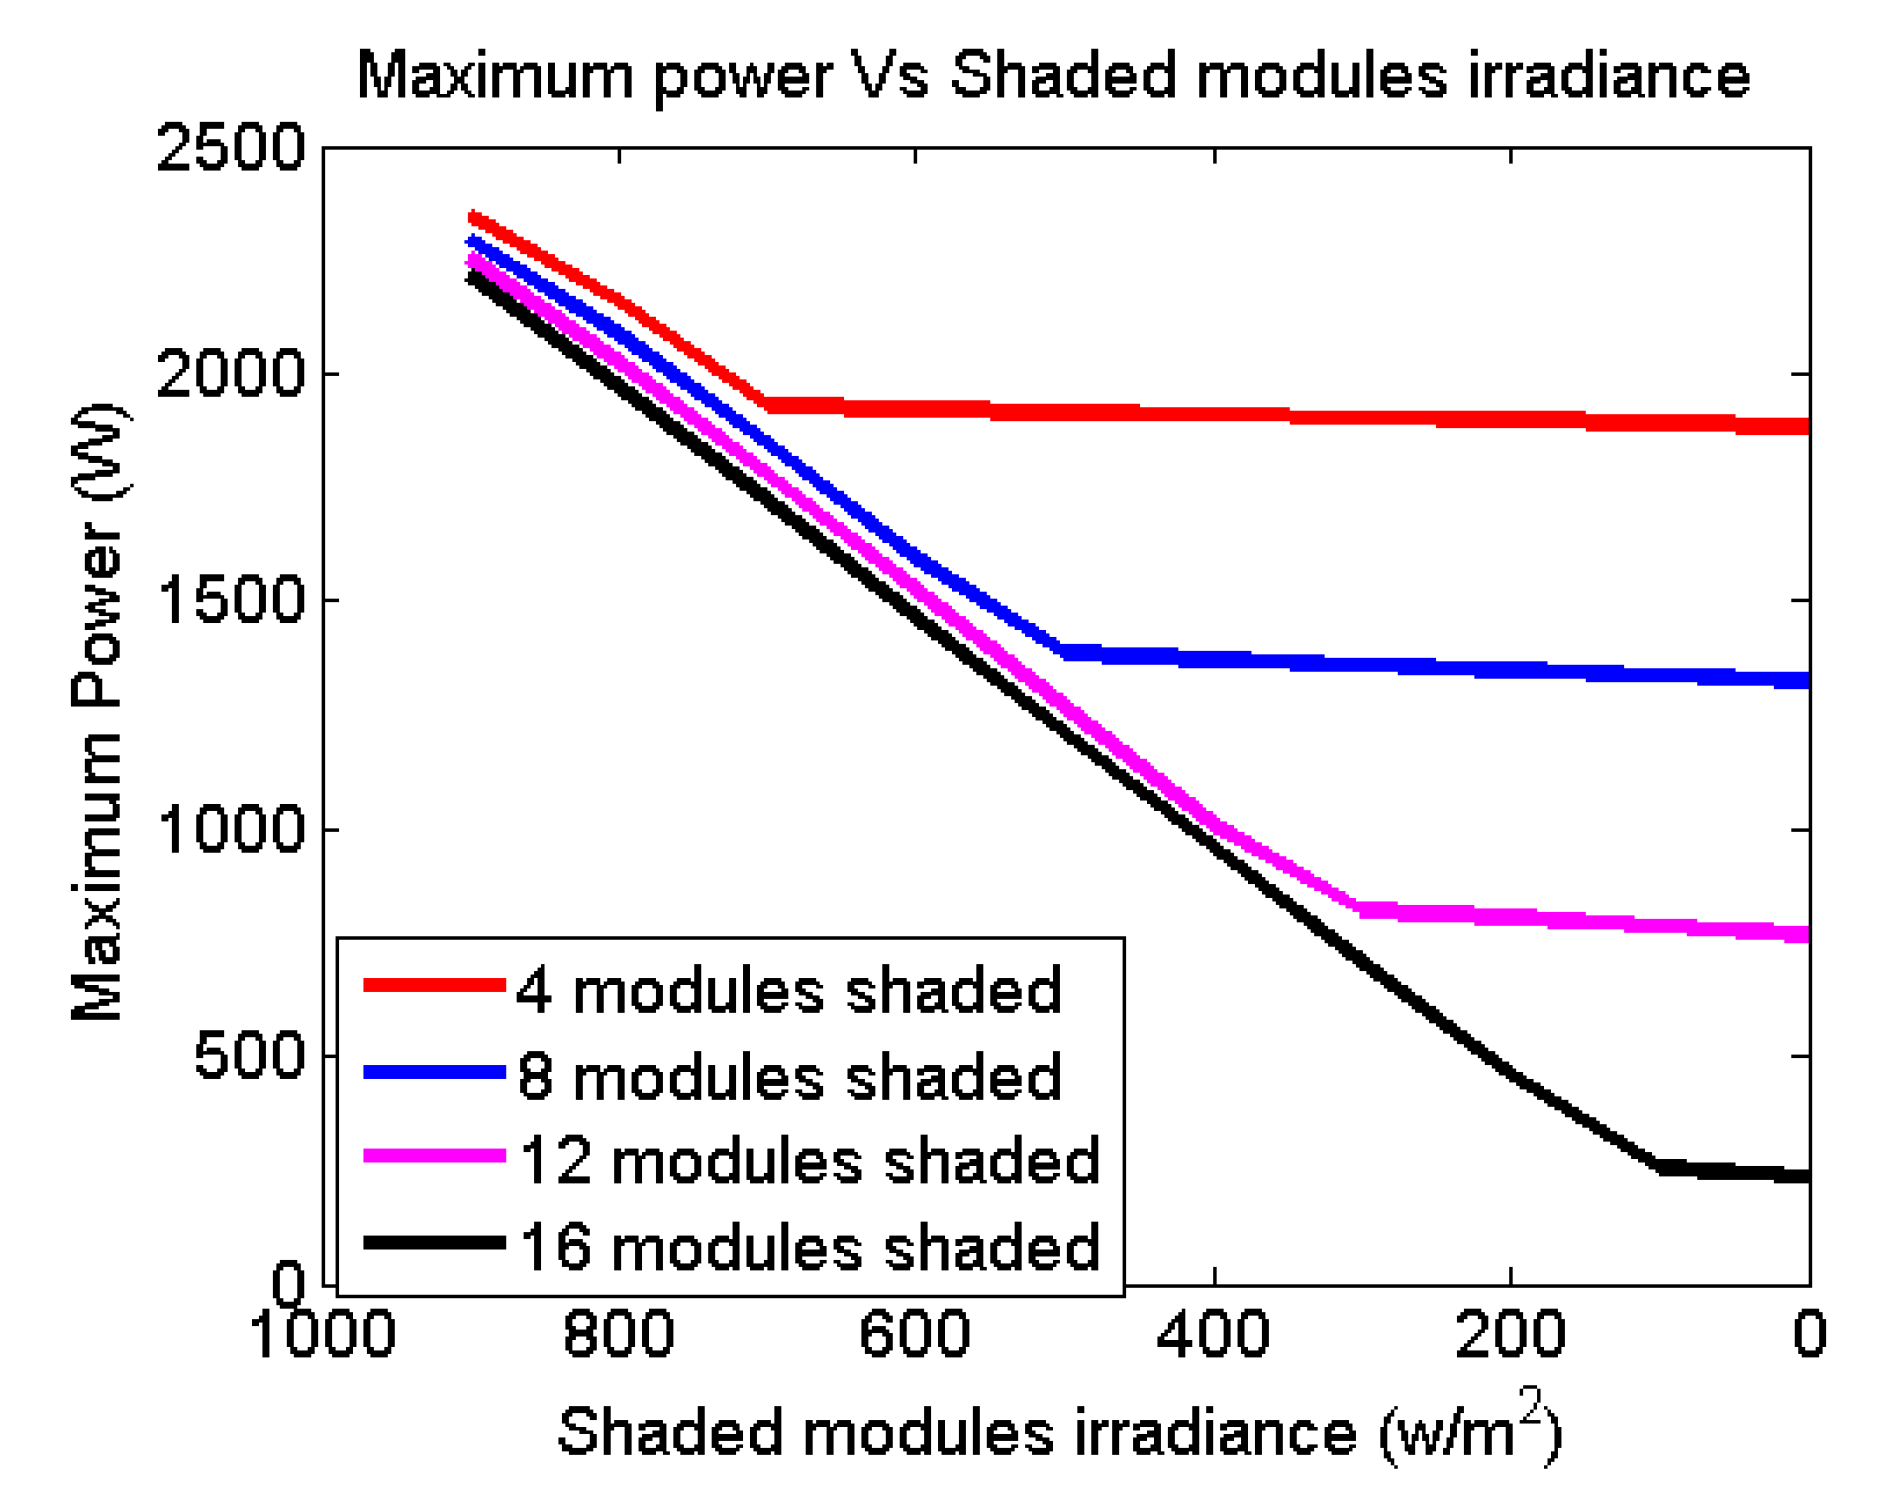
Similar procedures are applied to Table 7, Table 8 and Table 9 to obtain the relationship between the maximum powers and the shaded modules irradiance for the 8, 12, and 16 modules shaded setups. Figure 13 shows the relationship between the shaded modules irradiance and the maximum powers for all the experimental setups.
4. Discussions
Considering the 4 modules shaded setup in Figure 8a, the higher voltage peak of the P-V characteristics is higher than the lower voltage peak when the shaded module irradiance is between 800 and 900 w/m2. Therefore, the higher voltage peak acts as the global peak that represents the maximum power of the photovoltaic string. The higher voltage peak reduces as the shaded modules irradiance decreases, as illustrated in Figure 8. When the shaded modules irradiance drops below 800 w/m2, the higher voltage peak eventually becomes lower than the lower voltage peak. Therefore, the lower voltage peak becomes the global peak that represents the maximum power of the photovoltaic string.
Similar situations are observed in the 8 modules shaded setup shown in Figure 9, where the higher voltage peak acts as the global peak when the shaded modules irradiance is above a certain level. The higher voltage peak reduces as the shaded modules irradiance decreases. When the shaded modules irradiance drops below 600 w/m2, the higher voltage peak eventually becomes lower than the lower voltage peak. Therefore, the lower voltage peak started to acts as the global peak which represents the maximum power of the photovoltaic string.
It is observed that the similar situations that are seen in the 4 and 8 modules shaded setups are also observed in 12 and 16 module shaded setups shown in Figure 10 and Figure 11. The higher voltage peak acts as the global peak when the shaded modules irradiance is above a certain level. When the shaded modules irradiance drops below a certain level, the lower voltage peak started to acts as the global peak which represents the maximum power of the photovoltaic string.
Regardless of the number of shaded modules in the photovoltaic string, the higher voltage peak of the P-V characteristics reduces significantly as the shaded modules irradiance decreases. On the other hand, the lower voltage peak rarely changes as the shaded modules irradiance decreases. This is because the higher voltage peak of the P-V characteristics is formed by the shaded and unshaded photovoltaic modules in the photovoltaic string. Hence, the higher voltage peak is susceptible to the shading that is applied to the shaded photovoltaic modules. On the other hand, the lower voltage peak is formed by the unshaded modules in the photovoltaic string. Hence, the lower voltage peak is insusceptible to the shading applied to the shaded photovoltaic modules.
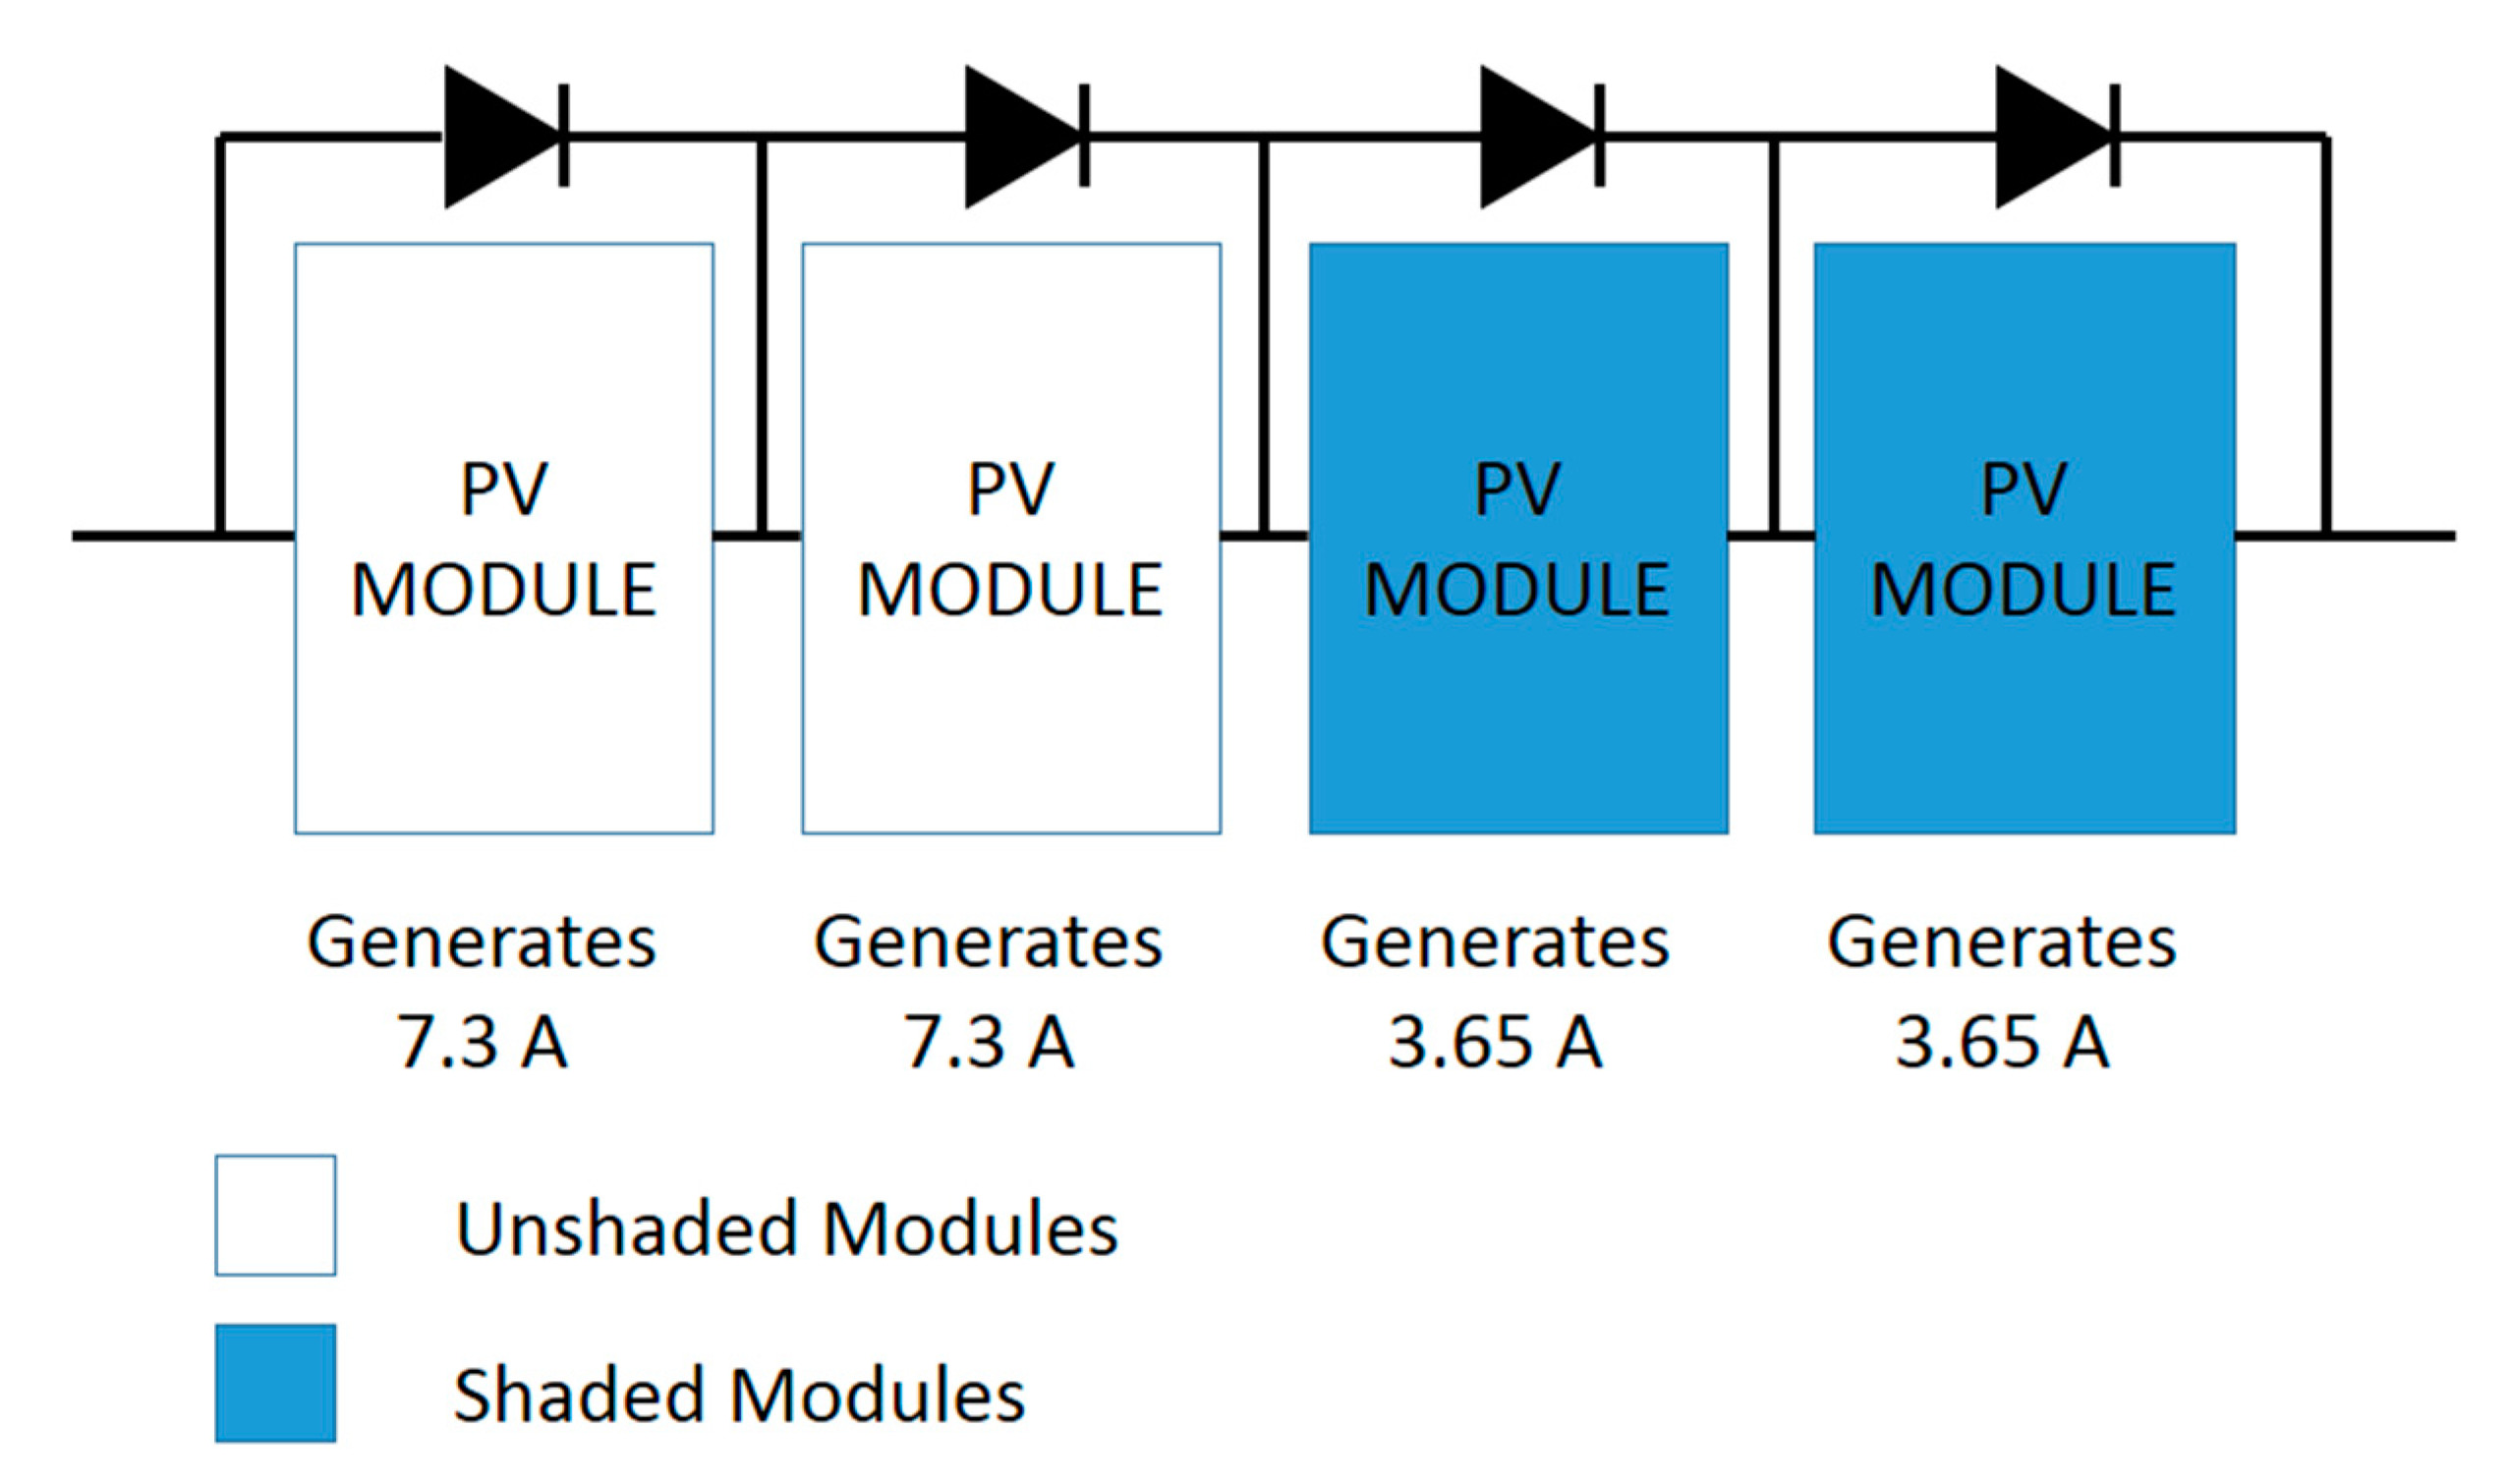
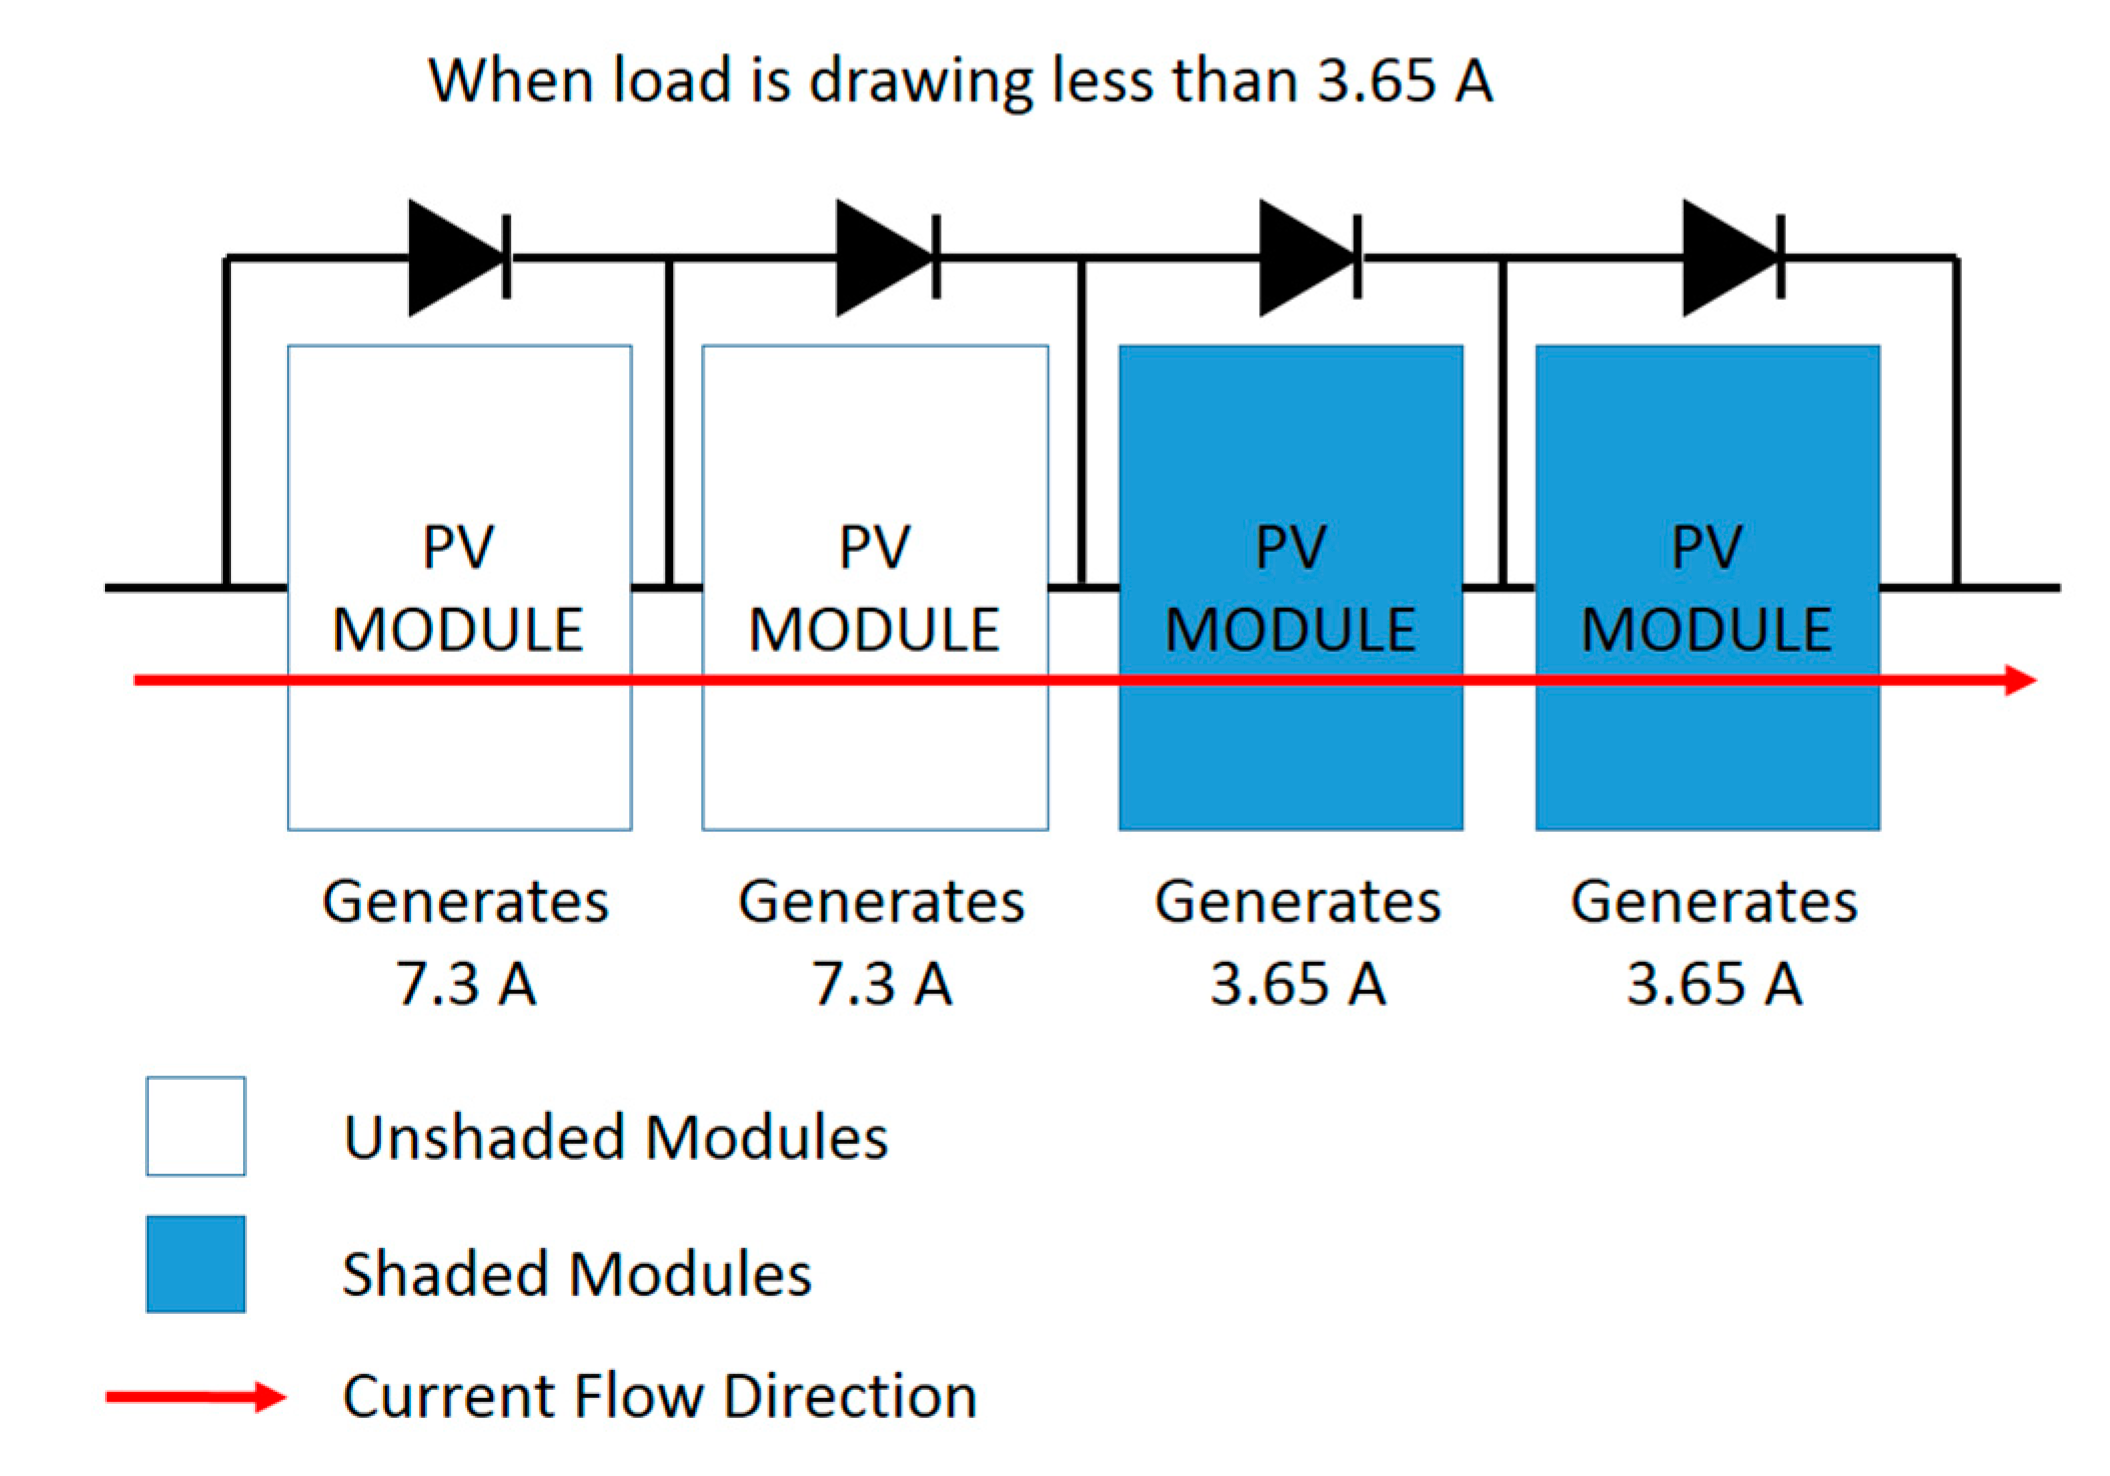
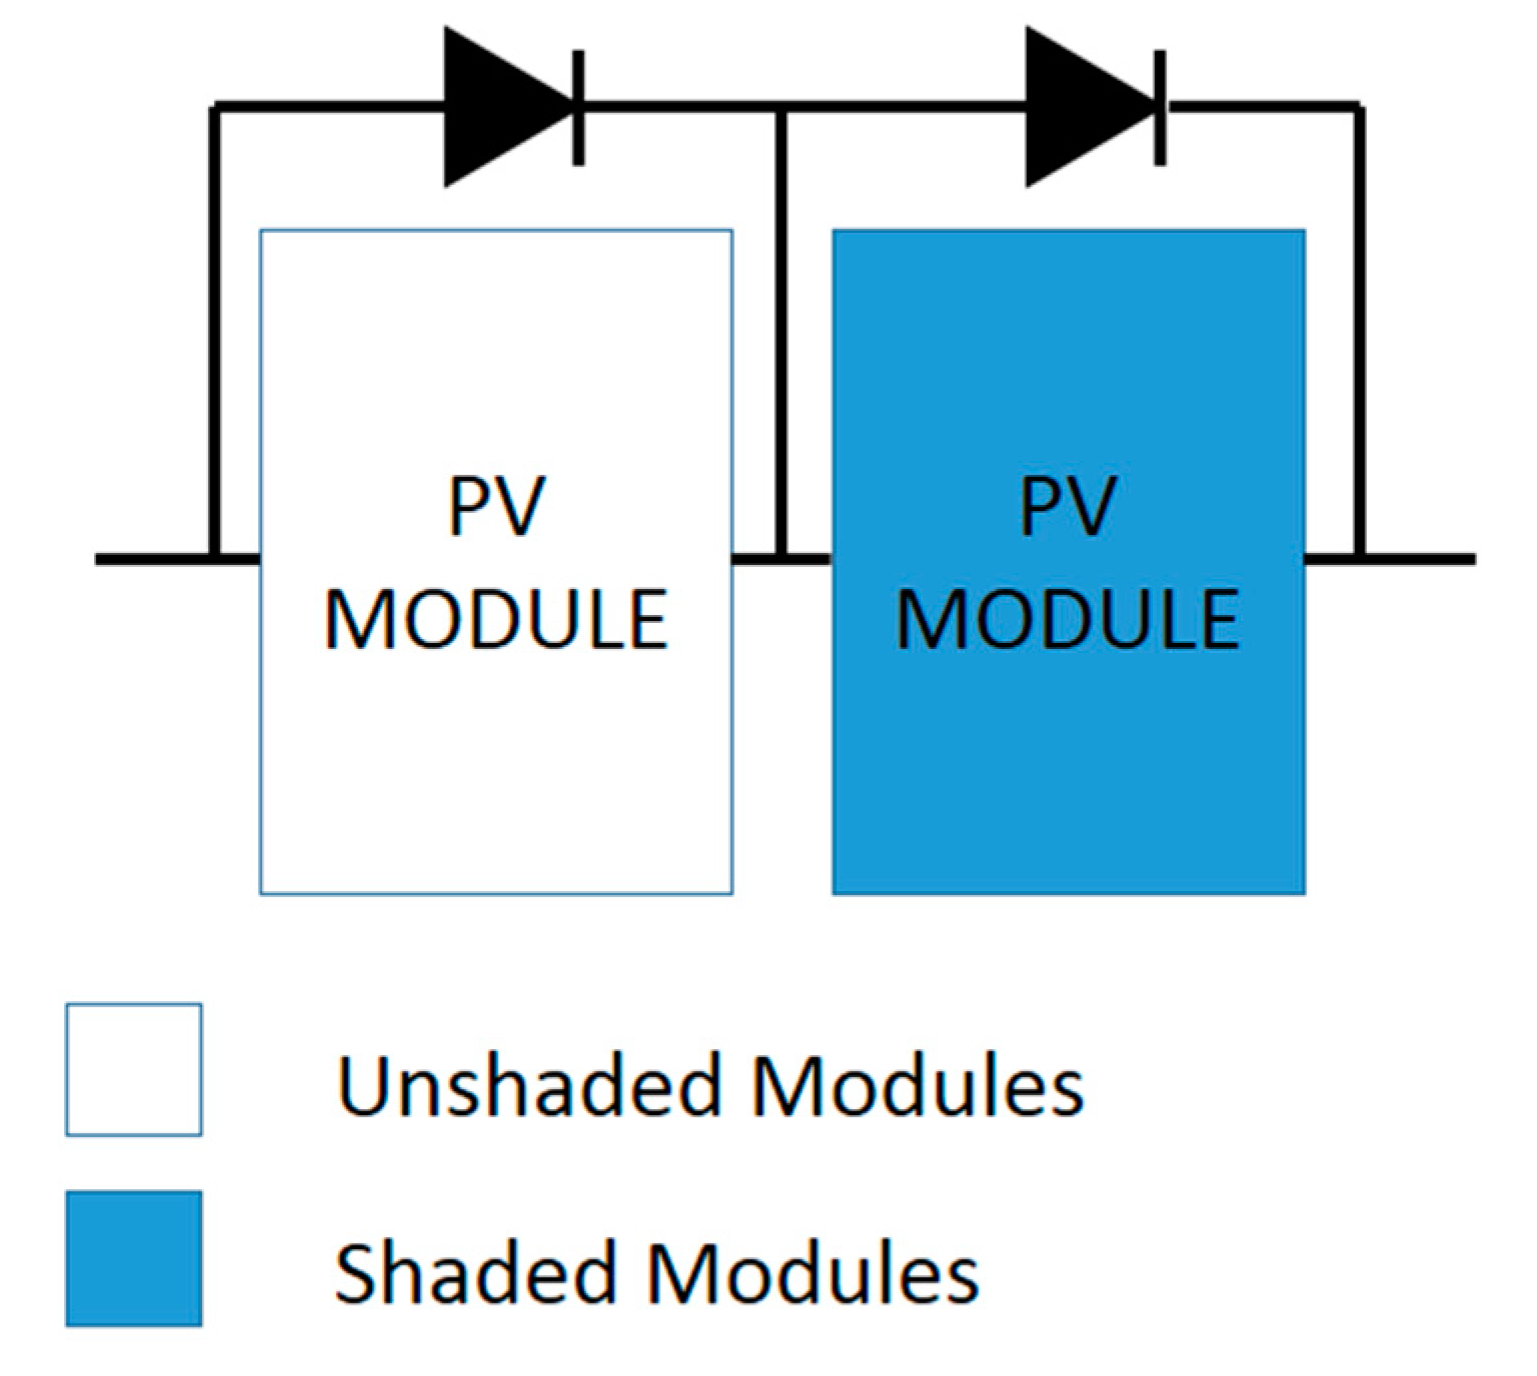
To apprehend this theory, consider the photovoltaic string in Figure 14. The photovoltaic string consists of four photovoltaic modules where two photovoltaic modules are unshaded and the other two photovoltaic modules are shaded, as illustrated in Figure 14. The unshaded photovoltaic modules generate 7.3 A and the shaded photovoltaic modules generate 3.65 A.
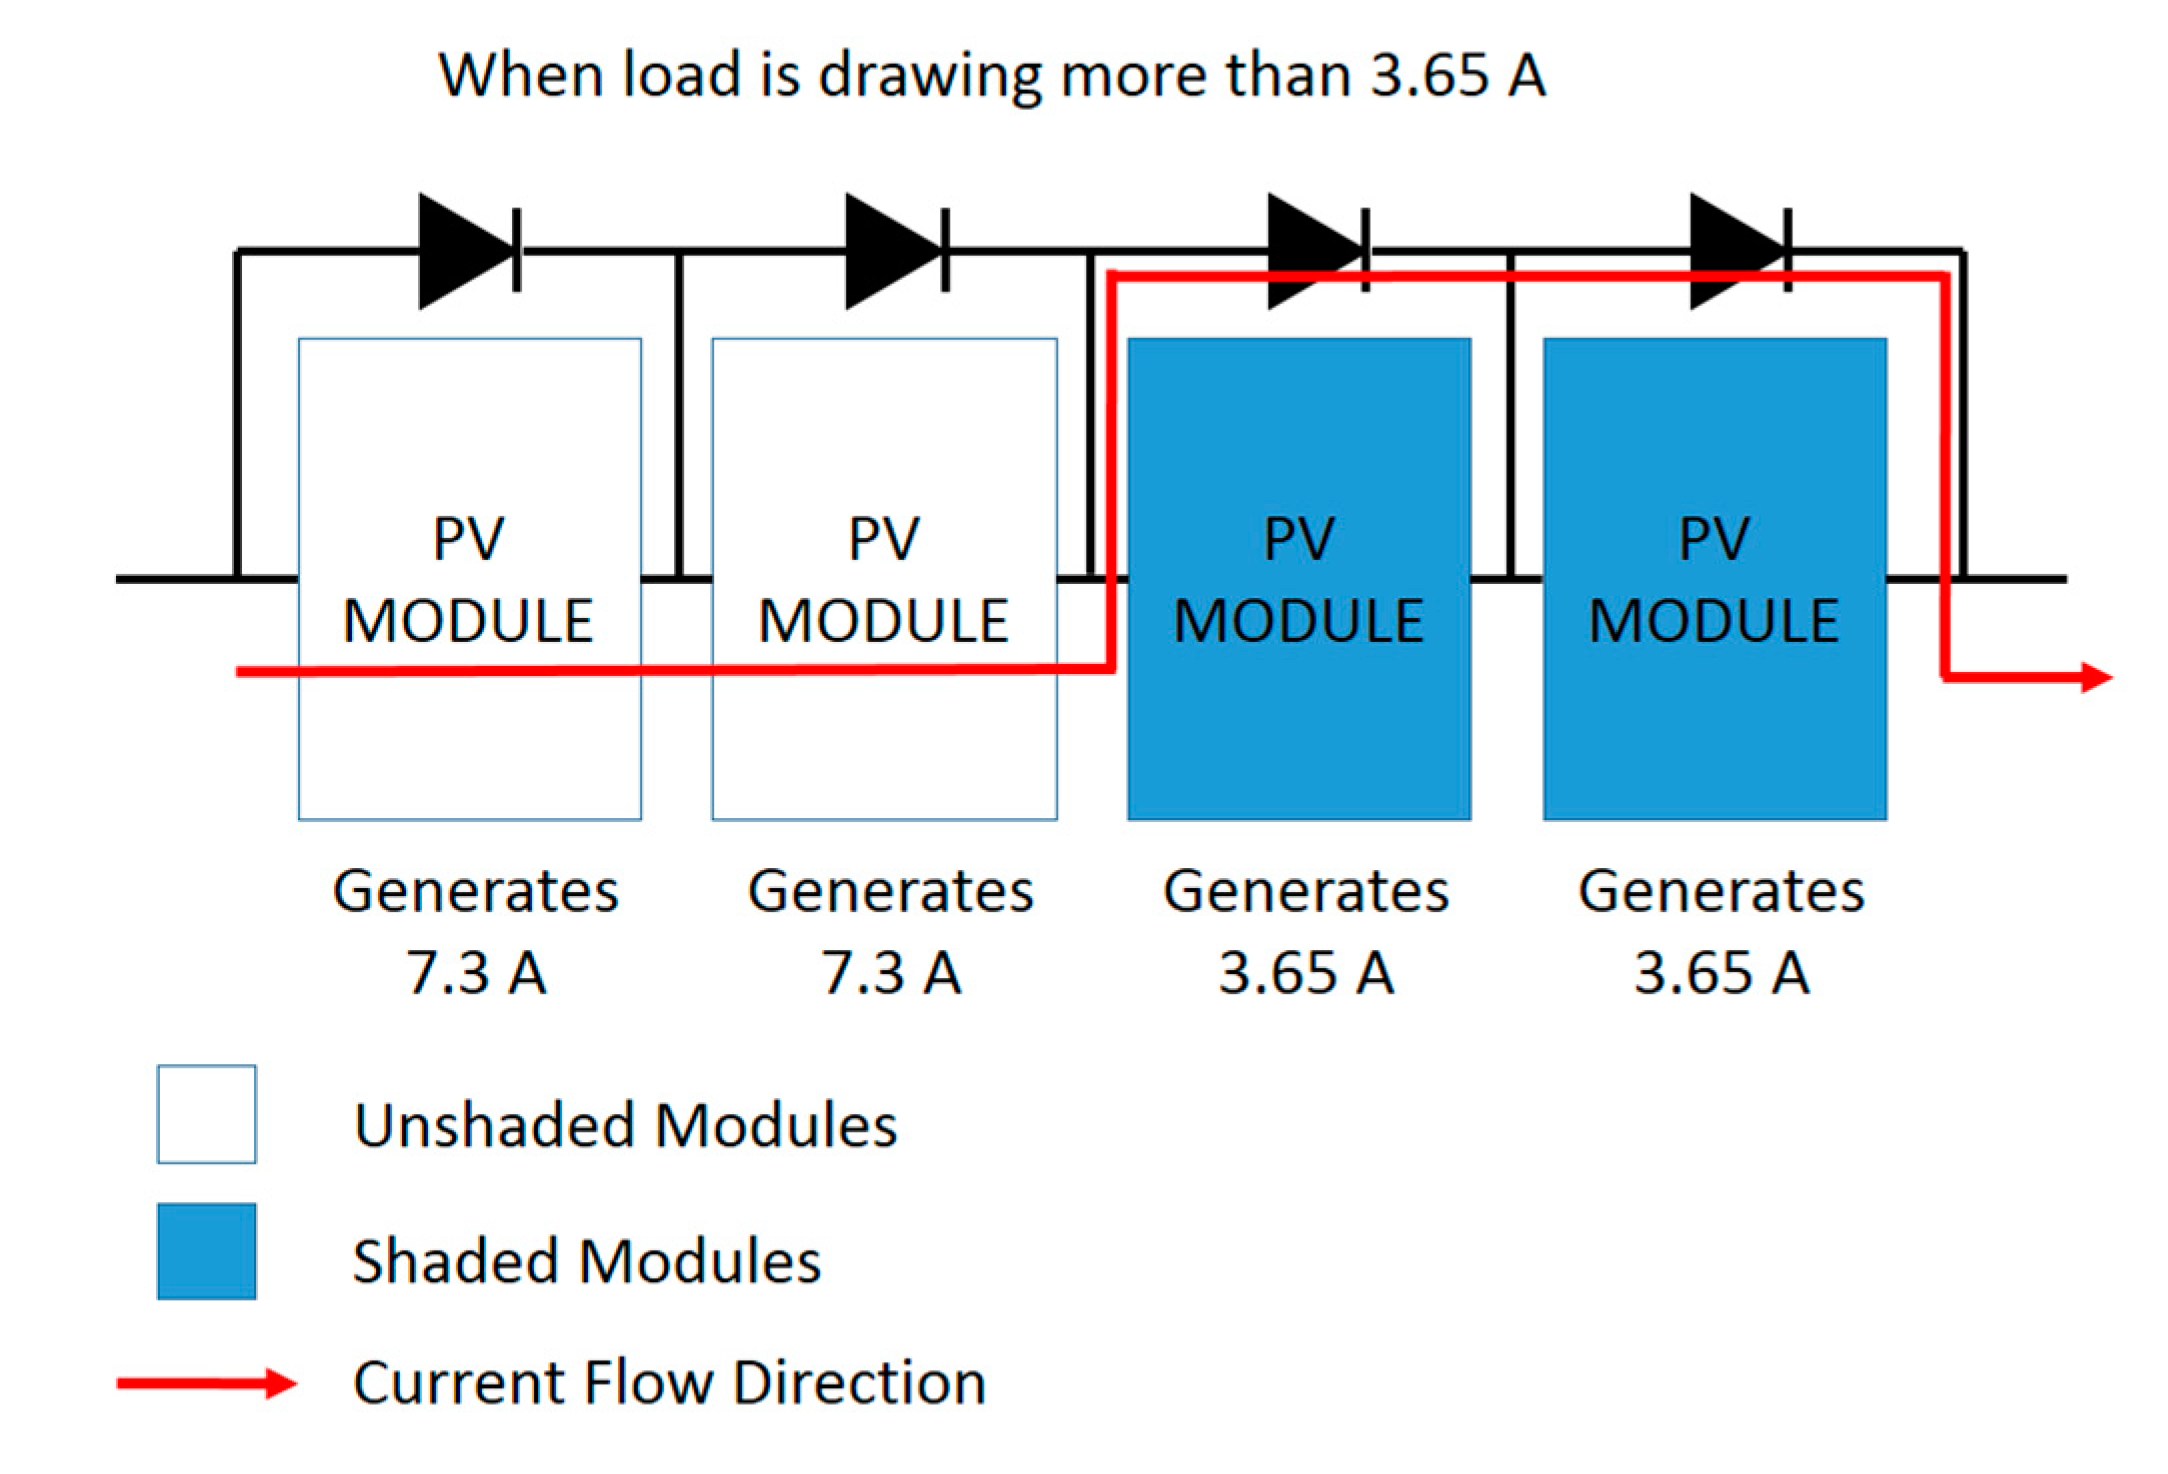
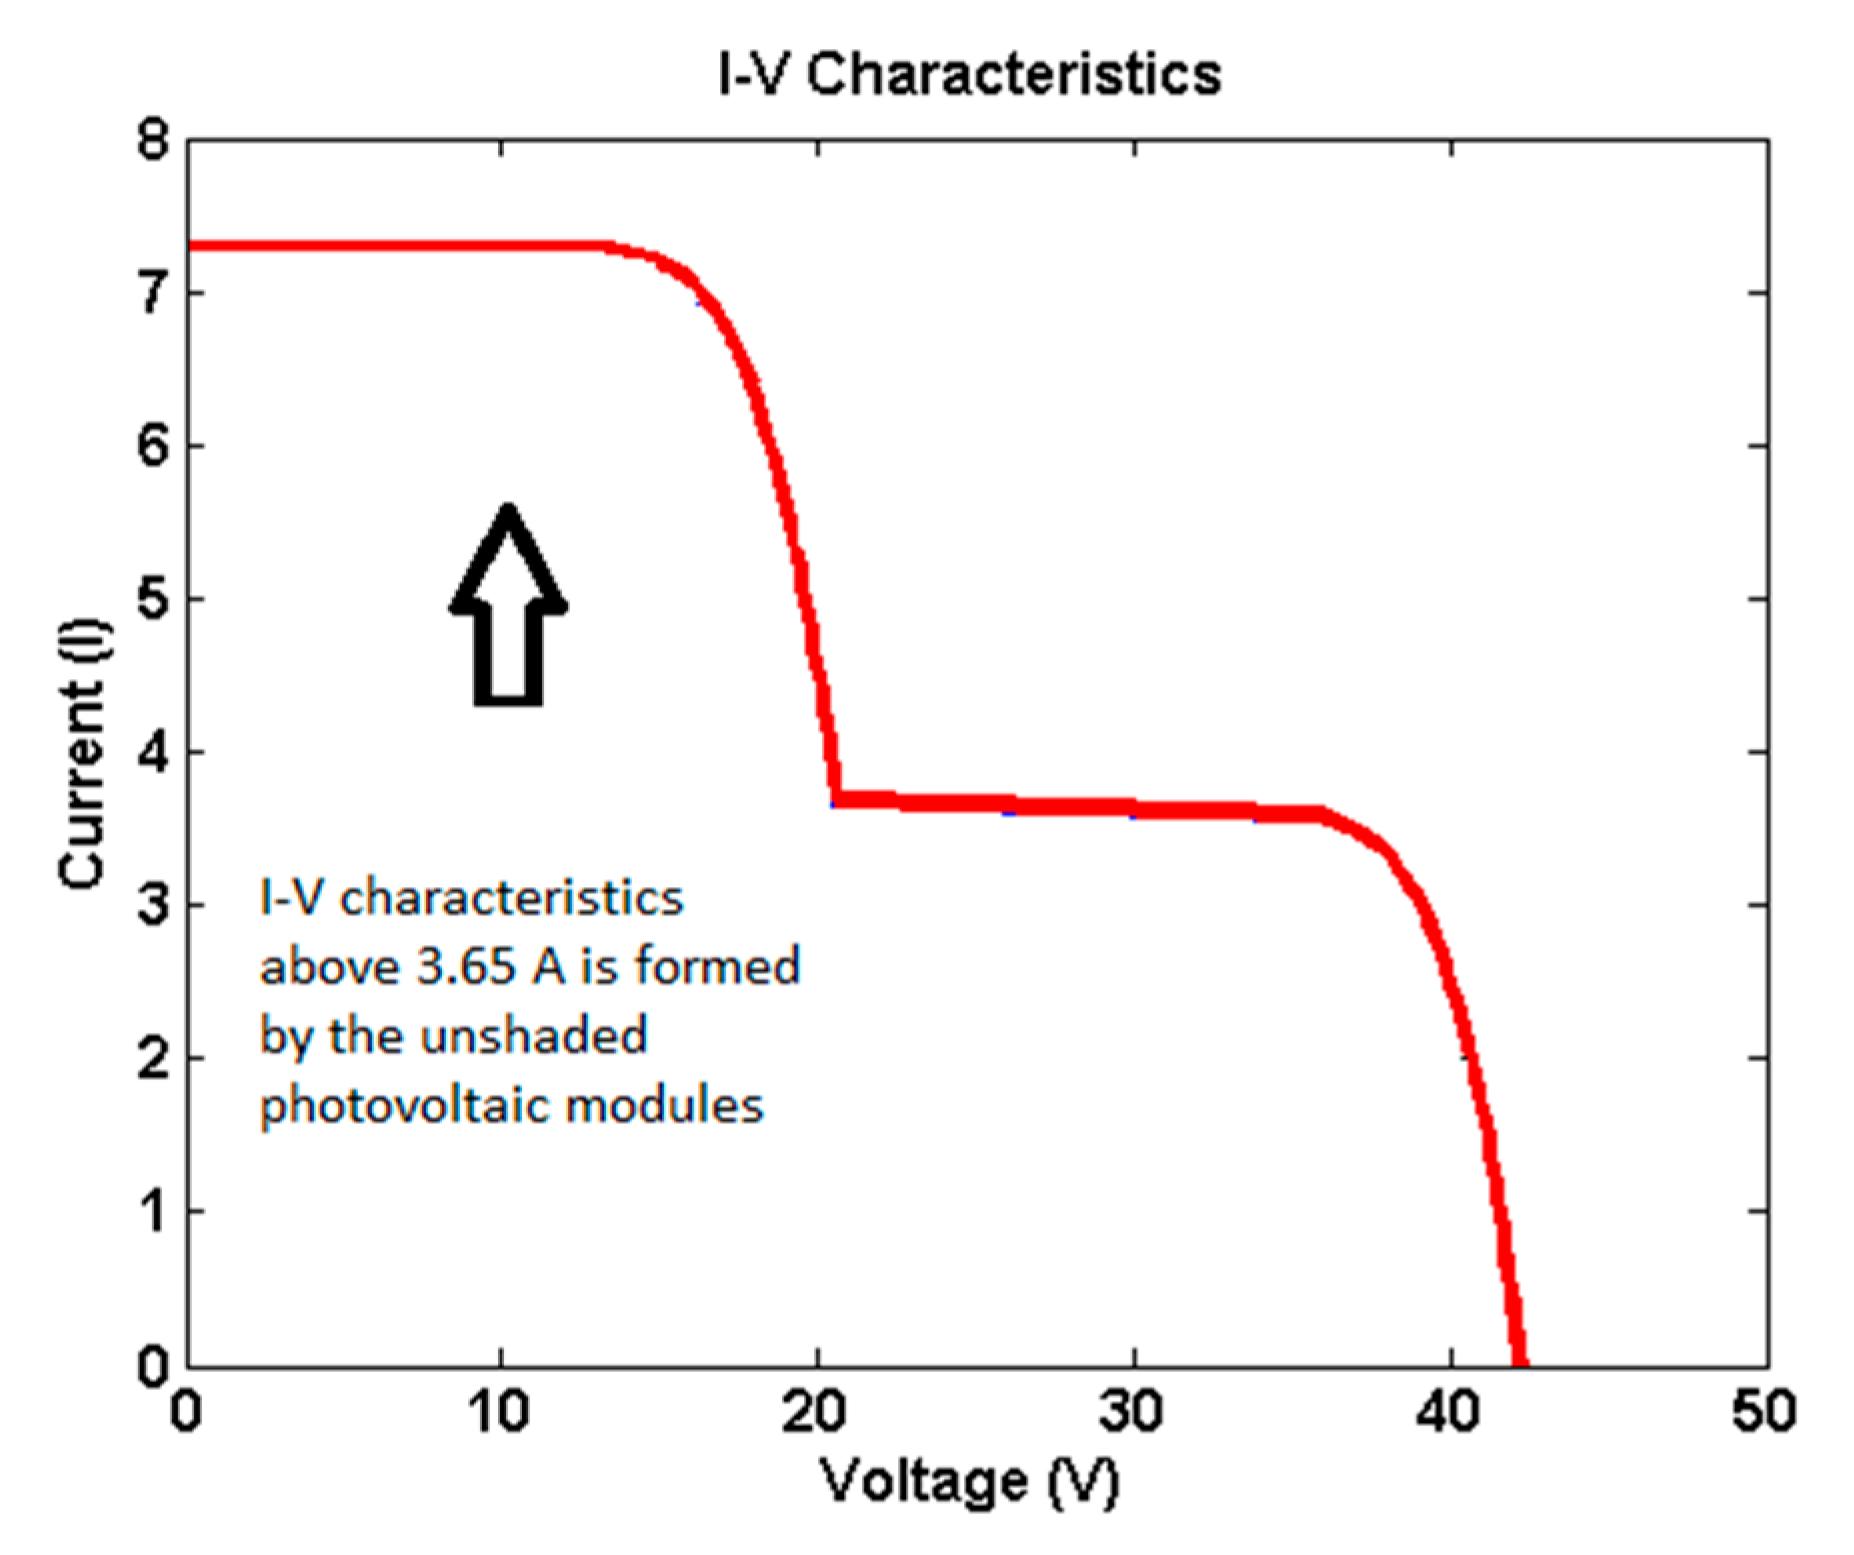
When the load is drawing more than 3.65 A, the shaded photovoltaic modules are bypassed by the bypass diodes. Hence, the current generated by the unshaded photovoltaic modules is directed to the load without flowing through the shaded photovoltaic modules, as illustrated in Figure 15. Therefore, the I-V characteristics of the photovoltaic string above 3.65 A are formed by the unshaded photovoltaic modules only, as illustrated in Figure 16. Hence, variation in the shading heaviness on the shaded photovoltaic modules does not change the I-V characteristic at currents above 3.65 A.
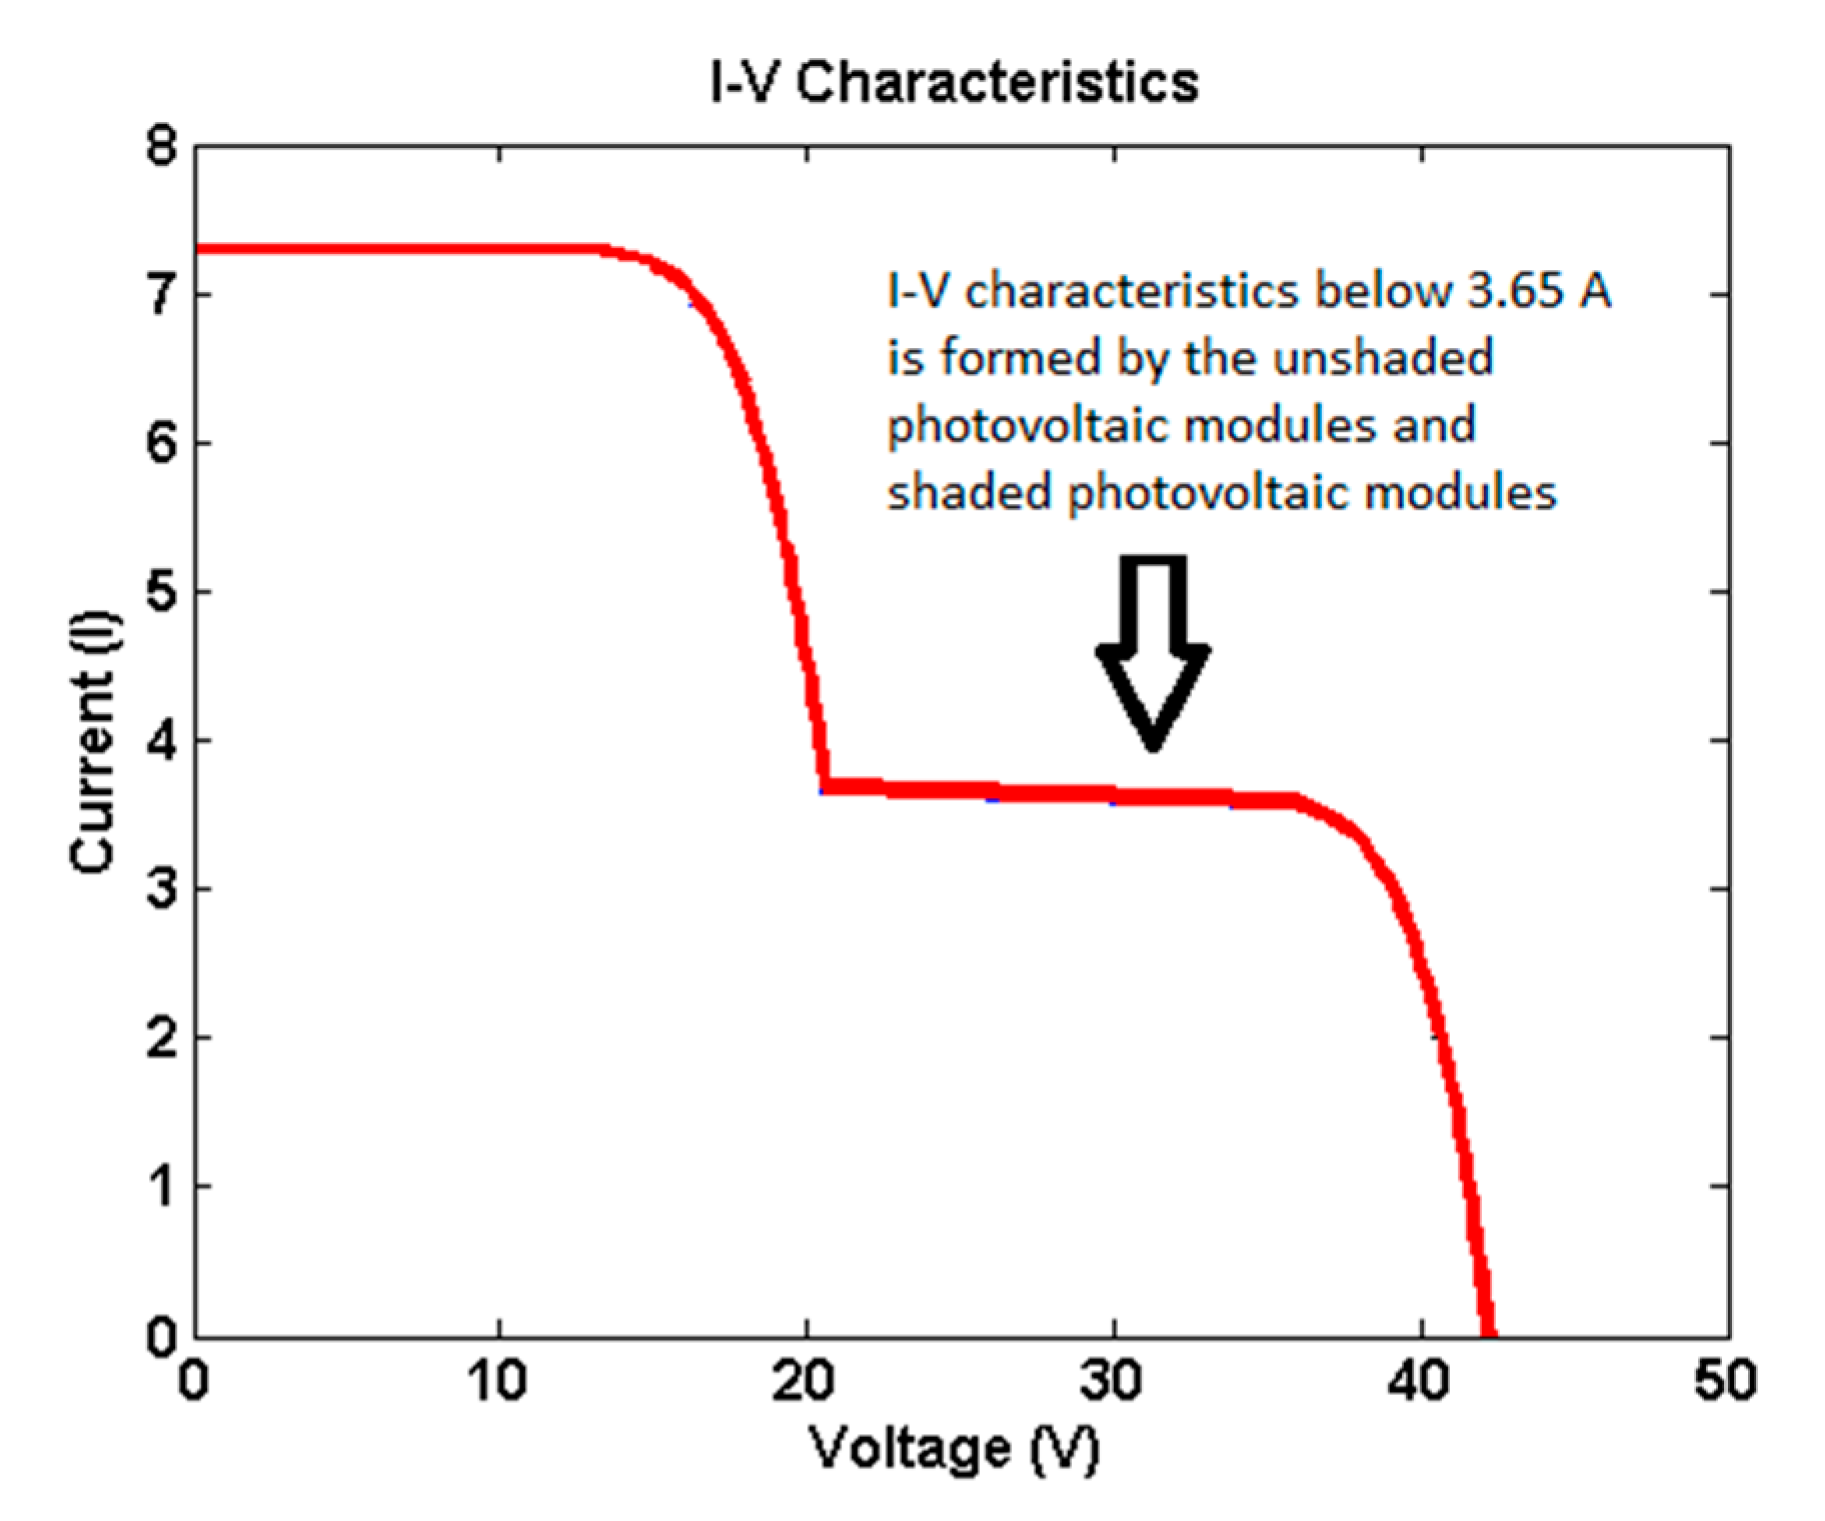
When the load is drawing less than 3.65 A, the shaded photovoltaic modules are not bypassed by the bypass diodes. Hence, the current generated by the unshaded photovoltaic modules flow through the shaded photovoltaic modules, as illustrated in Figure 17. Therefore, the I-V characteristics of the photovoltaic string below 3.65 A are formed by the unshaded photovoltaic modules and shaded photovoltaic modules, as illustrated in Figure 18. Hence, the I-V characteristic below 3.65 A is susceptible to the shading heaviness on the shaded photovoltaic modules.
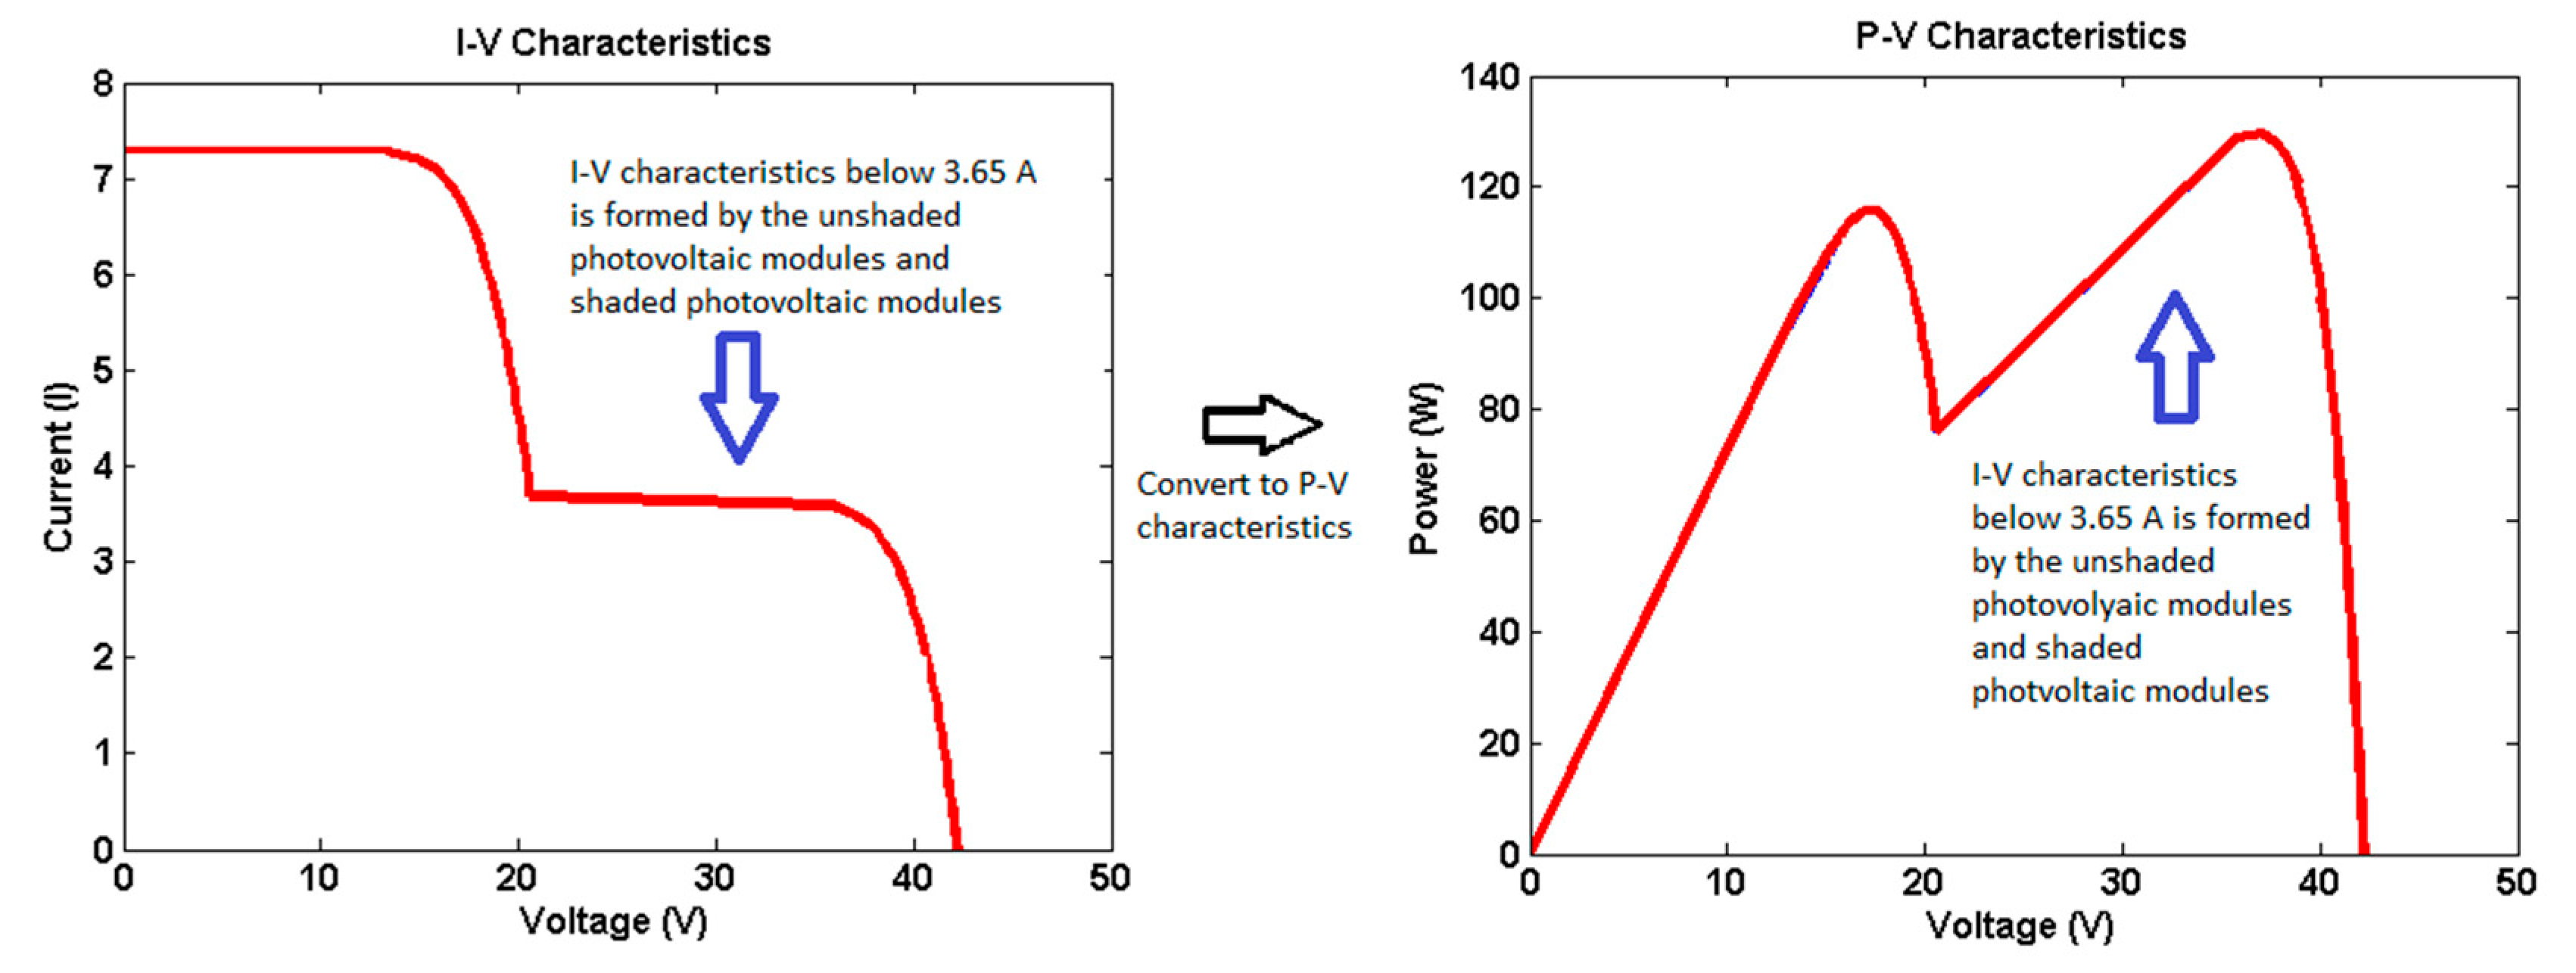
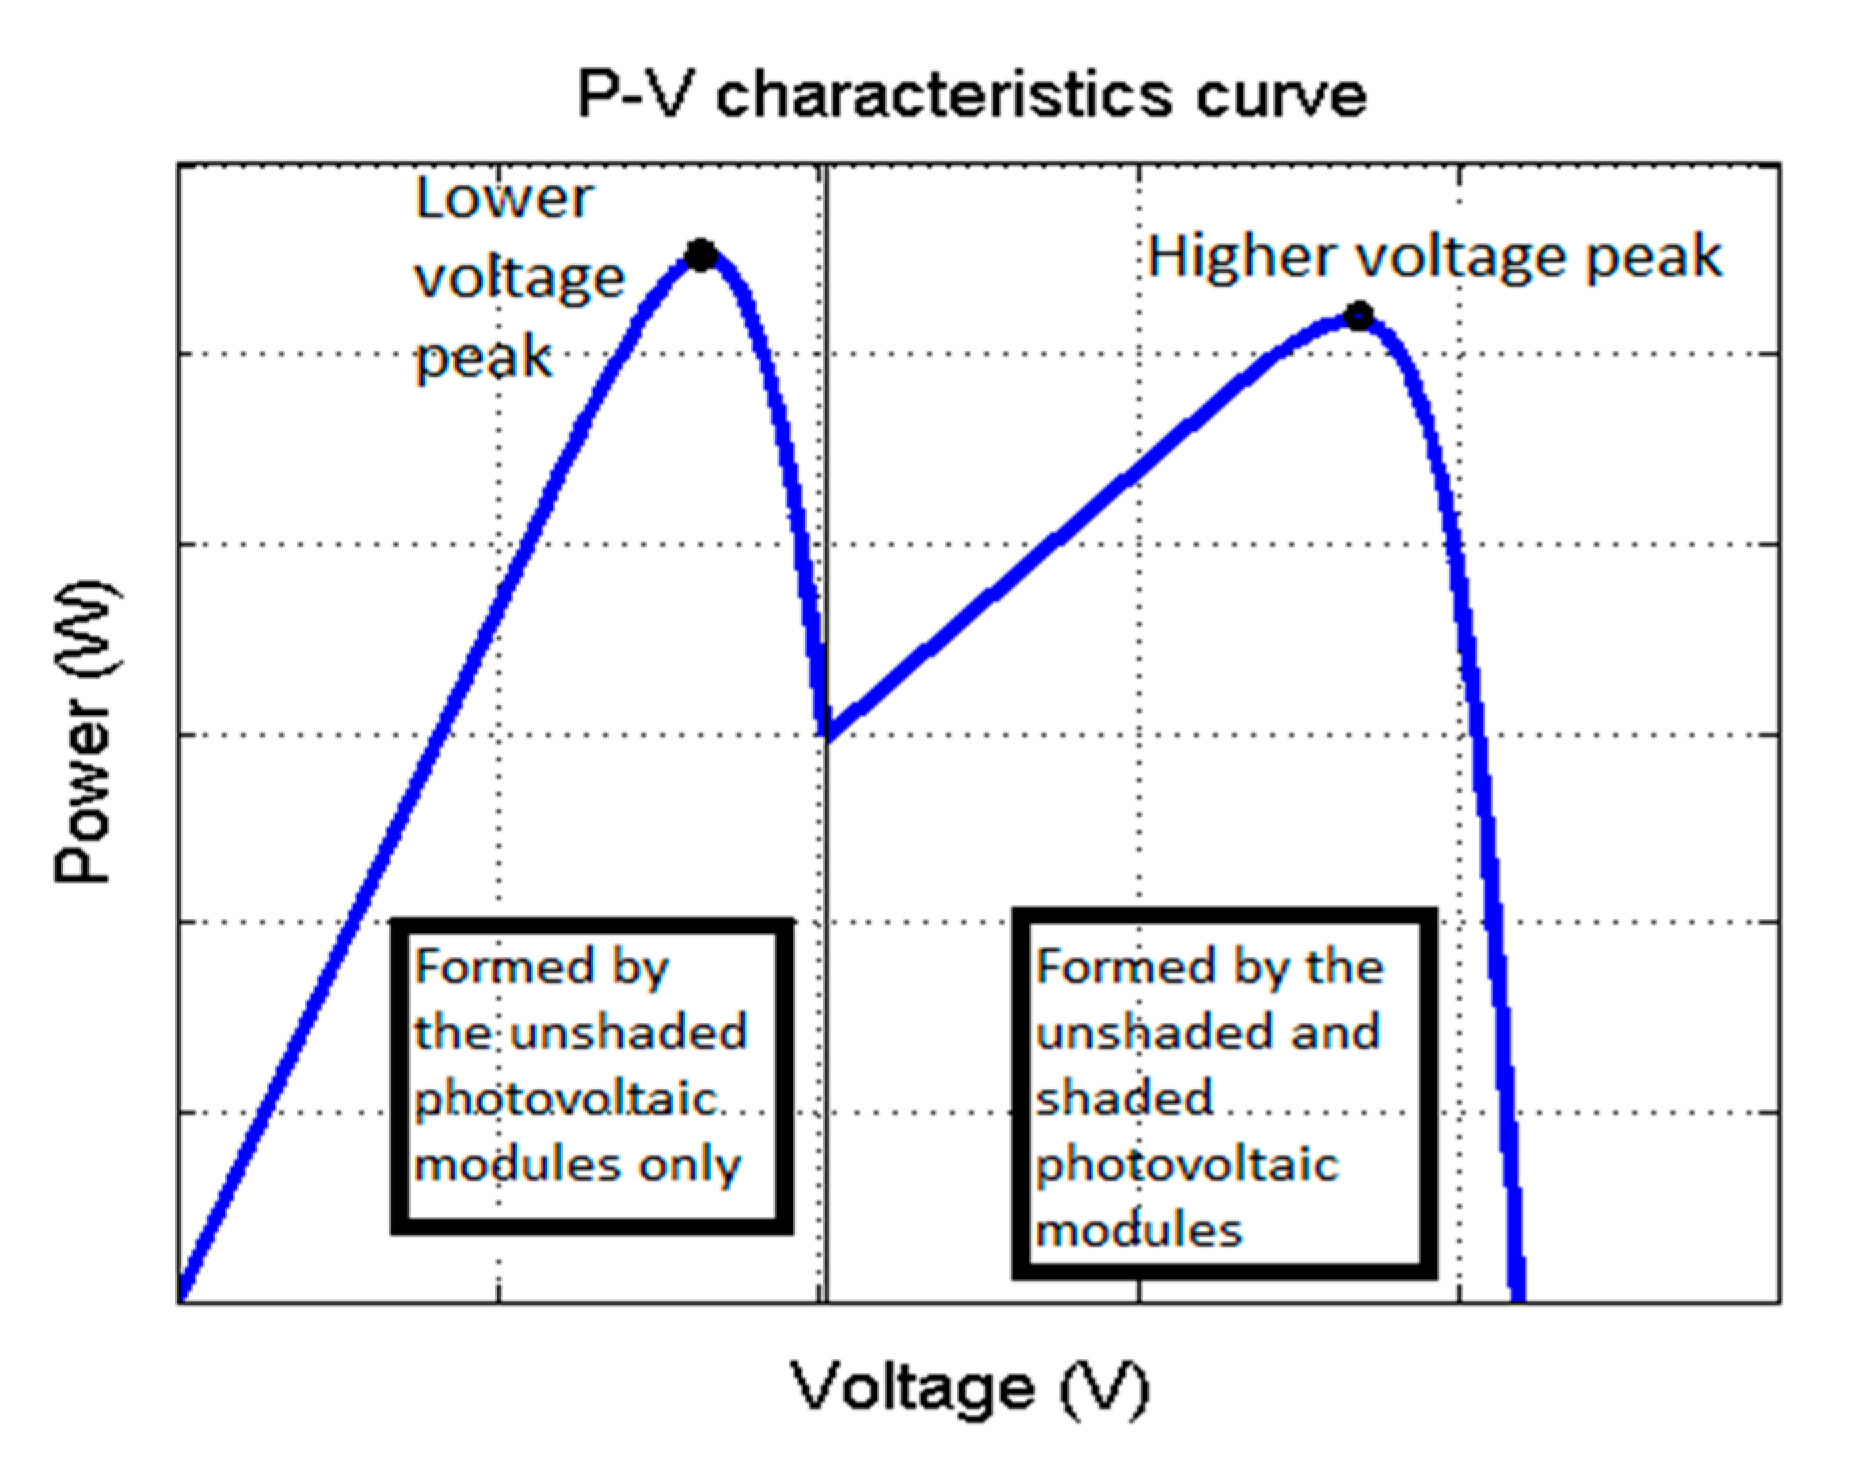
When the I-V characteristics in Figure 18 are converted to P-V characteristics, the P-V characteristics as illustrated in Figure 19 will be obtained. It shows that the higher voltage peak of the P-V characteristics is actually formed by the I-V characteristics below 3.65 A, as indicated by the blue arrows in Figure 19. This proves that the higher voltage peak of the P-V characteristics is formed by the shaded and unshaded photovoltaic modules in the photovoltaic string. Hence, the higher voltage peak is susceptible to the shading on the shaded photovoltaic modules. On the other hand, the lower voltage peak is formed by the unshaded photovoltaic modules only, as concluded in Figure 20.
The maximum power does not necessarily deliver at a higher voltage. For instance, for the 4 modules shaded setup in Figure 8a, the maximum power is delivered at a higher voltage when the shaded modules irradiance is between 800 and 900 w/m2, as illustrated in Figure 21. On the other hand, the maximum power is delivered at a lower voltage when the shaded modules irradiance is below or equal to 700 w/m2, as illustrated in Figure 21. Similar situations are also observed in the 8 modules shaded, 12 modules shaded, and 16 modules shaded setups, as illustrated in Figure 9, Figure 10 and Figure 11.
Considering the 8 modules shaded setup in Figure 9, the maximum power is delivered at a lower voltage when the shaded modules irradiance is below or equal to the critical point of 500 w/m2. Considering the 16 modules shaded setup in Figure 11, the maximum power is delivered at a lower voltage when the shaded modules irradiance is below or equal to the critical point of 100 w/m2. Table 10 shows the critical point for the maximum power to deliver at a lower voltage. Equation (3) defines the equation to determine the critical point which is derived from Table 10.
To validate Equation (3), consider the photovoltaic string in Figure 22. The photovoltaic string consists of two photovoltaic modules where one photovoltaic module is unshaded and fixed at 1000 w/m2. Another photovoltaic module is shaded and is exposed to the irradiance of 100 to 900 w/m2. Figure 23 and Figure 24 show the simulation results of the photovoltaic string in Figure 22. The simulation results show that the maximum power is delivered at a lower voltage when the shaded module irradiance is below or equal to the critical point of 400 w/m2. The critical point obtained from the simulation results resembles the critical point determined using Equation (3). Therefore, Equation (3) derived from the experiment is validated for different sizes of photovoltaic string.
Hence, Equation (3) is applicable to photovoltaic string with a small number of photovoltaic modules (two photovoltaic modules) and photovoltaic string with a big number of photovoltaic modules (20 photovoltaic modules). It shows that the critical point of large photovoltaic string and small photovoltaic string is not different in nature as they can both be determined using the same equation (Equation (3)). Therefore, Equation (3) should be applicable to any size of photovoltaic string. It should be applicable to the existing photovoltaic plants that consist of a huge number of photovoltaic modules because a megawatts scale photovoltaic plant consists of parallel connected photovoltaic strings. Equation (3) should also be suitable to determine the critical point of every photovoltaic string in the megawatts scale photovoltaic plant.
Consider the 4 modules shaded setup in Figure 13, where the maximum power drops significantly from 2346.7 watts to 1924 watts as the shaded modules irradiance drops from 1000 to 700 w/m2. This is an 18.65% drop in the maximum power, which is an approximately 6.22% drop for every 100 w/m2 drop in the shaded module irradiance. However, the maximum power rarely drops when the shaded modules irradiance is below or equal to 700 w/m2. When the shaded modules irradiance drops from 700 to 0 w/m2, the maximum power drops from 1924 watts to 1890.4 watts, which is only a 1.7% drop in the maximum power. It is an approximately 0.24% drop for every 100 w/m2 drop in the shaded module irradiance. These results show that the maximum power is susceptible to the shading on the shaded modules when the shaded modules irradiance is above the critical point determined by Equation (3). The maximum power becomes insusceptible to the shading on the shaded modules when the shaded modules irradiance is below or equal to the critical point determined by Equation (3).
Similar situations are observed in the 8 modules shaded, 12 modules shaded, and 16 modules shaded setups. For instance, for the 16 modules shaded setup in Figure 13, the maximum power drops significantly from 2216 watts to 254.56 watts as the shaded modules irradiance drops from 1000 to 100 w/m2. This is equivalent to an approximately 11.1% drop in the maximum power for every 100 w/m2 drop in the shaded module irradiance. However, the maximum power rarely drops when the shaded modules irradiance is less or equal to 100 w/m2, which is the critical point determined by Equation (3). When the shaded modules irradiance drops from 100 to 0 w/m2, the maximum power drops from 254.56 watts to 234.97 watts, which is only a 7.7% drop in the maximum power for every 100 w/m2 drop in the shaded module irradiance. Therefore, the shading on the shaded modules does not necessarily cause a high impact to the maximum power of the photovoltaic string. It depends on the number of shaded modules as well as the shading heaviness on the shaded modules. The maximum power is very susceptible to the shading on the shaded modules when the shaded modules irradiance is above the critical point determined by Equation (3). When the shaded modules irradiance is below or equal to the critical point, the maximum power of the photovoltaic string become insusceptible to the shading on the shaded modules. These findings address the condition when the photovoltaic string is susceptible to shading.
The experimental results are incomparable to those of other researchers presented in [26,27,28,29,30,31,32,33,34,35,36,37,38,39]. This is because the photovoltaic configuration, photovoltaic string size, and partial shading conditions applied in their experiments are different from this research. A similar issue is also restricting other researchers to compare their results with different research. However, the results in this research pretty much resemble the experimental results proposed by S. Silvestre et al. [39], which suggest that the maximum power of a photovoltaic system becomes insusceptible to the shading on the shaded modules when the shaded modules irradiance reaches a certain critical point.
The critical point calculation can contribute to the dynamical photovoltaic system reconfiguration mechanism. The dynamical photovoltaic system reconfiguration mechanism is used to reconfigure the photovoltaic modules connection in the photovoltaic system on a real time basis to tackle partial shading [40,41]. If the critical point is known, some unnecessary reconfiguration work can be reduced as the photovoltaic system become insusceptible to shading heaviness when the critical point is met. Elimination of unnecessary reconfiguration could reduce the stress of the charge controller of the energy storage. The proposed critical point calculation can contribute to the development of IEEE and IEC photovoltaic system standards, therefore leading to policy implementation wherever the standards are adopted. This research also provide opportunities to achieve the clean energy sustainable development goals (SDGs). Photovoltaic system research presented in this research can contribute to the improvement of renewable energy technology which can aid achievement of the Affordable and Clean Energy and Climate Action goal of the SDGs.
5. Conclusions
Photovoltaic systems are highly susceptible to partial shading. The maximum power of a photovoltaic system can reduce drastically when partial shading takes place. The susceptibility of partial shading can vary based on the partial shading patterns, shading heaviness, and the configuration employed in connecting all the photovoltaic modules in the photovoltaic system. Under a fixed configuration and partial shading pattern, the maximum power of a partially shaded photovoltaic system is tacitly assumed to decrease at a constant rate as the shading heaviness increases. This tacit assumption is proposed based on the functionality of a photovoltaic system that relies on solar irradiance to generate electrical power. However, some researchers discovered that the maximum power under a fixed configuration and partial shading pattern can be highly insusceptible to shading heaviness when a certain critical point is met. Furthermore, the critical point can vary based on the number of shaded modules in a photovoltaic system. The novelty of this research includes the formulation of the equation to determine the critical point that is applicable to different photovoltaic system sizes and numbers of shaded modules in a photovoltaic system. Besides that, the equation has been verified with different sized photovoltaic systems as well. When 20% of photovoltaic modules in the photovoltaic system are shaded under an identical partial shading pattern, the maximum power drops by approximately 6.22% for every 100 w/m2 drop in the shaded module irradiance as the shaded modules irradiance lies between 1000 and 700 w/m2. However, when the shaded modules irradiance lies between 700 and 0 w/m2, the maximum power drops only by 0.24% for every 100 w/m2 drop in the shaded module irradiance. This means that the photovoltaic system becomes insusceptible to shading heaviness as the shaded modules irradiance reaches a critical point of 700 w/m2. Some cases applied to 40%, 60%, and 80% of photovoltaic modules are shaded. The critical points of 40%, 60%, and 80% photovoltaic modules shaded are 500, 300, and 100 w/m2, respectively. The critical point varies as the number of shaded modules changes. However, it is determinable using the equation formulated in this research. The proposed critical point calculation can contribute to the dynamical photovoltaic system reconfiguration mechanism. If the critical point is known, some unnecessary reconfiguration switching can be reduced as the photovoltaic system become insusceptible to shading heaviness when the critical point is met.
Author Contributions
Conceptualization, J.C.T.; Methodology, J.C.T.; Software, J.C.T.; Validation, J.C.T.; Formal Analysis, J.C.T. and R.H.G.T.; Investigation, J.C.T.; Resources, V.K.R. and C.K.T.; Data Curation, J.C.T.; Writing-Original Draft Preparation, J.C.T.; Writing-Review & Editing, V.H.M. and R.H.G.T.; Visualization, J.C.T.; Supervision, R.H.G.T., V.H.M., V.K.R. and C.K.T.; Project Administration, R.H.G.T. and V.H.M.; Funding Acquisition, V.K.R. and C.K.T.
Acknowledgments
This research was funded by the Ministry of Education Malaysia under Fundamental Research Grant Scheme, Project code FRGS/1/2015/TK07/UCSI/02/1. The publication fees was funded by the CERVIE department of UCSI University, Malaysia.
Conflicts of Interest
The authors declare no conflict of interest.
References
- Titri, S.; Larbes, C.; Toumi, K.Y.; Benatchba, K. A new MPPT controller based on the Ant colony optimization algorithm for Photovoltaic systems under partial shading conditions. Appl. Soft. Comput. 2017, 58, 465–479. [Google Scholar] [CrossRef]
- Pandeya, A.K.; Hossain, M.S.; Tyagi, V.V.; Rahim, N.A.; Selvaraj, J.A.; Sari, A. Novel approaches and recent developments on potential applications of phase change materials in solar energy. Renew. Sustain. Energy Rev. 2018, 82, 281–323. [Google Scholar] [CrossRef]
- Ozoegwu, C.G.; Mgbemene, C.A.; Ozor, P.A. The status of solar energy integration and policy in Nigeria. Renew. Sustain. Energy Rev. 2017, 70, 457–471. [Google Scholar] [CrossRef]
- Kabir, E.; Kumar, P.; Kumar, S.; Adelodun, A.A.; Kim, K. Solar energy: Potential and future prospects. Renew. Sustain. Energy Rev. 2018, 82, 894–900. [Google Scholar] [CrossRef]
- Kannan, N.; Vakeesan, D. Solar energy for future world: A review. Renew. Sustain. Energy Rev. 2016, 62, 1092–1105. [Google Scholar] [CrossRef]
- Bayrak, F.; Ertürk, G.; Oztop, H.F. Effects of partial shading on energy and exergy efficiencies for photovoltaic panels. J. Clean. Prod. 2017, 164, 58–69. [Google Scholar] [CrossRef]
- Cucchiella, F.; D’Adamo, I.; Gastaldi, M. Economic analysis of a photovoltaic system: A resource for residential households. Energies 2017, 10, 814. [Google Scholar] [CrossRef]
- Rosa, C.B.; Rediske, G.; Rigo, P.D.; Wendt, J.F.M.; Michels, L.; Siluk, J.C.M. Development of a computational tool for measuring organizational competitiveness in the photovoltaic power plants. Energies 2018, 11, 867. [Google Scholar] [CrossRef]
- Ingle, A.; Sangotra, D.I.; Chadge, R.B.; Thorat, P. Module configurations in photovoltaic system: A review. Mater. Today Proc. 2017, 4, 12625–12629. [Google Scholar] [CrossRef]
- Syafiq, A.; Pandey, A.K.; Adzman, N.N.; Rahim, N.A. Advances in approaches and methods for self-cleaning of solar photovoltaic panels. Sol. Energy 2018, 162, 597–619. [Google Scholar] [CrossRef]
- Teo, J.C.; Tan, R.H.G.; Mok, V.H.; Ramachandaramurthy, V.K.; Tan, C.K. Effects of bypass diode configurations to the maximum power of photovoltaic module. Int. J. Smart Grids Energy 2017, 6, 225–232. [Google Scholar] [CrossRef]
- Siecker, J.; Kusakana, K.; Numbi, B.P. A review of solar photovoltaic systems cooling technologies. Renew. Sustain. Energy Rev. 2017, 79, 192–203. [Google Scholar] [CrossRef]
- Hazarika, K.; Choudhury, P.K. Automatic monitoring of solar photovoltaic (SPV) module. Mater. Today Proc. 2017, 4, 12606–12609. [Google Scholar] [CrossRef]
- Dolara, A.; Lazaroiu, G.C.; Leva, S.; Manzolini, G. Experimental investigation of partial shading scenarios on PV (photovoltaic) modules. Energy 2013, 55, 466–475. [Google Scholar] [CrossRef]
- Maghami, M.R.; Hizam, H.; Gomes, C.; Radzi, M.A.; Rezadad, M.I.; Hajighorbani, S. Power loss due to soiling on solar panel: A review. Renew. Sustain. Energy Rev. 2016, 59, 1307–1316. [Google Scholar] [CrossRef]
- Das, S.K.; Verma, D.; Nema, S.; Nema, R.K. Shading mitigation techniques: State-of-the-art in photovoltaic applications. Renew. Sustain. Energy Rev. 2017, 78, 369–390. [Google Scholar] [CrossRef]
- Wang, Y.; Li, Y.; Ruan, X. High accuracy and fast speed MPPT methods for PV string under partially shaded conditions. IEEE. Trans. Ind. Electron. 2016, 63, 235–245. [Google Scholar] [CrossRef]
- Liu, Y.; Chen, M.; Yang, C.; Kim, K.A.; Chiu, H. High-Efficiency Isolated Photovoltaic Microinverter Using Wide-Band Gap Switches for Standalone and Grid-Tied Applications. Energies 2018, 11, 569. [Google Scholar] [CrossRef]
- Bouselhama, L.; Hajjia, M.; Hajji, B.; Boualia, H. A New MPPT-based ANN for Photovoltaic System under Partial Shading Conditions. Energy Procedia 2017, 111, 924–933. [Google Scholar] [CrossRef]
- Eldahaba, Y.E.A.; Saad, N.H.; Zekry, A. Enhancing the tracking techniques for the global maximum power point under partial shading conditions. Renew. Sustain. Energy Rev. 2017, 73, 1173–1183. [Google Scholar] [CrossRef]
- Lia, G.; Jinb, Y.; Akramb, M.W.; Chen, X.; Ji, J. Application of bio-inspired algorithms in maximum power point tracking for PV systems under partial shading conditions—A review. Renew. Sustain. Energy Rev. 2018, 81, 840–873. [Google Scholar] [CrossRef]
- Chaieb, H.; Sakly, A. A novel MPPT method for photovoltaic application under partial shaded conditions. Sol. Energy 2018, 159, 291–299. [Google Scholar] [CrossRef]
- Belhachat, F.; Larbes, C. Global maximum power point tracking based on ANFIS approach for PV array configurations under partial shading conditions. Renew. Sustain. Energy Rev. 2017, 77, 875–889. [Google Scholar] [CrossRef]
- Rezka, H.; Fathy, A.; Abdelaziz, A.Y. A comparison of different global MPPT techniques based on meta-heuristic algorithms for photovoltaic system subjected to partial shading conditions. Renew. Sustain. Energy Rev. 2017, 74, 377–386. [Google Scholar] [CrossRef]
- Mohapatra, A.; Nayak, B.; Das, P.; Mohanty, K.B. A review on MPPT techniques of PV system under partial shading condition. Renew. Sustain. Energy Rev. 2017, 80, 854–867. [Google Scholar] [CrossRef]
- Patel, H.; Agarwal, V. MATLAB-based modeling to study the effects of partial shading on PV array characteristics. IEEE. Trans. Energy Convers. 2008, 23, 302–310. [Google Scholar] [CrossRef]
- Bingöl, O.; Özkaya, B. Analysis and comparison of different PV array configurations under partial shading conditions. Sol. Energy 2018, 160, 336–343. [Google Scholar] [CrossRef]
- Bana, S.; Saini, R.P. Experimental investigation on power output of different photovoltaic array configurations under uniform and partial shading scenarios. Energy 2017, 127, 438–453. [Google Scholar] [CrossRef]
- Ahmad, R.; Murtaza, A.F.; Sher, H.A.; Shami, U.T.; Olalekan, S. An analytical approach to study partial shading effects on PV array supported by literature. Renew. Sustain. Energy Rev. 2017, 74, 721–732. [Google Scholar] [CrossRef]
- Teo, J.C.; Tan, R.H.G.; Mok, V.H. Investigation of shading characteristics of mono-crystalline and poly-crystalline photovoltaic modules connected in series. Appl. Mech. Mater. 2015, 785, 220–224. [Google Scholar] [CrossRef]
- Lua, F.; Guo, S.; Walsh, T.M.; Aberle, A.G. Improved PV module performance under partial shading conditions. Energy Procedia 2013, 33, 248–255. [Google Scholar] [CrossRef]
- Ramaprabha, R.; Mathur, B.L. A comprehensive review and analysis of solar photovoltaic array configurations under partial shaded conditions. Int. J. Photoenergy. 2012, 2012. [Google Scholar] [CrossRef]
- Tian, H.; Mancilla–David, F.; Ellis, K.; Muljadi, E.; Jenkins, P. Determination of the optimal configuration for a photovoltaic array depending on the shading condition. Sol. Energy 2013, 95, 1–12. [Google Scholar] [CrossRef]
- Reiter, R.D.; Michels, L.; Pinheiro, J.R.; Reiter, R.A.; Oliveira, S.V.G.; Péres, A. Comparative analysis of series and parallel photovoltaic arrays under partial shading conditions. In Proceedings of the 10th IEEE/IAS International Conference on Industry Applications, Fortaleza, Brazil, 5–7 November 2012. [Google Scholar]
- Elserougi, A.A.; Abdel-Khalik, A.S.; Massoud, A.M.; Ahmed, S. A grid-connected switched PV array. In Proceedings of the 41st Annual Conference of the IEEE Industrial Electronics Society, Yokohama, Japan, 9–12 November 2015. [Google Scholar]
- Khatoon, S.; Ibraheem; Jalil, M.F. Analysis of solar photovoltaic array under partial shading conditions for different array configrations. In Proceedings of the IEEE International Conference on Innovative Applications of Computational Intelligence on Power, Energy and Controls with their Impact on Humanity, Ghaziabad, India, 28–29 November 2014. [Google Scholar]
- Boukenoui, R.; Bradai, R.; Salhi, H.; Mellit, A. Modeling and simulation of photovoltaic strings under partial shading conditions using Matlab/Simscape. In Proceedings of the IEEE International Conference on Clean Electrical Power, Taormina, Italy, 16–18 June 2015. [Google Scholar]
- Abdulazeez, M.; Iskender, I. Simulation and experimental study of shading effect on series and parallel connected photovoltaic PV modules. In Proceedings of the 7th IEEE International Conference on Electrical and Electronics Engineering, Bursa, Turkey, 1–4 December 2011. [Google Scholar]
- Silvestre, S.; Boronat, A.; Chouder, A. Study of bypass diodes configuration on PV modules. Appl. Energy 2009, 86, 1632–1640. [Google Scholar] [CrossRef]
- Carotenuto, P.L.; della Cioppa, A.; Marcelli, A.; Spagnuolo, G. An evolutionary approach to the dynamical reconfiguration of photovoltaic fields. Neurocomputing 2015, 170, 393–405. [Google Scholar] [CrossRef]
- Sanseverino, E.R.; Ngoc, T.N.; Cardinale, M.; Vigni, V.L.; Musso, D.; Romano, P.; Viola, F. Dynamic programming and Munkres algorithm for optimal photovoltaic arrays reconfiguration. Sol. Energy 2015, 122, 347–358. [Google Scholar] [CrossRef]
Figure 1.
P-V characteristics of a photovoltaic module.

Figure 2.
Photovoltaic system: (a) Photovoltaic string; (b) Photovoltaic array.

Figure 3.
P-V characteristics of photovoltaic string under partial shading.

Figure 4.
Maximum power of a partially shaded photovoltaic system under a fixed partial shading pattern (a) as suggested by the experimental results in [26]; (b) as suggested by the experimental results in [39].

Figure 5.
Experiment setups: (a) Four modules shaded setup; (b) eight modules shaded setup; (c) 12 modules shaded setup; (d) 16 modules shaded setup.
Figure 5.
Experiment setups: (a) Four modules shaded setup; (b) eight modules shaded setup; (c) 12 modules shaded setup; (d) 16 modules shaded setup.

Figure 6.
Solar cell block with bypass diode.

Figure 7.
Photovoltaic string model.

Figure 8.
P-V characteristics of the 4 modules shaded setups: (a) shaded modules irradiance is between 500 and 900 w/m2; (b) shaded modules irradiance is between 0 and 400 w/m2.
Figure 8.
P-V characteristics of the 4 modules shaded setups: (a) shaded modules irradiance is between 500 and 900 w/m2; (b) shaded modules irradiance is between 0 and 400 w/m2.

Figure 9.
P-V characteristics of the 8 modules shaded setups: (a) shaded modules irradiance is between 500 and 900 w/m2; (b) shaded modules irradiance is between 0 and 400 w/m2.
Figure 9.
P-V characteristics of the 8 modules shaded setups: (a) shaded modules irradiance is between 500 and 900 w/m2; (b) shaded modules irradiance is between 0 and 400 w/m2.

Figure 10.
P-V characteristics of the 12 modules shaded setups: (a) shaded modules irradiance is between 500 and 900 w/m2; (b) shaded modules irradiance is between 0 and 400 w/m2.
Figure 10.
P-V characteristics of the 12 modules shaded setups: (a) shaded modules irradiance is between 500 and 900 w/m2; (b) shaded modules irradiance is between 0 and 400 w/m2.

Figure 11.
P-V characteristics of the 16 modules shaded setups: (a) shaded modules irradiance is between 500 and 900 w/m2; (b) shaded modules irradiance is between 0 and 400 w/m2.
Figure 11.
P-V characteristics of the 16 modules shaded setups: (a) shaded modules irradiance is between 500 and 900 w/m2; (b) shaded modules irradiance is between 0 and 400 w/m2.

Figure 12.
Maximum power versus shaded modules irradiance (4 modules shaded).

Figure 13.
Maximum power versus shaded modules irradiance (all experiment setups).

Figure 14.
Photovoltaic string consisting of four photovoltaic modules.

Figure 15.
When the load is drawing more than 3.65 A.

Figure 16.
I-V characteristics above 3.65 A—formed by unshaded modules.

Figure 17.
When the load is drawing less than 3.65 A.

Figure 18.
I-V characteristics below 3.65 A—formed by unshaded modules and shaded modules.

Figure 19.
I-V characteristics converted to P-V characteristics.

Figure 20.
Higher and lower voltage peak of the P-V characteristics.

Figure 21.
Delivery voltages for maximum power (4 modules shaded setup).

Figure 22.
Photovoltaic string consisting of two photovoltaic modules.

Figure 23.
Simulated P-V characteristics of photovoltaic string in Figure 22—shaded module irradiance is between 500 and 900 w/m2.
Figure 23.
Simulated P-V characteristics of photovoltaic string in Figure 22—shaded module irradiance is between 500 and 900 w/m2.

Figure 24.
Simulated P-V characteristics of photovoltaic string in Figure 22—shaded module irradiance is between 0 and 400 w/m2.
Figure 24.
Simulated P-V characteristics of photovoltaic string in Figure 22—shaded module irradiance is between 0 and 400 w/m2.


Table 1.
Conditions applied to the experimental setups.
| Conditions | Unshaded Modules Irradiance (w/m2) | Shaded Modules Irradiance (w/m2) |
|---|---|---|
| Condition 1 | 1000 | 900 |
| Condition 2 | 1000 | 800 |
| Condition 3 | 1000 | 700 |
| Condition 4 | 1000 | 600 |
| Condition 5 | 1000 | 500 |
| Condition 6 | 1000 | 400 |
| Condition 7 | 1000 | 300 |
| Condition 8 | 1000 | 200 |
| Condition 9 | 1000 | 100 |
| Condition 10 | 1000 | 0 |
Table 2.
Parameters set in the model shown in Figure 7 to conduct the experiment for the 4 modules shaded setup.
Table 2.
Parameters set in the model shown in Figure 7 to conduct the experiment for the 4 modules shaded setup.
| Condition Applied to the Experiment Setup | Parameter Set in Shade Module Block | Parameter Set in Unshade Irr Block | Parameter Set in Shade Irr Block |
|---|---|---|---|
| Condition 1 | 4 | 1000 | 900 |
| Condition 2 | 4 | 1000 | 800 |
| Condition 3 | 4 | 1000 | 700 |
| Condition 4 | 4 | 1000 | 600 |
| Condition 5 | 4 | 1000 | 500 |
| Condition 6 | 4 | 1000 | 400 |
| Condition 7 | 4 | 1000 | 300 |
| Condition 8 | 4 | 1000 | 200 |
| Condition 9 | 4 | 1000 | 100 |
| Condition 10 | 4 | 1000 | 0 |
Table 3.
Parameters set in the model shown in Figure 7 to conduct the experiment for the 8 modules shaded setup.
Table 3.
Parameters set in the model shown in Figure 7 to conduct the experiment for the 8 modules shaded setup.
| Condition Applied to the Experiment Setup | Parameter Set in Shade Module Block | Parameter Set in Unshade Irr Block | Parameter Set in Shade Irr Block |
|---|---|---|---|
| Condition 1 | 8 | 1000 | 900 |
| Condition 2 | 8 | 1000 | 800 |
| Condition 3 | 8 | 1000 | 700 |
| Condition 4 | 8 | 1000 | 600 |
| Condition 5 | 8 | 1000 | 500 |
| Condition 6 | 8 | 1000 | 400 |
| Condition 7 | 8 | 1000 | 300 |
| Condition 8 | 8 | 1000 | 200 |
| Condition 9 | 8 | 1000 | 100 |
| Condition 10 | 8 | 1000 | 0 |
Table 4.
Parameters set in the model shown in Figure 7 to conduct the experiment for the 12 modules shaded setup.
Table 4.
Parameters set in the model shown in Figure 7 to conduct the experiment for the 12 modules shaded setup.
| Condition Applied to the Experiment Setup | Parameter Set in Shade Module Block | Parameter Set In Unshade Irr Block | Parameter Set in Shade Irr Block |
|---|---|---|---|
| Condition 1 | 12 | 1000 | 900 |
| Condition 2 | 12 | 1000 | 800 |
| Condition 3 | 12 | 1000 | 700 |
| Condition 4 | 12 | 1000 | 600 |
| Condition 5 | 12 | 1000 | 500 |
| Condition 6 | 12 | 1000 | 400 |
| Condition 7 | 12 | 1000 | 300 |
| Condition 8 | 12 | 1000 | 200 |
| Condition 9 | 12 | 1000 | 100 |
| Condition 10 | 12 | 1000 | 0 |
Table 5.
Parameters set in the model shown in Figure 7 to conduct the experiment for the 16 modules shaded setup.
Table 5.
Parameters set in the model shown in Figure 7 to conduct the experiment for the 16 modules shaded setup.
| Condition Applied to the Experiment Setup | Parameter Set in Shade Module Block | Parameter Set in Unshade Irr Block | Parameter Set in Shade Irr Block |
|---|---|---|---|
| Condition 1 | 16 | 1000 | 900 |
| Condition 2 | 16 | 1000 | 800 |
| Condition 3 | 16 | 1000 | 700 |
| Condition 4 | 16 | 1000 | 600 |
| Condition 5 | 16 | 1000 | 500 |
| Condition 6 | 16 | 1000 | 400 |
| Condition 7 | 16 | 1000 | 300 |
| Condition 8 | 16 | 1000 | 200 |
| Condition 9 | 16 | 1000 | 100 |
| Condition 10 | 16 | 1000 | 0 |
Table 6.
Maximum powers of the 4 modules shaded setup.
| Unshaded Modules Irradiance (w/m2) | Shaded Modules Irradiance (w/m2) | Maximum Power (W) | Maximum Power Delivery Voltage (V) |
|---|---|---|---|
| 1000 | 900 | 2346.7 | 364.39 |
| 1000 | 800 | 2158.3 | 374.70 |
| 1000 | 700 | 1924 | 283.3 |
| 1000 | 600 | 1920.4 | 282.82 |
| 1000 | 500 | 1914.4 | 281.94 |
| 1000 | 400 | 1908.4 | 281.47 |
| 1000 | 300 | 1902.4 | 280.59 |
| 1000 | 200 | 1896.4 | 279.29 |
| 1000 | 100 | 1890.4 | 278.41 |
| 1000 | 0 | 1884.5 | 277.94 |
Table 7.
Maximum powers of the 8 modules shaded setup.
| Unshaded Modules Irradiance (w/m2) | Shaded Modules Irradiance (w/m2) | Maximum Power (W) | Maximum Power Delivery Voltage (V) |
|---|---|---|---|
| 1000 | 900 | 2295.1 | 362.57 |
| 1000 | 800 | 2083.6 | 367.48 |
| 1000 | 700 | 1845.2 | 370.51 |
| 1000 | 600 | 1593 | 373.07 |
| 1000 | 500 | 1384 | 204.73 |
| 1000 | 400 | 1372.1 | 203.58 |
| 1000 | 300 | 1360.3 | 201.82 |
| 1000 | 200 | 1348.4 | 200.06 |
| 1000 | 100 | 1336.5 | 198.59 |
| 1000 | 0 | 1324.7 | 197.13 |
Table 8.
Maximum powers of the 12 modules shaded setup.
| Unshaded Modules Irradiance (w/m2) | Shaded Modules Irradiance (w/m2) | Maximum Power (W) | Maximum Power Delivery Voltage (V) |
|---|---|---|---|
| 1000 | 900 | 2252.8 | 359.87 |
| 1000 | 800 | 2022.6 | 361.83 |
| 1000 | 700 | 1777.2 | 362.69 |
| 1000 | 600 | 1524.3 | 362.06 |
| 1000 | 500 | 1267.4 | 361.09 |
| 1000 | 400 | 1008.8 | 360.27 |
| 1000 | 300 | 820.40 | 124.11 |
| 1000 | 200 | 802.96 | 121.84 |
| 1000 | 100 | 785.56 | 119.39 |
| 1000 | 0 | 768.20 | 117.10 |
Table 9.
Maximum powers of the 16 modules shaded setup.
| Unshaded Modules Irradiance (w/m2) | Shaded Modules Irradiance (w/m2) | Maximum Power (W) | Maximum Power Delivery Voltage (V) |
|---|---|---|---|
| 1000 | 900 | 2216 | 358 |
| 1000 | 800 | 1969.8 | 357.49 |
| 1000 | 700 | 1717.8 | 355.66 |
| 1000 | 600 | 1463.8 | 353.58 |
| 1000 | 500 | 1209.6 | 350.62 |
| 1000 | 400 | 956.54 | 346.57 |
| 1000 | 300 | 705.80 | 340.97 |
| 1000 | 200 | 459.07 | 332.66 |
| 1000 | 100 | 254.56 | 45.21 |
| 1000 | 0 | 234.97 | 42.80 |
Table 10.
Critical points for the maximum power to deliver at a lower voltage.
| Experiment Setup | Shaded Modules Irradiance (w/m2) |
|---|---|
| 4 Modules Shaded | Less or equal to 700 |
| 8 Modules Shaded | Less or equal to 500 |
| 12 Modules Shaded | Less or equal to 300 |
| 16 Modules Shaded | Less or equal to 100 |
© 2018 by the authors. Licensee MDPI, Basel, Switzerland. This article is an open access article distributed under the terms and conditions of the Creative Commons Attribution (CC BY) license (http://creativecommons.org/licenses/by/4.0/).
Share and Cite
MDPI and ACS Style
Teo, J.C.; Tan, R.H.G.; Mok, V.H.; Ramachandaramurthy, V.K.; Tan, C. Impact of Partial Shading on the P-V Characteristics and the Maximum Power of a Photovoltaic String. Energies 2018, 11, 1860. https://doi.org/10.3390/en11071860
AMA Style
Teo JC, Tan RHG, Mok VH, Ramachandaramurthy VK, Tan C. Impact of Partial Shading on the P-V Characteristics and the Maximum Power of a Photovoltaic String. Energies. 2018; 11(7):1860. https://doi.org/10.3390/en11071860
Chicago/Turabian StyleTeo, J. C., Rodney H. G. Tan, V. H. Mok, Vigna K. Ramachandaramurthy, and ChiaKwang Tan. 2018. "Impact of Partial Shading on the P-V Characteristics and the Maximum Power of a Photovoltaic String" Energies 11, no. 7: 1860. https://doi.org/10.3390/en11071860
Note that from the first issue of 2016, this journal uses article numbers instead of page numbers. See further details here.