Unit Commitment of a Power System Including Battery Swap Stations Under a Low-Carbon Economy


State Key Laboratory of Advanced Electromagnetic Engineering and Technology, Huazhong University of Science and Technology, No. 1037, Luoyu Road, Wuhan 430074, China
*
Author to whom correspondence should be addressed.
Energies 2018, 11(7), 1898; https://doi.org/10.3390/en11071898
Submission received: 5 June 2018
/
Revised: 15 July 2018
/
Accepted: 16 July 2018
/
Published: 20 July 2018
Abstract
:Battery swap stations (BSSs) are of great importance as an energy supplement for electric vehicles (EVs). The batteries in these stations not only charge instantaneous energy from the grid (G2B) but also discharge stored energy to the grid (B2G). This bidirectional energy consuming scheme provides more flexibility to the grid operation options, and henceforth, may bring in new challenges to the systems as well. In the meanwhile, the carbon trading mechanisms for the low-carbon economy can also have impacts on the generation scheduling of the power system. Therefore, a unit commitment (UC) model of the power system with BSSs in the low-carbon economic background is proposed to coordinate the G2B/B2G process of BSSs. Our model weighted the carbon dioxide emission in the cost function and tightened the constraint set with BSSs limits and the carbon trading mechanism. Case studies on a 10-unit test system demonstrate the effectiveness of the proposed model.
1. Introduction
Nowadays, reducing carbon dioxide (CO2) emissions has become a worldwide consensus that is accepted by many countries as an important strategy of sustainable development [1,2]. As one of the two major sources of CO2 emissions, the electricity generation sector has the obligation to implement low-carbon technologies to reduce their emissions [3]. Hence, more and more renewable energy sources, such as wind and solar, are introduced into the power system as clean substitutions for fossil fuels [4]. Besides the renewable energy, the carbon trading mechanisms, in which the CO2 emission allowance is regarded as a kind of commodity that can be traded in the carbon trading market, are required for the grid to restrict CO2 emissions [5]. On the other hand, another major emission source is the traditional gasoline combustion vehicles, which is gradually being replaced by electric vehicles (EVs) with zero CO2 emissions [6]. However, the adoption of a carbon trading mechanism and the arising of EVs industries bring in new challenges to the power system operation.
The low-carbon economy policies restrict the CO2 emissions tightly such that whoever exceeds the regulation needs to buy the additional emission allowance or to pay the penalty. Thus, not only the generation and start-up costs but also the relevant cost arising from emission transactions or penalties should be considered in the unit commitment (UC) problem. In such a case, many studies have investigated how the power system should operate with policies of a low carbon economy. In Reference [7], the impact of carbon emission policies on generation scheduling is analyzed and an economic dispatch model is established based on the cap-and-trade mechanism, and the case studies show how the carbon emission prices and allowances influence generation scheduling results. Renewable energy generation is regarded as a low-carbon solution in Reference [8], and a low-carbon economic dispatch model with wind power accommodation is built by considering carbon trading costs. In addition to renewable energy, the electrification of the transportation industry is able to reduce the overall primary energy consumption and CO2 emissions due to the electricity and transportation sector [9]. Therefore, the EV is regarded as a low-carbon solution, and a coordination operation model of EVs and the power system is developed on the basis of a low-carbon economy [10].
For a successful rollout of EVs, it is required that an adequate charging infrastructure be established to cope with the limited EV range and long charging times. An efficient solution to these problems involves the deployment of battery swapping stations (BSS) because BSSs offer a fast and reliable alternative to charging batteries, namely swapping the discharged battery with a charged one. Meanwhile, BSSs charge batteries in Grid-to-Battery mode (G2B), and operate in Battery-to-Grid mode (B2G) by discharging batteries to the grid, rendering the two-way flow of electricity between the power system and BSSs. The main operational features of BSS are depicted and an optimization model of BSS is proposed in Reference [11]. In References [12,13], an optimal operation and services scheduling model for an electric vehicle battery swapping station in an electricity market is established based on the evaluation of the electricity price and battery demand. However, these models only studied the operation of BBS and did not consider the interaction between the BSSs and generators, which neglects the coordinated optimal operation of the power system and BSSs, which makes it difficult to fully exploit BBS’s potential of carbon emission reduction. Therefore, this paper attempts to address these drawbacks, proposing a coherent optimization framework to incorporate BBS in the power system under a low-carbon economy. The major contributions of this paper are summarized as follow.
- Considering the flexible interaction between the BSSs and the grid based on the G2B and B2G modes, this paper builds an operation model of an electric vehicle battery swap station.
- The carbon emission costs due to generation dispatch are evaluated base on the Clean Development Mechanism (CDM) and are incorporated with the generation costs and battery wear cost of BSSs whilst considering the B2G mode.
- Then, the unit commitment model of the power system with BSSs considered under low-carbon economy is established in this paper.
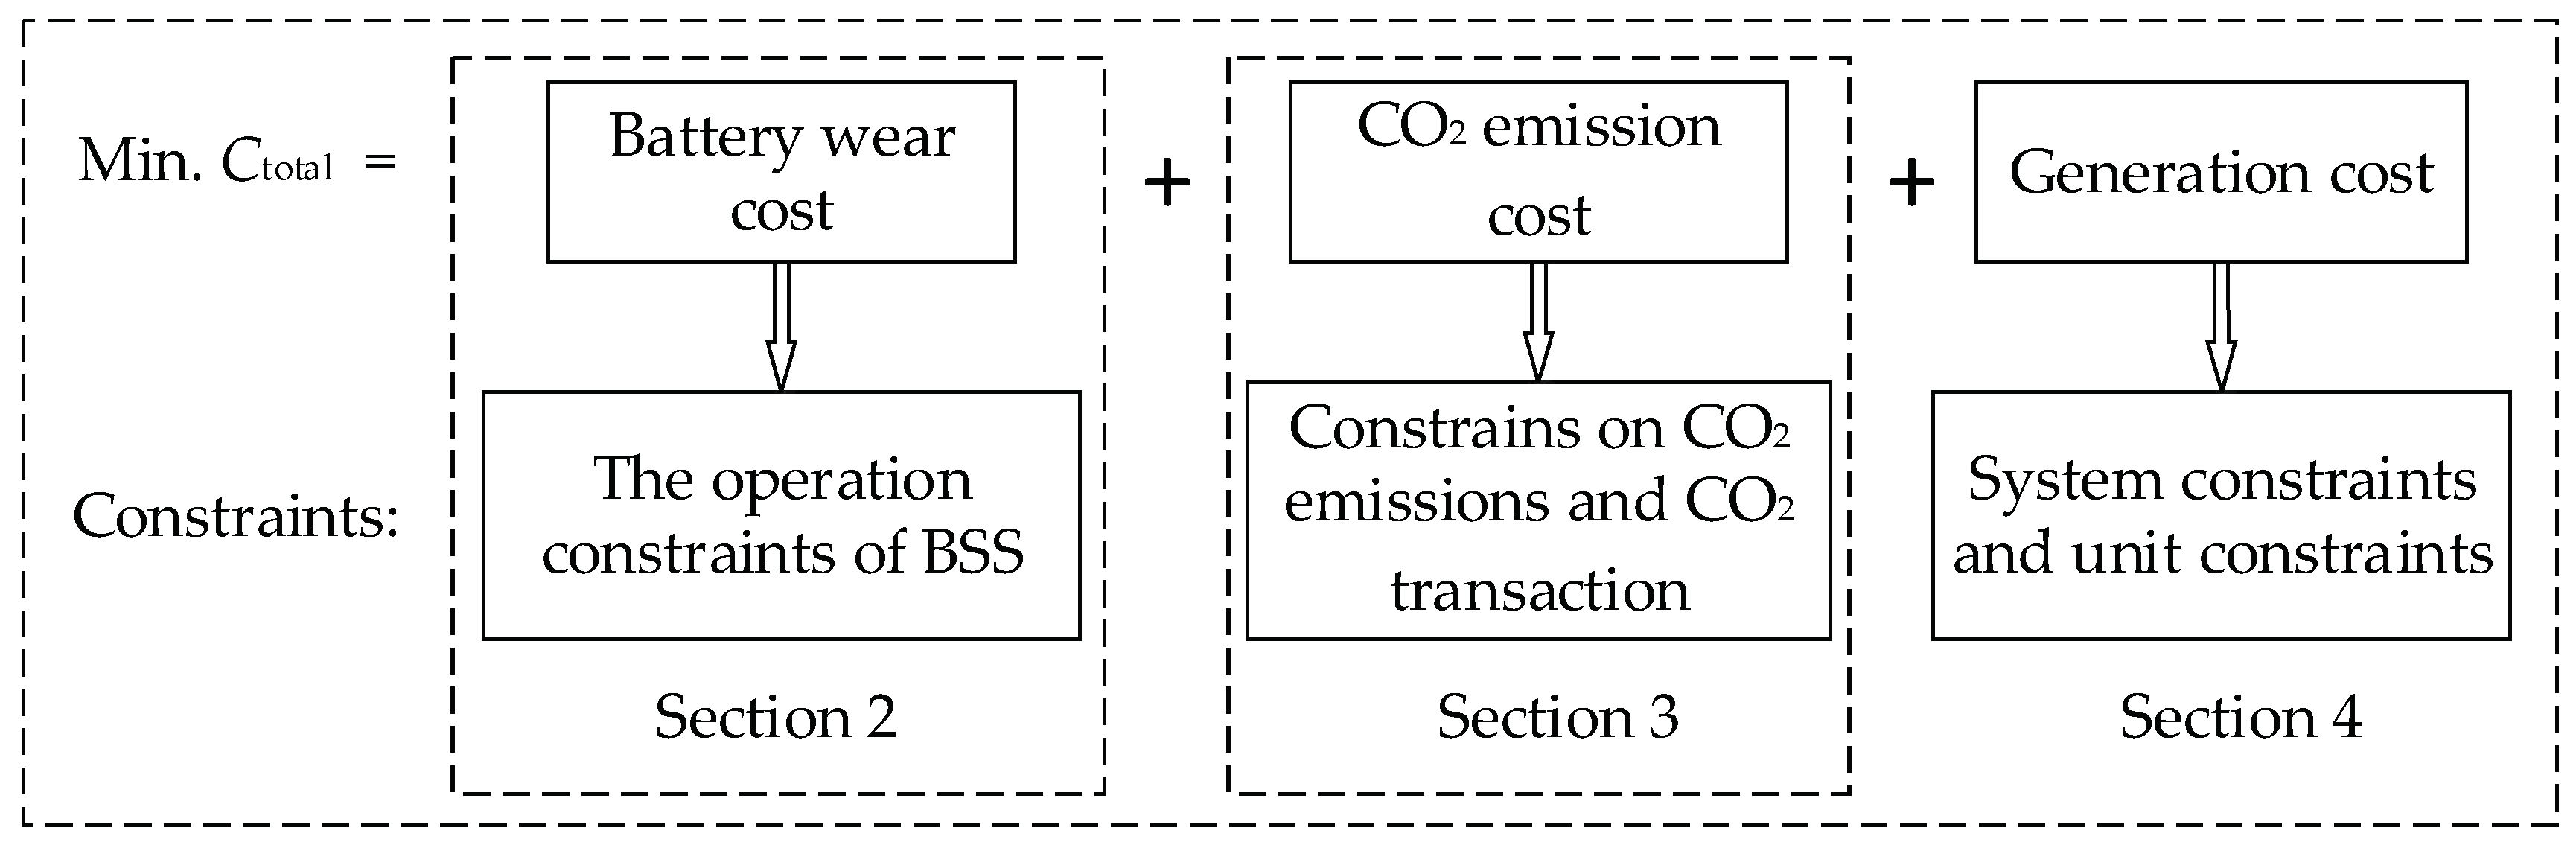
The framework of the unit commitment model of the power system with BSSs considered under a low-carbon economy is illustrated in Figure 1. The remainder of this paper is organized as follows. The model of BSS participating in the power system operation is established in Section 2. The CO2 emission cost and relevant constraints arising from the low-carbon economy are discussed in Section 3. Based on Section 2 and Section 3, the whole unit commitment model under a low-carbon economy with BSSs being considered is established in Section 4. Case studies based on a 10-unit test system are analyzed in Section 5, and some relevant conclusions are drawn in Section 6.
2. Operation Model of Electric Vehicle Battery Swap Station
2.1. Energy Flow Model of a Battery Swap Station
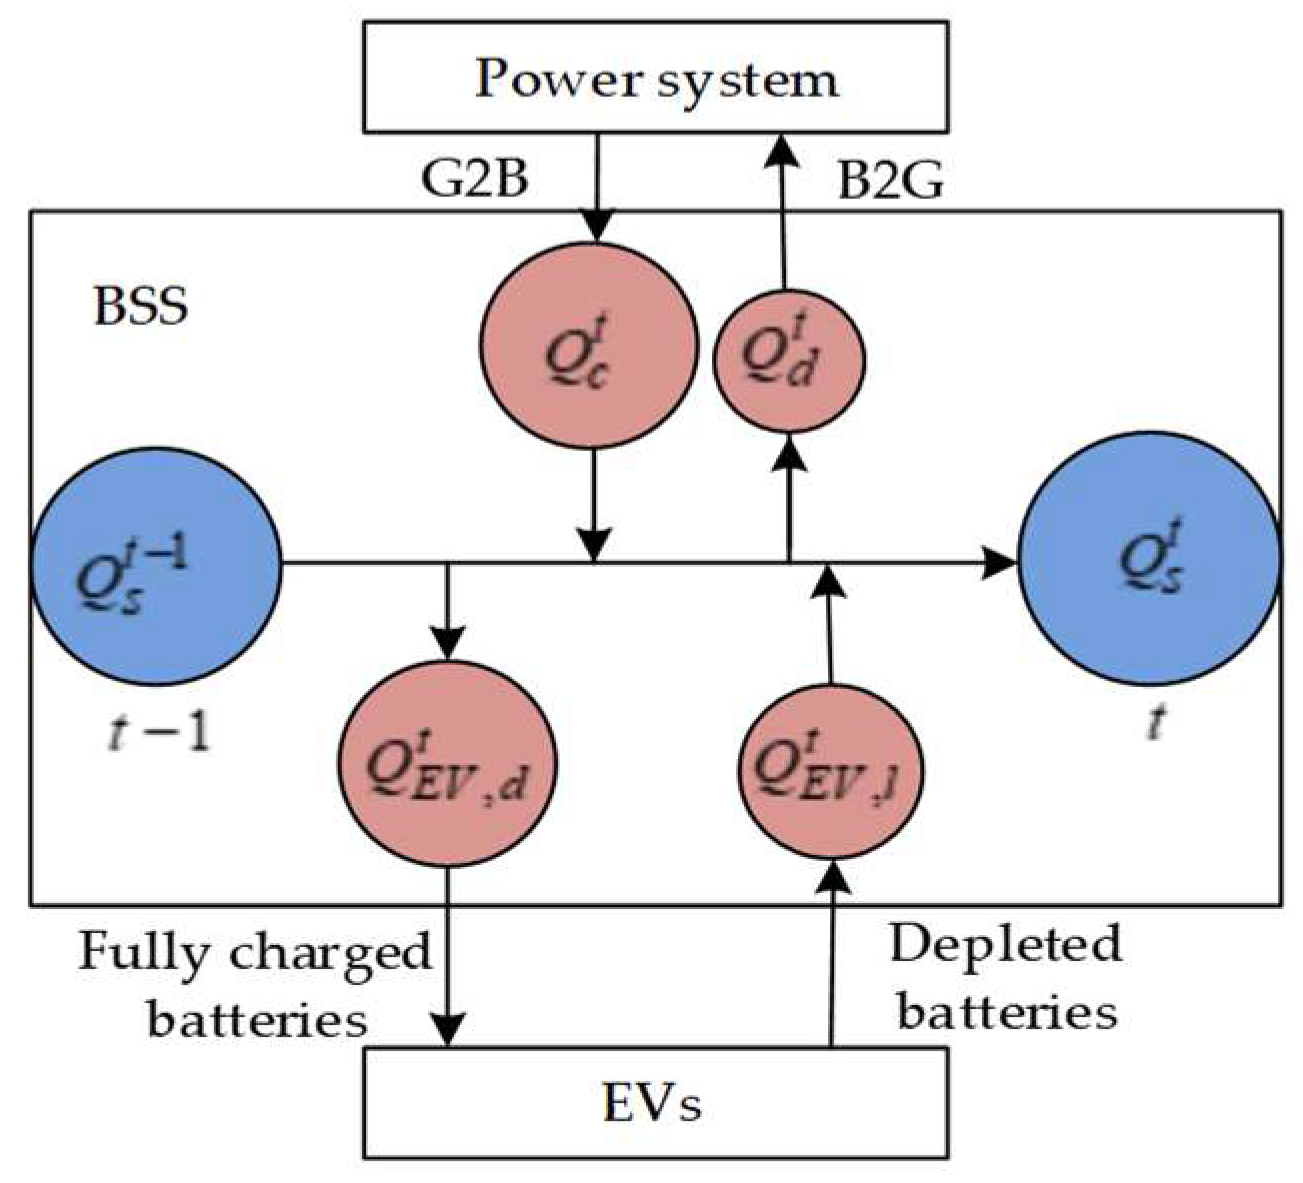
A battery swap station is an important energy supply place for EVs, where depleted batteries can be replaced with fully-charged ones quickly. Usually, a BSS contains a power supply system, charging system, battery swapping system, battery testing and maintenance system, etc. [14]. The main operation characteristics of the BSS are illustrated in Figure 2.
It shows that the BSS can communicate bi-directionally with the power system and EVs. The BSS can draw energy from the grid to charge batteries (G2B), discharge energy from batteries to the grid (B2G), or replace depleted batteries with full ones for EVs. These flexible operation mechanisms will give the BSS an advantage when participating in the generation scheduling of the power system. At times when the power load increases, the batteries of the BSS will be scheduled to discharge to keep a load balance, instead of increasing the output of units. At times when power load decreases, the extra power can be used to charge batteries to satisfy the energy needed by the BSS. Hence, the BSS can be considered as a flexible load or generator to coordinate with the output of units, so as to obtain the best comprehensive benefit in both economic and environmental terms.
As shown in Figure 2, the procedure of G2B/B2G via chargers, as well as battery swapping demand of EVs, influences the total energy in the BSS. At the end of each period t, the energy flow model of a BSS can be given as
where is the overall stored energy of the BSS at time t, and is the time interval. During period t (from time t − 1 to time t), is the charging energy from the grid to the BSS, is the discharging energy from the BSS grid to the grid, is the overall energy of batteries unloaded from EVs, and is the total energy of batteries used for swapping. and are the charging and discharging efficiency of each charger, respectively. is the rated charging/discharging power of each charger, is the number of chargers used for charging from the grid in period t, and is the number of chargers used for discharging to the grid in period t. is the number of batteries for EVs that need battery swapping during period t. is the battery capacity of each EV. is the average state of charge of battery for EVs when arriving at the BSS.
2.2. Operation Model of Battery Swap Station
The cost of a BSS participating in the power system operation is computed from battery wear cost due to discharging batteries to the grid in B2G mode. Considering the large-scale EVs access to the grid, there are enough batteries to discharge to the gird. Therefore, it is reasonable to assume that the discharging batteries are substituted with the others in every period to maintain a shallow depth-of-discharge (DoD) and then extend the battery lifetime. In this case, the battery wear cost is described as the product of the number of discharging batteries, i.e., the number of chargers used for discharging to the grid, and the wear cost in one discharging process is [15]:
where is the battery wear cost due to discharging batteries to the grid in period t, is battery capital cost, and is battery lifetime in cycles determined by the DoD.
The operation constraints of BSS include the constraint on the number of chargers, constraints on the maximum and minimum energy stored in the BSS, and the energy balance constraint of the BSS. During each period t, the batteries used for swapping are not available to participate in the G2B/B2G process. Thus, the number of chargers used for charging from the grid and discharging to the grid are limited by the total number of batteries that can be used. Also, the sum of them should not be more than the total number of chargers in the BSS. Therefore, the following constraint must be satisfied:
where is the total number of chargers in the BSS, and is the total number of batteries in the BSS.
The batteries unloaded at period t need to be recharged in the latter periods. If depleted batteries are arranged to be charged as soon as possible, the energy of the BSS is maximal. Contrarily, the energy stored in the BSS is minimum if the BSS only has enough fully charged batteries to meet the swapping demand for the next period, while the other batteries are in the minimum state of charge. The constraints on the maximum and minimum energy stored in the BSS can be expressed as Equation (8):
where is the periods required to finish the charging of unloaded batteries from EVs, is the ceiling function of the argument, and is the minimum state of charge of batteries in the BSS.
In order to ensure continuous operation of the BSS, it should obtain enough energy from the grid to fully charge all the unloaded batteries during the dispatch cycle. Then, the following energy balance constraint of the BSS ought to be enforced:
where T is the set of time periods in the dispatch cycle.
3. Evaluation of the CO2 Emission Cost Based on a Carbon Emission Trading Mechanism
3.1. Carbon Emission Trading Mechanism
For the purpose of achieving a CO2 emission reduction effectively, three forms of carbon emission trading mechanisms have been proposed in the Kyoto Protocol, namely the clear development mechanism (CDM), joint implementation (JT), and emissions trading (ET), respectively [16]. Recently, China is mainly engaging in CDM transactions. The CDM allows industrialized countries that have accepted emissions reduction targets to develop or finance projects that reduce greenhouse gas (GHG) emissions in non-Annex 1 countries, which are large GHG emitters such as China, India, Brazil, and Mexico, in exchange for emission reduction credits. This contributes to the sustainable development of the non-Annex 1 countries.
When introducing the CDM transactions into the electric power sector, a limit or cap on the amount of CO2 that is allowed to be emitted (i.e., a carbon emission allowance) is allocated to each generation company. The generation company has to keep the actual CO2 emissions less than the allocated allowances. Otherwise, it may need to purchase additional allowances from the other companies through CDM transactions or pay a penalty for the exceeding emissions. In such a case, however, the operation of the power system would minimize not only the generation costs but also the carbon emission costs arising from the CDM transactions or penalty paid for exceeding emissions. It is imperative to study how a carbon trading mechanism will influence the generation dispatch of the power system.
3.2. Evaluation of the CO2 Emission Cost under CDM Transactions
The carbon emission allowance is allocated to each generation company through various methods, such as grandfathering, benchmarking, and auction [17]. According to the development of the carbon trading market in China, the benchmarking method in which the emission allowances are granted on the basis of a proportion of historical production is used to allocate the initial emission allowances for the generation company [18]. During each period t, the carbon emission allowances of one grid can be expressed as:
where is the power demand of the traditional load during period t, and is the benchmarking emission factor of the thermal power system; it is decided by the operation margin (OM) and build margin (BM).
In each period t, the overall CO2 emissions of each unit can be estimated as a quadratic function of the power output. Thus, the total CO2 emissions of all units in the grid is as follows:
where, , , and are all the corresponding CO2 emission coefficients of unit i, I is the index set of units in the grid, and is the power output of unit i in period t.
On the basis of the CDM transactions, the CO2 emission cost can be evaluated by comparing the CO2 emission allowances and actual emissions, which is written by
where, in each period t, , , and represent the purchased emission allowances through CDM transactions, the emission allowances obtained by paying penalty, and the sold emission allowances through CDM transactions, respectively. is the price of purchased and sold emission allowances through CDM transactions, is the penalty paid for excessive CO2 emission, and is the upper limit of purchased and sold emission allowances through CDM transactions.
The two cases of are as follows. When , i.e., the amount of carbon emissions being more than the allocated emission allowances, the system has to purchase emission allowances via CDM transactions or pay a penalty for the exceeding emissions. In this case, it would increase the overall cost of the power system. Whereas when , the system could sell the surplus allowances to make a profit. In such case, it would decrease the total cost of the power system accordingly.
Considering the allocated emission allowances and the development scale of the carbon trading market, constraints of the maximum CO2 emissions and limit of CO2 trading allowances by CDM transactions should be enforced
4. Unit Commitment Model of the Power System Including BSSs under a Low-Carbon Economy
4.1. Objective Function
As described in Section 2, BSSs can exchange power bi-directionally with the grid as load or generator depending on the Grid-to-Battery mode (G2B) and Battery-to-Grid mode (B2G), which makes the operation of the power system more flexible and a lower carbon emitter, but also more complicated. To solve this problem, a unit commitment model under a low-carbon economy with BSSs considered is proposed to coordinate the charging/discharging profile of BSSs with the production of generators. The objective of this model is to minimize the overall cost, which includes fuel costs and the start-up cost of generators, the CO2 emission cost arising from a low-carbon economy, and battery wear cost due to discharging batteries to the grid. Therefore, the objective function is described as
where, is the fuel cost in period t, is the start-up cost in period t, , , and are the fuel cost coefficients of unit , is the start cost of unit , and and are the hot-start and cold-start cost of unit , respectively. represents the duration that unit is continuously off. and are the minimum down-time and the cold-start time of unit , respectively. N is the index set of BSSs in the grid, and is the number of chargers used for discharging in period t of BSS n.
4.2. Constraints
- Electric power balance constraint of the whole system in each period t.where is the power demand of the traditional load during period t. is the number of chargers used for charging in period t of BSS n.
- Minimum and maximum output constraints of generation units.where is the maximum generation output of unit i, is the minimum generation output of unit i, and is the on/off status of unit i during period t.
- Minimum on and off time constraints of generation units.where is the minimum on time intervals of unit i, and is the minimum off time intervals of unit i.
- Up- and down-ramping rate constraints of generation units.where is the ramp-up limit of unit i, and is the ramp-down limit of unit i.
- Spinning reserve constraintswhere is the up-spinning reserve requirement in period t, and is the down-spinning reserve requirement in period t.
- Operation constraints of the BSS, i.e., Equations (7)–(11), should be satisfied.
- Constraints of the maximum CO2 emissions and limit of CO2 trading allowances by CDM transactions, i.e., Equations (18)–(20), should be satisfied.
5. Case Study
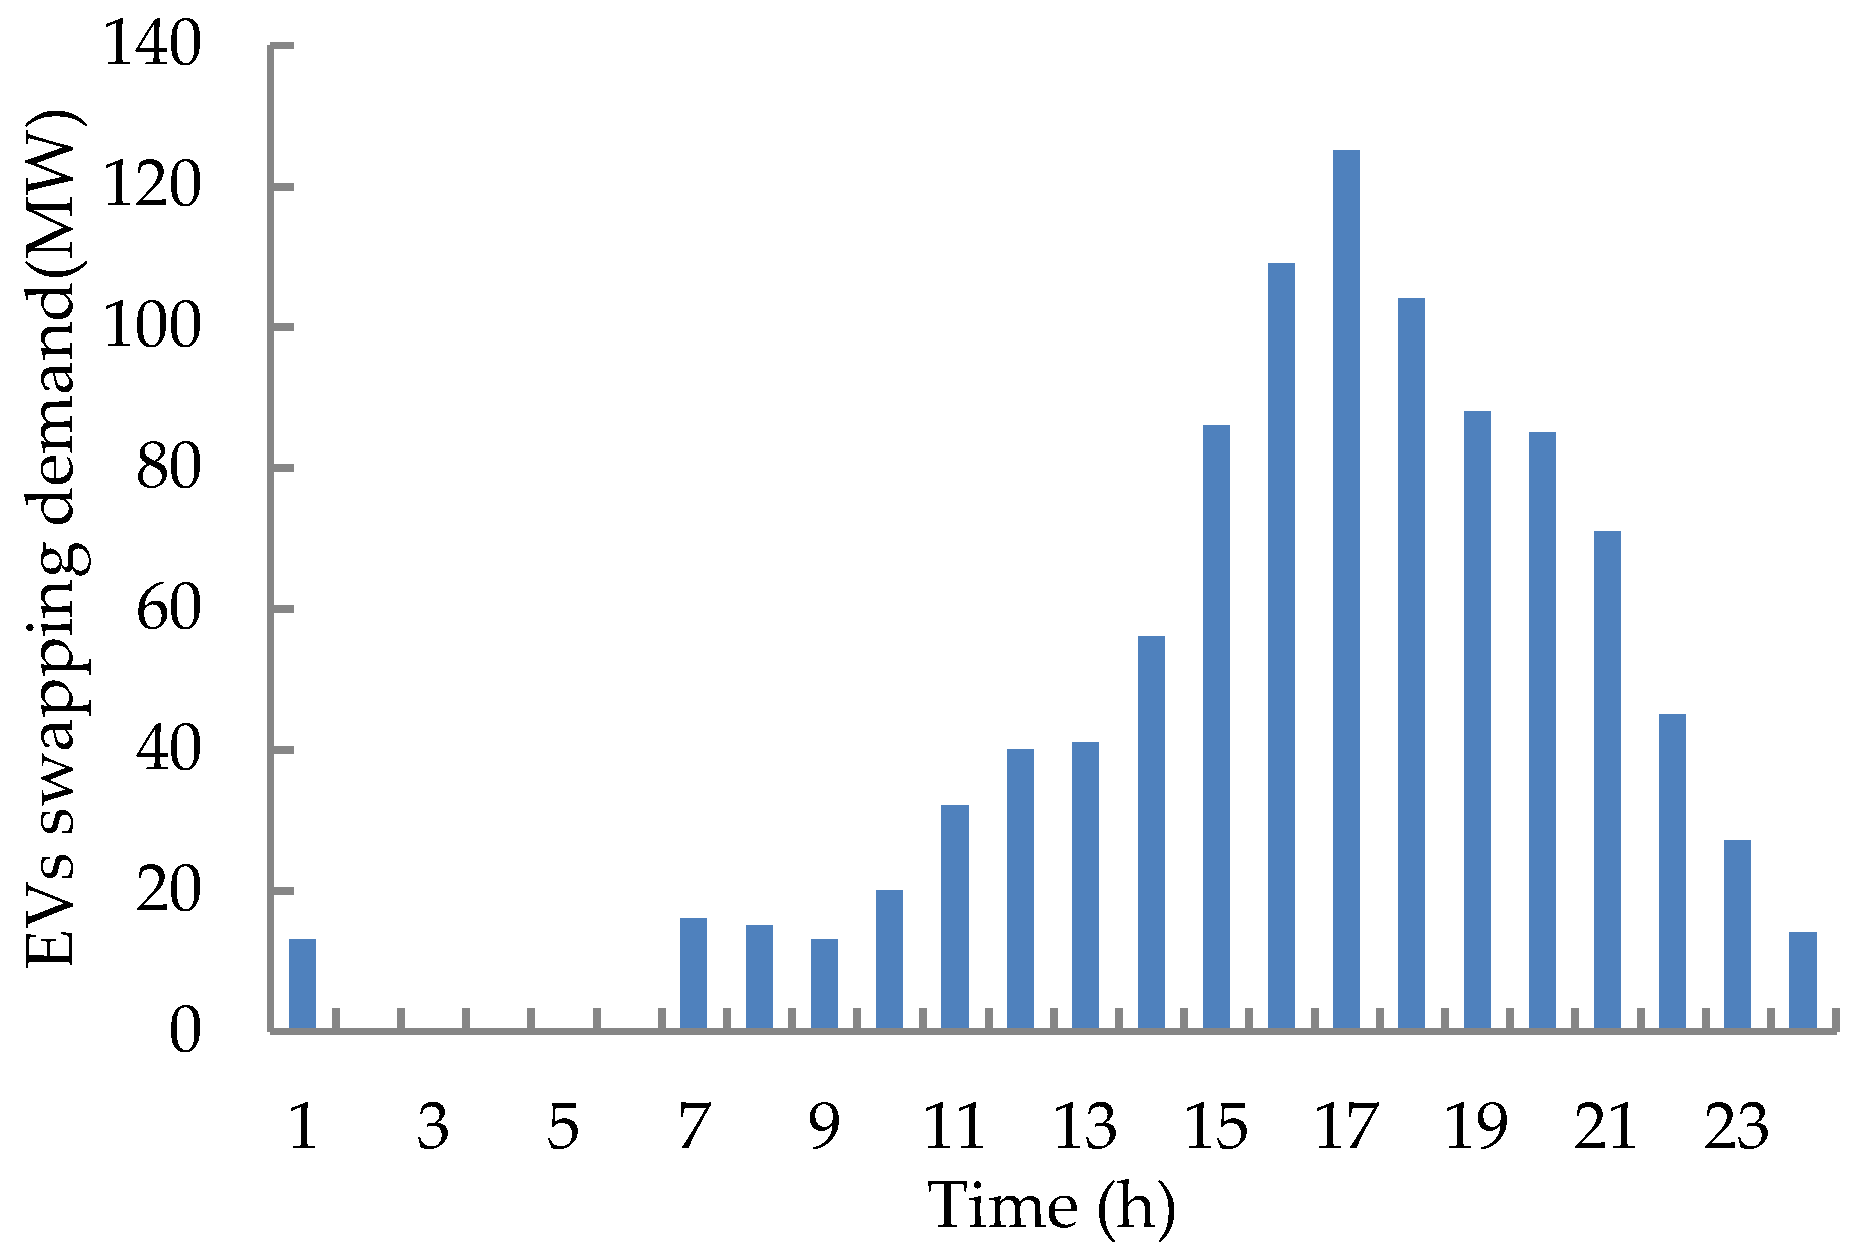
A simulation study of an independent system consisting of ten units with 1662 MW total installed capacity was carried out. The generation data of the ten units and the traditional load profile were obtained from Reference [19]. The estimated emission coefficients of the ten units were collected from Reference [20], and the unit parameters can be found in Table 1. Both up- and down-spinning reserve requirements were set to 10% of peak demand. It was assumed that there were 50 BSSs connected to the system and each of them provided a swapping service for 1000 EVs. Some important parameters of BSSs and EVs are shown in Table 2 [21,22]. Assuming that EVs would go to the BSS to complement energy when they finish their last trips, the statistical data of the end time of the last trip from Reference [23] was used to generate the EVs battery swapping demand of each BSS, as shown in Figure 3.
In this case study, the CO2 emissions were assumed to be measured simply through the CDM transactions. The price of the purchased or sold emission allowances under the CDM was set to be $20/tCO2. The benchmarking emission factor of the grid was 0.55 tCO2/MWh. The optimization period was one day from 6:00 to the next day 6:00 in order to ensure all batteries fully charged at the last time interval. The time interval used for all the simulations was 1h. The proposed model was a Mixed Integer Quadratic Programming (MIQP) problem, which was solved by using CPLEX solver under MATLAB.
5.1. Results Analysis
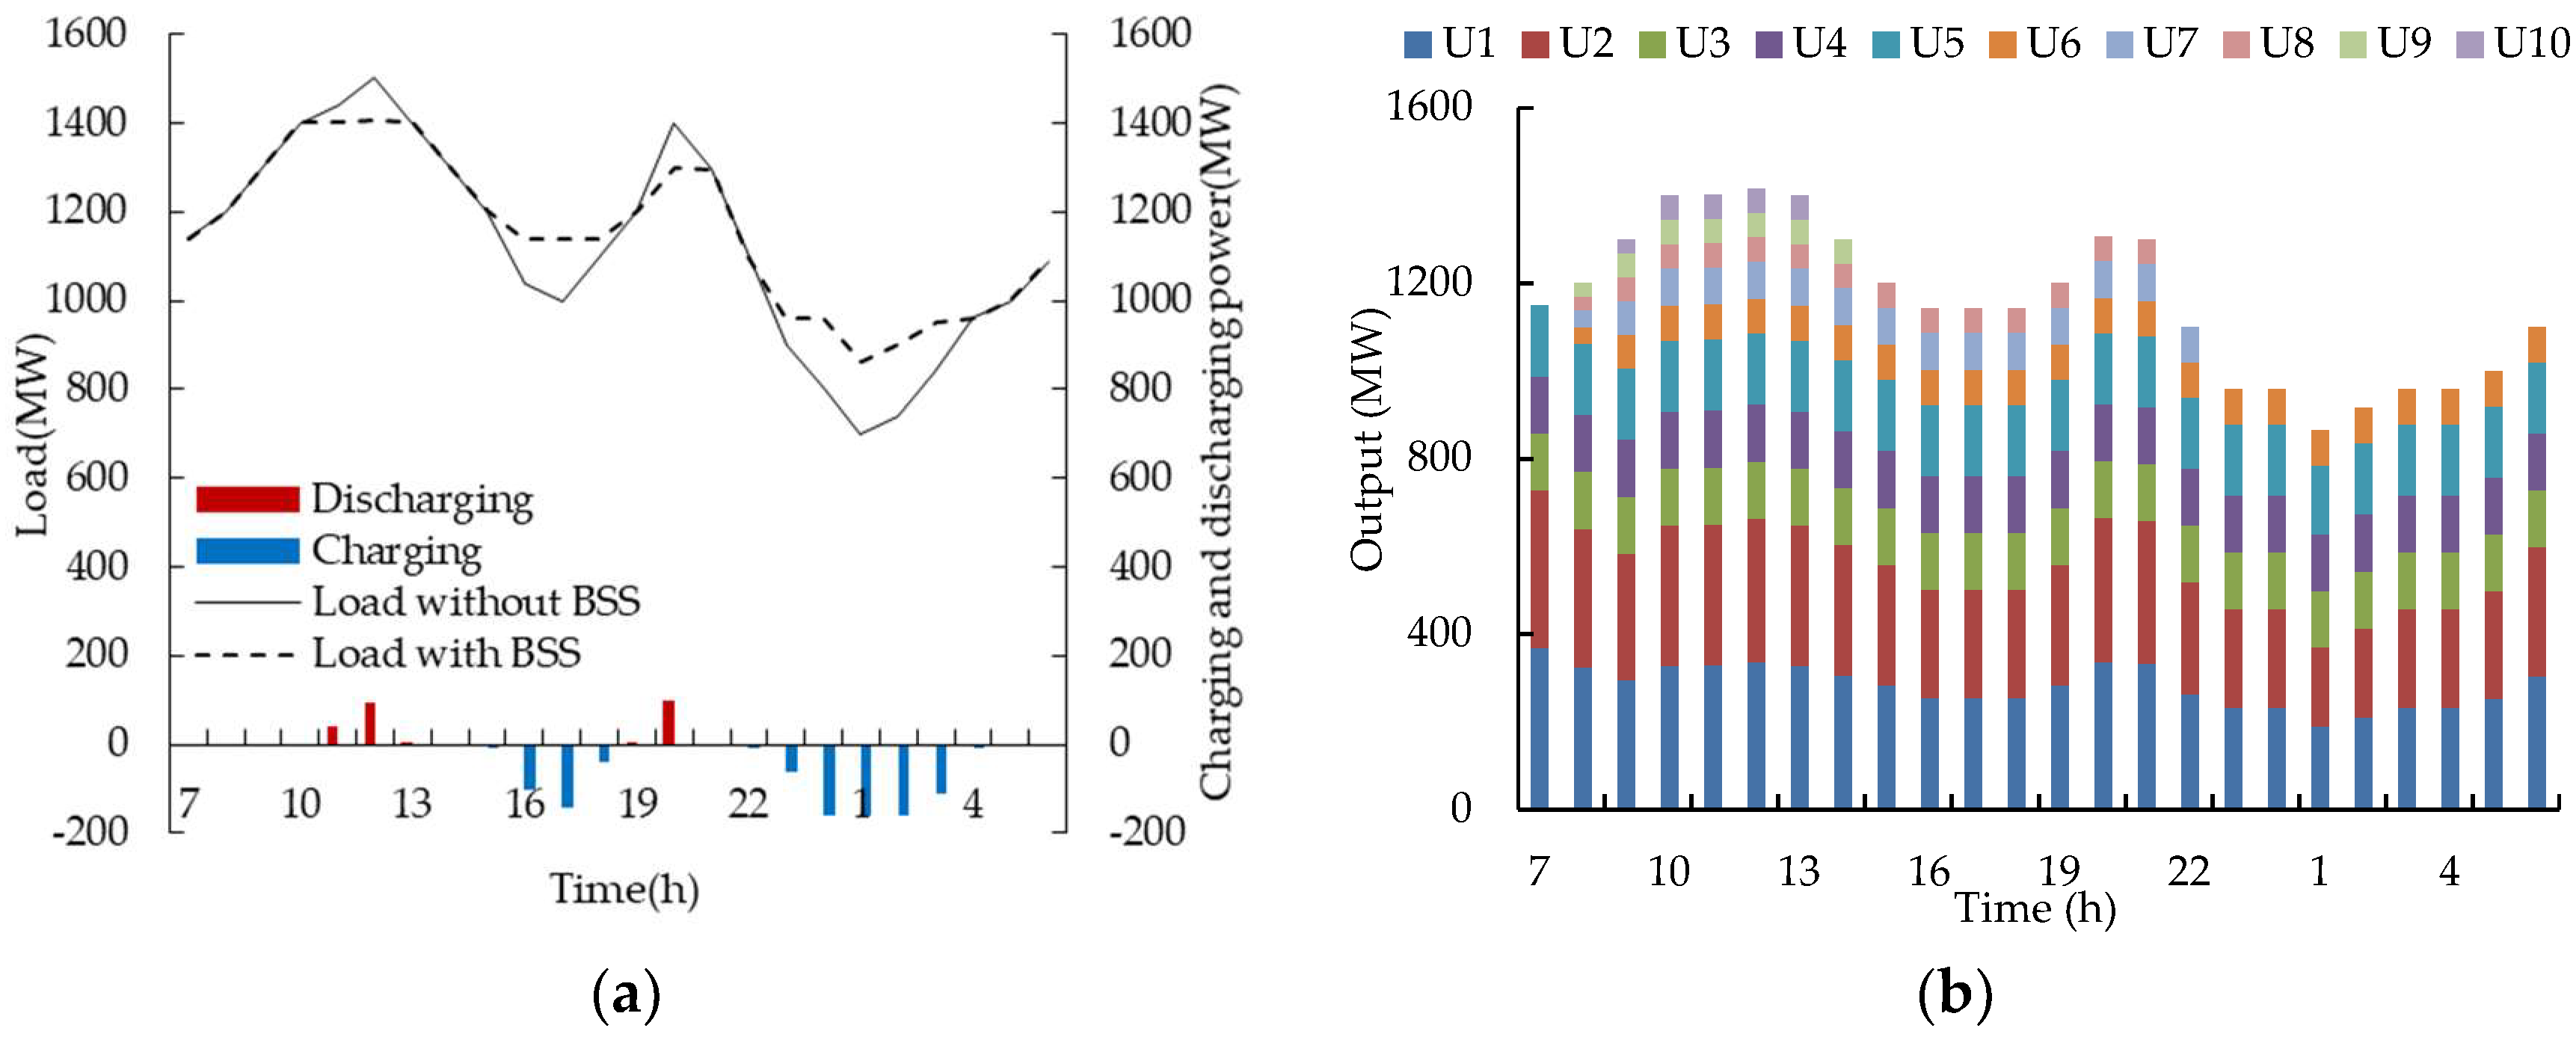
The charging/discharging process of the BSSs, the original load, and the formed total load with BSSs are shown in Figure 4a. As shown, the charging of batteries was mainly focused on the off-peak periods, while the B2G injections were primarily in the peak periods. The charging process from 15:00 to 18:00 was to ensure that BSSs were able to meet the energy requirement of battery swapping in peak periods. Note also that the BSSs charged again from 22:00 to 4:00 because they needed the same energy state as the one they had at the beginning of the optimization horizon. The B2G injections (11:00–13:00 and 19:00–20:00) could replace the output of units in a part, which decreased the burden of units and increased their flexibility to achieve a more optimal operating condition. Due to the B2G/G2B process of BSSs, the difference of peak load and off-peak load was reduced from 800 MW to 632.1 MW, which implied a more effective utilization of all units in the system.
The optimization results of the commitment status and production of each generating unit are shown in Figure 4b. As can be seen, the initial states of units 1–5 were synchronized while the others are offline. All the generators were operating from hours 8:00 to 13:00, during which the load demands were greater than that of the other periods. Additionally, the units with small capacities were operating at the maximum output state as far as possible, if they were online. Under the low-carbon economy, the generation outputs of units with large capacities, which were with lower fuel consumption and higher CO2 emissions, were reduced to some extent so as to achieve the optimum of economic benefit and environmental benefit.
5.2. Optimization Results with and without B2G
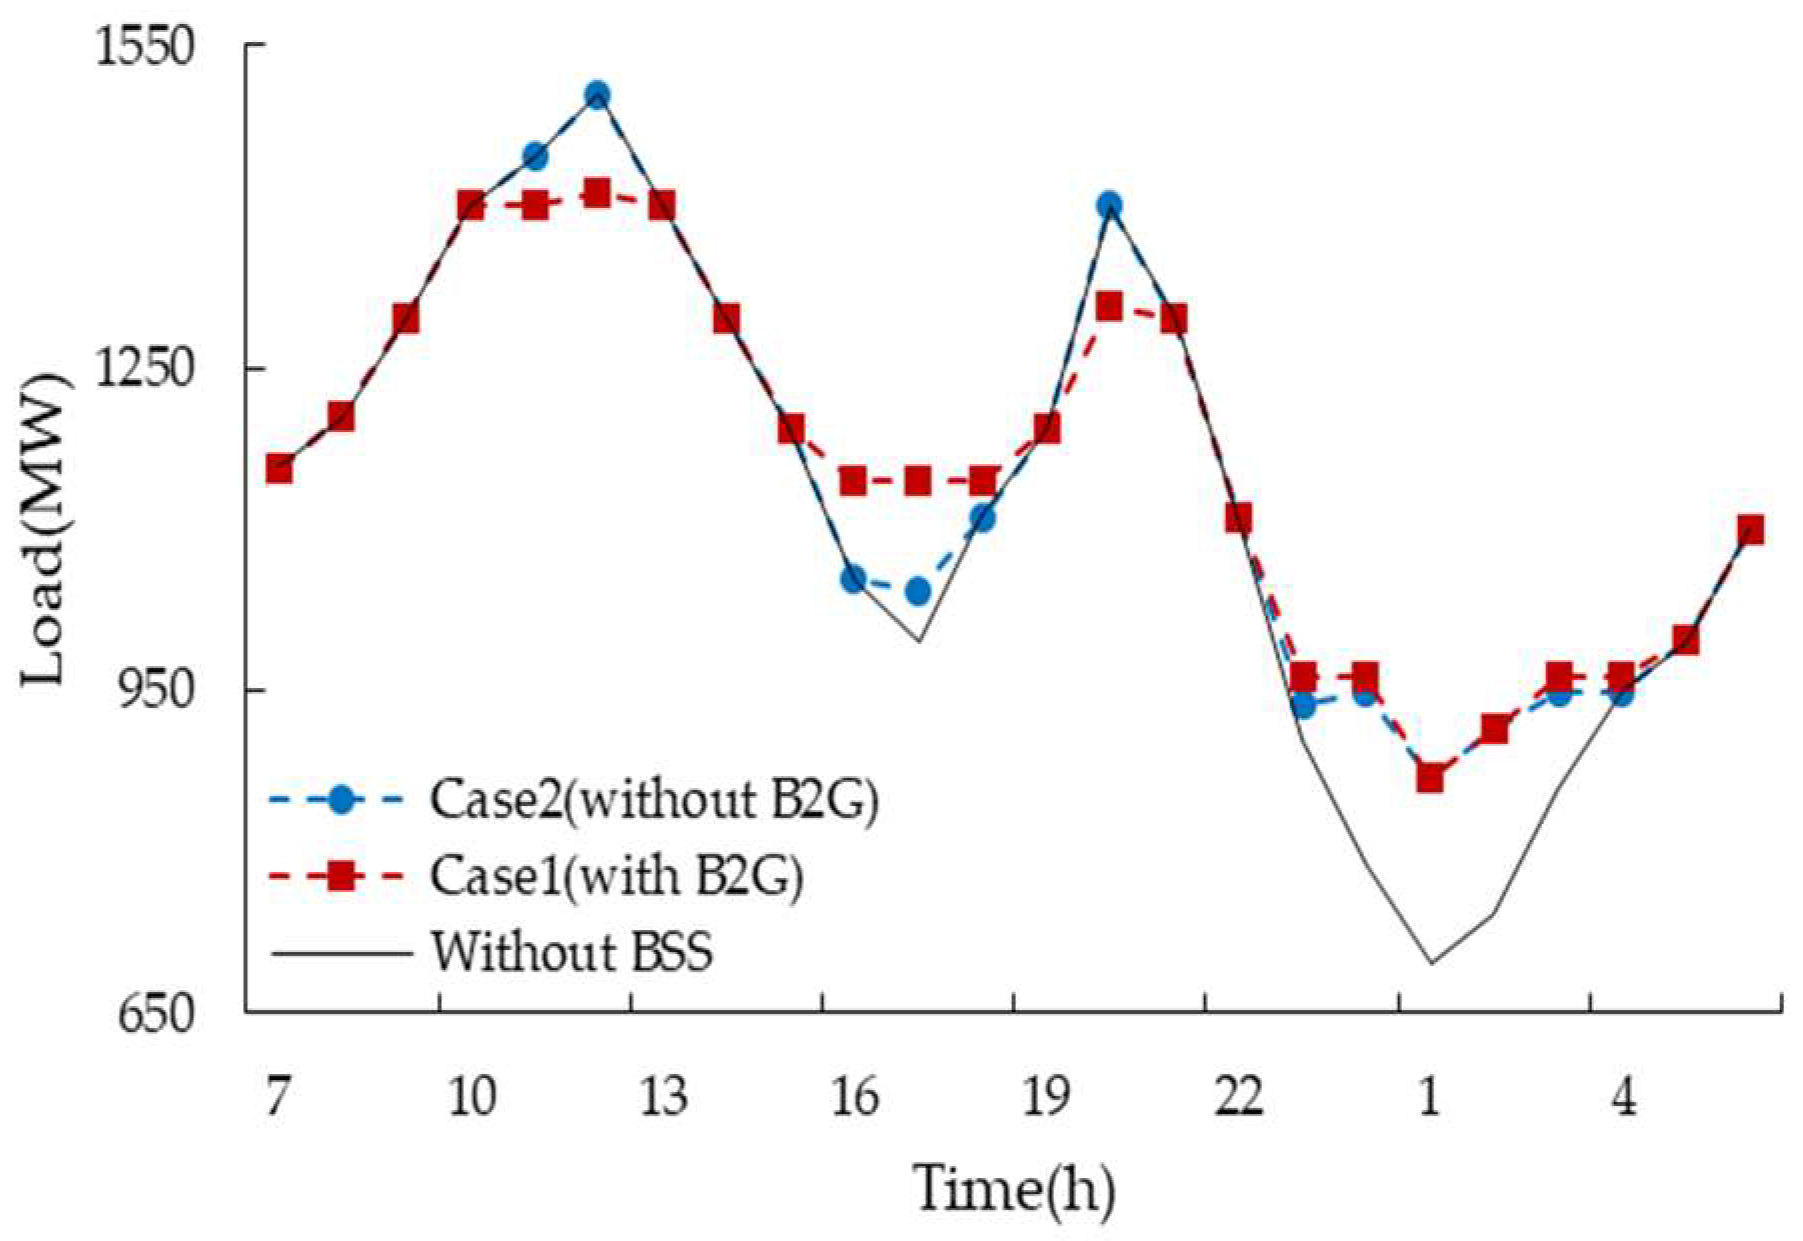
The BSS may not be willing to discharge to the grid when needed, considering the battery degradation, because of B2G injections [24]. Therefore, case 2, in which the discharging of batteries was not allowed, was employed to analyze how the optimization results changed without B2G. Figure 5 shows the total load curves of the two cases. It indicates that the valley in the load curve could be filled in both cases, while the peak of the load curve was only decreased in case 1. Also, from 15:00 to 18:00, batteries of case 1 were scheduled to charge more energy than that of case 2. The reason is that the additional energy was not only used to compensate the consumption energy of B2G from 11:00 to 13:00, but also as reserves to deploy scheduled discharging during 19:00–20:00.
The costs and CO2 emissions of the two cases are shown in Table 3. It can be seen that the battery wear cost only occurred in case 1 because the B2G process and fuel cost in case 1 was more than that of case 2, while both start-up cost and CO2 emission costs were less than that of case 2. It was the loss resulting from the flow of electricity from the system to batteries and then from batteries back to the system that required more power production from generators in case 1, thereby increasing the fuel cost. However, the B2G injections were available for peak load shaving, which allowed generators to operate more flexibly and reduce startup and output with higher CO2 emission intensity, thus the start-up cost and CO2 emission cost of case 1 was decreased compared to case 2. Therefore, the overall cost was reduced and the total CO2 emissions were decreased by 243 tons when the B2G mode was implemented.
5.3. Low Carbon Analysis of EVs
EVs with zero-emission of CO2 are regarded as the clean alternatives of traditional vehicles. However, charging the EVs will increase the load of the power system, which in return increases the CO2 emissions from power plants. Thus, it is worthwhile to analyze whether EVs can reduce emissions or not, as emissions will be shifted from the transportation sector to the power system.
As shown in Table 2, the average daily mileage of each EV is 33.9 miles. If so, the total daily mileage of the 50,000 EVs in the system is 1,695,000 miles. Then, the total CO2 emission from CVs is 927.3 tons, if they cover the same mileage with EVs (the average CO2 emission from CVs is 1.2 lb/mi). As shown in Table 3, the CO2 emissions of case 3 without EVs are 14,985.4 tons. Compared with that of case 1, the excess emission from power plants to supply energy for the EVs is 328.5 tons, which is regarded as the CO2 emissions of EVs. Thus, 50,000 EVs reduce the CO2 emissions by 598.8 tons compared to CVs. Even in case 2, EVs can also reduce a total of 337.5 tons CO2 emissions. It can be seen that the application of EVs are effective to achieve carbon emission reduction, although it increases CO2 emissions of the power system to some extent.
5.4. Sensitivity Analysis of CDM Transactions Price
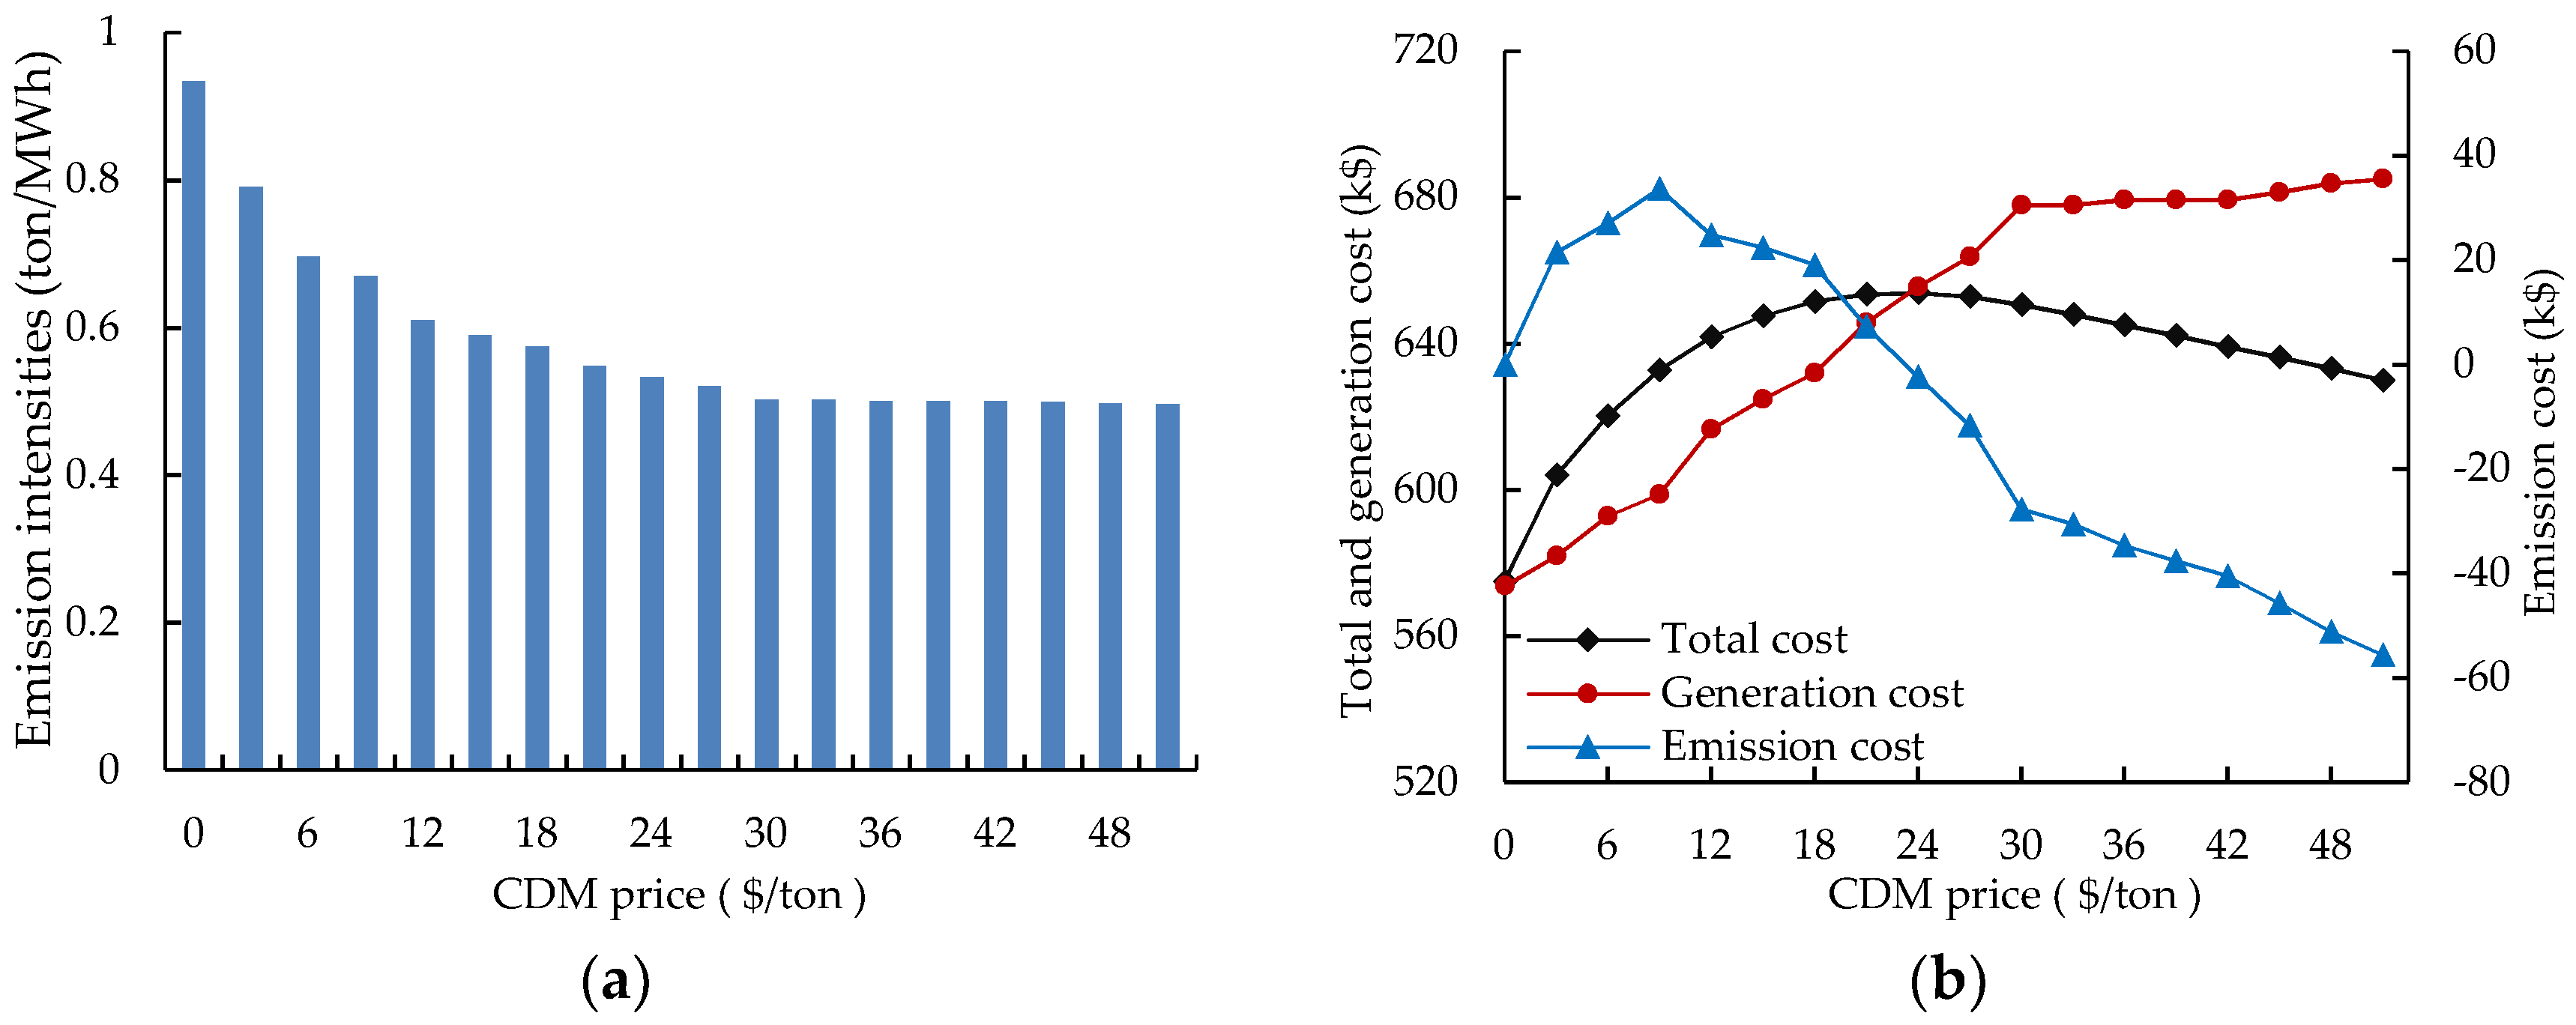
Under the low-carbon economy, the price of the CDM transactions plays an important role in the UC optimization problem. The CO2 emission intensity at different CDM prices are shown in Figure 6a. Observe that an increase in the CDM price led to the decrease of the CO2 emission intensity. This is because more units with lower CO2 emission intensity were scheduled to increase production with higher CDM price, reducing the total CO2 emissions. Additionally, the emission intensities were decreased slightly, and were almost the same when the price was higher than $30/tCO2, since the units with lower emissions intensity have been used as far as possible. Thus, it was tough to reduce the CO2 emissions further.
Figure 6b presents how the different costs change with the CDM price. As shown, with an increase of the CDM price, the generation cost, including the fuel and start-up costs, tended to increase continuously, while the CO2 emission cost increased at first and then decreased. Consequently, the overall cost was increased first and had the maximum value when the CDM price was $24/tCO2, and then decreased. The reasons are as follows. As the CDM price increased, the units with a lower emission intensity as well as higher fuel consumption were scheduled to increase power output, which reduced the CO2 emissions, which increased the generation cost correspondingly. Besides, given the emission allowances through CDM transactions increased with higher CDM price, the total CO2 emission cost depended on the trade-off between the increase of the CDM price and the decrease of CO2 emissions. Therefore, if the effect of the CDM price dominated over the effect of CO2 emissions, the CO2 emission cost was increased. Otherwise, it tended to decrease.
6. Conclusions
A model for optimizing the unit commitment and the charging/discharging profile of BSSs under a low-carbon economy has been proposed in this paper, which aimed to minimize the overall cost of the power system. By taking the relevant constraints of BSSs and a carbon trading mechanism into account, the model could better evaluate the generation scheduling of a power system with BSSs, in the condition of a low-carbon economy. In addition, an explicit model of the operation characteristics of BSSs was also described.
An implementation of case studies based on a 10-unit test system showed that BSSs were scheduled to charge during off-peak periods, while being discharged in peak periods, so as to achieve the optimum of economic benefit and environmental benefit. A comparison of UC with and without B2G revealed that B2G injections were effective for CO2 emission reduction. It was also shown that EVs shifting less CO2 emissions to the power system was promising to be the alternative to the traditional vehicles. Moreover, the results of UC optimization were sensitive to the CDM transaction price.
Author Contributions
S.L. proposed the core idea. M.L. developed the models, performed the simulations, and exported the results. Y.W. and M.M. provided some important reference material. All authors discussed the results and contributed to writing this paper.
Funding
This research was funded by the National Key Research and Development Program of China grant number 2017YFB0902202 and The National Natural Science Foundation of China grant number 51677076.
Conflicts of Interest
The authors declare no conflict of interest.
References
- Commission of the European Communities. Limiting Global Climate Change to 2 Degrees Celsius: The Way Ahead for 2020 and Beyond; CEC: Brussels, Belgium, 2007. [Google Scholar]
- Ji, Z.; Kang, C.; Chen, Q. Low-Carbon Power System Dispatch Incorporating Carbon Capture Power Plants. IEEE Trans. Power Syst. 2013, 28, 4615–4623. [Google Scholar] [CrossRef]
- Labatt, S.; White, R.R. Carbon Finance: The Financial Implications of Climate Change; Wiley: Hoboken, NJ, USA, 2015. [Google Scholar]
- Liu, G.Z.; Yu, C.W.; Li, X.R. Impacts of emission trading and renewable energy support schemes on electricity market operation. IET Gener. Transm. Distrib. 2011, 5, 650–655. [Google Scholar] [CrossRef]
- Wu, Y.; Lou, S.; Lu, S. A Model for Power System Interconnection Planning Under Low-Carbon Economy with CO2 Emission Constraints. IEEE Trans. Sustain. Energy 2011, 2, 205–214. [Google Scholar] [CrossRef]
- Ortega-Vazquez, M.A.; Bouffard, F.; Silva, V. Electric Vehicle Aggregator/System Operator Coordination for Charging Scheduling and Services Procurement. IEEE Trans. Power Syst. 2013, 28, 1806–1815. [Google Scholar] [CrossRef]
- Song, Y.; Zhong, J.; Liu, J. Economic dispatch model considering policy-guided carbon trading mechanisms. In Proceedings of the IEEE Grenoble PowerTech, Grenoble, France, 16–20 June 2013. [Google Scholar]
- Wang, X.; Wang, J.; Tian, B. Economic Dispatch of the Low-Carbon Green Certificate with Wind Farms Based on Fuzzy Chance Constraints. Energies 2018, 11, 943. [Google Scholar] [CrossRef]
- Smith, W.J. Plug-in hybrid electric vehicles—A low-carbon solution for Ireland. Energy Policy 2010, 38, 1485–1499. [Google Scholar] [CrossRef]
- Lou, S.; Zhang, L.; Wu, Y. Coordination Operation of Electric Vehicles and Power System under Low-Carbon Economy. Trans. China Electrotech. Soc. 2017, 32, 176–183. [Google Scholar]
- Sarker, M.R.; Pandzic, H.; Ortega-Vazquez, M.A. Electric vehicle battery swapping station: Business case and optimization model. In Proceedings of the International Conference on Connected Vehicles and Expo (ICCVE), Las Vegas, NV, USA, 2–6 December 2013. [Google Scholar]
- Yang, S.; Yao, J.; Kang, T. Dynamic operation model of the battery swapping station for EV (electric vehicle) in electricity market. Energy 2014, 65, 544–549. [Google Scholar] [CrossRef]
- Sarker, M.R.; Pandžić, H.; Ortega-Vazquez, M.A. Optimal Operation and Services Scheduling for an Electric Vehicle Battery Swapping Station. IEEE Trans. Power Syst. 2015, 30, 901–910. [Google Scholar] [CrossRef]
- Zheng, Y.; Dong, Z.Y.; Xu, Y. Electric vehicle battery charging/swap station in distribution systems: Comparison study and optimal planning. IEEE Trans. Power Syst. 2014, 29, 221–229. [Google Scholar] [CrossRef]
- Kempton, W.; Tomić, J. Vehicle-to-grid power fundamentals: Calculating capacity and net revenue. J. Power Sources 2005, 144, 268–279. [Google Scholar] [CrossRef]
- French, D. Kyoto Protocol to the United Nations Framework Convention on Climate Change. Rev. Eur. Comp. Int. Environ. Law 2010, 7, 214–217. [Google Scholar] [CrossRef]
- Li, X.I.; Yu, C.W. Impacts of emission trading on Carbon, Electricity and Renewable Markets: A review. In Proceedings of the IEEE Power and Energy Society General Meeting, Minneapolis, MN, USA, 25–29 July 2010. [Google Scholar]
- National Development and Reform Commission, Baseline Emission Factors for Regional Power Grids in China. Available online: http://cdm.ccchina.gov.cn (accessed on 15 February 2014).
- Ting, T.O.; Rao, M.V.C.; Loo, C.K. A novel approach for unit commitment problem via an effective hybrid particle swarm optimization. IEEE Trans. Power Syst. 2006, 21, 411–418. [Google Scholar] [CrossRef]
- Saber, A.Y.; Venayagamoorthy, G.K. Plug-in vehicles and renewable energy sources for cost and emission reductions. IEEE Trans. Ind. Electron. 2011, 58, 1229–1238. [Google Scholar] [CrossRef]
- Ashtari, A.; Bibeau, E.; Shahidinejad, S. PEV charging profile prediction and analysis based on vehicle usage data. IEEE Trans. Smart Grid 2012, 3, 341–350. [Google Scholar] [CrossRef]
- Qian, K.; Zhou, C.; Allan, M. Modeling of load demand due to EV battery charging in distribution systems. IEEE Trans. Power Syst. 2011, 29, 802–810. [Google Scholar] [CrossRef]
- Darabi, Z.; Ferdowsi, M. Aggregated impact of plug-in hybrid electric vehicles on electricity demand profile. IEEE Trans. Sustain. Energy 2011, 2, 501–508. [Google Scholar] [CrossRef]
- Ortega-Vazquez, M.A. Optimal scheduling of electric vehicle charging and vehicle-to-grid services at household level including battery degradation and price uncertainty. IET Gener. Transm. Distrib. 2014, 8, 1007–1016. [Google Scholar] [CrossRef]
Figure 1.
Framework of the proposed model.

Figure 2.
Main operation characteristics of a battery swap station.

Figure 3.
Battery swapping demand of EVs in each BSS.

Figure 4.
The optimization results of UC model: (a) The charging/discharging profile of BSSs; (b) The output of each unit in each period.
Figure 4.
The optimization results of UC model: (a) The charging/discharging profile of BSSs; (b) The output of each unit in each period.

Figure 5.
Total load curves formed in case 1 and case 2.

Figure 6.
The generation scheduling results under different CDM prices: (a) CO2 emission intensities; (b) Generation cost, CO2 emission cost, and total cost.
Figure 6.
The generation scheduling results under different CDM prices: (a) CO2 emission intensities; (b) Generation cost, CO2 emission cost, and total cost.


Table 1.
Relevant Parameters of 10-unit Test System.
| Unit | Pmax (MW) | Pmin (MW) | ai ($/MW2h) | bi ($/MWh) | ci ($/h) | αi (ton/MW2h) | βi (ton/MWh) | γi (ton/h) |
|---|---|---|---|---|---|---|---|---|
| 1 | 455 | 150 | 0.00048 | 16.19 | 1000 | 0.00312 | −0.24444 | 10.33908 |
| 2 | 455 | 150 | 0.00031 | 17.26 | 970 | 0.00312 | −0.24444 | 10.33908 |
| 3 | 130 | 20 | 0.002 | 16.6 | 700 | 0.00509 | −0.40695 | 30.03910 |
| 4 | 130 | 20 | 0.00211 | 16.5 | 680 | 0.00509 | −0.40695 | 30.03910 |
| 5 | 162 | 25 | 0.00398 | 19.7 | 450 | 0.00344 | −0.38132 | 32.00006 |
| 6 | 80 | 20 | 0.00712 | 22.26 | 370 | 0.00344 | −0.38132 | 32.00006 |
| 7 | 85 | 25 | 0.0079 | 27.74 | 480 | 0.00465 | −0.39023 | 33.00056 |
| 8 | 55 | 10 | 0.00413 | 25.92 | 660 | 0.00465 | −0.39023 | 33.00056 |
| 9 | 55 | 10 | 0.00222 | 27.27 | 665 | 0.00465 | −0.39524 | 35.00056 |
| 10 | 55 | 10 | 0.00173 | 27.79 | 670 | 0.0047 | −0.39864 | 36.00012 |
Table 2.
Relevant Parameters of BSSS and EVS.
| Parameters | Values |
|---|---|
| Battery capacity (KWh) | 24.0 |
| Battery lifetime in cycles for shallow DoD | 6000 |
| Battery capital cost ($) | 9890 |
| Average state of charge of EVs | 0.5 |
| Number of chargers in each BSS | 500 |
| Number of batteries in each BSS | 600 |
| Charging/discharging efficiency | 0.9 |
| Rated charging/discharging power (KW) | 6.6 |
| Minimal state of charge | 0.2 |
Table 3.
Costs and CO2 Emissions in Different Cases.
| Cost | Case 1 (With B2G) | Case 2 (Without B2G) | Case 3 (Without EVs) |
|---|---|---|---|
| Fuel cost (104$) | 64.316 | 63.966 | 62.803 |
| Start-up cost ($) | 610 | 670 | 670 |
| Emission cost (104$) | 0.819 | 1.341 | 0.161 |
| Battery wear cost ($) | 1236 | -- | -- |
| Overall cost (104$) | 65.320 | 65.374 | 63.031 |
| Total CO2 emissions (tons) | 15,332.6 | 15,575.2 | 14,985.4 |
© 2018 by the authors. Licensee MDPI, Basel, Switzerland. This article is an open access article distributed under the terms and conditions of the Creative Commons Attribution (CC BY) license (http://creativecommons.org/licenses/by/4.0/).
Share and Cite
MDPI and ACS Style
Lv, M.; Lou, S.; Wu, Y.; Miao, M. Unit Commitment of a Power System Including Battery Swap Stations Under a Low-Carbon Economy. Energies 2018, 11, 1898. https://doi.org/10.3390/en11071898
AMA Style
Lv M, Lou S, Wu Y, Miao M. Unit Commitment of a Power System Including Battery Swap Stations Under a Low-Carbon Economy. Energies. 2018; 11(7):1898. https://doi.org/10.3390/en11071898
Chicago/Turabian StyleLv, Mengxuan, Suhua Lou, Yaowu Wu, and Miao Miao. 2018. "Unit Commitment of a Power System Including Battery Swap Stations Under a Low-Carbon Economy" Energies 11, no. 7: 1898. https://doi.org/10.3390/en11071898
Note that from the first issue of 2016, this journal uses article numbers instead of page numbers. See further details here.