A Parametric Study of Blast Damage on Hard Rock Pillar Strength

_Spearing.png)
Western Australian School of Mines, Curtin University, Kalgoorlie, WA 6430, Australia
*
Author to whom correspondence should be addressed.
Energies 2018, 11(7), 1901; https://doi.org/10.3390/en11071901
Submission received: 6 July 2018
/
Revised: 10 July 2018
/
Accepted: 19 July 2018
/
Published: 20 July 2018
Abstract
:Pillar stability is an important factor for safe working and from an economic standpoint in underground mines. This paper discusses the effect of blast damage on the strength of hard rock pillars using numerical models through a parametric study. The results indicate that blast damage has a significant impact on the strength of pillars with larger width-to-height (W/H) ratios. The blast damage causes softening of the rock at the pillar boundaries leading to the yielding of the pillars in brittle fashion beyond the blast damage zones. The models show that the decrease in pillar strength as a consequence of blasting is inversely correlated with increasing pillar height at a constant W/H ratio. Inclined pillars are less susceptible to blast damage, and the damage on the inclined sides has a greater impact on pillar strength than on the normal sides. A methodology to analyze the blast damage on hard rock pillars using FLAC3D is presented herein.
1. Introduction
The most common methods employed in hard rock mines are drilling and blasting. An inherent problem that exists with this method is the damage to the periphery of excavation induced by the blast. Perimeter control and smooth wall blasting have been implemented to reduce blast-induced damage where it is considered an issue and is common in underground civil construction. However, some level of blast damage is inevitable, and this leads to adverse consequences in the form of stability issues in the rock excavations.
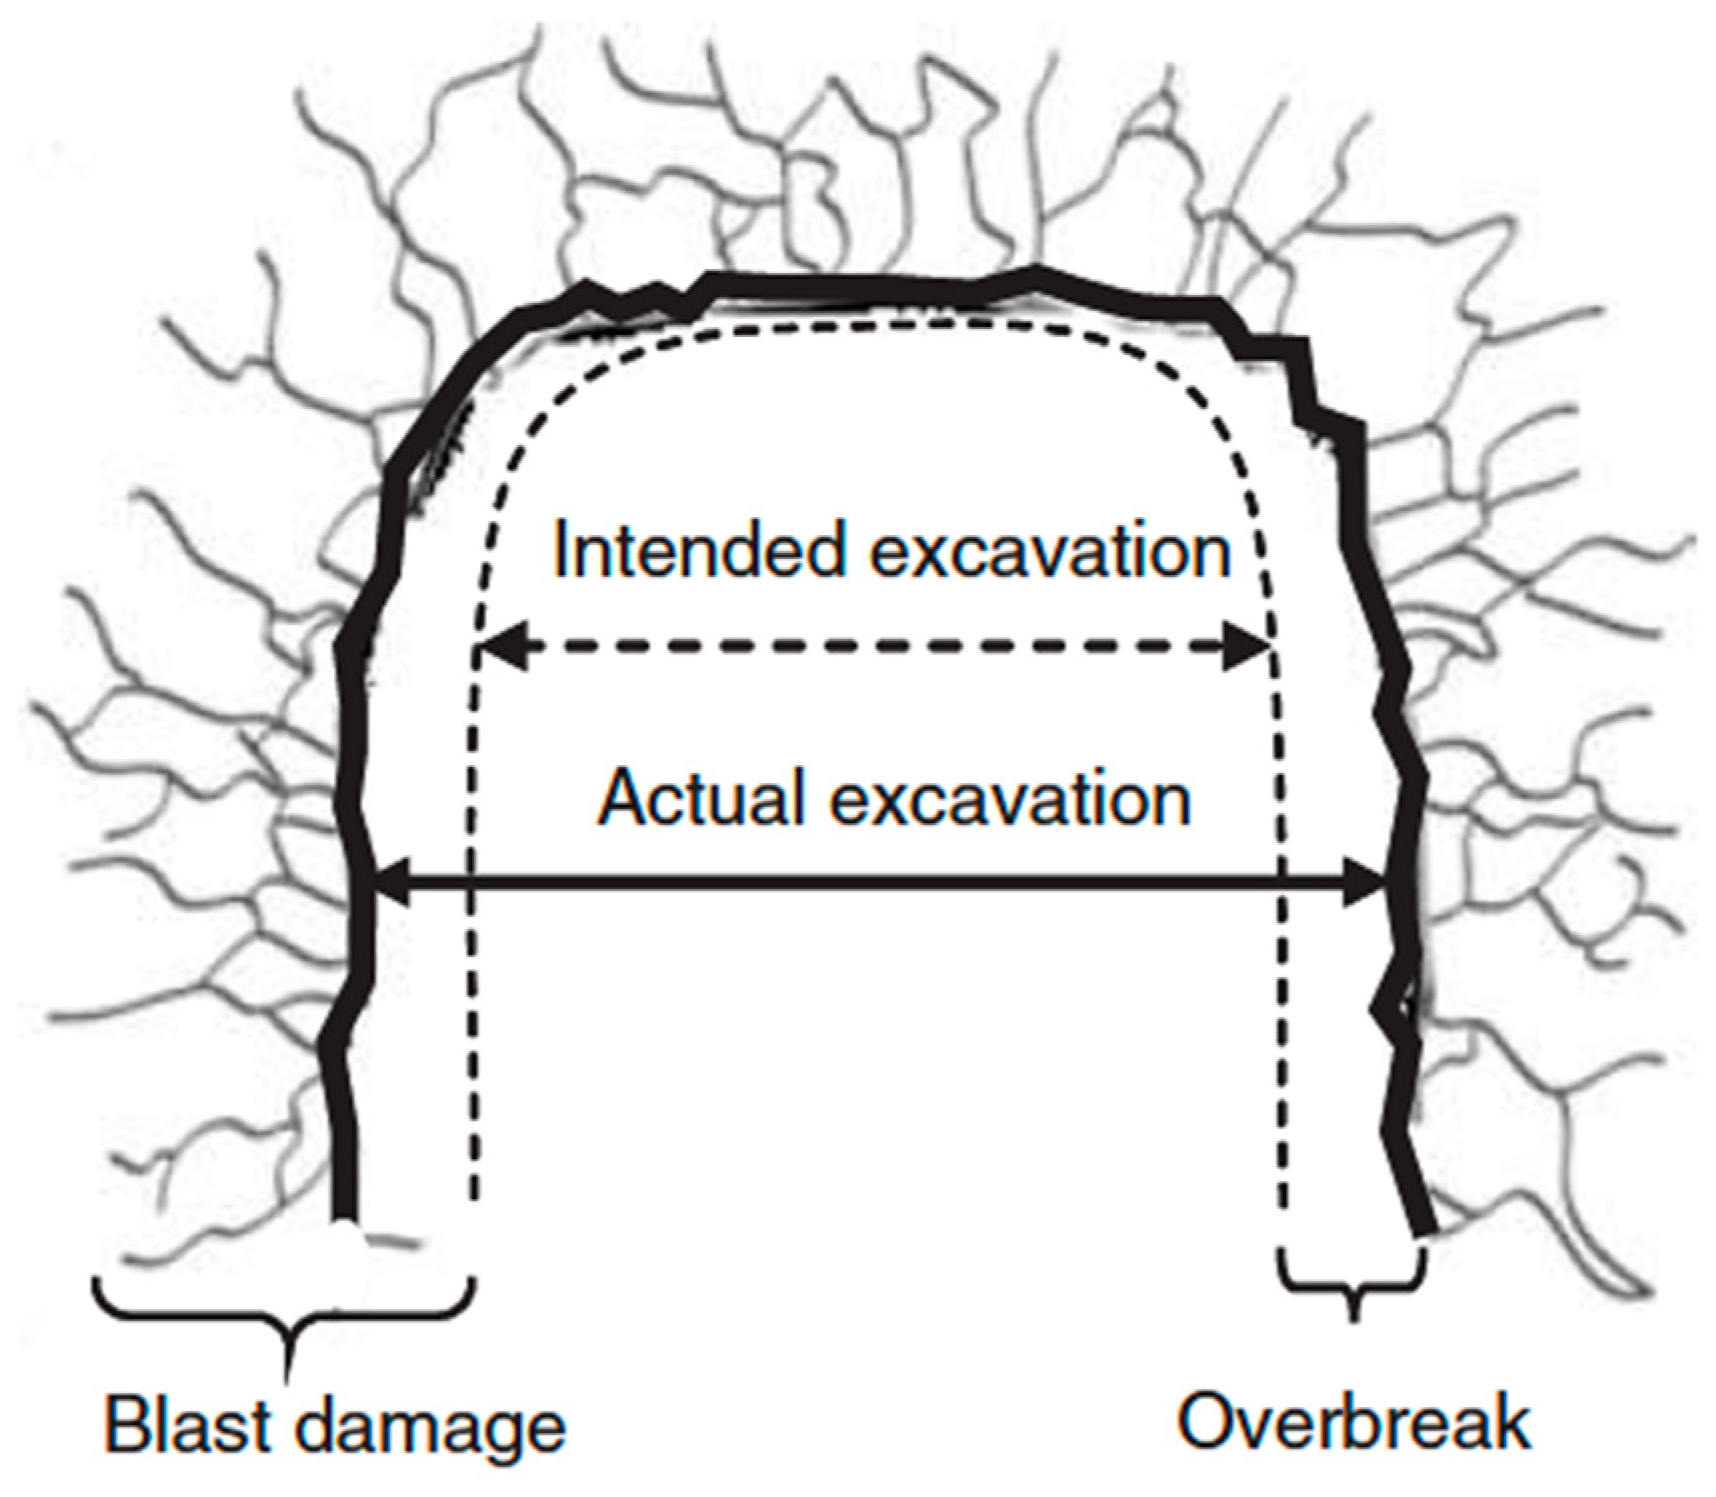
Some of the earliest research [1,2,3] stated over-break as the only major consequence of the blast damage. It was defined as the unwanted loosening, dislocation, and disturbance of the rock mass beyond the limits of the intended excavation design. Figure 1 illustrates a clear distinction between the over-break and the blast damage [4]. This paper employs numerical models to consider blast-induced damage as the region beyond the final excavation boundary, where the rock has been damaged by blasting.
Numerous studies have been undertaken to determine the extent of the blast damage on rock excavations [5,6,7,8,9]. General theories were developed to determine the extent of the damage zone from small-scale and field-scale investigations based on explosive properties, borehole radius, and material properties. Kutter and Fairhurst [5] also found that the stress waves and the gas-generated fractures propagate along the maximum principal stress direction. Ouchterlony et al. [10] have done field studies to determine the blast-damaged zone based on explosive type, charge concentration, and charge diameter. It was concluded that the damaged zone can range from 0.25 to 2.0 m depending on the properties of the rock, such as intact rock mass, jointed rock mass, and heavily jointed rock mass.
Hoek et al. [11] classified the rock damage from blasting by introducing a blast damage factor (D). A qualitative classification was presented with good blasting represented as D = 0 and poor blasting represented as D = 0.8. Sharifzadeh and Pal [12] attempted to quantify the blast damage factor by deducing a relationship between deformation modulus and intact rock modulus by taking the blasting effect into consideration. Torbica and Lapcevic [13] quantified the blast damage by reducing the geological strength index (GSI) by 10 units in the damaged rock zone. It was concluded that the results of the reduced-GSI method were equivalent to that of the D factor, showing that reduced GSI can be used as an alternative for determining the properties of the degraded rock mass.
There are no theoretical methods to account for excavation stability in the tunnels and pillars considering blast damage. Therefore, numerical modeling is one of the most appropriate method to observe the effect of blast damage on excavations when the model parameters, rock properties, and constitutive models are employed properly. Shen and Barton [14] described the damaged zone with increased jointing and evaluated the stress distribution around the tunnels with the help of discontinuum modeling UDEC. Saiang [15] evaluated the properties of the rock in the blast-damaged zone with the discrete element modeling PFC2D. These properties were used in FLAC to perform a parametric study on the properties affecting the stress distribution of the tunnels. Blast damage thickness had a moderate effect, and deformation modulus had a high effect, on the stress distribution in the tunnels. Mitelman and Elmo [16] developed a hybrid element discrete modeling approach to study the induced damage in tunnels. Phase2 was used to demonstrate the blast effect on the tunnels where the degraded rock properties were used for only the specified thickness of the blast zone [13]. In these studies, the periphery of the tunnels was simulated by reducing the intact rock properties of the blast-effected zone.
Baharani et al. [17] conducted finite element analysis on pillars in a hypothetical case study considering the blasting effect. It was concluded that the slender pillars are prone to strain bursting, and the strength of the wider pillars is affected by drill and blast methods. It was also shown that the yielding of the pillar side walls is higher due to blast damage. Limited study has been conducted on pillars with blast damage. Therefore, in this paper, a parametric study of the damage factor and damage thickness over different pillar dimensions was conducted to understand the blast damage effect on the strength of the pillars.
2. Theoretical Background
Pillar design theories are predominantly concerned with the factor of safety, which is the ratio of pillar strength to the maximum pillar stress. This approach ignores aspects such as the following:
- The presence of geology and water;
- A weak roof or floor;
- The effects of blasting;
- The dip.
To overcome these other, often-ignored parameters, a higher factor of safety is adopted, such as 1.4 for hard rock pillars [18].
To date, many studies have been conducted to develop empirical approaches to the study of hard rock pillar strength [19,20] in different rock types. Lunder’s approach [18] is considered one of the most prominent empirical approaches that has been used to design pillars. It is given as:
where is the ultimate strength of the pillar (MPa), K is the pillar size factor, UCS is the uniaxial compressive strength of the intact rock (MPa), C1 and C2 are the empirical rock mass constants, and κ is the friction term, which is calculated as:
where Cpav is the average pillar confinement, and Coeff is the coefficient of the pillar confinement.
Past empirical studies were based on a specific database that does not consider the rock mass properties. To improve upon these empirical equations, studies were conducted with numerical models considering the fracture sets [21,22], but blast damage has yet to be considered.
2.1. Blast Damage Zone Properties
Rock properties play an important role in explaining the damage in the blast damage zone. Blasting creates fractures in the blast damage zone that reduce the strength of the rock mass. The most important rock properties affecting blast damage are massive rock modulus, cohesion, and friction [11].
The rock modulus in the blast damage zone is expressed as the degraded rock modulus (Erm), which depends on the intact rock modulus (Ei), damage factor (D), and GSI, [23] is given as follows:
The most popular forms of numerical modeling have been developed with the Mohr-Coulomb or bilinear failure criterion. For example, the effects of cohesion (C′) and friction (Ø′) on the blast damage zone were evaluated by Hoek et al. (2002) and are given as:
where mb is the reduced value of the rock mass material constant, a and s are the rock structure constants, σci is the uniaxial compressive strength of the intact rock sample, and is the upper limit of the confining stress.
The degraded rock modulus, cohesion, and friction are the key parameters employed in numerical models of the blast damage zone derived by Equations (5)–(7), while the massive rock properties are the key parameters employed for the zone beyond the blast damage zone.
2.2. Effect of Pillar Height
Pillar height has a considerable effect on the strength of hard rock pillars. The strength of the pillar decreases with the increase in pillar height at a constant pillar width-to-height (W/H) ratio [24]. Many studies have been conducted to understand the effect of size, which shows that at a constant W/H ratio, as the sample size increases, the strength of the sample decreases [25]. Alternatively, at a constant blast thickness, the blast would encompass a larger amount of a smaller pillar and, conversely, a smaller amount of a larger pillar. For example, a 0.25 m blast thickness on a pillar with a height of 1 m and a W/H ratio of 1 would lead to 44% pillar damage, while a blast of the same thickness on a pillar with a height of 2 m and a W/H ratio of 1 would lead to 23% pillar damage. Therefore, it is important to understand the different blast damage that occurs at different pillar heights at constant pillar W/H ratios.
2.3. Effect of Pillar Inclinations
Pillar inclinations lead to inclined loading conditions, and increasing pillar inclination reduce pillar strength [26,27]. In inclined pillars, the pillar sides towards the dip lead to the pillar failure. While blasting affects all sides of the pillar similarly, for inclined pillars, it would be interesting to understand which pillars sides are more susceptible to pillar strength reduction from blast damage. Therefore, the effect of blast damage on the strength of inclined pillars on all the pillar sides, including dip sides and strike sides, is also studied in this paper.
The scope of this paper is to understand the effects of blast damage on vertical as well as inclined hard rock pillars with use of numerical modeling. A parametric study has been conducted with pillar parameters such as W/H ratio, pillar height, and pillar inclination and with blast parameters such as blast damage factor and blast damage thickness.
3. Numerical Modeling
To develop an understanding of pillar behavior with blast damage, FLAC3D 5.0 [28], a finite difference element software, was employed throughout the body of the work. A majority of the studies on ground control, and especially on pillar stability, have employed FLAC3D for its inbuilt, well-developed constitutive models. The extent of blast damage in a pillar depends on the blast factor (D) and blast zone thickness (T). Therefore, these two parameters were varied to understand the response of the models. The results were presented in either normalized fashion or the actual results depending on the factor analyzed. The normalized result is the ratio of pillar strength as affected by blast damage to that of the actual pillar strength.
3.1. Grid Generation
The model was created in a three-dimensional framework with the origin at the center of the pillar, as shown in Figure 2. The horizontal plane of the coordinate system is denoted by x and y axes and the vertical plane by the z axis. The model consists of pillar, main roof, and main floor. The model’s extent in the vertical plane was three times the pillar width to ensure that there were no interaction effects of model boundaries on the pillar. The excavation surrounding the pillar was set at a 75% extraction ratio; therefore, the excavation width is equal to that of the pillar width.
3.2. Mesh Generation and Loading Rate
The mesh size and the loading rates play a critical role in developing the numerical models effectively and are dependent on each other. Mesh size depends on the area of concentration on the pillar that will be helpful in understanding the impact of blast damage on pillar behavior. The blast damage reported in the excavation ranges from 0.25 to 2 m [10]. Therefore, the minimum mesh size should be about 0.25 m × 0.25 m × 0.25 m or less, such that the blast zone thickness of 0.2 m can be analyzed on the pillars.
Loading rate can be either stress-controlled or strain-controlled. It is recommended to use strain-controlled loading rates to obtain reliable stress strain graphs [28]. The model run time and the stress strain curve are dependent on the loading rate. To understand the effect of loading rate, a pillar with W/H ratio of 1.0 was applied with three different loading rates. Table 1 shows that the model run time increases exponentially with decreasing loading rates. Figure 3a shows that with low loading rates, the models obtained good and reliable stress strain graphs.
The loading rate is largely dependent on the mesh size. Past numerical studies on pillars have adopted large meshes [29,30,31] and therefore employed higher loading rates. The relationship between the mesh size and loading rate was defined with the help of stress strain graphs. It was found that smaller mesh sizes needed very low loading rates, and as the mesh size increases, higher loading rates can be employed. Three mesh sizes were varied to understand the stress strain behavior at a 1 × 10⁻⁶ m/step loading rate. This loading rate serves well for 0.5 m and 0.25 m meshes. For 0.125 m mesh, the loading rate seems to be higher, resulting in bumps in the stress strain curve (Figure 3b). The smaller mesh size also results in higher model run times. Optimization of the loading rate, mesh size, and model run time is required to obtain a good stress strain graph. Therefore, a 1 × 10⁻⁶ m/step loading rate is suitable for a mesh size of 0.25 m × 0.25 m × 0.25 m and has been used throughout this paper.
3.3. Boundary Conditions
Roller boundaries were applied on the x and y boundaries, which restricted displacement and velocity normal to the planes. These boundaries simulate the chain of pillars around the model. The main floor was pinned, restricting the displacements and the velocities both normal and parallel to the plane. The load was applied as uniform velocity on the top of the main roof to simulate the compressive loading on the pillars. The model was subjected to a vertical stress of 2.7 MPa with a vertical-to-horizontal stress ratio of 1:1, which simulates a mine of a depth of 100 m.
3.4. Material Properties
Material properties and failure criteria prove to be critical in developing realistic numerical models. The model comprises the main roof, main floor, and pillars, and as the focus of the paper is on the pillars; the main roof and the main floor are simulated as elastic materials. The pillars are best represented with the brittle Hoek-Brown criterion [29,32,33], which is established on the formation of brittle cracks at 0.3 to 0.5 times the uniaxial compressive strength, followed by shear failure in the pillars. Therefore, a bilinear strength envelope was used in which strength is equal to one third of the uniaxial compressive strength and is independent of friction at lower confinement, followed by friction hardening at higher confinement [33].
The bilinear strain-hardening/softening ubiquitous-joint model, an inbuilt FLAC3D constitutive model, was used to simulate the bilinear rock strength behavior based on the Mohr-Coulomb failure criterion and strain softening as a function of deviatoric plastic strain [28]. The rock and joint properties for the constitutive model are obtained from Esterhuizen [29] using uniaxial compressive strength and Rock Mass Rating of 120 MPa and 70, respectively, and are shown in Table 2 and Table 3.
Strain softening parameters are dependent on the model mesh size. These parameters are established by calibrating all of the numerical models to that of the theoretical results using the same element size throughout all of the models [28]. It was determined that while using a large mesh size, the softening should occur at very low plastic strain, and when a small mesh size is adopted, the softening occurs over a large plastic strain. Therefore, the mesh size was kept at 0.25 m × 0.25 m × 0.25 m with a loading rate of 1 × 10⁻⁶ for all the models, and cohesion softening was performed to calibrate the numerical model results to that of the Lunder results [18].
To simulate the blast damage in the model, rock properties were changed to degraded rock properties in the blast-damaged zones with the help of FISH code (an inbuilt function in FLAC3D for developing user-defined variables and functions), as shown in Figure 4. That shows the blast damage zone’s thickness was 0.5 m, whereas the Young’s modulus, Mohr-Coulomb cohesion, and Mohr-Coulomb friction were altered in the blast-damaged zones using Equations (4)–(6) for blast damage factors (D) of 0.25, 0.5, 0.75, and 1.0 and are presented in Table 4. A flowchart has been developed representing step-by-step procedure for numerical modeling of pillars in FLAC3D, as shown in Figure 5.
3.5. Model Calibration
The models were created at pillar W/H ratios of 0.5, 1.0, 1.5, and 2.0. The pillar height adopted in these models was about 4 m, which is similar than the pillar height in Lunder’s database [18]. The strength results were obtained through the stress strain curves developed by FISH code. The model strength of the pillars was then calibrated to that of the theoretical results, as shown in Figure 6. It was observed that the difference between the model results and the theoretical results was less than 5%.
4. Results and Discussion
4.1. Effect of Blast Damage on Pillar Width-to-Height Ratio
Five W/H ratios were simulated: 0.5, 1.0, 1.5, 2.0, and 2.5. These models used four different blast factors (D) (0.25, 0.5, 0.75, and 1.0) and four different blast thicknesses (T) (0.25 m, 0.5 m, 0.75 m, and 1.0 m). For a W/H ratio of 1.0, 16 models were simulated to understand the blast effect on pillar strength. Therefore, a total of 80 models were simulated to understand the blast effect on varying W/H ratios.
Assuming the blast damage on the pillars would decrease pillar strength, the results are presented in a normalized fashion, mainly for qualitative purposes, to understand the percentage decrease in pillar strength due to blasting when compared to the pillar strength with no damage effect. Pillar strength with no blast effect (i.e., a disturbance factor of zero and a damage thickness of zero) represents the baseline value. For example, if the pillar strength with no blast effect were 50 MPa, and the pillar strength with a 0.5 disturbance factor and a 0.5 m damage thickness were 35 MPa, then the normalized pillar strength ratio would be 1.0 for no blast effect and 0.7 for a pillar with a 0.5 disturbance factor and a 0.5 m damage thickness.
Assuming the aforementioned methodology, the results are shown in Table 5. Based on the results for the blast effect on the slender pillars (W/H < 0.8), the damage has a little effect on the pillars’ strength. This is due to the fact that the slender pillars fail in a brittle fashion, which starts from the center of the pillar [29]. The models show that the blasting had a more considerable effect on pillars with higher W/H ratios. With a blast damage of 1 m and a disturbance factor of 0.75, the decrease in pillar strength was observed to be about 7% for a W/H ratio of 1, 16% for a W/H ratio of 1.5, 22% for a W/H ratio of 2.0, and 27% for a W/H ratio of 2.5.
It was observed that the 16% decrease in pillar strength of a pillar with a W/H ratio of 1.5 gives it an equivalent pillar strength to a pillar with a W/H ratio of 1.0 with no blast effect. Similarly, a 22% decrease in the pillar strength of a pillar with a W/H ratio of 2.0 gives it the same pillar strength as a pillar with a W/H ratio of 1.5 with no blast effect. Therefore, to account for blasting with a disturbance factor of 0.75 and a damage thickness of 1 m, 1 m could be added along all sides of the pillar. These normalized pillar strengths can be used to derive the thickness of the sides that must be left on the pillars to account for blasting.
Damage caused by blasting on the excavation has been considered as a technique to combat excessive stress accumulated near underground excavations in highly stressed rock masses [15,34,35,36]. Krauland and Soder [37] suggested that destressing and preconditioning practices can strategically create fractures in the rock mass near excavation to soften the rock locally to transfer the stress away from the excavation boundaries. The models of blast damage show a similar effect on the pillars.
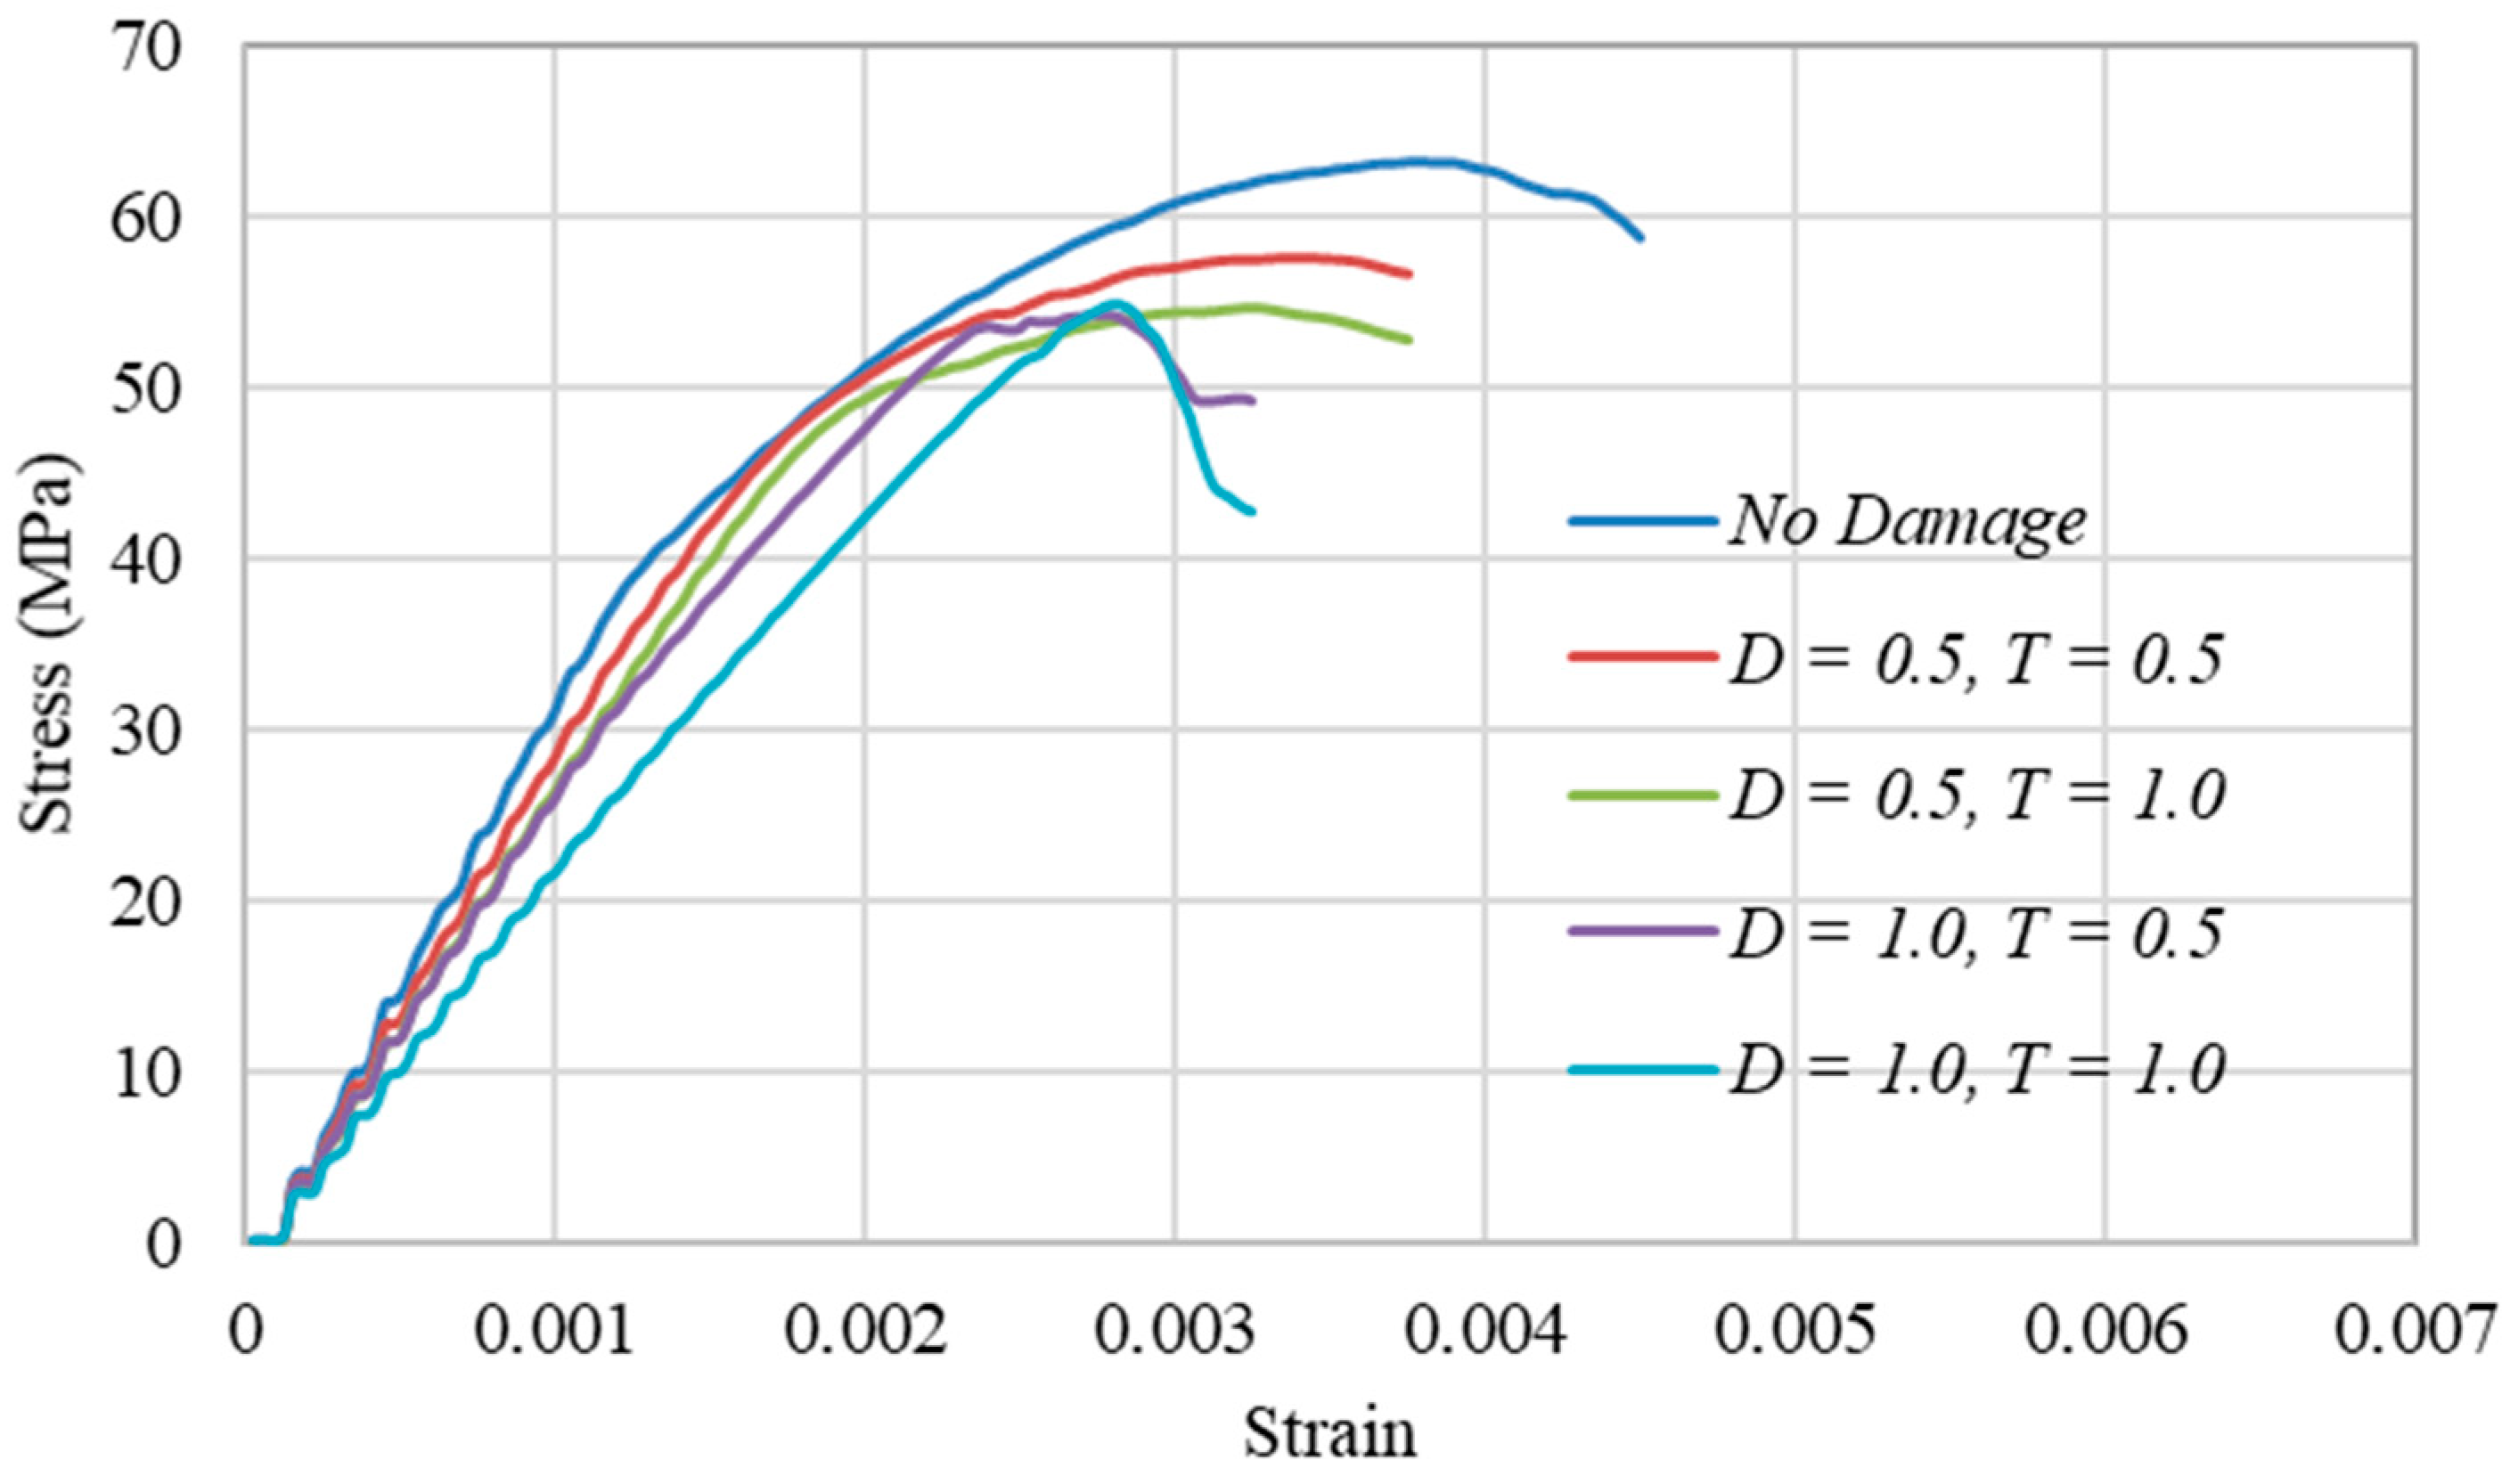
For this, five models were analyzed with a W/H ratio of 1.5 and five different blast damage combinations: D = 0 and T = 0 m, D = 0.5 and T = 0.5 m, D = 0.5 and T = 1.0 m, D = 1.0 and T = 0.5 m, and D = 1.0 and T = 1.0 m. The stress strain curve of these models is shown in Figure 7. It can be observed that the modulus of the pillars decreases with an increase in disturbance factor and damage thickness. The stress strain curve of the pillar with no damage shows a point (40 MPa) where the modulus changes which can be denoted as the pillar transitioning from brittle failure to shear failure. This transition happens in the pillar from blast damage with a disturbance factor of 0.5 at 48 MPa and blast damage with a disturbance factor of 1.0 at 54 MPa. It can be deduced that with the increase in blast damage, the tendency of the brittle failure increases in the pillars. Finally, it can be observed that the pillar with a W/H ratio of 1.5, disturbance factor of 1.0, and damage thickness of 1 m undergoes complete brittle failure.
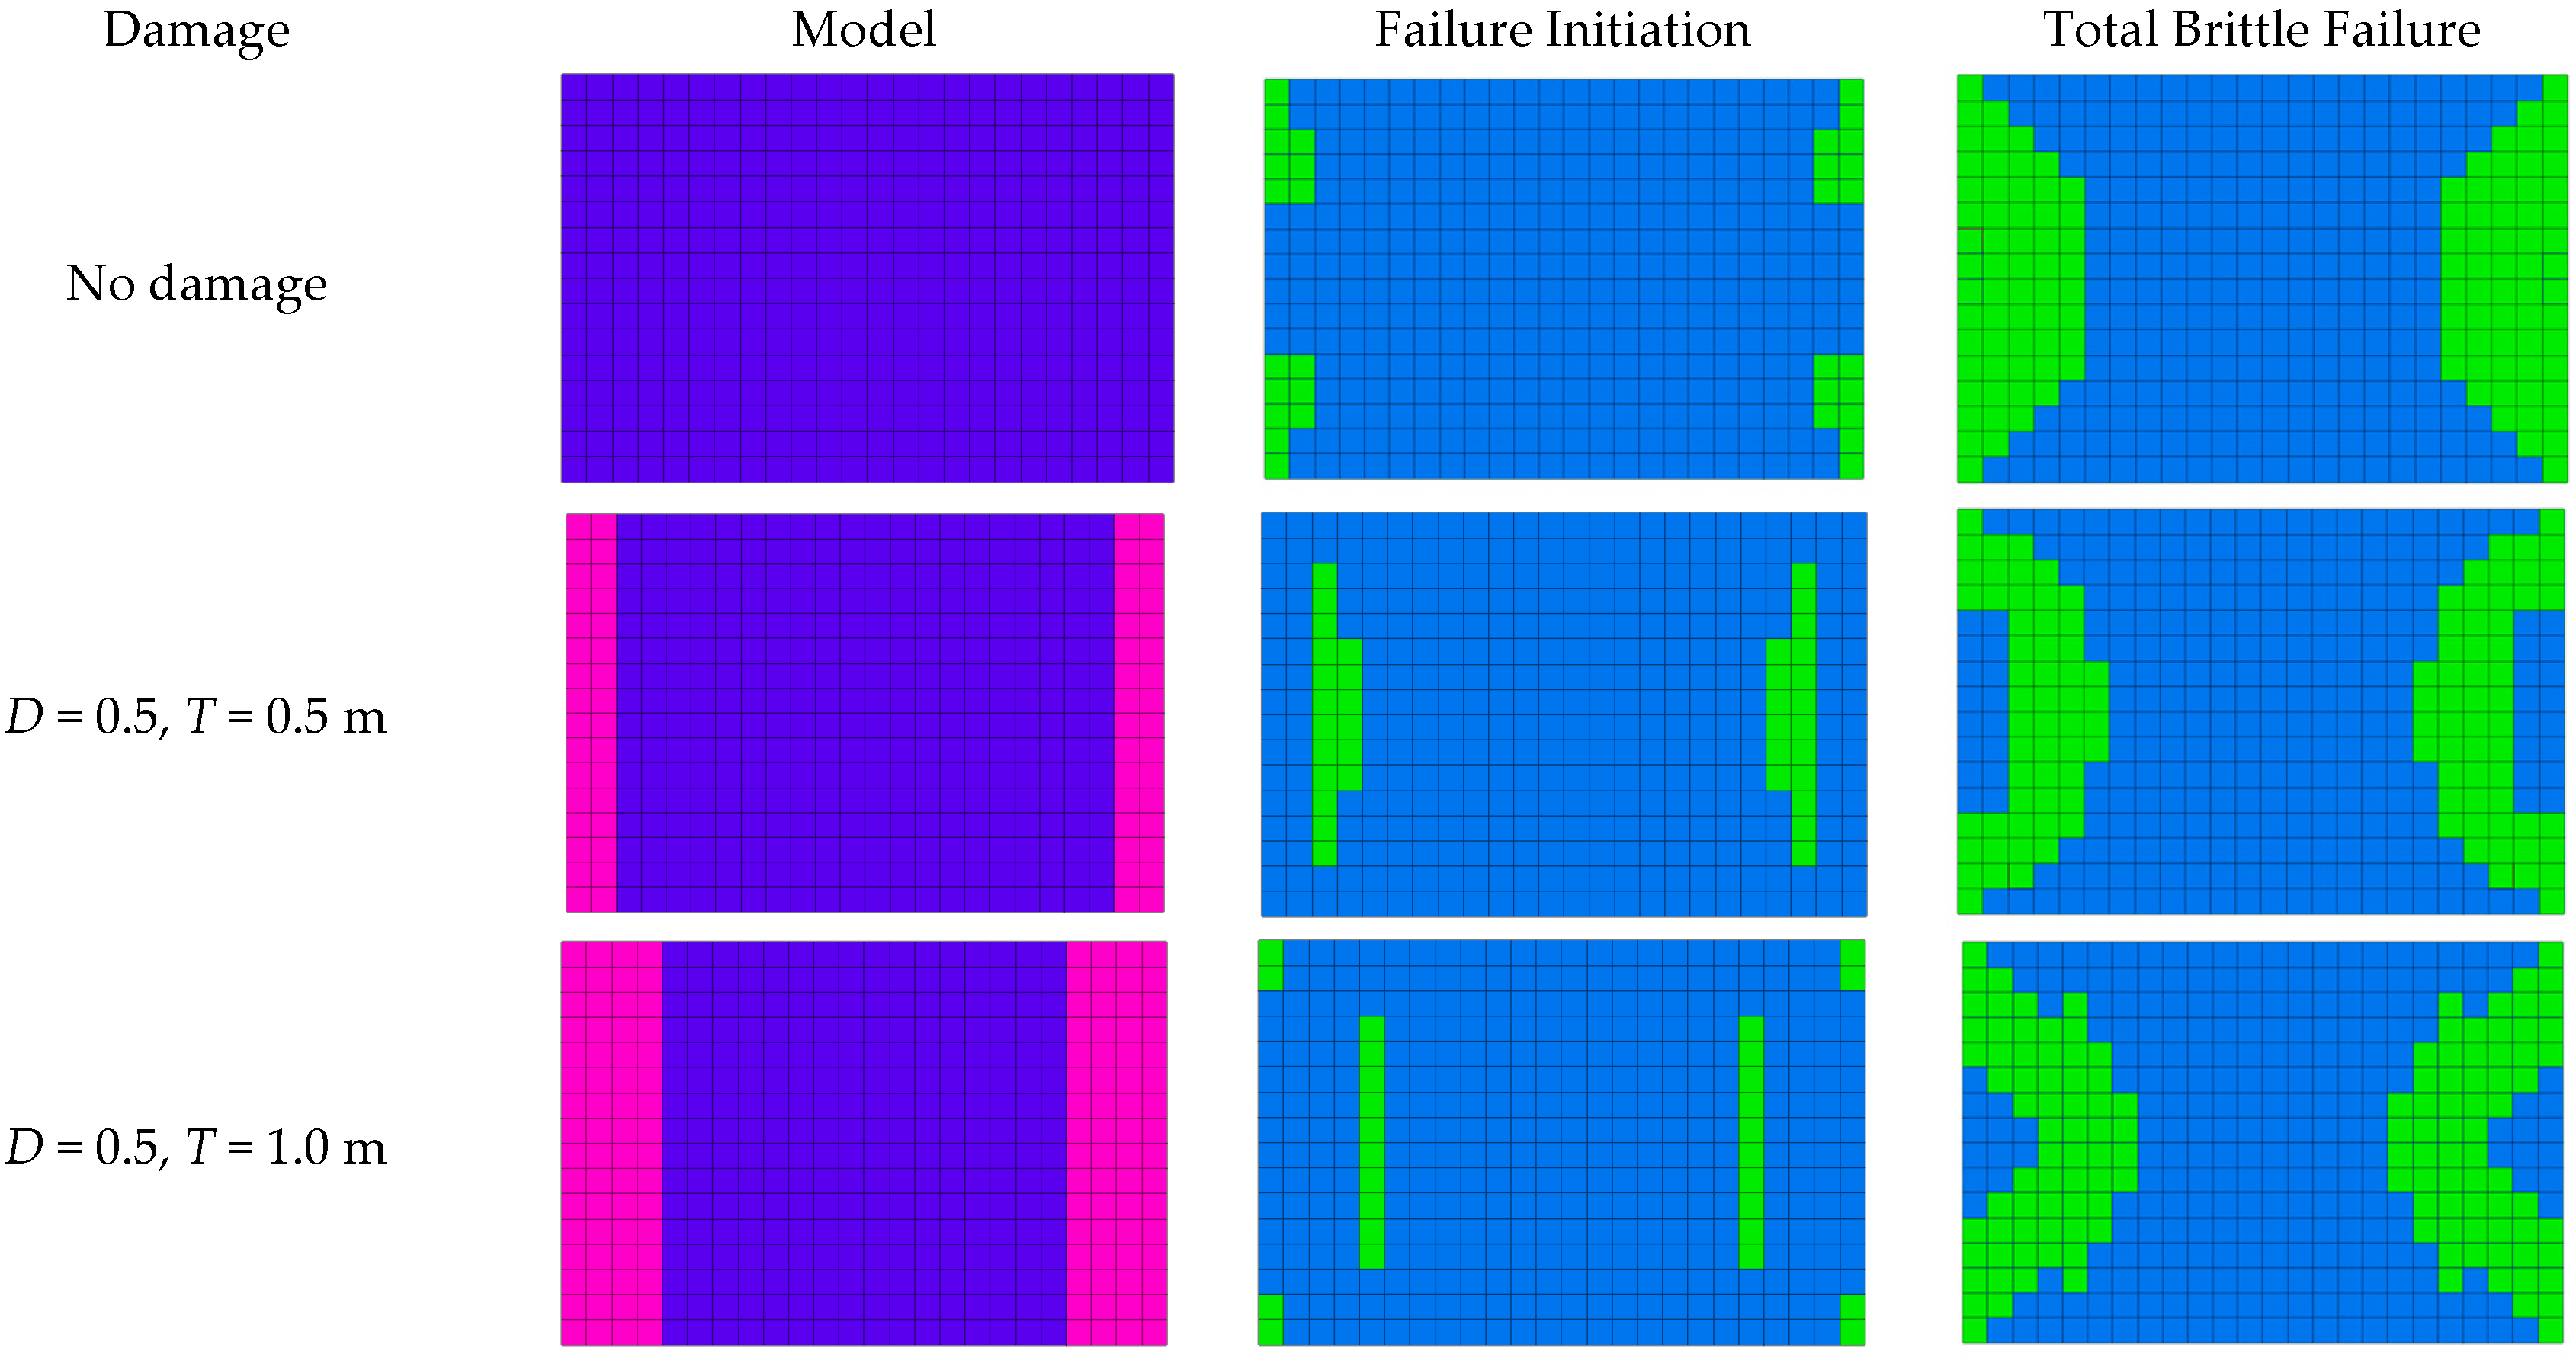
To understand the failure behavior of the pillars with blast damage, failure regions were observed from the plastic state plot to better describe the regions undergoing plastic flow. These plots can be used to determine which regions have or are undergoing shear and tensile failure. The plots show the failure regions at the central section of the pillar, as shown in Figure 8. Three points on the stress strain curve in Figure 7 were selected that correspond to the plastic state plots in Figure 8. The points were selected at the following stages: before loading began, at the pillar failure initiation, and at the transition point between brittle and shear failure. The before-loading point shows the pillar with massive rock and degraded rock in the model, while the failure-initiation point shows the crack initiation in the pillar, and the transition point shows the total brittle failure in the pillar.
Based upon the plots in Figure 8b–d, several observations were made. In Figure 8b, the model plots have been extrapolated, showing massive rock mass and degraded rock mass at the central section of the pillar. Initially, failure regions were analyzed in the pillar with no damage. In the pillar without damage, the failure starts at the sides of the pillar (Figure 8c) and propagates through the whole side into brittle failure (Figure 8d). In Esterhuizen et al. [29], similar brittle failure has been described in the pillars at higher W/H ratios.
Next, the failure regions were analyzed in pillars with a disturbance factor of 0.5 and a blast damage thickness of 0.5 m. Figure 8b shows the central section of the pillar with two zones on each side as the degraded rock in the 0.5 m-damage-thickness model. In Figure 8c, it can be observed that the failure initializes in the massive rock, which can be ascribed to softening of the degraded rock due to blasting and the stresses getting transferred to the massive rock. In Figure 8d, it can be observed that the total brittle failure in the pillar has increased when compared to that of the pillar without damage, which can be attributed to increase in the transition point from brittle failure to shear failure to 48 MPa. This can therefore decrease the region for shear failure which ultimately decreases the strength of the pillar with blast damage.
For a pillar with a disturbance factor of 0.5 and a damage thickness of 1.0 m, Figure 8b shows the four zones on each side with degraded rock mass that account for 1.0 m of blast damage thickness. In Figure 8c, it can be observed that the failure initiation occurs in massive rock, as well as in the degraded rock, which can be attributed to the higher stress-causing fracture initiation in both rock masses. The softening effect on the degraded rock due to blasting is evident, while as the massive rock is far away from the pillar boundary, the stresses required to initiate the fracture in the pillar affect both the massive rock mass and the degraded rock mass. In Figure 8d, at the transition point of brittle to shear failure in the pillar, it can be observed that the total brittle failure is more than that in the pillar without damage or the pillar with a disturbance factor of 0.5 and a damage thickness of 0.5 m. As the brittle failure in the pillar increases, the region undergoing shear failure decreases, which in turn decreases the overall strength of the pillar.
Next, the failure regions were analyzed in a pillar with a disturbance factor of 1.0 and a damage thickness of 0.5 m, which is shown in Figure 8b. In Figure 8c, it can be observed that the failure initiates in the massive rock mass due to the softening effect in the degraded rock mass caused by blasting where stresses get transferred to the massive rock. In Figure 8d, it is observed that the degraded rock mass is so weak that it does not provide any confinement to the core, which increases the brittle failure of the pillar and decreases the region for shear failure. Therefore, the overall strength of the pillar decreases significantly.
The pillar model with a disturbance factor of 1.0 and a damage thickness of 1.0 m is shown in Figure 8b. It can be observed that the fracture initiation is evident in the massive rock mass, which is beyond the very weak degraded rock mass. Figure 8c shows that the total brittle failure in the pillar is more than any of the pillars analyzed above. Due to the very low confinement, this pillar, with a W/H ratio of 1.5, disturbance factor of 1.0 and damage thickness of 1.0 m, has a lower strength than that of a pillar with a W/H ratio of 1.0.
4.2. Effect of Blast Damage on Pillar Height
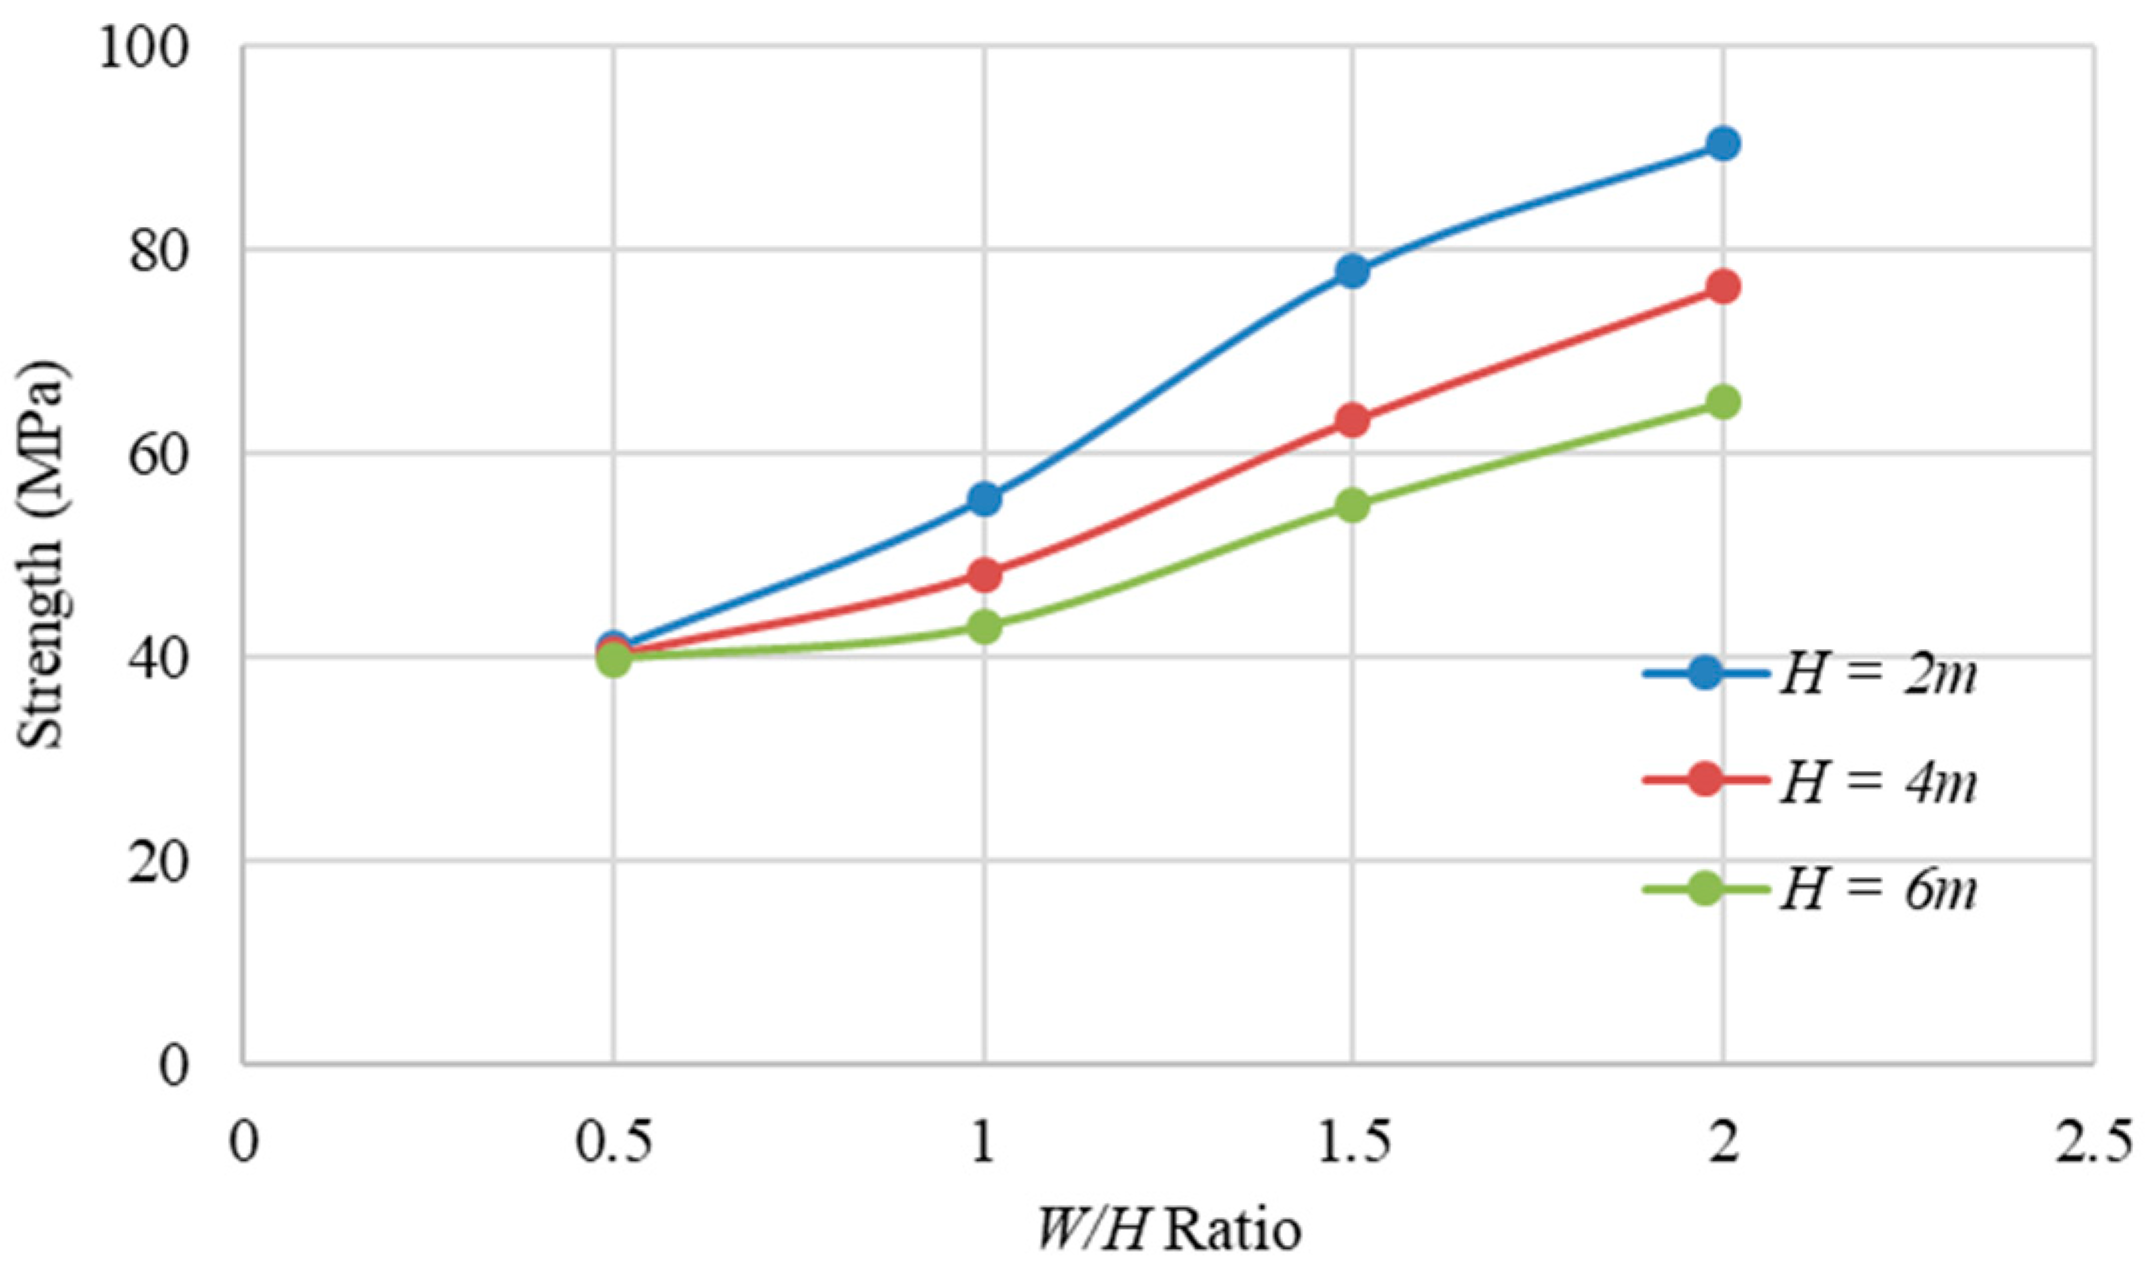
All the models discussed to this point assumed a pillar height of 4 m. The effect of blast damage on a pillar with a W/H ratio of 1.5 at different pillar heights was also analyzed. Figure 9 shows pillars at three different heights (2 m, 4 m, and 6 m), each with a damage thickness of 0.5 m. Since this now incorporates different pillar heights, the strength of the normal pillars was analyzed at different pillar W/H ratios. Figure 10 shows that shorter pillar heights represent higher strength, while larger pillar heights lead to lower strength, in accordance with Kaiser [24].
The pillars with a W/H ratio of 1.5 and a damage factor (D) of 0.5 were analyzed at blast thicknesses (T) of 0.25 m, 0.5 m, 0.75 m, and 1 m. Figure 11 shows that the blast damage has a significant effect on pillars with lower pillar heights. It was also observed that at a blast thickness of 1.0 m, the strength of the pillars with different heights converges to a single point with 10% deviation.
4.3. Effect of Blast Damage on Inclined Pillars
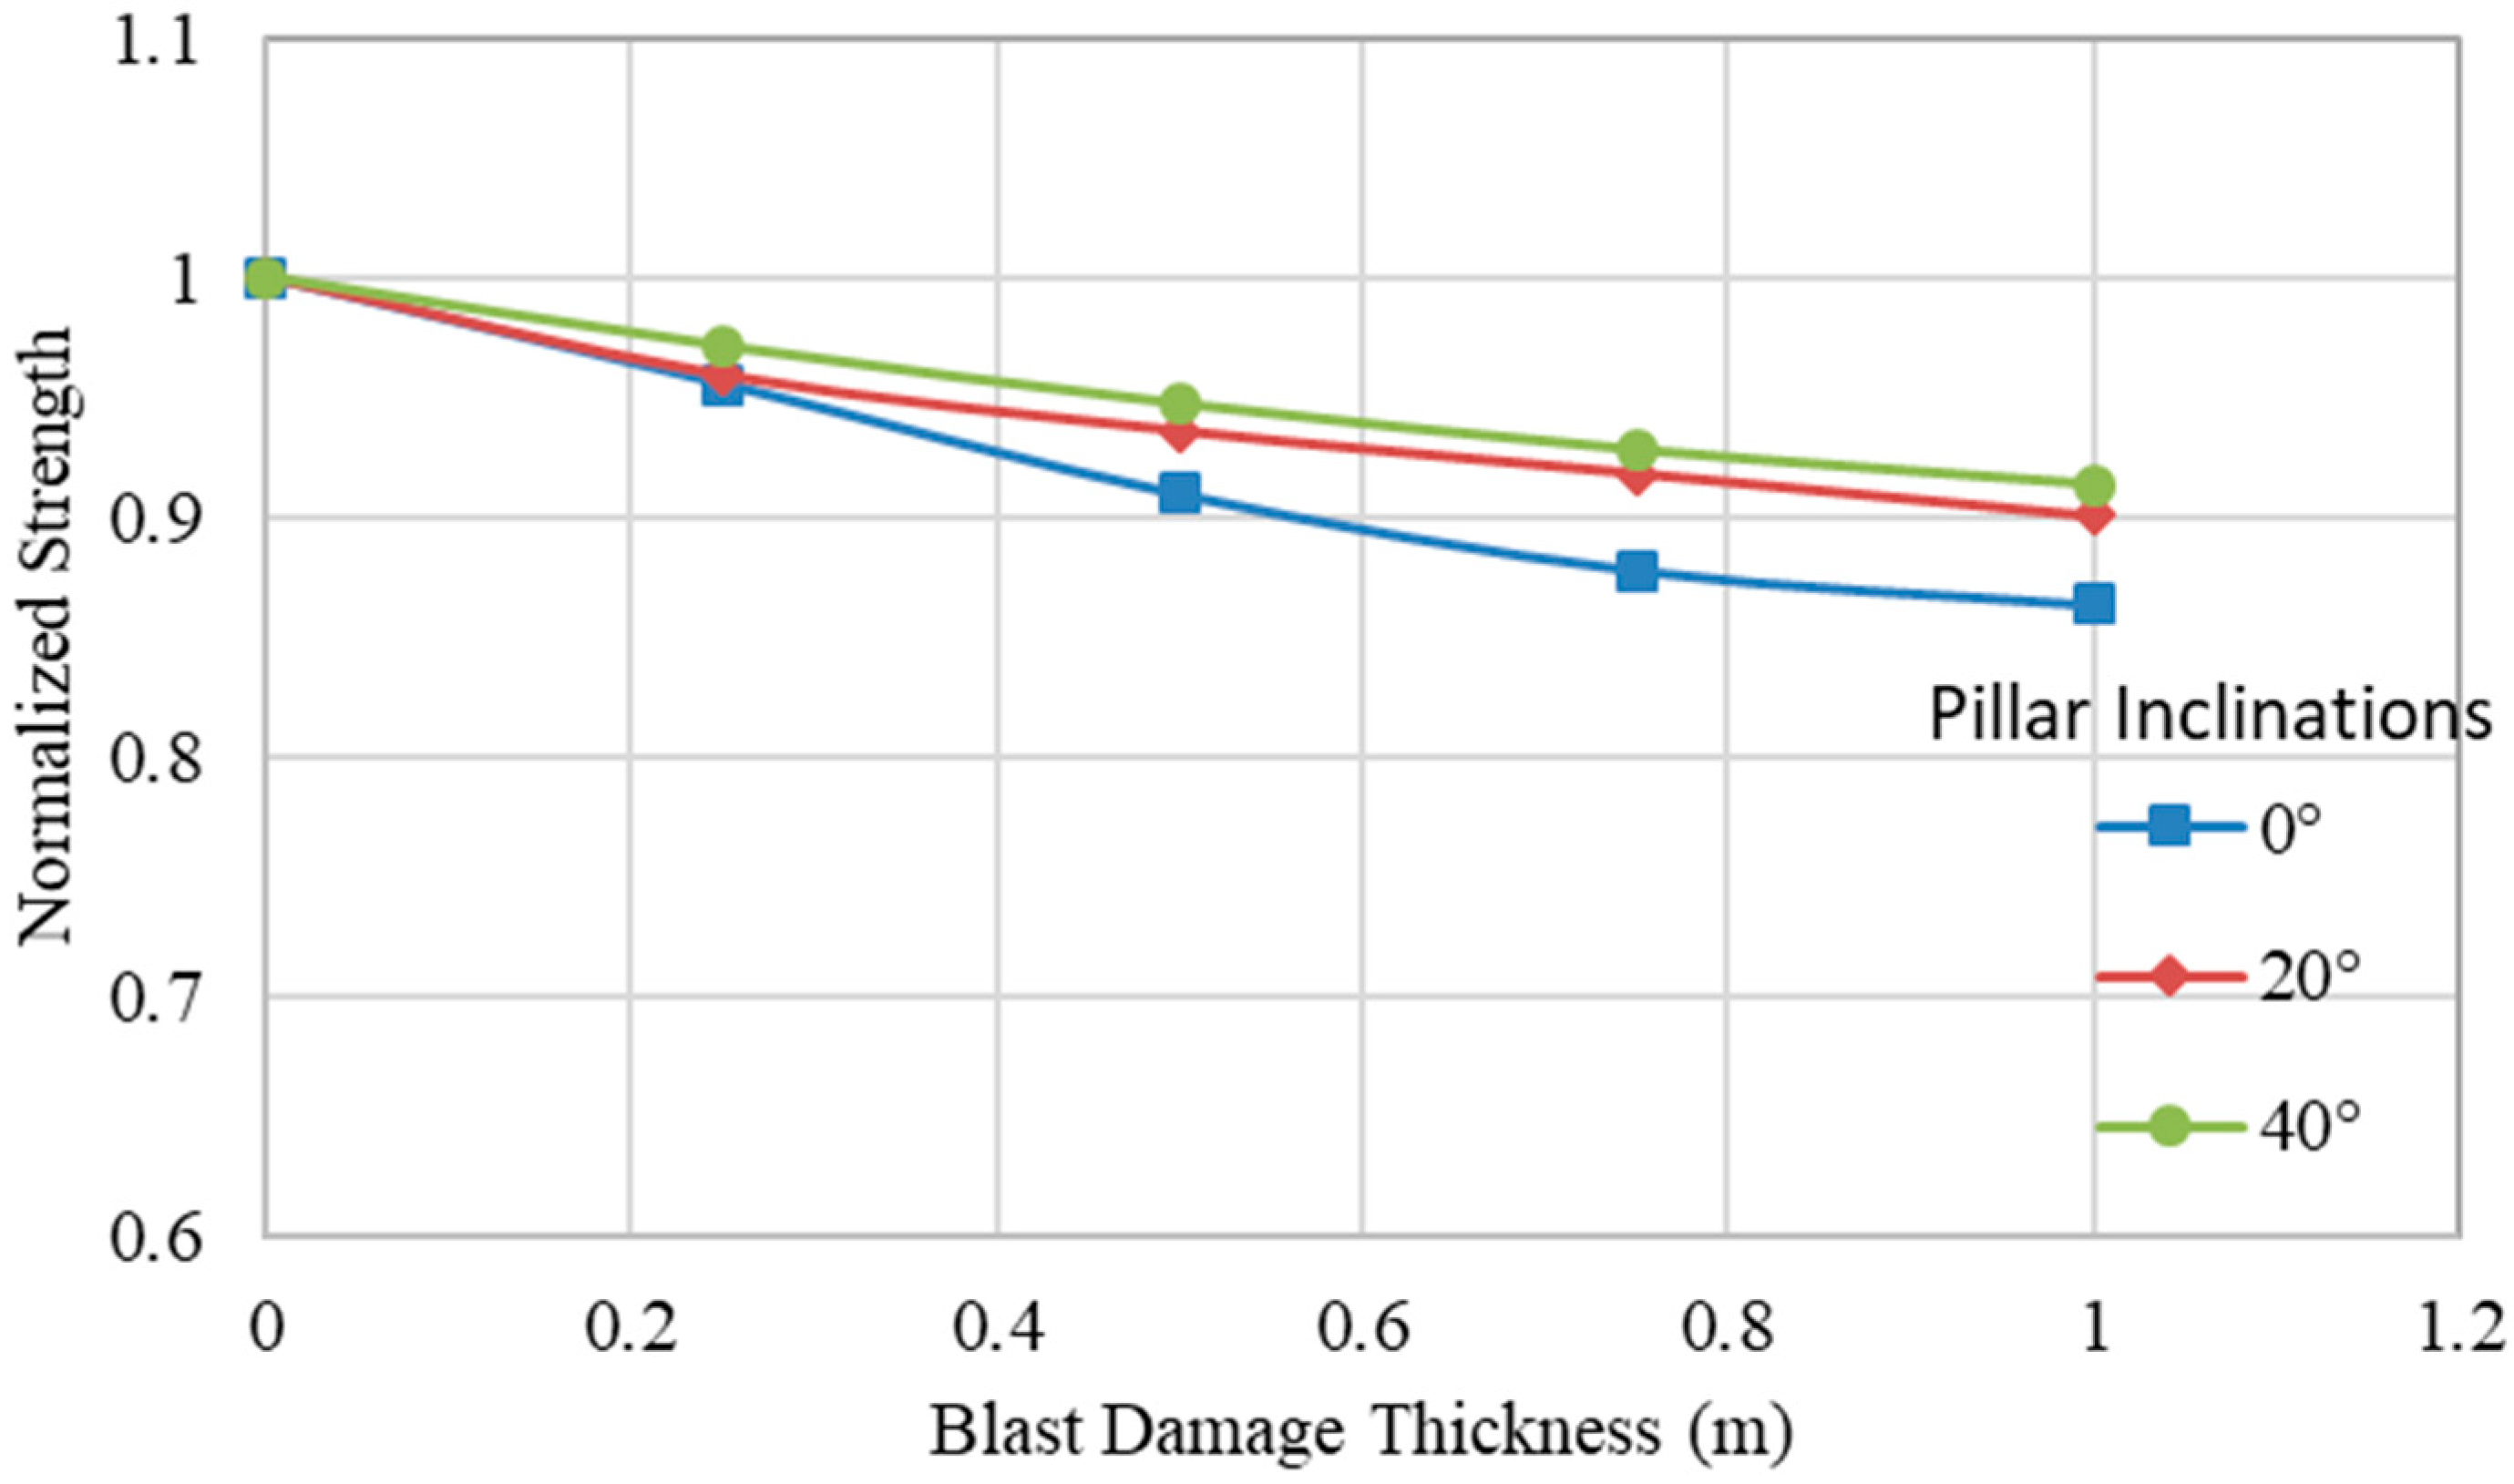
The effect of blast damage on inclined pillars (Figure 12) was evaluated next. The strength of the inclined pillars with a height of 4 m and a W/H ratio of 1.5 were evaluated with a blast damage factor of 0.5 at different blast thicknesses. It was determined that the strength of the inclined pillars is less susceptible to blast damage. Figure 13 shows the decrease in strength of the pillars at 0, 20, and 40 degrees of inclination with a W/H ratio of 1.5 and a damage factor of 0.5 at varying blast thicknesses. Given that that inclined pillars have less strength than vertical pillars, the 10% decrease in pillar strength because of blasting in inclined pillars would lead to significant strength reduction.
5. Conclusions
Based on the investigation of blast damage on hard rock pillars, the following conclusions can be drawn.
Damage factor and damage thickness are important features that need to be considered when evaluating pillar strength. The decrease in pillar strength is considerable in pillars with W/H ratios higher than 1.0. Pillar strength can decrease up to 7% for a W/H ratio of 1.0, 16% for a W/H ratio of 1.5, 22% for a W/H ratio of 2.0, and 27% for a W/H ratio of 2.5.
Assuming a constant blast damage in the region, the hard rock mine pillars with larger W/H ratios would have more strength than that of the pillars with smaller W/H ratios.
The numerical models with a W/H ratio of 0.5 show that pillar failure starts at the center of the pillar, which is also evident with the pillars with damage and a W/H ratio 0.5. Therefore, the slender pillars are prone to strain bursting with or without the damage due to blasting. As the pillar failure occurs from the center of the pillar, the strength of the pillar remains similar.
Numerical models revealed that the brittle failure plays an important role in defining the strength of the pillars based on the blast damage zone. Initiation of the brittle failure beyond the damaged zone, resulting in reduction of core, causes failure at a relatively low brittle failure in the pillar, resulting in loss of pillar strength.
Numerical model results show that the degraded rock modulus in the blast damage zone is a significant parameter in softening the rock, resulting in transfer of the stresses inside the pillar. The blast damage zone, which is itself a critical factor, leads to an increase of the brittle failure in the pillar, resulting in loss of pillar strength.
Pillar height is an essential dimension in determining the strength of the pillars. Varying blast thicknesses on pillars with different heights at constant W/H ratios has a distinct impact on the reduction of pillar strength. Blast damage causes a substantial reduction in the strength of pillars with smaller heights and insignificant reduction for pillars with larger heights.
The strength of inclined pillars is less susceptible to blast damage. Blast damage on the dip sides of inclined pillars reduces the pillar strength more significantly than blast damage on the normal sides. When compared to vertical pillars, the inclined pillars have lower strength at a constant W/H ratio.
A methodology has been presented for analyzing the strength and failure characteristics of hard rock pillars. This methodology can help engineers generate models to analyze the failure mechanisms in these pillars due to blasting damage.
Considering the effect of blast damage on pillars could enhance mine safety and improve stability and, possibly, profitability.
Author Contributions
K.V.J. devised and presented the original idea of the research and prepared the manuscript. A.J.S.S. and M.S. reviewed the manuscript and provided input on the writing of parts of the manuscript.
Funding
This research received no external funding.
Conflicts of Interest
The authors declare no conflicts of interest.
References
- Oriad, L.L. Blasting effect and their control. In Underground Mining Methods Handbook; Hustrulid, W., Ed.; AIME: New York, NY, USA, 1982. [Google Scholar]
- Forsyth, W.W.; Moss, A.E. Investigation of Development Blasting Practices; Canmet Mrl: Hamilton, ON, Canada, 1991. [Google Scholar]
- Yu, T.R.; Vongpaisal, S. New blast damage criteria for underground blasting. CIM Bull. 1996, 89, 139–145. [Google Scholar]
- Warneke, J.; Dwyer, J.G.; Orr, T. Use of a 3D scanning laser to quantify dift geometry and overbreak due to blast damage in underground manned entries. In Rock Mechanics: Meeting Society’s Challenges and Demands; Eberhardt, E., Stead, D., Morrison, T., Eds.; Taylor & Francis Group: London, BC, Canada, 2007. [Google Scholar]
- Kutter, H.K.; Fairhurst, C. On the fracture process in blasting. Int. J. Rock Mech. Min. Sci. 1971, 8, 181–202. [Google Scholar] [CrossRef]
- Wilson, W.H.; Holloway, D.C. Fragmentation studies in instrumented concrete models. In Proceedings of the International Congress on Rock Mechanics, Montreal, QC, Canada, 30 August–3 September 1987. [Google Scholar]
- Djordjevic, N. Two-component model of blast fragmentation. In Proceedings of the International Symposium on Rock Fragmentation by Blasting, Johannesburg, South Africa, 8–12 August 1999. [Google Scholar]
- Olsson, M.; Ouchterlony, F. New Formula for Blast Induced Damage in the Remaining Rock; SveBeFo Report No. 65; Swedish Rock Engineering Research: Stockholm, Sweden, 2003. [Google Scholar]
- Fleetwood, K.G. Near-Field Blast Vibration Monitoring and Analysis for Prediction of Blast Damage in Sublevel Open Stoping. Ph.D. Dissertation, Curtin University, Kalgoorlie, WA, USA, 2010. [Google Scholar]
- Ouchterlony, F.; Olsson, M.; Bergqvist, I. Towards new Swedish recommendations for cautious perimeter blasting. Int. J. Blasting Fragmentation 2010, 6, 235–261. [Google Scholar] [CrossRef]
- Hoek, E.; Carranza Toress, C.; Corkum, B. Hoek-Brown failure criterion—2002 edition. In Proceedings of the 5th North American Rock Mechanics Symposium and 17th Tunneling Association of Canada Conference, Toronto, ON, USA, 7–10 July 2002. [Google Scholar]
- Sharifzadeh, M.; Pal, M. Quantification of rock mass disturbance using rock-mass property, rock characterization and blast characterization in underground hard-rock. In Proceedings of the 8th Asian Rock Mechanics Symposium, Sapporo, Japan, 14–16 October 2014. [Google Scholar]
- Torbica, S.; Lapčević, V. Estimating extent and properties of blast-damaged zone around underground excavations. Rev. Esc. Minas 2015, 68, 441–453. [Google Scholar] [CrossRef] [Green Version]
- Shen, B.; Barton, N. Disturbed zone around tunnels in jointed rock masses. Int. J. Rock Mech. Min. Sci. 1997, 34, 117–125. [Google Scholar] [CrossRef]
- Saiang, D. Blast-Induced Damage: A Summary of SveBeFo Investigations; Luleå Tekniska Universitet: Luleå, Sweden, 2008. [Google Scholar]
- Mitelman, A.; Elmo, D. Modelling of blast-induced damage in tunnels using a hybrid finite-discrete numerical approach. Rock Mech. Geotech. Eng. 2014, 6, 565–573. [Google Scholar] [CrossRef]
- Bahrani, N.; Suorineni, F.T.; Kaiser, P.K. Stability Analysis of Rib Pillars in Mechanized and Drill and Blast Excavations Using Numerical Modeling. In Proceedings of the MEMO’2010, Sudbury, ON, Canada, 24–27 October 2010. [Google Scholar]
- Lunder, P.J. Hard Rock Pillar Strength Estimation an Applied Approach. Master’s Thesis, University of British Columbia, Vancouver, BC, Canada, 1994. [Google Scholar]
- Hedley, D.G.F.; Grant, F. Stope and pillar design for the Elliot lake uranium mines. Can. Inst. Min. Metall. Bull. 1972, 65, 37–44. [Google Scholar]
- Potvin, Y.; Hudyma, M.; Miller, H.D.S. Rib pillar de sign in open stoping. Can. Inst. Min. Metall. Bull. 1989, 82, 31–36. [Google Scholar]
- Esterhuizen, G.S.; Dolinar, D.R.; Ellenberger, J.L. Pillar strength and design methodology for stone mines. In Proceedings of the 27th International Conference on Ground Control in Mining, Morgantown, WV, USA, 29–31 July 2008. [Google Scholar]
- Elmo, D.; Stead, D. An integrated numerical modelling—Discrete fracture network approach applied to the characterisation of rock mass strength of naturally fractured pillars. Rock Mech. Rock Eng. 2010, 43, 3–19. [Google Scholar] [CrossRef]
- Hoek, E.; Diederichs, M.S. Empirical estimation of rock mass modulus. Int. J. Rock Mech. Min. Sci. 2006, 43, 203–215. [Google Scholar] [CrossRef]
- Kaiser, P.K.; Kim, B.; Bewick, R.P.; Valley, B. Rock strength and depth and implications for pillar design. In Proceedings of the 5th International Seminar on Deep and High Stress Mining, Santiago, Chile, 6–8 October 2010. [Google Scholar]
- Ayres da Silva, L.A.; Ayres da Silva, A.L.M.; Sansone, E.C. The shape effect and rock mass structural control for mine pillar design. In Proceedings of the ISRM International Symposium, EUROCK, Wroclaw, Poland, 23–26 October 2013. [Google Scholar]
- Suorineni, F.T.; Mgumbwa, J.J.; Kaiser, P.K.; Thibodeau, D. Mining of orebodies under shear loading Part 1—Case histories, Mining Technology. Trans. Inst. Min. Metall. A 2011, 120, 138–147. [Google Scholar]
- Suorineni, F.T.; Mgumbwa, J.J.; Kaiser, P.K.; Thibodeau, D. Mining of orebodies under shear loading Part 2—Failure modes and mechanisms, Mining Technology. Trans. Inst. Min. Metall. A 2014, 123, 240–249. [Google Scholar]
- Itasca Consulting Group. Fast Lagrangian Analysis of Continua in 3Dimensions; Itasca Consulting Group: Minneapolis, MN, USA, 2016. [Google Scholar]
- Esterhuizen, G.S. An evaluation of the strength of slender pillars. Trans. Soc. Min. Metall. Explor. Inc. 2006, 320, 69–76. [Google Scholar]
- Lu, J.; Ray, A.; Morsey, K.; Peng, S. Effects of rock/coal interface property on coal pillar strength. In Proceedings of the 27th International Conference on Ground Control in Mining, Morgantown, WV, USA, 29–31 July 2008. [Google Scholar]
- Perry, K.A.; Unrug, K.F.; Harris, K.W.; Raffaldi, M.J. Influence of roof/floor interface on coal pillar performance. In Proceedings of the 32nd International Conference on Ground Control in Mining, Morgantown, WV, USA, 30 July–1 August 2013. [Google Scholar]
- Martin, C.D.; Kaiser, P.K.; McCreath, D.R. Hoek–Brown parameters for predicting the depth of brittle failure around tunnels. Can. Geotech. J. 1999, 36, 136–151. [Google Scholar] [CrossRef]
- Kaiser, P.K.; Diederichs, M.S.; Martin, C.D.; Sharp, J.; Steiner, W. Underground works in hard rock tunnelling and mining. In Proceedings of the GeoEng2000, Melbourne, Australia, 19–24 November 2000. [Google Scholar]
- Roux, A.J.A.; Leeman, E.R.; Denkhaus, H.G. Destressing: A Means of Ameliorating Rockburst Conditions. Part I: The Concept of Destressing and Results Obtained from Its Application. J. S. Afr. Inst. Min. Metall. 1958, 59, 66–68. [Google Scholar]
- Salamon, M.G.D. Rockburst hazard and the fight for its alleviation in South African gold mines. In Rockbursts: Prediction and Control; IMM: London, UK, 1983. [Google Scholar]
- Andrieux, P.P.; Brummer, R.K.; Liu, Q.; Simser, B.P.; Mortazavi, A. Large scale panel destress blast at Brunswick mine. J. Can. Inst. Min. Metall. Pet. 2003, 96, 78–87. [Google Scholar]
- Krauland, N.; Söder, P.E. Rock Stabilisation by Destress Blasting Experiences from Boldien Mines, Rock Mechanics Meeting; BeFo: Stockholm, Sweden, 1988. [Google Scholar]
Figure 1.
Distinction between the over-break and blast damage [4].
Figure 1.
Distinction between the over-break and blast damage [4].

Figure 2.
FLAC3D pillar model.
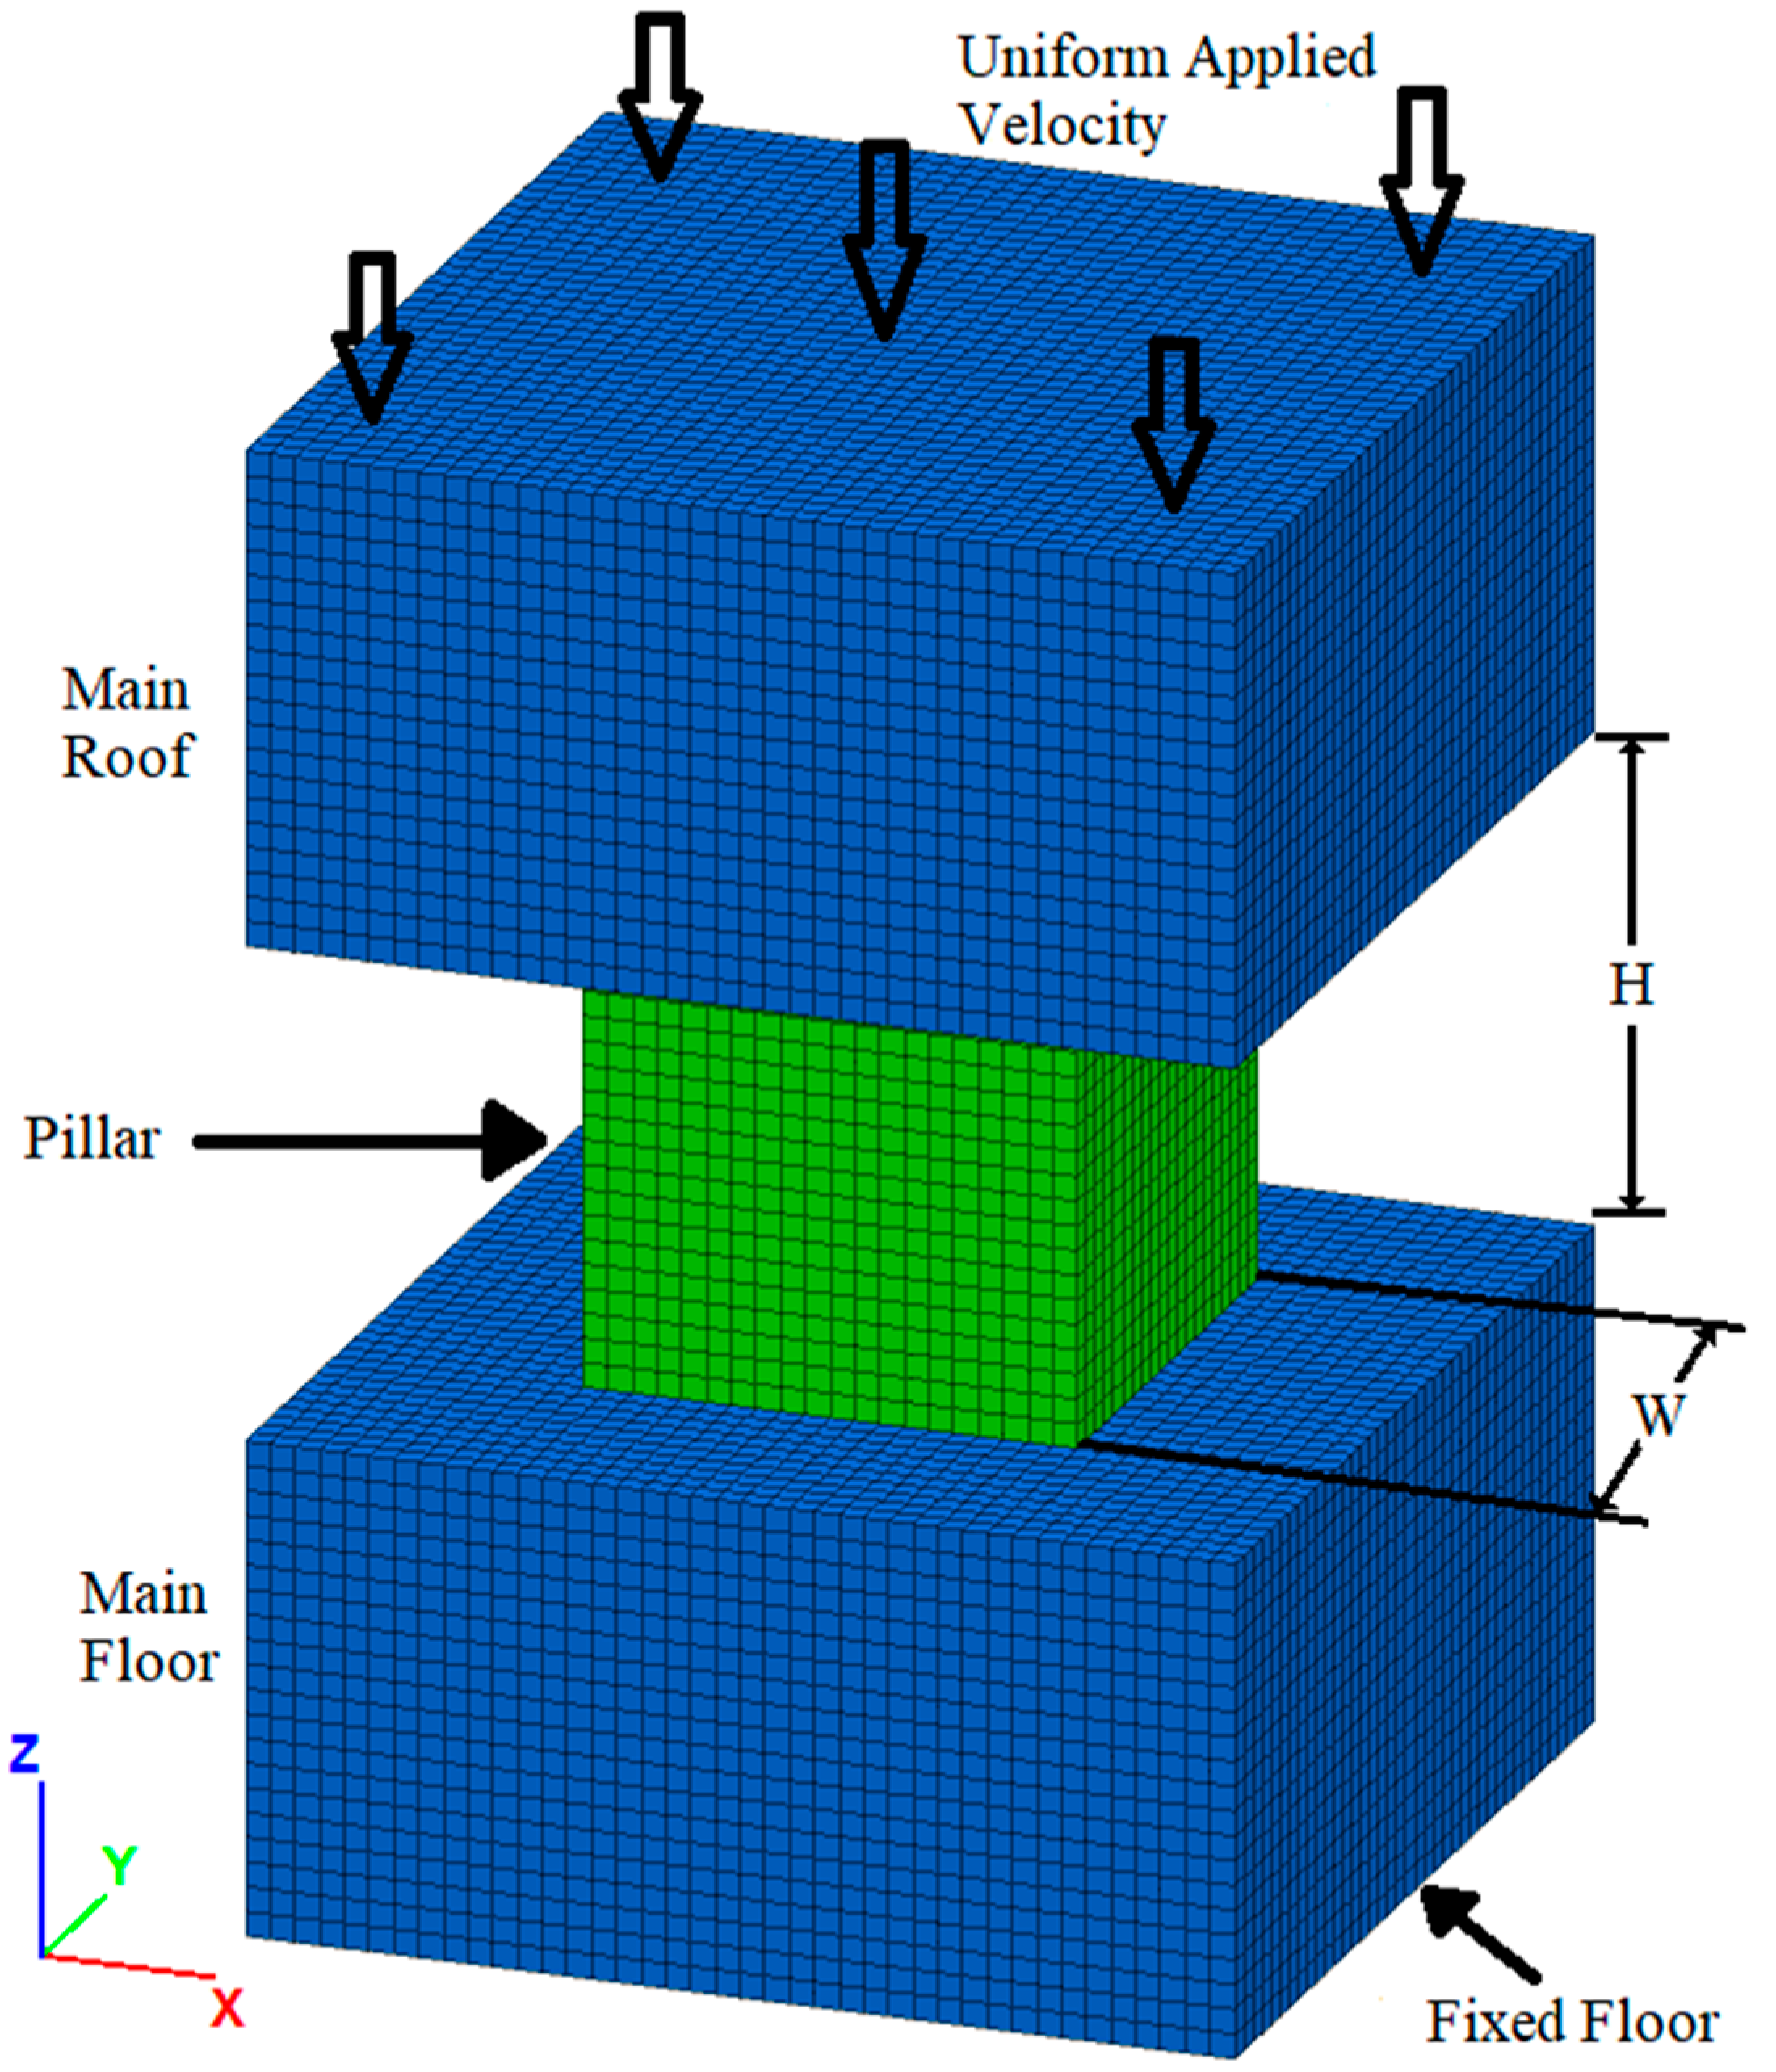
Figure 3.
Stress strain graphs (a) At different loading rates and (b) At different mesh sizes.
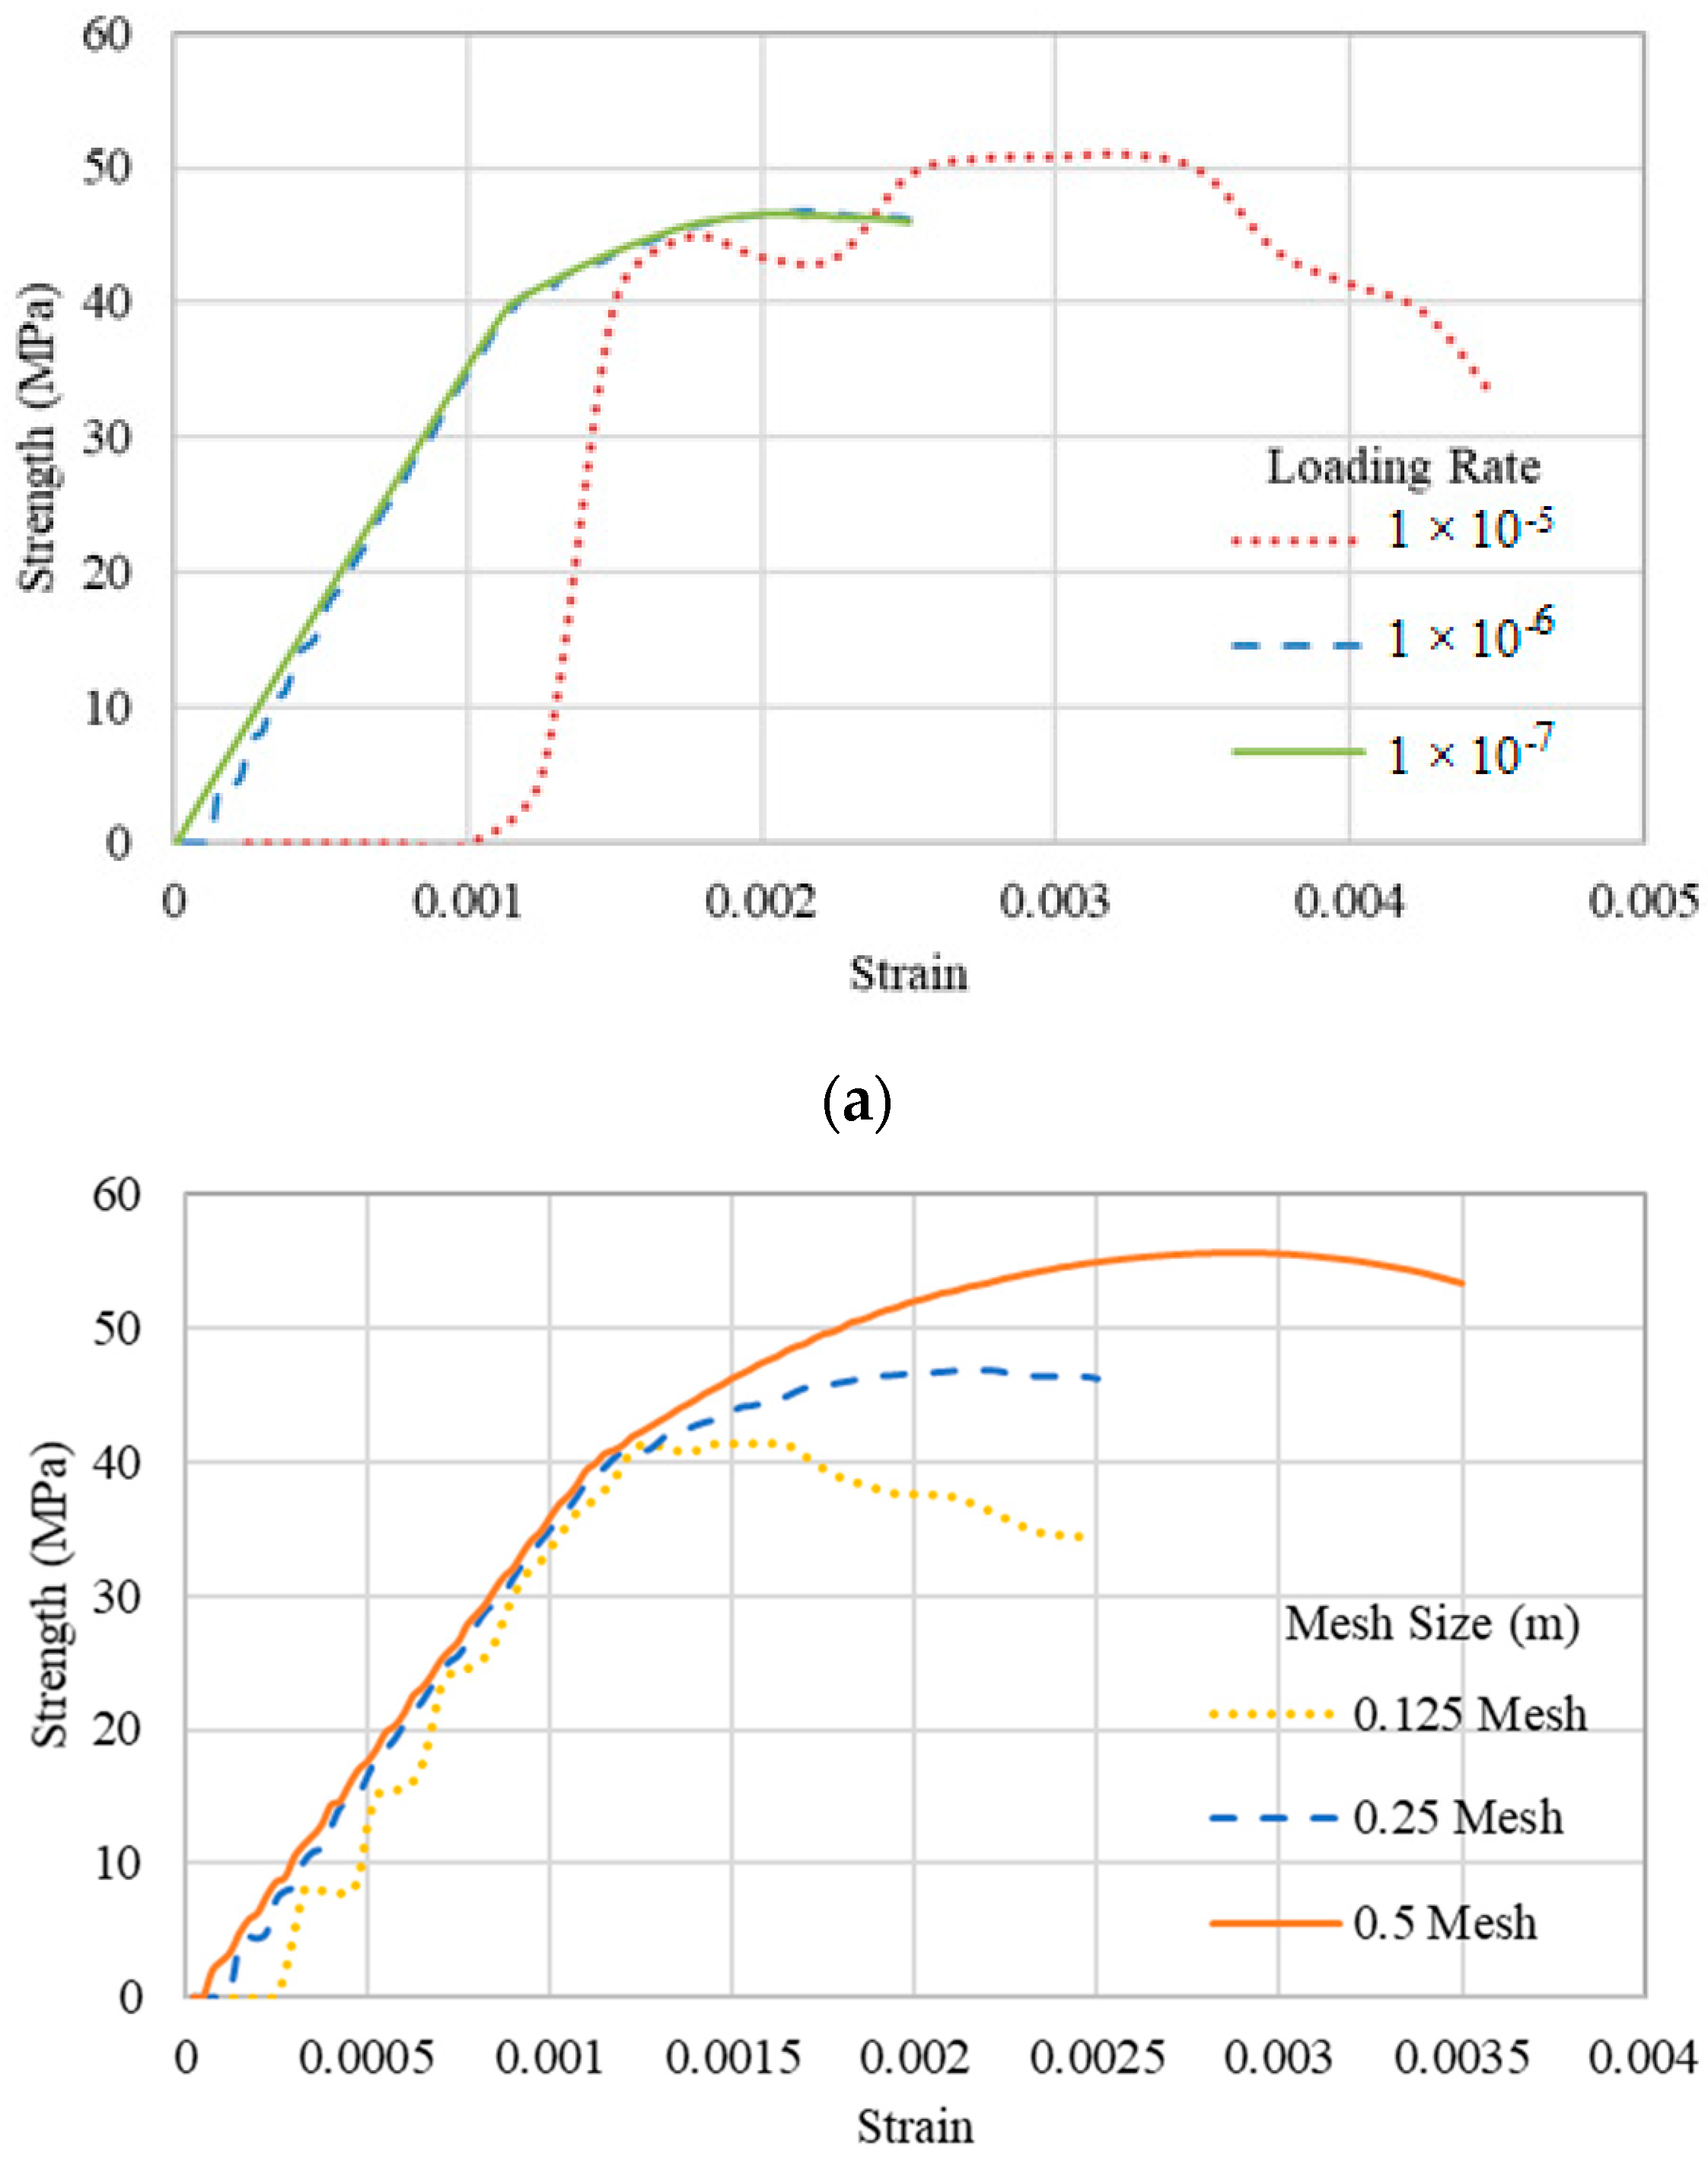
Figure 4.
Pillar model with massive rock in the core and degraded rock on the sides.

Figure 5.
Flowchart indicating numerical modeling procedure in FLAC3D to simulate pillars.
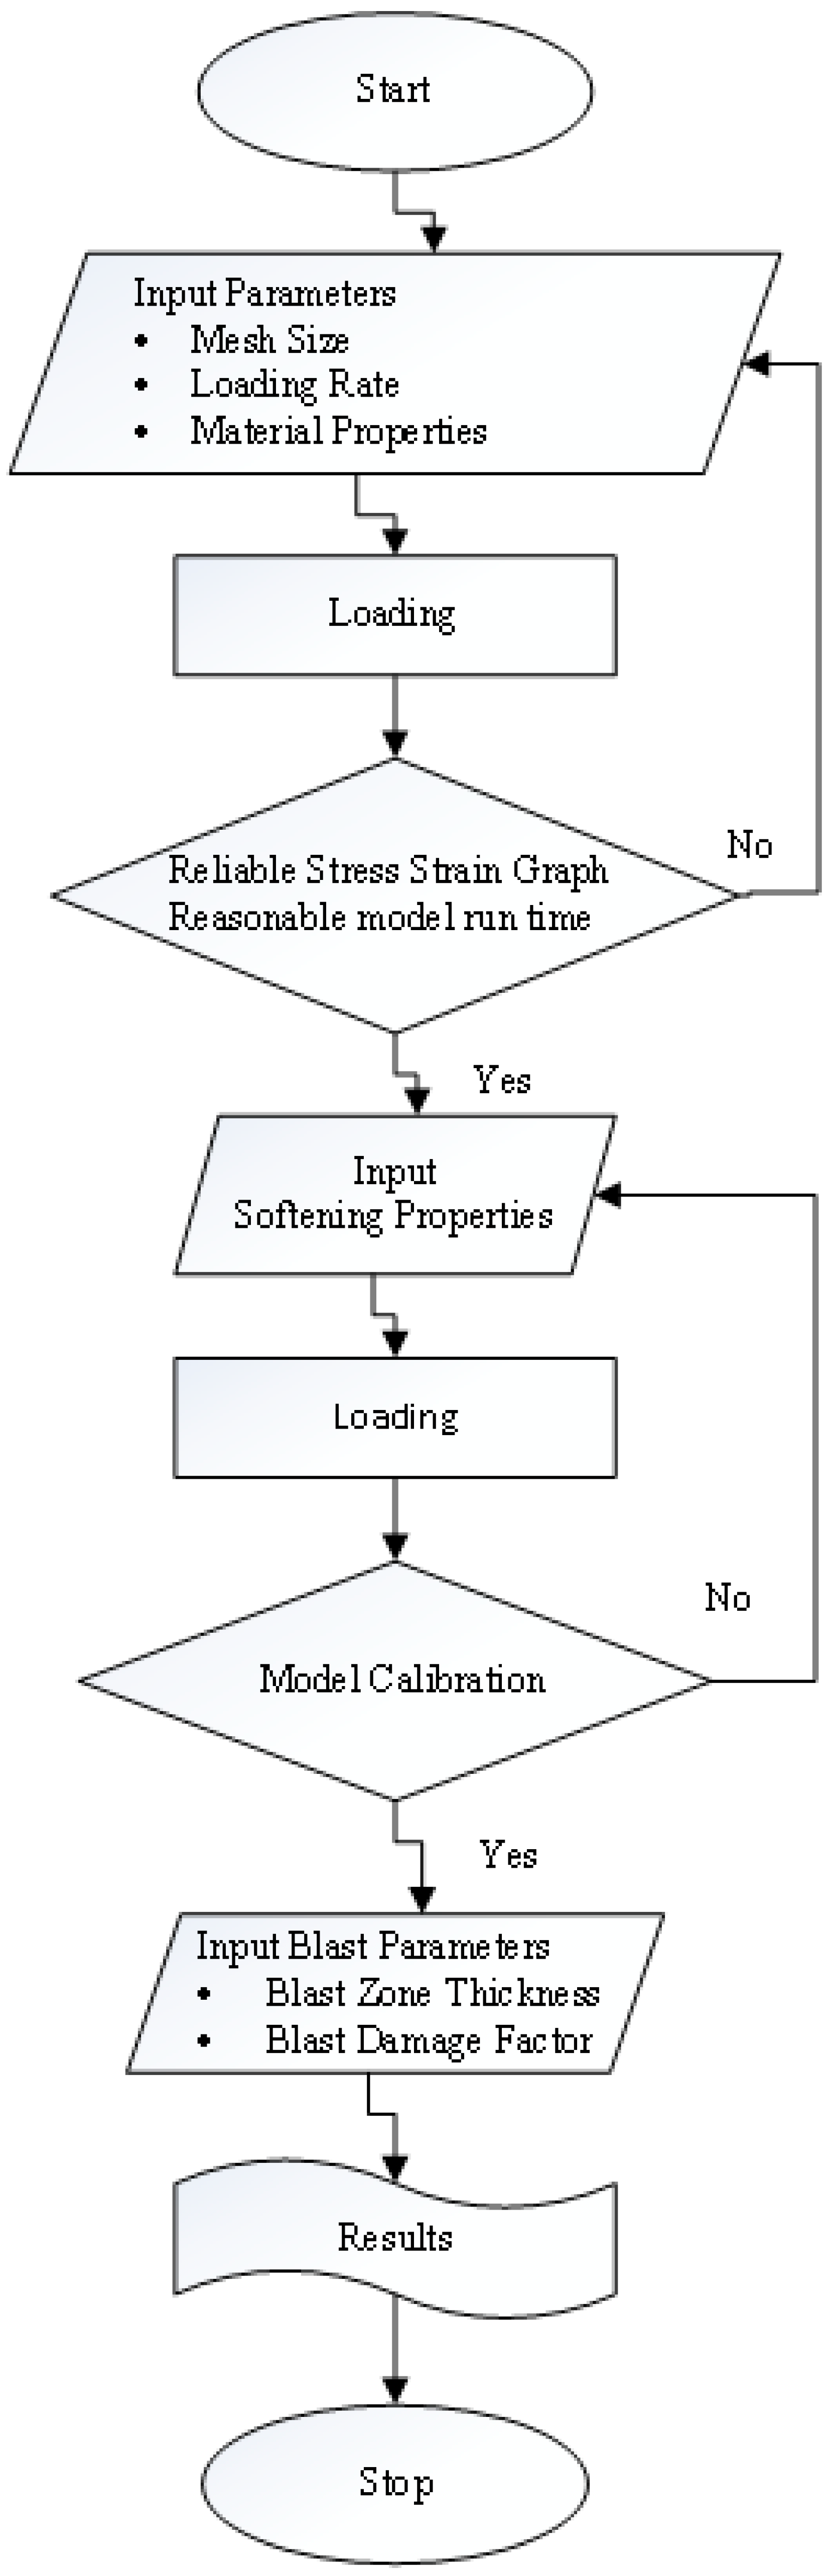
Figure 6.
Model Calibration results.
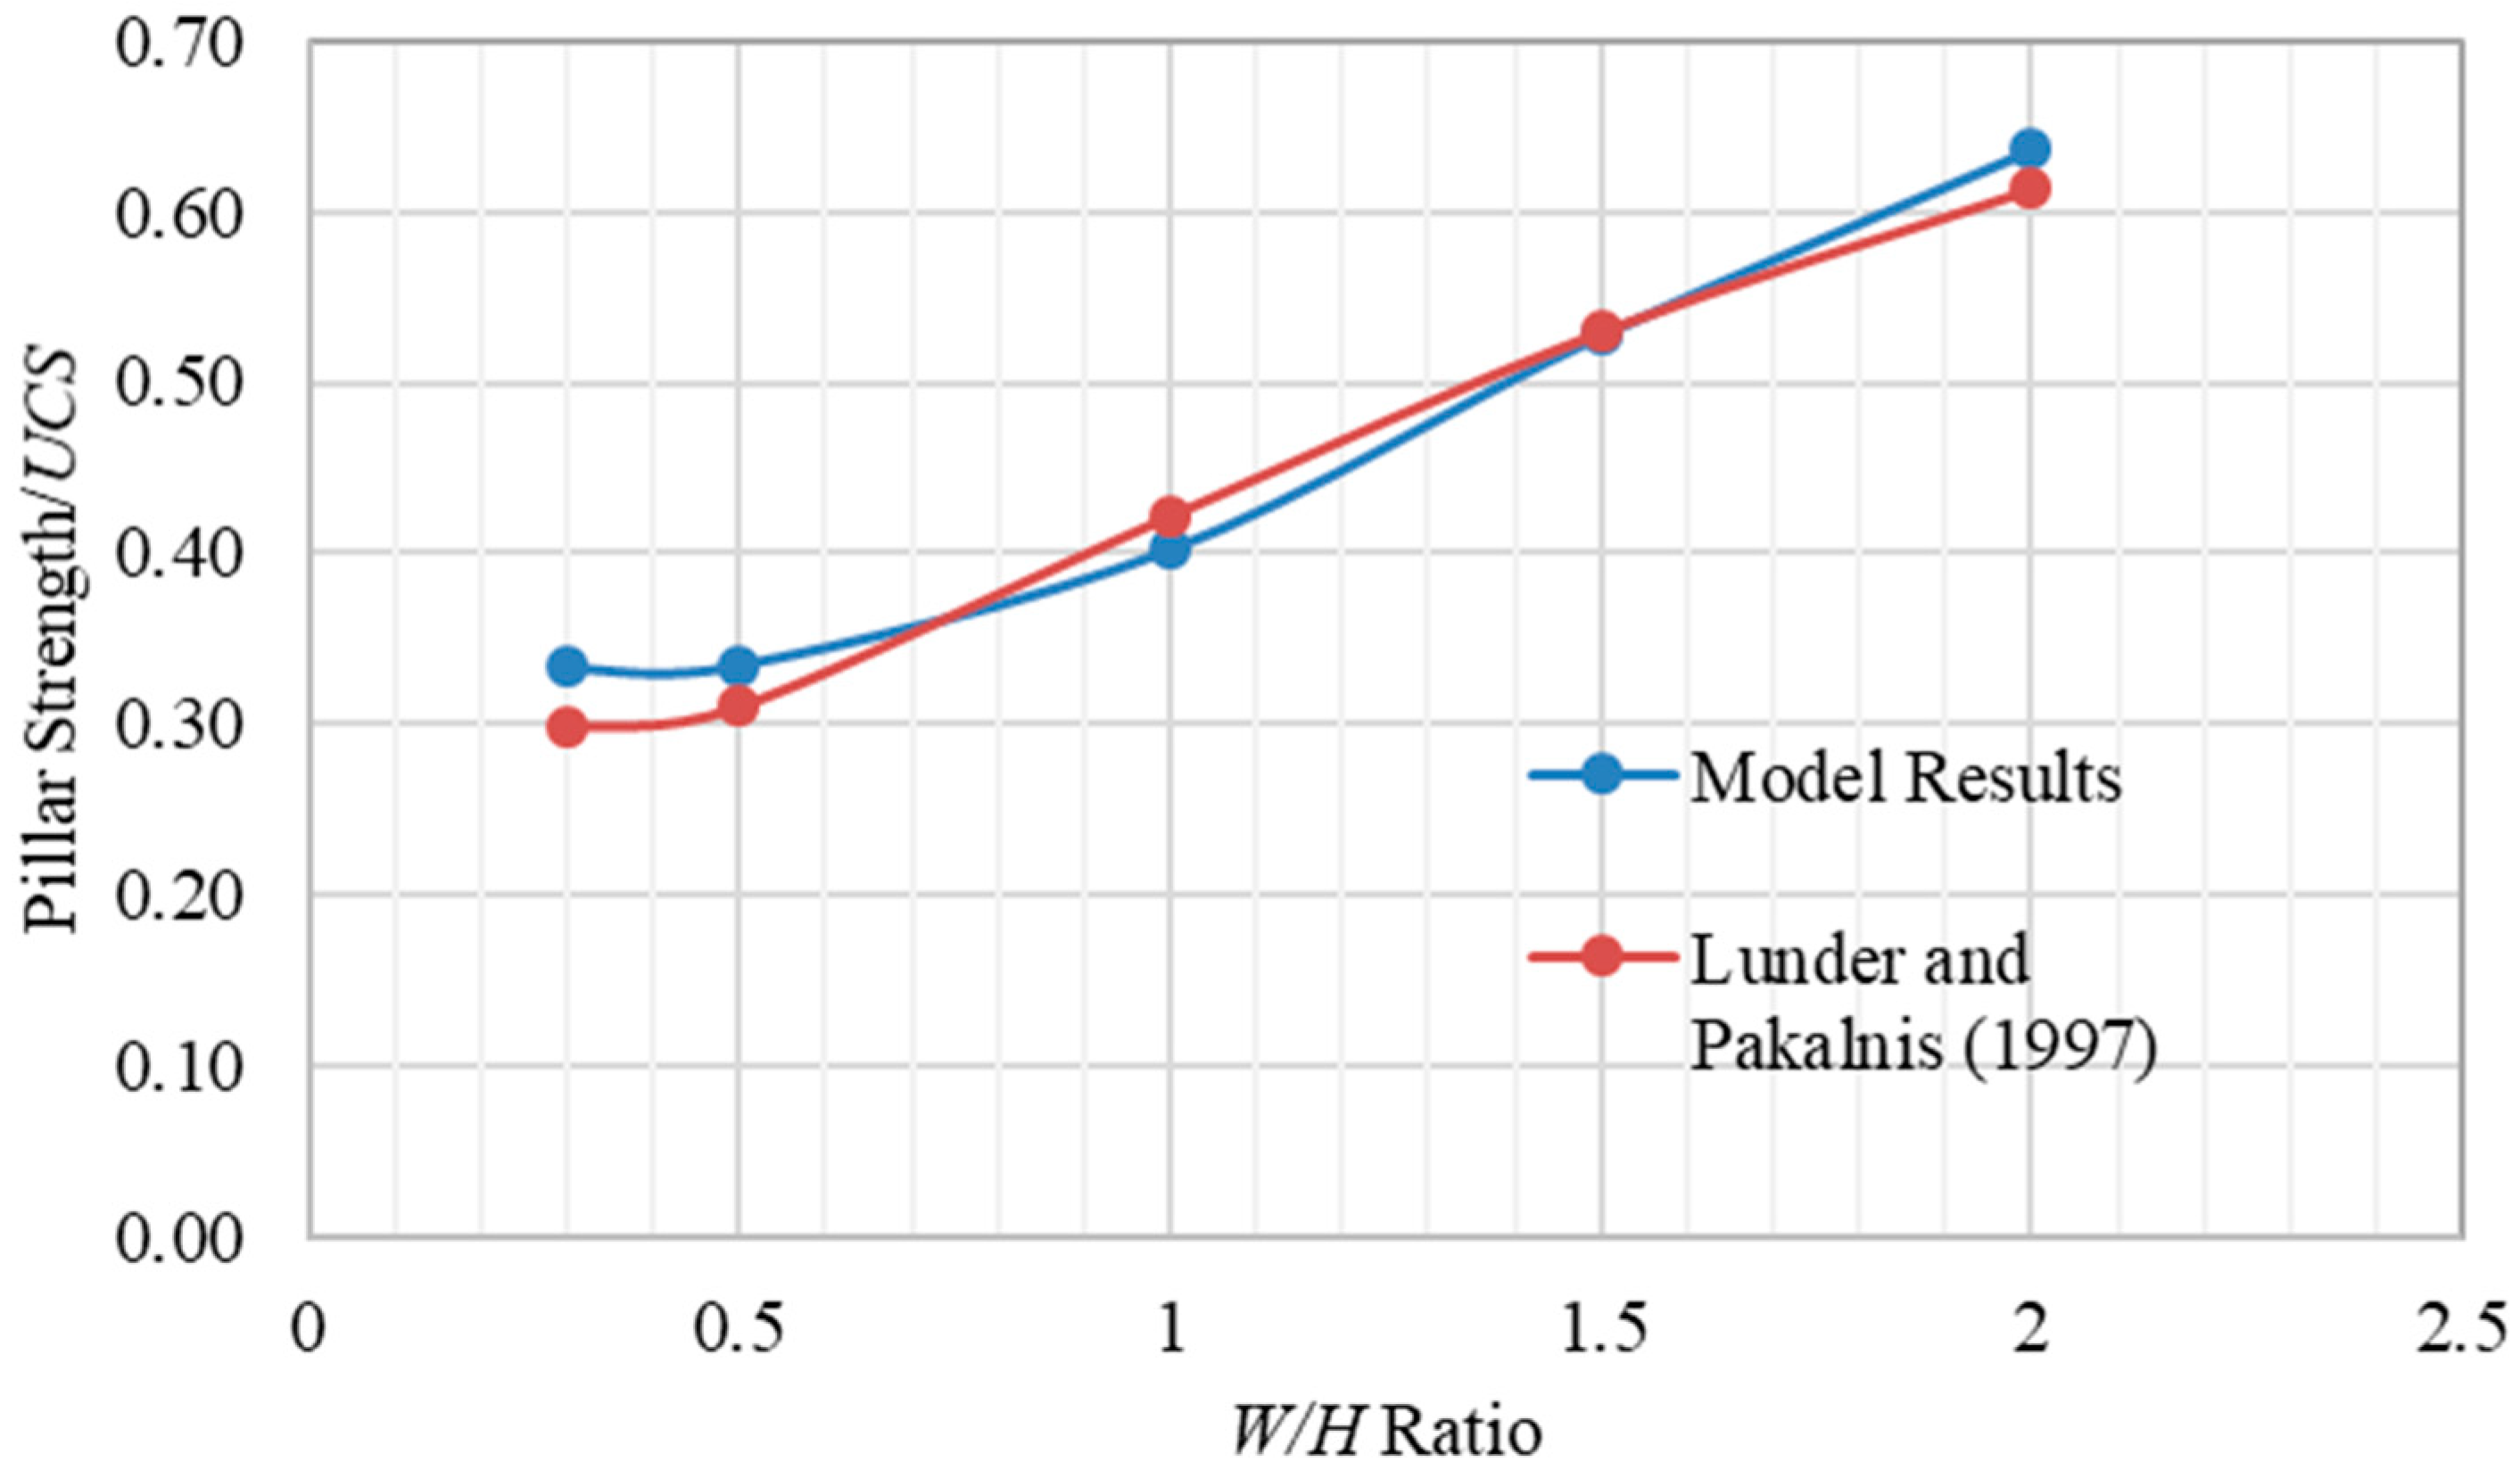
Figure 7.
Stress strain graph of the pillars with blast damage.

Figure 8.
Plasticity state plots of a pillar with a W/H ratio of 1.5 with different damage characteristics: (a) Model type, (b) Model plots (point before loading), (c) Failure initiation point, and (d) Transition point (total brittle failure).
Figure 8.
Plasticity state plots of a pillar with a W/H ratio of 1.5 with different damage characteristics: (a) Model type, (b) Model plots (point before loading), (c) Failure initiation point, and (d) Transition point (total brittle failure).


Figure 9.
Pillars with a width-to-height ratio of 1.5 and pillar height of (a) 2 m, (b) 4 m, and (c) 6 m.
Figure 9.
Pillars with a width-to-height ratio of 1.5 and pillar height of (a) 2 m, (b) 4 m, and (c) 6 m.
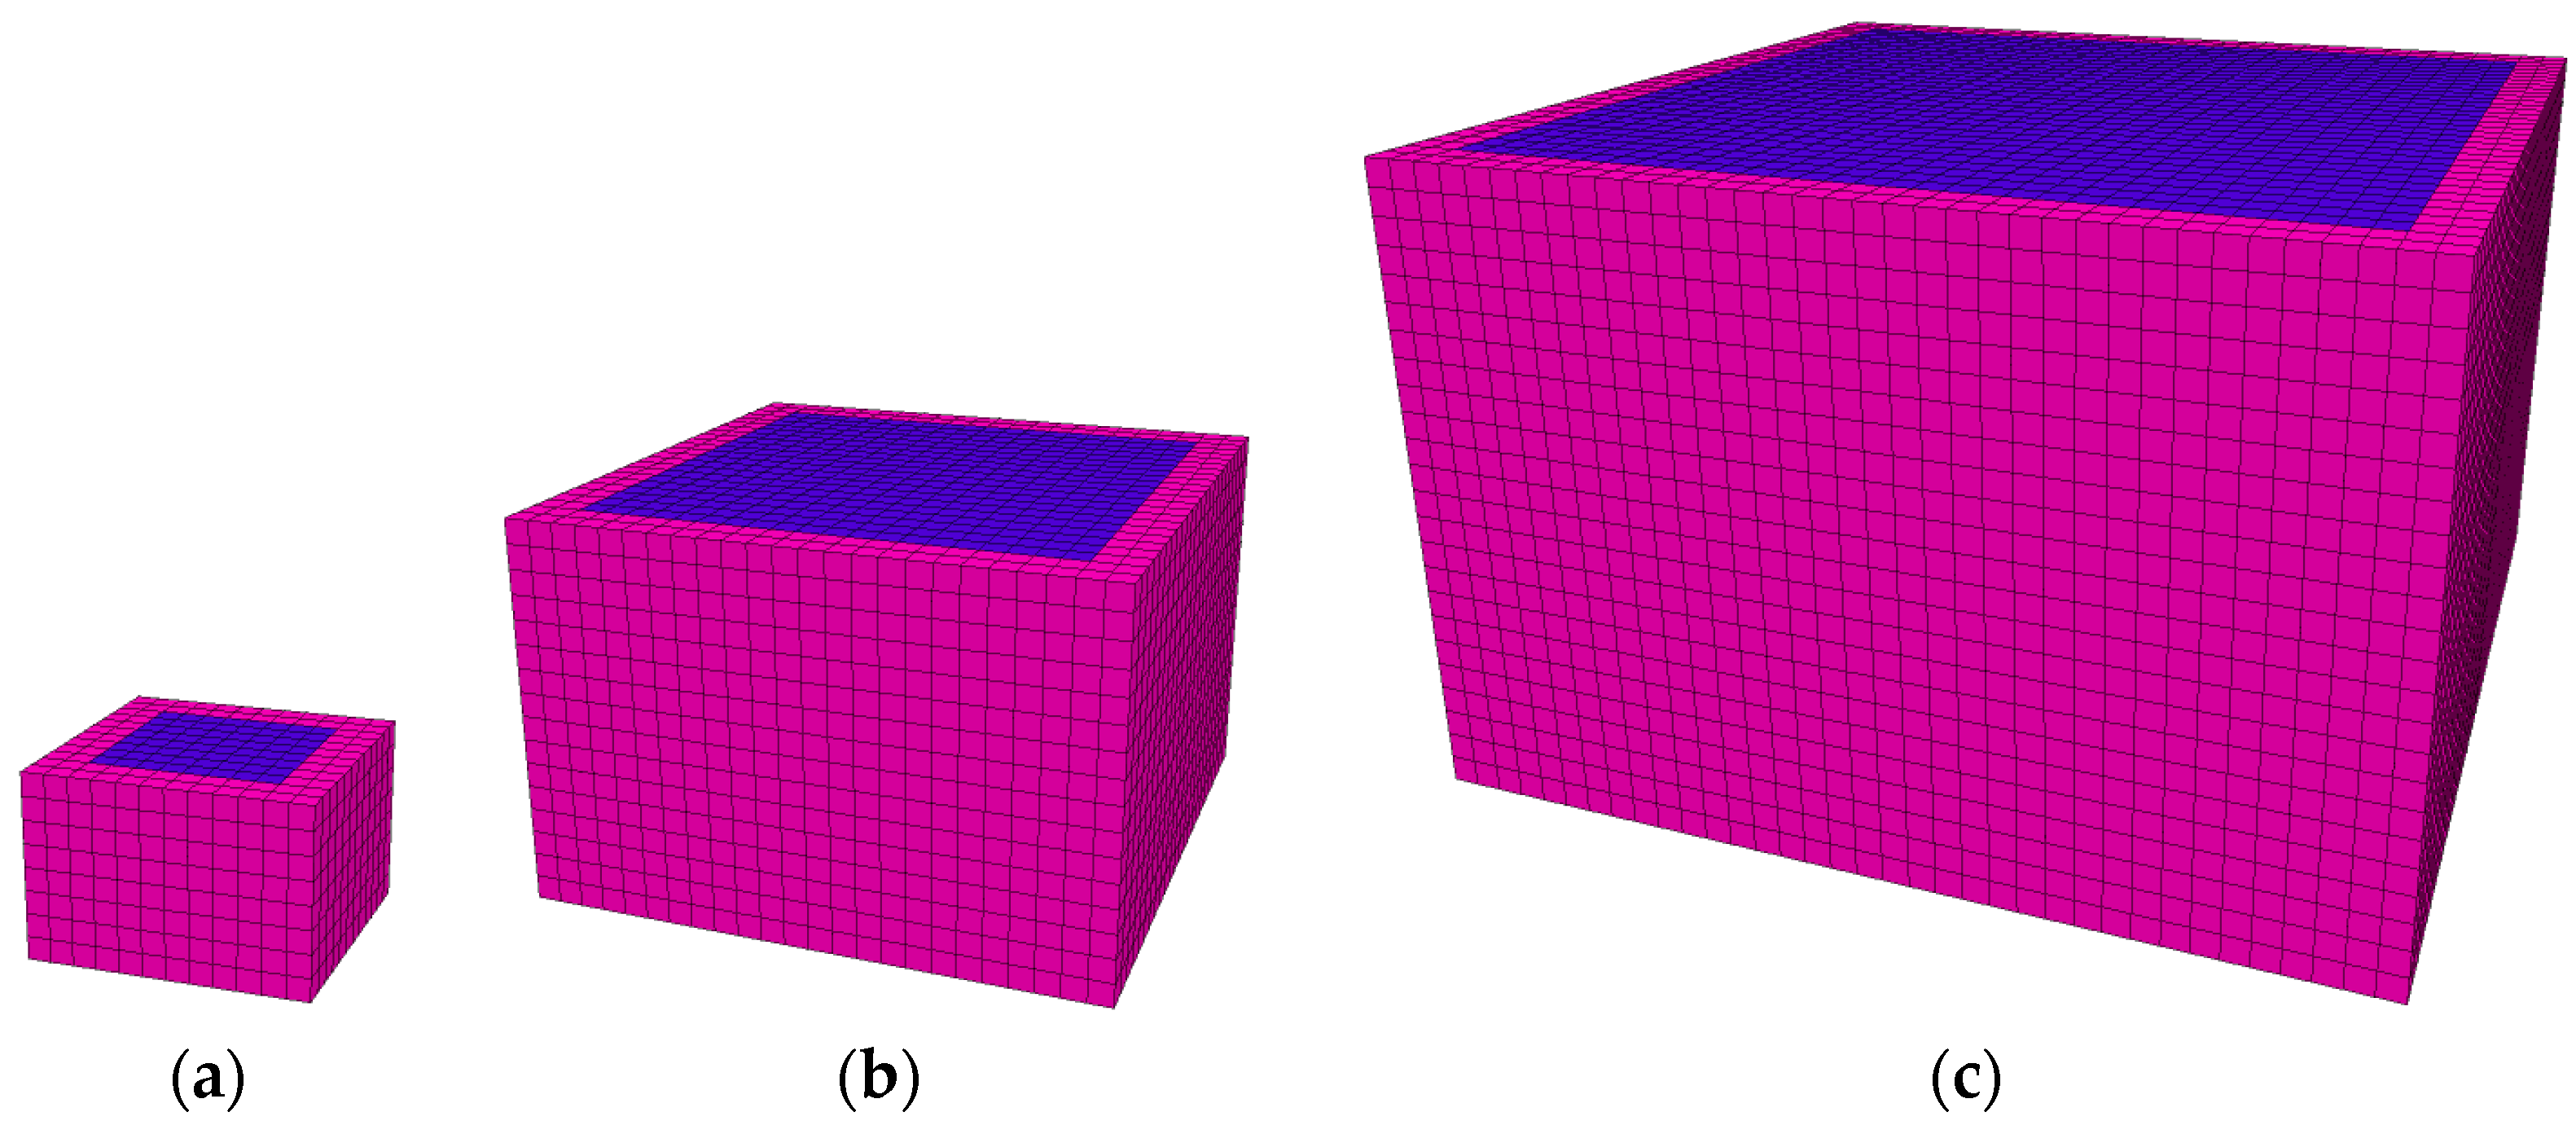
Figure 10.
Pillar strength at different pillar heights.

Figure 11.
Pillar strength at different pillar heights with a blast damage of 0.5 at varying blast thicknesses.
Figure 11.
Pillar strength at different pillar heights with a blast damage of 0.5 at varying blast thicknesses.
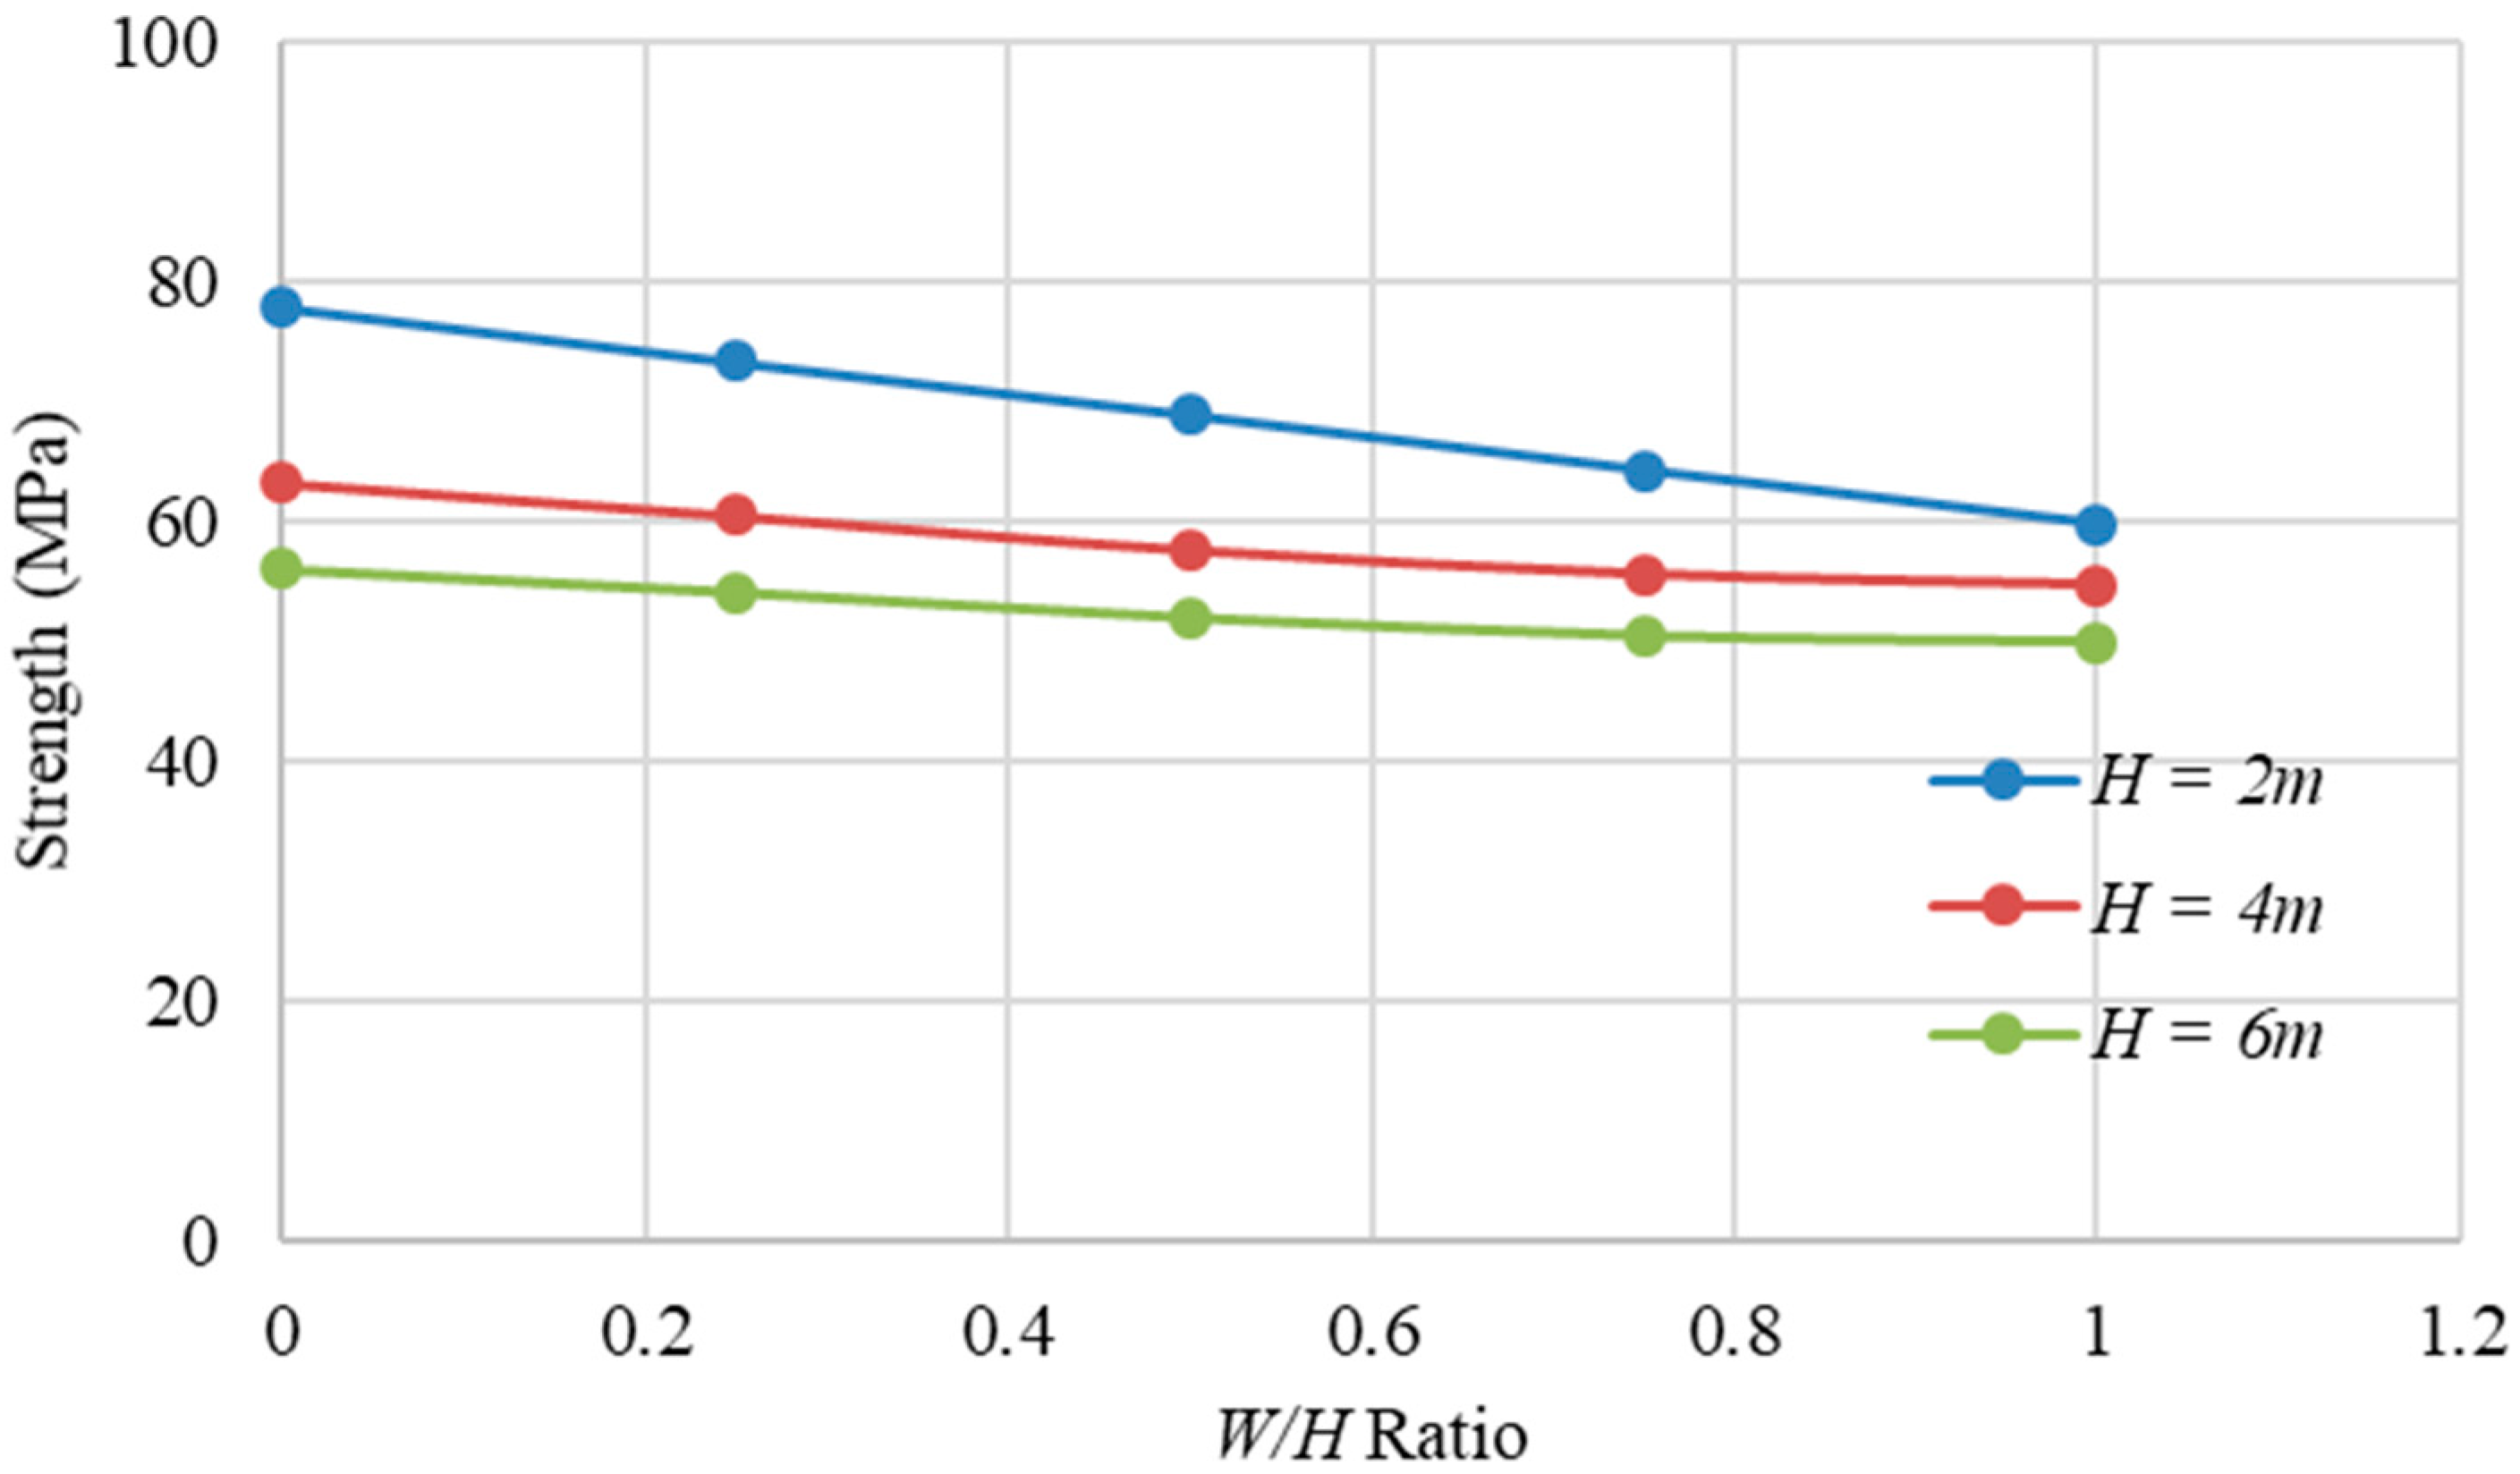
Figure 12.
20-degree inclination pillar model.
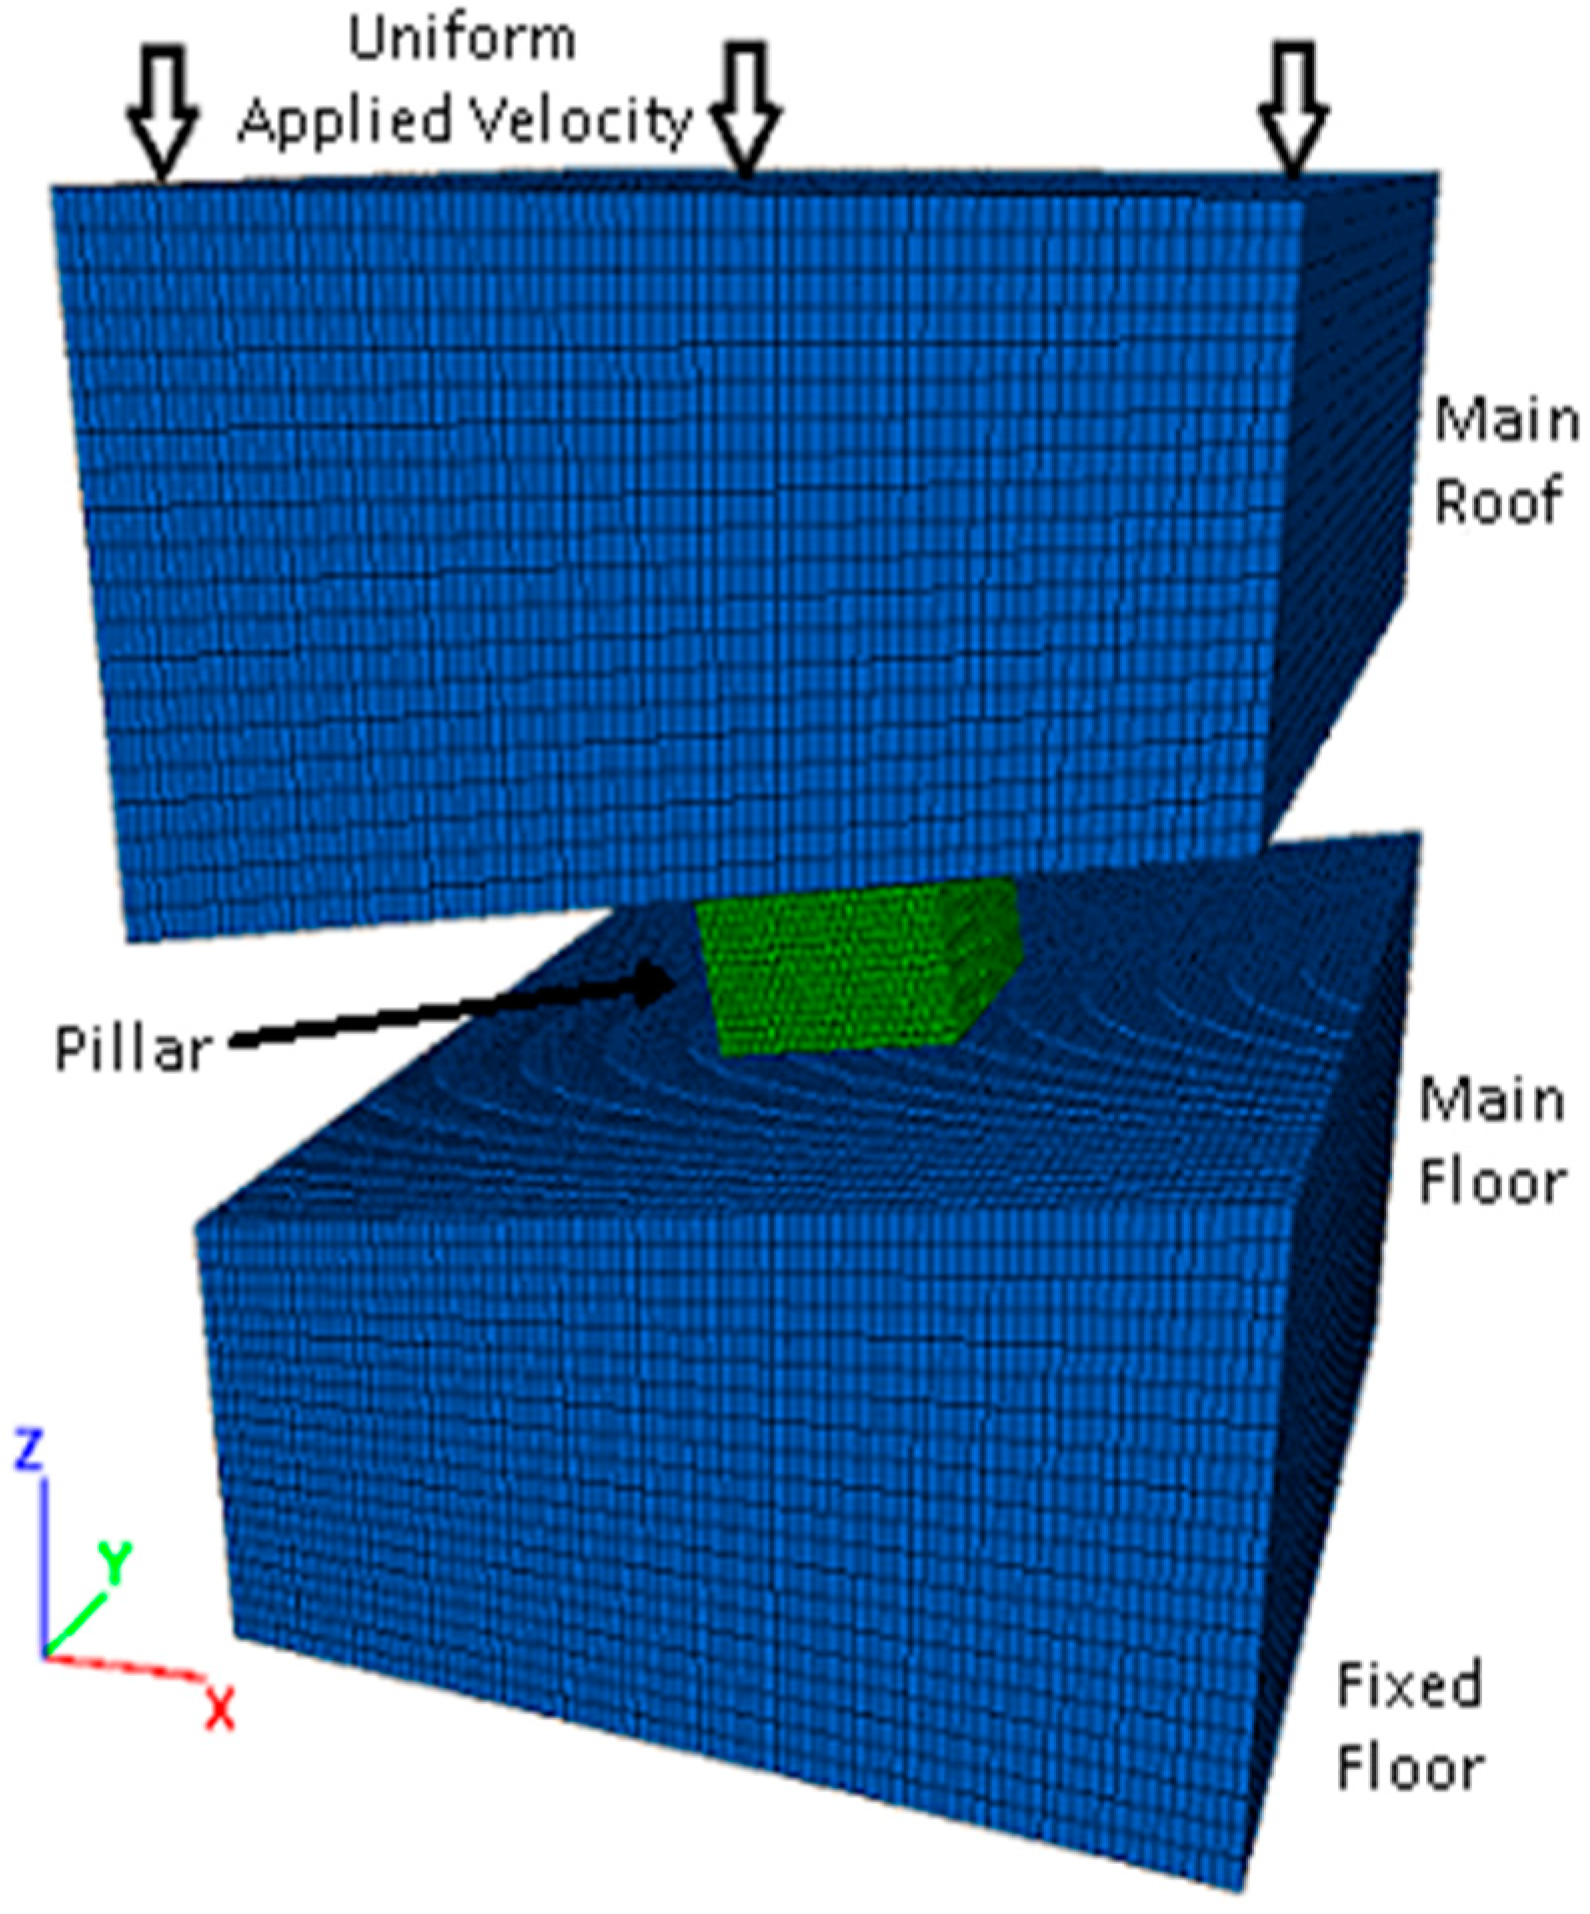
Figure 13.
Effect of blast damage on inclined pillars at varying assumed blast damage thicknesses.

Table 1.
Model run times at different loading rates.
| Loading Rate (m/Step) | Model Run Time (Min.) |
|---|---|
| 1 × 10⁻⁵ | 1 |
| 1 × 10⁻⁶ | 4 |
| 1 × 10⁻⁷ | 34 |
Table 2.
Model Properties [29].
Table 2.
Model Properties [29].
| Rock Mass Properties | Numerical Value |
|---|---|
| Young’s Modulus | 70 GPa |
| Cohesion (Brittle) | 20 MPa |
| Friction (Brittle) | 0 |
| Cohesion (Mohr-Coulomb) | 6.5 MPa |
| Friction (Mohr-Coulomb) | 42.7 |
| Tensile Strength | 7 MPa |
| Dilation | 30 |
Table 3.
Joint Properties (Esterhuizen, 2006).
| Joint Properties | Numerical Value |
|---|---|
| Joint Cohesion | 1.2 MPa |
| Joint Friction | 42 |
Table 4.
Degraded rock properties.
| Damage Factor (D) | D = 0.25 | D = 0.5 | D = 0.75 | D = 1.0 |
|---|---|---|---|---|
| Degraded Modulus | 54 GPa | 39 GPa | 27 GPa | 18 GPa |
| Degraded Cohesion | 6.1 MPa | 5.5 MPa | 4.9 MPa | 4.1 MPa |
| Degraded Friction | 41.1 | 39.1 | 36.3 | 32 |
Table 5.
Normalized pillar strength results at varying disturbance factors and blast damage thicknesses.
Table 5.
Normalized pillar strength results at varying disturbance factors and blast damage thicknesses.
| W/H Ratio | Disturbance Factor | Damage Thickness | Normalized Strength |
|---|---|---|---|
| 1 | 0 | 0 | 1.00 |
| 1 | 0.25 | 0.25 | 0.98 |
| 1 | 0.25 | 0.5 | 0.97 |
| 1 | 0.25 | 0.75 | 0.96 |
| 1 | 0.25 | 1 | 0.94 |
| 1 | 0.5 | 0.25 | 0.98 |
| 1 | 0.5 | 0.5 | 0.97 |
| 1 | 0.5 | 0.75 | 0.97 |
| 1 | 0.5 | 1 | 0.94 |
| 1 | 0.75 | 0.25 | 0.99 |
| 1 | 0.75 | 0.5 | 0.97 |
| 1 | 0.75 | 0.75 | 0.96 |
| 1 | 0.75 | 1 | 0.94 |
| 1 | 1 | 0.25 | 0.99 |
| 1 | 1 | 0.5 | 0.96 |
| 1 | 1 | 0.75 | 0.95 |
| 1 | 1 | 1 | 0.93 |
| 1.5 | 0 | 0 | 1.00 |
| 1.5 | 0.25 | 0.25 | 0.98 |
| 1.5 | 0.25 | 0.5 | 0.96 |
| 1.5 | 0.25 | 0.75 | 0.94 |
| 1.5 | 0.25 | 1 | 0.93 |
| 1.5 | 0.5 | 0.25 | 0.96 |
| 1.5 | 0.5 | 0.5 | 0.91 |
| 1.5 | 0.5 | 0.75 | 0.88 |
| 1.5 | 0.5 | 1 | 0.86 |
| 1.5 | 0.75 | 0.25 | 0.92 |
| 1.5 | 0.75 | 0.5 | 0.85 |
| 1.5 | 0.75 | 0.75 | 0.85 |
| 1.5 | 0.75 | 1 | 0.84 |
| 1.5 | 1 | 0.25 | 0.91 |
| 1.5 | 1 | 0.5 | 0.86 |
| 1.5 | 1 | 0.75 | 0.84 |
| 1.5 | 1 | 1 | 0.84 |
| 2 | 0 | 0 | 1.00 |
| 2 | 0.25 | 0.25 | 0.98 |
| 2 | 0.25 | 0.5 | 0.96 |
| 2 | 0.25 | 0.75 | 0.93 |
| 2 | 0.25 | 1 | 0.94 |
| 2 | 0.5 | 0.25 | 0.96 |
| 2 | 0.5 | 0.5 | 0.92 |
| 2 | 0.5 | 0.75 | 0.88 |
| 2 | 0.5 | 1 | 0.87 |
| 2 | 0.75 | 0.25 | 0.93 |
| 2 | 0.75 | 0.5 | 0.86 |
| 2 | 0.75 | 0.75 | 0.82 |
| 2 | 0.75 | 1 | 0.80 |
| 2 | 1 | 0.25 | 0.89 |
| 2 | 1 | 0.5 | 0.81 |
| 2 | 1 | 0.75 | 0.77 |
| 2 | 1 | 1 | 0.78 |
| 2.5 | 0 | 0 | 1.00 |
| 2.5 | 0.25 | 0.25 | 1.00 |
| 2.5 | 0.25 | 0.5 | 0.99 |
| 2.5 | 0.25 | 0.75 | 0.95 |
| 2.5 | 0.25 | 1 | 0.97 |
| 2.5 | 0.5 | 0.25 | 0.98 |
| 2.5 | 0.5 | 0.5 | 0.95 |
| 2.5 | 0.5 | 0.75 | 0.89 |
| 2.5 | 0.5 | 1 | 0.88 |
| 2.5 | 0.75 | 0.25 | 0.95 |
| 2.5 | 0.75 | 0.5 | 0.89 |
| 2.5 | 0.75 | 0.75 | 0.86 |
| 2.5 | 0.75 | 1 | 0.83 |
| 2.5 | 1 | 0.25 | 0.92 |
| 2.5 | 1 | 0.5 | 0.83 |
| 2.5 | 1 | 0.75 | 0.79 |
| 2.5 | 1 | 1 | 0.73 |
© 2018 by the authors. Licensee MDPI, Basel, Switzerland. This article is an open access article distributed under the terms and conditions of the Creative Commons Attribution (CC BY) license (http://creativecommons.org/licenses/by/4.0/).
Share and Cite
MDPI and ACS Style
Jessu, K.V.; Spearing, A.J.S.; Sharifzadeh, M. A Parametric Study of Blast Damage on Hard Rock Pillar Strength. Energies 2018, 11, 1901. https://doi.org/10.3390/en11071901
AMA Style
Jessu KV, Spearing AJS, Sharifzadeh M. A Parametric Study of Blast Damage on Hard Rock Pillar Strength. Energies. 2018; 11(7):1901. https://doi.org/10.3390/en11071901
Chicago/Turabian StyleJessu, Kashi Vishwanath, Anthony J. S. Spearing, and Mostafa Sharifzadeh. 2018. "A Parametric Study of Blast Damage on Hard Rock Pillar Strength" Energies 11, no. 7: 1901. https://doi.org/10.3390/en11071901
Note that from the first issue of 2016, this journal uses article numbers instead of page numbers. See further details here.