An Accurate Online Dynamic Security Assessment Scheme Based on Random Forest †


1
Department of Energy Technology, Aalborg University, Pontoppidanstræde 111, 9220 Aalborg Øst, Denmark
2
School of Electrical Engineering, Wuhan University, Wuhan 430072, China
*
Author to whom correspondence should be addressed.
†
This paper is an extended version of authors’ paper published in Liu, C.; Bak, C. L.; Chen Z.; Lund P. Dynamic security assessment of western Danish power system based on ensemble decision trees. In Proceedings of the 12th International Conference on Developments in Power System Protection (DPSP), Copenhagen, Denmark, 31 March–3 April 2014.
Energies 2018, 11(7), 1914; https://doi.org/10.3390/en11071914
Submission received: 29 May 2018
/
Revised: 10 July 2018
/
Accepted: 17 July 2018
/
Published: 23 July 2018
(This article belongs to the Section F: Electrical Engineering)
Abstract
:With the increasing integration of renewable energy resources and other forms of dispersed generation, more and more variances and uncertainties are brought to modern power systems. The dynamic security assessment (DSA) of modern power systems is facing challenges in ensuring its accuracy for unpredictable operating conditions (OC). This paper proposes a novel approach that uses random forest (RF) for online DSA. Hourly scenarios are generated for the database according to the forecast errors of renewable energy resources, which are calculated from historical data. Fed with online measurement data, it is able to not only predict the security states of current OC with high accuracy, but also indicate the confidence level of the security states one minute ahead of the real time by an outlier identification method. The results of RF together with outlier identification show high accuracy in the presence of variances and uncertainties due to wind power generation. The performance of this approach is verified on the operational model of western Danish power system with around 200 transmission lines and 400 buses.
1. Introduction
1.1. Motivations
Dynamic Security Assessment (DSA) provides power system operators with important information about the ability of a certain Operating Condition (OC) to withstand a defined set of disturbances and to regain a state of equilibrium after being subjected to a physical disturbance, with most system variables bounded in the secure criteria, so that practically the entire system remains intact [1].
Generally, there are two mainstreams of DSA, that is, offline DSA and online DSA. Offline DSA performs detailed time-domain simulations offline for all credible contingencies and a selected set of OCs, so as to determine the security thresholds of generation and load as well as the power transfer limits of important interties in power systems. Even though a large number of simulations are implemented for selected OCs and credible contingencies, it is still impossible to cover all OCs, especially for medium-scale and large-scale power systems integrated with large areas of unpredictable renewable energies.
Online DSA is able to update the current OC to supplement the result of offline DSA for higher reliability. It involves a screening process to rank and select the most critical contingencies and intelligent filtering of OCs to be simulated and updated to the knowledge of offline DSA [2]. Then only a limited number of traditional time-domain simulations are carried out to explore the guidelines of system security according to different criteria. Finally, the guidelines of online DSA are updated dynamically with precise prediction of security in case of credible contingencies.
Nowadays, the increasing penetration of renewable energy resources such as wind farms, solar power plants, energy storage units, as well as micro-grids further bring more variances and uncertainties to the power systems at different voltage levels. These energy resources definitely have impacts on power system security, but they are not as directly accessible for monitoring and control from control centers as conventional centralized generation. Therefore, the presence of these uncertainties makes the DSA of modern power systems much more challenging than before.
1.2. Literature Reviews
Many data mining algorithms, such as Support Vector Machine [3], Artificial Neural Network [4], Intelligent System [5], and Decision Tree (DT) [6,7,8,9,10,11,12] are used for the online DSA. DT has the superiority for DSA due to high computation efficiency, interpretability, and uncertainty manageability [6]. Reference [7] proposes a scheme using a new classification rule involving whole paths of DTs to provide more robust DSA for large-scale interconnected power systems. Reference [8] then proposes ensemble DTs to increase the accuracy of the DSA based on single DT, but it does not refer to the database preparation method. Reference [9] explores the significance of the training database for the online environment of DSA and proposes the importance sampling method to maximize the information contained in the database. Then, more realistic applications associated with the DSA are proposed, such as detecting the missing measurements [10], preventive and corrective control [11] and parallel computation for super-scale power grids [12]. Reference [13] explores the optimal input features for data mining based on transient energy function to reduce the size of the database and to improve the performance of the trained model for the DSA. Reference [14] proposes a decentralized decision-making scheme to collaborate between the transmission system operator and distribution system operators to achieve optimal operating conditions.
Most of these methods offline generate a training database by a large number of time-domain simulations and then train a mathematical model with decision rules using the training set of label patterns, that is, security results. Plugged with online measurements from SCADA or Wide Area Measurement System, the created model is then used to determine the security states of current OCs. However, it is very difficult to achieve the standard for industrial applications, that is, high reliability of three nines (>99.97%) [15]. The advanced data mining algorithm, Random Forest (RF) is also used in assessing the power system stability and security. Reference [16] develops a systematic approach to baseline the phase-angles with respect to actual transfer limits across the system interties to enable the PMU-based situational awareness. Reference [17] proposes using data-mining algorithms to give an early assessment of the stable/unstable status of an ongoing contingency. Reference [18] proposes an intelligent scheme that uses periodically updating data mining models incorporating new training cases accounting for new OCs or possible changes of system topology. However, the issue of “generalization capability” has not been covered yet by previous studies, that is, the applicability of a created data mining model for online scenarios of DSA with different OCs or deviated parameters from the training database. The methodology of telling the “generalization capability”, to the best of our knowledge, is new to the DSA, aiming at increasing the accuracy and robustness of online DSA.
1.3. Contributions
In this paper, a methodology using RF for online DSA is proposed. The training database is deliberately prepared and sampled according to the forecast errors of renewable energy resources from historical data. The proposed online DSA scheme is able to not only predict the security states of the new coming OC with high accuracy, but also inform the adaptability of the created RF model by Outlier Index. The Outlier Index is calculated by the proximities of the new coming OCs to all the cases existing in the database. A larger Outlier Index implies the low adaptability of the new OC to the model trained by the database, so that the RF model is unsure about the security states of the new OC, and vice versa. Therefore, given a threshold of Outlier Index, the misclassified cases can be filtered out as unsure cases for further verification. Finally, the new cases together with the existing cases can be used to build a new RF model immediately to strengthen the adaptability of model.
Compared with authors’ previous work in [8], new findings of this paper include (i) the proposal of creating a contingency-oriented hourly-based training database for an accurate online DSA; (ii) a new “scenario generation method” for the training database to reproduce the uncertainties and variances of power systems according to the forecast errors of renewable energy resources from historical data.
The rest of this paper is organized as follows. Section 2 introduces the principal algorithms of a traditional DT model and the RF model ensembled from a number of DTs. Section 3 proposes two indices, the Proximity Index and Outlier Index, to evaluate the adaptability of the new OC; it then introduces a scenario generation method for the training database; and describes the details of the proposed scheme for online DSA. Section 4 verifies the performance of this approach on the detailed model of the western Danish power system. Finally, conclusions and discussions are drawn in Section 5.
2. Principle of Random Forest
2.1. From Decision Tree to Random Forest
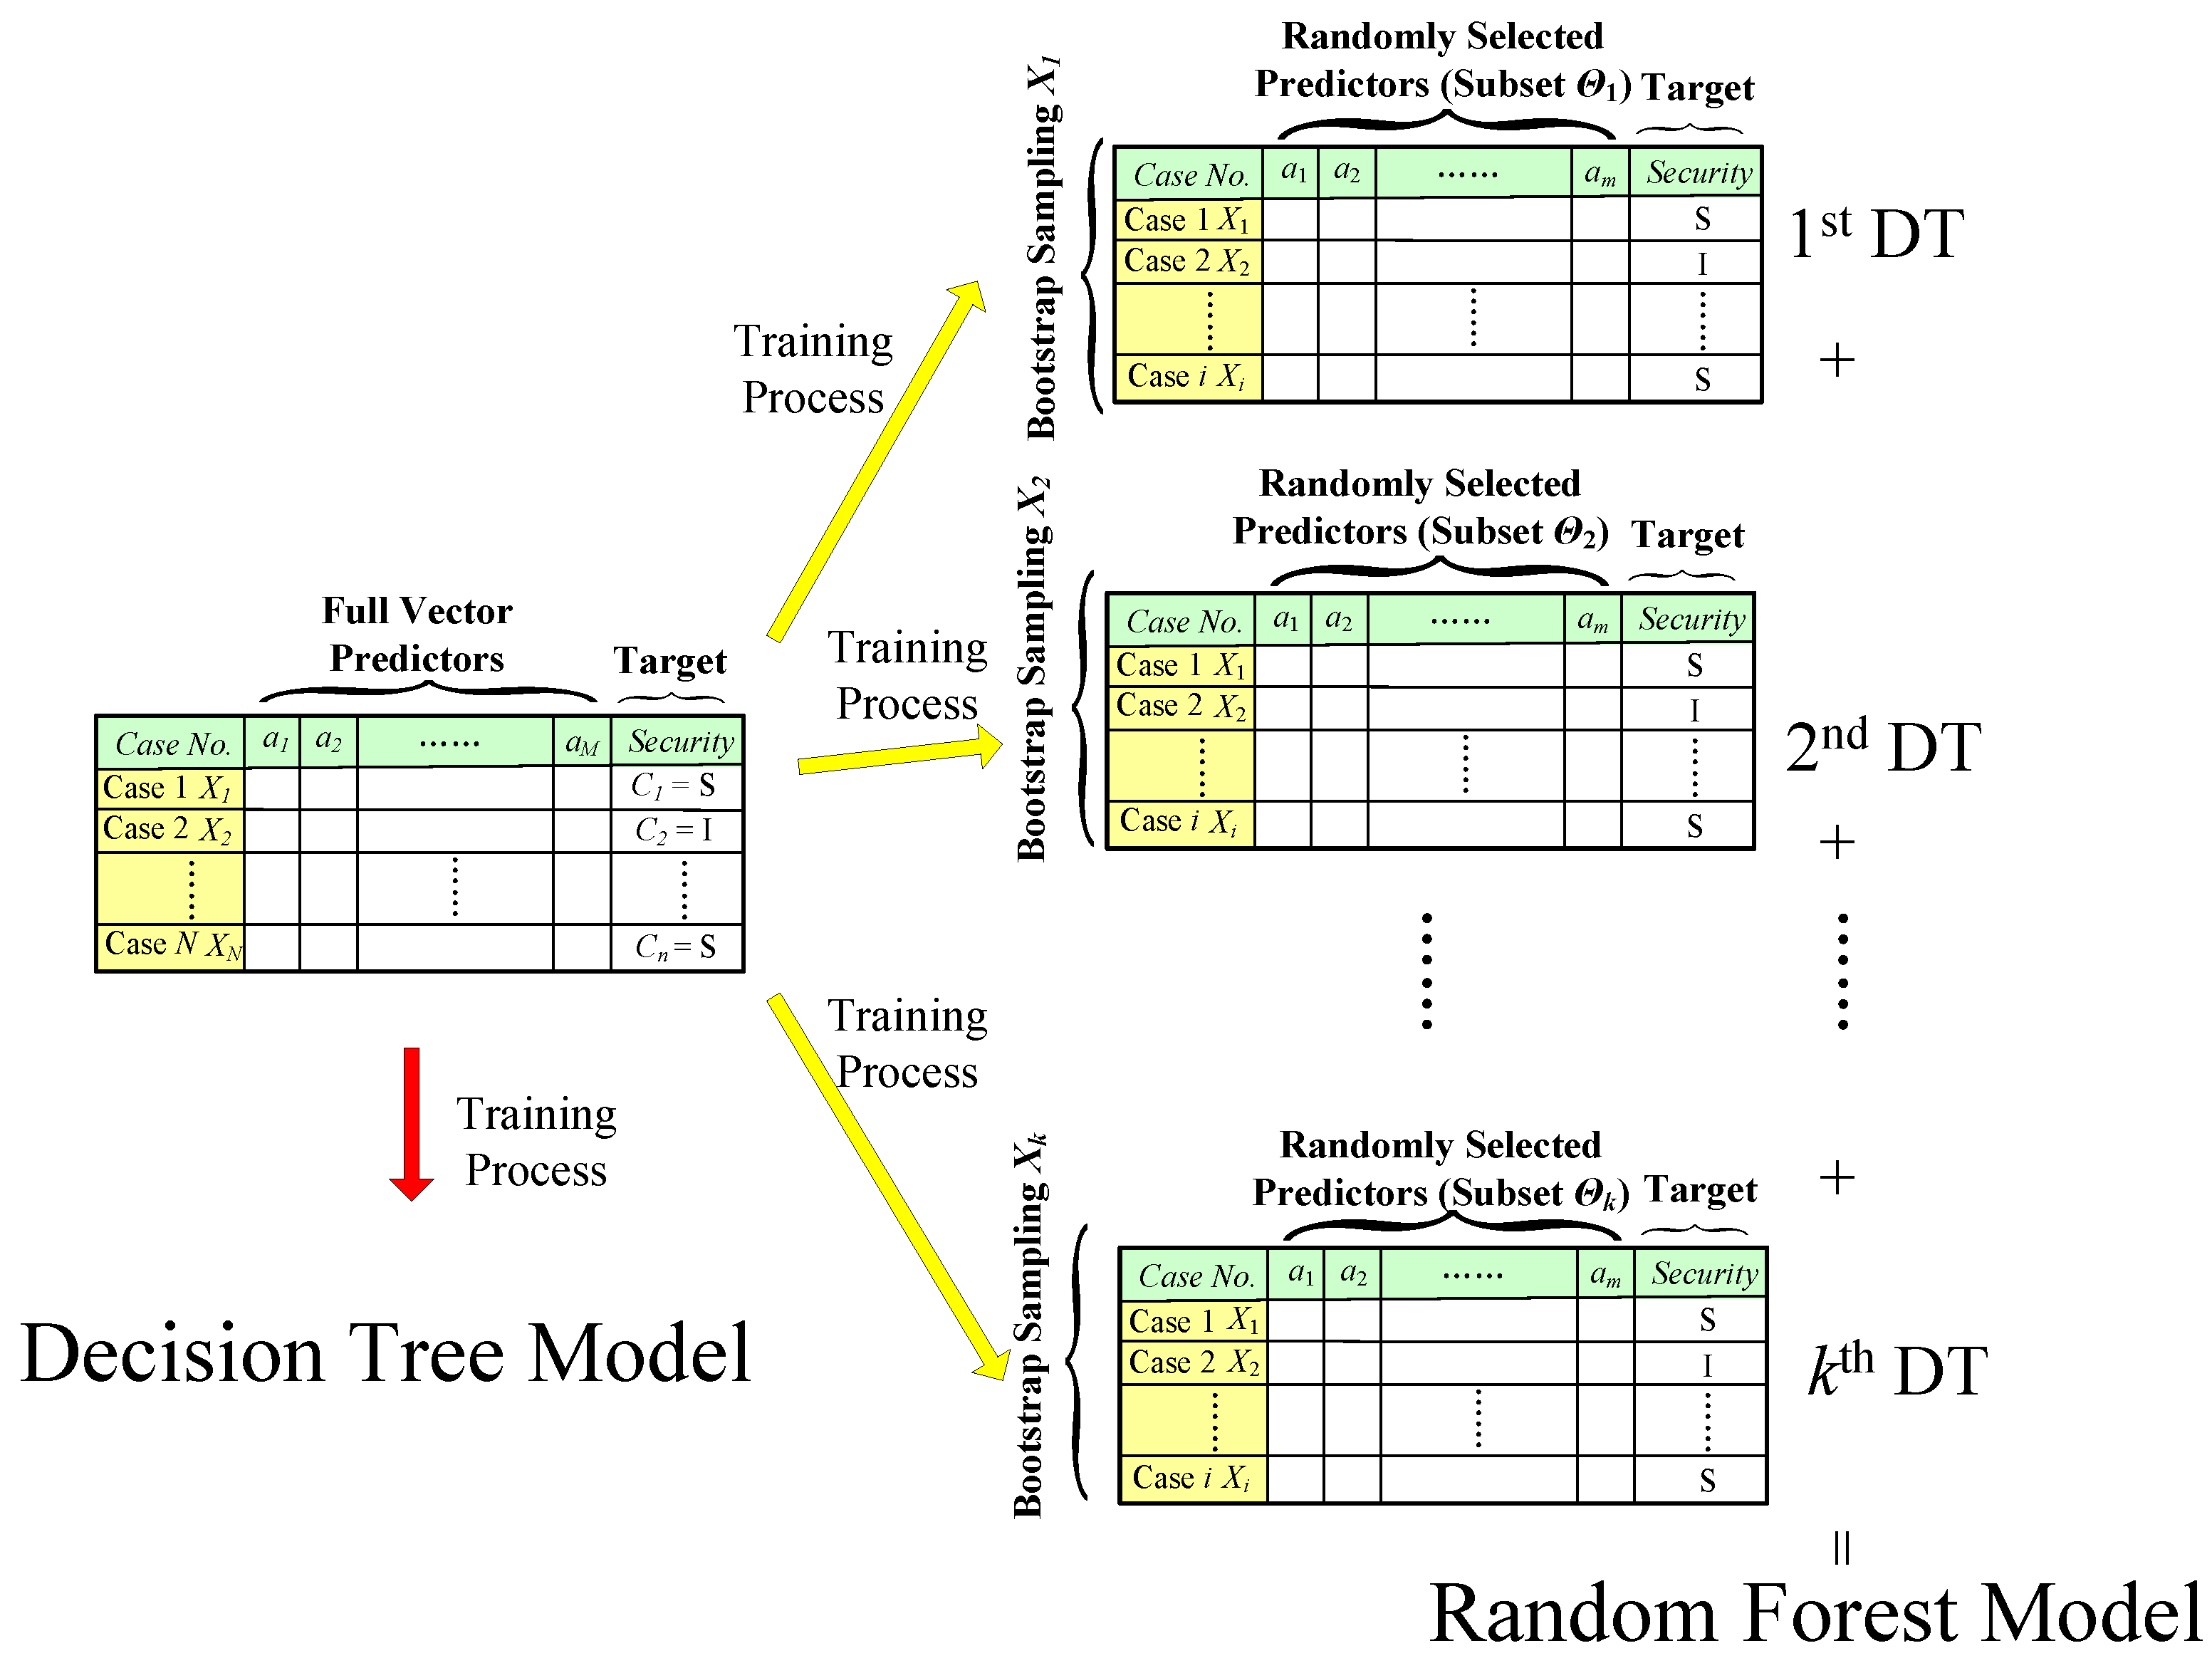
Generally, to build a data mining model for DSA, a training database is firstly prepared from time-domain simulations that contain predictors and the target, as shown in Figure 1a. The predictors are composed of the measurements from a number of OCs and the target is their security results in case of contingencies obtained from time-domain simulations. Then, the training database is randomly divided to a learning set and a test set. The learning set is used to grow a series of DTs with increasing sizes, while the test set is used to test and prune these DTs to find the optimal one with the highest accuracy. Finally, a DT model is generated to search out the critical attributes, which are the most relevant to the security so as to predict the security of any OCs using these critical attributes. The DT is a decision-support model expressed as single binary tree to predict the possible consequences of the target value by a lot of “if-then rules”. Therefore, the security of a specific OC, either Secure (S) or Insecure (I), represented by a set of measurements (i.e., a1, a2, …, aj, …, am, …, aM), can be predicted by dropping the measured values of the case downward from the root node to a terminal node of a DT, as shown in Figure 1b. Classification And Regression Trees (CART) invented by L. Breiman are used as the DT algorithm in this paper. Details of the CART algorithm can be found in [19].
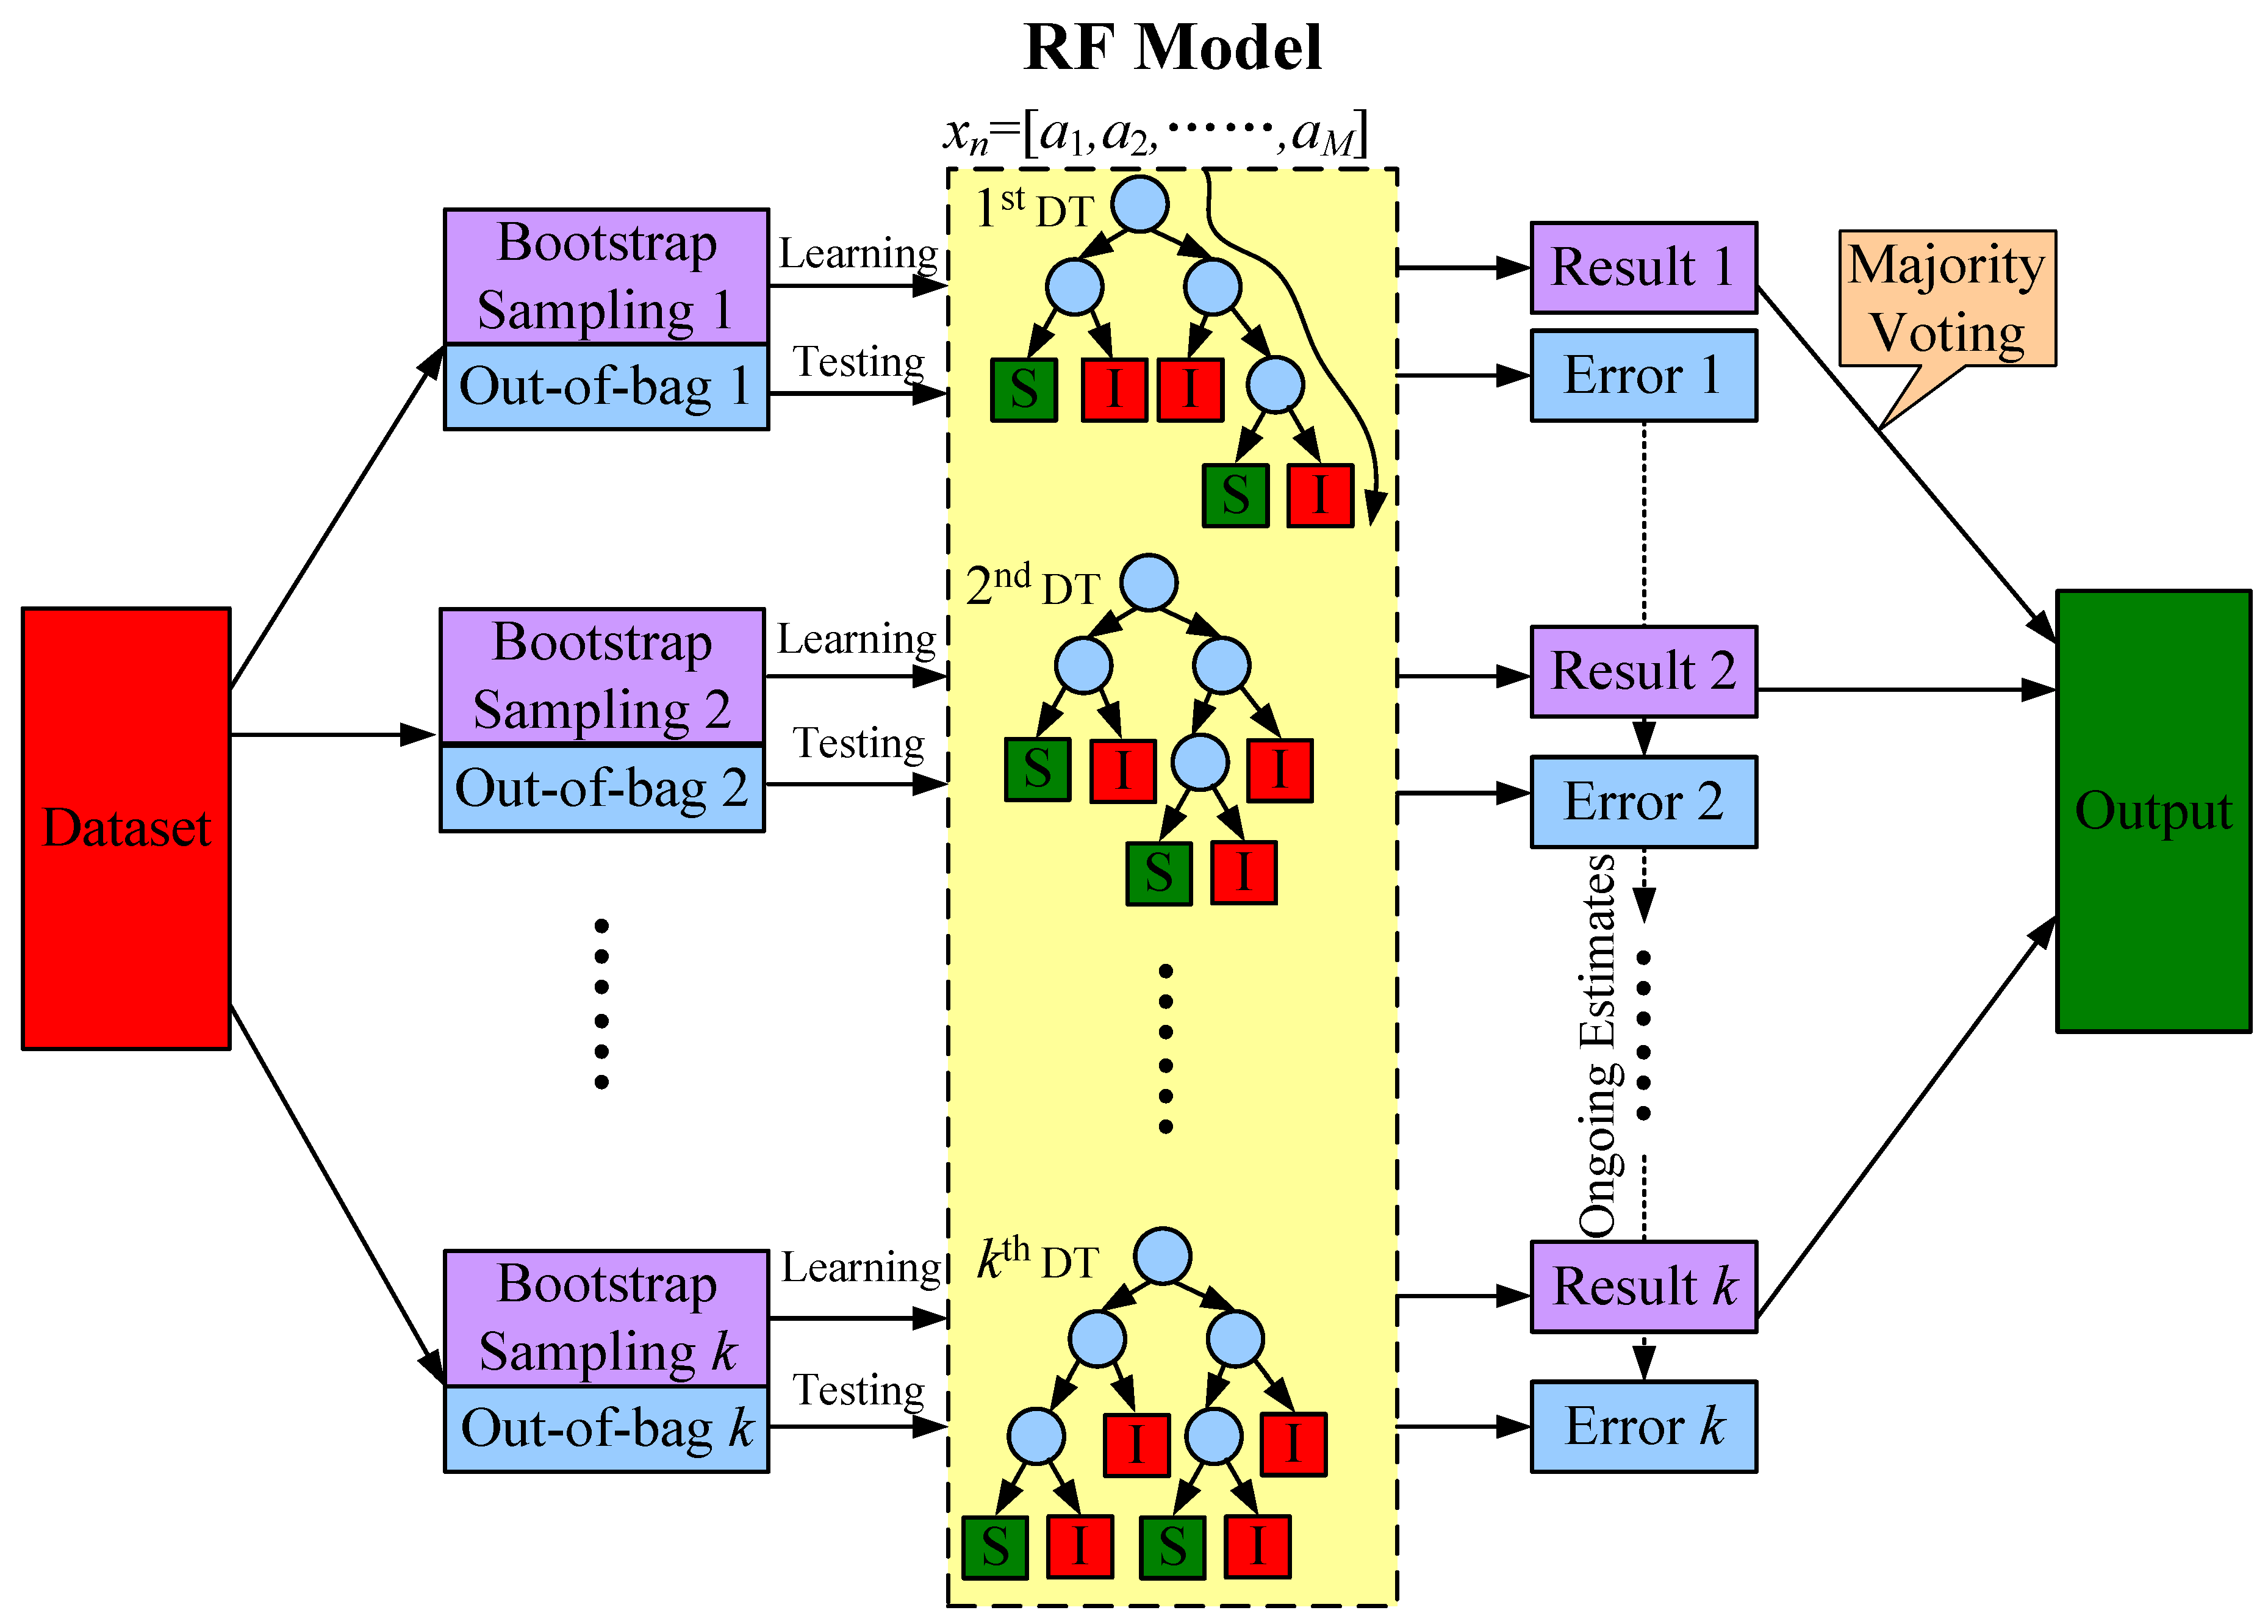
In contrast, the model of RF, developed from DT, is composed of a multitude of de-correlated DTs such that each node of DTs depends on a sub-vector randomly selected from the full-vector predictors. Additionally, the Bootstrap Sampling method is also used in the RF by randomly sampling the cases with replacement from the database a lot of times to create many datasets with the same size. Then, each dataset may consist of repeated cases because of the replacement. However, the Bootstrap Sampling method assists in better estimating the distribution of the original database so as to enhance the accuracy. For each DT in RF model, about one third (i.e., e−1 = 36.8%) of the cases are left out from the Bootstrap Sampling—called the Out-Of-Bag dataset—which can be used as the test set to give ongoing estimates of the error. The procedure of creating an RF model is illustrated in Figure 2.
Figure 3 shows the structure of an RF model. The final classification output (i.e., Secure or Insecure) of an RF model is the majority voting result (largest fraction) from a large number of DTs. Although each DT is unpruned and over-fitted, the overall RF model can benefit from aggregated-base variance reduction. Details of RF algorithm can be found in [20].
Assume we have a database containing N cases. Each case is represented by M predictors and one target. The nth case contains the measurements of case n, xn = {a1, a2, …, aM} (n = 1 to N), and one target, Cn = {S or I}, standing for the secure (S) or insecure (I) state for Case n which is obtained by the time-domain simulation. Defining that there is an RF model composed of a number of Ntree trees, the process of RF training is that for each node in the kth tree (k ≤ Ntree), the random sub-vector Θj for predictors is selected from M predictors, which is independent from the past random vector Θ1, Θ2, …, Θj−1, but with the same distribution. The kth tree is grown using the training set Xk from the kth bootstrap sampling and Θk = {Θ1, Θ2, …, Θj, …} results in a number of classifiers Tk(Xk, Θk). Therefore, an RF model is composed of a collection of Ntree tree-structured classifiers defined in Equation (1). Each DT casts a unit vote for the most popular class at input xi, and an RF model is the majority voting result of all DTs, which is defined in Equation (2).
2.2. Margins
The margin is a measure used to evaluate the confidence of the classification model for a specific case. The margin of a case measures the extent to which the average proportion of votes by for the true class Ci exceeds the average proportion of votes for any other false classes. As defined in Equation (3), the margin of a case is the proportion of votes for true class minus the maximum proportion of votes for the remaining false class. Hence, a larger margin for case i implies a higher confidence in the classification by the RF model.
In Equation (3), indicates the margin of Case xi in a created RF model composed of Ntree DTs and Ci indicates the true class of Case xi.
Therefore, the strength of classifiers in an RF model is defined as the average margin of all cases in the dataset, as defined in Equation (4). A stronger RF model implies clearer classification of all cases in the database.
where N is the number of cases in the training database. For a two-class problem, an RF model with a classifier strength larger than 0.4 can be deemed as a comparably strong classification model, which implies that on average, more than 70% of DTs have correct votes (i.e. 70% − 30% = 0.4). A stronger classification model may result in a relatively lower misclassification rate.
3. Proposed Approach
The previous section introduces the principle of RF and some indices to evaluate the attributes of a created RF model. Nevertheless, the “generalization capability” of a created data mining model and other data-driven algorithms is still an undergoing research issue with immature results. More specifically, a data mining model is structured on a training database, but a database should be applied by validation datasets, probably with different patterns. It is necessary to predict the confidence level when applying a new dataset on a created data mining model.
In this section, two indices, the Proximities Index and Outliers Index, are proposed from the view of information theory to evaluate the confidence level of a new coming case in the validation process. Then, a methodology of scenario generation is proposed for preparing the hourly training database for DSA. Finally, a systematic scheme is proposed for an accurate online DSA, where these proposed indices are further used to indicate the confidence of the security states one minute ahead of the real time and to filter out the unsure cases for further examination.
3.1. Indices of Proximities and Outliers
The proximity is an important index representing the similarity between each two cases, either in the database or out of the database. Particularly, a large training database having the same case does not have sufficient information. Conventionally, Euclidean Distance (ED) is used to evaluate the proximity between each two cases, expressed by (5).
where xi and xj are two different cases in the training database, and xin and xjn are the projection on the nth Cartesian coordinate in the Euclidean n-space, for example, the measured power in the network.
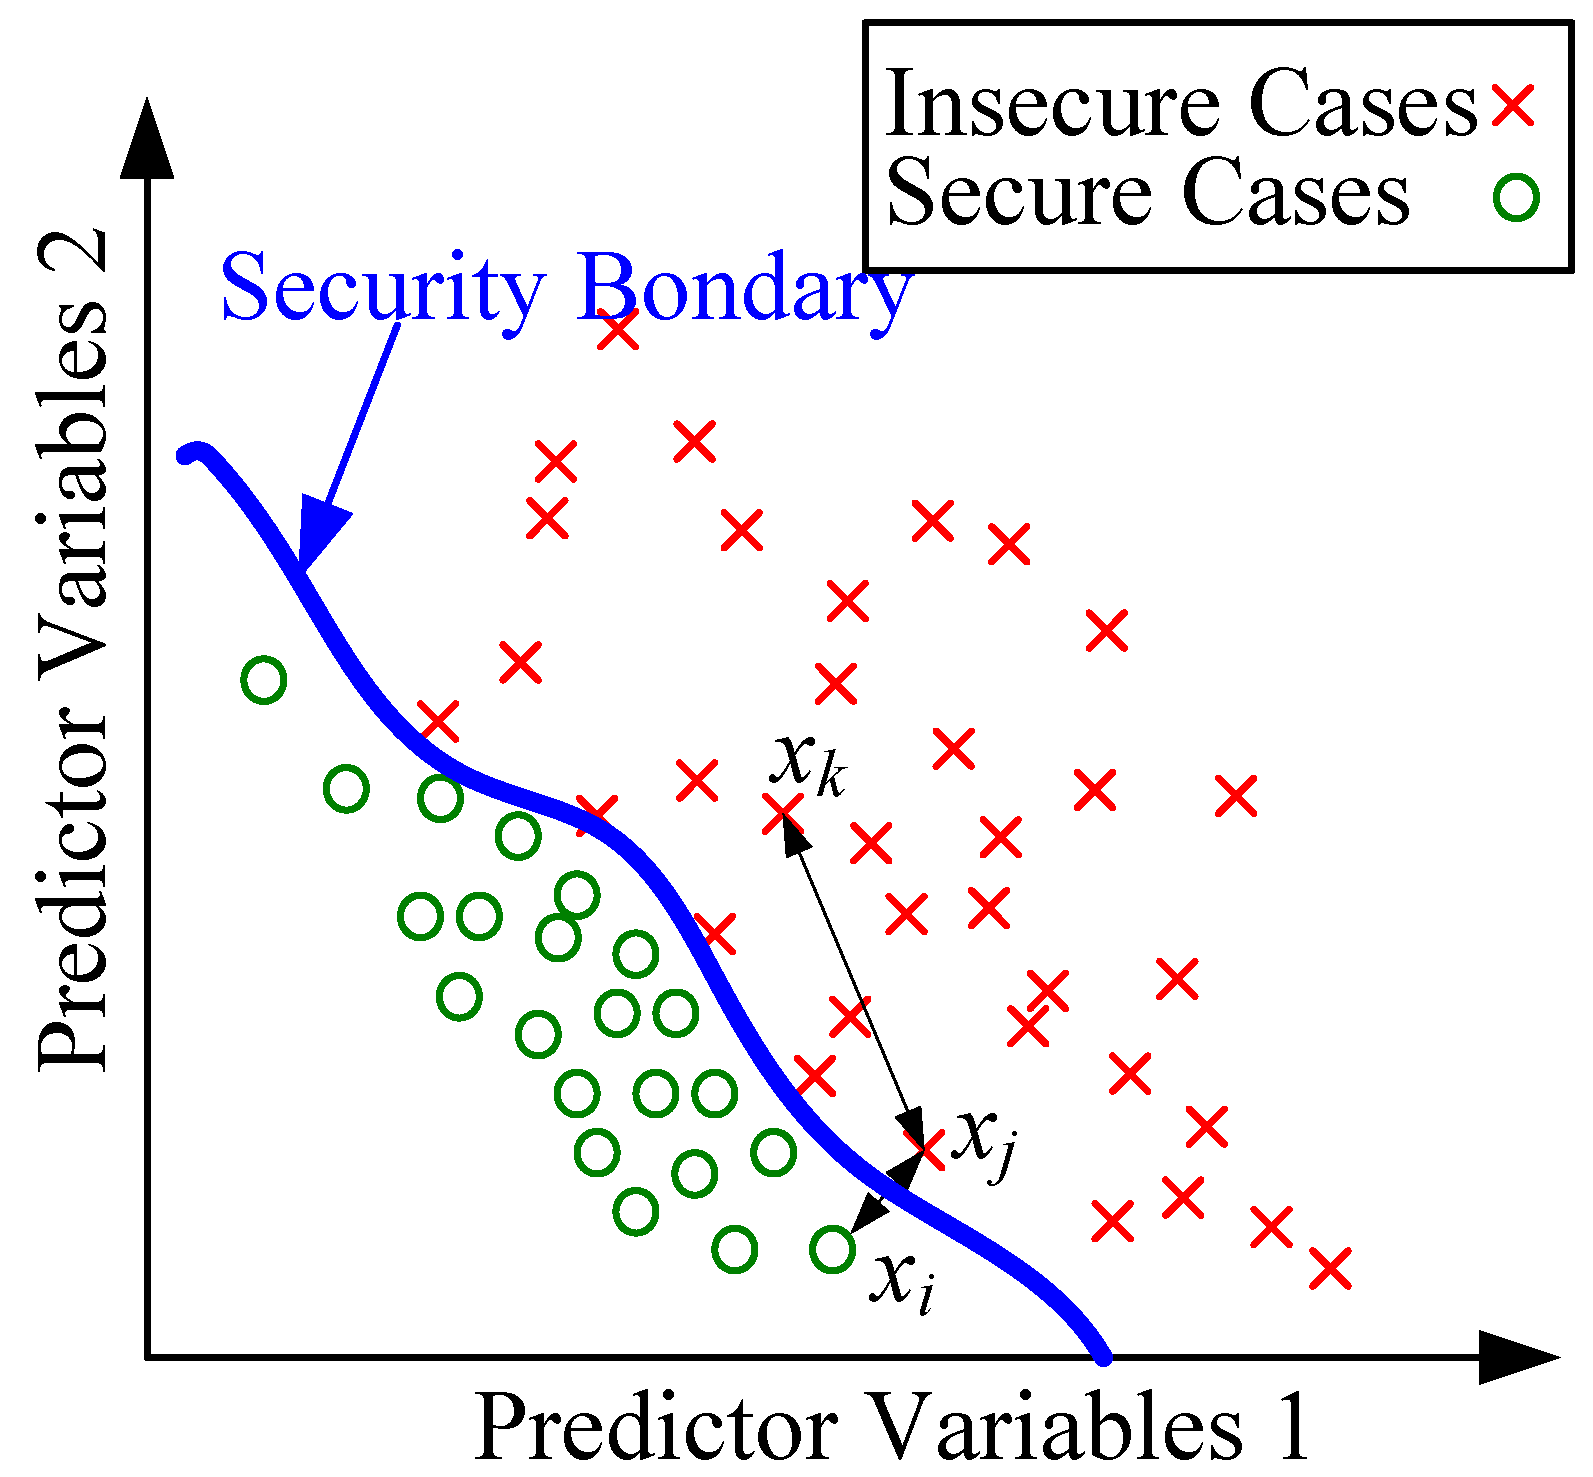
However, from the view of information theory, each two cases having less ED does not necessarily ensure they have more similar information. This can be illustrated by Figure 4, in which the circle and cross represent the secure cases and insecure cases in the database. The ED between xi and xj is obviously less than the ED between xj and xk, but xi and xj are more different in terms of information content. Hence, the distance between xi and xj is more important, because they have more contribution to the decision of security boundary shown as the blue curve.
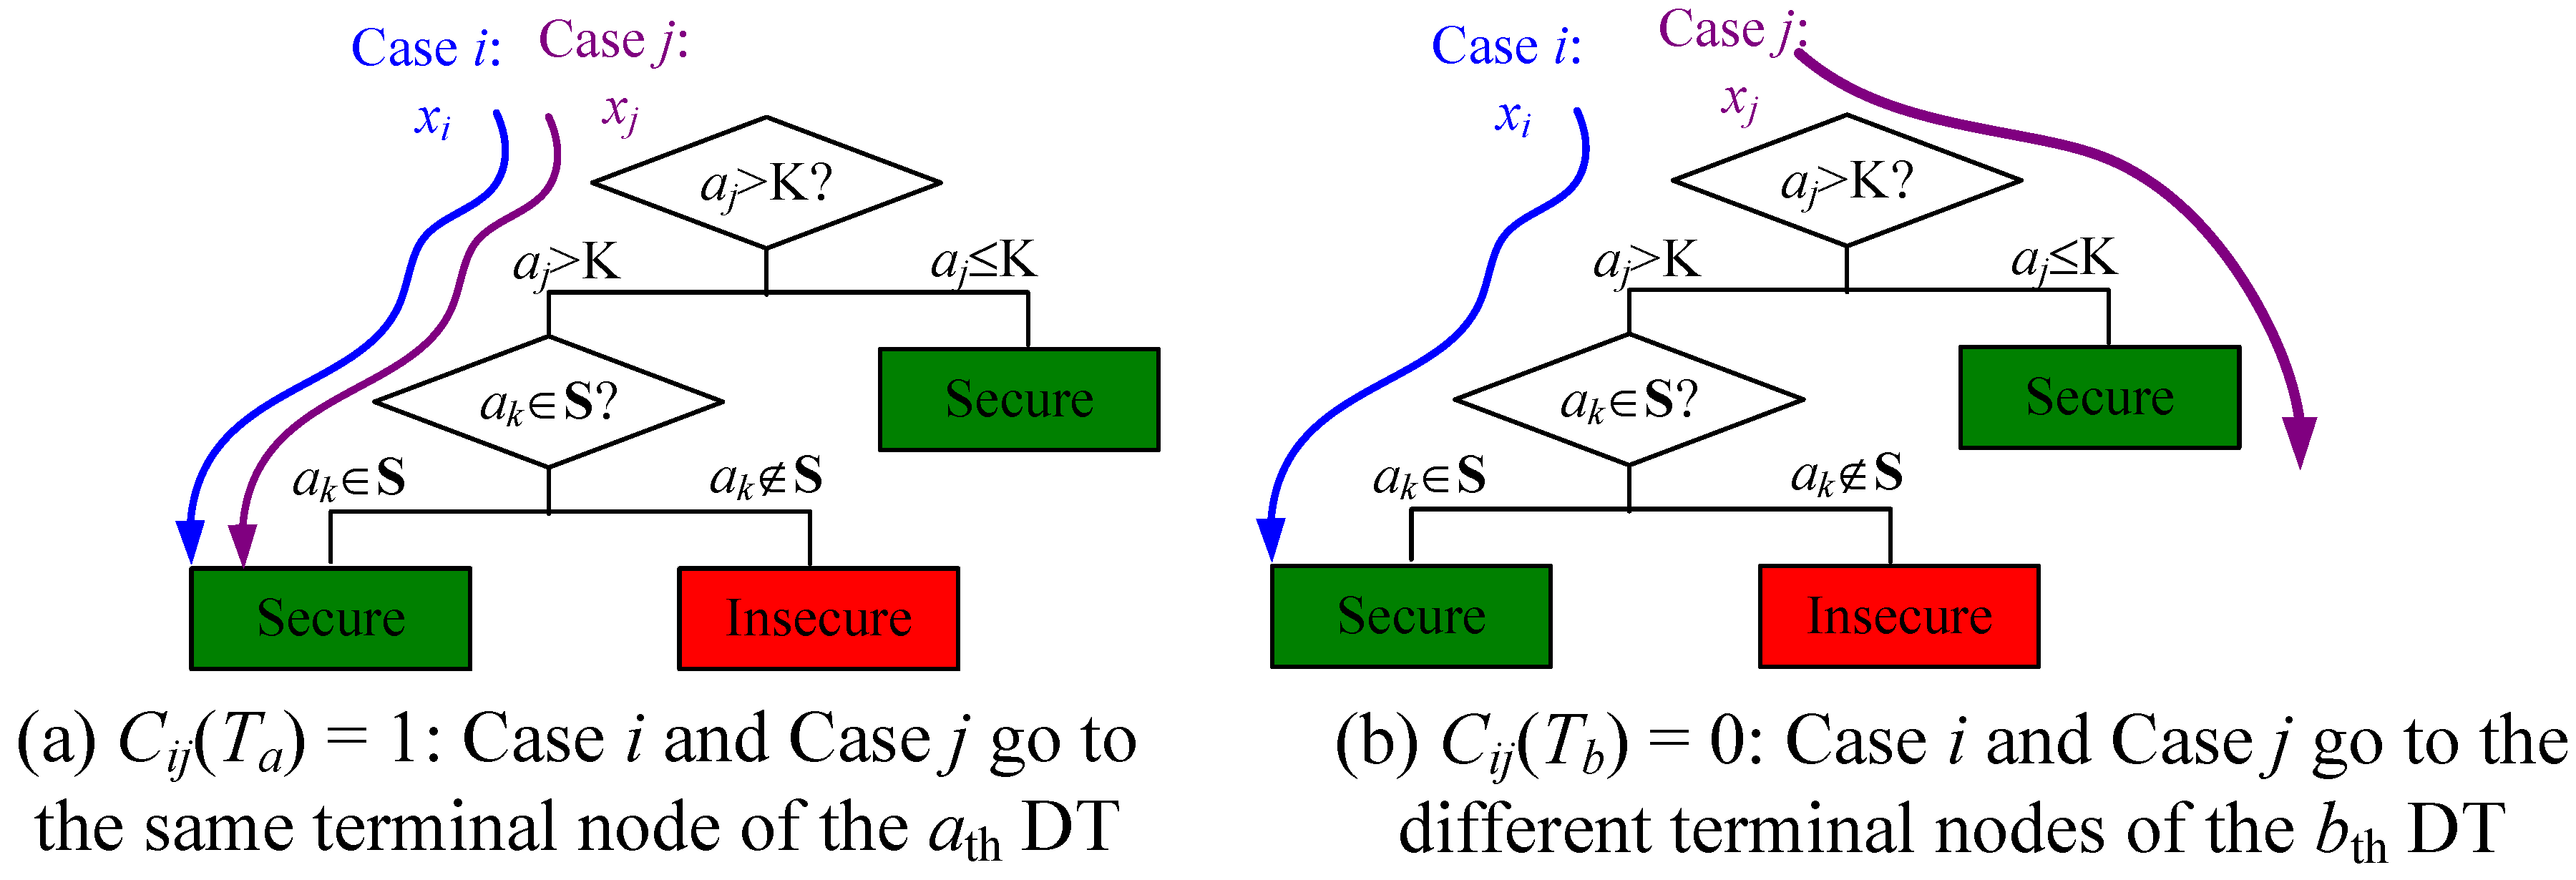
Proximity using RF is proposed as an index that effectively evaluates the similarity between each two cases in the space of observations. The proximity between Case i and Case j is the number of times that they occur in the same terminal node of trees, then these counts are normalized by dividing the total number of DTs Ntree, as defined in (6).
where Ci,j(Tk) is the one-zero function for counting the times that xi and xj go to the same terminal node, as defined in (7). As illustrated by Figure 5a, Cij(Ta) = 1, since Case i and Case j go to the same terminal node of the ath tree of RF model. Figure 5b illustrate the opposite case, so Cij(Tb) = 0.
Furthermore, a proximity matrix Prox is a 2-D matrix introduced to assess the information content of the training database. The diagonal elements in the proximity matrix Prox are 1.0 which are self-proximities. Cases that are alike will have a proximity close to 1.0, while dissimilar cases will have proximities close to 0.0.
Outliers are the cases differing from the main patterns of the dataset, which have more probability of violating the trained model. In this paper, an Outlier Index is proposed to detect the cases having small proximities to all other cases belonging to the same target class. The Outlier Index of case i is defined in (8),
where Nk is the number of cases that the classification is the same with case i, that is, Ck = Ci.
An adaptive method is also proposed for this scheme to give recommendatory Outlier Index thresholds. Here, Case i can be either one case in the training database or a new coming case outside the database. If Case i is in the training database, Equation (8) can be used to evaluate the difference of the Case i from the main pattern of the database. If Case i is out of the training database, Equation (8) can be used to evaluate the adaptability of a new coming case to the trained model. Since every trained RF model has a few misclassified cases in the database, their outlier index can be used to give the reference of the Outlier Index thresholds for the new coming cases. Therefore, to increase the robustness of the proposed scheme, the adaptive Outlier Index thresholds are introduced to give recommendatory thresholds for different OCs. Supposing the outlier indices for the misclassified cases range from [Γmin, Γmax], the recommendatory Outlier Index thresholds of the new coming cases should be larger than [Γmin, Γmax], because the new coming cases are more likely from a changed OC or system topology. In this study, the factor α > 1 is used to give the recommendatory thresholds, such as [αΓmin, αΓmax]. In this study, the factor α is given as 1.1. Although the recommendatory thresholds cannot 100% filter out unsure cases which are misclassified by the model, they can adapt to the every-changing power system OCs. This will be demonstrated in Section 4.
3.2. Scenario Generation for Database
With the increasing penetration of renewable energy resources and other forms of dispersed generation, more and more uncertainties will be brought to modern power systems. Among other variances and uncertainties, the existence of wind power forecast errors is the most challenging issue for power system operation. For online DSA, it is then necessary to generate the hourly-based scenarios using a limited number of cases that can best reproduce the variances and uncertainties. The 24 hourly OCs for daily operation decided by the maintenance plan and settled day-ahead market are selected as the basic OCs. Then, for each OC, a training database with a limited number of cases is created by the proposed scenario generation method.
A contingency-oriented training database is effective for an accurate online DSA, because (i) all the basic hourly-based OCs are dynamically obtained by forecast and scheduling, other unrelated OCs are not in the training database; (ii) the uncertainties and variances mainly driven by renewable energy resources are reproduced in the training database by this scenario generation method; (iii) there are Nc training databases for Nc critical contingencies. Each training database is prepared specifically for one contingency, so as to reduce the influence of other contingencies.
A probability distribution model is formulated in this paper to describe the wind forecast errors with respect to the wind forecast in power system scheduling. Historical wind power data obtained from [21] is used to obtain the probability distribution model of wind forecast errors.
Firstly, the historical wind power data are classified into m Wind Power Forecast Spans according to historical hourly wind power forecast data, such that the historical wind forecast errors are calculated and sorted into different forecast spans.
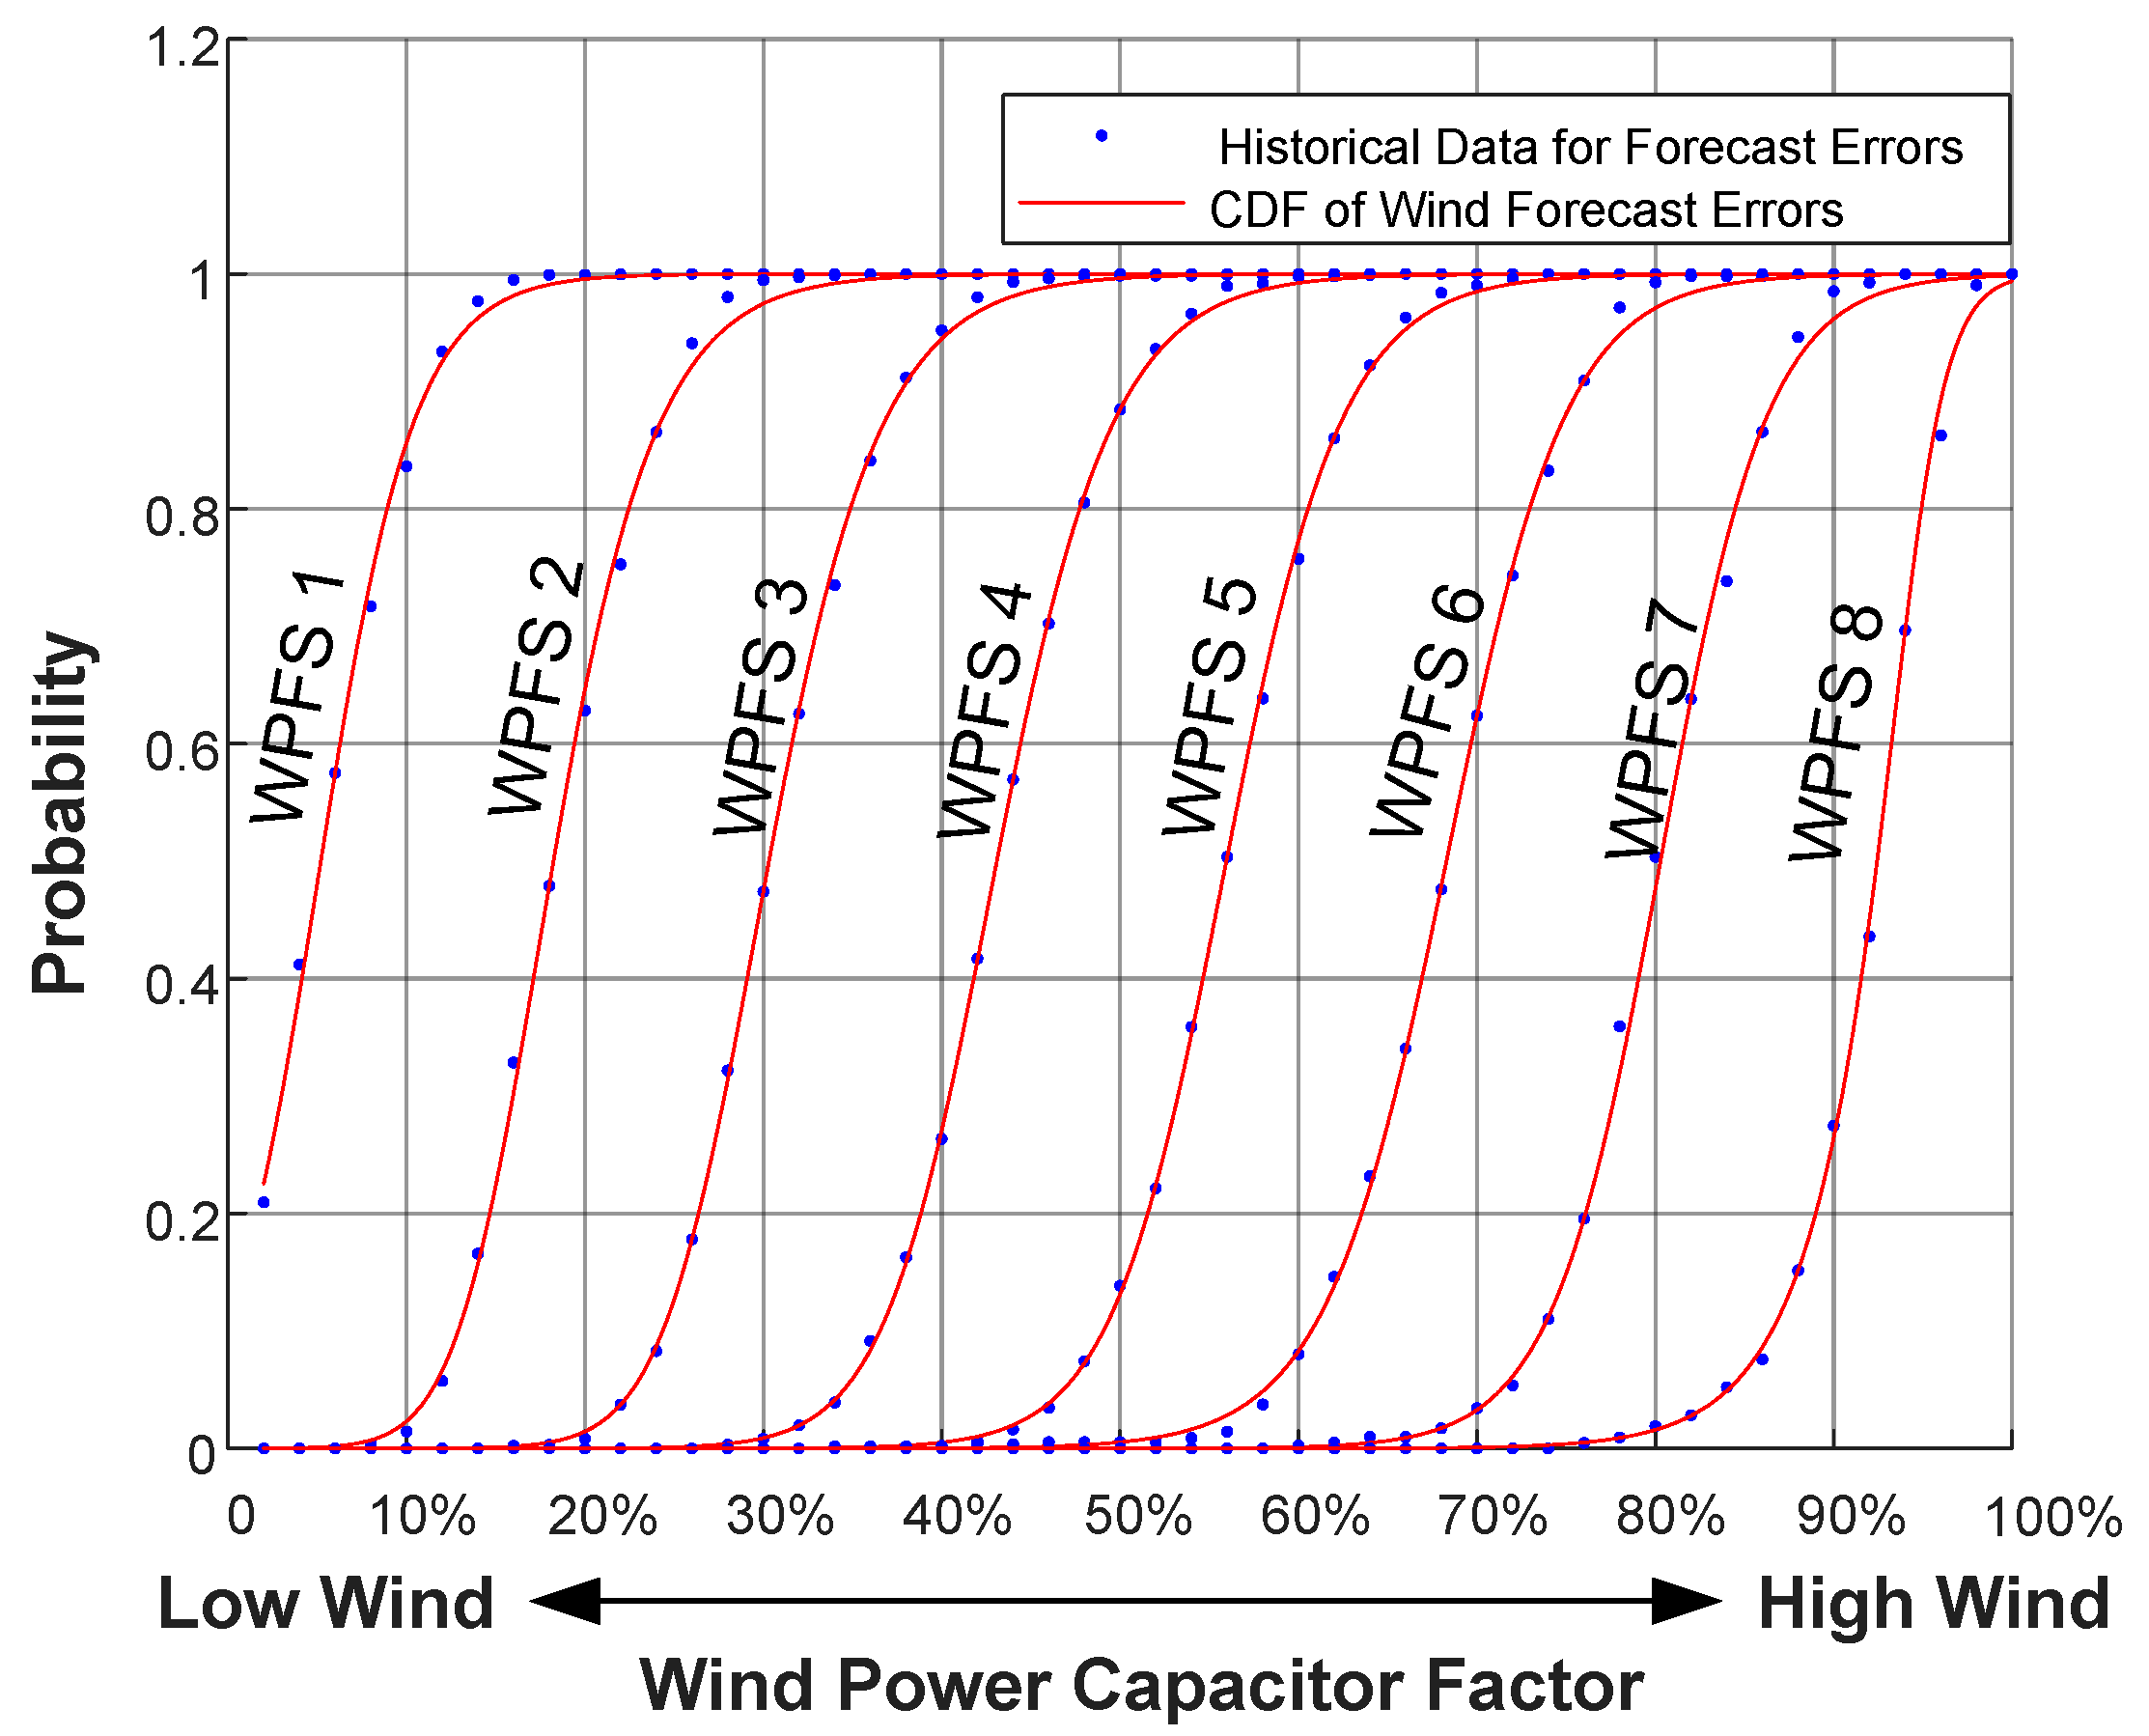
Secondly, the wind forecast errors for each Wind Power Forecast Span can be described by a model called “versatile distribution”, whose probability density function (PDF) and cumulative density function (CDF) are expressed by (9) and (10), respectively [22]. The parameters of CDFs, α, β and γ, are identified by a curve fitting algorithm, such as the Levenberg-Marquardt algorithm [23].
Finally, for each hourly basic OC, the wind power generations at different locations are randomly sampled according to the CDF of the specific Wind Power Forecast Span. Although the number of cases in the database is limited, it contains the most significant information accounting for the uncertainties.
3.3. Systematic Scheme for Online DSA
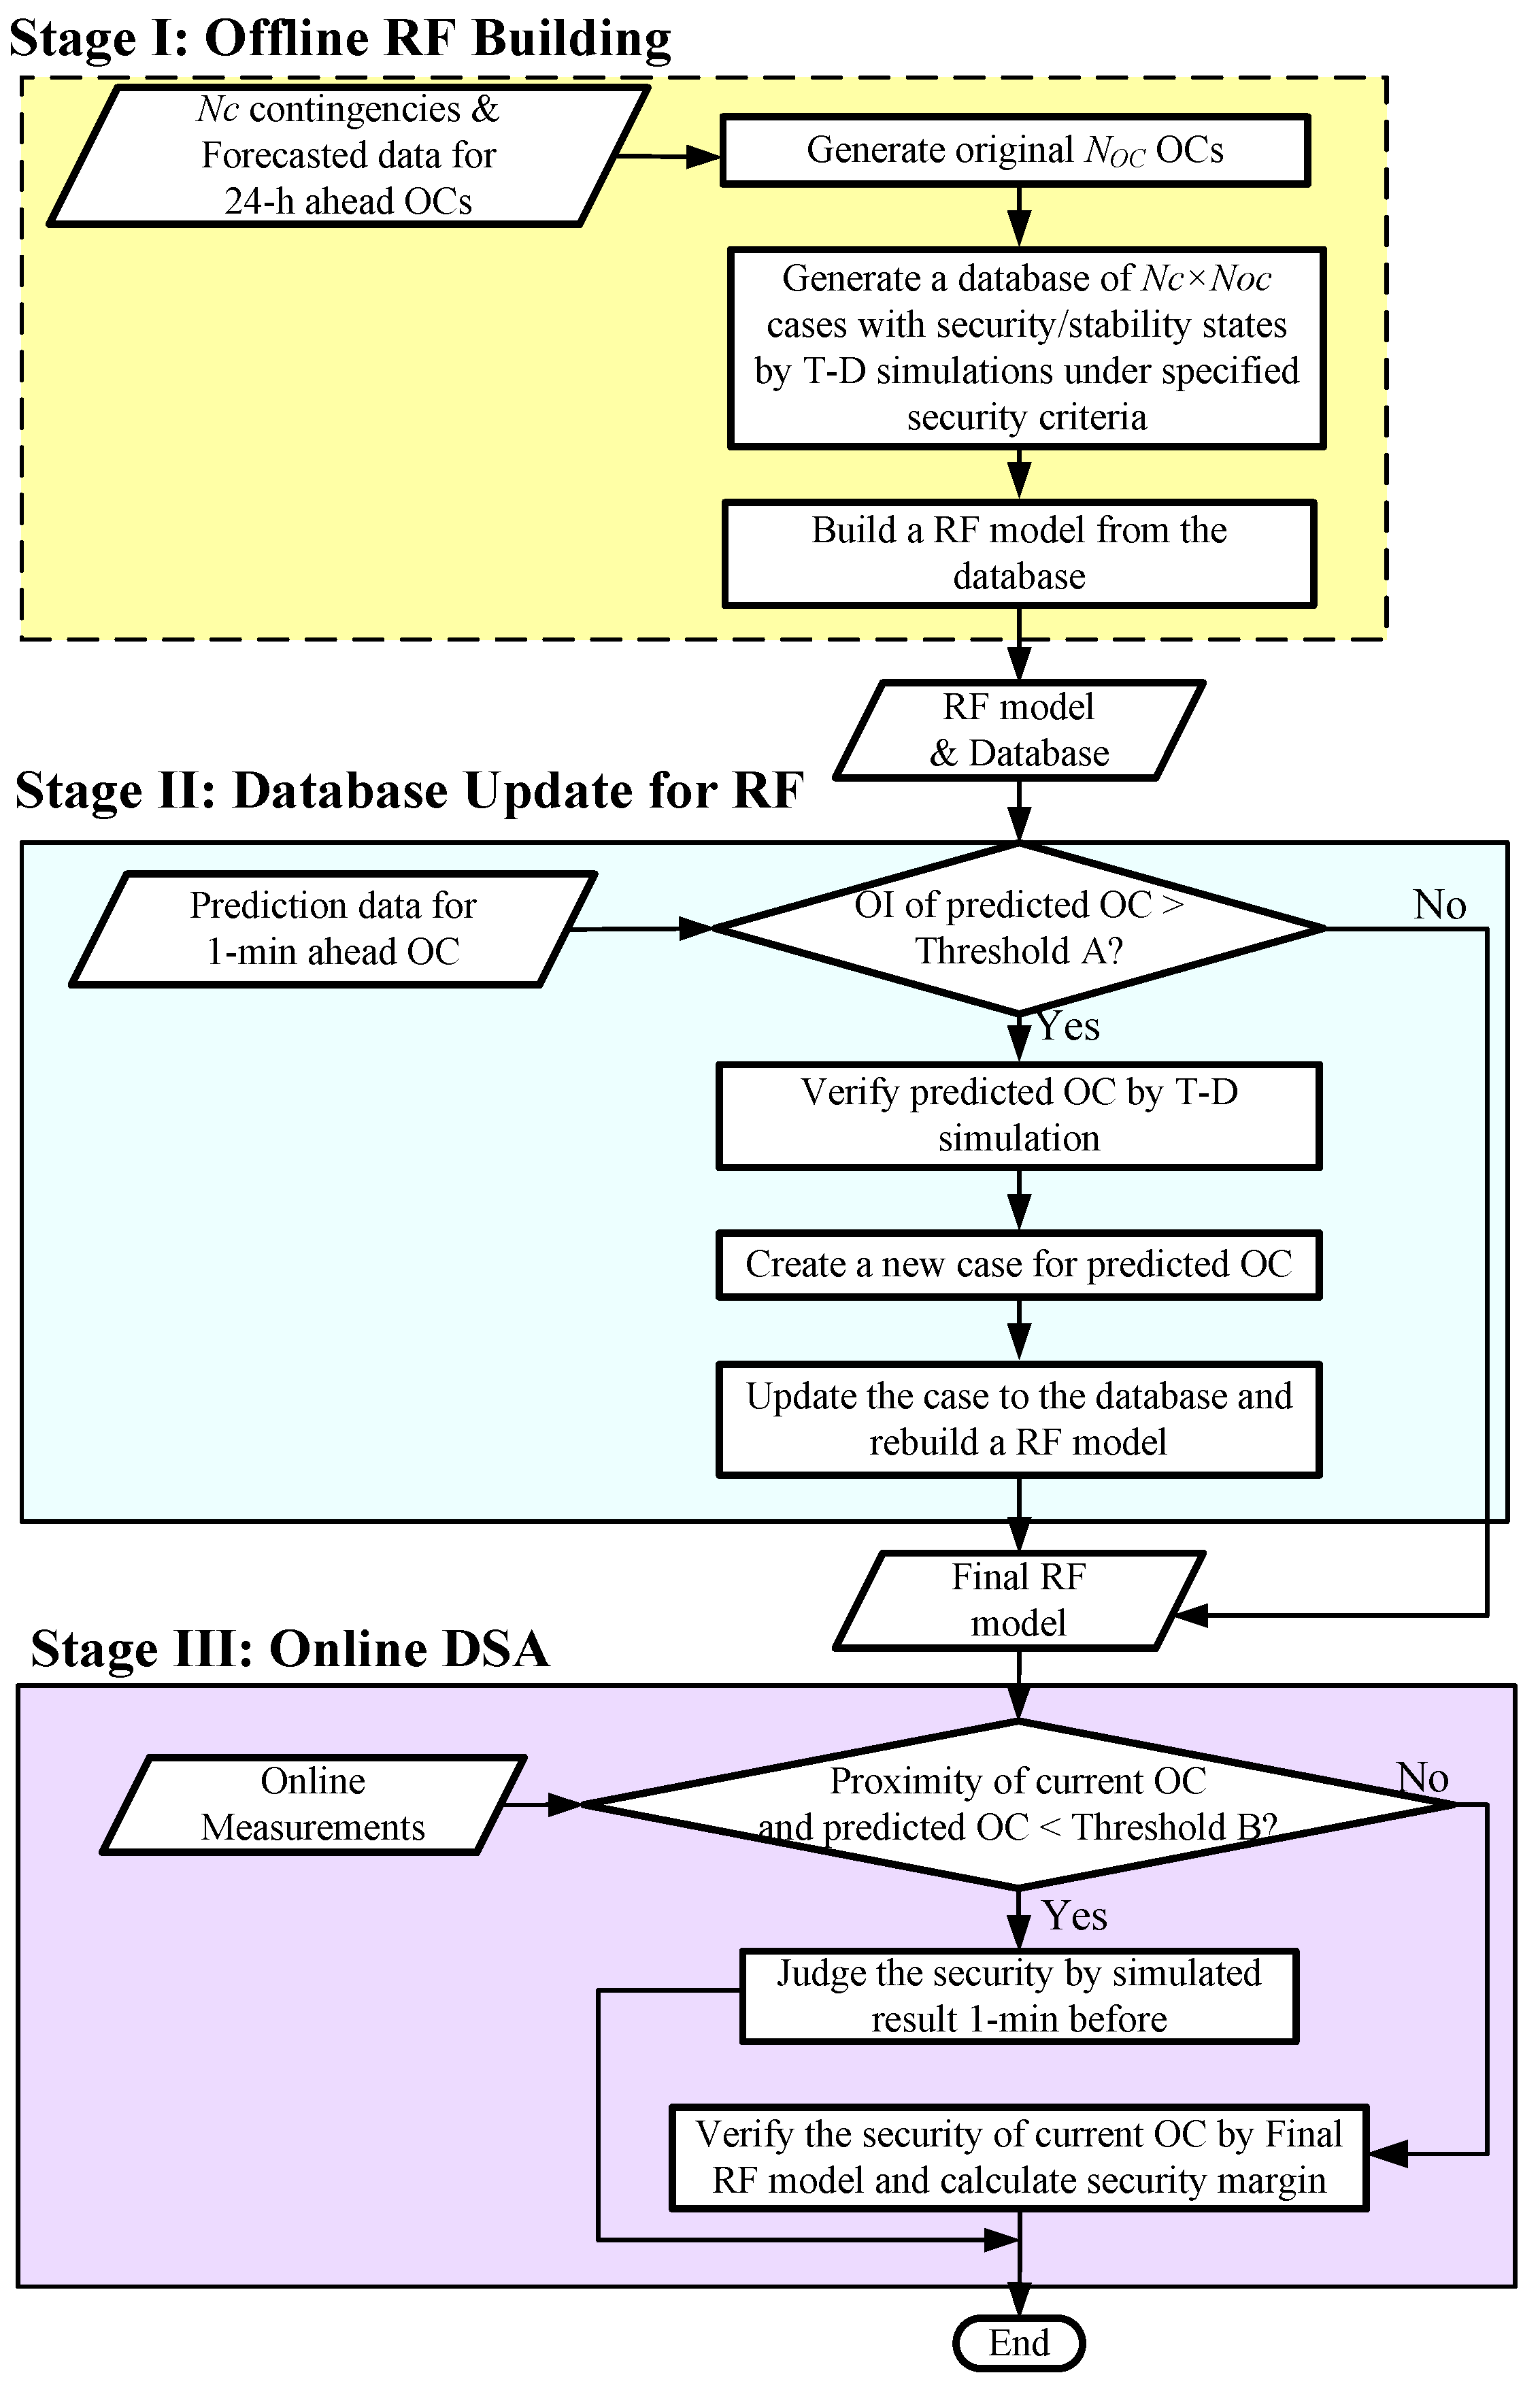
The flowchart of the proposed RF-based online DSA scheme is shown in Figure 6. The proposed approach is executed in the following three stages.
3.3.1. Stage I: Offline RF Building
For each day, 24 basic OCs are decided at the time of 12:00 one day ahead. These basic OCs are based on 24-h horizon forecasted data of the system, such as load forecast, wind forecast, unit-commitment-based generation plan, settlement of spot market, network topology as well as the unavailability of system elements due to scheduled maintenance, and so on.
Then, the Nc contingency-oriented databases containing a limited number of OCs are prepared offline by scenario generation method and detailed time-domain simulations. The scenario generation method considers uncertainties from the renewable energies, for example, the wind forecast errors. Although the total number of OCs in the database is limited, the adaptability of the final hourly-based RF model is high. It is because that it not only considers the settlement of basic OCs, but also considers the uncertainties from renewable energies.
It is pertinent to mention that Nc critical contingencies are selected offline. A preliminary set of critical contingencies are selected from industrial experience, and then a final set of Nc critical contingencies are verified by the offline time-domain simulations based on dozens of pre-defined heavily stressed OCs. Reference [24] gives some information about critical contingencies of western Danish power system.
3.3.2. Stage II: Database Update for RF Model
The system OC of 1 min ahead can be predicted with much higher accuracy by short-term power flow prediction algorithms, such as short-term load forecast and short-term wind forecast. Then the Outlier Index of 1-min ahead OC is calculated according to (8) to evaluate the proximity of the predicted OC to all the cases already existing in the database. Given an Outlier Index threshold A, the predicted OC with Outlier Index larger than the specified threshold will be filtered out as an unsure case for immediate verification by time-domain simulation. Then the original database will be updated by the new case of predicted OC together with the existing cases. Finally, an upgraded RF model will be built straightaway with strengthened information of the updated database.
3.3.3. Stage III: Online Dynamic Security Assessment
Fed by online measurement from Wide Area Measurement System and SCADA system, the proximity between current OC and predicted OC is calculated by (6). If the proximity is smaller than the specified proximity threshold B, which implies that the current OC matches the predicted OC, then the security of the current OC is decided by a detailed time-domain simulation conducted 1-min before. If the proximity is larger than the specified proximity threshold B, the security of the current OC is judged by the final RF model built in Stage II and the security margin for the current OC is calculated by Equation (3).
4. Case Study
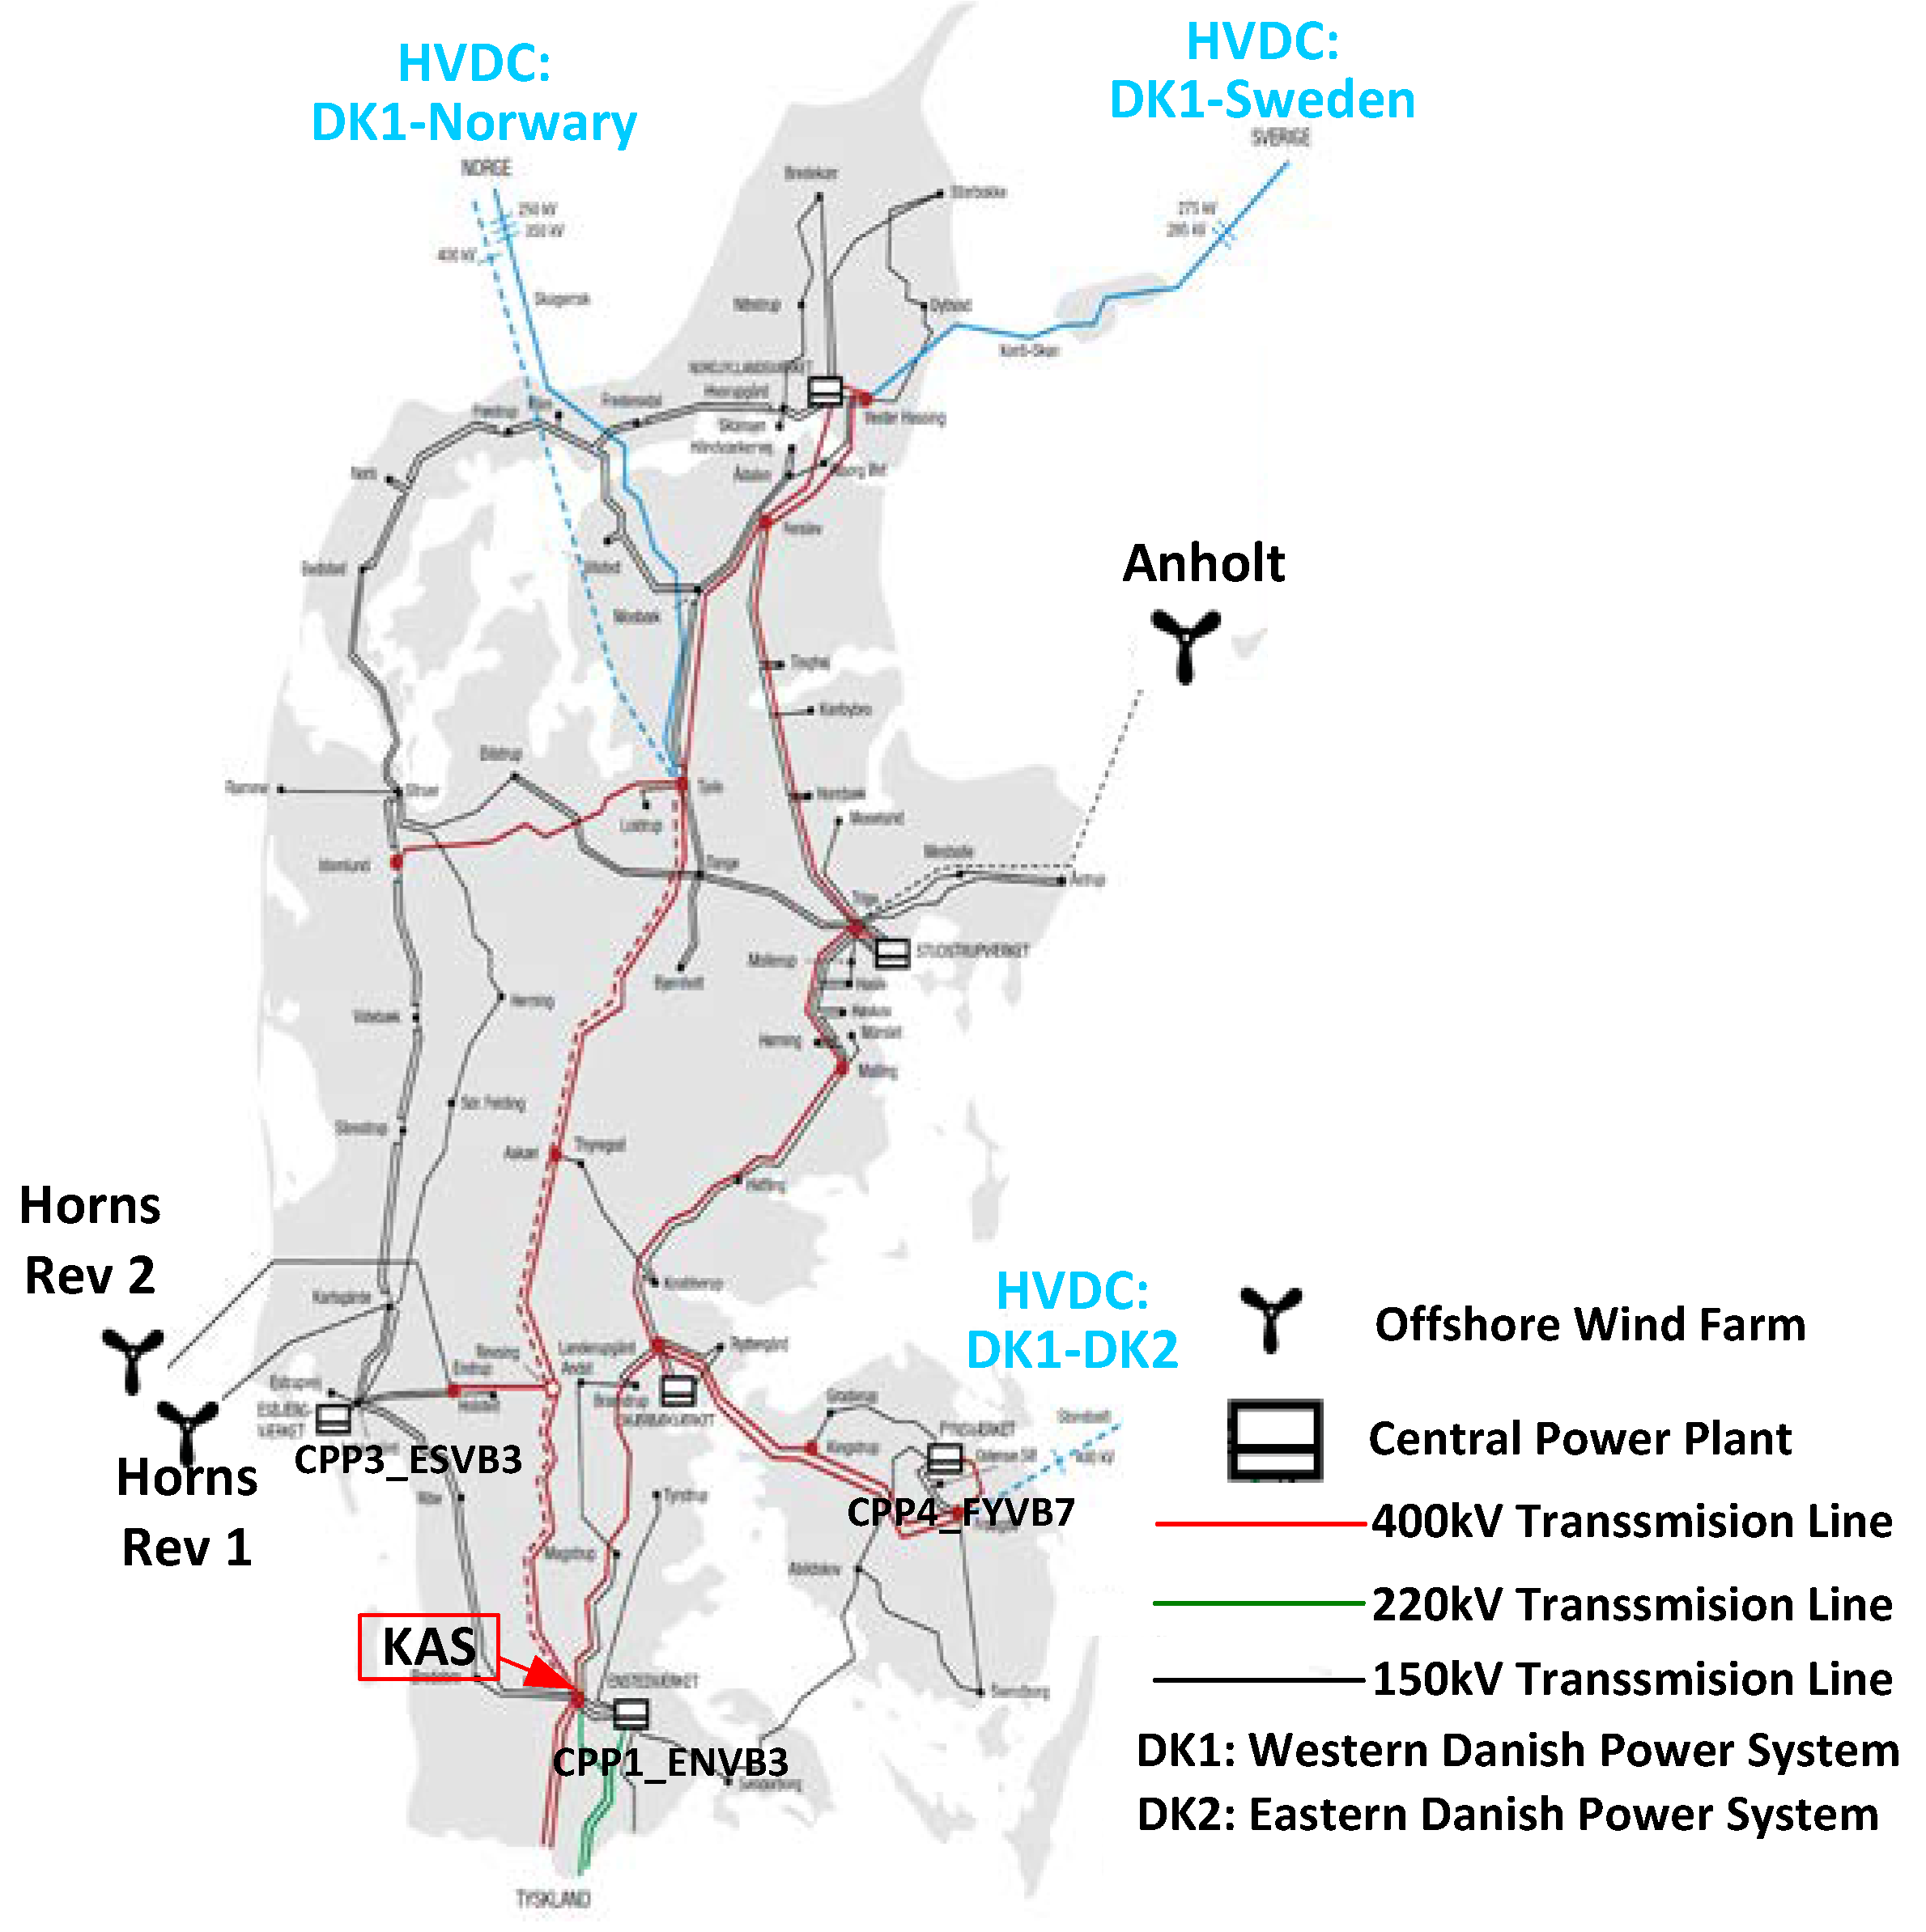
The approach proposed in this paper is demonstrated on the western Danish power system. The transmission system data of the 2020 system is published by the Danish TSO [25]. The model of western Danish power system with about 400 buses and 200 lines is then developed in DIgSILENT/PowerFactory according to the published data. There are five central power plants and three offshore wind farms connected to the power grid at the transmission system level. Besides, around 150 combined and heat power plants and more than 200 onshore wind power plants are integrated at the distribution system level. The geographical map of the western Danish power system is shown in Figure 7 [25].
The probability distribution model using “versatile distribution” is adopted to describe the probability distribution function of the wind forecast errors. Based on the historical hourly wind power data from [21], the parameters of the CDF for wind forecast error with respect to different Wind Power Forecast Spans is identified as in Table 1, where the level of wind power generation in percentage are sorted into 8 spans, m = 8. α, β and γ are the parameters of versatile distribution for different Wind Power Forecast Spans whose CDFs are expressed as (10). The CDFs for different Wind Power Forecast Span are shown in Figure 8.
As mentioned in Section 2, the training process of the RF model should be based on a database which is prepared by offline time-domain simulation considering the critical “N–1” contingencies and “N–k” contingencies from Danish Transmission System Operator’s historical record and knowledge. The disturbance is the three-phase faults at the terminals of 400/150 kV transmission lines with a clearing time of 0.12 s (6 cycles). The time-domain simulation is carried out by a desktop computer with Intel Core i7-6700 CPU @ 3.4 GHz with 16 GB RAM. It takes 5–6 s for completing each dynamic time-domain simulation, so more than 600 cases can be generated within one hour. The database contains not only the measurement data as predictor values, but also the target values which are the results of time-domain simulation, secure (S) or insecure (I) based on criteria as given below:
(a) Transient Stability: The system is considered as transient instable for a given contingency, if the systems transient stability index (TSI) defined by (11) is lower than 10%, in which Δδmax is the maximum angle separation of any two rotor angles in degree. Here the TSI in Equation (11) is based on TSAT’s power swing-based algorithm [26].
(b) Short-Term Voltage Security: The system is considered to be insecure if the duration of any bus voltage going out of range from 0.8 pu to 1.1 pu is longer than 0.5 s. For more details about the criteria of transient stability and short-term voltage security, please refer to [27,28,29].
The security regarding the transmission line overload of all critical scenarios with all “N–1” contingencies has been considered in the phase of the network planning. The “N–1” contingencies should include the loss of transmission lines and transformers as well as the loss of generator or a large wind farm. Nevertheless, in order to demonstrate the proposed approach with a typical scenario, the OC with peak load and peak wind power generation, with one 400 kV backbone KAS_400_LAG and one VSC-HVDC out of service is selected as the test scenario. This test scenario is identified to be one of the most insecure OCs, which is very close to the security boundary. The wind power is within the maximum Wind Power Forecast Span No. 8, that is, the wind power capacity factor is between 87.5% and 100%, so α = 76.2 β = 0.370 and γ = 0.944 for the cumulative density function (CDF) of versatile distribution.
The contingency is a 3-phase short circuit in 400 kV overhead line FGD_400_LAG close to the substation of LAG followed by the line trip. The short circuit place is marked as a red square in Figure 7. Then a database with 660 cases for hourly-based OC is randomly sampled from versatile distribution considering the variance of dispersed generation, such as wind farms.
The data mining software Salford Predictive Miner is adopted to train an RF model base on the database [30]. The database is contingency-oriented and hourly-based, since each database is oriented to the security result of a single contingency and the OC for each hour. Unlike the single DT model, the RF model randomly selects the data in learning set and test set based on the Bootstrap sampling method, so for each DT in the RF model, the size of the learning set is the same with the training database and the size of test set is about one third (i.e., e−1 = 36.8%) of the size of the training database.
Typically, for a classification problem with p predictors using the RF model, features are recommended to be selected in each split [18]. Here 10 out of 202 predictors are randomly selected as the predictors within each node of every DT. The RF model contains 500 deep-grown DTs, Ntree = 500, since the training process shows that the performance of the RF model (Error Rate) does not improve obviously after the 300th DT.
Figure 9 shows the proximity matrix map of the 660 cases in the training database, in which the blue color shows the secure cases and red color shows the insecure cases. The brightness of the points indicates the value of proximity (i.e., 0~1) between each 2 cases of the same class in the dataset, which is calculated by (6). The accuracy of the trained RF model is 96.21%, with 25 misclassified cases whose outlier indices range from 1.43 to 4.62, so the recommendatory OI threshold is 1.573 and 5.082, such that factor α = 1.1.
After the training process of RF model, another database with 440 cases with different variance parameters and network topologies, completely independent from the previous database is generated to validate the created RF model. Figure 10a shows the 440 cases in the test set with respect to their Outlier Index, which are then sorted in descendent order in Figure 10b. The misclassified cases are all within the 30 cases with the highest Outlier Index. The blue cases are the correct ones, while the green and red cases are the misclassified ones. Larger Outlier Index implies larger difference between the new case and the cases in the training database, uncertainty of wind power generation is one of the aspects of the multifold issue. Different wind power forecast spans (WPFSs) have different variances. The medium WPFSs, for example, WPFS No. 2 No. 3 and No. 4, have larger variances. However, larger variances of renewable energies do not necessarily result in a lower accuracy of the RF model, because medium WPFS does not push the system OCs to the security boundary and most of the cases in the database are the secure ones.
Given a threshold of Outlier Index, the predicted OC with an Outlier Index larger than the specified threshold will be filtered out as an unsure case for immediate verification by time-domain simulation. For practical applications in industry, the cost of misclassification from insecure to secure (I→S) should be higher than that from secure to insecure (S→I), so two different minimum OI thresholds are proposed. One is proposed only focusing on the more severe misclassification (i.e., I→S), and the other is proposed for all the misclassifications (i.e., I→S and S→I). With the limited computational resources, further time-domain simulations should better focus more on the former one (i.e., I→S). Thus, it is important to further validate the security of the secure cases in the unsure band judged by the RF model.
It is also pertinent to mention that, when training the RF model, “prior probability” can also be used to effectively control the splitting rules over the tradeoff between the class purity and class accuracy. Since the severity of misclassification of I→S and S→I are different, one can set the prior probabilities of secure and insecure cases in the database to give the severity of misclassification I→S as higher than misclassification S→I. Therefore, the RF model will be trained to be more conservative for I→S cases.
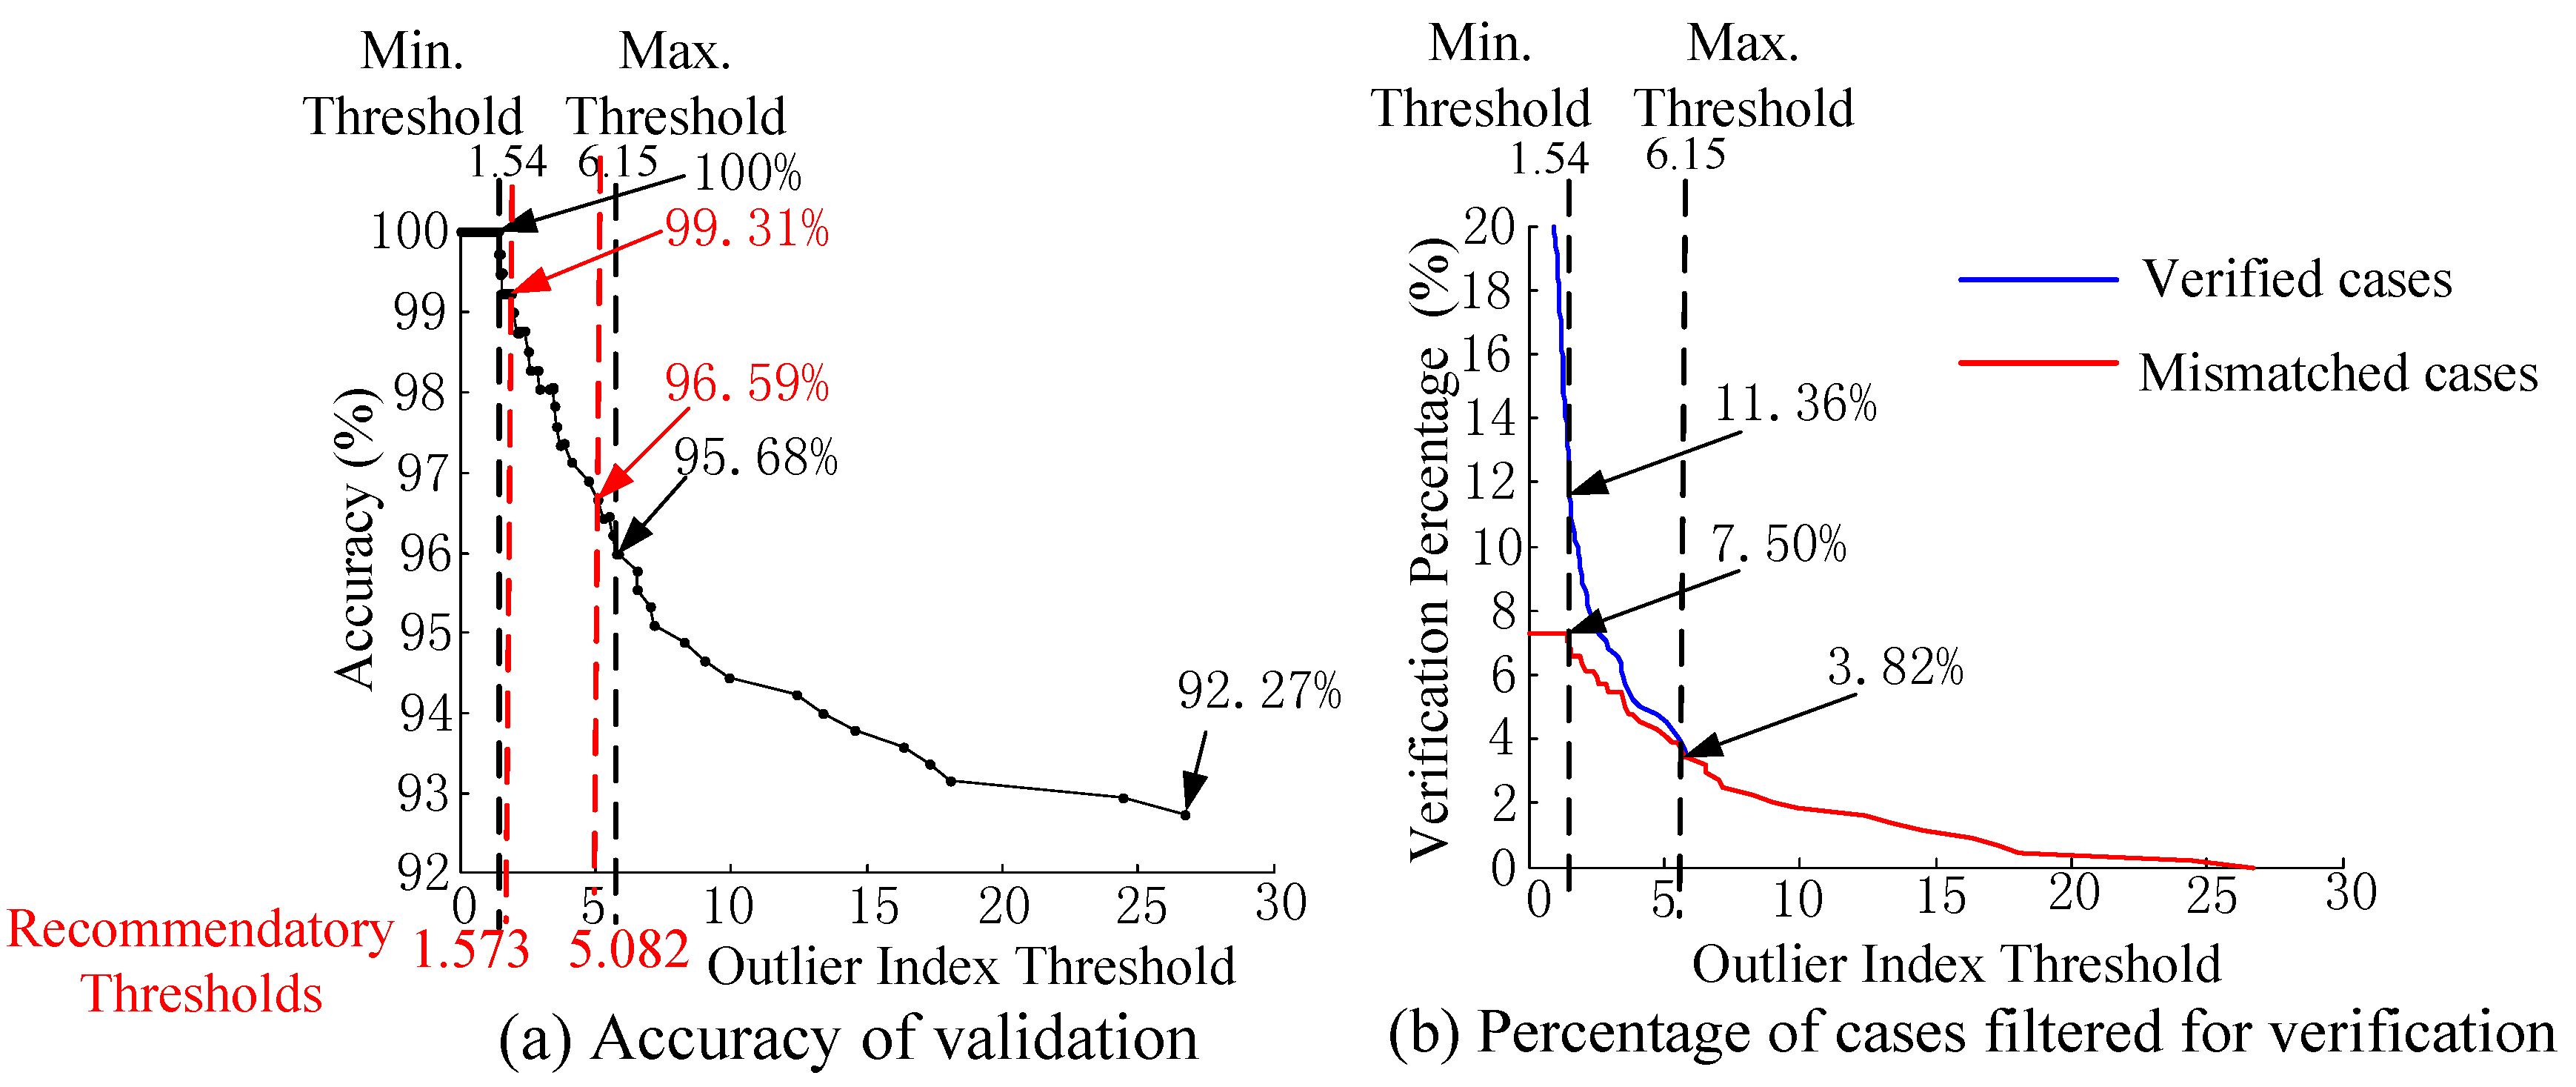
As shown in Figure 11a, the original accuracy of the RF model is tested as 92.27%. If the Outlier Index threshold is given as 6.15 and all the cases with an Outlier Index larger than 6.15 are verified by further time-domain simulation, the accuracy can be increased to 95.68%. Whilst, if a stricter (more conservative) threshold is given for I→S misclassifications (i.e., 1.54), the accuracy of truly insecure cases can reach to even 100%. The recommendatory Outlier Index thresholds are 1.573 and 5.082, so the accuracy can be increased to 96.59%% and 99.31%.
Figure 11b shows the percentage of cases that need further verification. Only a percentage of 3.82% out of 440 cases needs to be verified if the threshold is given as 6.15. Nevertheless, a percentage of 11.36% out of 440 cases needs to be verified if a stricter threshold is given as 1.54, and within these cases, a percentage of 7.50% are the mismatched cases.
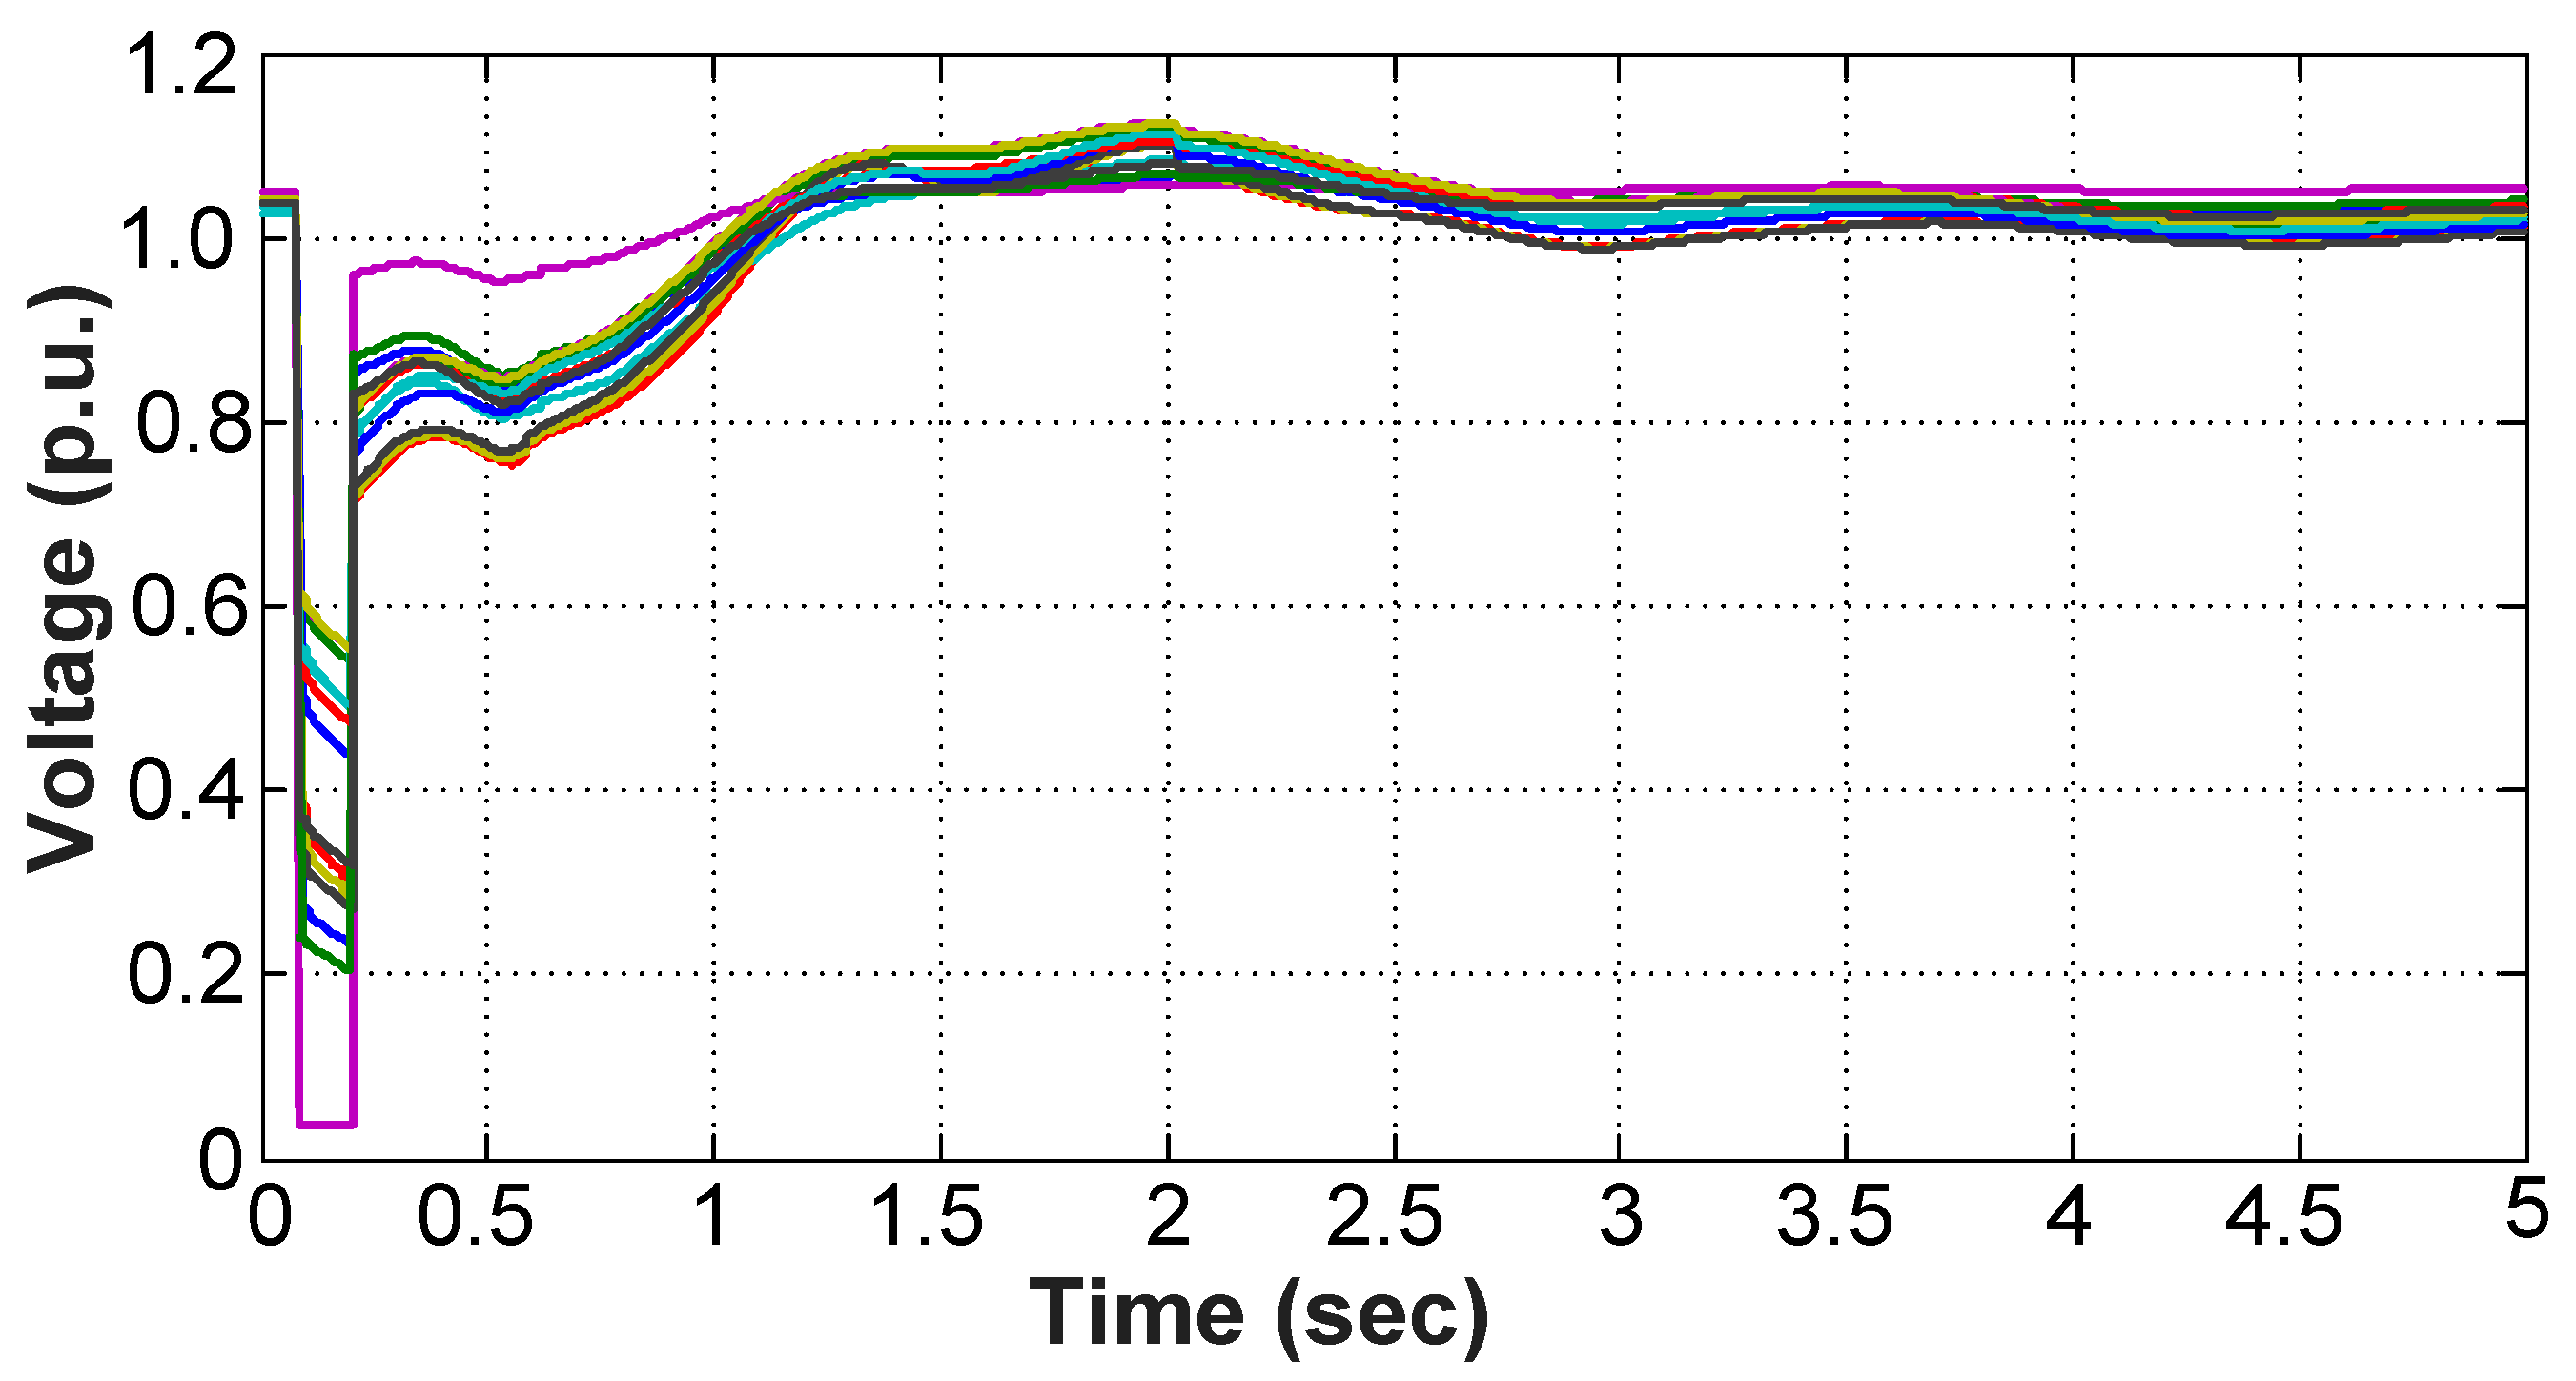
In this case study, the I→S misclassified case with minimum Outlier Index decides the minimum Outlier Index threshold, 1.54, as tagged in Figure 10a. This case is a marginal insecure case. The time-domain simulation result of all the 400 kV bus voltages for this misclassified case is shown in Figure 12. It can be noticed that the voltages of this insecure case marginally violate the criterion of short-term voltage security. This marginal insecure case can be filtered out if the threshold is no more than 1.54.
Thus, in the operational environment, the hourly-based database can be updated by the new verified cases of predicted OCs together with the existing ones. Finally, a stronger RF model can be created straightaway with strengthened information of the updated database. Because of the temporal continuity of power system operation, the OCs in consecutive minutes do not vary too much. Therefore, the percentage of filtered out cases for verification should be significantly decreased if new cases of current OCs are added into the database for upgrading the RF model.
Table 2 shows the sensitivity analysis of the original RF model and the OI thresholds in the context of different renewable energy penetration levels for the same contingency. The wind power capacity factors (WPCF) are increased from 12.5% to 100%, and the generation from central power plants decreases to balance the system. For WPCF lower than 75.0%, all the cases in the database are secure, so there is no need for an Outlier Index threshold aiming at filtering out the unsure cases. For WPCF 75.0%, the original RF model is 96.81%, relatively higher than the basic study case. The Outlier Index thresholds of WPCF 75.0% are also higher, because the basic OC is relatively more secure compared with 100% wind power generation, which results in clearer classifications between secure cases and insecure cases.
The values of Outlier Index thresholds may shift as the power system OCs vary. Indefinitely reducing the Outlier Index thresholds or setting the Outlier Index thresholds to very small values aiming at achieving 100% accuracy is impossible. It will reduce the efficiency because of the increasing cases that need for further time-domain validations. However, the proposed scheme provides an indicator that can significantly filter out those unsure cases. Recommendatory thresholds are also calculated by the proposed adaptive method, shown in the last column of Table 2. Although the recommendatory thresholds cannot ensure 100% reliability to filter out the misclassified cases, they can adapt to the every-changing power system OCs.
5. Conclusions and Discussion
This paper proposes an online DSA approach based on RF. This approach is demonstrated on the western Danish power system considering the uncertainties of wind power and other forms of dispersed generation. A scenario generation method is proposed to create the contingency-oriented training database. Given a threshold of Outlier Index, misclassified cases can be filtered out as outliers for further verification one minute ahead of the real time. Practically, this outlier identification method is able to improve the accuracy of online DSA.
This paper is a first step towards a goal to achieve online DSA with higher accuracy theoretically in the presence of uncertainties of renewable energy. For a specific OC, the exact value of Outlier Index thresholds to be given should have a strong relationship with the value of variance or uncertainties of wind or other DG units in mathematics, which is being pursued in future study.
The algorithm of CART is used as the basic algorithm to train each DT of the RF model. Other tree generation algorithms, such as ID3, C4.5, and C5.0 can also be combined in the RF frameworks to achieve a better performance [16].
Author Contributions
All of the authors have contributed to this research. C.L. proposed the main approach, implemented part of the simulations and wrote the manuscript. F.T. suggested part of the study idea, shared ideas in revising the paper and wrote part of the manuscript. C.L.B. suggested part of the research idea, gave many advices to the structure of the manuscript and provided part of the testing data.
Funding
National Natural Science Foundation of China (Grant No. 51507116) and the State Grid Corporation of China (Grant No. SGHBJY00PSJS1800037, Research on the development form and construction technology of power grid based on functional attributes).
Acknowledgments
This research is sponsored in part by the National Natural Science Foundation of China (Grant No. 51507116) and in part by the State Grid Corporation of China (Grant No. SGHBJY00PSJS1800037, Research on the development form and construction technology of power grid based on functional attributes).
Conflicts of Interest
The authors declare no conflict of interest.
Nomenclature
| DT | Decision tree |
| ED | Euclidean distance |
| RF | Random forest |
| OC | Operating condition |
| CDF | Cumulative density function |
| DSA | Dynamic security assessment |
| OI | Outlier index |
| WPFS | Wind Power Forecast Span |
| TSI | Transient stability index |
| Probability density function |
References
- Fouad, A.A.; Aboytes, F.; Carvalho, V.F.; Corey, S.L.; Dhir, K.J.; Vierra, R. Dynamic security assessment practices in North America. IEEE Trans. Power Syst. 1998, 3, 1310–1321. [Google Scholar] [CrossRef]
- Sauer, P.W. Dynamic security assessment. In Power System Stability and Control, 2nd ed.; Chapter 15; CRC Press: Boca Raton, FL, USA, 1985. [Google Scholar]
- Zhu, Y.; Riyasat, A.; Amna, H.; Sun, K. Microgrid security assessment and islanding control by support vector machine. In Proceedings of the IEEE PES General Meeting, Denver, CO, USA, 26–30 July 2015. [Google Scholar]
- Al-Masri, A.N.; Ab Kadir, M.Z.A.; Hizam, H.; Mariun, N. A novel implementation for generator rotor angle stability prediction using an adaptive artificial neural network application for dynamic security assessment. IEEE Trans. Power Syst. 2013, 28, 2516–2525. [Google Scholar] [CrossRef]
- Xu, Y.; Zhang, R.; Zhao, J.; Dong, Z.Y.; Wang, D.; Yang, H.; Wong, K.P. Assessing short-term voltage stability of electric power systems by a hierarchical intelligent system. IEEE Trans. Neural Netw. Learn. Syst. 2016, 27, 1686–1696. [Google Scholar] [CrossRef] [PubMed]
- Liu, C.; Sun, K.; Rather, Z.H.; Chen, Z.; Bak, C.L.; Thøgersen, P.; Lund, P. A system approach for dynamic security assessment and the corresponding preventive control scheme based on decision trees. IEEE Trans. Power Syst. 2014, 29, 717–739. [Google Scholar] [CrossRef]
- Sun, K.; Likhate, S.; Vittal, V.; Kolluri, V.S.; Mandal, S. An online dynamic security assessment scheme using phasor measurement and decision trees. IEEE Trans. Power Syst. 2007, 22, 1935–1943. [Google Scholar] [CrossRef]
- Liu, C.; Bak, C.L.; Chen, Z.; Lund, P. Dynamic security assessment of western Danish power system based on ensemble decision trees. In Proceedings of the 12th International Conference on Developments in Power System Protection (DPSP), Copenhagen, Denmark, 31 March–3 April 2014. [Google Scholar]
- Liu, C.; Rather, Z.H.; Chen, Z.; Bak, C.L. Importance sampling based decision trees for security assessment and the corresponding control schemes: The Danish case study. In Proceedings of the IEEE PES PowerTech, Grenoble, France, 16–20 June 2013. [Google Scholar]
- He, M.; Vittal, V.; Zhang, J. Online dynamic security assessment with missing PMU measurements: A data mining approach. IEEE Trans. Power Syst. 2013, 28, 1969–1977. [Google Scholar] [CrossRef]
- Genc, I.; Diao, R.; Vittal, V.; Kolluri, S.; Mandal, S. Decision tree-based preventive and corrective control application for dynamic security enhancement in power systems. IEEE Trans. Power Syst. 2010, 25, 1611–1619. [Google Scholar] [CrossRef]
- Konstantelos, I.; Jamgotchian, G.; Tindemans, S.H.; Duchesne, P.; Cole, S.; Merckx, C.; Strbac, G.; Panciatici, P. Implementation of a massively parallel dynamic security assessment platform for large-scale grids. IEEE Trans. Smart Grid 2017, 8, 1417–1426. [Google Scholar] [CrossRef]
- Geeganage, J.; Annakkage, U.D.; Weekes, T.; Archer, B.A. Application of energy-based power system features for dynamic security assessment. IEEE Trans. Power Syst. 2015, 30, 1957–1965. [Google Scholar] [CrossRef]
- Mohammadi, A.; Mehrtash, M.; Kargarian, A. Diagonal quaratic approximation for decentralized collaborative TSO+DSO optimal power flow. IEEE Trans. Smart Grid 2018, (in press). [Google Scholar] [CrossRef]
- Electric Advisory Committee. Smart Grid: Enabler of the New Energy Economy; US Department of Energy: Washington, DC, USA, 2008.
- Kaci, A.; Kamwa, I.; Dessaint, L.; Guillon, S. Synchrophasor data baselining and mining for online monitoring of dynamic security limits. IEEE Trans. Power Syst. 2014, 29, 2681–2695. [Google Scholar] [CrossRef]
- Kamwa, I.; Samantaray, S.R.; Joos, G. Catastrophic predictors from ensemble decision-tree learning of wide-area severity indices. IEEE Trans. Smart Grid 2010, 1, 144–158. [Google Scholar] [CrossRef]
- He, M.; Zhang, J.; Vittal, V. Robust online dynamic security assessment using adaptive ensemble decision-tree learning. IEEE Trans. Power Syst. 2013, 28, 4089–4098. [Google Scholar] [CrossRef]
- Breiman, L.; Friedman, J.; Stone, C.J.; Olshen, R.A. Classification and Regression Trees; Wadsworth: Belmont, CA, USA, 1984. [Google Scholar]
- Breiman, L. Random forest. Mach. Learn. 2001, 45, 5–32. [Google Scholar] [CrossRef]
- Hourly Danish Power System Data. Available online: https://energinet.dk/El/Data-om-energisysteemet (assessed on 27 May 2018).
- Zhang, Z.; Sun, Y.; Gao, D.; Lin, J.; Cheng, L. A versatile probability distribution model for wind power forecast errors and its application in economic dispatch. IEEE Trans. Power Syst. 2013, 28, 3114–3125. [Google Scholar] [CrossRef]
- Vetterling, W.T.; Teukolsky, S.A.; Press, W.H.; Flannery, B.P. Numerical Recipes in C, 2nd ed.; Cambrige University Press: Cambrige, UK, 1992; Chapter 15.5. [Google Scholar]
- Liu, C.; Chen, Z.; Bak, C.L.; Liu, Z.; Lund, P.; Rønne-Hansen, P. Transient stability assessment of power system with large amount of wind power penetration: The Danish case study. In Proceedings of the 10th International Power & Energy Conference (IPEC), Ho Chi Minh, Vietnam, 12–14 December 2012. [Google Scholar]
- Transmission System Data of Western Danish System. Available online: https://en.energinet.dk/Electricity/Energy-data/System-data (assessed on 27 May 2018).
- Transient Security Assessment Tool (TSAT) 18.0. User Manual. Available online: http://www.dsatools.com/downloads/ (assessed on 11 June 2018).
- CIRGRE Technical Brochure No. 325 Review of On-Line Dynamic Security Assessment Tools and Techniques; CIGRE Working Group C4.601: Paris, France, 2007.
- Savulescu, S.C. Real-Time Stability in Power Systems; Springer: New York, NY, USA, 2006. [Google Scholar]
- Kundur, P.; Paserba, J.; Ajjarapu, V.; Andersson, G.; Bose, A.; Canizares, C.; Hatziargyriou, N.; Hill, D.; Stankovic, A.; Taylor, C.; et al. Definition and classification of power system stability. IEEE Trans. Power Syst. 2004, 19, 1387–1401. [Google Scholar]
- Salford Predictive Modeler Software Suit. SPM Version 8.2. Available online: https://www.salford-systems.com/products/spm (assessed on 27 May 2018).
Figure 1.
Illustration of a training database and a single decision tree (DT).

Figure 2.
The procedure of training a Random Forest model.

Figure 3.
The illustrative structure of a Random Forest model.

Figure 4.
The illustration of the drawback of Euclidean Distance.

Figure 5.
The illustration of one-zero function Cij that counts the number of DTs of which xi and xj go to the terminal node.
Figure 5.
The illustration of one-zero function Cij that counts the number of DTs of which xi and xj go to the terminal node.

Figure 6.
The flowchart of the Random Forest based online DSA scheme.

Figure 7.
Geographical map of the western Danish power system [25].
Figure 7.
Geographical map of the western Danish power system [25].

Figure 8.
The CDFs for different wind power levels, i.e., Wind Power Forecast Spans.

Figure 9.
Proximity matrix map of 660 cases in the training database.

Figure 10.
Cases in the validation set w.r.t. their Outlier Index.

Figure 11.
Accuracy and verification percentage w.r.t. different Outlier Index thresholds.

Figure 12.
Time-domain simulation of the insecure case with minimum Outlier Index.


Table 1.
The identified parameters of the cumulative density function (CDF) for wind forecast error w.r.t. different forecast spans *.
Table 1.
The identified parameters of the cumulative density function (CDF) for wind forecast error w.r.t. different forecast spans *.
| WPFS (WPCF) | α (−95% +105% CI) | β (−95% +105% CI) | γ (−95% +105% CI) |
|---|---|---|---|
| 1 (0–12.5%) | 36.26 (35.01, 37.51) | 1.166 (0.999, 1.333) | 0.0462 (0.0406, 0.0519) |
| 2 (12.5–25.0%) | 29.20 (28.42, 29.97) | 2.469 (2.079, 2.860) | 0.1438 (0.1364, 0.1512) |
| 3 (25.0–37.5%) | 27.48 (27.09, 27.88) | 2.061 (1.911, 2.211) | 0.2698 (0.2661, 0.2735) |
| 4 (37.5–50.0%) | 27.99 (27.72, 28.26) | 1.477 (1.424, 1.530) | 0.4126 (0.4107, 0.4144) |
| 5 (50.0–62.5%) | 29.39 (29.00, 29.78) | 1.176 (1.128, 1.224) | 0.5521 (0.5500, 0.5541) |
| 6 (62.5–75.0%) | 30.21 (29.53, 30.88) | 0.929 (0.876, 0.982) | 0.6863 (0.6835, 0.6892) |
| 7 (75.0–87.5%) | 33.24 (32.15, 34.33) | 0.984 (0.897, 1.070) | 0.8035 (0.7996, 0.8075) |
| 8 (87.5–100%) | 76.42 (73.81, 79.03) | 0.370 (0.352, 0.388) | 0.9466 (0.9457, 0.9475) |
* WPFS—Wind power forecast span; WPCF—Wind power capacity factor; CI—Confidence interval.
Table 2.
Sensitivity analysis in the context of renewable energy penetration level.
| WPCF | Accuracy | Min. OI Threshold | Max. OI Threshold | Recom. Thresholds |
|---|---|---|---|---|
| 12.5% | 100% (all secure) | Do not need | Do not need | Do not need |
| 25.0% | 100% (all secure) | Do not need | Do not need | Do not need |
| 37.5% | 100% (all secure) | Do not need | Do not need | Do not need |
| 50.0% | 100% (all secure) | Do not need | Do not need | Do not need |
| 62.5% | 100% (all secure) | Do not need | Do not need | Do not need |
| 75.0% | 96.81% | 2.06 | 8.37 | [2.123, 7.018] |
| 87.5% | 95.23% | 1.87 | 8.02 | [2.103, 6.328] |
| 100% (basic case) | 92.27% | 1.54 | 6.15 | [1.573, 5.082] |
© 2018 by the authors. Licensee MDPI, Basel, Switzerland. This article is an open access article distributed under the terms and conditions of the Creative Commons Attribution (CC BY) license (http://creativecommons.org/licenses/by/4.0/).
Share and Cite
MDPI and ACS Style
Liu, C.; Tang, F.; Leth Bak, C. An Accurate Online Dynamic Security Assessment Scheme Based on Random Forest. Energies 2018, 11, 1914. https://doi.org/10.3390/en11071914
AMA Style
Liu C, Tang F, Leth Bak C. An Accurate Online Dynamic Security Assessment Scheme Based on Random Forest. Energies. 2018; 11(7):1914. https://doi.org/10.3390/en11071914
Chicago/Turabian StyleLiu, Chengxi, Fei Tang, and Claus Leth Bak. 2018. "An Accurate Online Dynamic Security Assessment Scheme Based on Random Forest" Energies 11, no. 7: 1914. https://doi.org/10.3390/en11071914
Note that from the first issue of 2016, this journal uses article numbers instead of page numbers. See further details here.