Complementarity Roses Evaluating Spatial Complementarity in Time between Energy Resources


1
Centro Estadual de Pesquisas em Sensoriamento Remoto e Meteorologia (CEPSRM), Universidade Federal do Rio Grande do Sul (UFRGS), Av Bento Gonçalves, 9500, Bairro Agronomia, 91501-970 Porto Alegre, RS, Brazil
2
Instituto de Pesquisas Hidráulicas (IPH), Universidade Federal do Rio Grande do Sul (UFRGS), Av Bento Gonçalves, 9500, P.O. Box 15029, Bairro Agronomia, 91501-970 Porto Alegre, RS, Brazil
*
Author to whom correspondence should be addressed.
Energies 2018, 11(7), 1918; https://doi.org/10.3390/en11071918
Submission received: 26 May 2018
/
Revised: 10 July 2018
/
Accepted: 10 July 2018
/
Published: 23 July 2018
(This article belongs to the Section F: Electrical Engineering)
Abstract
:Hybrid energy systems have higher initial costs than systems that are based on only one renewable resource, but allow for the fulfillment of the demands of consumer loads with lower values for the cost of energy. The possible complementarity between the resources used can contribute to a better use of the available energy. On a large scale, complementarity between power plants can serve as a tool for the management of energy resources. A complete evaluation of complementarity needs to consider three components: time complementarity, energy complementarity, and complementarity between amplitudes of variation. Complementarity can also be assessed between energy resources in one place (which may be termed temporal complementarity) and between resources at different sites (termed spatial complementarity). This paper proposes a method for quantifying spatial complementarity over time and for its expression through maps. The method suggests the establishment of a hexagonal network of cells and the determination of complementary roses for each cell that contains power plants. This article also applies the method proposed to some hydroelectric plants and wind farms in the State of Rio Grande do Sul, in southern Brazil, and present the map of spatial complementarity in time obtained.
1. Introduction
Hybrid systems in various dimensions and compositions are becoming increasingly common and increasingly the target of research projects related to their design and optimization and related to their proposition as alternatives for a sustainable future. The initial costs of systems that are based on renewable resources have been showing significant reductions over the last few years, both due to the growth in demand for energy conversion devices and due to ongoing investment in research and development. In this scenario, the possible complementarity between energy resources may be a tool for technology managers to decide on new plants and investments in renewable resources still in the process of maturation.
The subject complementarity has been studied for some years seeking a description that allows for exploring all of its potential as a design parameter and as a tool for planning and management of renewable energy resources. Ghirardi et al. [1] evaluated the complementarity between water resources along the South American territory, Cantão et al. [2] and Silva et al. [3] studied the complementarity between water and wind resources throughout Brazilian territory. Beluco et al. [4] proposed a dimensionless index assessing complementarity, with an innovative approach, and Beluco et al. [5] and Kougias et al. [6] proposed methods, respectively, for analysis and optimization of hybrid systems based on complementary resources.
Energetic complementarity can be understood as a capacity of one, two, or even more renewable energy resources to complement each other over time, in one place or at different places. Only complementarity between renewable energy resources makes sense to be evaluated. The different characteristics of intermittency and variability of the various renewable energy alternatives make complementarity difficult to evaluate.
Energetic complementarity is, in a direct sense, an obvious concept, but the first work of Beluco [4] was the first to deal with this matter comprehensively. This work discussed the concept of complementarity and proposed a dimensionless index for the quantification of complementarity in time while considering resources in a same location. The work of Borba and Brito [7] suggested the evaluation of the complementarity in time by means of a kind of convolution of the energy availability functions.
According to Beluco et al. [4], complementarity in time evaluated in the same place must be divided into three partial complementarities: time-complementarity itself, energy-complementarity, and amplitude-complementarity. Beluco et al. [8] also described a situation of complete complementarity. Situations where one or more of these three components appear to be incomplete match not full complementarities.
Time-complementarity will be complete when availability minima occur six months apart. Energy-complementarity will occur when the average values of the compared energy resources are equal. Amplitude-complementarity will occur when the differences between maximum and minimum energy availability for the compared energy resources are equal. This work will deal only with the determination of the complementarity in time, as presented by Beluco et al. [4], when comparing data at different points along spatial coordinates.
Complementarity in one place is easier to represent, since it is enough to associate the final value of complementarity to the place in question. This type of complementarity can be termed as temporal complementarity (having time-complementarity as one of its components). The work of Beluco et al. [8] discusses in more detail some issues that are related to complementarity and shows a map of temporal complementarity for the State of Rio Grande do Sul.
The energetic complementarity obtained between two different sites is more difficult to represent graphically. This type of complementarity can be called spatial complementarity (also having time-complementarity as one of its components). Additionally, for the same place in space may be assigned different complementarity values associated with the comparison of energy availability of this point with the available energy from several other points.
Hoicka and Rowlands [9] focused on the integration of renewable resources into the interconnected system in Ontario, Canada, while considering solar and wind energy and using a proposed dimensionless index for this paper. One of the main results of this work is that the complementarity between these resources, considered in the same place and in different places, results in energy produced with less variability than the energy produced from these resources alone.
The work of Solomon et al. [10] is centered in California, western of United States, and it presents a map with potential solar and wind power generation across twelve regions of California, working through the paper with a quantitative comparison of these potentials to handle the complementarity between these energy resources in one place and at different places.
This work has studied several aspects that are related to a greater penetration of renewable resources in the interconnected system and with the complementarity between energy resources, presenting some very interesting results. The joint use of solar and wind energies leads to better impacts on the system storage requirement, as compared to the use of solar energy or wind energy alone. The joint use of solar and wind energy also results in less need for the backup for energy supply.
The insertion of energy from renewable resources in power systems faces a number of technical difficulties that go beyond the variability and the intermittence of energy availability. Gabash and Li [11,12] and Min and Kim [13] deal with different aspects of these difficulties and show that the design of new technological solutions has been happening with great speed in this field.
The work of Silva et al. [3] studies the complementarity between water and offshore wind resources along the Brazilian territory, aiming to improve the operation of Brazilian reservoirs and reduce the dependence of energy from thermoelectric origin. The paper presents complementarity maps between water resources, between offshore wind resources and between water and offshore wind resources, based on cluster analysis and statistical correlation.
The work of Cantão et al. [2] studies the complementarity between water resources and wind resources along the Brazilian territory, presenting results through correlation maps elaborated from Voronoi cells that are associated with values of correlation coefficients between seasonally averaged stream flows and wind speeds. The paper also comments on how the results can be applied to establish strategies for the operation and expansion of energy systems.
This article discusses the concept of energetic complementarity that is focused on the complementarity in time between different places along a territory and proposes the use of “roses of complementarity” to graphically express this spatial complementarity. In the end, the spatial complementarity between some hydro power plants and wind farms in the State of Rio Grande do Sul, in southern Brazil, is determined and represented by the use of complementarity roses on a map.
The next section discusses the complementarity in time and the complementarity through spatial coordinates and it suggests the use of complementary roses for their graphic expression. The two subsequent sections present a method for evaluating spatial complementarity in time by means of complementary roses and an application to the State of Rio Grande do Sul, with the presentation of a map of spatial complementarity in time. Finally, the conclusions are presented.
2. Spatial Complementarity in Time and “Complementarity Roses”
This section is composed of three subsections. The first discusses the determination of complementarity in time between energy resources in the same place, as already discussed in the literature. The second section discusses the spatial complementarity in time and the third section presents the idea of evaluating spatial complementarity through complementary roses.
2.1. Temporal Complementarity in Time
The term “temporal complementarity” can be used to refer to the energetic complementarity between energy resources in the same place, while the term “spatial complementarity” can be used in the case of complementarity between energy resources in different places. In both cases, complementarity has three components, as presented by Ref. [4], namely time-complementarity, energy-complementarity, and amplitude-complementarity.
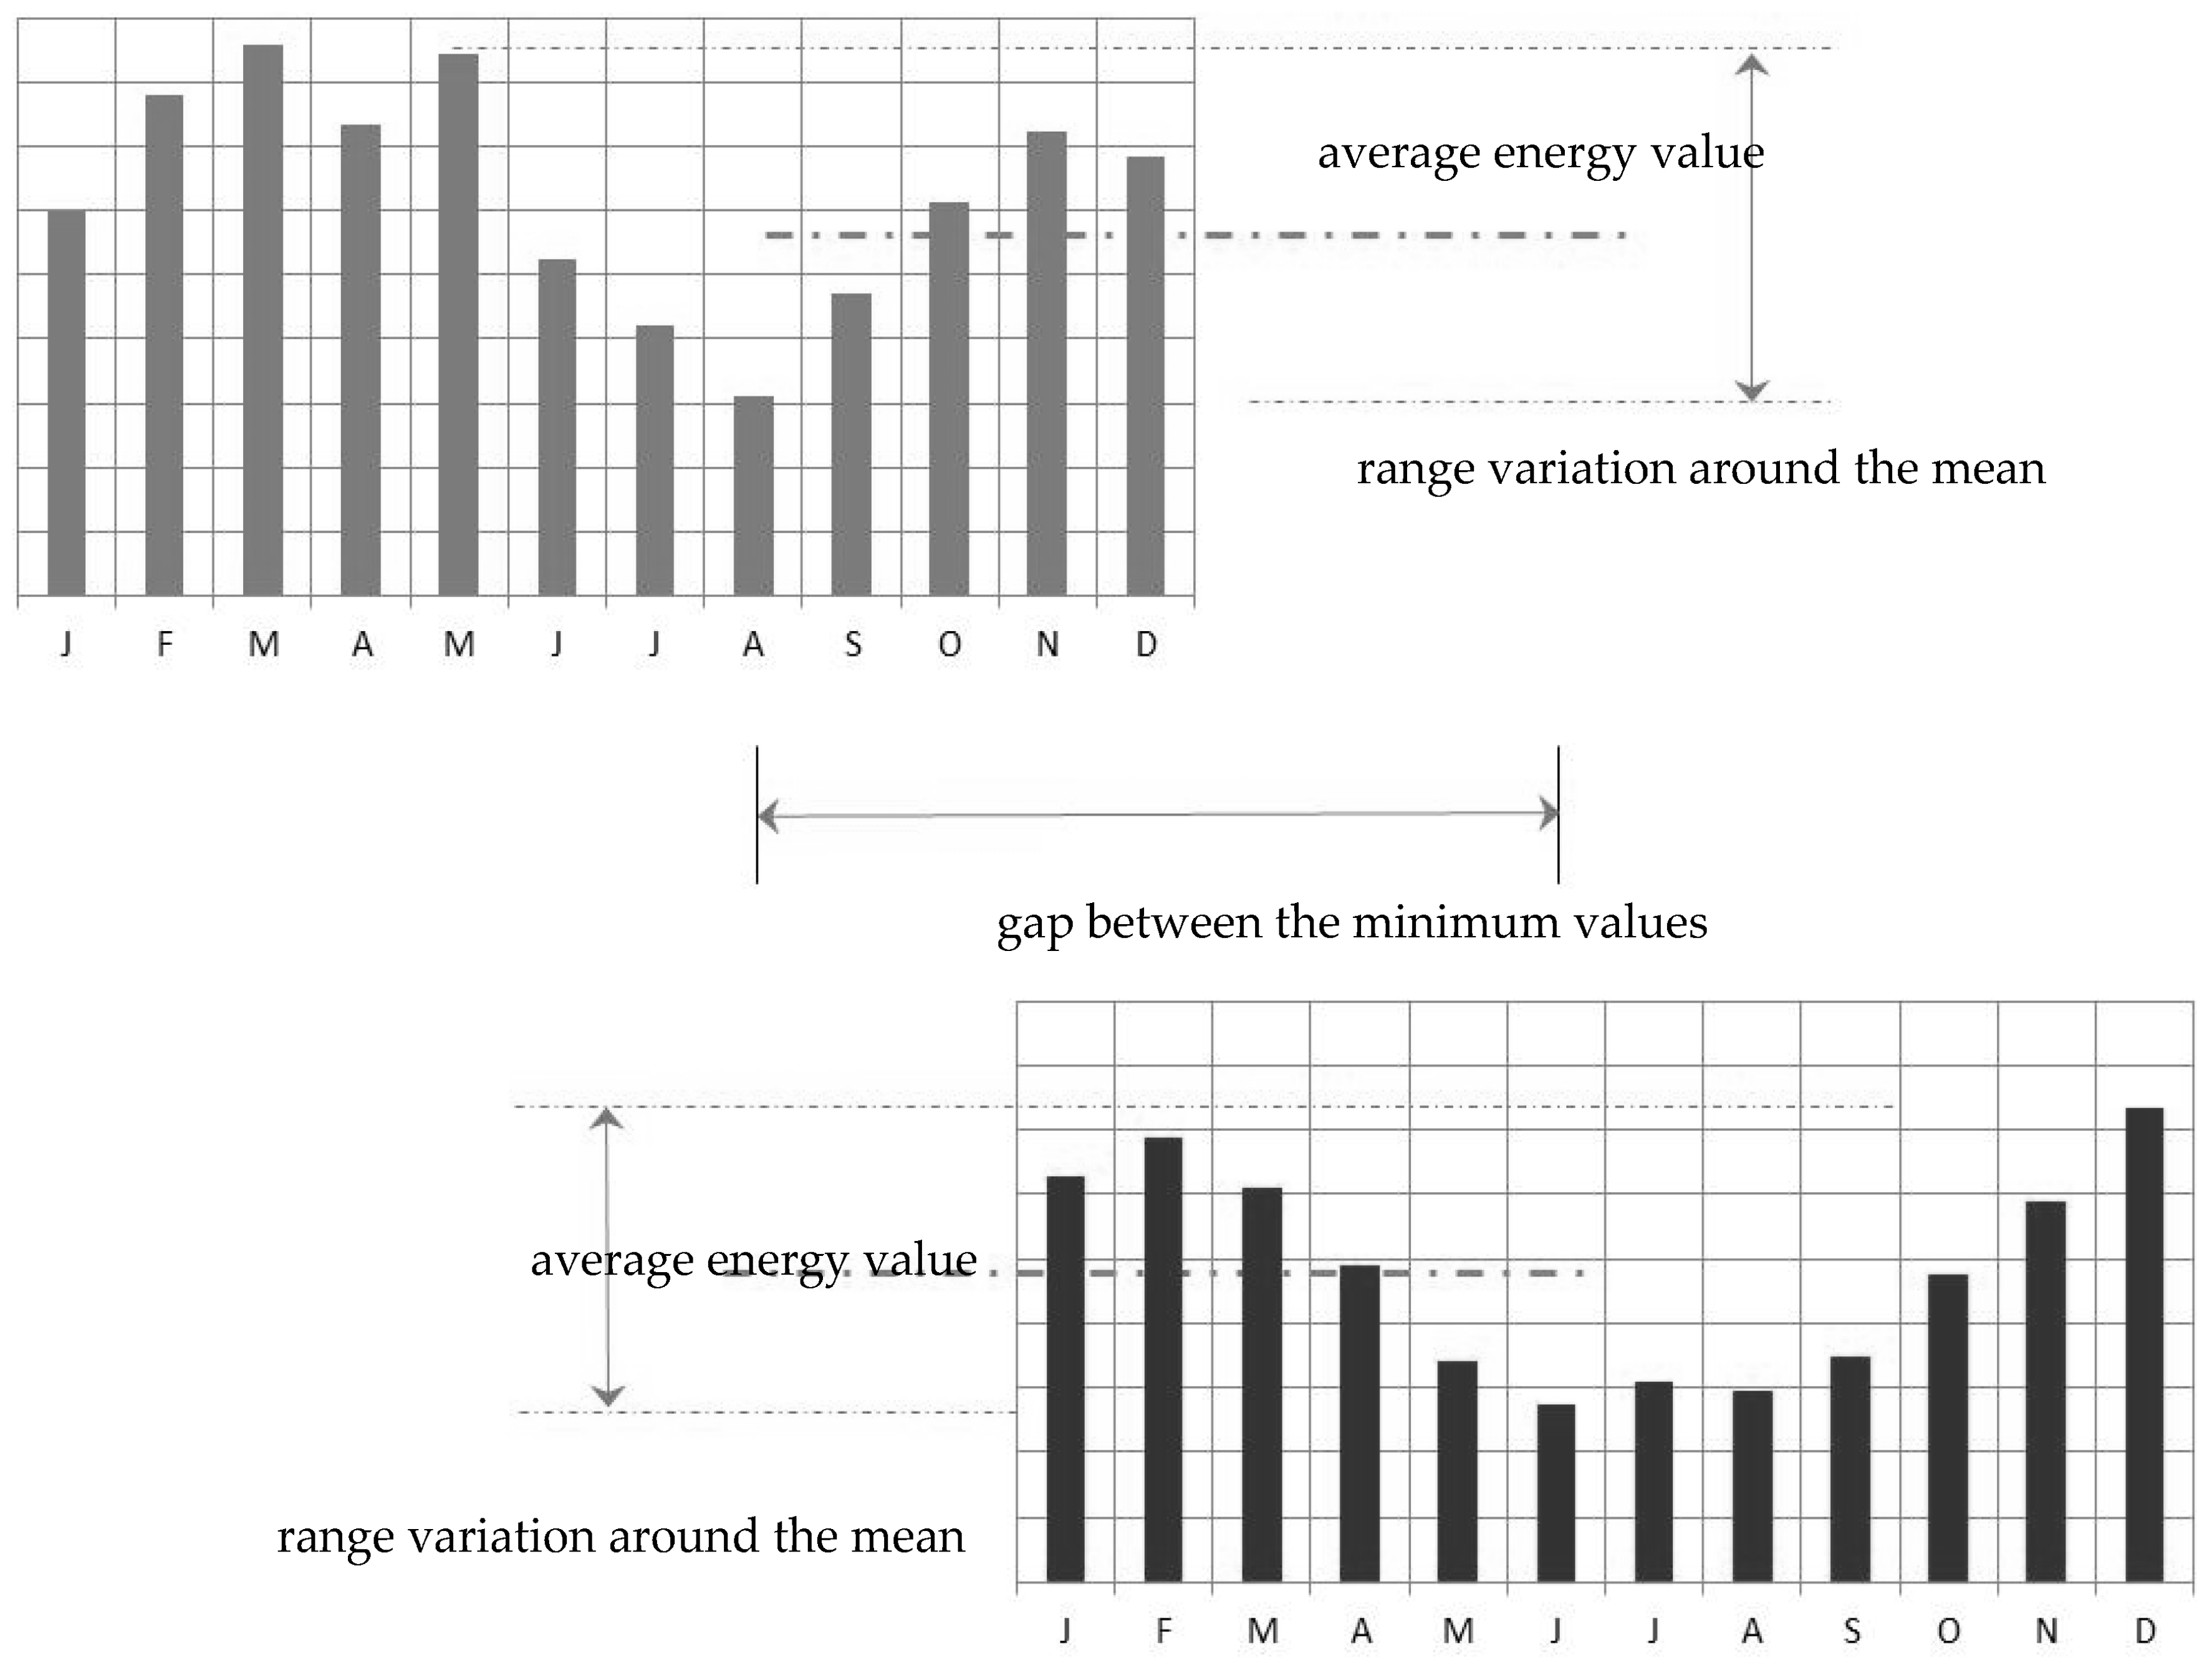
Figure 1 shows actual energy availability data. The uppermost data, on the left, correspond to typical water availability data in a river section. The lowermost data, on the right, in turn, correspond to the solar radiation incident on a flat horizontal surface. The figure characterizes the mean values of energy and the amplitudes of variation for the two energy resources. The time-complementarity component evaluates the lag between the maximum or minimum values of energy availability of the energy resources considered.
The energy-complementarity component compares the average energy values and a maximum value will be obtained if each resource contributes half of the total annual energy. The amplitude-complementarity component compares the amplitudes of variation of each energy resource and, like the energy complementarity component, a maximum value of complementarity will be obtained if the energy resources compared have the same amplitude variation.
This article deals with the time-complementarity component (here called simply as complementarity in time), which is directly related to the time lag between the maximum or minimum values of energy availability of two renewable resources. Equation (1) presents the complementarity in time, as defined by Ref. [4]. This equation assigns a linear characteristic to the complementarity in time and other equations can be proposed.
In this equation, D is the number of the day (or month) in which the maximum energy availability occurs and d is the day (or month) in which the minimum value occurs. Subscript 1 indicates one of the energy resources, while the number 2 indicates the other. The denominator assesses whether energy resources have a 180-day (or six-month) interval between maximum and minimum energy availability, which also affects the complementarity in time.
The application of this equation should not be performed from a mathematically more rigid point of view, as discussed by Beluco [14]. Its application must be carried out by a trained human analyst with a good sense of analysis. The evaluation of the energy resources shown in Figure 1, for example, indicates a complementarity that is equal to 2 over 6, that is, equal to 0.3333. The minimum values of energy availability occur in months apart from each other for two months.
2.2. Spatial Complementarity in Time
As discussed above, spatial complementarity is the complementarity between energy resources that are located at different sites. This concept, duly quantified and mapped, can lead to important tools for managing energy resources. The appropriate exploitation of spatial complementarity can contribute to the lower cost of installation of power plants and the optimization of operation costs of plants inserted in an interconnected system.
The problem is then the determination of complementarity between operating plants (or sites with energetic potential) in different locations and not in the same place. It is necessary to determine the complementarity in time between energy resources, such as those shown in Figure 1 but located at different sites. Such a calculation will generate information on complementarities with different sites, placed at different distances and in different orientations.
For simplicity, some limitations to this problem will be established, allowing for the basic problem of determining spatial complementarity to be solved.
This article will then present only the determination of complementarity in time. In addition, a region under study will be modeled with the application of a network of hexagonal cells. Thus, the energy in each cell will be the sum of the energy generated (or available energy resources) on its surface, according to the analysis being undertaken.
2.3. Complementarity Roses
The previous work by Risso and Beluco [15] proposed the analysis based on the establishment of a network of hexagonal cells, but it suggested the determination of complementarity in a limited way, not relating the spatial complementarity with its angular distribution throughout the territory under analysis.
Figure 2 shows a network of hexagonal cells established on a hypothetical distribution of hydroelectric power plants and wind farms. The cells are differentiated between cells with hydroelectric plants (in blue), cells with wind farms (in yellow), cells with both types of plants (in gray), and cells without plants (without color).
The goal is then to determine the complementarity in time of each cell that contains some power plant with other cells that also contain power plants. There are three parameters to be determined: the complementarity in time with the other grid cells that contain power plants, their respective distances, and their respective directions.
In Figure 2, H and W indicate the months in which the minimum energy availability value occurs. These values serve as reference for the determination of complementarity in time. Equation (1) should be used and in this calculation the interval between the months in which minimum and maximum energy availability values will be considered to be equal to six months.
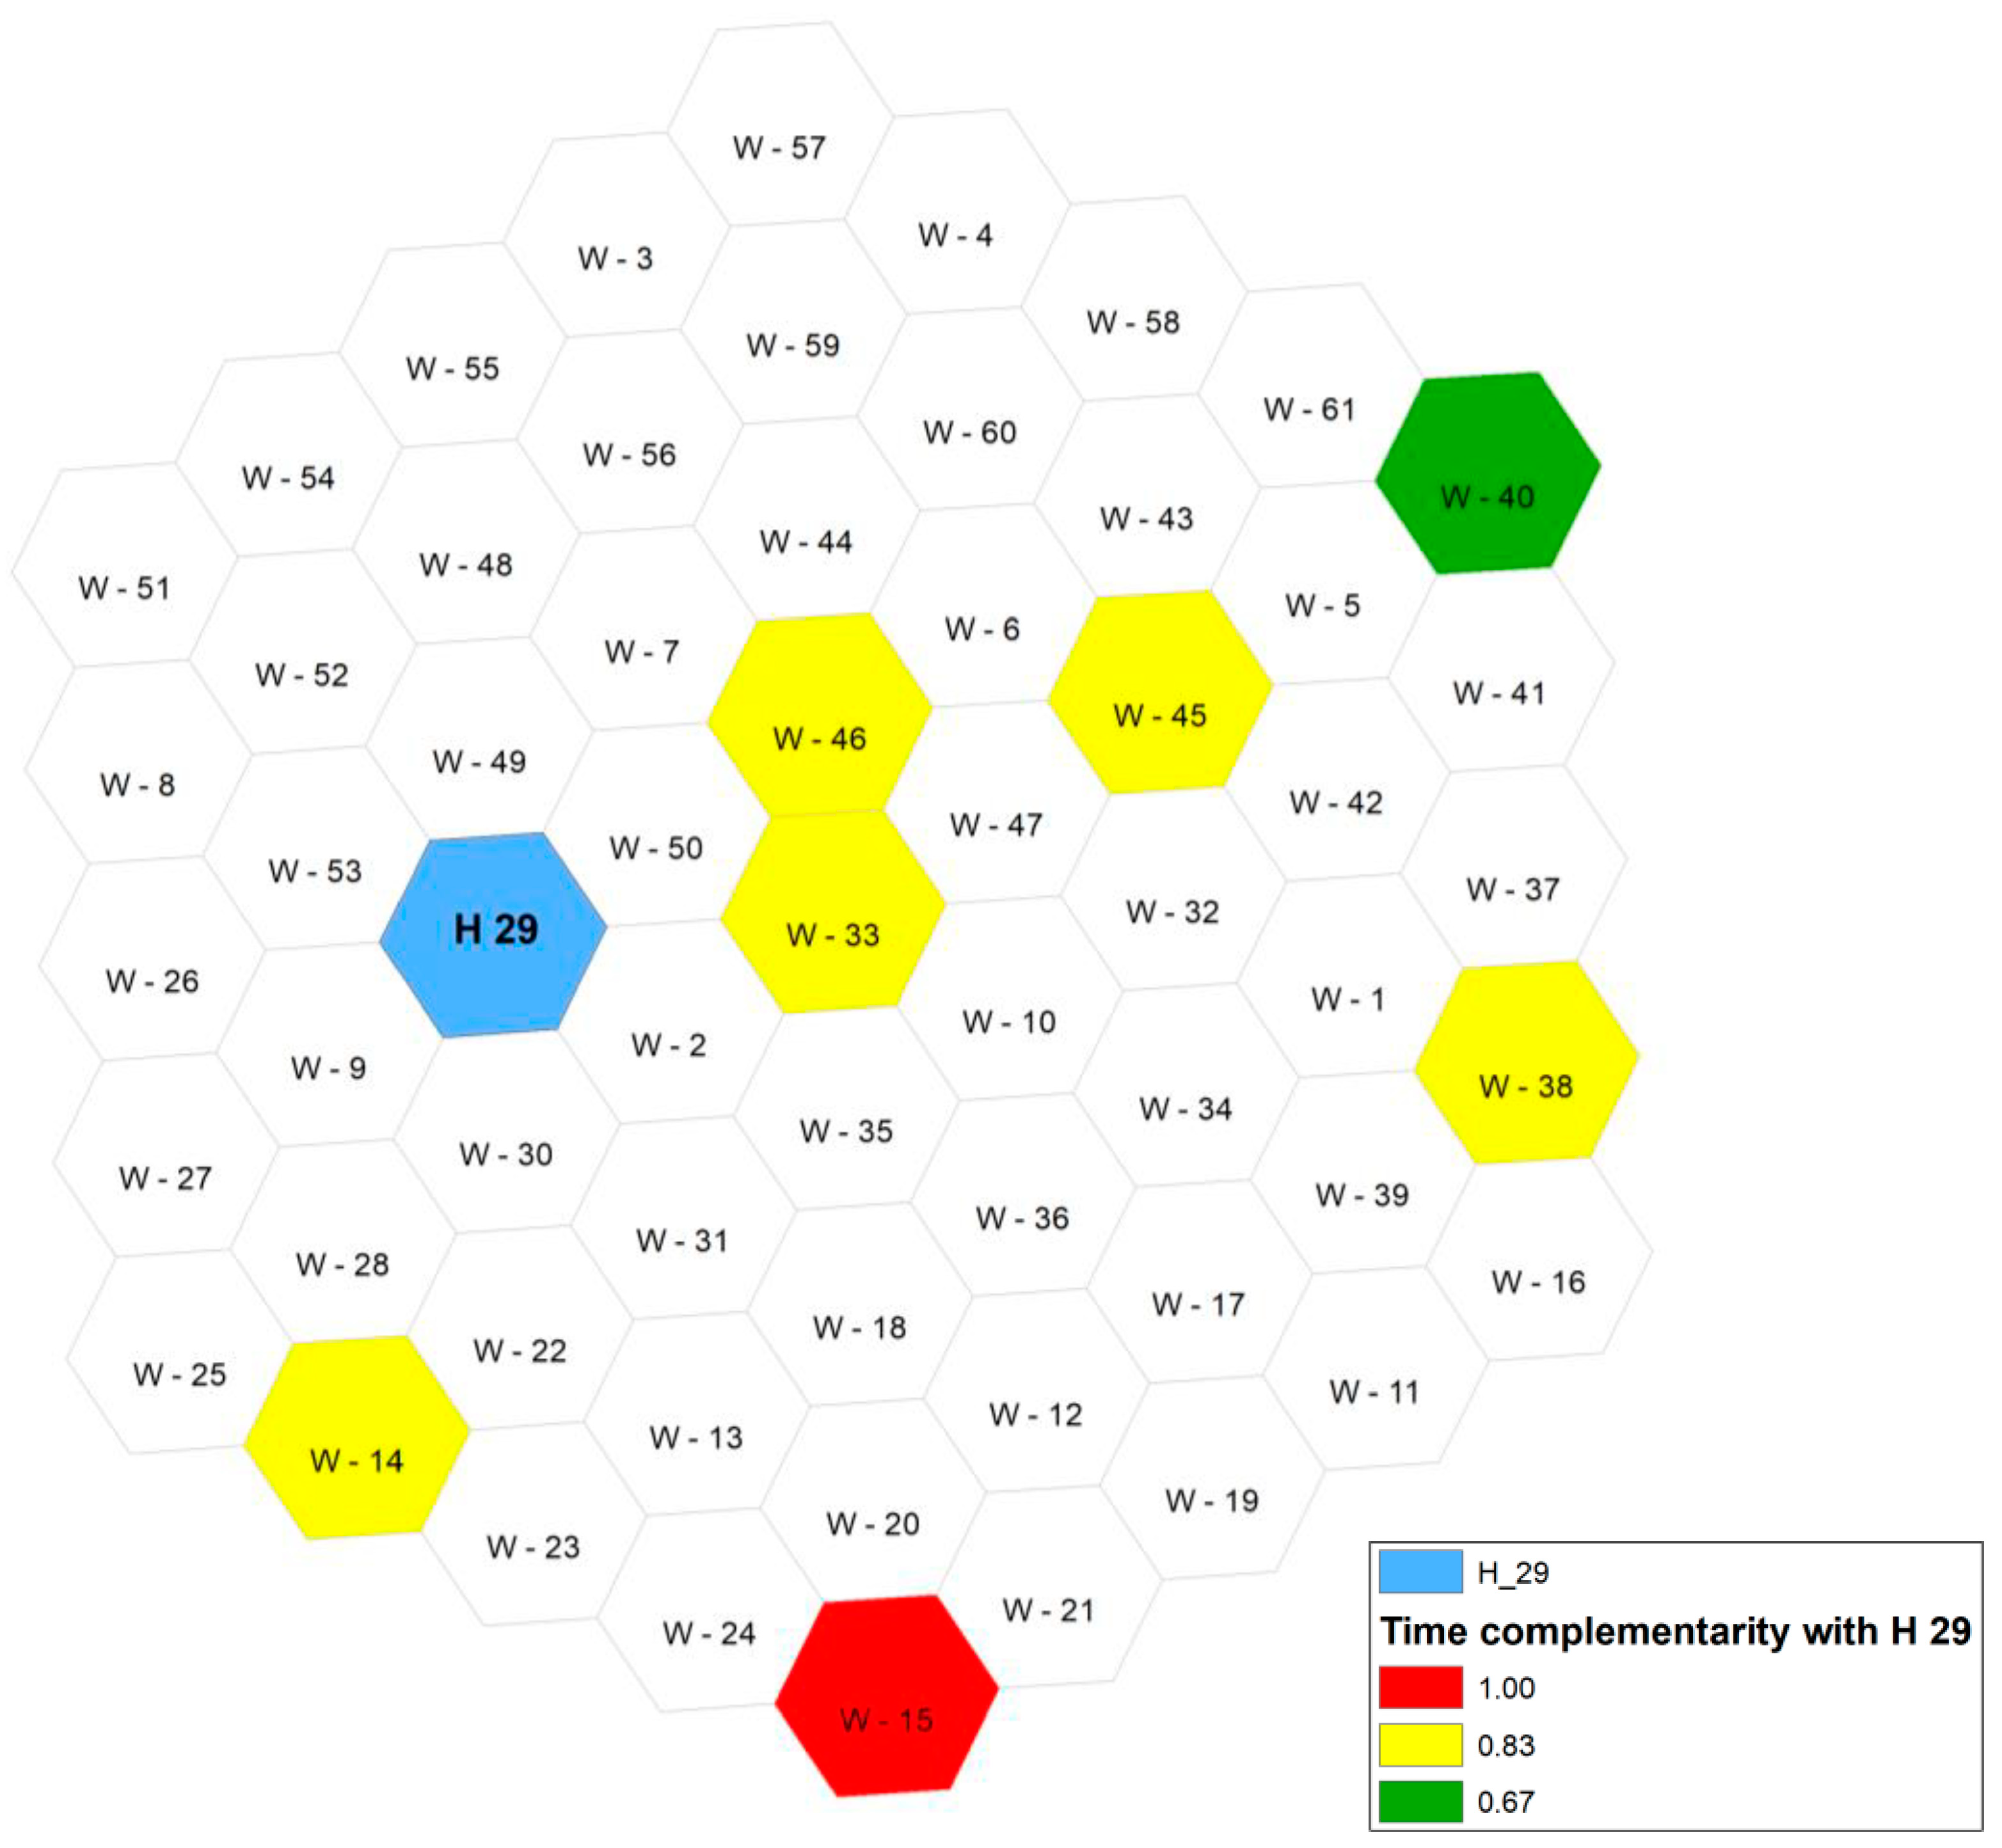
The first step is to choose one of the cells containing plants and determine their complementarity with the other cells that also contain plants, taking into account in each calculation the respective distance and orientation. Figure 3 shows the cell network of Figure 1 with one identifier per cell. In addition, in this figure appears a cell that is chosen as reference for the determination of the complementarity that is the cell in blue denominated H-29.
When comparing the hydroelectric plant in cell H-29 with the wind farm in the central cell, W-33, a complementarity that is equal to 0.83 is obtained. This complementarity is greater than that existing between the hydroelectric plants present in these two cells. So, because of this, the cell H-33 appears in Figure 3 painted in yellow.
Following the same reasoning, the comparison of the hydroelectric plants in the H-29 cell with the wind farms in the cell W-40 and in the cell W-46 results, respectively, in complementarities that are equal to 0.83 and 0.67. Consequently, these cells are painted in Figure 3, respectively, in yellow and green. Other cells in this figure were painted according to the complementarities determined with the H-29 cell. Complementarity is maximal only with the cell W-15, painted in red.
The next step would be to replicate this process for all cells that are containing power plants. However, it would also be necessary to represent the results on only one map. One solution to this problem of representation is the use of a complementarity rose, representing in each cell the complementarity that was identified with all other cells.
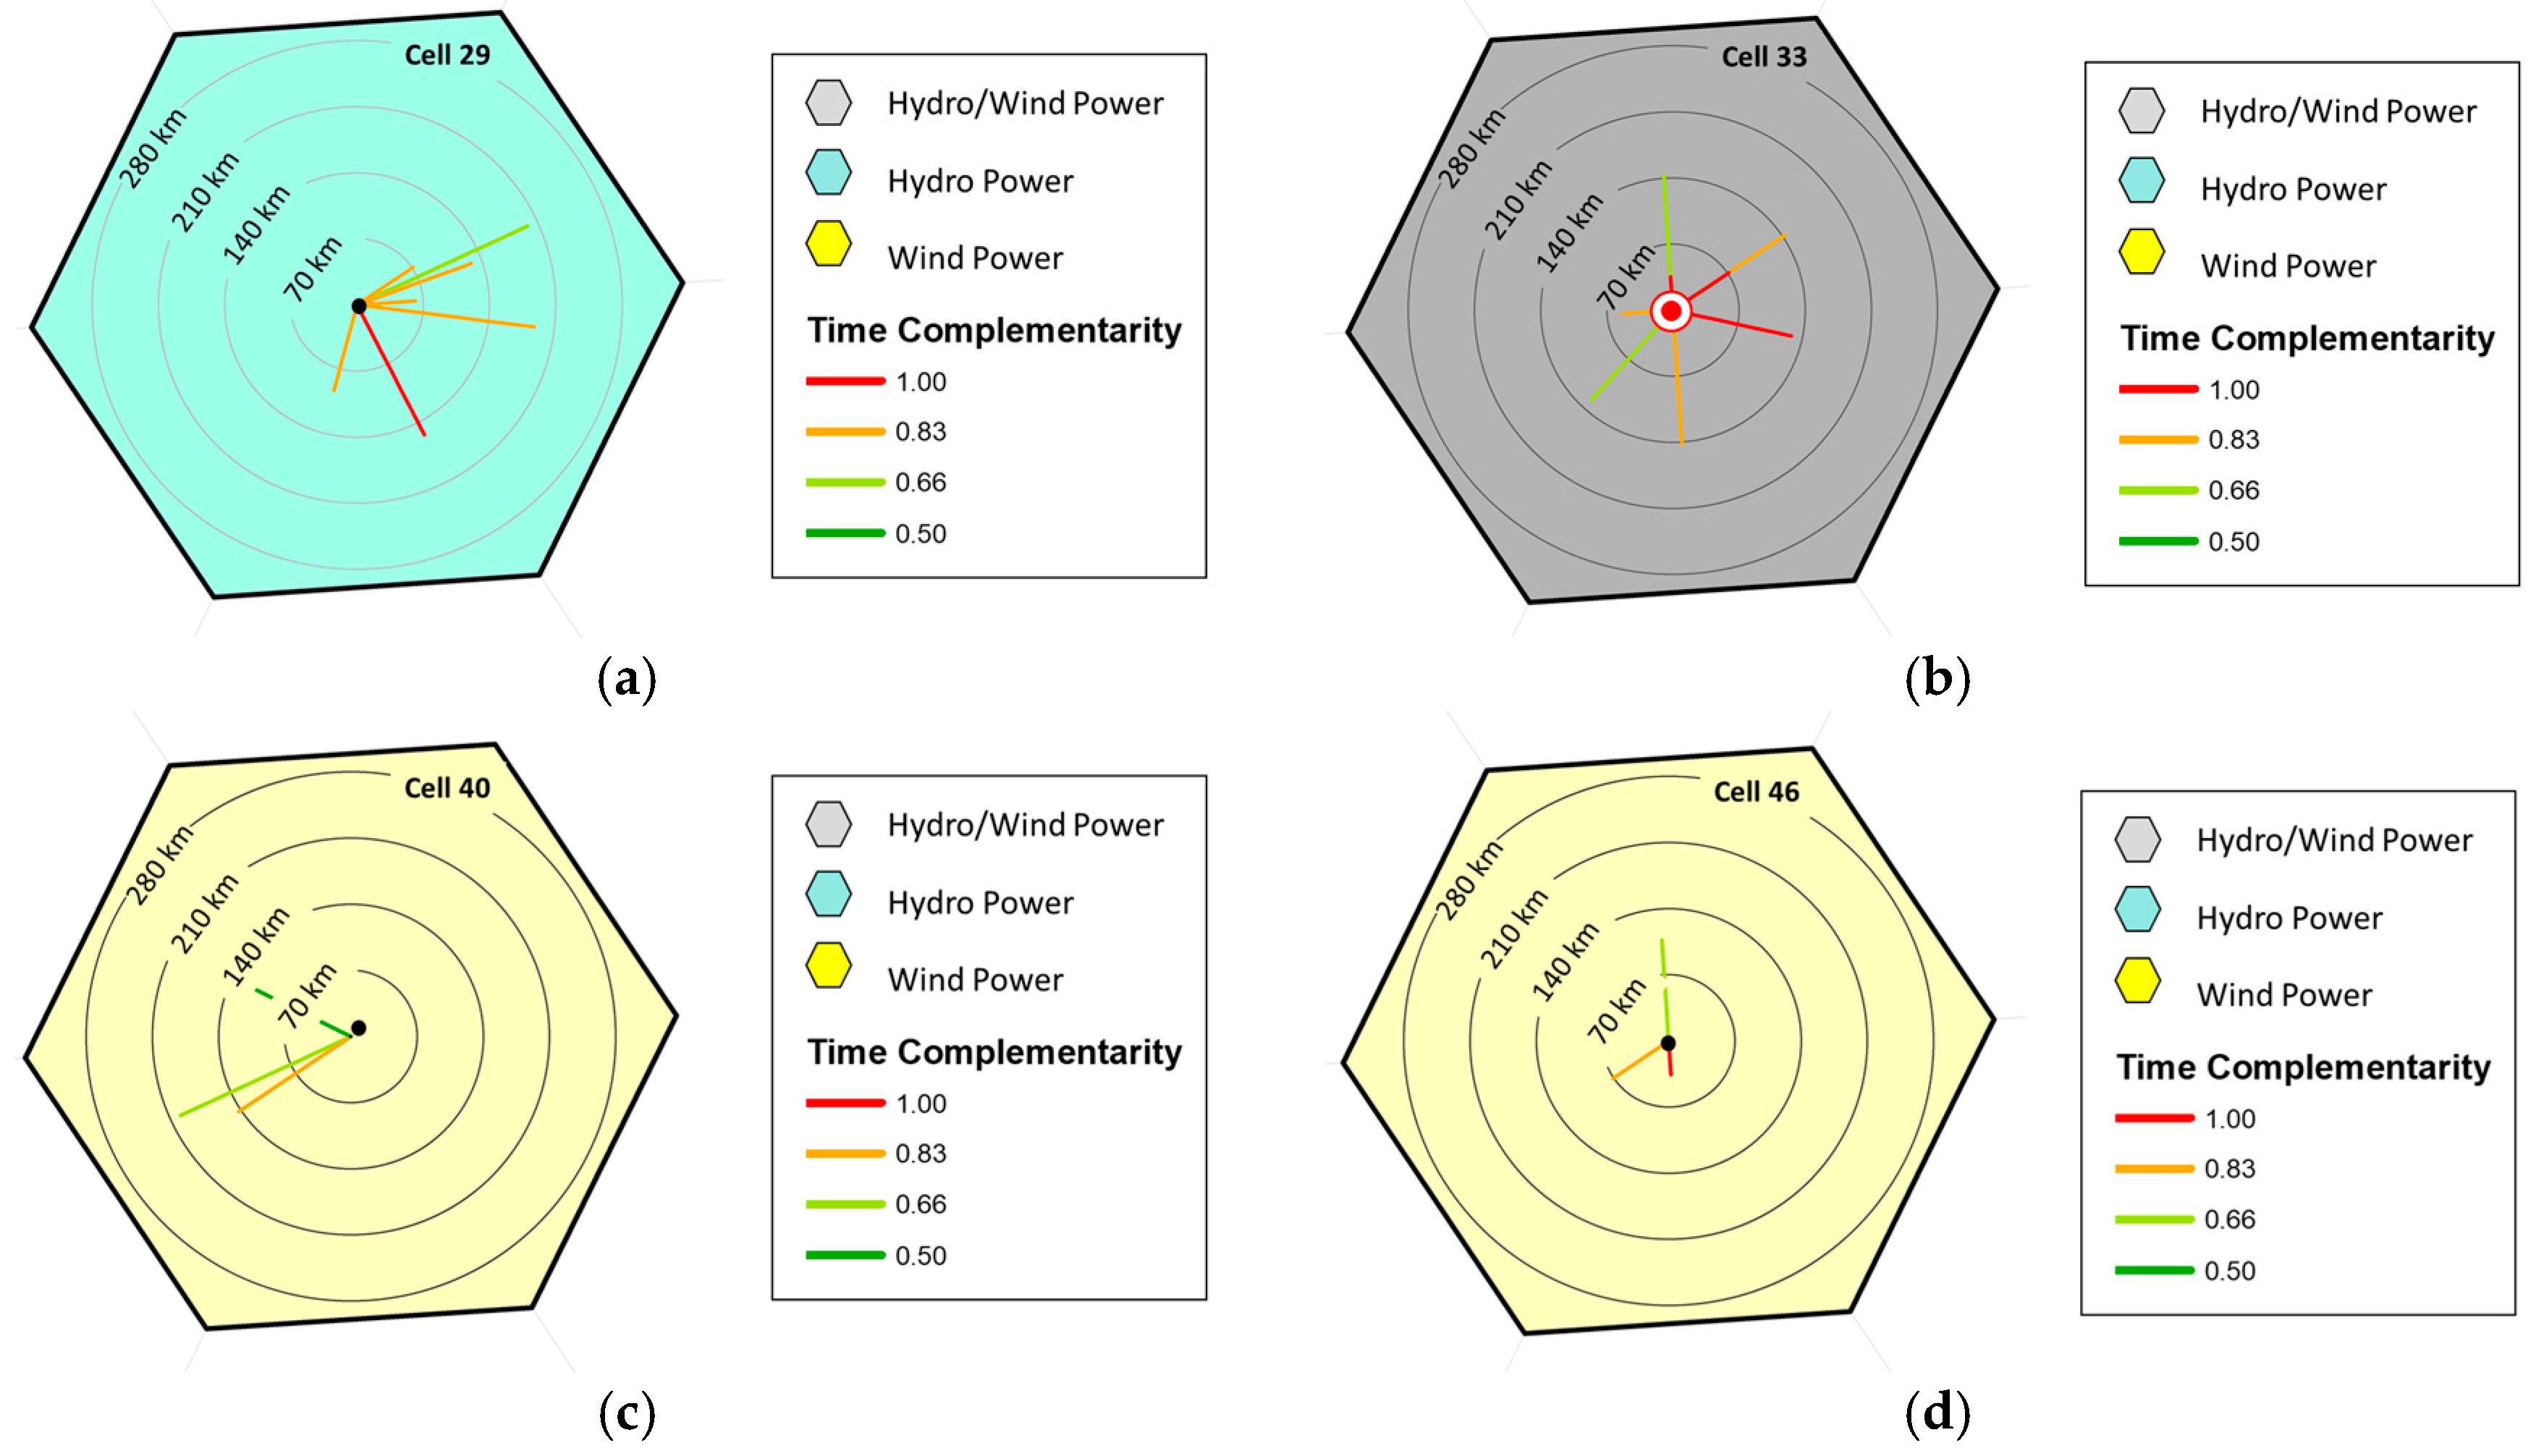
Figure 4a shows the rose for the cell H-29, showing yellow lines that are pointing to the cells W-33 and W-40 and a green line towards the cell H-46. There is also a red line in the direction of the cell W-15. These lines show their respective distances and their orientations. Figure 4b–d, respectively, present complementarity roses for the cells H-33, H-40, and H-46.
The complementarity rose shown in Figure 4b is different from the other complementary roses since it corresponds to a cell containing hydroelectric power plants and wind farms. The indication of the complementarity between the energetic resources present in this cell occurs with the application of a central circle, which is filled with the color corresponding to the complementarity. In this case, full complementarity, therefore with a circle that is painted in red.
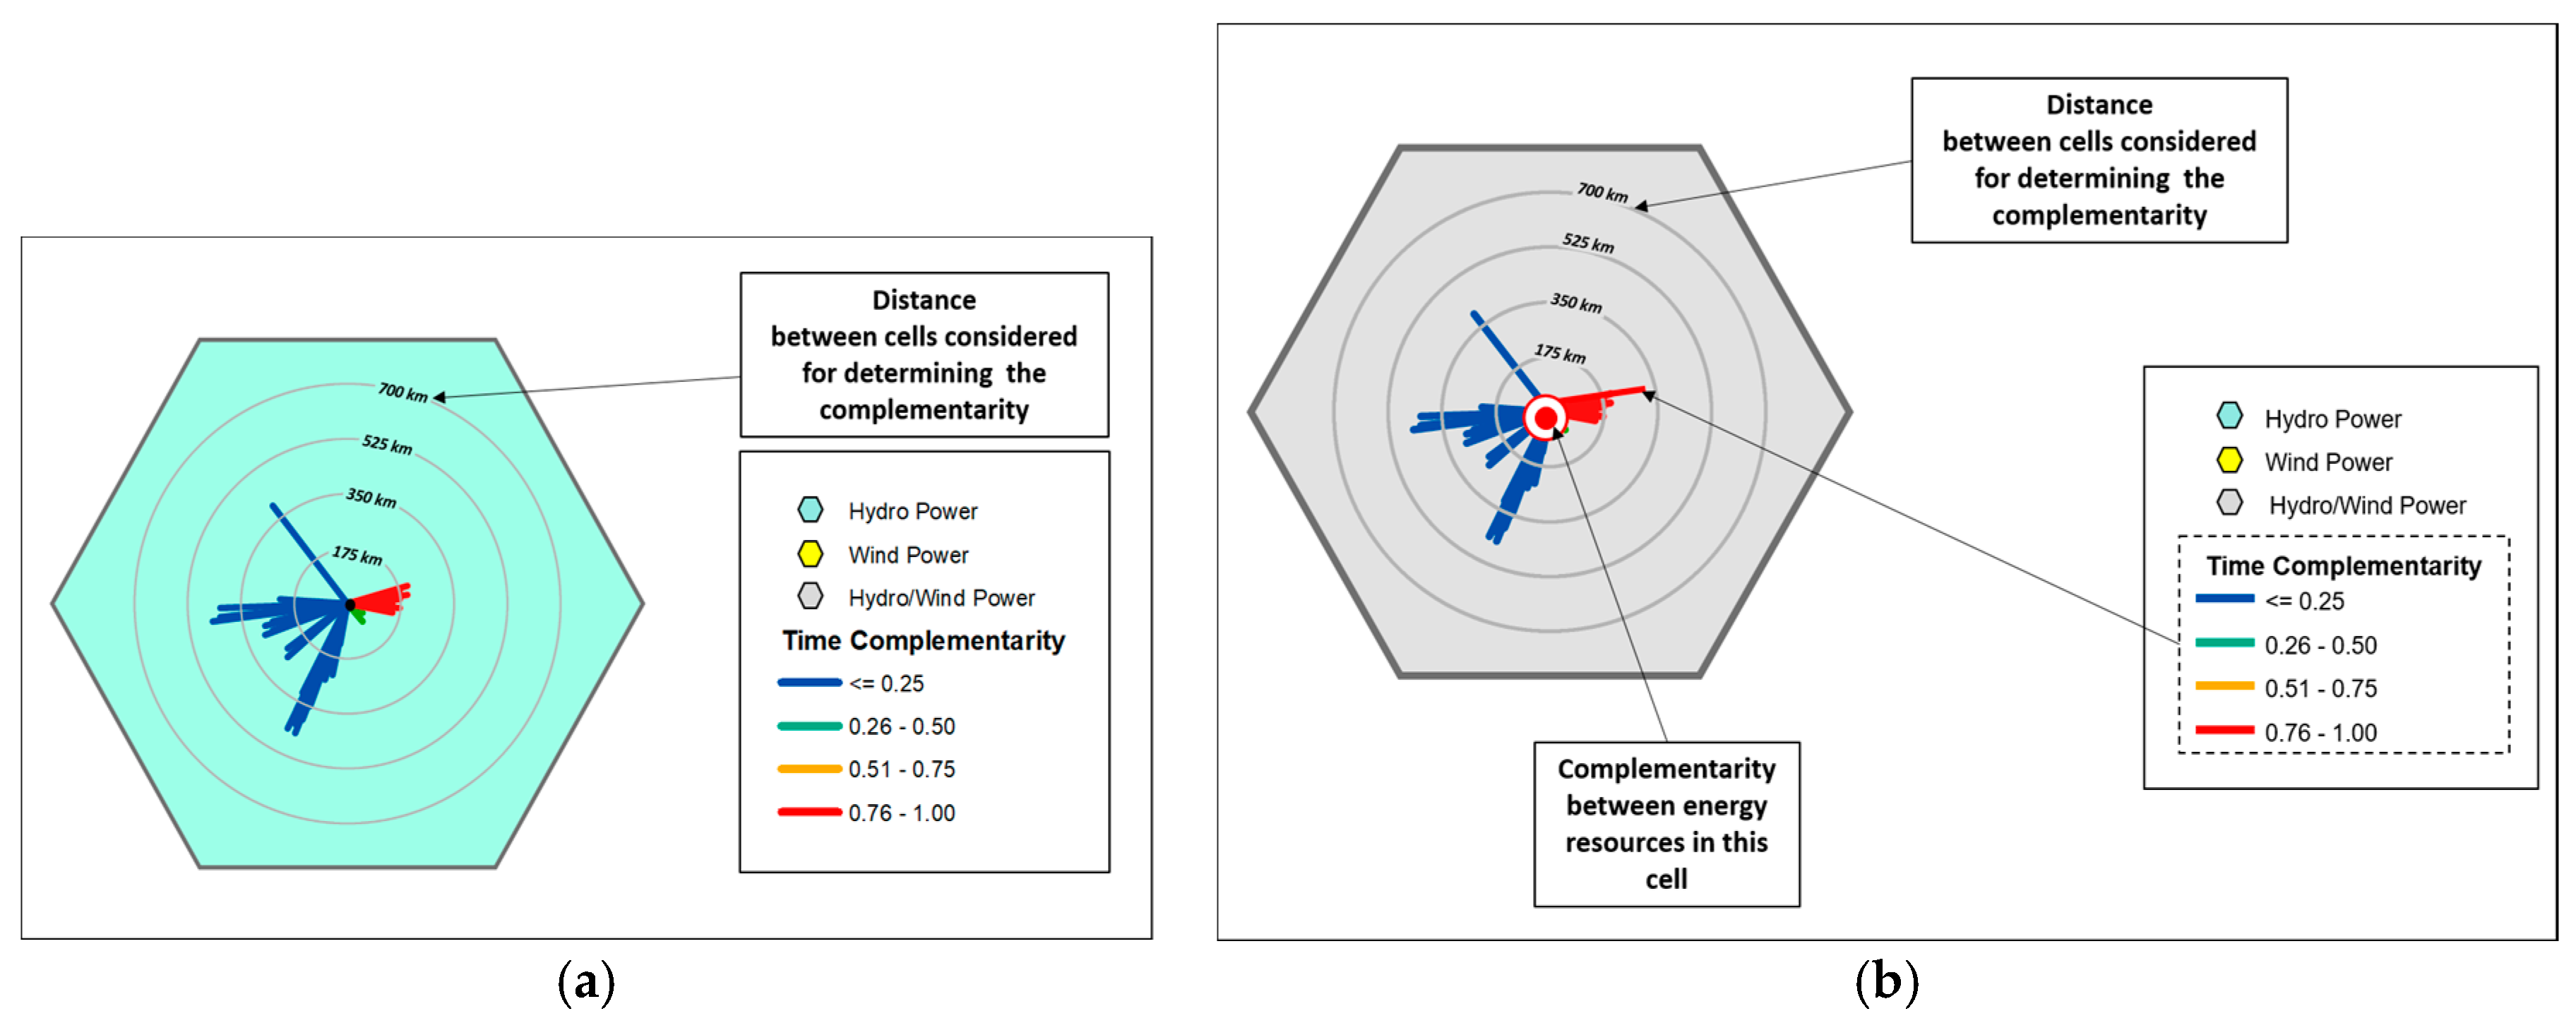
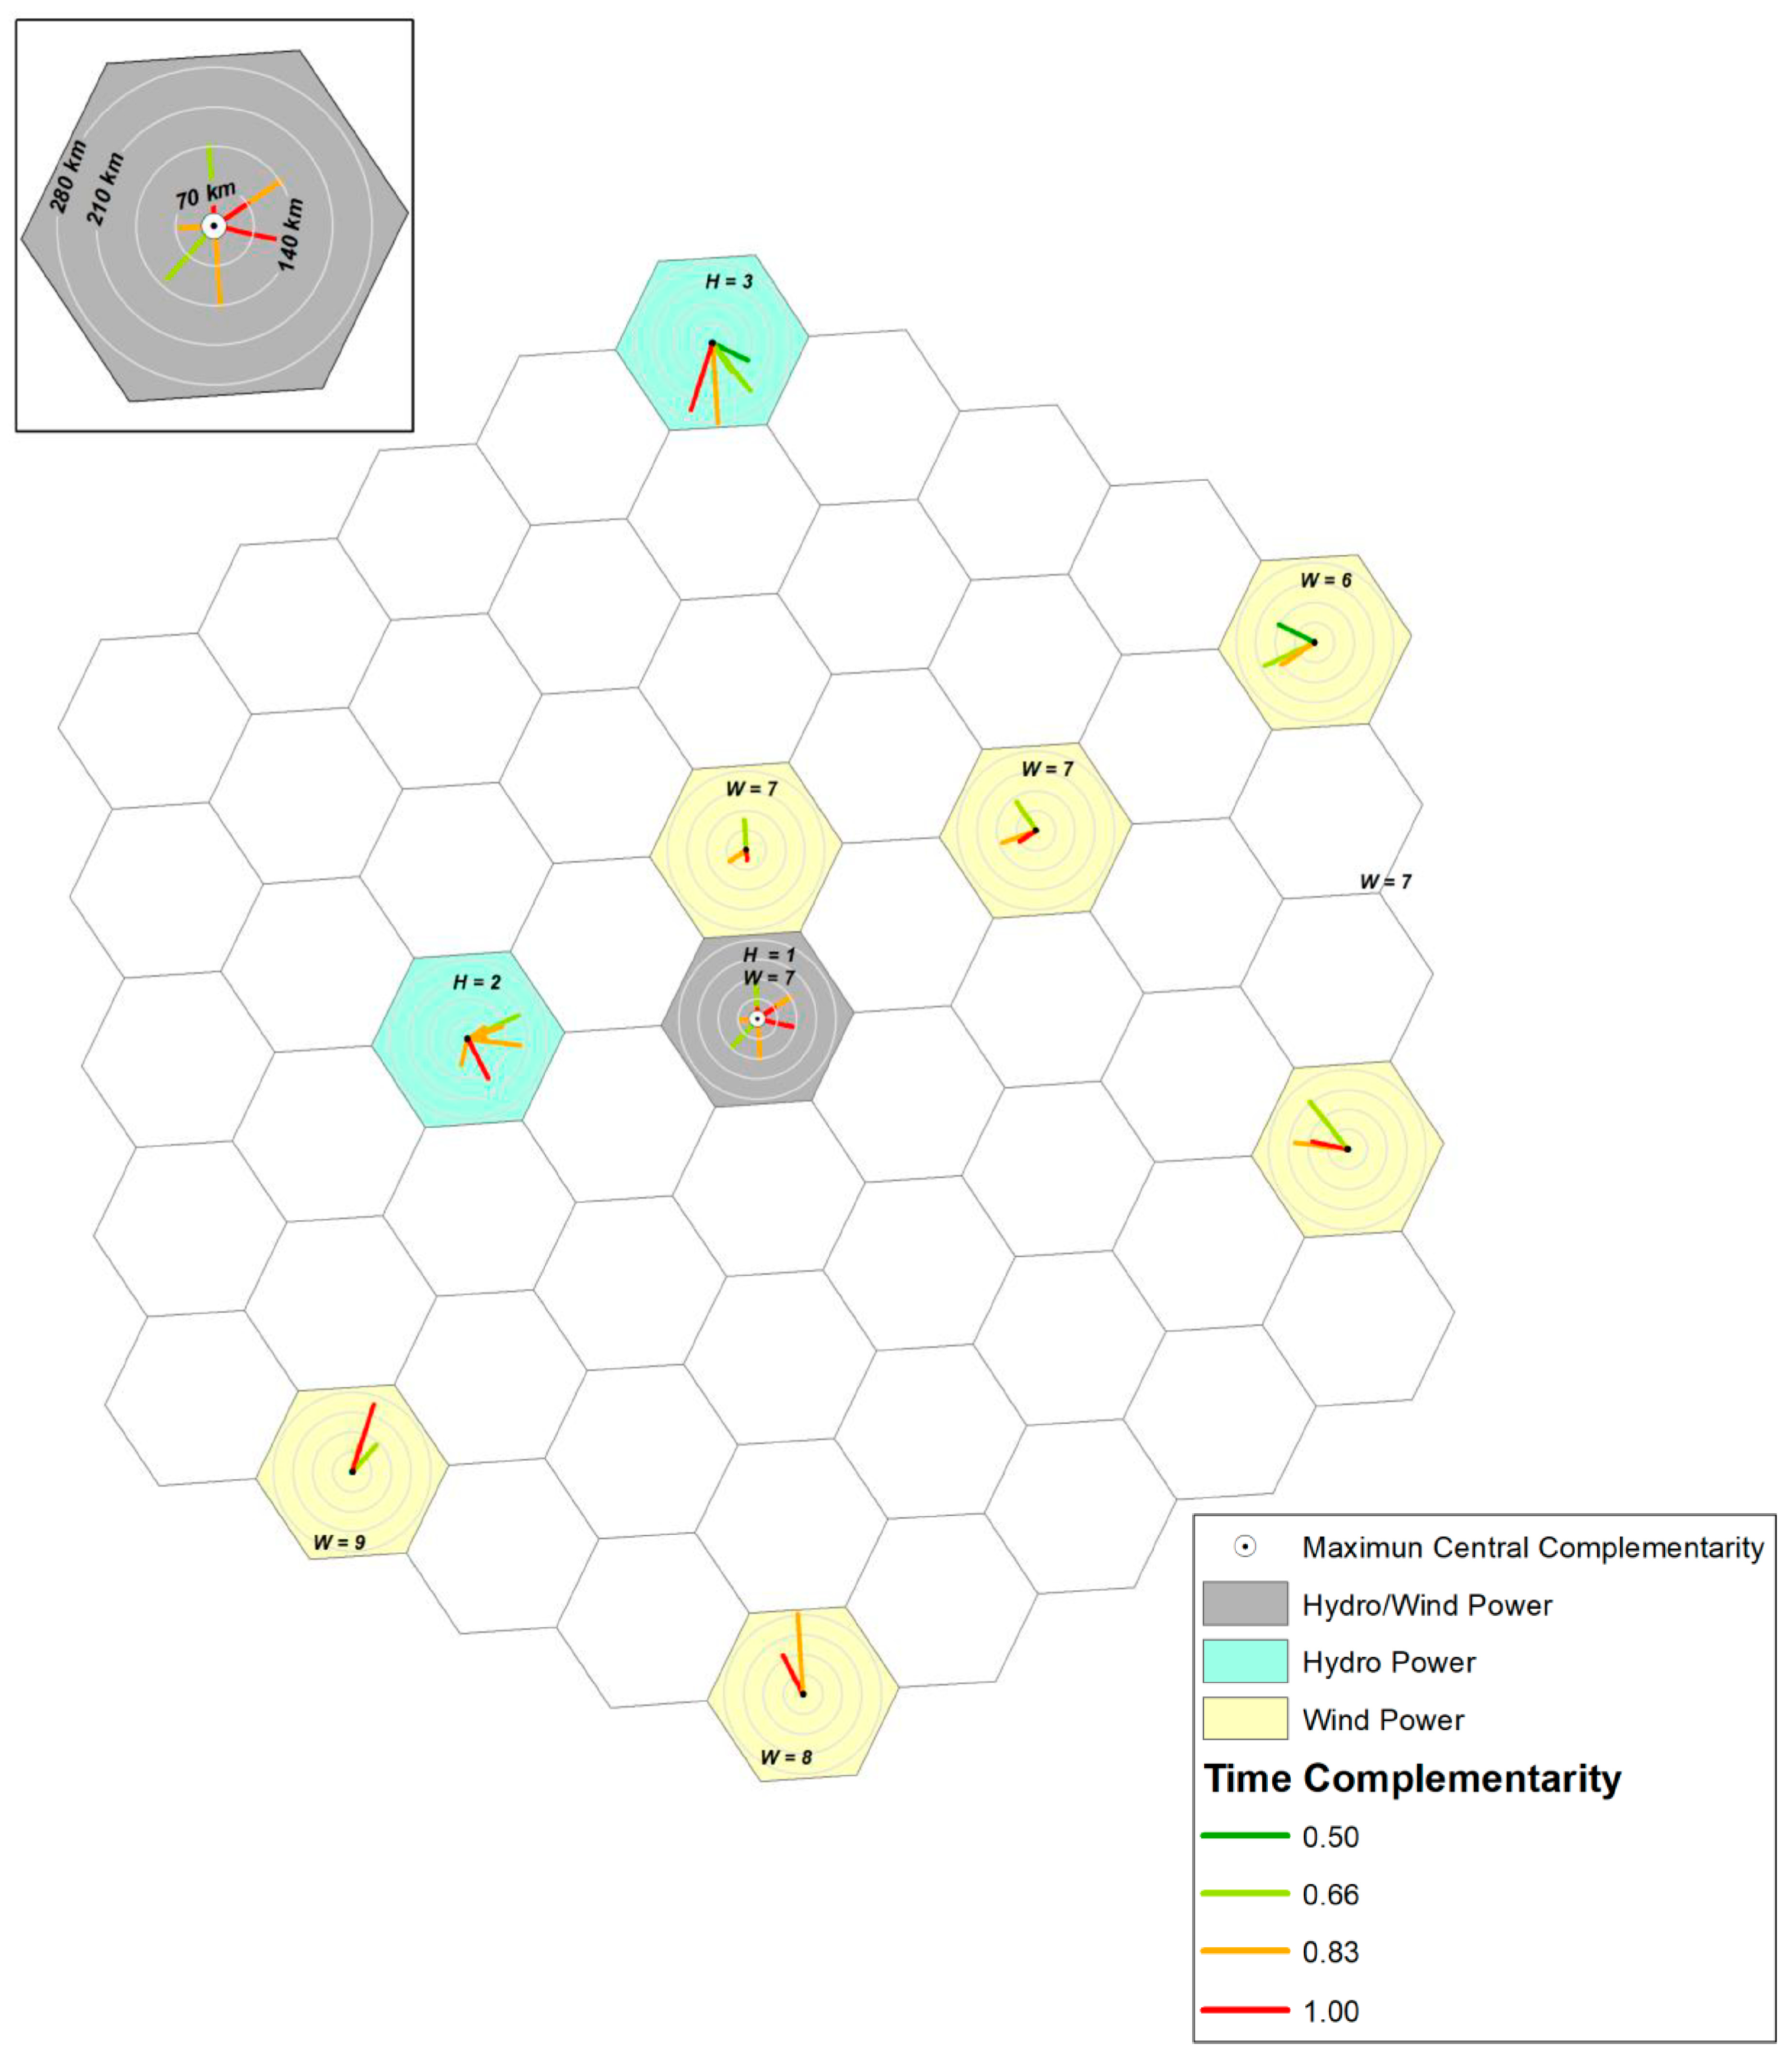
Figure 5 shows models for determining the roses of complementarity. In Figure 5a, a model for cells containing only one energetic resource. In Figure 5b, a model for cells containing two or more energy resources. Slice directions are matched by the relative positions of the compared cells. The lengths are related to the distances between the cells. The colors are established by the legend, associating a color scale with the different values of complementarity.
Figure 6 shows the map made with the complementarity roses determined for the cells and the hypothetical distribution of power plants proposed in Figure 2. As expected, the lines in a cell always find identical lines in their counterpart. With this idea in mind, it is relatively easy to look at the cells in the hexagonal network that is shown in Figure 6 and identify which cells have maximum complementarity with each other.
The next section proposes a method for quantifying spatial complementarity in time and its expression through a map containing complementary roses in cells containing power plants.
3. A Method Evaluating Spatial Complementarity
The method for establishing the spatial complementarity in time (with the use of complementarity roses) over a specified region can be stated in five steps, as follows:
- (1)
- To delimit the region for which the spatial complementarity will be determined, identifying the plants in operation and-or the sites with energetic potential that will be considered in the complementarity analysis;
- (2)
- To obtain data of power supplied (for plants in operation) or energy availability (for sites with energetic potential) that will be considered in the determination of complementarity in time when considering different sites;
- (3)
- To establish a network of hexagonal cells over the region chosen for the analysis, identifying the cells containing operating plants and-or sites with energetic potential and recording the distances between these cells;
- (4)
- To determine the complementarity in time for each cell that contains some plant existing or potential, whn comparing it with all other cells containing plants, noting in a complementarity rose for this cell the different values of complementarity according to the respective distances; and,
- (5)
- Finally, to evaluate the final result that is obtained with the superposition of the complementarity roses on the respective hexagonal cells and on the map, possibly suggesting some simplification if the complementarity roses have become too full, making the visual reading of the information along the map difficult.
The next section presents the application of this method to a set of hydroelectric power plants and wind farms in the State of Rio Grande do Sul, in southern Brazil.
4. Complementarity in Space for Some Hydropower Plants and Wind Farms along the State of Rio Grande do Sul, Brazil
The State of Rio Grande do Sul is the most southern state in Brazil and can be seen on Google Maps [16]. Rio Grande do Sul has a surface area of 281,730.223 square kilometers and an estimated population of 11,286,500 inhabitants. According to ANEEL [17], Rio Grande do Sul has installed capacity of 9517.817 MW, with a combination of hydroelectric power plants, thermoelectric power plants, and wind farms.
In this paper, the determination of spatial complementarity in time between some hydropower plants and some wind farms and its expression through a map with roses of complementarity is the only interest, without the intention of exhausting the subject. The objective is just to demonstrate the potentialities of the method proposed here.
In this sense, some hydroelectric plants and some wind farms were selected along the territory of the State. A network of hexagonal cells was established to group the selected plants. The generation data were obtained in order to determine the complementarity component in time, as defined by Ref. [4].
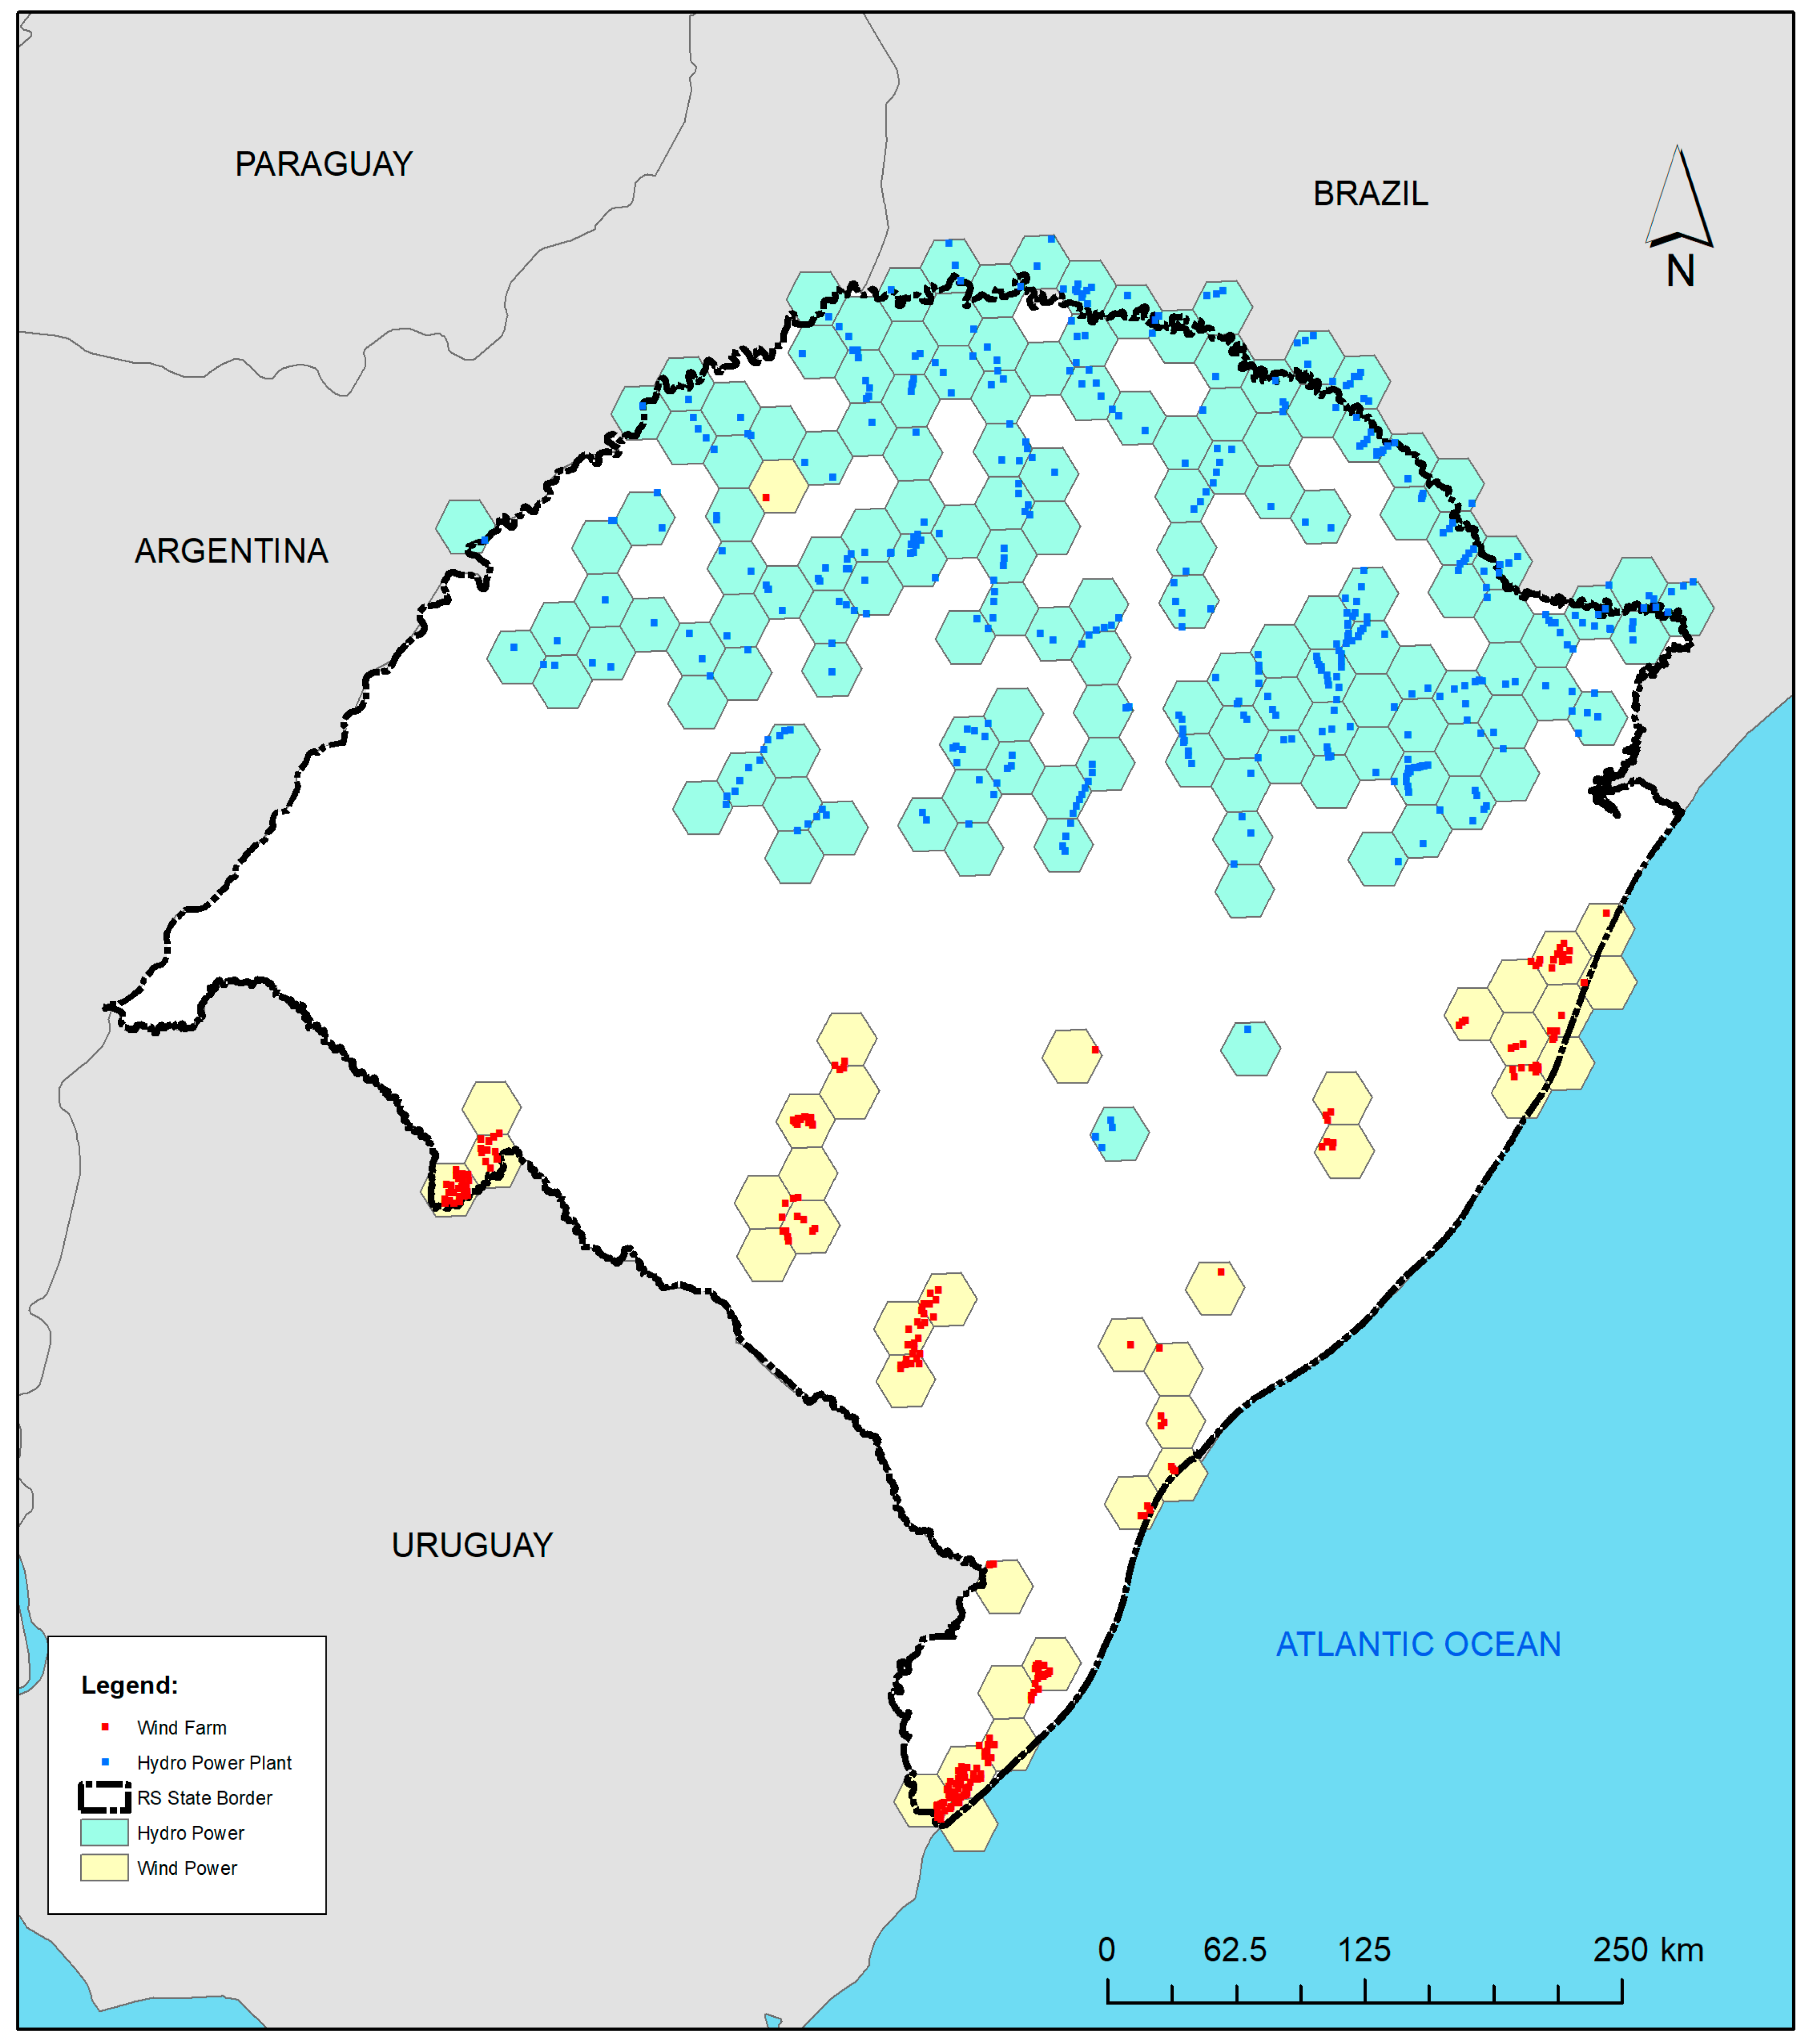
Figure 7 shows the State of Rio Grande do Sul and the network of hexagonal cells that was established for this study. The network has 582 hexagonal cells, each with 500 km2. This study selected 431 hydro power plants, marked in blue dots, and inserted in 141 cells represented in the map painted with blue. This study also selected 222 wind farms, marked in red spots, and inserted in 141 cells painted with yellow.
The region to the north of the State presents greater topographic differences and presents a drainage network more dense and mighty, and therefore receive a greater number of hydroelectric plants. The southernmost region of the State has the largest wind potential and therefore concentrates the wind farms.
The cells identified in this figure should then have their potentials as compared in order to determine complementarity in time. The index proposed by Beluco [4] is here applied to energy resources that are located in different positions. It is necessary to determine the values of complementarity and the corresponding directions.
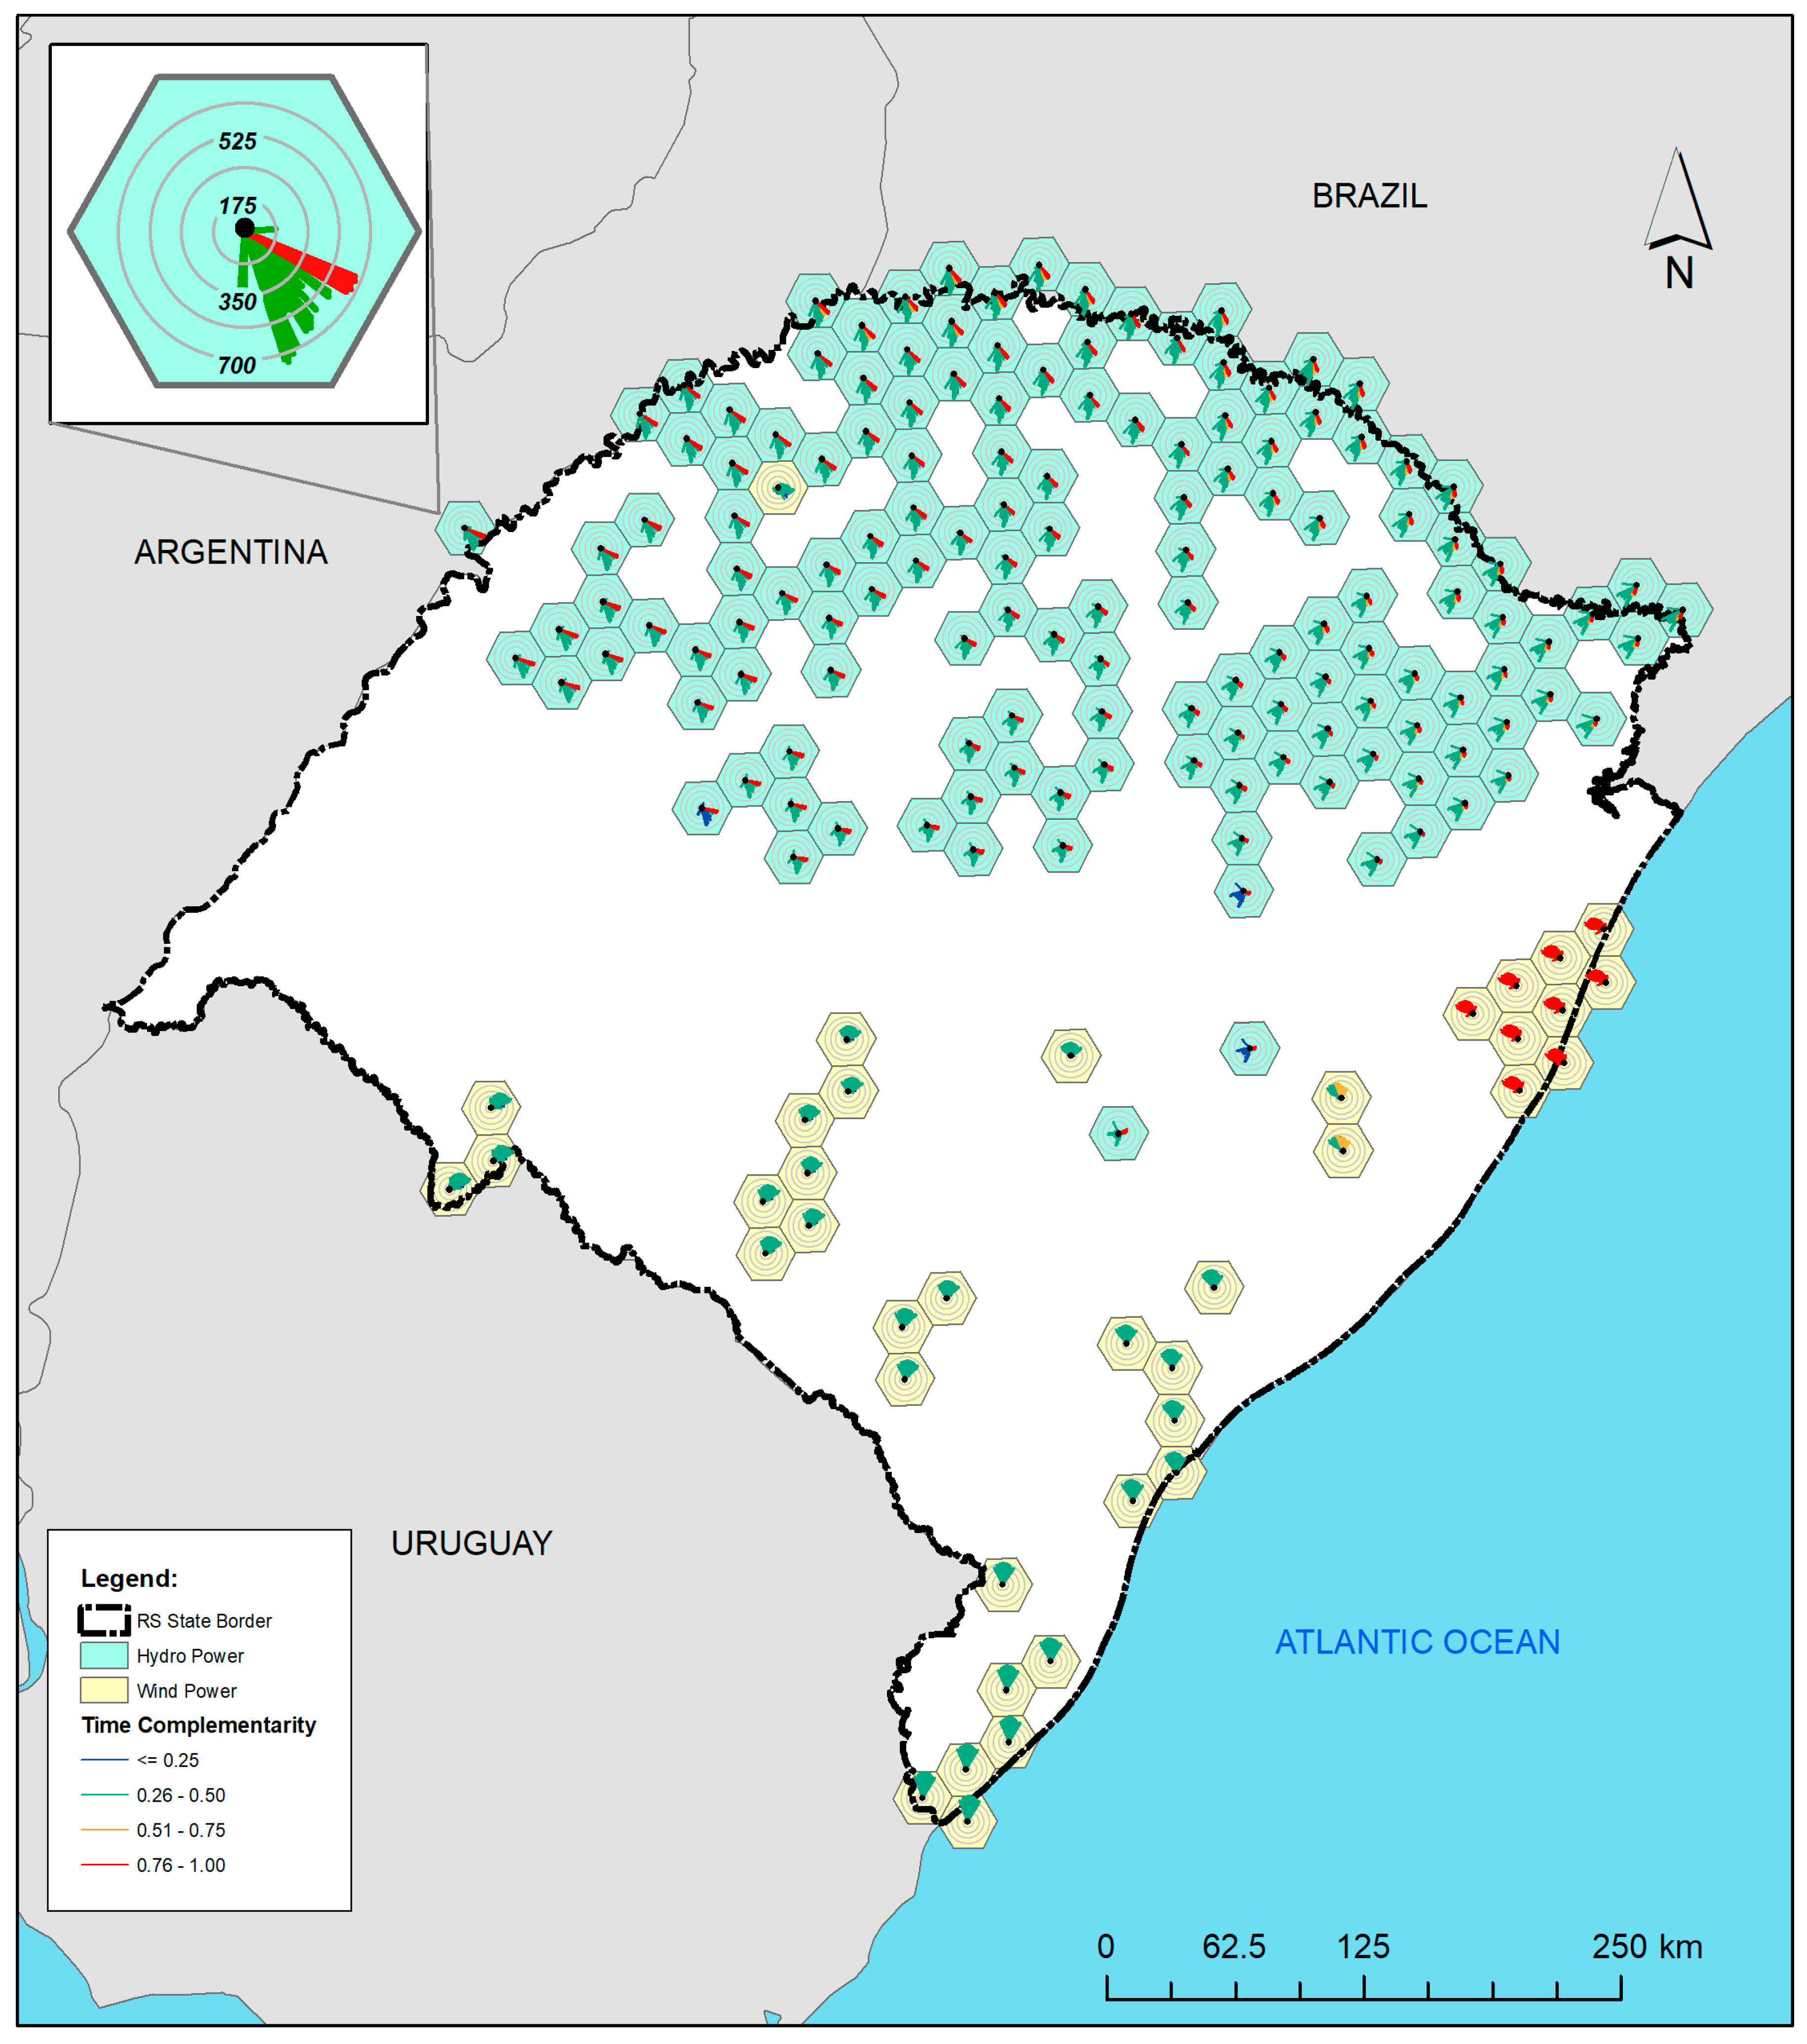
Figure 8 shows the map of Rio Grande do Sul with the roses of complementarity indicating spatial complementarity in time. This figure shows the detailing of one of the complementary roses located in the upper left corner, which contains hydroelectric plants. The map obtained is a complex figure to be analyzed at a first glance.
Only the hydroelectric cell that had its complementarity rose shown in detail in the upper right corner, and the wind cells located in the northernmost part of the coast have red lines. These lines in red indicate existence of complementarity in time reaching maximum values. The identification of this maximum complementarity (between a hydroelectric plant in the far west and wind farms in the east) can be considered as the main result of this work.
As can be expected, the cells at the extremities of the studied region will exhibit lines of complementary roses, which could be termed as petals, with longer lengths. Likewise, the cells in the most central parts will present a large number of lines with intermediate lengths. In addition, it can also be expected that the roses will present great variations of intensities of complementarity, as the resources analyzed are more intermittent.
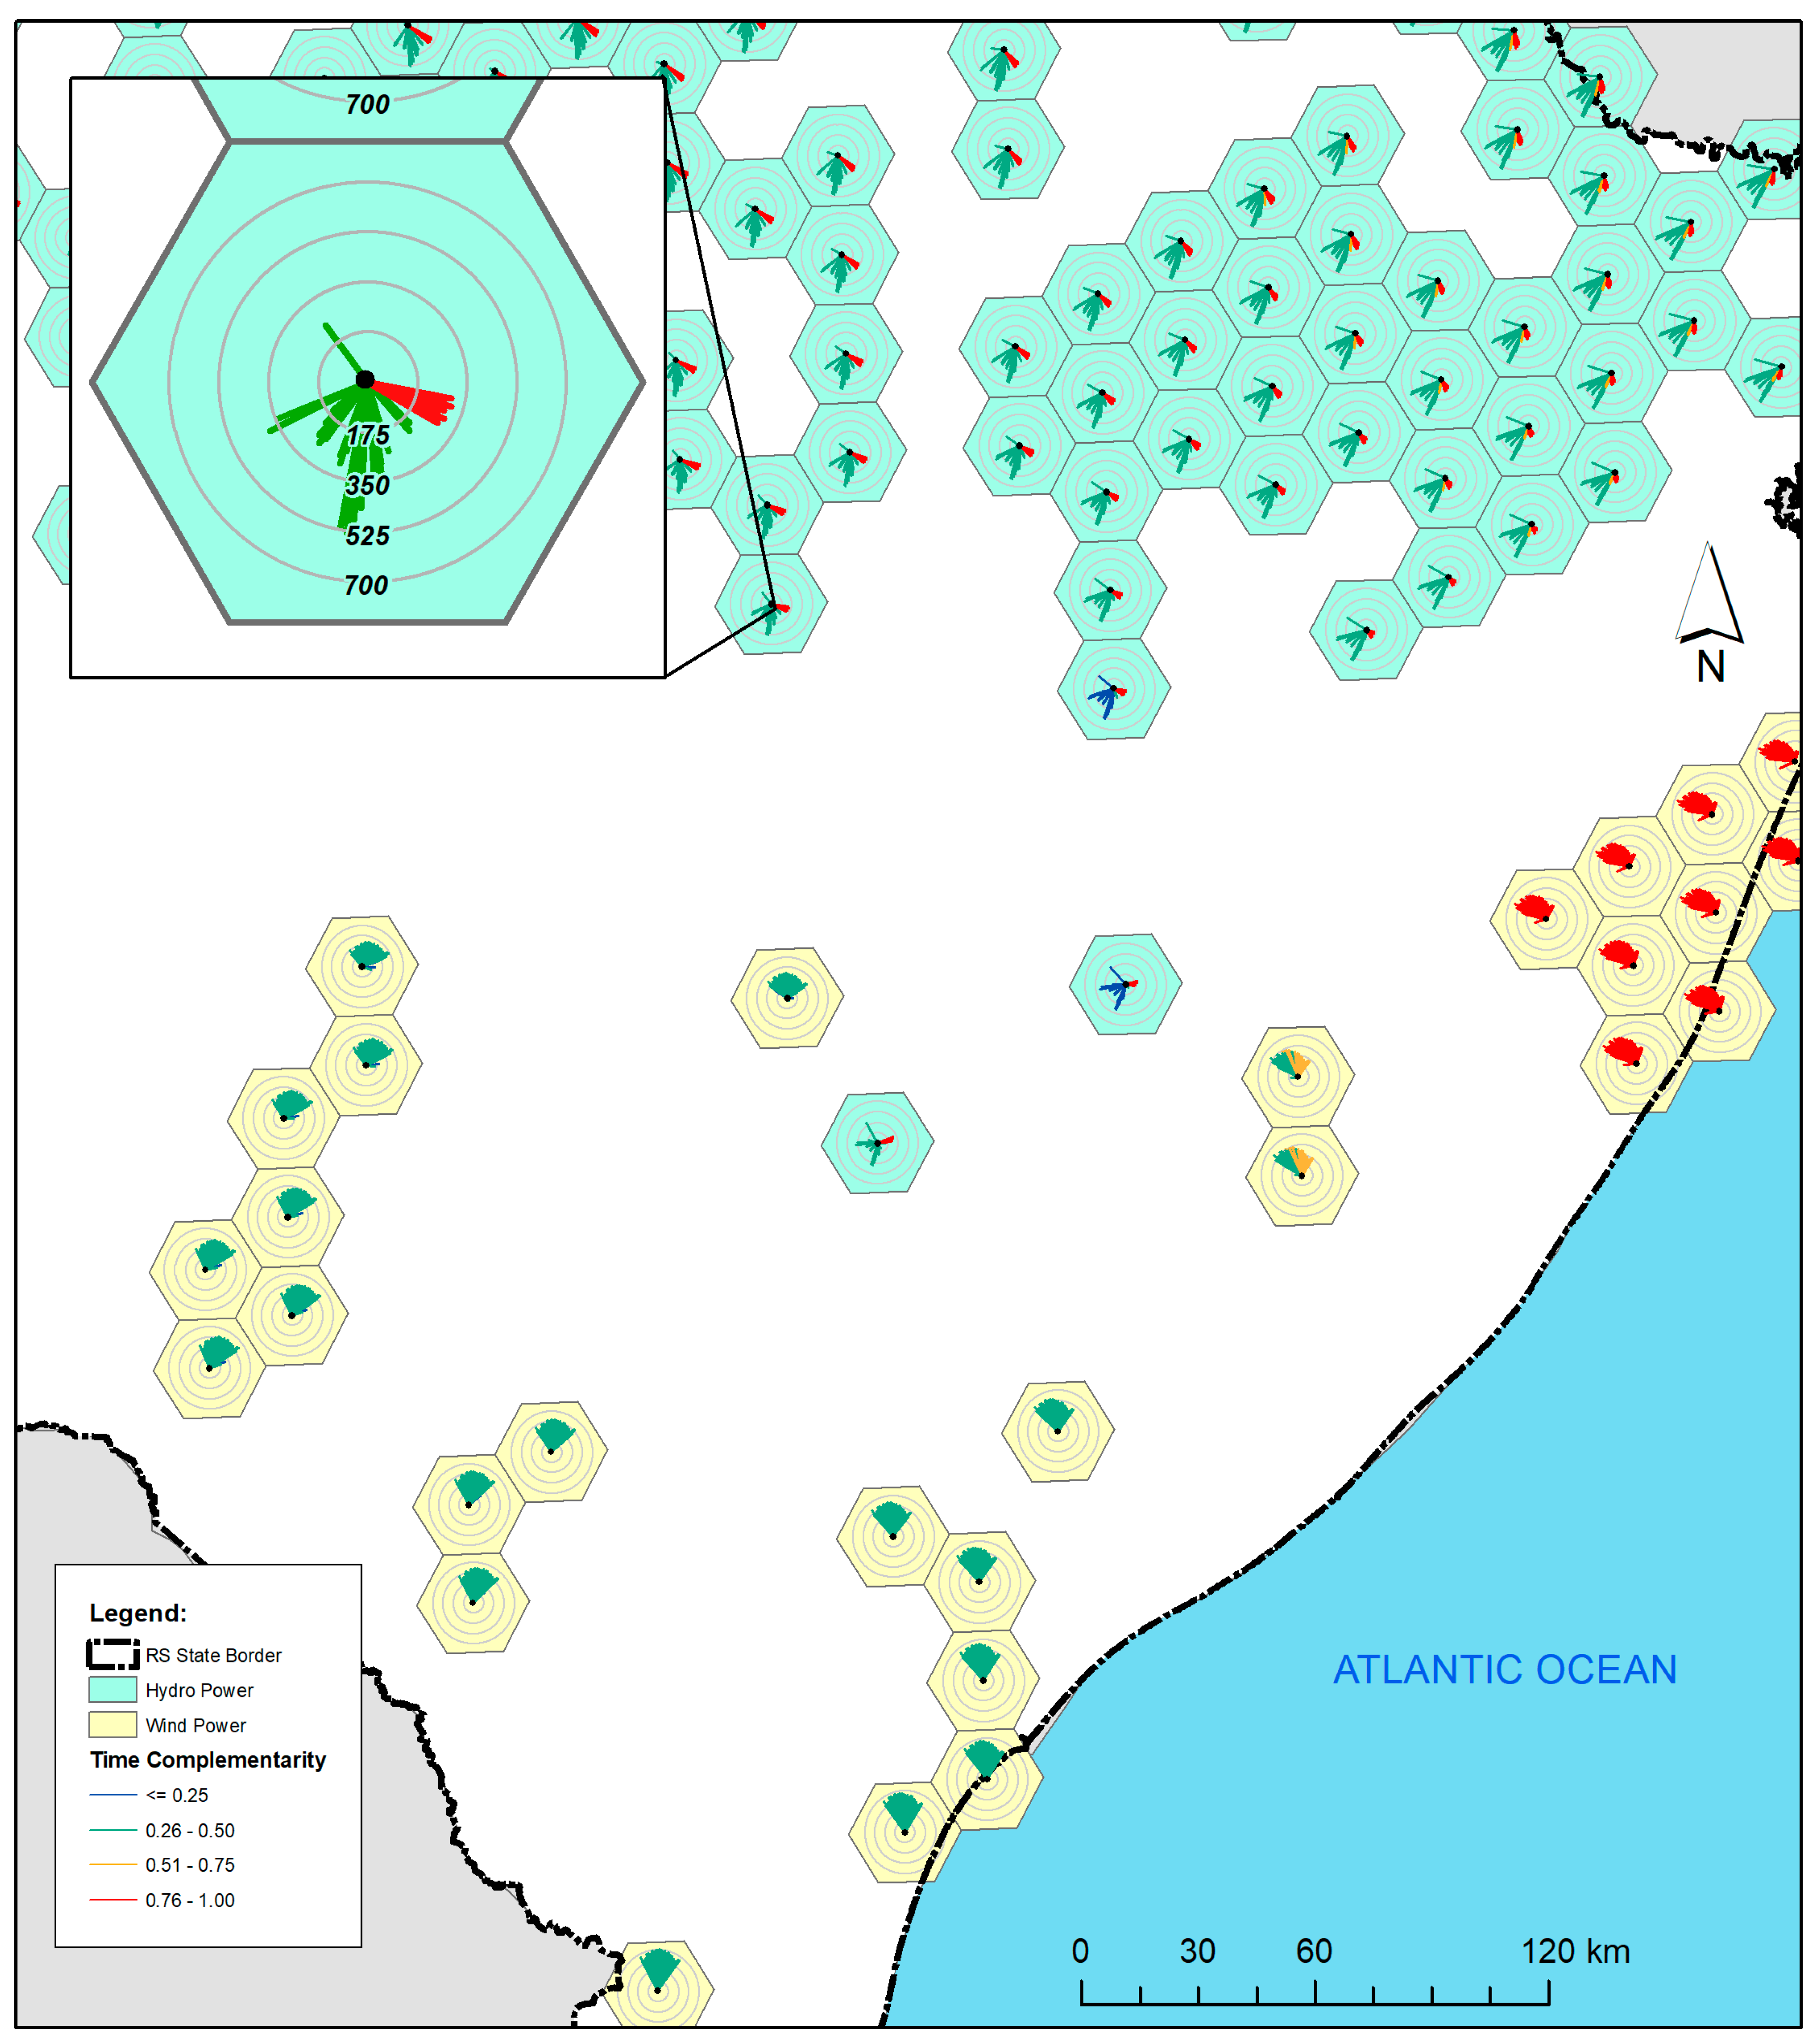
Figure 9 shows a detail of the central part of the map shown in Figure 8. This map at a larger scale allows for a better observation of the roses of complementarity. The complementary roses of the cells of the north coast present more petals with maximum complementarities that are oriented to the hydroelectric plants of the central north region, besides those already identified in Figure 8.
The cell that appears in detail in the upper left corner is one of these cells. Petals with approximately maximum complementarity at distances of the order of 350 km are complemented with these cells of the north coast. Intermediate complementarities with wind farms to the south and southwest complete the petals of this rose of complementarity.
The wind farms to the southwest of this position, in turn, present intermediate complementarities also with the more distant power plants, which are located in the region of the cell detailed in the map of Figure 8.
These complementarity maps can be used to optimize the operating rules of the plants considered in this study, for example, by better utilizing water reservoirs and backup systems. These complementarity maps can also be used to optimize the adjustment between the available energy for the various generating plants and the demand profile of different types of consumers.
Maps of energetic complementarity can also be elaborated from data, indicating energetic potential, allowing for elaborating strategies to choose the best new generating plants that are to be inserted in the energy system. Maps based on energetic potentials may also indicate the best combination of power plants based on renewable energies, when considering their insertion in the energy system.
The applications of complementarity maps, both for the elaboration of operating strategies and for the expansion planning, can be very important for a better insertion of power plants based on renewable resources in existing energy systems and for the optimization of operating rules with a better use of renewable resources.
5. Conclusions
This article discussed the concept of complementarity and it contributed to a better understanding of spatial complementarity. This paper proposed a method for determining the spatial complementarity in time and its expression through maps.
The proposed method is based on the determination of complementary roses, whose petals will have length determined by the distance to another cell and their color will indicate the complementarity between these two cells.
This article also shows the application of the proposed method for the determination of spatial complementarity in time between some hydroelectric power plants and wind farms that were identified along the territory of the State of Rio Grande do Sul, the southernmost State of Brazil, and present the map prepared with this application.
The possibility of expressing spatial complementarity in time through a map opens the way for a better use of the concept of complementarity as a tool for the management of renewable energy resources and for prioritization of energy generation projects.
A natural way to use complementary roses in the study of spatial complementarity is the determination of the other two components of complementarity (as discussed in this article) and the integration of this tool into geographic information systems.
A better knowledge of the applicability of the proposed method will come with its application to other case studies and its application to determine the other components of complementarity, in addition to the complementarity in time. Likewise, the quality of the information on the complementarity map will be better as the data used to determine complementary roses are better.
Author Contributions
The work was conceived by A.R., A.B. and R.d.C.M.A. and constitutes the core of the doctoral thesis of A.R. The original idea was conceived by A.B. and the concept of roses of complementarity was developed by A.R. and R.d.C.M.A. The figures were elaborated by A.R. (including the choice of hydroelectric power plants and wind farms and the selection of data) and the article was written by A.R., A.B. and R.d.C.M.A.
Funding
This research received partial funding from CNPq (proc. n. 309021/2014-6).
Acknowledgments
This work was developed as a part of research activities on renewable energy developed at the Instituto de Pesquisas Hidráulicas (IPH), Universidade Federal do Rio Grande do Sul (UFRGS), southern Brazil. The authors acknowledge the support received by the institution. The second author acknowledges the financial support received from CNPq.
Conflicts of Interest
The authors declare no conflict of interest.
References
- Ghirardi, A.O.; Costa, F.S.; Damazio, J.M. Analysis of hydrological complementarities at continental level in South America. Revista Brasileira de Recursos Hídricos 1997, 2, 143–156. (In Portuguese) [Google Scholar] [CrossRef]
- Cantão, M.P.; Bessa, M.R.; Bettega, R.; Detzel, D.H.M.; Lima, J.M. Evaluation of hydro wind complementarity in the Brazilian territory by means of correlation maps. Renew. Energy 2017, 101, 1215–1225. [Google Scholar] [CrossRef]
- Silva, A.R.; Pimenta, F.M.; Assireu, A.T.; Spyrides, M.H.C. Complementarity of Brazil’s hydro and offshore wind power. Renew. Sustain. Energy Rev. 2016, 56, 413–427. [Google Scholar] [CrossRef]
- Beluco, A.; Souza, P.K.; Krenzinger, A. A dimensionless index evaluating the time complementarity between solar and hydraulic energies. Renew. Energy 2008, 33, 2157–2165. [Google Scholar] [CrossRef]
- Beluco, A.; Souza, P.K.; Krenzinger, A. A method to evaluate the effect of complementarity in time between hydro and solar energy on the performance of hybrid hydro PV generating plants. Renew. Energy 2012, 45, 24–30. [Google Scholar] [CrossRef]
- Kougias, I.; Szabo, S.; Monforti-Ferrario, F.; Huld, T.; Bodis, K. A methodology for optimization of the complementarity between small hydropower plants and solar PV systems. Renew. Energy 2016, 87, 1023–1030. [Google Scholar] [CrossRef]
- Borba, E.M.; Brito, R.M. An index as sessing the energetic complementarity in time between more than two energy resources. Energy Power Eng. 2017, 9, 505–514. [Google Scholar] [CrossRef]
- Beluco, A.; Souza, P.K.; Livi, F.P.; Caux, J. Energetic complementarity with hydropower and the possibility of storage in batteries and water reservoir. In Solar Energy Storage; Sorensen, B., Ed.; Academic Press: Cambridge, MA, USA, 2015; pp. 155–188. ISBN 9780124095403. [Google Scholar]
- Hoicka, C.E.; Rowlands, I.H. Solar and wind resource complementarity: Advancing options for renewable electricity integration in Ontario, Canada. Renew. Energy 2011, 36, 97–107. [Google Scholar] [CrossRef]
- Solomon, A.A.; Kammen, D.M.; Callaway, D. Investigating the impact of wind-solar complementarities on energy storage requirement and the corresponding supply reliability criteria. Appl. Energy 2016, 168, 130–145. [Google Scholar] [CrossRef]
- Gabash, A.; Li, P. On variable reverse power flow, part I: Active-reactive optimal power flow with reactive power of wind stations. Energies 2016, 9, 121. [Google Scholar] [CrossRef]
- Gabash, A.; Li, P. On variable reverse power flow, part II: An electricity market model considering wind station size and location. Energies 2016, 9, 235. [Google Scholar] [CrossRef]
- Min, C.G.; Kim, M.K. Impact of the complementarity between variable generation resources and load on the flexibility of the Korean Power System. Energies 2017, 10, 1719. [Google Scholar] [CrossRef]
- Beluco, A. A concept of boundaries of performance for analysis of hybrid systems based on complementary energy resources. In Energy Science and Technology; Prasad, R., Shivakumar, B.G., Sharma, U.C., Eds.; Studium Press LLC: Houston, TX, USA, 2015; Volume 12, pp. 459–483. ISBN 9781626990739. [Google Scholar]
- Risso, A.; Beluco, A. Bases for a methodology assessing spatial complementarity in time. Energy Power Eng. 2017, 9, 527–540. [Google Scholar] [CrossRef]
- Rio Grande do Sul. Available online: https://goo.gl/maps/s9bAbfCEopK2 (accessed on 10 July 2018).
- Electric Energy National Agency [Agência Nacional de Energia Elétrica, ANEEL] Installed Power Capacity in State of Rio Grande do Sul. Available online: www2.aneel.gov.br/aplicacoes/ResumoEstadual/Resumo Estadual.cfm (accessed on 5 May 2018).
Figure 1.
Set of sample data for two renewable energy resources. (Adapted from Ref. [14]).
Figure 1.
Set of sample data for two renewable energy resources. (Adapted from Ref. [14]).

Figure 2.
Hexagonal cell network with hypothetical distribution of hydroelectric power plants and wind farms. H and W indicate respectively the months of the year for which there is minimum energy availability for hydroelectric plants and wind farms.
Figure 2.
Hexagonal cell network with hypothetical distribution of hydroelectric power plants and wind farms. H and W indicate respectively the months of the year for which there is minimum energy availability for hydroelectric plants and wind farms.

Figure 3.
Complementarity in time between the cell marked in blue, containing hydro power plants, and the other cells of the network containing power plants, shown in Figure 2. H and W labeled in each cell, followed by numbers, constitute an identification for each cell.
Figure 3.
Complementarity in time between the cell marked in blue, containing hydro power plants, and the other cells of the network containing power plants, shown in Figure 2. H and W labeled in each cell, followed by numbers, constitute an identification for each cell.

Figure 4.
Complementarity roses for the cells (a) H-29; (b) W-33; (c) W-40; and, (d) W-46 (Figure 2).
Figure 4.
Complementarity roses for the cells (a) H-29; (b) W-33; (c) W-40; and, (d) W-46 (Figure 2).

Figure 5.
Models for determining roses of complementarity: (a) with only one energy resource per cell and (b) with two or more energy resources per cell.
Figure 5.
Models for determining roses of complementarity: (a) with only one energy resource per cell and (b) with two or more energy resources per cell.

Figure 6.
Map of spatial complementarity in time for the network of hexagonal cells of Figure 2.
Figure 6.
Map of spatial complementarity in time for the network of hexagonal cells of Figure 2.

Figure 7.
Network with 582 hexagonal cells of 500 km2 each, for analysis of spatial complementarity in the time along the State of Rio Grande do Sul, indicating hydroelectric power plants and wind farms that are considered in the analysis.
Figure 7.
Network with 582 hexagonal cells of 500 km2 each, for analysis of spatial complementarity in the time along the State of Rio Grande do Sul, indicating hydroelectric power plants and wind farms that are considered in the analysis.

Figure 8.
Maps of the State of Rio Grande do Sul with roses of complementarity indicating the spatial complementarity in the time between the plants marked in Figure 7.
Figure 8.
Maps of the State of Rio Grande do Sul with roses of complementarity indicating the spatial complementarity in the time between the plants marked in Figure 7.

Figure 9.
Detail of the eastern center region of the map shown in Figure 8.
Figure 9.
Detail of the eastern center region of the map shown in Figure 8.

© 2018 by the authors. Licensee MDPI, Basel, Switzerland. This article is an open access article distributed under the terms and conditions of the Creative Commons Attribution (CC BY) license (http://creativecommons.org/licenses/by/4.0/).
Share and Cite
MDPI and ACS Style
Risso, A.; Beluco, A.; Marques Alves, R.D.C. Complementarity Roses Evaluating Spatial Complementarity in Time between Energy Resources. Energies 2018, 11, 1918. https://doi.org/10.3390/en11071918
AMA Style
Risso A, Beluco A, Marques Alves RDC. Complementarity Roses Evaluating Spatial Complementarity in Time between Energy Resources. Energies. 2018; 11(7):1918. https://doi.org/10.3390/en11071918
Chicago/Turabian StyleRisso, Alfonso, Alexandre Beluco, and Rita De Cássia Marques Alves. 2018. "Complementarity Roses Evaluating Spatial Complementarity in Time between Energy Resources" Energies 11, no. 7: 1918. https://doi.org/10.3390/en11071918
Note that from the first issue of 2016, this journal uses article numbers instead of page numbers. See further details here.